Article

The Effect of Carbon Dissection of Waste Plastics on Inhibiting the Adhesion of Fine Iron Ore Particles during Hydrogen Reduction

School of Metallurgical Engineering, Anhui University of Technology, Ma’anshan 243002, China
*
Author to whom correspondence should be addressed.
Metals 2018, 8(7), 523; https://doi.org/10.3390/met8070523
Submission received: 8 June 2018 / Revised: 3 July 2018 / Accepted: 3 July 2018 / Published: 6 July 2018
(This article belongs to the Special Issue 5th UK-China Steel Research Forum)

Abstract

:
In this research, Australian fine iron ore was reduced by combining pressurized and energy-bearing waste plastics in a fluidized bed. This research aims to obtain preferable operating parameters by synthetically researching the effect of temperature, linear velocity, pressure, size, and mass content of energetic waste plastics, and to clarify the sticking mechanism and the inhibitory mechanism of fine iron ore during the reduction process. The experimental results show that the preferable operating parameters include a reduction temperature of 923–973 K, linear velocity of 0.8 m/s, reduction pressure of 0.15 MPa, particle size of energetic waste plastics of 0.18–0.66 mm, and mass content of energetic waste plastics of 8%. Under the conditions of theses preferable operating parameters, the sticking mechanism of fine iron ore is caused by the reunion of the metal iron atoms. The occurrence states of carbons deposited from waste plastics can be divided into two types: graphite and carbon from Fe3C. Carbon from Fe3C reduces the sticking of fine iron ore, while the graphite hinders the direct contact of iron atoms, thereby effectively controlling the sticking.

1. Introduction

Given the increase in environmental pollution caused by blast furnace ironmaking, the scarcity of coal resources, and the decrease in quantity of iron ore resources, metallurgical workers attempt to explore new technologies for reducing the coke rate of blast furnace ironmaking and non-blast furnace ironmaking [1]. Direct reduction in fluidization, which is consistent with said development trend, has been introduced. This approach presents many advantages, such as a large contact area between gas and solid phases, uniform temperature and concentration, good heat and mass transfer conditions, and high operation efficiency. Considering the change of iron ore from lump to powder, direct reduction in fluidization, which possesses the advantage of directly reducing fine iron ore without using non-coking coal, has provided many possibilities for energy saving and environmental protection in the metallurgical industry, the rational use of low-grade and composite ore, and the solution to iron ore shortage [2,3]. This technique plays an important metallurgical function in magnetic roasting of fine iron ore, preheating and low pre-reduction of fine iron ore, and production of direct reduction iron [4,5]. However, high-temperature fluidized reduction of fine iron ore easily causes sticking, reduces reduction efficiency, and hinders continuous operation of the process. These limitations are important obstacles for the industrialized application of fluidized iron smelting technology.
Many scholars have added inert components to fine iron ore to control the sticking behavior and thus reduce the probability of iron contact on the surface of particles. The inert components added are mainly oxides, such as CaO, MgO, SiO2, and Al2O3. The adding methods include the dry method, powder method, water mixing method, sintering method, solution method, slurry method, and high-temperature coating method [6,7,8,9]. The addition of inert components affects the surface morphology of particles, especially the growth of iron whiskers [9]. Moreover, the inert components wrap the surface of slag particles or the dilution bed and reduce the probability of iron contact on the surface of particles. Therefore, the inhibitory effect and inert ingredients’ uniformity on the particle surface are related to adhesion strength.
Carbon is attached to the surface of the particles through carbon precipitation and chemical reactions, and its uniformity distribution and adhesion strength are improved compared with those for the method of adding oxides [10,11]. Shi et al. [12] found that the adhesion of carbon effectively inhibits growth of iron whiskers, which are not easily generated on the surface of powder particles, thereby inhibiting sticking loss. This theory is based on the fact that powder sticking is caused by the hook of an iron whisker. However, Mikami, Zhong, and Shao et al. [13,14,15] showed that the iron whisker is not a necessary condition for the occurrence of sticking loss; pure iron powder particles can also generate sticking loss, and pure iron powder contains no iron whisker. Therefore, the mechanism of inhibition of sticking by carbon precipitation must be further studied. During non-blast furnace ironmaking, the gas-based reduction process is implemented using pressure. Many experts’ studies on the mechanism of inhibiting sticking loss are mostly based on atmospheric pressure and differ from the production practice.
In order to improve environmental protection and production efficiency, the current study added energetic waste plastics into the iron ore powder [16] according to a certain size and ratio, resulting in the changing direction of the optimal operating parameters in a self-designed, hot visual, pressurized, fluidized bed experimental device. On this basis, economic, convenient, and effective operating parameters were determined. This research focuses on the mechanism of inhibiting sticking of iron ore powder particles by coated waste plastics, and it elucidates the mechanism of inhibiting sticking loss by carbon precipitation from pressure-coated waste plastics. Accordingly, data storage and the theoretical basis for the industrialization of direct reduction in fluidization are provided.

2. Experiment

2.1. Experimental Materials

The reduction iron ore powder is Australian fine iron ore (OMC fine iron ore, Ma steel, Ma’anshan, China) with a size in the range of 0.18–0.66 mm. Its composition is shown in Table 1. This study used energetic waste plastics (the ingredient of energetic waste plastics is PE reagent) with particle sizes of 0.12–0.15 mm, 0.15–0.18 mm, 0.18–0.66 mm, and 0.66–1.00 mm for testing. The chemical composition is hydrocarbon polymers. TFe is the total iron in the table.

2.2. Experimental Device

The main device used in the study is a self-designed pressurized, visible, fluidized bed (with a double stainless-steel pipe as the reactor). The inner pipe is a fluidized bed. The gas is preheated through the interlayer between the outer and inner tubes and flows into the fluidized bed. The outer tube contains heated cabinets. The different flows of H2 and N2 are regulated using multiple sets of flow meters to ensure that the composition content and velocity meet the experimental requirements. The inlet flow rate of the fluidized bed is controlled with a gas mass flow controller. The reduction temperature in the fluidized bed is measured with a thermocouple. Preheating and cooling of fine iron ores in the fluidized bed are conducted by passing through high-purity nitrogen for exhaust and protection. To evaluate the fluidized reduction sticking situation, the bed pressure difference ΔP is measured using a pressure sensor, and the observation window is used. The schematic of the pressurized fluidized reduction experiment and the device are shown in Figure 1.

2.3. Experimental Programs and Methods

Under nonpressurized and pressurized conditions, iron ore powder-coated waste plastics and uncoated waste plastics were used as control experiments to compare and analyze the fluidizing effect of coated waste plastics.
Five factors of inhibiting sticking of fine iron ore particles by coated waste plastics were considered: reduction temperature, linear velocity of reduction gas, reduction pressure, size, and mass content of energetic waste plastics. Four levels of these factors were investigated [17,18,19,20]. The five factors are denoted using letters A, B, C, D, and E. In particular, A represents the reduction temperature, with A1, A2, A3, and A4 representing 923 K, 973 K, 1023 K, and 1073 K, respectively; B represents the linear velocity of reduction gas, with B1, B2, B3, and B4 representing 0.6 m/s, 0.8 m/s, 1.0 m/s, and 1.2 m/s, respectively; C represents the reduction pressure, with C1, C2, C3, and C4 representing the atmospheric pressure, 0.15, 0.30, and 0.45 MPa, respectively; D represents the size of energetic waste plastics, with D1, D2, D3, and D4 representing 0.12–0.15 mm, 0.15–0.18 mm, 0.18–0.66 mm, and 0.66–1.00 mm, respectively; E represents the mass content of energetic waste plastics, with E1, E2, E3, and E4 representing 4%, 8%, 12%, and 16%, respectively (See Table 2 and Table 3). First, 20 g of fine iron ore and 5 g of waste plastics were fully blended. Thereafter, the fluidized bed was heated to the set-point temperature. Then, N2 flows for 10 min with a linear velocity of 0.3–0.5 m/s, thereby making the waste plastics pyrolyze first and then passing through pure H2 for the fine iron ore reduction in 50 min. At the end of the test, the ferric chloride titration method was used to test the samples after reduction. The total iron (TFe) and the metal iron (MFe) values were obtained. After calculating the metallization rate (η), the state of fluidized reduction sticking was evaluated in time and, ultimately, through the pressure difference (ΔP) and sticking ratio (Ω).
The inner layer of the double-layer fluidized bed can be disassembled; therefore, the sticking material can be removed from the inner bottom, and the unsticking material can be obtained from the loading port.
The rate of metallization is calculated using the following formula:
η = MFe/TFe
where η is the rate of metallization, MFe is the metal iron, g; and TFe is the total iron, g.
The sticking ratio is calculated using the following formula:
Ω = Msticking/Mtotal
where Ω is the sticking ratio, Msticking is the quantity of sticking material after reduction and can be used to measure the mass of sticking material of the fine iron ore after reduction, g; and Mtotal is the total quantity of material after reduction and can be used to measure the mass of total material of the fine iron ore after reduction, g.
The total quantity of material after reduction is calculated as follows:
Mtotal = Msticking + Munstickng
where Mtotal is the total quantity of material after reduction, g; Msticking is the quantity of sticking material after reduction and can be used to measure the mass of sticking material of the fine iron ore after reduction, g; and Munstickng is the quantity of unsticking material after reduction and can be used to measure the mass of unsticking material mass of the fine iron ore after reduction, g.
The larger the sticking ratio, the more considerable the sticking loss. The smaller the ratio, the better the fluidization effect. Therefore, the metallization rate and sticking ratio were selected as the indexes for determining the effect of fluidization reduction. The optimum operational parameters for the fluidization reduction of coated waste plastics by fine iron ore were optimized using an orthogonal test and a comprehensive balance method.
The mechanical analysis of the sticking mechanism of fine iron ore particles was performed under the experimental conditions using the optimum operating parameters. Microscopic analysis and characterization experimental means of determining physicochemical characteristics of the gas–solid reaction were adopted to detect the inhibition effect on the carbon precipitation reaction. The carbon content of the particles was measured by an infrared carbon–sulfur analyzer (LECO, CS-344, Tongpu, Nanjing, China). X-ray photoelectron spectroscopy (XPS) (Shimadzu International, AXIS Ultra DLD, Thermo Fisher Scientific Inc., Waltham, MA, USA) was used to detect different valence states and the content of carbon on the surface of particles, and the emission source of the X-ray was the aluminum target. When the incident photon energy was fixed at 1486.7 eV and the pressure in the analysis chamber was 6.67 × 10⁻⁷ Pa in the detection process, the entire spectrum was scanned first to determine the elements of the samples, and then the C1s core level spectrum was acquired through high-resolution fine scanning of the narrow area. The microscopic structure on the surface of the particles was observed and analyzed by environmental scanning electron microscopy (FEI, Quanta 250, Oxford, London, UK), and the microscopic structure inside the particles was observed and analyzed with a light microscope (CarlZeiss, Axio Imager A1, Thermo Fisher Scientific, Waltham, MA, USA). The phase composition of particles was analyzed using an X-ray diffraction analyzer (X’ PertPro, MPDalytical, Cu target, 2θ: 10–90°, Inficon, New York, NY, USA), and the mechanism of the carbon dioxide reaction in the sticking inhibition process was determined.

3. Results and Discussion

3.1. Results and Analysis of the Pre-Experiment

Fine iron ore with and without energetic waste plastics were used as controls in the experiment under the conditions of normal pressure and pressure.
The experimental conditions and results are shown in Table 4.
Samples with and without energetic waste plastics were compared and studied under the conditions of 973 K temperature and 0.8 m/s linear velocity. With a reduction pressure of 0.3 MPa, compared with Scheme 1, Scheme 2 possesses a coated mass fraction of 4%, a particle size in the range of 0.18–0.66 mm, and a sticking ratio reduction of 2%. The rate of metallization increases by 4.19%, and the fluidization effect improves. Under normal pressure, compared with Scheme 3, Scheme 4 possesses a coated mass fraction of 4%, a particle size in the range of 0.18–0.66 mm, and a sticking ratio reduction of 3.9%. The rate of metallization increases by 7.84%, and the fluidization effect improves. Therefore, under nonpressurized and pressurized conditions, the fine iron ore with waste plastics of a certain particle size and ratio can improve the rate of metallization and the fluidization effect.
The nonpressurized and pressurized conditions comparison experiment was conducted under the conditions of 973 K temperature and 0.8 m/s linear velocity. Compared with that of Scheme 3, the reduction pressure of Scheme 1 increases from the atmospheric pressure to 0.3 MPa. The sticking ratio reduces by 5%, the rate of metallization increases by 14%, and the fluidization effect improves. Compared with Scheme 4, Scheme 2 possesses a coated mass fraction of 4% and a particle size in the range of 0.18–0.66 mm. The reduction pressure increases from the atmospheric pressure to 0.3 MPa, the rate of metallization increases by 10.35%, and the sticking ratio reduces by 3.1%. Therefore, the appropriate increase in reduction pressure can increase the metallization rate and improve the fluidization effect for coated and uncoated waste plastics.

3.2. Optimization of Operating Parameters

Fluidized reduction aims to achieve a high metallization rate without sticking. Therefore, a high metallization rate and a low sticking ratio were chosen as the optimal scheme. The metallization rate and sticking ratio of each experiment were measured, and results are shown in Table 5.
The orthogonal experiment analysis results are shown in Table 6. The primary and secondary influential factors of the metallization rate during the fluidized reduction of fine iron ore are linear velocity, mass content of energetic waste plastics, reduction pressure, reduction temperature, and size of energetic waste plastics. The optimum process parameters are B2, E2, C2, A3, and D3, specifically, linear velocity of 0.8 m/s, mass content of energetic waste plastics of 8%, reduction pressure of 0.15 MPa, reduction temperature of 1023 K, and size of energetic waste plastics in the range of 0.15–0.18 mm.
The primary and secondary influential factors of the sticking ratio during the fluidized reduction of fine iron ore are reduction pressure, mass content of energetic waste plastics, reduction temperature, linear velocity, and size of energetic waste plastics. The optimum process parameters are C2, E4, A1, B2, and D1, specifically, reduction pressure of 0.15 MPa, mass content of energetic waste plastics of 16%, reduction temperature of 923 K, linear velocity of 0.8 m/s, and size of energetic waste plastics in the range of 0.66–1.00 mm.
The optimum scheme was obtained under the given factors and levels. Obtaining a good test scheme without defining the level is possible. Thus, the optimal scheme may be unsuitable for the experiment when the selected factors and levels are not adjusted at the same time. Therefore, the factors and levels should be adjusted to achieve an improved scheme. The relationship between the factors and indicators can be drawn, using the factor levels as the horizontal coordinates and the experimental index of the average value of ki as the longitudinal coordinates. The relationship is shown in Figure 2.
The impact of different factors on different indicators varies; thus, the importance order of the factors affecting two indicators cannot be combined. However, the optimal scheme can be obtained using a comprehensive balance method. The specific balancing process is as follows.
Factor A (reduction temperature): A reduction process is conducted after the addition of the mixed materials; thus, the metallization rate increases with the reduction reaction [21]. When the temperature reaches a certain degree, the metallization rate reaches the maximum value. With the increase in temperature, the energy of the iron whiskers or iron atoms on the surface of particles produced by the reduction also increases, which in turn increases the physical adsorption; as a result, the energy of the iron whisker becomes prone to amalgamation, thereby leading to sticking loss [8,19] and the decrease in metallization rate. As temperature increases, the critical solid bridge radius increases first and then decreases. The smaller the critical solid bridge radius, the more likely the sticking loss occurs [22] and the smaller the metallization rate. Therefore, the selected level for the metallization rate is Level 2. At low temperatures, the sticking ratio is maintained at a low level and the fluidization effect is good. With the increase in temperature, the sticking ratio gradually increases, and the sticking loss gradually decreases. Thus, the selected level for the sticking ratio is low (Level 1). Therefore, temperature should be between Levels 1 and 2, that is, 923–973 K.
Factor B (linear velocity): With the increase in superficial gas velocity, the upward gas drag force on particles also increases. The decrease in the load on particles enlarges the particle spacing, reduces the tightness of the particles in the bed, and increases the porosity. The increase in the bed expansion hinders sticking loss. As linear velocity of reduction gas increases, the metallization rate increases. However, when the gas velocity increases to a certain extent, particles are blown out of the fluidized bed and the metallization rate is reduced. Therefore, Level 2 is selected. The sticking force among particles increases along with the particle size. Particles easily slide when gas velocity reaches a certain value. When the particle spacing in the bed is small, the expansion rate of the bed layer decreases gradually with the increase in particles, and the sticking ratio increases. When the sticking force among the particles exceeds the gas drag force, the high-temperature iron whiskers reunite [23]. Accordingly, the fluidization reduction of fine iron ore sticking is facilitated. Level 2 is selected for sticking ratio. Considering the above-mentioned factors, the linear velocity of 0.8 m/s is selected.
Factor C (reduction pressure): With the increases in reduction pressure, gas density, and gas–solid contact area, the speed of the gas–solid reaction is accelerated, and the metallization rate is improved. Notably, as reduction pressure increases, the metallization rate gradually increases with the reduction reaction and then reaches the maximum value.
The increase in reduction pressure increases the velocity of reduction gas. Consequently, the reduction gas is exhausted from the fluidized bed vessel before rising to the setting temperature, thereby effectively reducing the reduction temperature and the reduction effect. The metallization rate and the gas utilization also decrease. At the same time, the pressure curbs the Fe3C + FeO = 4Fe + CO (g) reaction, and C + FeO = Fe + CO (g) shifts to the positive direction of the reaction, which is not conducive to the formation of metallic iron and reduces the metallization rate. Therefore, Level 2 is selected for the rate of metallization and the effective utilization of gas. The appropriate increase in reduction pressure is conducive to the increase in gas velocity during gas reduction. The increase in the upward gas drag force on particles results in a uniform particle distribution in the fluidized bed; this condition achieves “more flowing” fluidization [24], which can improve the fluidization effect and reduce the sticking ratio. As the reaction continues, the iron whiskers or iron atoms deposited are reunited with each other, thereby increasing particle size and particle gravity. When the gravity and sticking force are larger than the gas drag force on particles, the sticking of particles occurs, and the sticking ratio increases. Therefore, Level 2 is selected for the sticking ratio. Considering said factors, the reduction pressure of 0.15 MPa is selected.
Factor D (particle size of energetic waste plastics): A small particle size of energetic waste plastics and a full pre-cracking reaction mean increased precipitation of graphite content and an obvious inhibition effect on sticking. However, the specific impact and mechanism of particle size of energetic waste plastics on sticking loss are related to particle size of iron powder, fluidization gas velocity, and mass content of energetic waste plastics. The metallization rate shows an increasing trend and decreases slightly after reaching the maximum value. Therefore, Level 3 is selected for the sticking ratio. Considering the above-mentioned factors, the particle size of energetic waste plastics in the range of 0.18–0.66 mm is selected.
Factor E (mass content of energetic waste plastics): The test results show that, with the increase in the mass content of energetic waste plastics, the metallization rate increases to the maximum and then declines. The micron graphite content deposited obstructs the reunion of iron whiskers or iron atoms, thereby effectively improving the metallization rate. However, the increase in mass content of energetic waste plastics increases graphite precipitation. The newly deposited iron whiskers or iron atoms are effectively coated, and the unreacted iron ore particles are coated to some extent. As graphite precipitation increases, the extent of coating increases, which decreases the effective contact area of reduction gas, iron ore particles, and reaction efficiency. This condition is the main reason why the metallization rate increases to the maximum and then declines. Therefore, Level 2 is chosen for the rate of metallization and the effective utilization of gas. The increase in mass content of energetic waste plastics increases the micron graphite content deposited, thereby effectively coating the new iron whiskers and precipitated iron atoms and inhibiting the sticking loss. The test results show that the sticking ratio drops in an oscillating manner with the increase in the energy of energetic waste plastics. The density difference between the mixture components (graphite and fine iron ore particles) will result in non-uniform graphite coating. Levels 2 and 3 are selected for the sticking ratio. Considering said factors, a mass content of energetic waste plastics of 8% is selected.
From the above-mentioned analysis, the best operating parameters are obtained as a reduction temperature in the range of 923–973 K, linear velocity of 0.8 m/s, reduction pressure of 0.15 MPa, reduction pressure of 0.15 MPa, size of energetic waste plastics in the range of 0.18–0.66 mm, and mass content of energetic waste plastics of 8%.

4. Mechanism of Carbon Precipitation in Inhibiting Sticking of Iron Ore Particles

On the basis of the optimum technological parameters, the mechanism of carbon precipitation in inhibiting sticking of iron ore particles is discussed from three aspects: the sticking mechanism of iron ore particles, the reaction mechanism of carbon precipitation from energetic waste plastics, and the mechanism of carbon precipitation in inhibiting sticking.

4.1. Sticking Mechanism of Iron Ore

To elucidate the sticking mechanism of iron ore particles, the iron ore particles were reduced for 50 min at 973 K with a reduction gas of pure H2 and a linear velocity of 0.8 m/s.
SEM-EDS analysis was carried out on the micromorphology of the sample surface, as shown in Figure 3.
Figure 3a shows many tiny white particles on the surface with a size in the range of 20–40 nm. The results of EDS in Figure 3b reveal that these tiny particles are metallic iron. Given that nanoscale microstructure appears on the particle surface, the surface energy increases and the melting temperature decreases. The change in these properties increases the sticking force between particles and results in the sticking loss of particles.
The particles on the reactant surface migrate at a low temperature. The temperature is called the Tammann temperature when a reaction starts to show significant diffusion. For different materials, a relationship exists between the Tammann temperature Ts and the melting point Tm. The relationship for metallic iron is as follows.
Ts = 0.3~0.47Tm
When the solid melts, the solid is in equilibrium; accordingly, Formula (5) can be deduced using the Kelvin formula and the phase equilibrium as follows:
ln T m , y T m = 2 M γ ρ Δ H f r
where Tm,r and Tm are the melting temperature of small sphere and bulk solid, K; M is the molar mass, g; ρ is the solid density, g/m3; ΔHf is the molar heat of fusion, J/mol; γ is the surface tension, N/m.
When Formula (4) is substituted into Formula (5), Formula (6) is obtained as follows:
ln T s , r T s = 2 M γ ρ Δ H f r
where Ts,r and Ts are the melting temperature of small sphere and bulk solid, K; M is the molar mass, g; ΔHf is the molar heat of fusion, J/mol; γ is the surface tension, N/m.
The Tammann temperature of 903 K of the metallic iron is substituted into Formula (6), and the Tammann temperature range of the iron atom on the surface of the reduced particles is 776–837 K [22]. Therefore, under the experimental conditions of 903 K, the reduction temperature exceeds the Tammann temperature of iron atoms, which diffuse significantly. The bridge originates or grows between the iron atoms. The fluidization depends on the relationship between gas drag force on the iron atoms (Formula (7)) and solid bridge force (Formula (8)).
F d = α C d π 8 d p 2 ρ g U g 2
where Fd is gas drag force on the iron atoms, N; α is the coefficient of gas composition, %; Cd is the drag coefficient; dp is the average particle diameter, m; ρg is the average gas density, g/m3; Ug is the gas velocity, m/s.
F C = π x 2 σ
where Fc is the solid bridge force, N; x is the radius of solid bridge, m; σ is the tensile strength of solid bridge, Pa.
The iron atoms stick to each other and cause sticking loss when the solid bridge force is larger than the gas drag force on the iron atoms. The system is in a fluidized state when the solid bridge force is smaller than the gas drag force on the iron atoms.
Under the conditions of pressure of 0.15 MPa, temperature of 973 K, reduction gas of pure H2, and linear velocity of 0.8 m/s, the law of the phase evolution of particles before and after sticking was studied, and results are shown in Figure 4.
The results show that the main phase compositions in the reduction process of iron ore particles are Fe3O4, FeO, and Fe. The particle phase before the loss is mainly composed of Fe3O4 and FeO and shows no diffraction peaks of metallic iron. With the extension of reduction time, the diffraction peaks of Fe3O4 gradually weaken, the diffraction peaks of metallic iron gradually increase, and the diffraction peaks of FeO insignificantly change. The reduction in Fe3O4 increases the content of FeO, but the deposition of metallic iron decreases the content of FeO. When sticking loss occurs, the obvious diffraction peaks of metallic iron appear in particles; this finding confirms the result in Figure 3. The occurrence of sticking is caused by the reunion of the metal iron atoms.

4.2. Reaction Mechanism of Carbon Precipitation from Energetic Waste Plastics

To elucidate the reaction mechanism of carbon precipitation from energetic waste plastics, a reduction experiment was conducted under the condition of temperature of 973 K, reduction gas of pure H2, linear velocity of 0.8 m/s, reduction pressure of 0.15 MPa, particle size of added energetic waste plastics in the range of 0.18–0.66 mm, and mass content of added energetic waste plastics of 8%.
The different valence states of deposited carbon were determined with the help of XPS by studying the C1s core-level energy spectrum. Thus, the occurrence state of deposited carbon was obtained. Each XPS spectrum was used to produce a peak division fitting graph by using of XPS PEAK 4.1 and the Gaussian–Lorentzion method. The XPS spectra of C1 present a double peak structure, which shows that the deposited carbon possesses two occurrence states: carbon from Fe3C with a binding energy of 283.7 eV, and the free carbon with a binding energy of 284.6 eV [25,26]. Carbon from Fe3C and free carbon exist in the particles after the reduction of iron ore with the addition of deposited carbon from energetic waste plastics.
The proposition of carbon in Fe3C and graphite in the total carbon content was calculated using the integration of the area under the carbon peaks of different valences. The data in Figure 5 show that, after the pre-cracking for 10 min and the reduction for 30 and 50 min, the occurrence of carbon in the particles is carbon in Fe3C and free carbon. Furthermore, the graphite content is higher than that in Fe3C. The energetic waste plastics (PP and PE) are cracked, and the occurrence of carbon is mainly in the form of graphite. Therefore, the energetic waste plastics (PP and PE) are first cracked into ethylene, propylene, methane, etc., and then they further split into graphite. Figure 5 shows that, compared with (a) and after the reduction for 30 min in (b), the graphite content reduces by 7.40% and the carbon content in Fe3C increases. The graphite produced from pre-cracking and the iron ore powder exhibit a chemical reaction that causes the generation of Fe3C and the formation of carbon oxides (CO and CO2), which are emitted out of the fluidized bed reactor. The small amount of graphite taken out of the exhaust port by the gas is responsible for the decrease in the content of graphite. The Fe–O–C equilibrium diagram shows that the metal iron cannot be obtained from iron oxides by the reduction in solid carbon or CO at 923–958 K. The main product is Fe3C. CO can exhibit a Boudouard reaction, in which the carbon atoms may dissolve into the metal iron to form Fe3C; the newly deposited metal iron can react with CO to produce Fe3C [27], which results in graphite loss and increases the amount of Fe3C after the reduction for 30 min. The chemical reactions are as follows.
2CO = C + CO2
C = [C]
3Fe + [C] = Fe3C
3Fe + 2CO = Fe3C + CO2
Figure 5b,c show that the main occurrence state of carbon is graphite. Compared with the reduction for 30 min, the graphite content increases slightly by 0.49% and the carbon content in Fe3C decreases slightly after the reduction for 50 min. The thermodynamics of carbon precipitation and iron oxide reduction was analyzed to determine the reasons for the change in carbon content. The XRD diagram of post-reduction fine iron ore is shown in Figure 6. Fe, Fe3C, and graphite were identified by XRD, shown in Figure 6. The main reactions are as follows [28].
Fe3C + FeO = 4Fe + CO (g)
C + FeO = Fe + CO (g)
Fe3C = 3Fe + C
The thermodynamics analysis of the above-mentioned reactions was performed using Factsage thermodynamics software (7.2, ThermFact LTD, Mont-Royal, QC, Canada), and the Gibbs free energy change is shown in Figure 7. With the temperature in the range of 958–973 K, the reaction rate of H2 is better than that of CO [29,30] and the reaction free energy of (15) is lower than that of (13) and (14). Therefore, the latter reaction proceeds easier than the two previous reactions at this temperature. Moreover, the reaction free energy of (15) increases the rate of metallization and the content of graphite. This condition is also the reason for the slight increase in the graphite content and the slight decrease in the carbon content of Fe3C, which can be seen by comparing the reduction for 30 and 50 min in Figure 5.

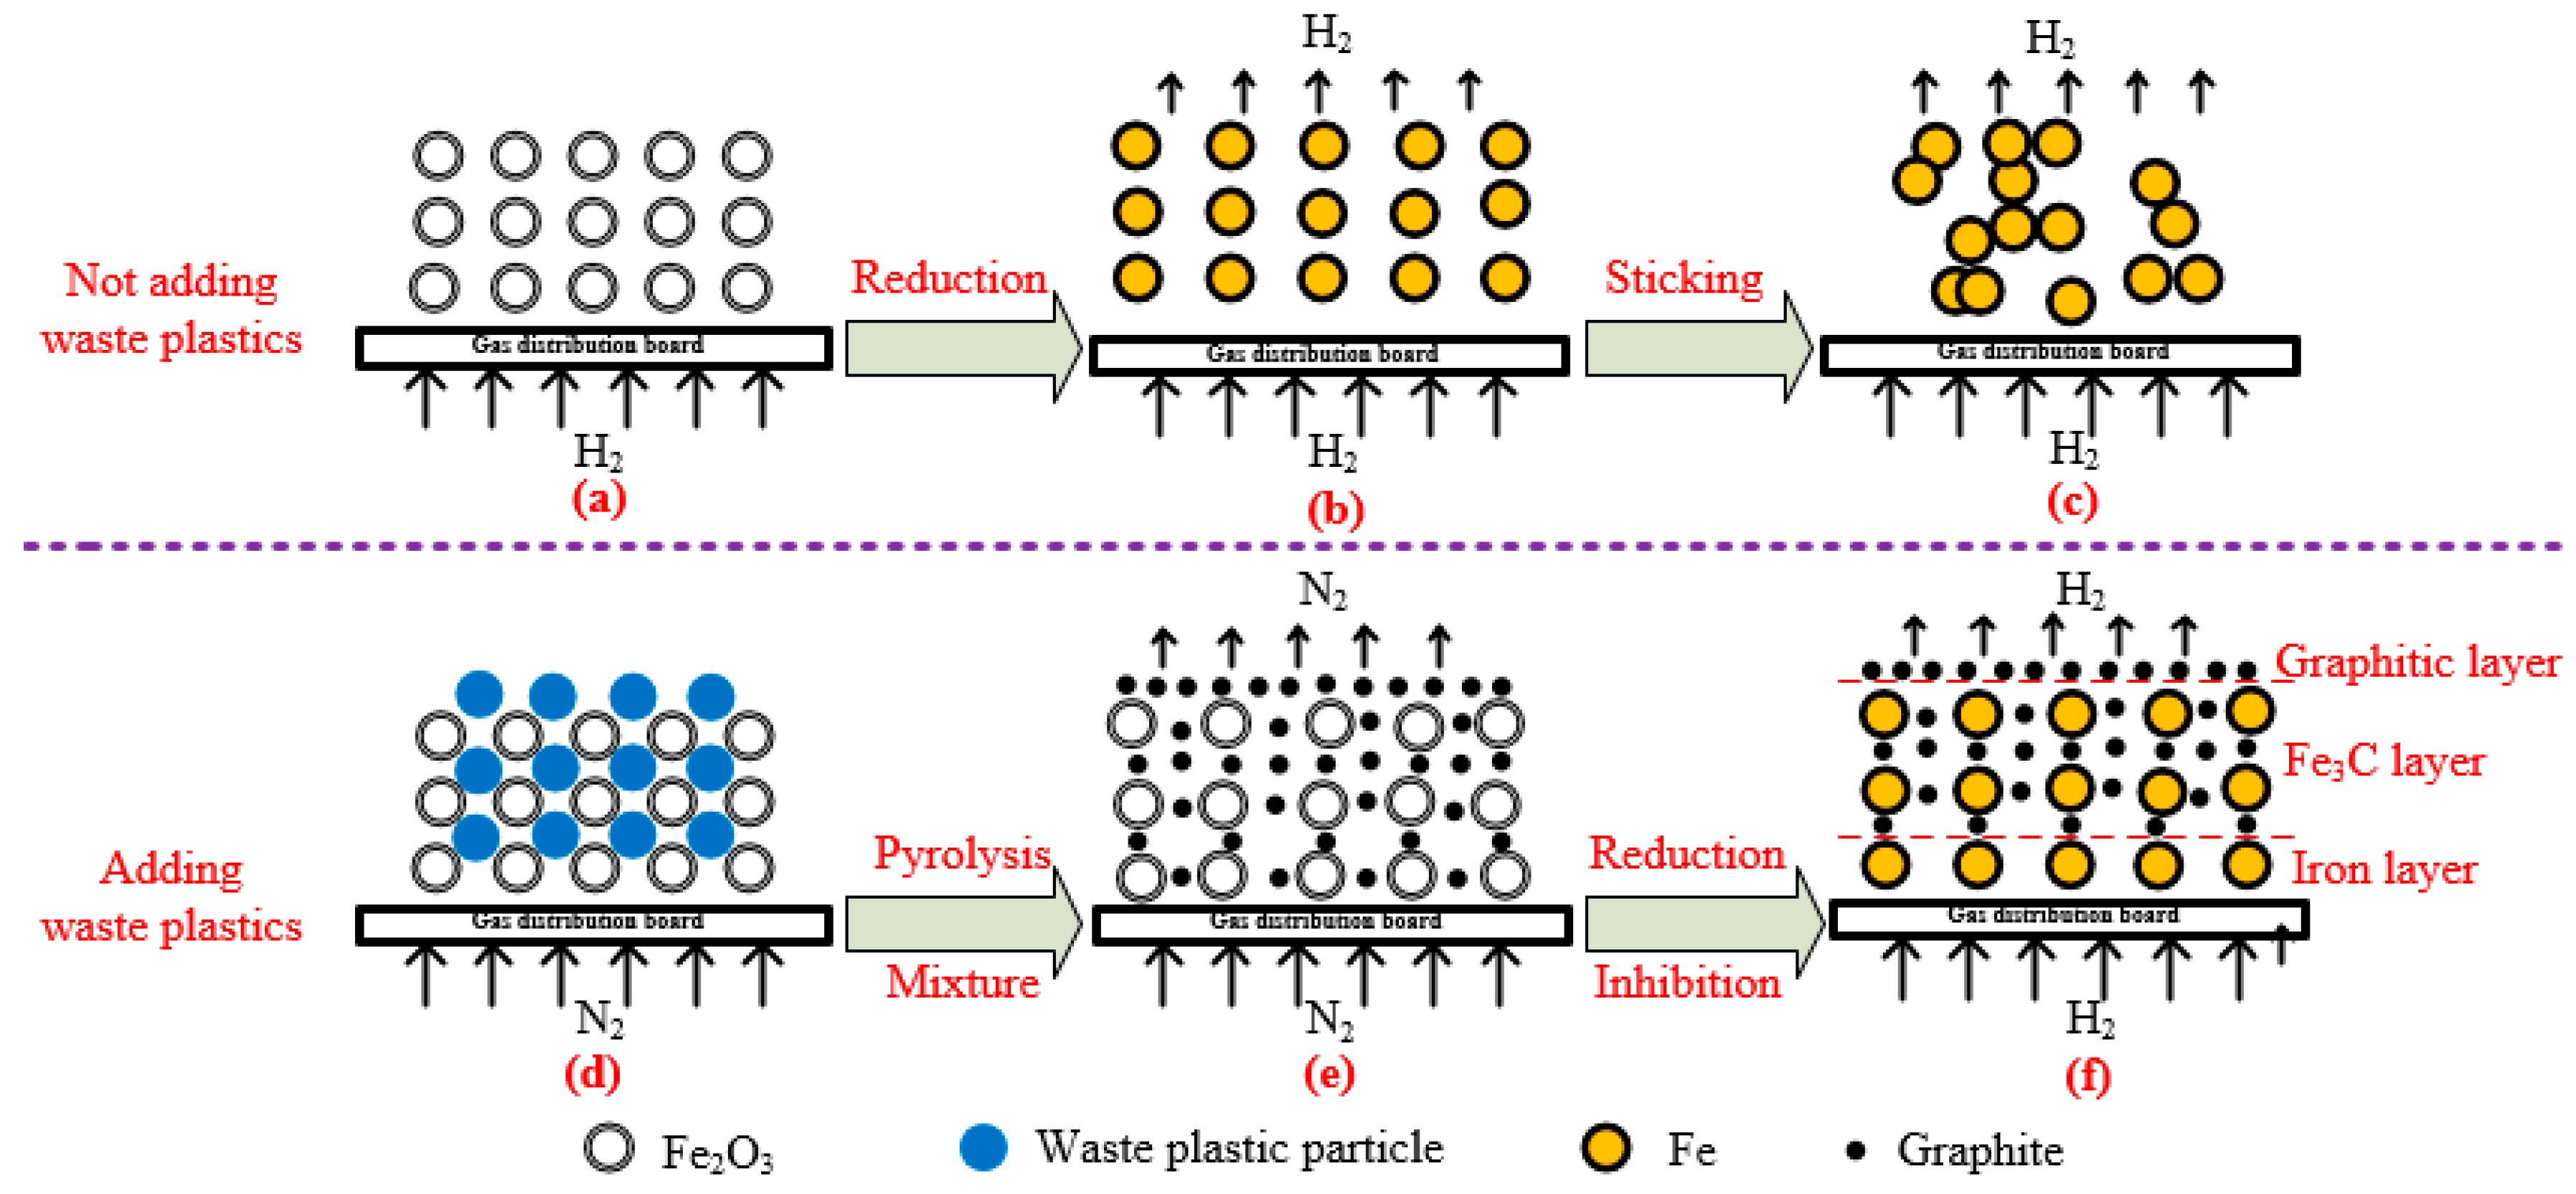
4.3. Mechanism of Carbon Precipitation in Inhibiting Sticking

The occurrence of sticking is caused by the mutual bonding between iron atoms, and the inhibition of the sticking is mainly due to the role of carbon precipitation. Therefore, clarifying the mechanism of different forms of carbon to iron atoms is important for elucidating the mechanism of carbon precipitation in inhibiting sticking.
Figure 7 shows that the surface possesses a layer of powder material to wrap the particles. The coating at the corner of the powder particles slightly peels given the particle collision in the process of fluid reduction. As shown in Figure 8, a layer of metal forms on the particle surface and the dissolved carbon on the iron layer becomes saturated and forms a layer of Fe3C between the graphite and metal iron, thereby hindering the graphite solid solution. The surface graphite cannot be combined with the oxygen atoms in the particles given the barrier effect of the metal iron layer. Thus, the direct contact between iron and iron is avoided, the diffusion of iron atoms is hindered, and the formation of solid bridges between particles is prevented. Therefore, the carbon precipitation reaction attaches a layer of graphite to the surface of particles, and the formation of the graphite is the main reason that sticking is avoided, which is consistent with the reported opinion [28], that is, carbon in Fe3C slows down the sticking of iron ore powder, but graphite inhibits sticking.
Figure 9 shows the mechanism of carbon precipitation in inhibiting sticking for further analysis. In the reduction of the iron ore powder fluidization process, metal iron is exposed on the surface of the particle without adding energetic waste plastics. Collision of the particles eases the iron–iron contact and causes reunion, thereby resulting in sticking. The structure is shown in Figure 9a–c. At the beginning, hydrogen was used to reduce fine iron ore through gas distribution board, as shown in Figure 9a. But with the increase of iron atoms, there is Sticking among the iron atoms, as shown in Figure 9b,c. This is because the iron atoms are in direct contact with each other, which eventually leads to sticking, therefore sticking is caused by the mutual reunion of metal atoms.
In the fluidized reduction of fine iron ore, if a certain proportion of waste plastics with a certain size is added, then N2 with low gas velocity is passed through and stirred, and the energetic waste plastics are cracked and fully mixed. The structure is shown in Figure 9d,e. Gas is passed through for reduction, which causes the precipitation of metallic iron on the particle surface. Some solid solutions of carbon filter are added to the iron, thereby forming Fe3C. However, given the low metallization rate of particles, metallic iron exists in the form of iron particles on the particle surface, which is not a metal layer, and with the iron oxides distributed around. The deposited carbon exhibits a reducing reaction with iron oxides when temperature rises, thereby decreasing carbon and increasing iron. When no iron oxides exist on the particle surface, a layer of metal forms and the dissolved carbon on the iron layer becomes saturated, which lead to the formation of a layer of Fe3C. Consequently, the content of Fe3C remains stable. The structure of the particle surface is shown in Figure 9f. The outer part of the structure is graphite layer, the middle part is the layer of Fe3C, and the innermost part is the layer of metal iron. The formation of a metallic iron layer hinders the reduction consumption of carbon precipitation, while the Fe3C layer hinders the further solution of graphite. Thus, metallic iron and Fe3C are covered with graphite, thereby avoiding contact with each other in the particle collision. Accordingly, the formation of solid bridge from mutual diffusion is hindered and the sticking force between particles is eliminated. Ultimately, sticking is completely inhibited.

5. Conclusions

  • Graphite which is pyrolyzed by waste plastics can effectively inhibit the sticking between fine iron particles.
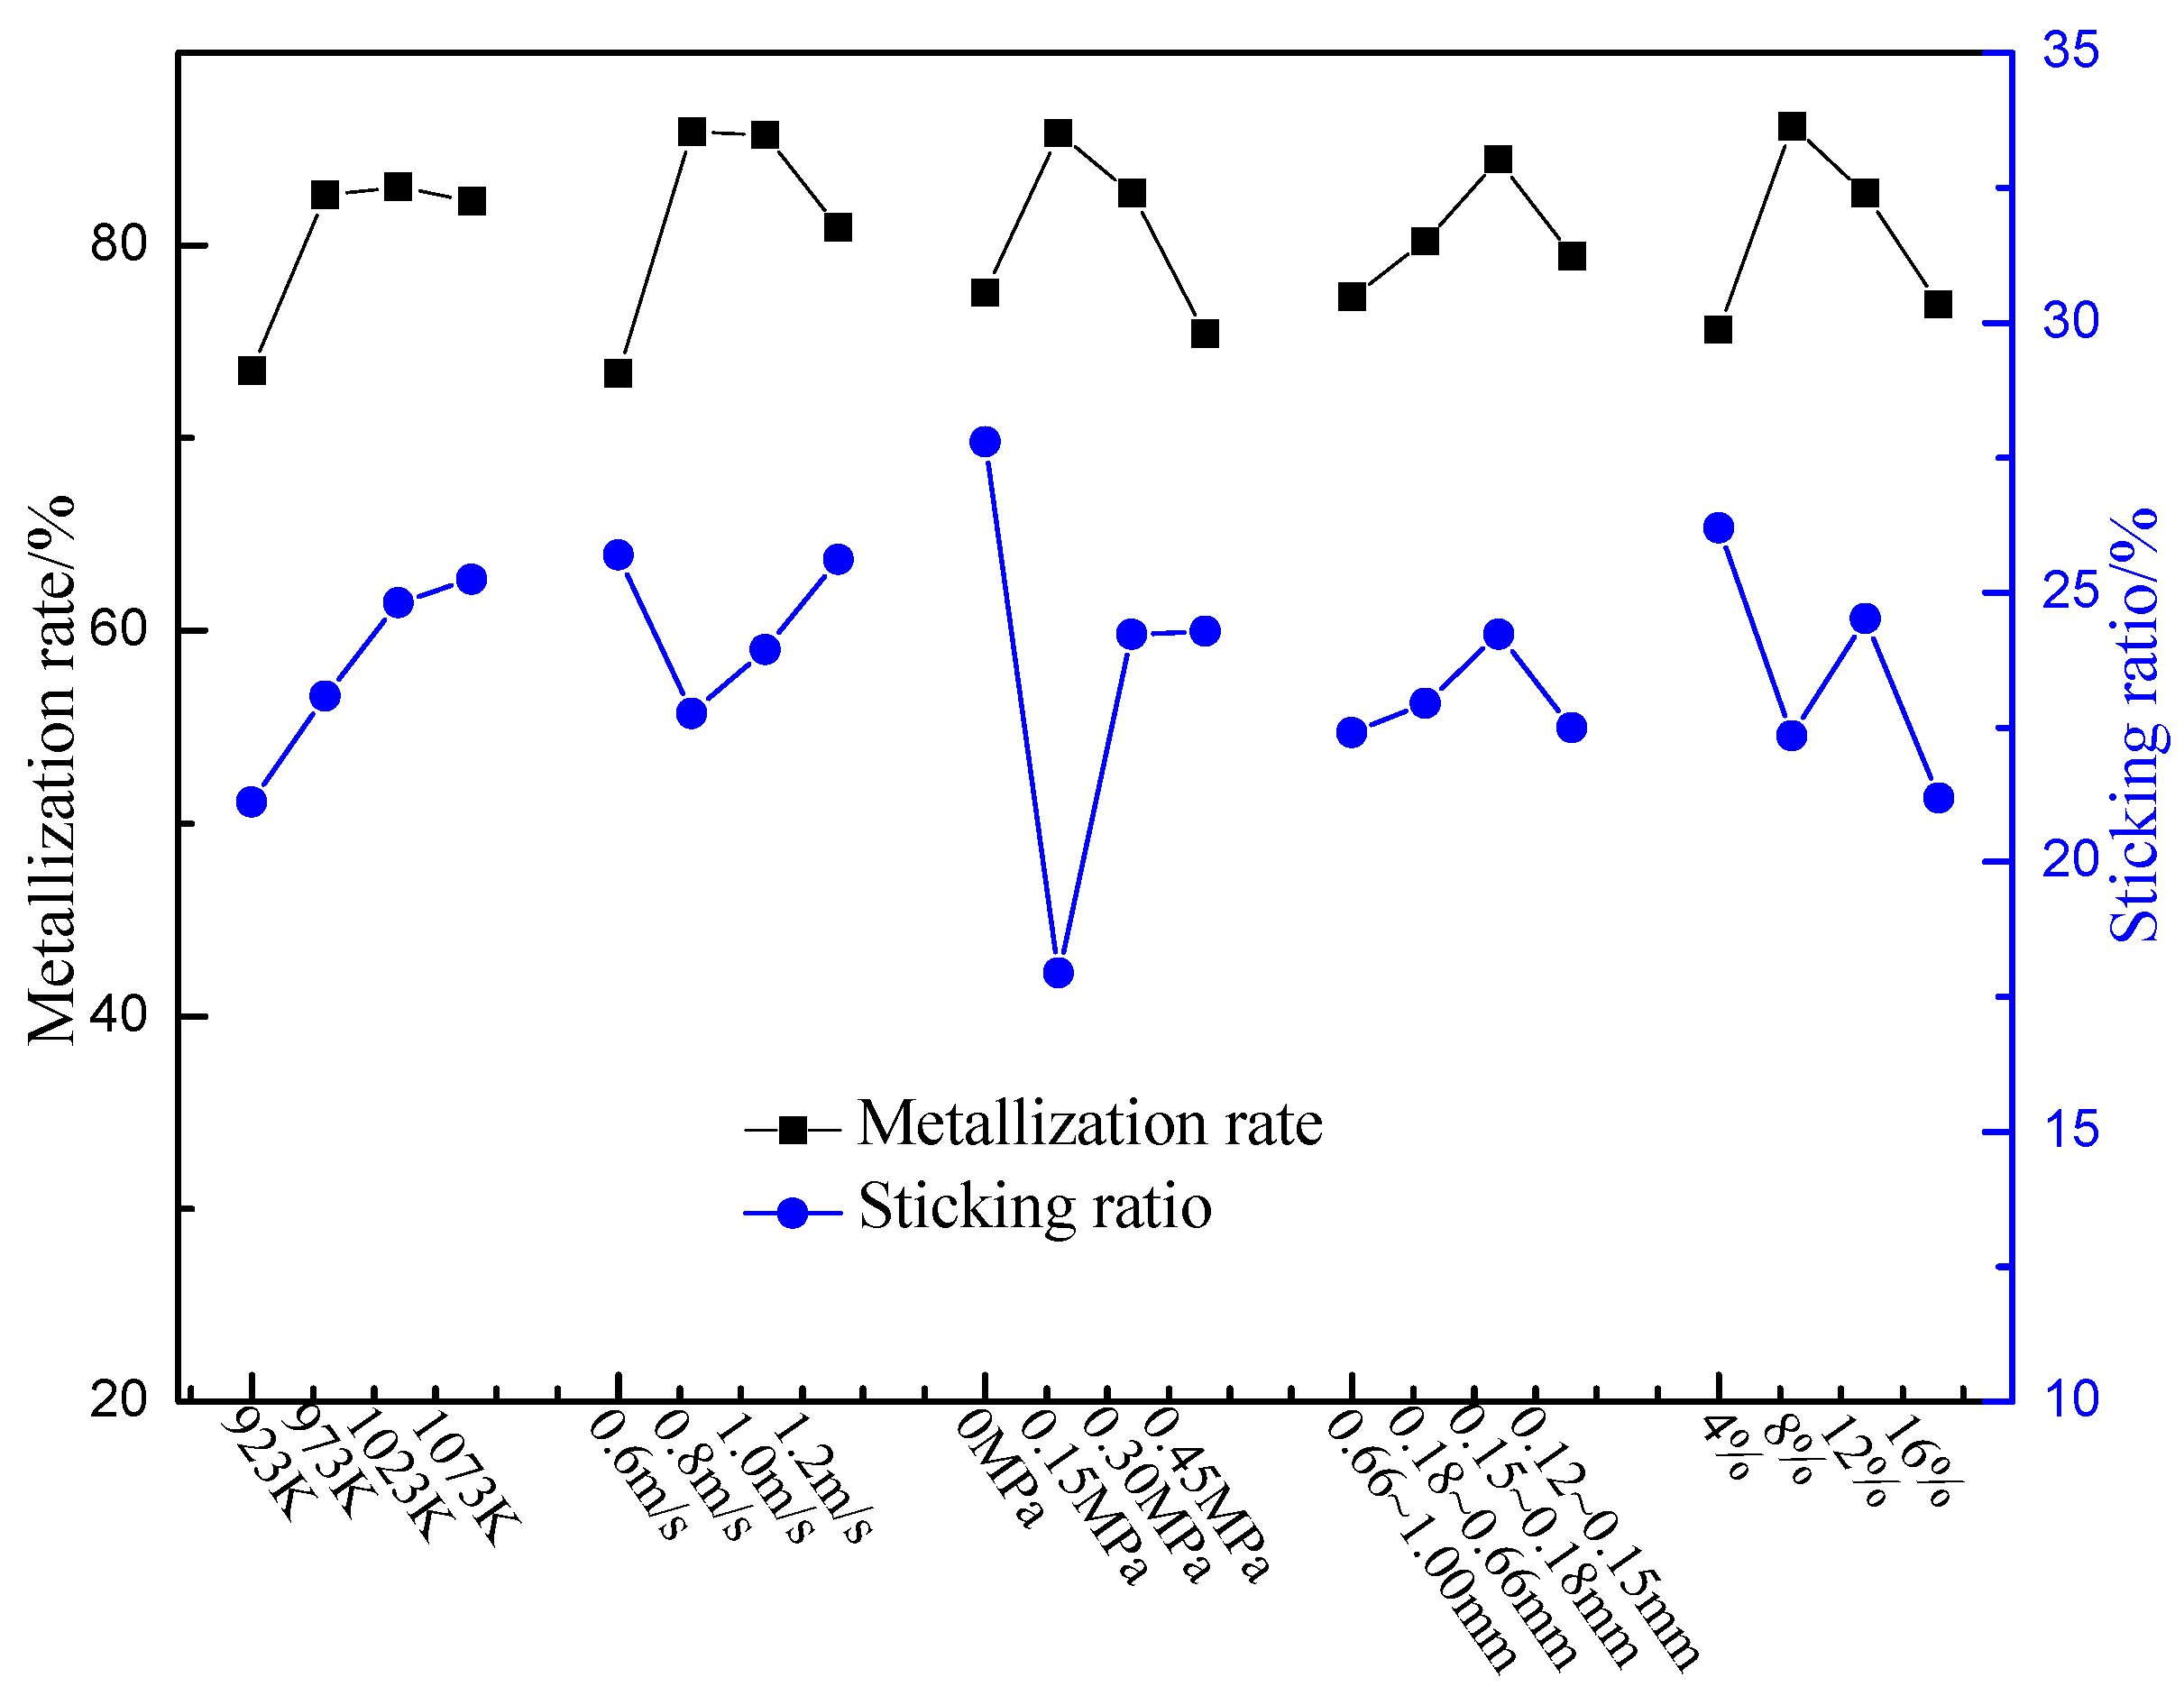
  • The primary and secondary influencing factors of the metallization rate during fluidized reduction are linear velocity, mass content of energetic waste plastics, reduction pressure, reduction temperature, and particle size of energetic waste plastics. Meanwhile, the primary and secondary influencing factors of the sticking ratio during fluidized reduction are reduction pressure, mass content of energetic waste plastics, reduction temperature, linear velocity, and particle size of energetic waste plastics.
  • The optimal operating parameters are reduction temperature in the range of 923–973 K, linear velocity of 0.8 m/s, reduction pressure of 0.15 MPa, reduction pressure of 0.15 MPa, size of energetic waste plastics in the range of 0.18–0.66 mm, and mass content of energetic waste plastics of 8%.
  • Sticking is caused by the mutual reunion of metal atoms.
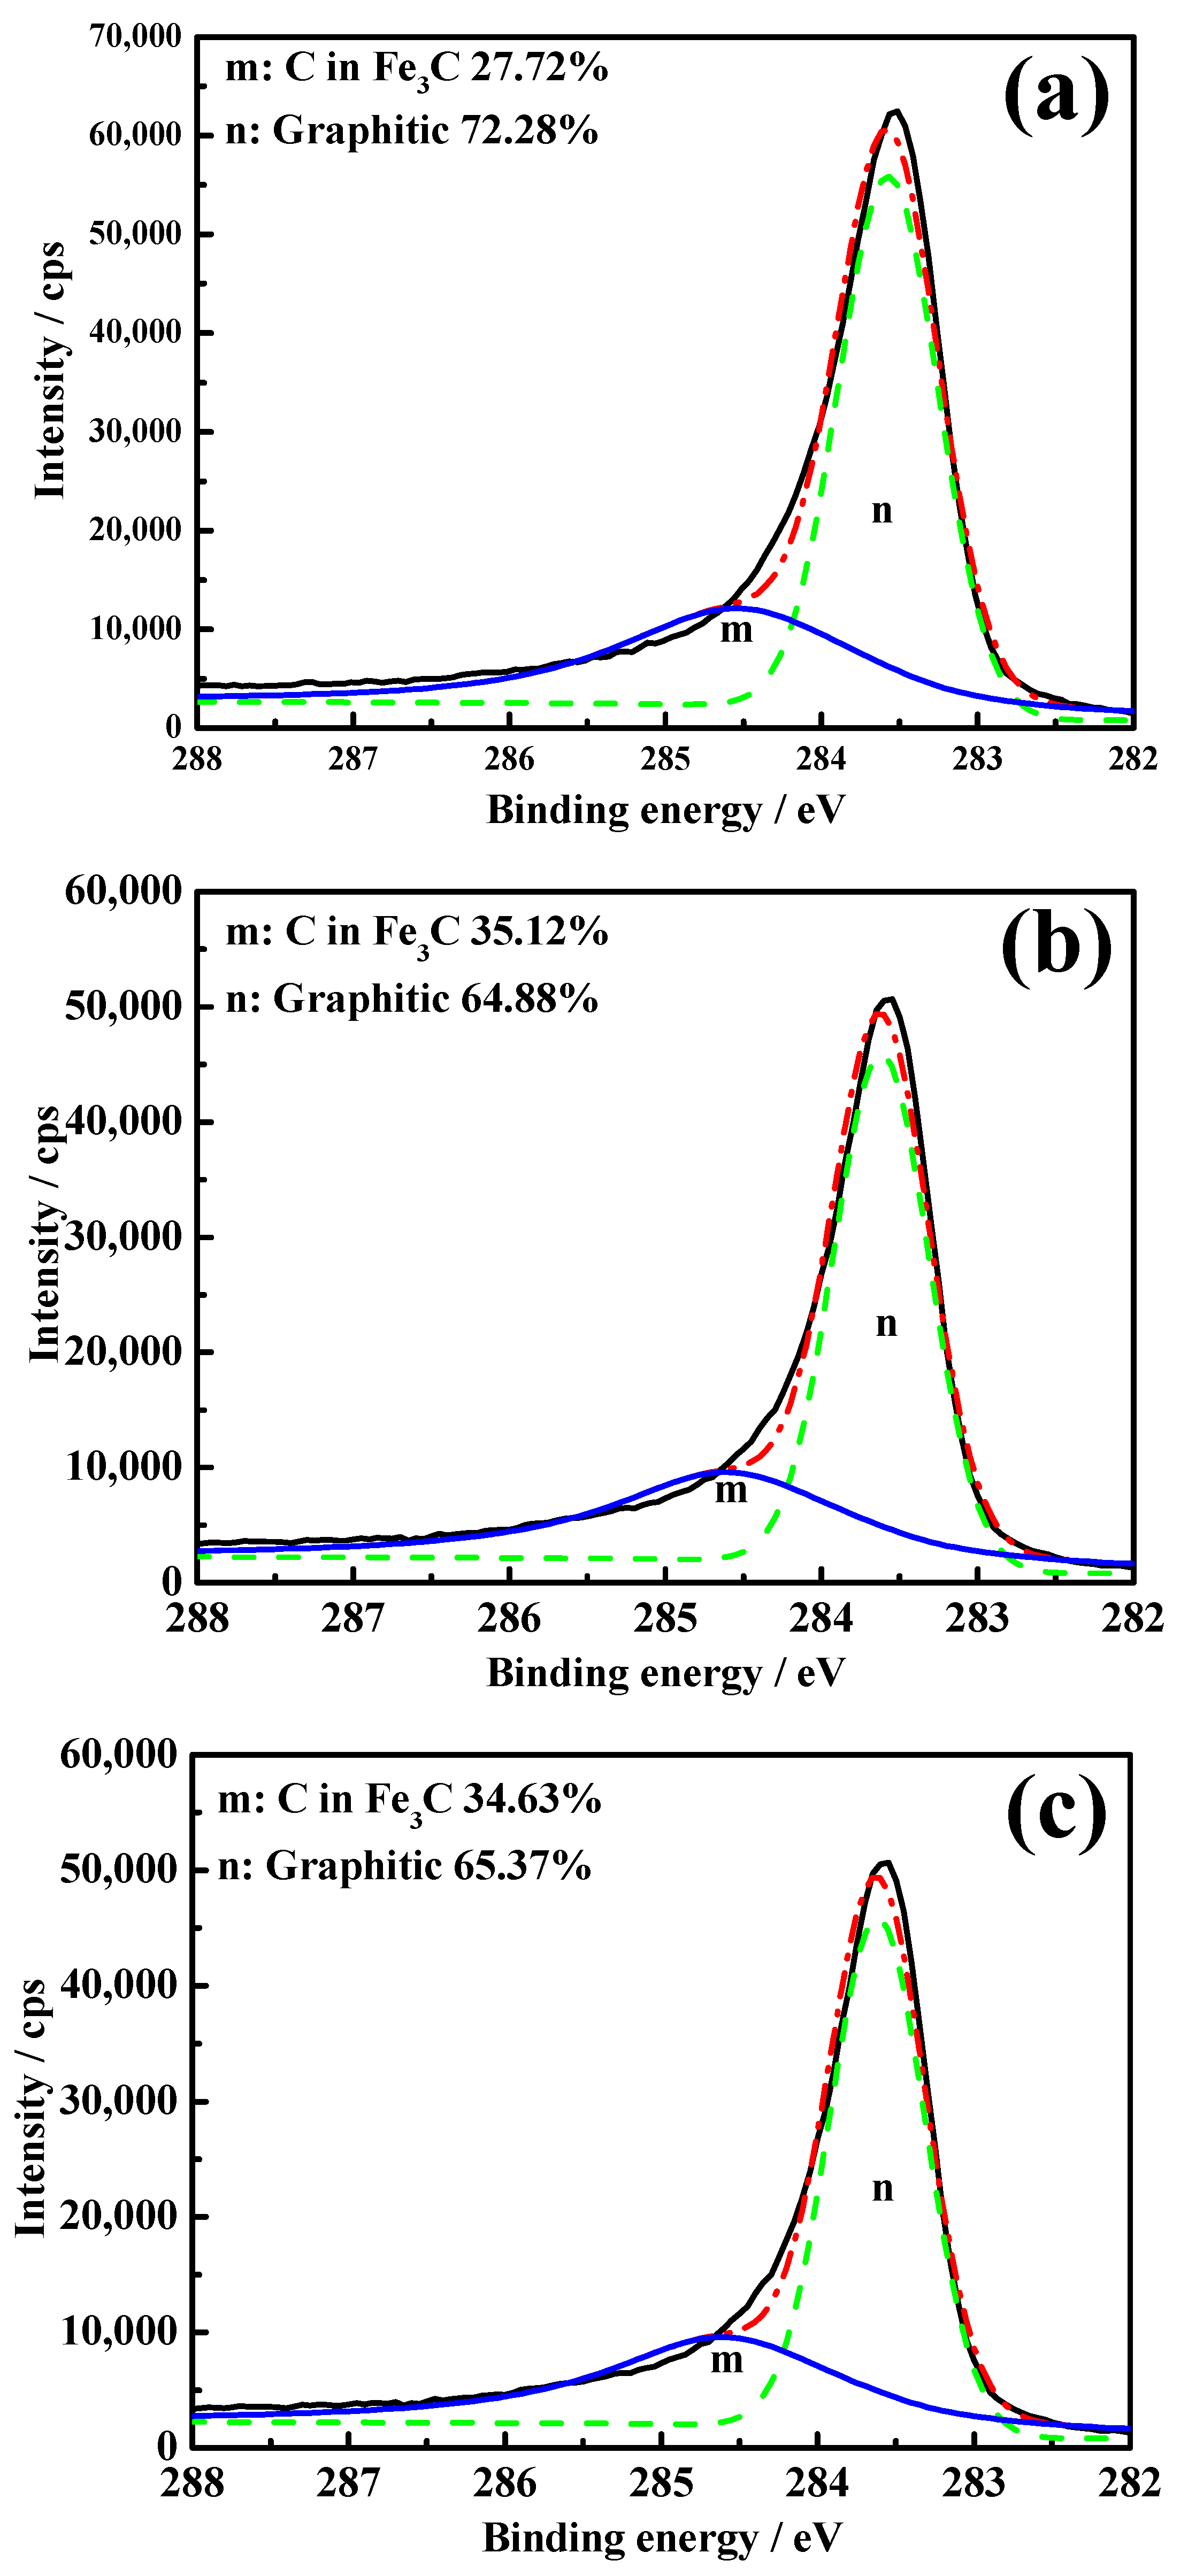
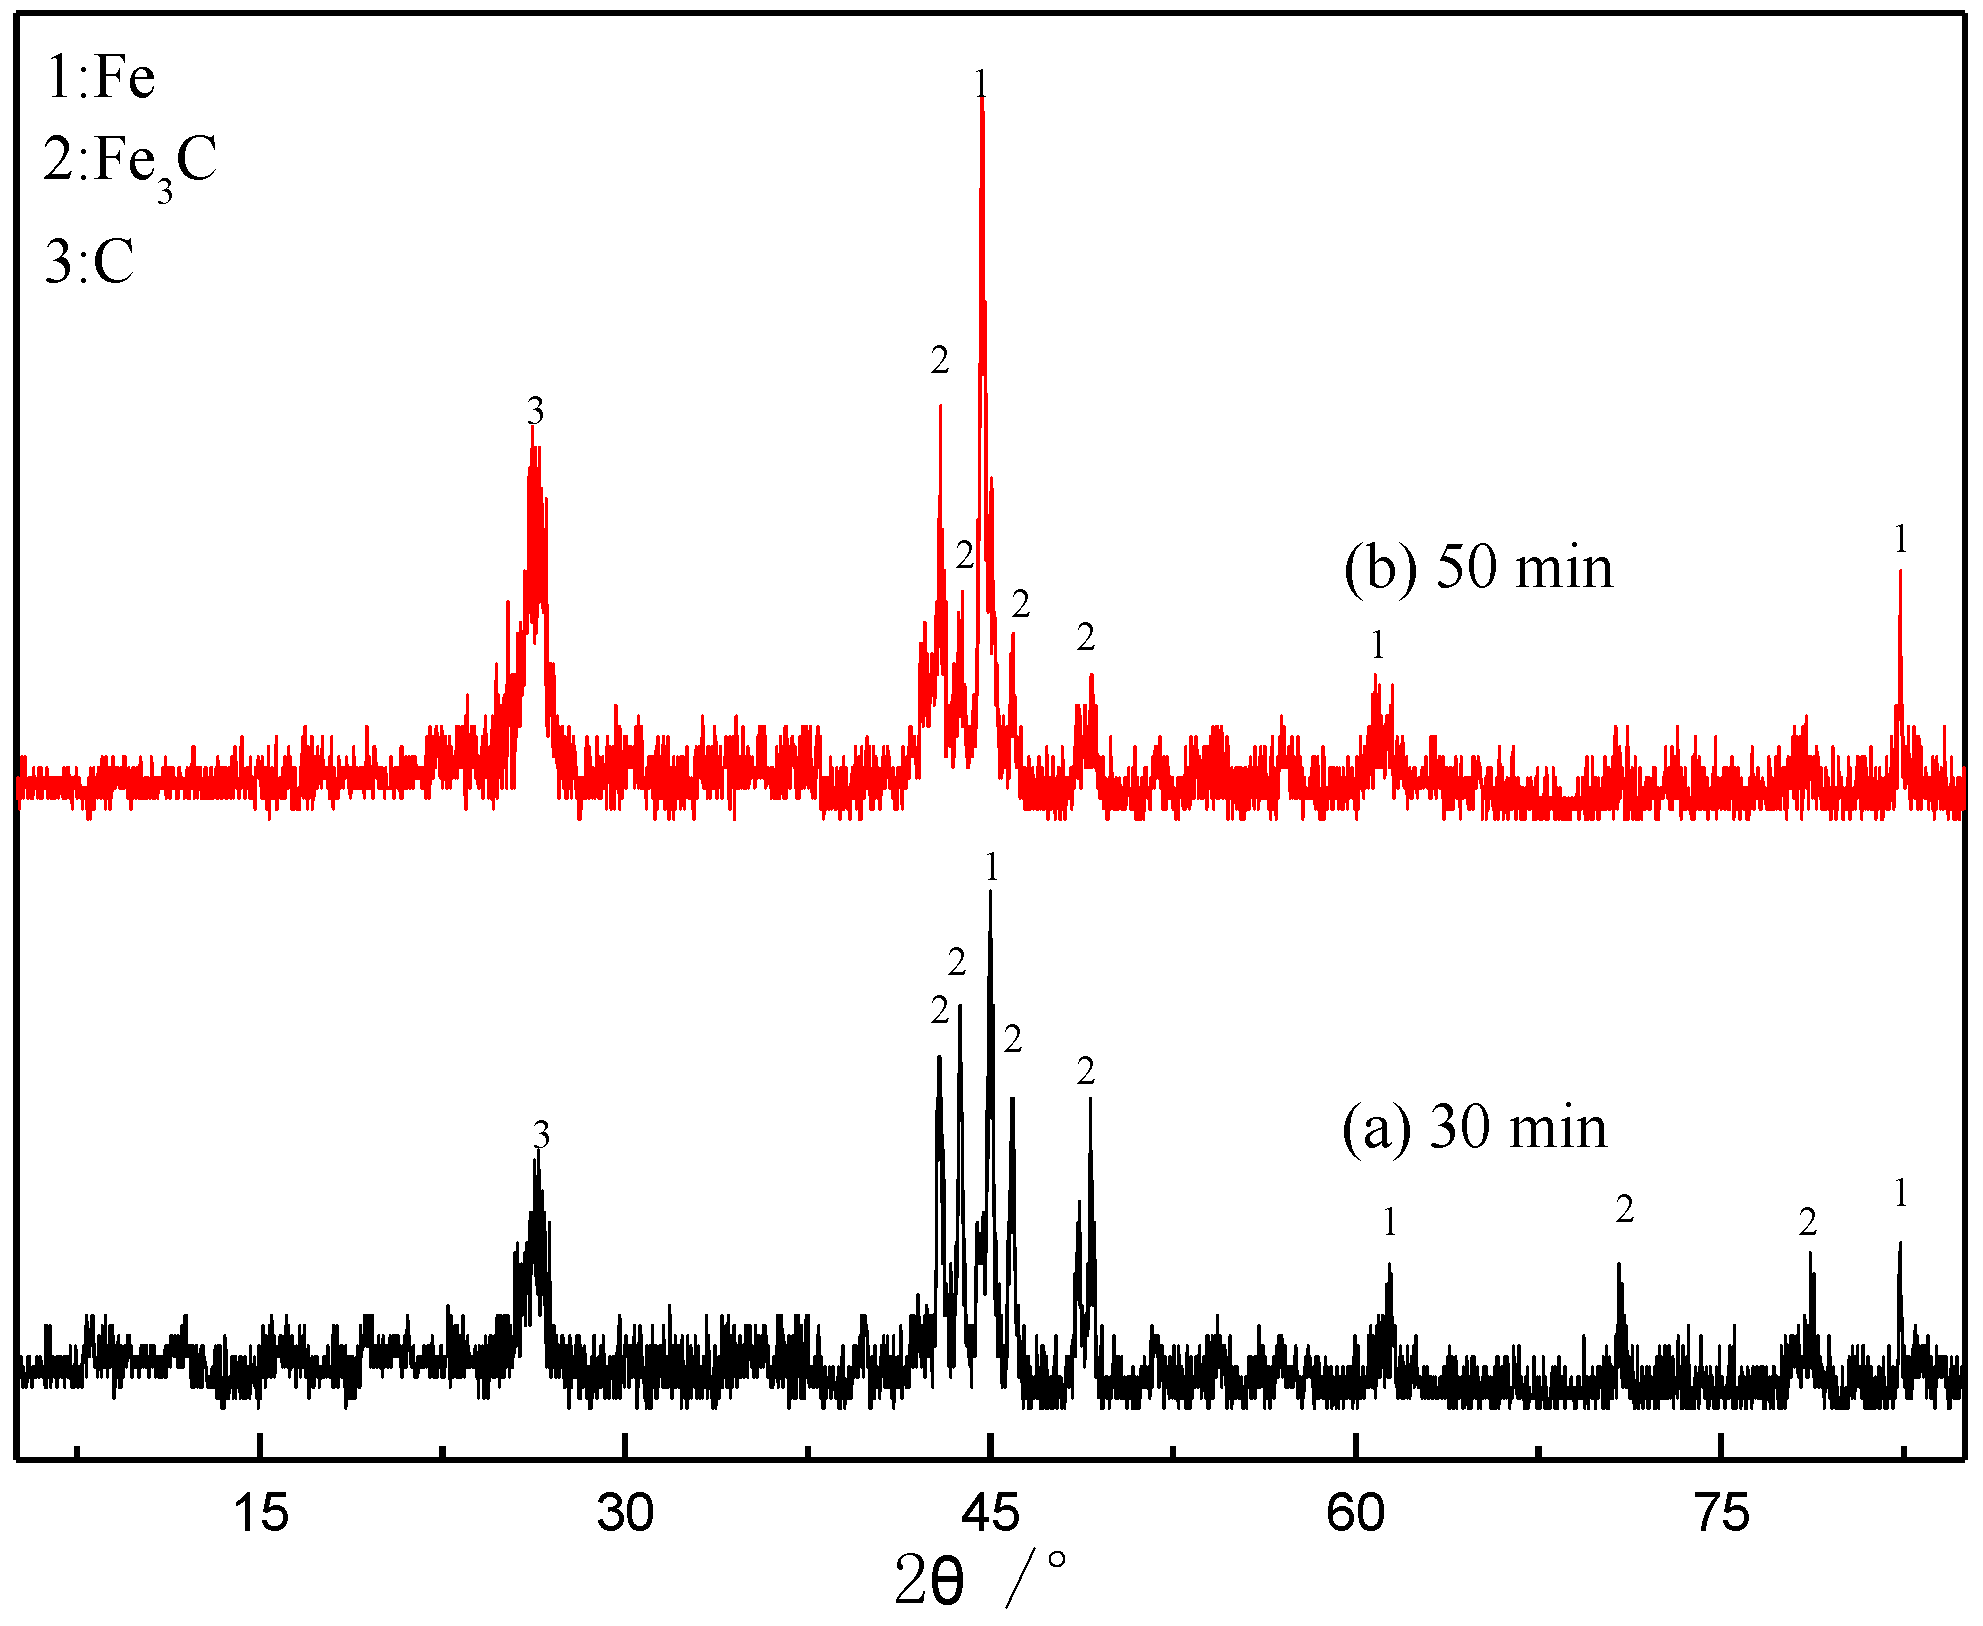
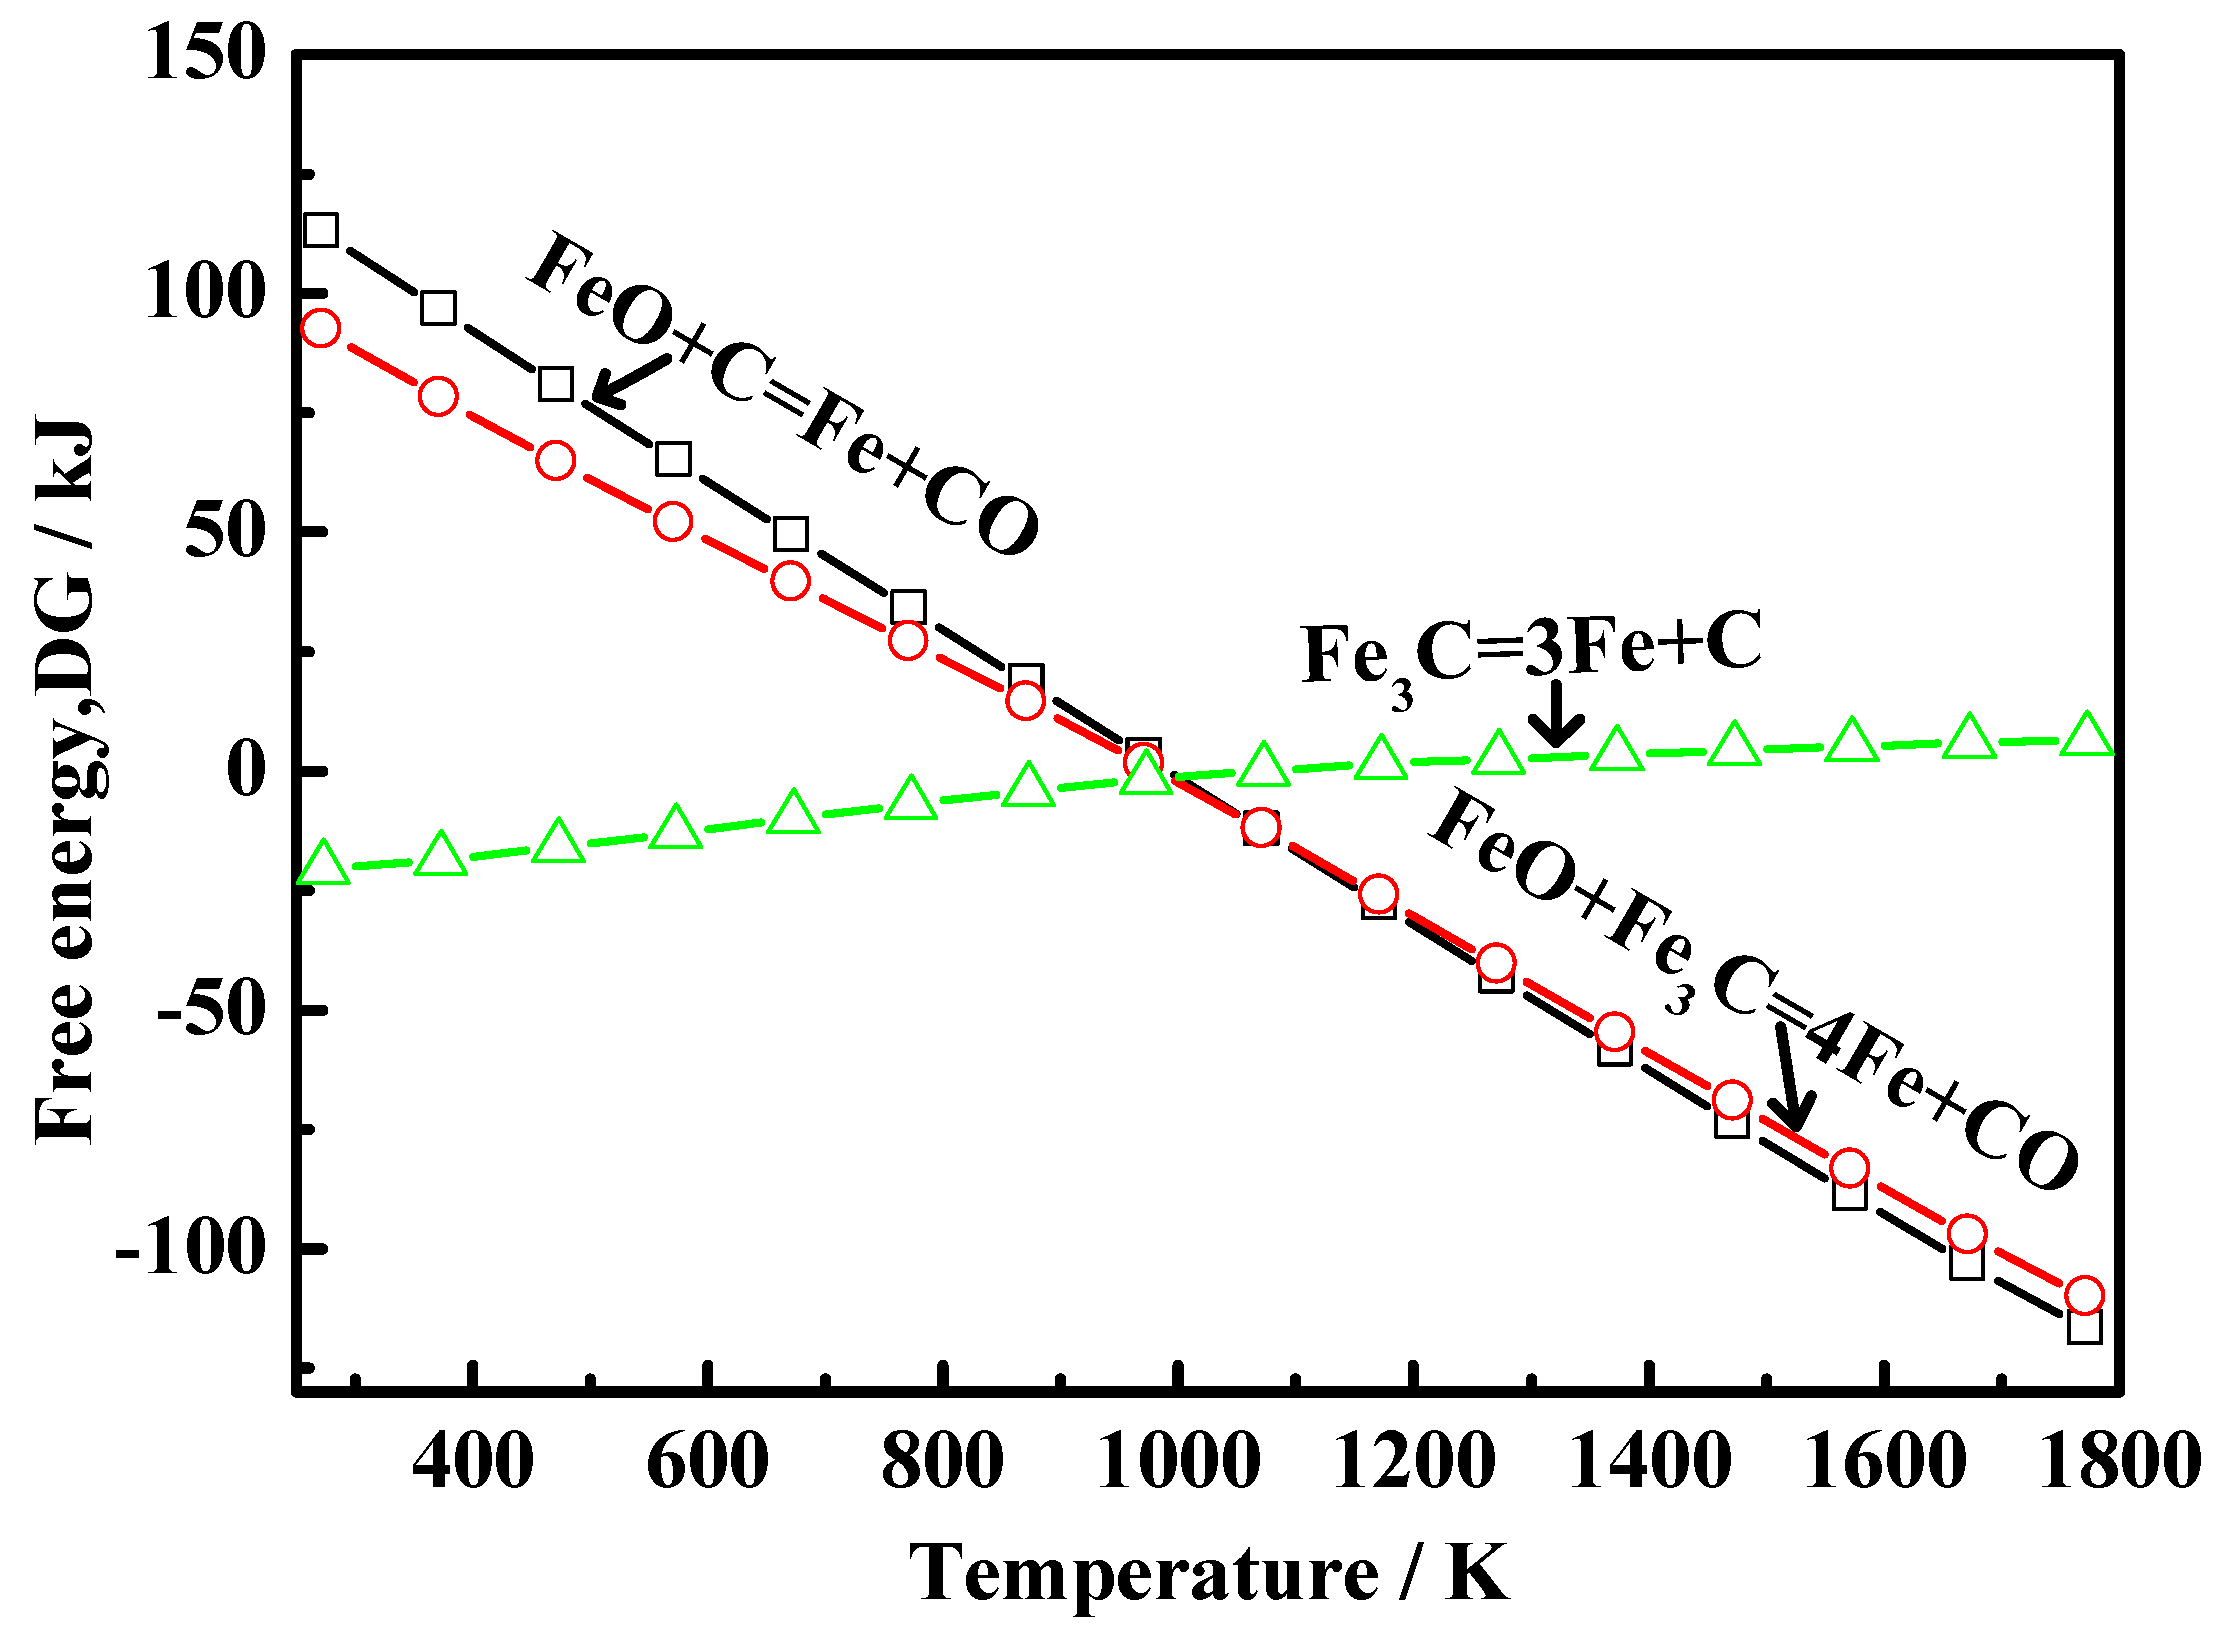
  • The occurrence states of carbons deposited from energetic waste plastics can be divided into two types: graphite and carbon from Fe3C. Carbon from Fe3C slows down the sticking, while the graphite hinders the contact among particles, thereby effectively inhibiting the sticking.

Author Contributions

Q.X., J.W. and L.Z. designed and performed the experiments; Z.L. (Zhuangzhuang Liu) and Z.L. (Zhiping Li) analyzed and discussed the data; J.W. provided guidance for this research; Q.X. wrote the paper.

Funding

This research was founded by the National Natural Science Foundation of China. The grant number is 51704003 and the grant number from the financial support of Anhui province natural science research project is KJ2017A043.

Conflicts of Interest

The authors declare no conflict of interest.

References

  1. Cui, L.W.; Xia, H.D.; Wang, C.; Yi, J.J.; Kong, L.H.; Chen, J. Current Status of Iron-Ore Resources in China and Screening of Object Iron-Ore Geological Data. Geol. Explor. 2012, 48, 1–5. [Google Scholar]
  2. Yang, M.; Xiao, W.D.; Zhang, P. Processing mineralogy study on lead and zinc oxide ore in Sichuan. Metals 2016, 6, 93. [Google Scholar] [CrossRef]
  3. Yang, T.J.; Zhang, J.L.; Zuo, H.B. Energy-Saving and Emission-Reducing of Blast Furnace Ironmaking Production in China. J. Iron Steel Res. Int. 2009, 16, 591–596. [Google Scholar]
  4. Liu, D.H.; Wang, X.Z.; Zhang, J.L.; Liu, Z.J.; Jiao, K.X.; Liu, X.L.; Wang, R.R. Study on the controlling steps and reduction kinetics of iron oxide briquettes with CO-H2 mixtures. Metall. Res. Technol. 2017, 114, 611. [Google Scholar] [CrossRef]
  5. Tang, J.; Chu, M.S.; Ying, Z.W.; Li, F.; Feng, C.; Liu, Z.G. Non-Isothermal gas-based direct reduction behavior of high chromium vanadium-titanium magnetite pellets and the melting separation of metallized pellets. Metals 2017, 7, 153. [Google Scholar] [CrossRef]
  6. Gransden, J.F.; Sheasby, J.S. Sticking of iron ore during reduction by hydrogen in a fluidized bed. Can. Metall. Q. 1974, 13, 649–657. [Google Scholar] [CrossRef]
  7. Komatina, M.; Gudenau, H.W. The Sticking Problem during Direct Reduction of Fine Iron Ore in the Fluidized Bed. Metalurgija 2004, 10, 309–328. [Google Scholar]
  8. Xue, Q.; Ma, Y.J.; Lei, J.F.; Yang, R.; Wang, C. Evolution of microstructure and phase composition of Ti-3Al-5Mo-4.5V alloy with varied β phase stability. J. Mater. Sci. Technol. 2018. [Google Scholar] [CrossRef]
  9. Bizhanov, A.; Malysheva, T. Metallization of extruded briquettes (BREX) in midrex process. Metals 2017, 7, 259. [Google Scholar]
  10. Lu, W.K. Observations of whisker growth during iron ore reduction. Scand. J. Metall. 1973, 2, 65–67. [Google Scholar]
  11. Gong, Q.M.; Huang, Q.Z.; Huang, B.Y.; Wu, F.Q.; Chen, T.F.; Zhang, F.Q. Effect of carbonization pressure on morphology of pitch derived carbon and densification efficiency of C/C composites used for aircraft brakes. New Carbon Mater. 2002, 17, 23–28. [Google Scholar]
  12. Shi, Y.J.; Liu, S.J.; Yao, J.Z.; Li, G.L. Carbon adhesion and reduction of iron ore powder in a fluidized bed. Iron Steel 1993, 28, 1–7. [Google Scholar]
  13. Mikami, T.; Kamiya, H.; Horio, M. The mechanism of defluidization of iron particles in a fluidized bed. Powder Technol. 1996, 89, 231–238. [Google Scholar] [CrossRef]
  14. Zhong, Y.W.; Gong, X.Z.; Wang, Z.; Guo, Z.C. Effect of iron surfaces with nano/micro structures on the sticking of Fe2O3 in fluidized bed reduction. J. Univ. Sci. Technol. Beijing 2011, 33, 406–412. [Google Scholar]
  15. Wang, Q.; Zou, X.; Matsuura, H.; Wang, C. Evolution of Inclusions During the 1473 K (1200 °C) Heating Process of EH36 Shipbuilding Steel. Metall. Mater. Trans. B 2018, 49, 18–22. [Google Scholar] [CrossRef]
  16. Krishnan, S.H.; Sharma, R.; Dash, P.S.; Haldar, S.K.; Biswas, B. Use of waste plastics in cokemaking at Tata Steel. Ironmak. Steelmak. 2013, 33, 288–292. [Google Scholar] [CrossRef]
  17. Shao, J.H.; Guo, Z.C.; Tang, H.Q. Influence of reducing atmosphere on the sticking during reduction of iron ore fines in a fluidized bed. J. Univ. Sci. Technol. Beijing 2013, 35, 273–281. [Google Scholar]
  18. Guo, L.; Yu, J.T.; Tang, J.K.; Lin, Y.H.; Guo, Z.C. Influence of coating MgO on sticking and functional mechanism during fluidized bed reduction of vanadium titano-magnetite. J. Iron Steel Res. Int. 2015, 22, 464–472. [Google Scholar] [CrossRef]
  19. Langston, B.G.; Stephens, F.M. Self-agglomerating fluidized bed reduction. J. Met. 1960, 12, 312–316. [Google Scholar] [CrossRef]
  20. Piotrowski, K.; Mondal, K.; Lorethova, H.; Stonawski, L.; Szymański, T.; Wiltowski, T. Effect of gas composition on the kinetics of iron oxide reduction in a hydrogen production process. Int. J. Hydrog. Energy 2005, 30, 1543–1554. [Google Scholar] [CrossRef]
  21. Wang, Q.H.; Shao, J.H.; Lin, Y.H.; Guo, Z.C.; Tang, H.Q. An experimental study on the kinetics of iron ore fine reduced by CO in micro fluidized bed. J. Iron Steel Res. 2012, 24, 6–9. [Google Scholar] [CrossRef]
  22. Golunski, S.E. Why use platinum in catalytic converters? Platin. Met. Rev. 2007, 51, 162. [Google Scholar] [CrossRef]
  23. Xu, Q.Y.; Wang, H.C.; Fu, Y.K.; Wang, J.J. Parameters optimization, sticking mechanism and kinetics analysis of fine iron ore in fluidized-reduction process. ISIJ Int. 2016, 56, 1929–1937. [Google Scholar] [CrossRef]
  24. Liu, M.H.; Ding, Z.W.; Zhang, T.W.; Hou, S.D. Analysis of pressure fuctuation signals in a pressured fluidized bed. Comput. Appl. Chem. 2011, 28, 1281–1284. [Google Scholar]
  25. Park, E.; Ostrovski, O.; Zhang, J.Q.; Thomson, S.; Howe, R. Characterization of phases formed in the iron carbide process by X-ray diffraction, mossbauer, X-ray photoelectron spectroscopy, and Raman spectroscopy analyses. Metall. Mater. Trans. B 2001, 32, 839–845. [Google Scholar] [CrossRef]
  26. Dong, X.L.; Zhang, Z.D.; Xiao, Q.F.; Zhao, X.G.; Chuang, Y.C.; Jin, S.R.; Sun, W.M.; Li, Z.J.; Zheng, Z.X.; Yang, H. Characterization of ultrafine γ-Fe(C), α-Fe(C) and Fe3C particles synthesized by arc-discharge in methane. J. Mater. Sci. 1998, 33, 1915–1919. [Google Scholar] [CrossRef]
  27. Hui, Y.A.; Wang, D.Y.; Jiang, M.F. Phase analysis and production mechanism of iron carbide. J. Northeast. Univ. 2003, 24, 828–831. [Google Scholar]
  28. Zhang, B.; Wang, Z.; Gong, X.Z.; Guo, Z.C. Characterization of precipitated carbon by XPS and its prevention mechanism of sticking during reduction of Fe2O3 particles in the fluidized bed. ISIJ Int. 2013, 53, 411–418. [Google Scholar] [CrossRef]
  29. Liu, J.H.; Zhang, J.Y.; Zhou, T.P. Influence of foreign oxides on reduction kinetics of iron oxides. J. Iron Steel Res. 2000, 12, 55–58. [Google Scholar]
  30. Hou, B.L.; Zhang, H.Y.; Li, H.Z.; Zhu, Q.S. Study on kinetics of iron oxide reduction by hydrogen. Chin. J. Chem. Eng. 2012, 20, 10–17. [Google Scholar] [CrossRef]
Figure 1. Experimental setup: (a) fluidized bed reactor; (b) the flowchart. 1. Gas mixing and preheating chamber; 2. Gas mixing hole; 3. Fluidized bed; 4. K-type thermal couple; 5. Pressure sensor; 6. Gravity filter; 7. Feeding and sampling port; 8. Pressure seal cap; 9. Temperature change recorder; 10. Gas analyzer; 11. H2 gas analysis recorder; 12. CO2 gas analysis recorder; 13. CO gas analysis recorder; 14. Pressure change analysis recorder; 15. Computer; 16. Gas dryer; 17. Gasholder; 18. Pressure display; 19. Gas mass flowmeter; 20. CO/CO2 gas cylinders; 21. H2 gas cylinders; 22. N2 gas cylinders; 23. Booster pump; 24. Gas valve.
Metals 08 00523 g001
Figure 2. Change of metallization rate and sticking ratio at different levels.
Metals 08 00523 g002
Figure 3. Micromorphology analysis on the surface of reduction particles (a) SEM; (b) EDS.
Metals 08 00523 g003
Figure 4. XRD spectra of particles before and after sticking.
Metals 08 00523 g004
Figure 5. XPS peak fitting graph of C1s: (a) pre-cracking 10 min; (b) reduction 30 min; (c) reduction 50 min; (—) Experimental curve, (– · –) Fitting curve, (– –) Peak division curve.
Metals 08 00523 g005
Figure 6. The XRD diagram of post-reduction fine iron ore: (a) 30 min; (b) 50 min.
Metals 08 00523 g006
Figure 7. Gibbs free energy of deposited carbon reducing metal oxides.
Metals 08 00523 g007
Figure 8. SEM diagram of surface morphology of particles after reduction at 0.15 MPa.
Metals 08 00523 g008
Figure 9. Diagram of the mechanism of carbon precipitation inhibiting the sticking.
Metals 08 00523 g009
Table 1. Chemical composition of the OMC iron ore (mass %). TFe: total iron ore.
CompositionsAl2O3CaOFeOMgOMnOPSSiO2TFe
Mass %2.610.0350.150.051.0550.0760.0314.7057.59
Table 2. Factor levels.
FactorA
Temperature/K
B
Linear Velocity/m/s
C
The Reducing Pressure/MPa
D
Waste Plastic Particle Size/mm
E
Waste Plastic Mass Percentage
LevelA1A2A3A4B1B2B3B4C1C2C3C4D1D2D3D4E1E2E3E4
923973102310730.60.81.01.200.150.300.450.66–1.00018–0.660.15–0.180.12–0.154%8%12%16%
Table 3. Orthogonal experimental plan.
ConditionTemperature/KLinear Velocity/m/sThe Reducing Pressure/MPaParticle Size/mmHydrogen Volume Scale
NO.
19230.600.66–1.004%
29230.80.150.18–0.668%
39231.00.300.15–0.1812%
49231.20.450.12–0.1516%
59730.60.150.12–0.1516%
69730.800.15–0.1812%
79731.00.450.18–0.668%
89731.20.300.66–1.004%
910230.60.300.18–0.668%
1010230.80.450.66–1.004%
1110231.000.12–0.1516%
1210231.20.150.15–0.1812%
1310730.60.450.15–0.1812%
1410730.80.300.12–0.1516%
1510731.00.150.66–1.004%
1610731.200.18–0.668%
Table 4. Scheme and results of the pre-experiment.
SchemeTemperature/KLinear Velocity/m/sPressure/MPaParticle Size of Wasted Plastics/mmMass Content of Wasted Plastics/%Metallization Rate/%Sticking Ratio/%
19730.80.30076.4417.1
29730.80.30.18~0.66480.6315.1
39730.800062.4422.1
49730.800.18~0.66470.2818.2
Table 5. Experimental results.
ResultABCDEMetallization Rate/%Bonding Mass Percentage/%
NO.
1A1B1C1D1E153.1925.21
2A1B2C2D2E290.1812.86
3A1B3C3D3E383.1522.20
4A1B4C4D4E467.4424.21
5A2B1C2D3E481.7720.06
6A2B2C1D4E384.0322.64
7A2B3C4D1E284.0921.8
8A2B4C3D2E180.6327.82
9A3B1C3D4E283.3025.31
10A3B2C1D3E185.7133.93
11A3B3C4D2E474.8018.93
12A3B4C2D1E388.3521.02
13A4B1C4D2E375.2532.19
14A4B2C3D1E483.6721.56
15A4B3C2D4E182.9517.83
16A4B4C1D3E287.2829.39
Table 6. The orthogonal experimental results.
FactorIndicatorsABCDE
Metallization rate/%K1293.96293.51310.21309.30302.48
K2330.52343.59343.25320.86344.85
K3332.16324.99330.75337.91330.78
K4329.15323.70301.58317.72307.68
k173.4973.3877.5577.3375.62
k282.6385.9085.8180.2286.21
k383.0485.7582.6984.4882.70
k482.2980.9375.4079.4376.92
R9.5512.5210.417.1510.59
Primary and secondary factorsBECAD
Optimization schemeB2E2C2A3D3
Bonding mass percentage/%K184.48102.77111.1789.59104.79
K292.3290.9971.7791.8089.36
K399.1995.7696.8996.8998.05
K4100.97102.4497.1389.9984.76
k121.1225.6927.7922.4026.20
k223.0822.7517.9422.9522.34
k324.8023.9424.2224.2224.51
k425.2425.6124.2822.5021.19
R4.122.949.851.825.01
Primary and secondary factorsCEABD
Optimization schemeC2E4A1B2D1
Note: Ki represents the sum of the test results for the corresponding level number in each column; ki = Ki/s, where s is the number of times that it appears in any column. In this table, s = 4; R = max{k1, k2, k3, k4} − min{ k1, k2, k3, k4}.

