Microstructure and Texture Inhomogeneity after Large Non-Monotonic Simple Shear Strains: Achievements of Tensile Properties


1
Faculty of Metallurgical and Materials Engineering, Semnan University, Semnan 35131-19111, Iran
2
Department of Materials Science and Engineering, School of Engineering, Shiraz University, Shiraz 71348-51154, Iran
3
Department of Mechanical Engineering, Doshisha University, Kyotanabe, Kyoto 610-0394, Japan
*
Author to whom correspondence should be addressed.
Metals 2018, 8(8), 583; https://doi.org/10.3390/met8080583
Submission received: 19 June 2018
/
Revised: 3 July 2018
/
Accepted: 6 July 2018
/
Published: 26 July 2018
(This article belongs to the Special Issue Processing-Structure-Property Relationships in Metals)
Abstract
:In this study, for the first time, the effect of large non-monotonic simple shear strains on the uniformity of the tensile properties of pure Cu specimens was studied and justified by means of microstructural and textural investigations. A process called simple shear extrusion, which consists of two forward and two reversed simple shear straining stages on two different slip planes, was designed in order to impose non-monotonic simple shear strains. Although the mechanism of grain refinement is continuous dynamic recrystallization, an exceptional microstructural behavior and texture were observed due to the complicated straining path results from two different slip planes and two pairs of shear directions on two different axes in a cycle of the process. The geometry of the process imposes a distribution of strain results in the inhomogeneous microstructure and texture throughout the plane perpendicular to the slip plane. Although it is expected that the yield strength in the periphery reaches that of the center by retardation, it never reaches that value, which results in the different deformation modes of the center and the periphery. The occurrence of shear reversal in each quarter of a cycle results in the elimination of some of the boundaries, an increase in the cell wall thickness, and a decrease in the Taylor factor. Change in the shear plane in each half of a cycle leads to the formation of cell boundaries in a different alignment. Since the direction of the shear and/or the shear plane change frequently in a cycle, the texture of a sample after multi-cycles of the process more closely resembles a random orientation.
1. Introduction
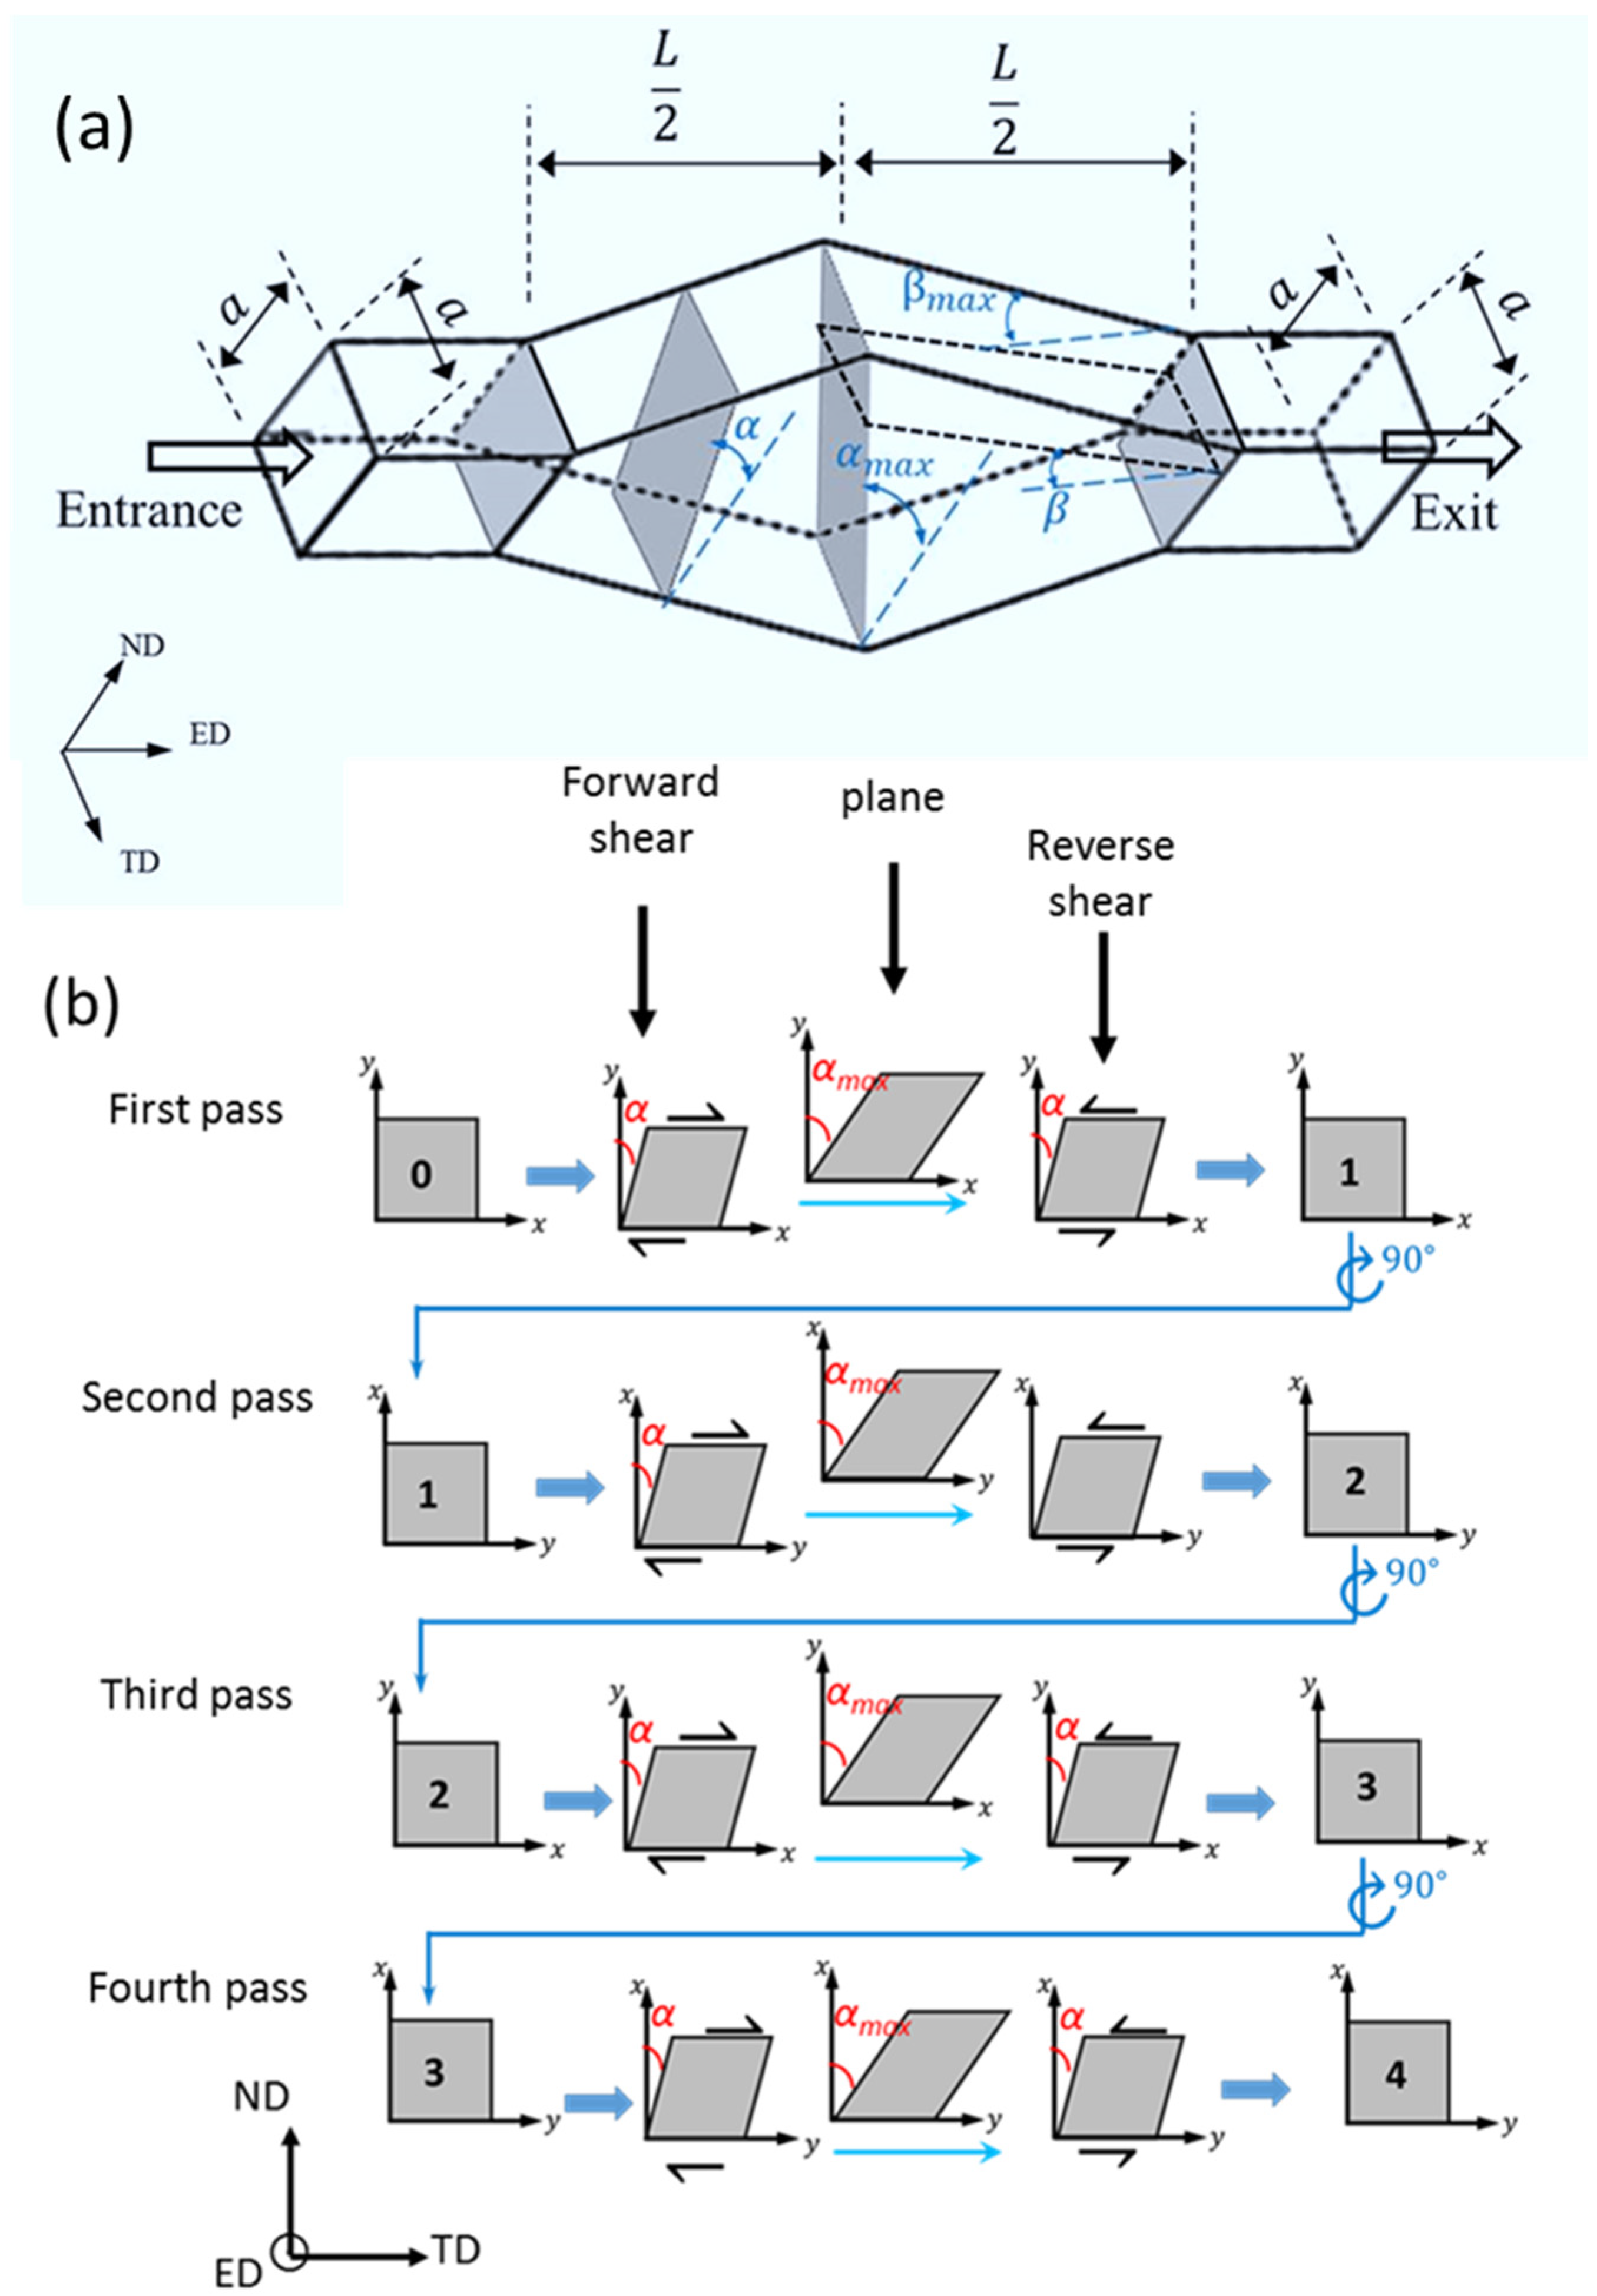
Microstructural homogeneity plays an important role in the properties of various materials. This becomes more important in severe plastic deformation (SPD) processing in which a large amount of strain has been applied to the bulk materials to obtain ultrafine-grained structures [1]. The reason is because in almost all of the SPD methods such as equal-channel angular pressing (ECAP) [2], high-pressure torsion (HPT) [3], twist extrusion (TE) [4], and simple shear extrusion (SSE) [5], the imposed strain varies across the sample. Significant parameters in the homogeneity of deformation through SPD methods are the mode of straining and its monotonicity. The dominant mode of deformation in the mentioned methods is simple shear. While straining in a pass of ECAP and a turn of HPT is monotonic, it is non-monotonic in a pass of TE and SSE. Therefore, in order to investigate the effect of non-monotonic simple shear straining on the microstructure and mechanical properties of the materials, both TE and SSE methods are good candidates. However, in contrast to TE, which has two shear planes, SSE has a single shear plane. Therefore, in order to achieve the goal, the SSE [5] that was also named as planar twist extrusion (PTE) [6] is the best choice. As shown in Figure 1a, during a pass of SSE, the material undergoes simple shear gradually without changing in the cross-sectional area. As can be seen, in the middle of deformation channel, the shear direction reverses on the same shear plane, and results in the non-monotonic straining during the process. It was reported that the amount of accumulated strain at the center of the SS-extruded specimens is higher than the periphery, both experimentally [7,8,9] and by simulations [5,10]. However, the effect of this strain’s non-homogeneity and the corresponding microstructural differences on the tensile properties has not been studied yet. On the other hand, it was well proved that the higher strains in the processes such as ECAP, which was achieved after processing by several passes, results in the more homogeneous microstructure and the uniform distribution of mechanical properties [2,11,12].
The effect of large strains on the uniformity of the tensile properties has been not studied yet for the non-monotonic simple shear straining. Therefore, this study has three main goals. The first goal is to investigate the effect of large non-monotonic shear strains on the homogeneity of tensile properties of Cu samples (as an FCC metal). The second goal is to explore the origins of the variations in the distribution of the strength and ductility by means of microstructure and microtextural changes. Finally, our third goal is to propose a mechanism for the change in the microstructure, microtexture, and strength of Cu in particular, and FCC metals in general, that could be responsible not only for the general behavior of the deformed material, but also for the regional behaviors.
2. Methodology
2.1. Cycles in Large Non-Monotonic Simple Shear Strains
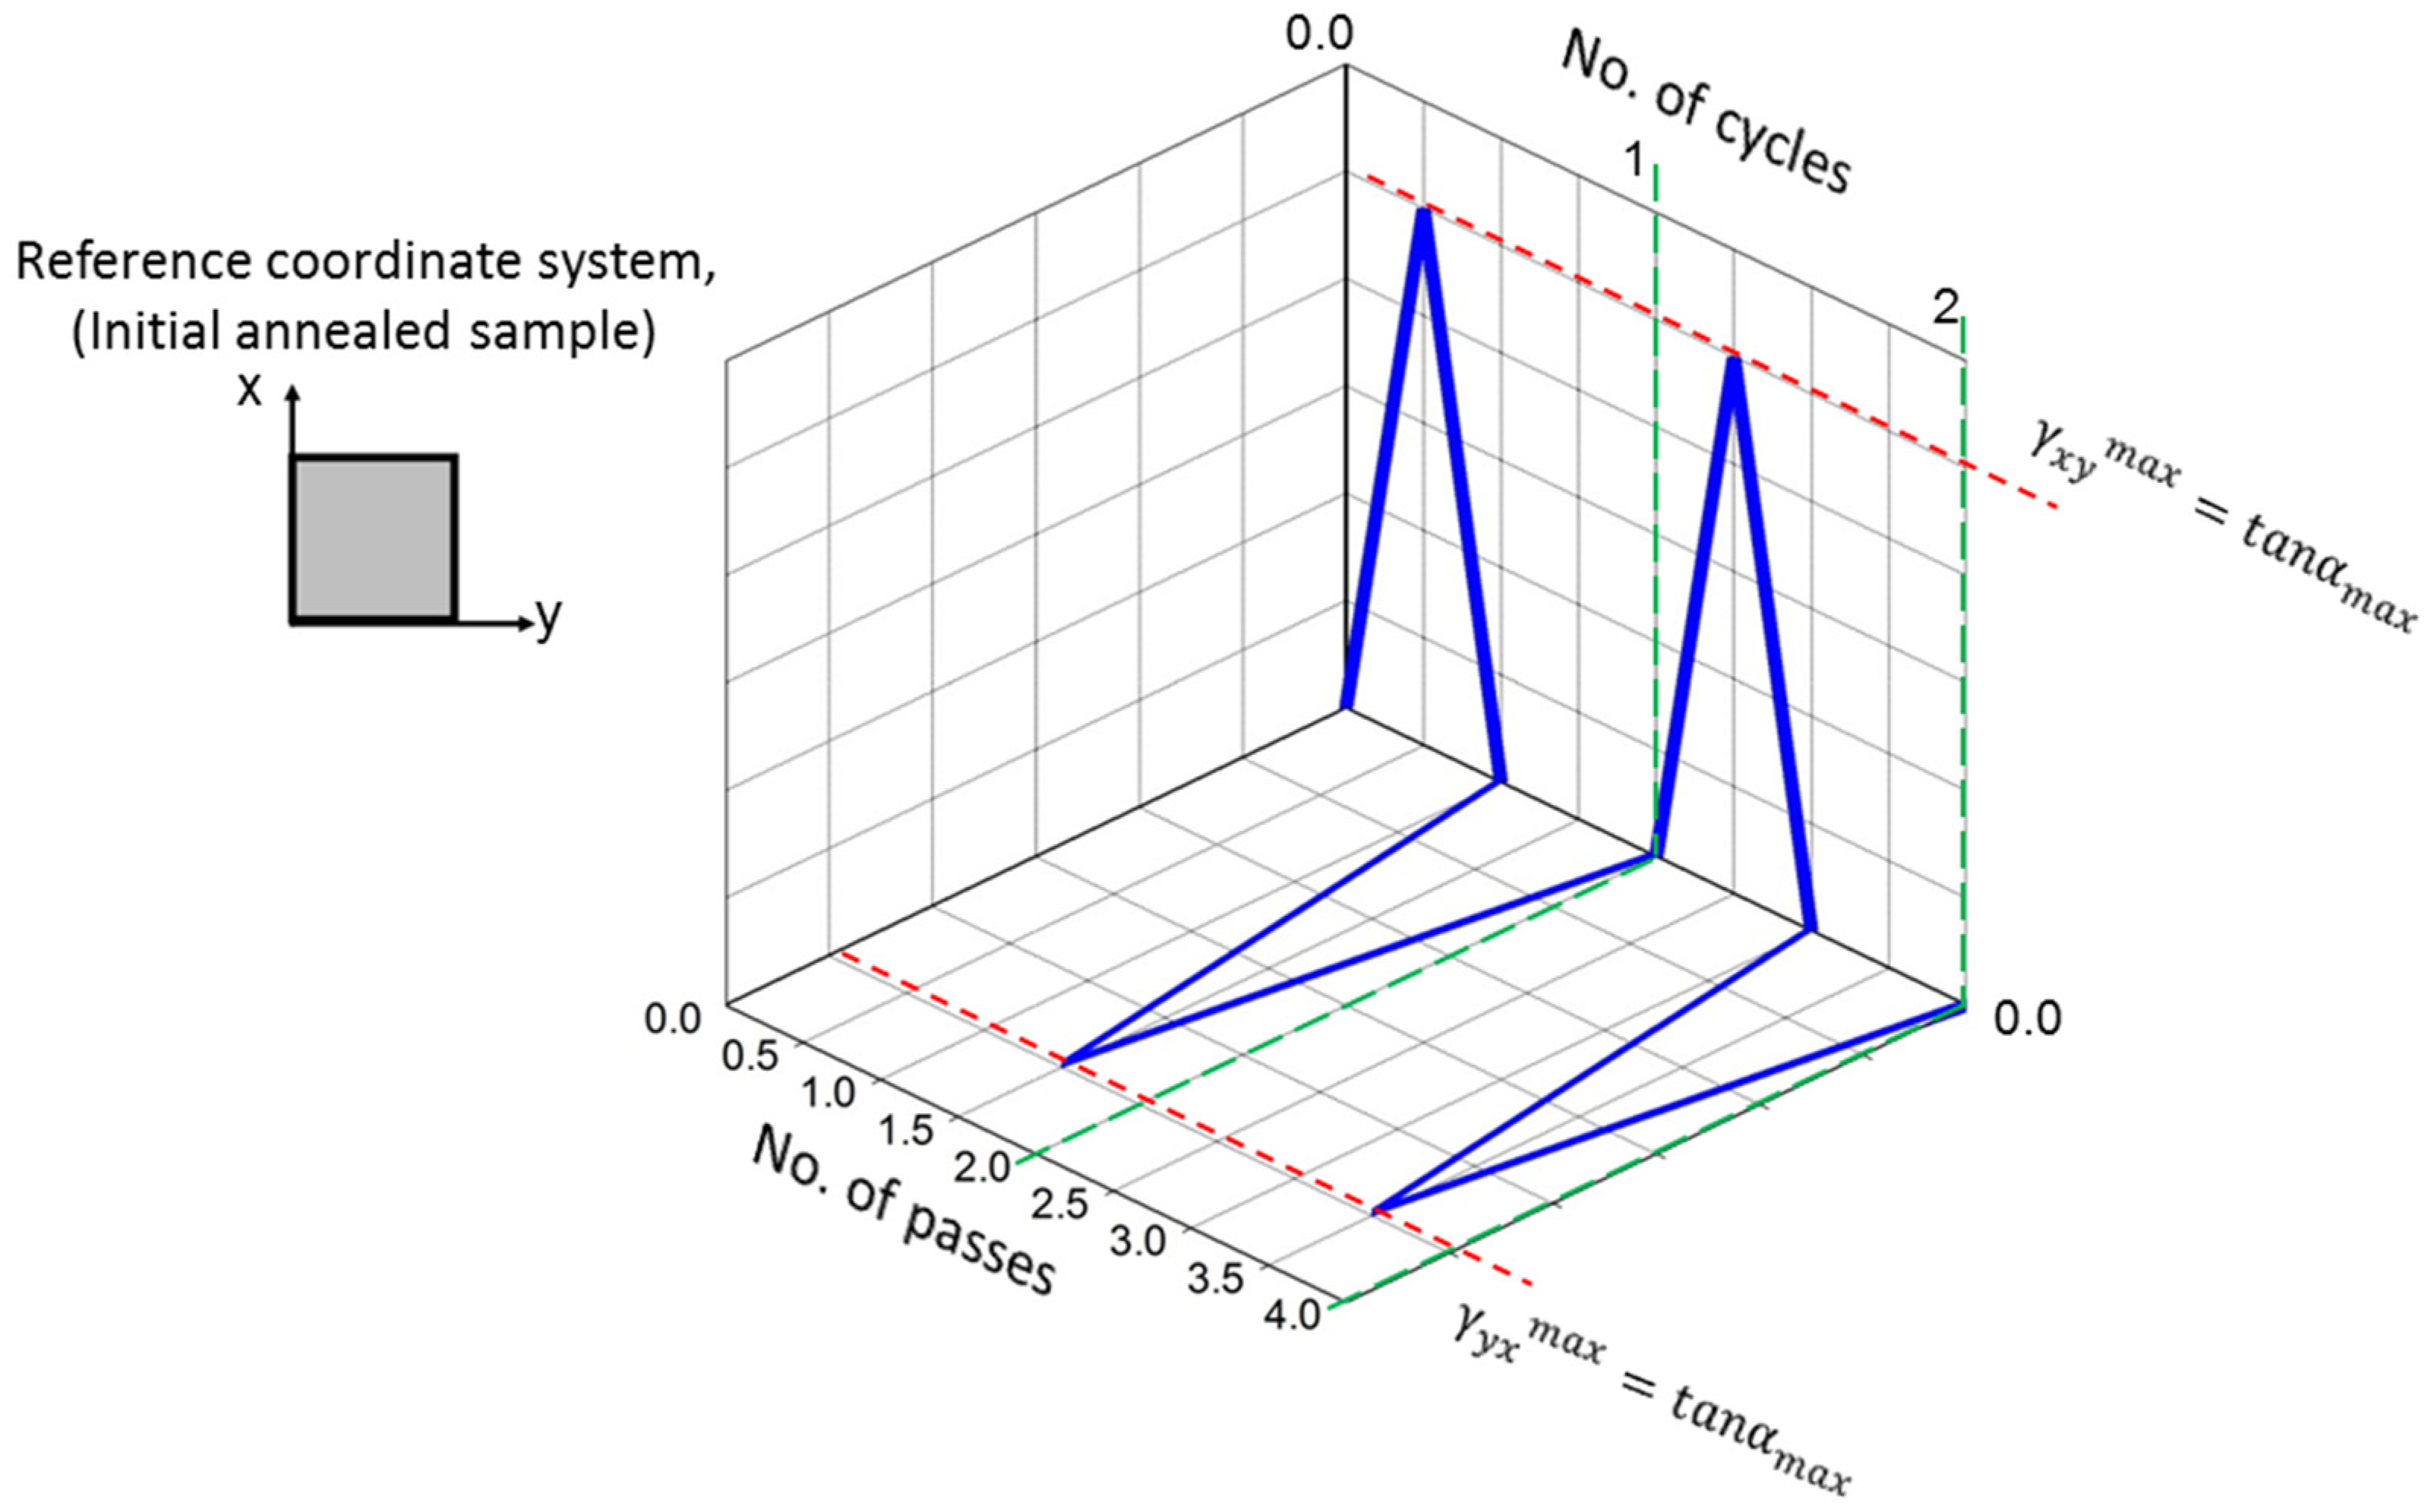
For the first step, it is necessary to define the route that was used in this study to apply large non-monotonic simple shear strains. As discussed in the introduction, SSE was used for this purpose. For further straining, the repetition of the process is indisputable. Among different processing routes [13] for the repetition of the process, the nominal route C was chosen. The rotation of samples around extrusion direction (ED) by between passes is the specification of route C. Assuming the original coordinate system of the sample as xyz (see Figure 1b) and the coordinate system of the die as ND-ED-TD (see Figure 1a), it is obvious that in the first pass, the x-axis and y-axis of the sample matches the TD and ND directions of the die, respectively. This results in the gradual forward shearing of the sample by in the positive sense of x-axis in the first half of deformation channel. reaches its maximum at the middle plane. In the second half of the deformation channel, the direction of the shear is reversed, and applies to the material in the negative sense of the x-axis. Since in route C, the sample rotates around ED—the axis of the die—in the second half of the process, the x and y axes of the sample align with the ND and TD directions of the die, respectively (see the second pass in Figure 1b). By this rotation, in the first half of the deformation channel, the sample tolerates a gradual increase of in the positive sense of the y-axis. Afterward, it endures in the negative sense of the y-axis during the second half of the deformation channel. The deformation paths for the third and the fourth passes are the same as the first and second passes respectively. As shown in Figure 2, in the first and second passes of SSE, maximum and values of apply to the materials, which results in a complete deformation route after every two passes. Therefore, in the current study, every two passes of SSE via route C is considered a cycle.
2.2. Experimental Procedure
In the present investigation, pure copper samples have been deformed over up to 12 passes by SSE processing. A die with a primary square cross-section of 10 mm × 10 mm was designed and constructed for SSE processing. The maximum distortion [5] and maximum inclination [14] angles of the die are 45° and 22.2°, respectively. Such a die imposes a strain of 1.155 mm/mm in a pass. Cu billets of 50-mm height and 10 mm × 10 mm in the cross-section were machined and then annealed at 650 °C for 2 h to be used as an initial (starting) material. For lubrication, samples were wrapped with Teflon tape, and tools were silicon sprayed. The specimens were pressed by a screw press with a ram speed of 0.2 mm/s. The namely route C was used for SSE [13]. In route C, the specimen is rotated 90° around the shear direction between passes. Then, as shown in Figure 1b, TEM and tensile samples are prepared from the center and periphery of the specimens of one, two, four, six, eight, and 12 passes. For the preparation of TEM foils, first, the samples were cut from the desired places (see Figure 1b); second, the surface of the specimens was mechanically polished to the thickness of 100 µm using SiC abrasive papers; third, the samples electropolished in a mixture of 250 mL of ethanol, 250 mL of phosphoric acid, 500 mL of phosphoric acid, 50 mL of propanol, and 5 g of urea at 273 K using a twin-jet polishing Tenupole 5 facility (Struers Inc., Cleveland, UT, USA) with the applied voltage of 10 V. Finally, the specimens were polished by ion beam using a Gatan 691 precision ion polishing system (PIPS). A transmission electron microscope (STEM, JEOL JEM-2100F, JEOL Ltd., Tokyo, Japan) with the acceleration voltage of 200 kV was used for TEM. Electron back-scattering diffraction (EBSD) observations were performed by a JEOL 7001 F scanning electron microscope (FE-SEM, JEOL Ltd., Tokyo, Japan) equipped with a field emission gun operating at 20 kV. The EBSD measurements and texture analysis were accomplished by the INCA suite 4.09 software package (Oxford Instruments, Abingdon, UK). Specifications of the EBSD measurements including the area of investigations and the approximate number of grains are 0.023 μm2 and ~2000 respectively. EBSD maps were taken from two areas on each sample, one in the center and one 2.5 mm away from the center on the ED plane, as shown in Figure 3. Prior to EBSD analysis, the surface of the samples was polished as per the standard metallographic procedure, and followed with electrical polishing in a mixture of 300 mL of ethanol and 700 mL of phosphoric acid with a DC voltage of 2.5 V for 15 min. Grain boundaries were identified using 5° minimum disorientation angles between two adjacent pixels. Misorientations below 3° were not considered in the post-processing data procedure.
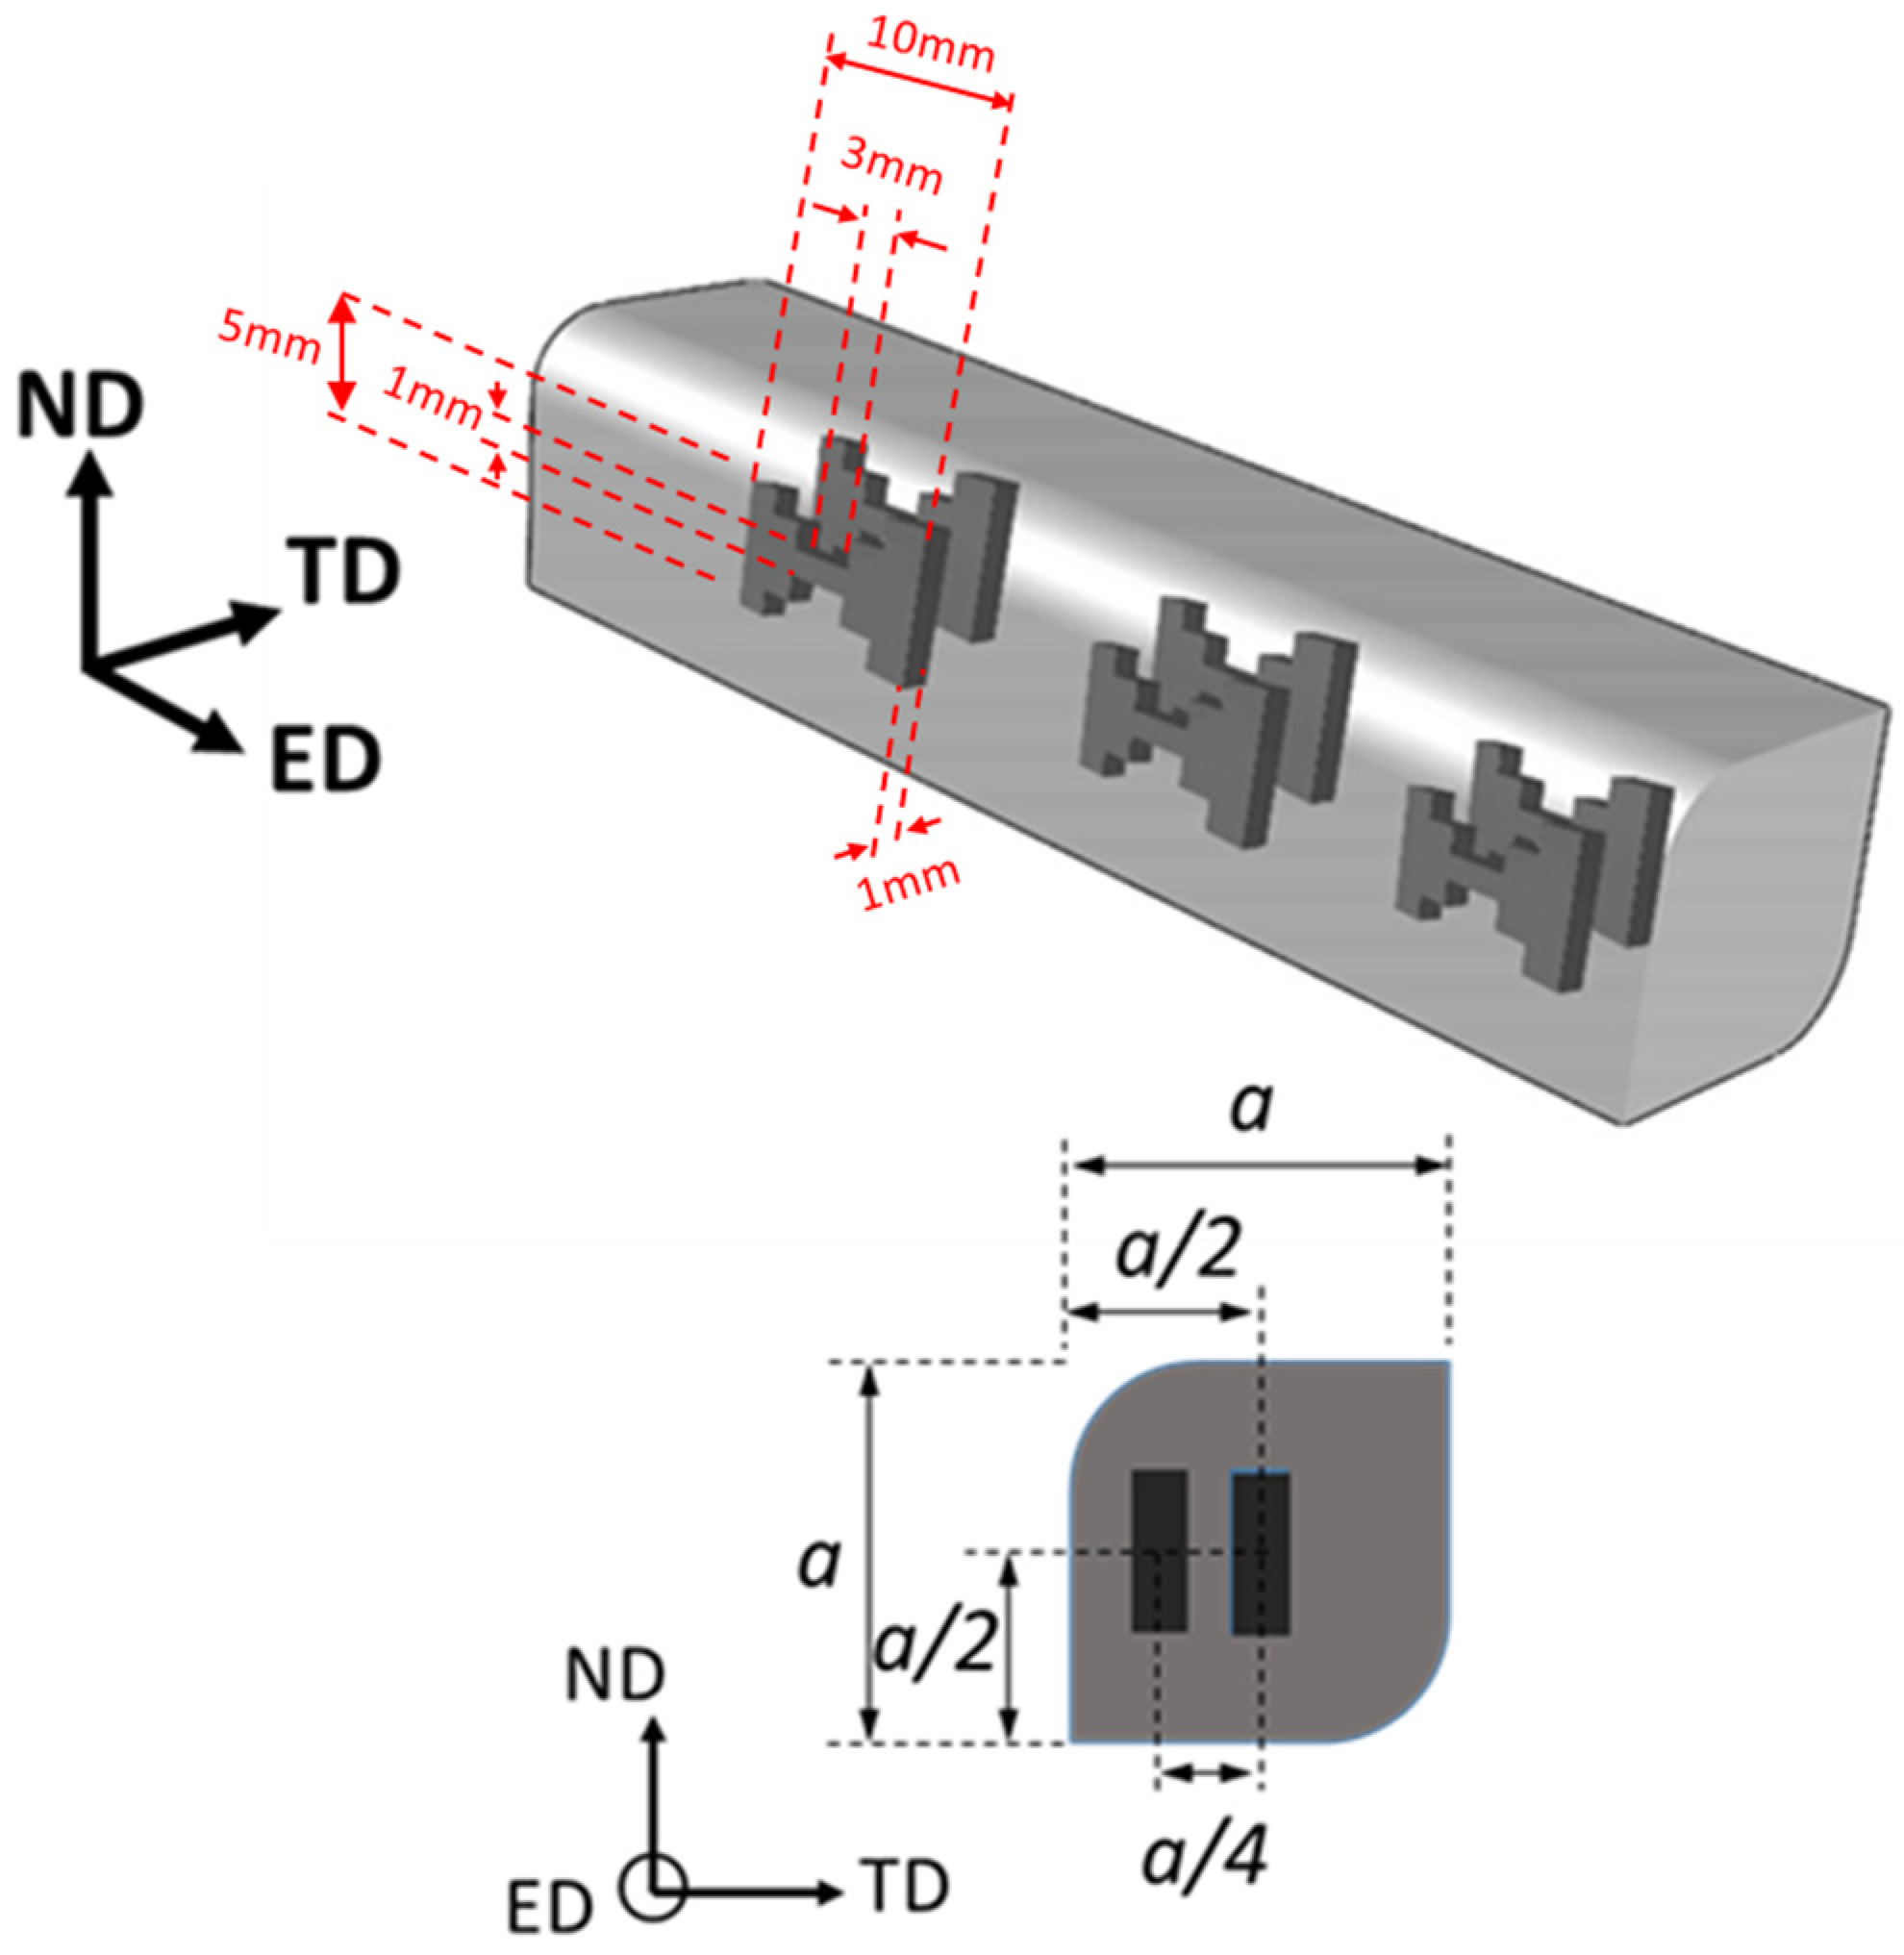
Tensile samples with the gauge width and length of 1 and 3 mm, respectively, were machined from the center and the periphery of SSE-processed specimens with orientation along the extrusion direction (ED), as shown in Figure 3. Tensile tests were performed at room temperature with a tensile testing machine (AGS-10kND, SHIMADZU, Kyoto, Japan) operating at an initial strain rate of 1.1 × 10⁻³ s−1. Five tensile tests were performed on each sample-condition, except for the sample of sixth cycle (12th pass), from which three tests could be performed (these tensile samples was prepared from two different specimens for each pass and position). The yield stress was calculated by a 0.2% strain offset.
3. Results
3.1. Microstructural Investigations
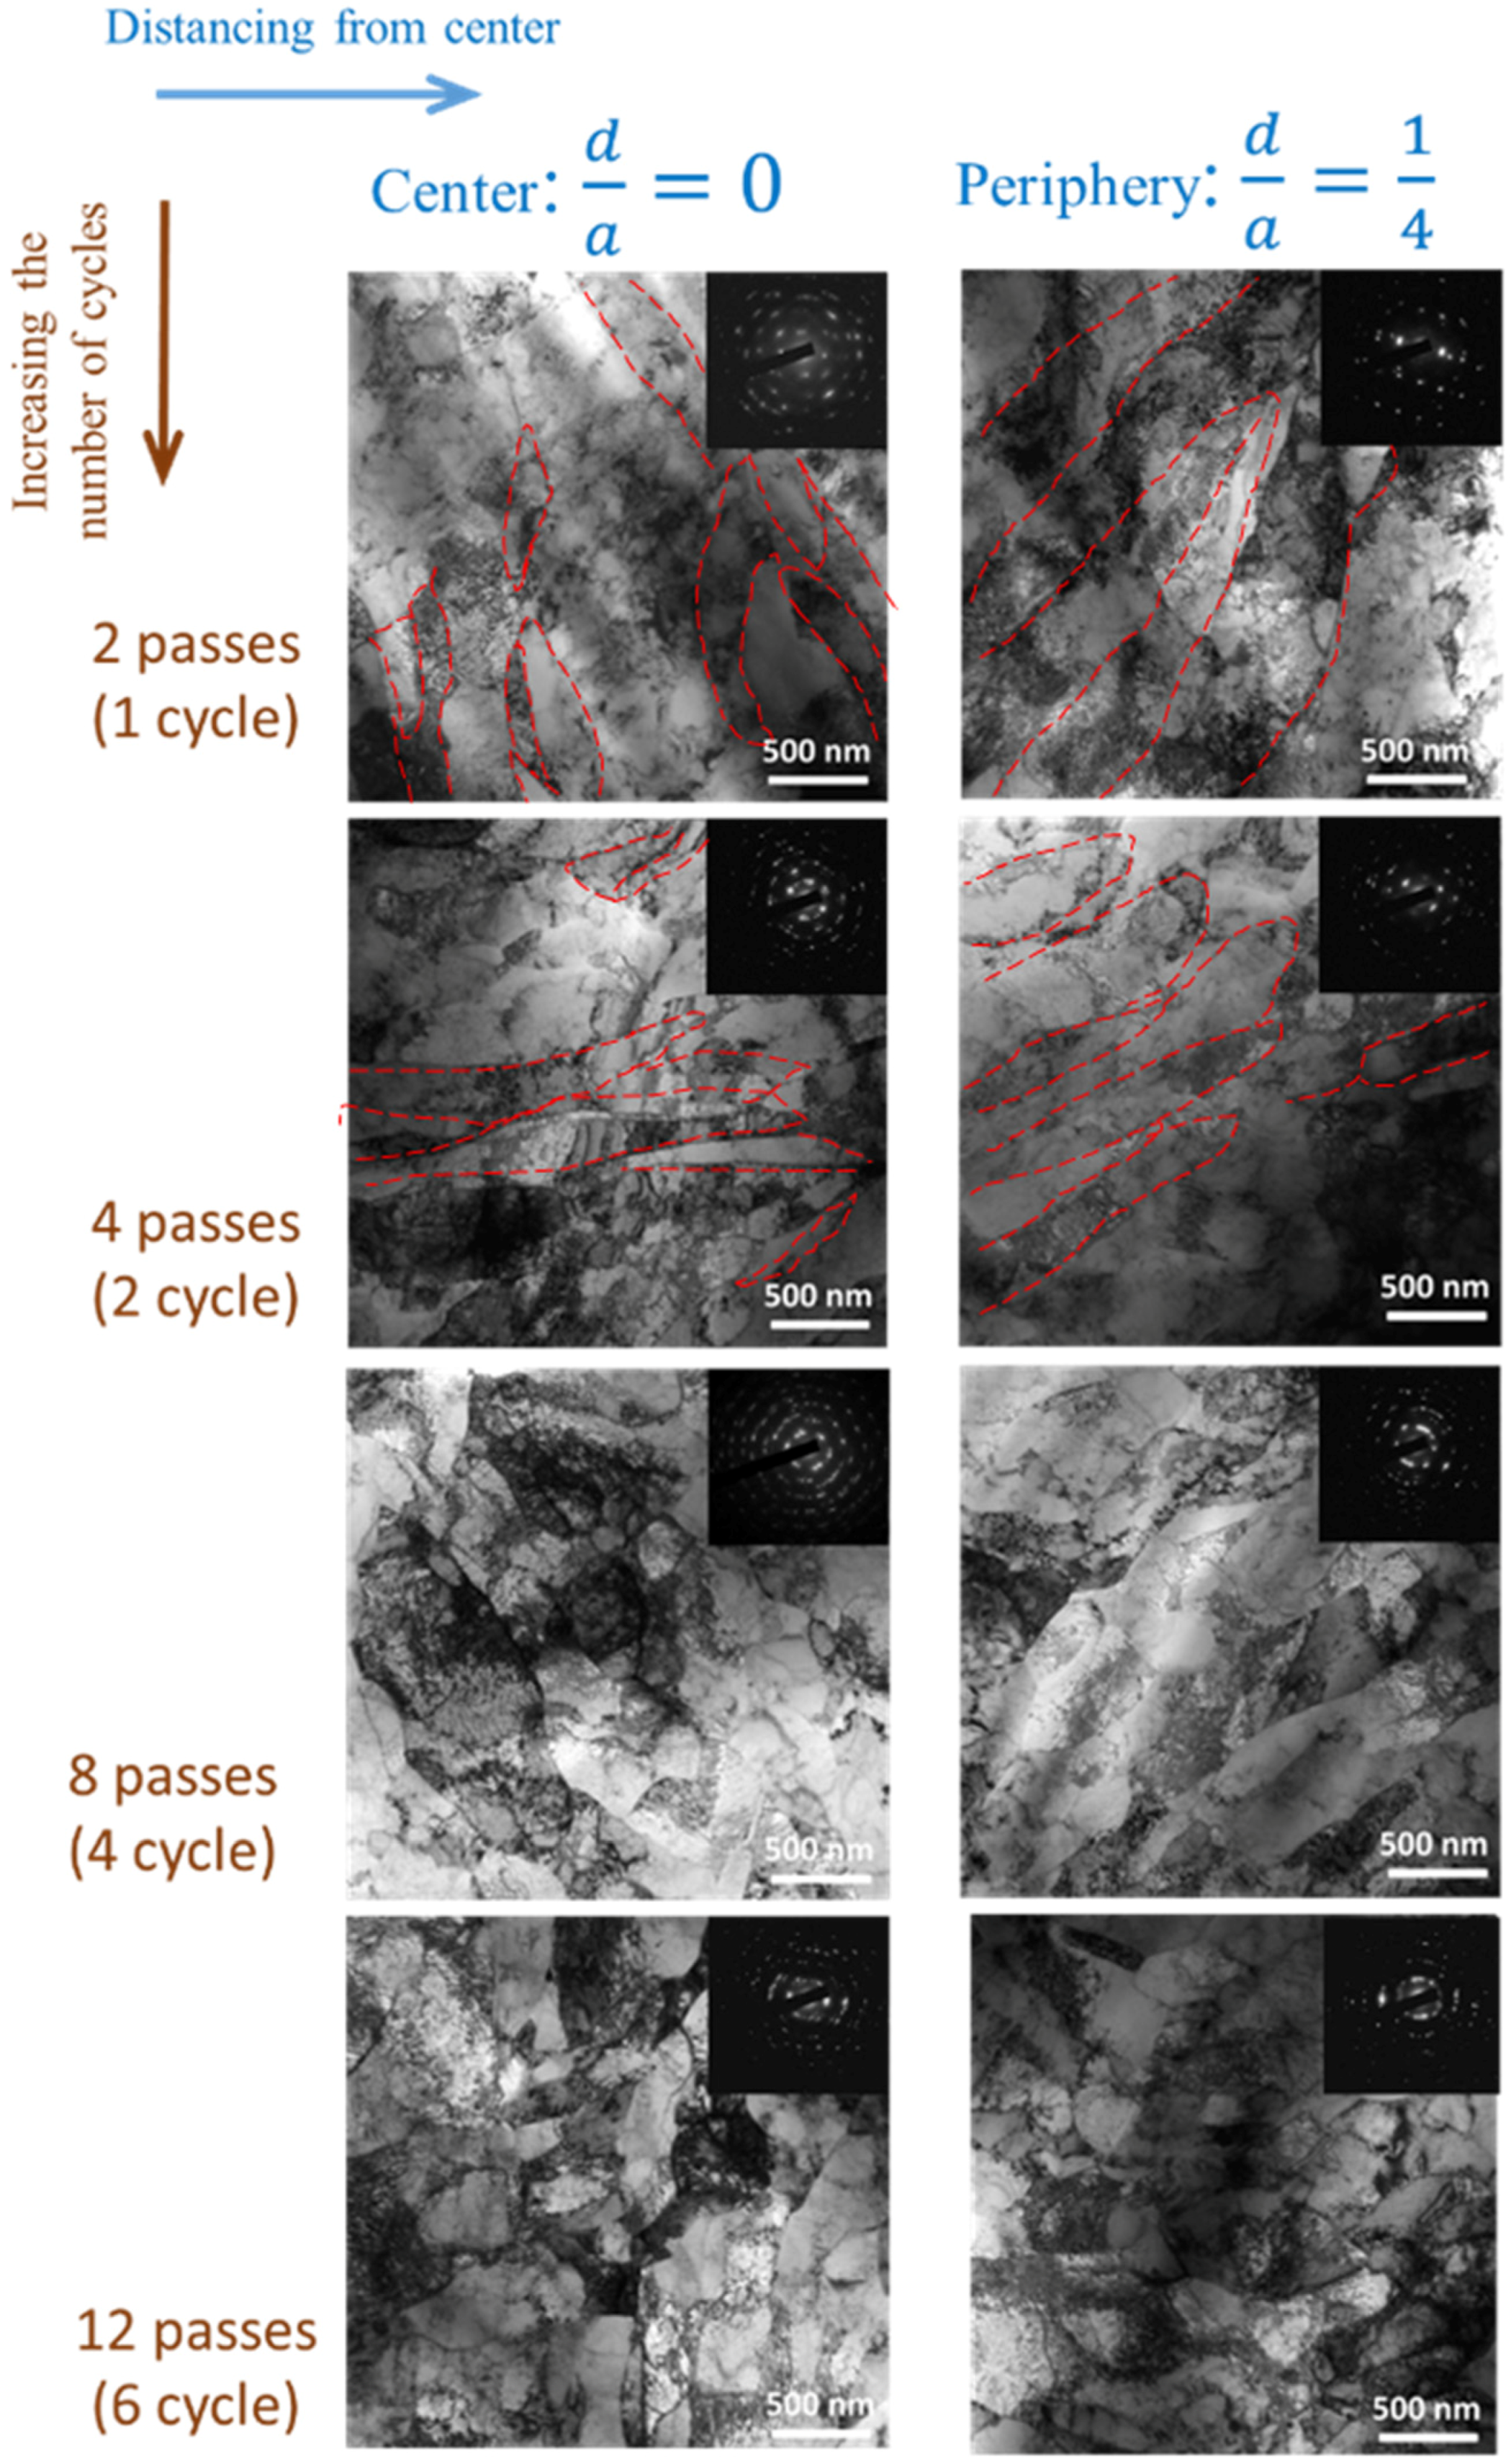
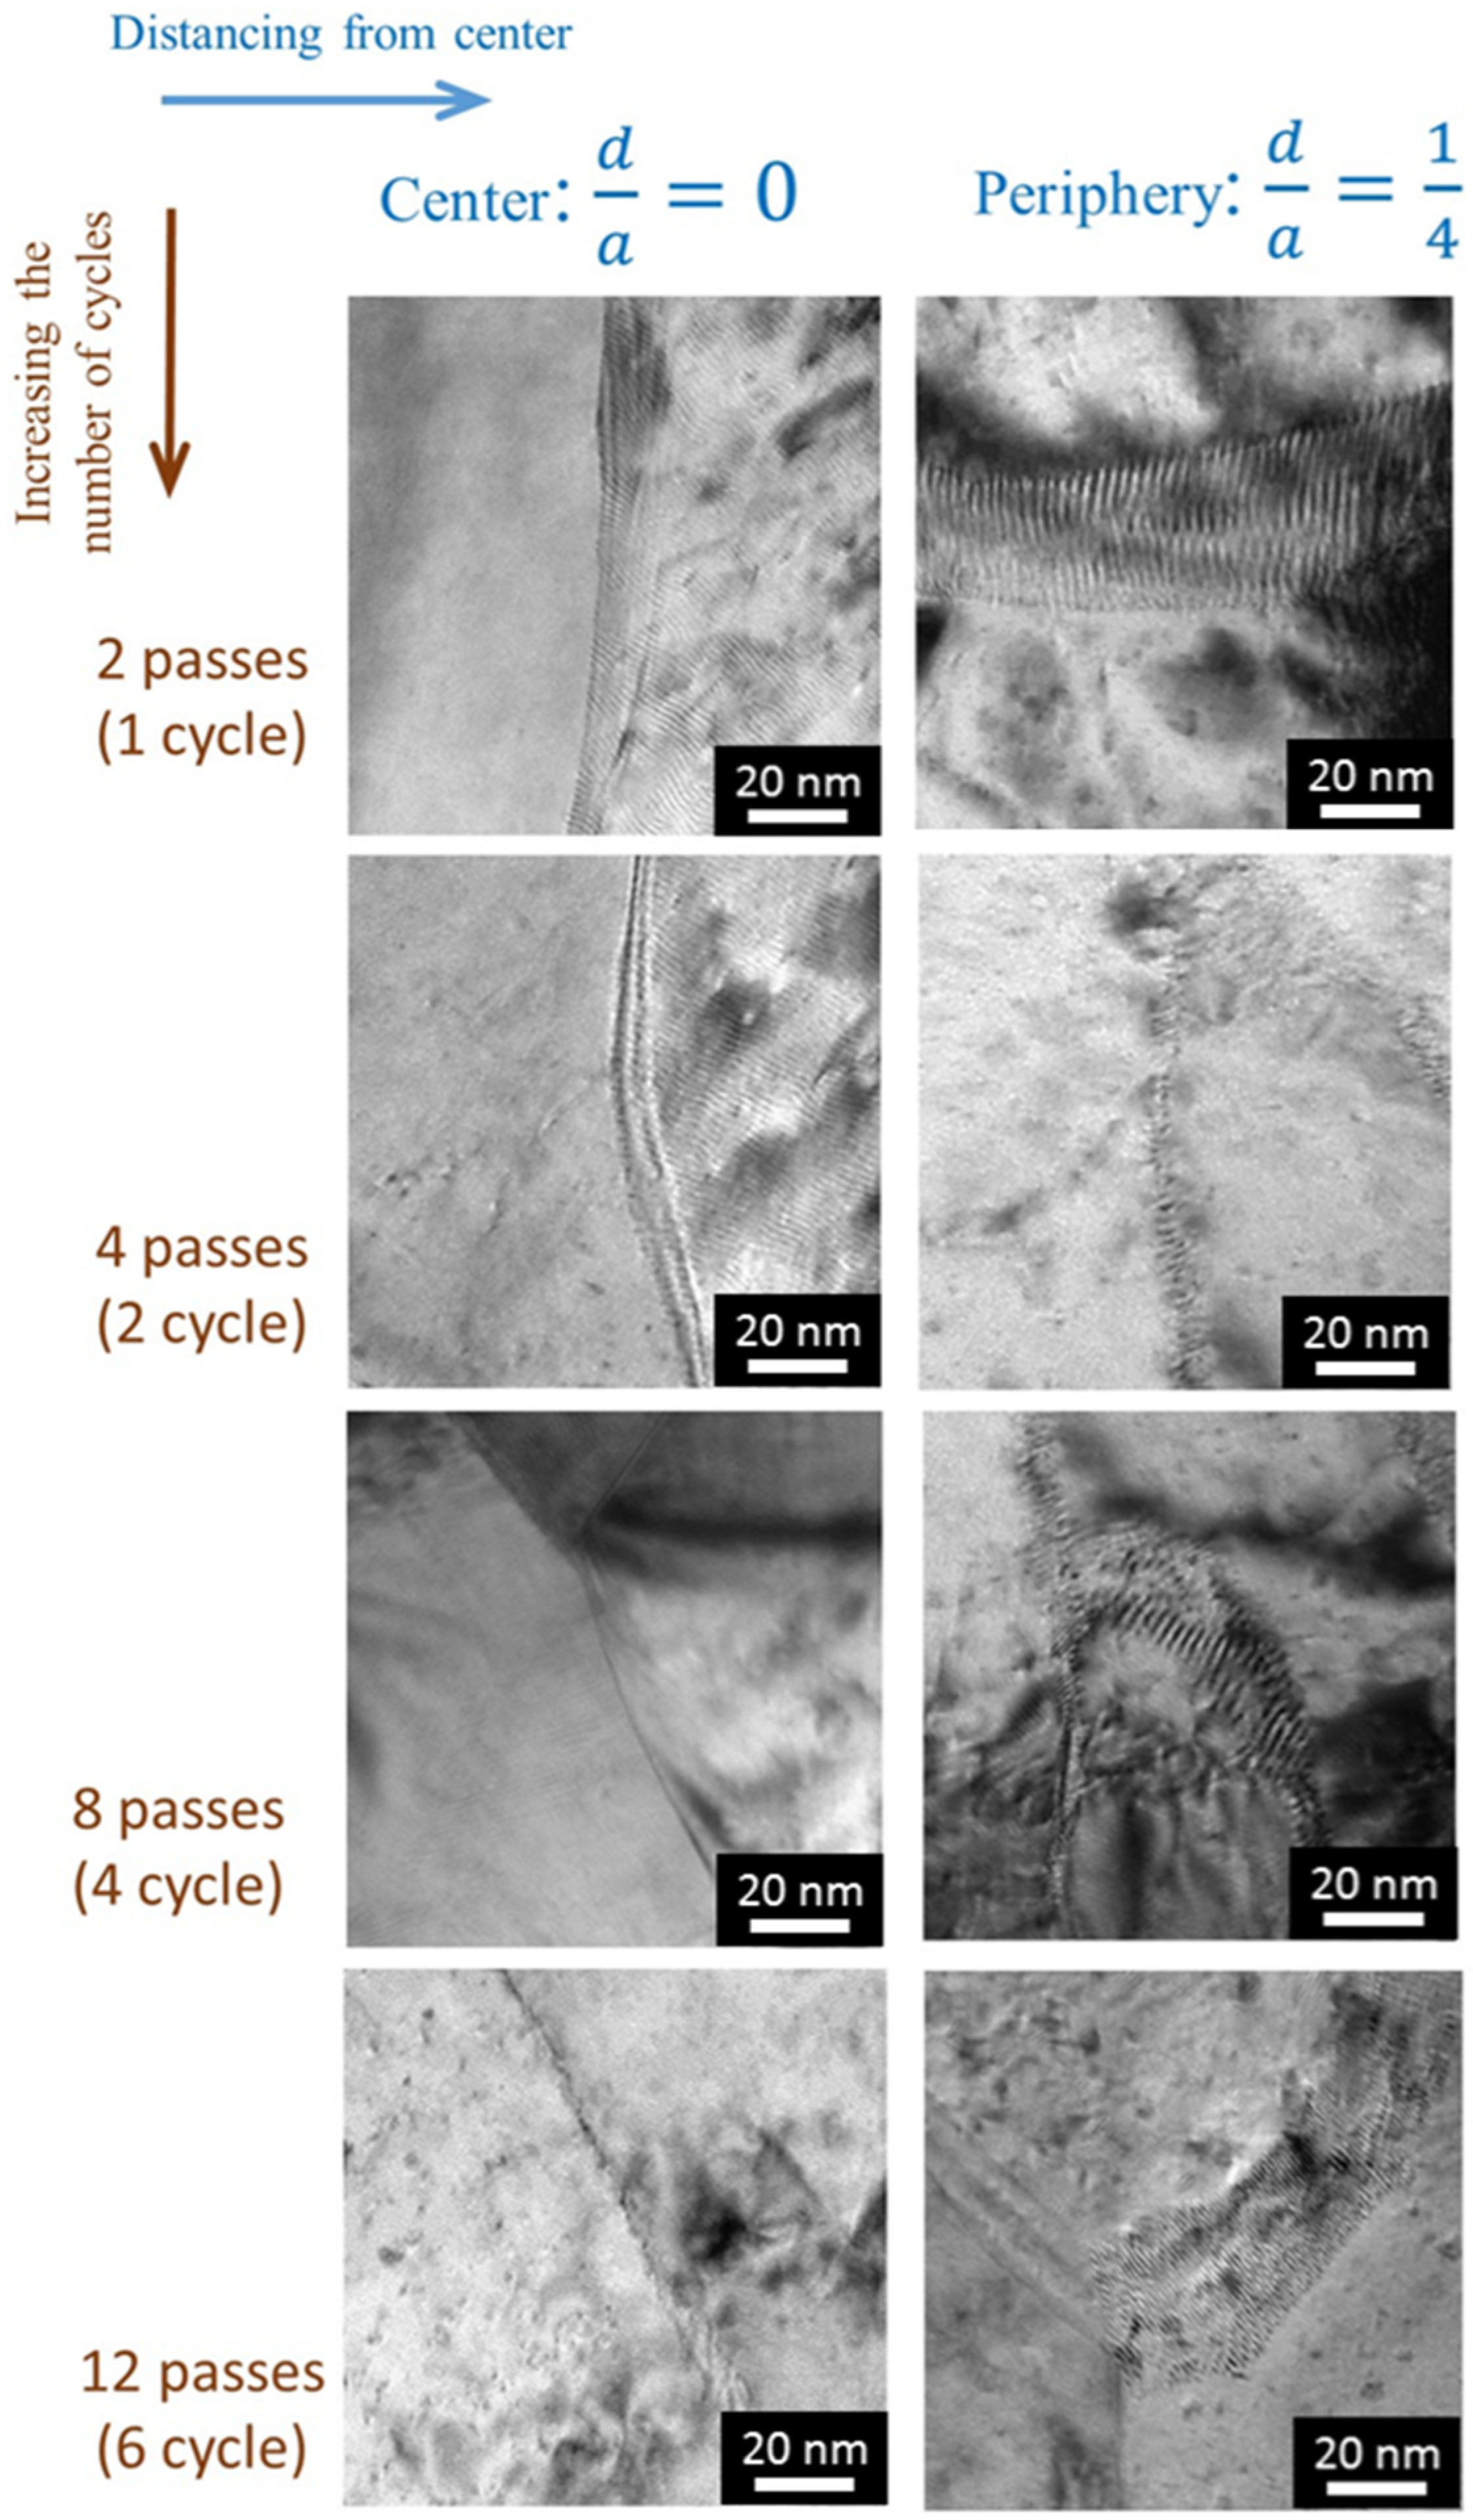
Figure 4 shows the microstructural evolution of the samples of one, two, four, and six cycles of the process taken by TEM from both center and periphery of the samples. Also, the corresponding selected area diffraction (SAD) patterns (have been taken with 1.3-µm aperture size) were shown on the right upper corner of the TEM images of Figure 4. The microstructure after a cycle (two passes) consists of two types of sub-grains at the center region, ~60% of elongated sub-grains, and ~40% of equiaxed one. On the other hand, more than 90% of the cells in the periphery of the first cycle are elongated sub-grains. The mean spacing of the parallel lamellar boundaries (LBs) in the sample of the first cycle is about 400 nm and 550 nm for the center and periphery, respectively. Another indication of finer grains in the center is that its SAD pattern that has more spots than that of the periphery. Paying attention to the microstructure of the sample after two cycles (four passes), it is seen that the area fractions of equiaxed grains at the center and periphery are ~75% and ~55% respectively. After four passes, the spacing of the boundaries is smaller, which leads to smaller cell sizes after the second cycle. The rate of reduction in the cell size, and the difference between the cell size of the center and periphery decrease between second to fourth cycle. After four cycles (eight passes), almost all of sub-grains are equiaxed. After six cycles (12 passes), a slight increase in the cell size of the center region is observed, while the cell size at the periphery decreases a little (almost remains constant in comparison to the sample of four cycles).
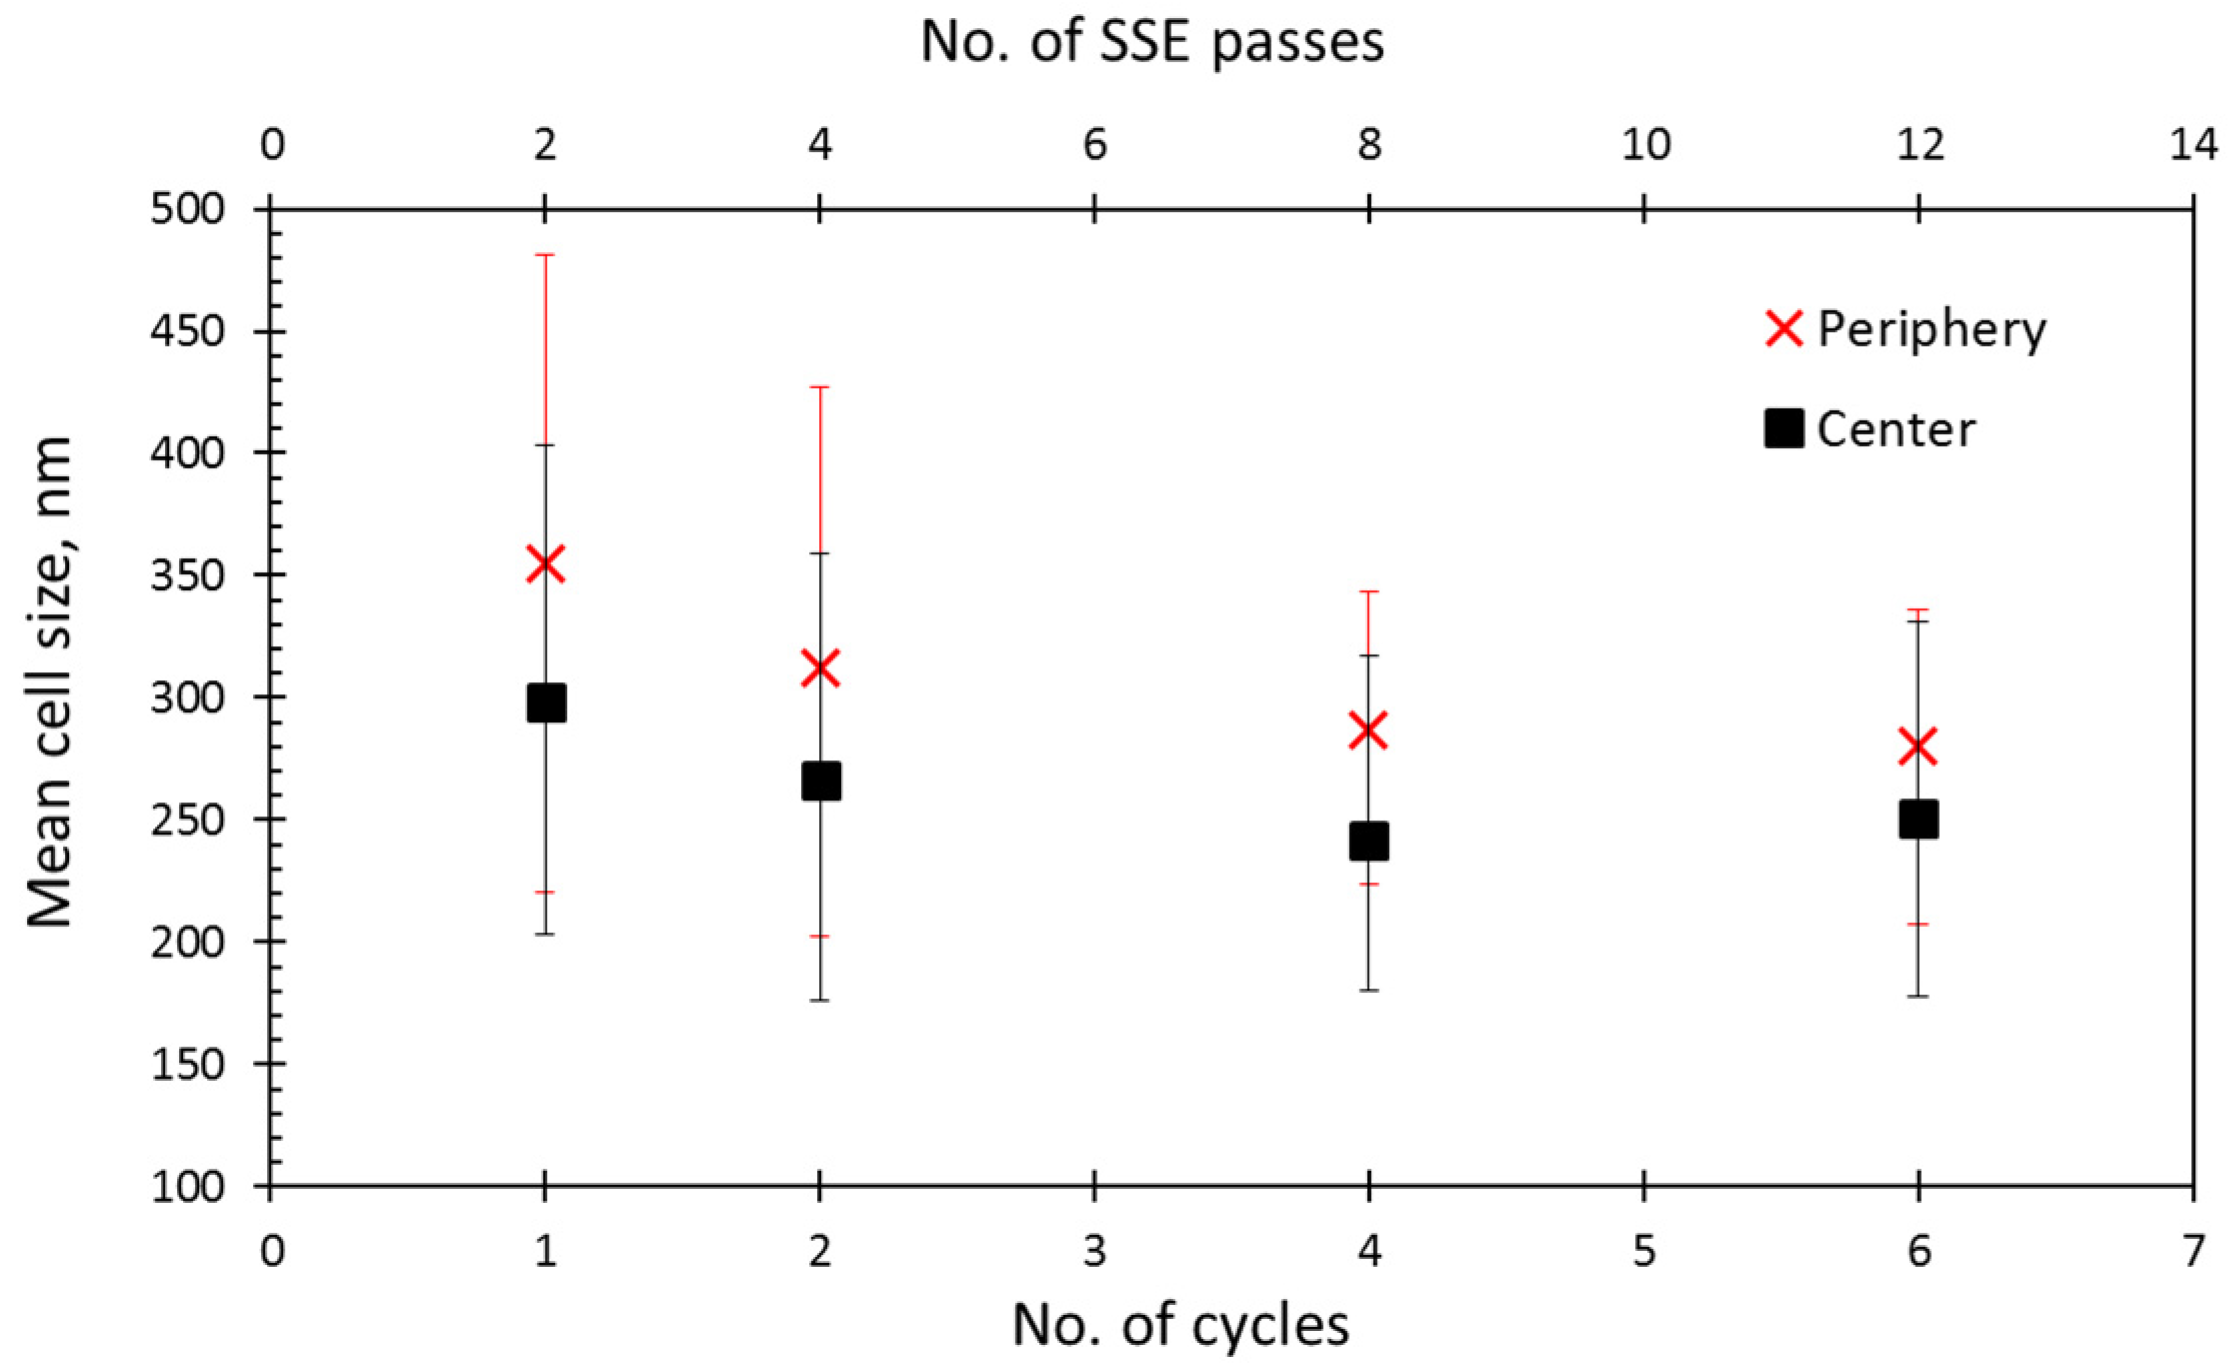
Values of the mean cell sizes have been shown in Figure 5 for the center and periphery of the samples of various cycles. As can be seen, the value of the mean cell size for the periphery is higher. For the center, the cell size decreases gradually from the first to the fourth cycle, which was followed with a slight increase afterward. The minimum cell size of ~240 nm is achieved in the center of the samples after the fourth cycle (eight passes). Interestingly, no increase is seen in the cell size of the periphery in the first six cycles.
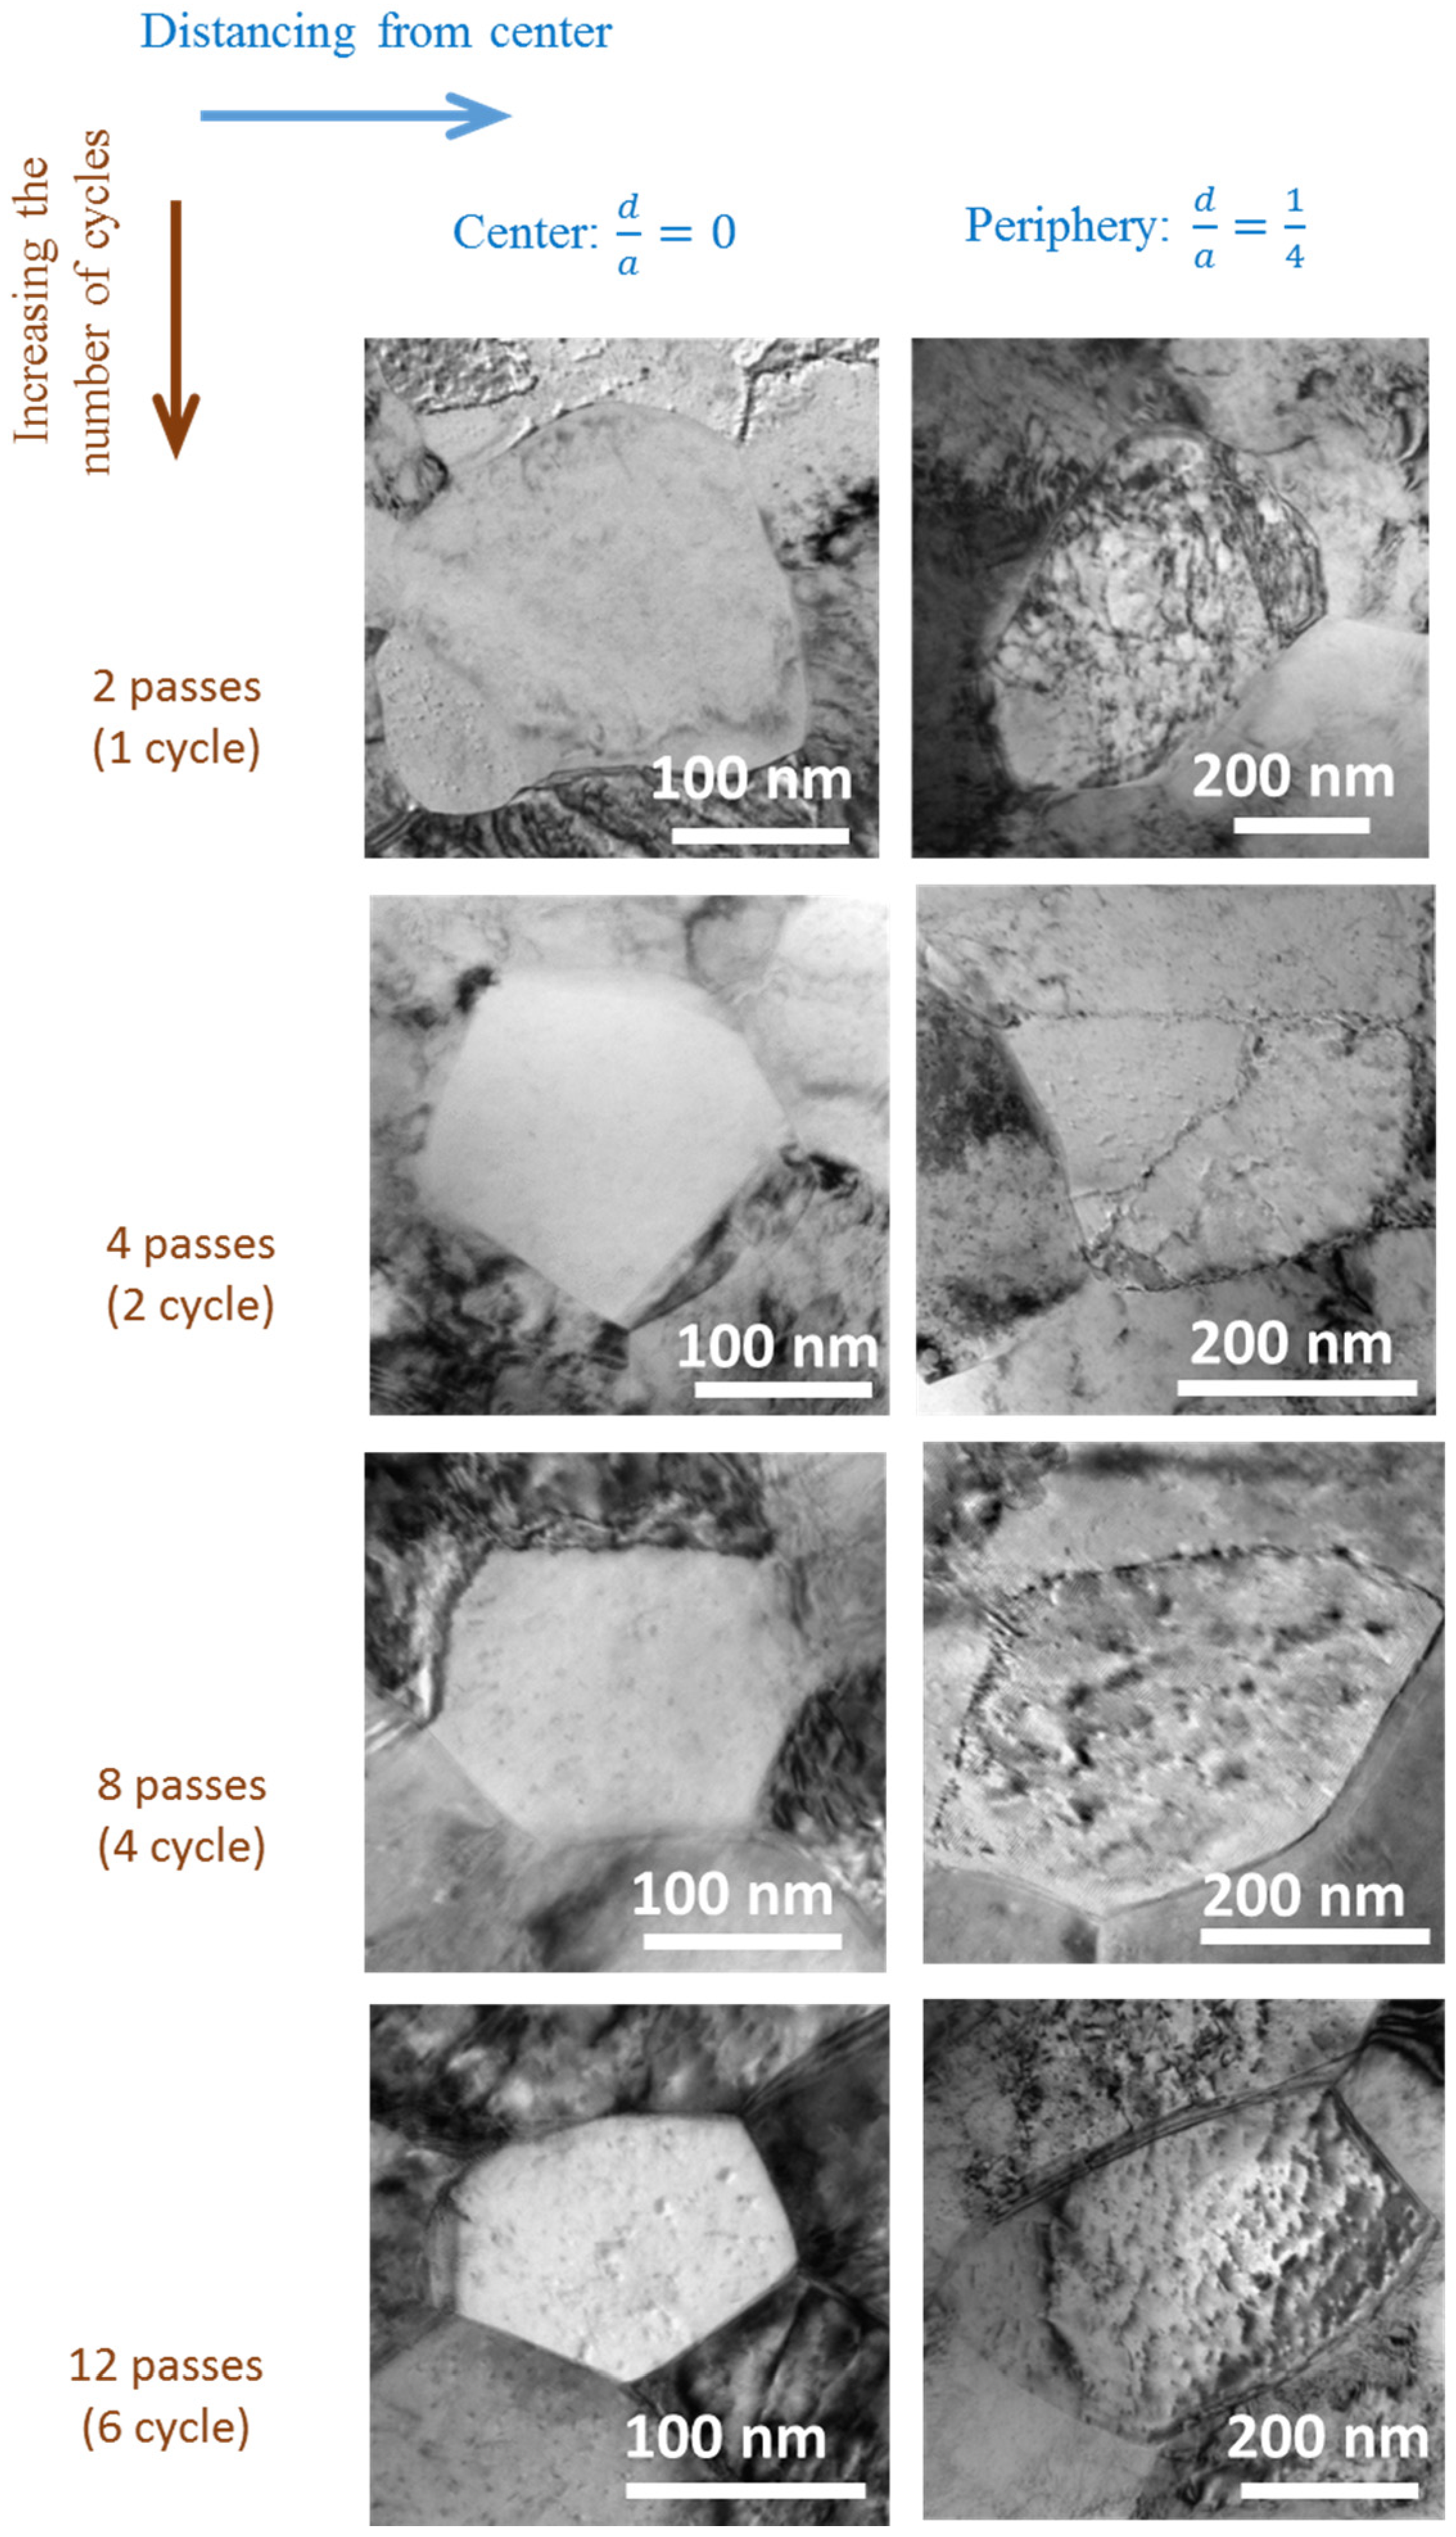
Figure 6 shows the smallest cells detected in the center and periphery of the samples of one to six cycles. The average minimum cell sizes after one, two, four, and six cycles were approximately, 280 nm, 190 nm, 160 nm, and 100 nm, respectively for the center region, while they were approximately, 400 nm, 250 nm, 300 nm and 320 nm, respectively, for the periphery. In the center, the first cycle sample has cell boundaries with a curved appearance, which are mobile boundaries and indicate the low angle characteristic. On the other hand, the boundaries of the smallest cells after two, four, and six cycles samples are sharp, and have high misorientation angles in the center region. For all of the grains in the center part, the grain interior is more or less free of dislocations. In contrast to the center, the cells of the periphery are almost full of dislocations. In the periphery, the smallest cell size and the clearest cell were observed after two cycles of the process. Furthermore, almost all of the boundaries in the periphery are of the curved variety with low misorientation angles.
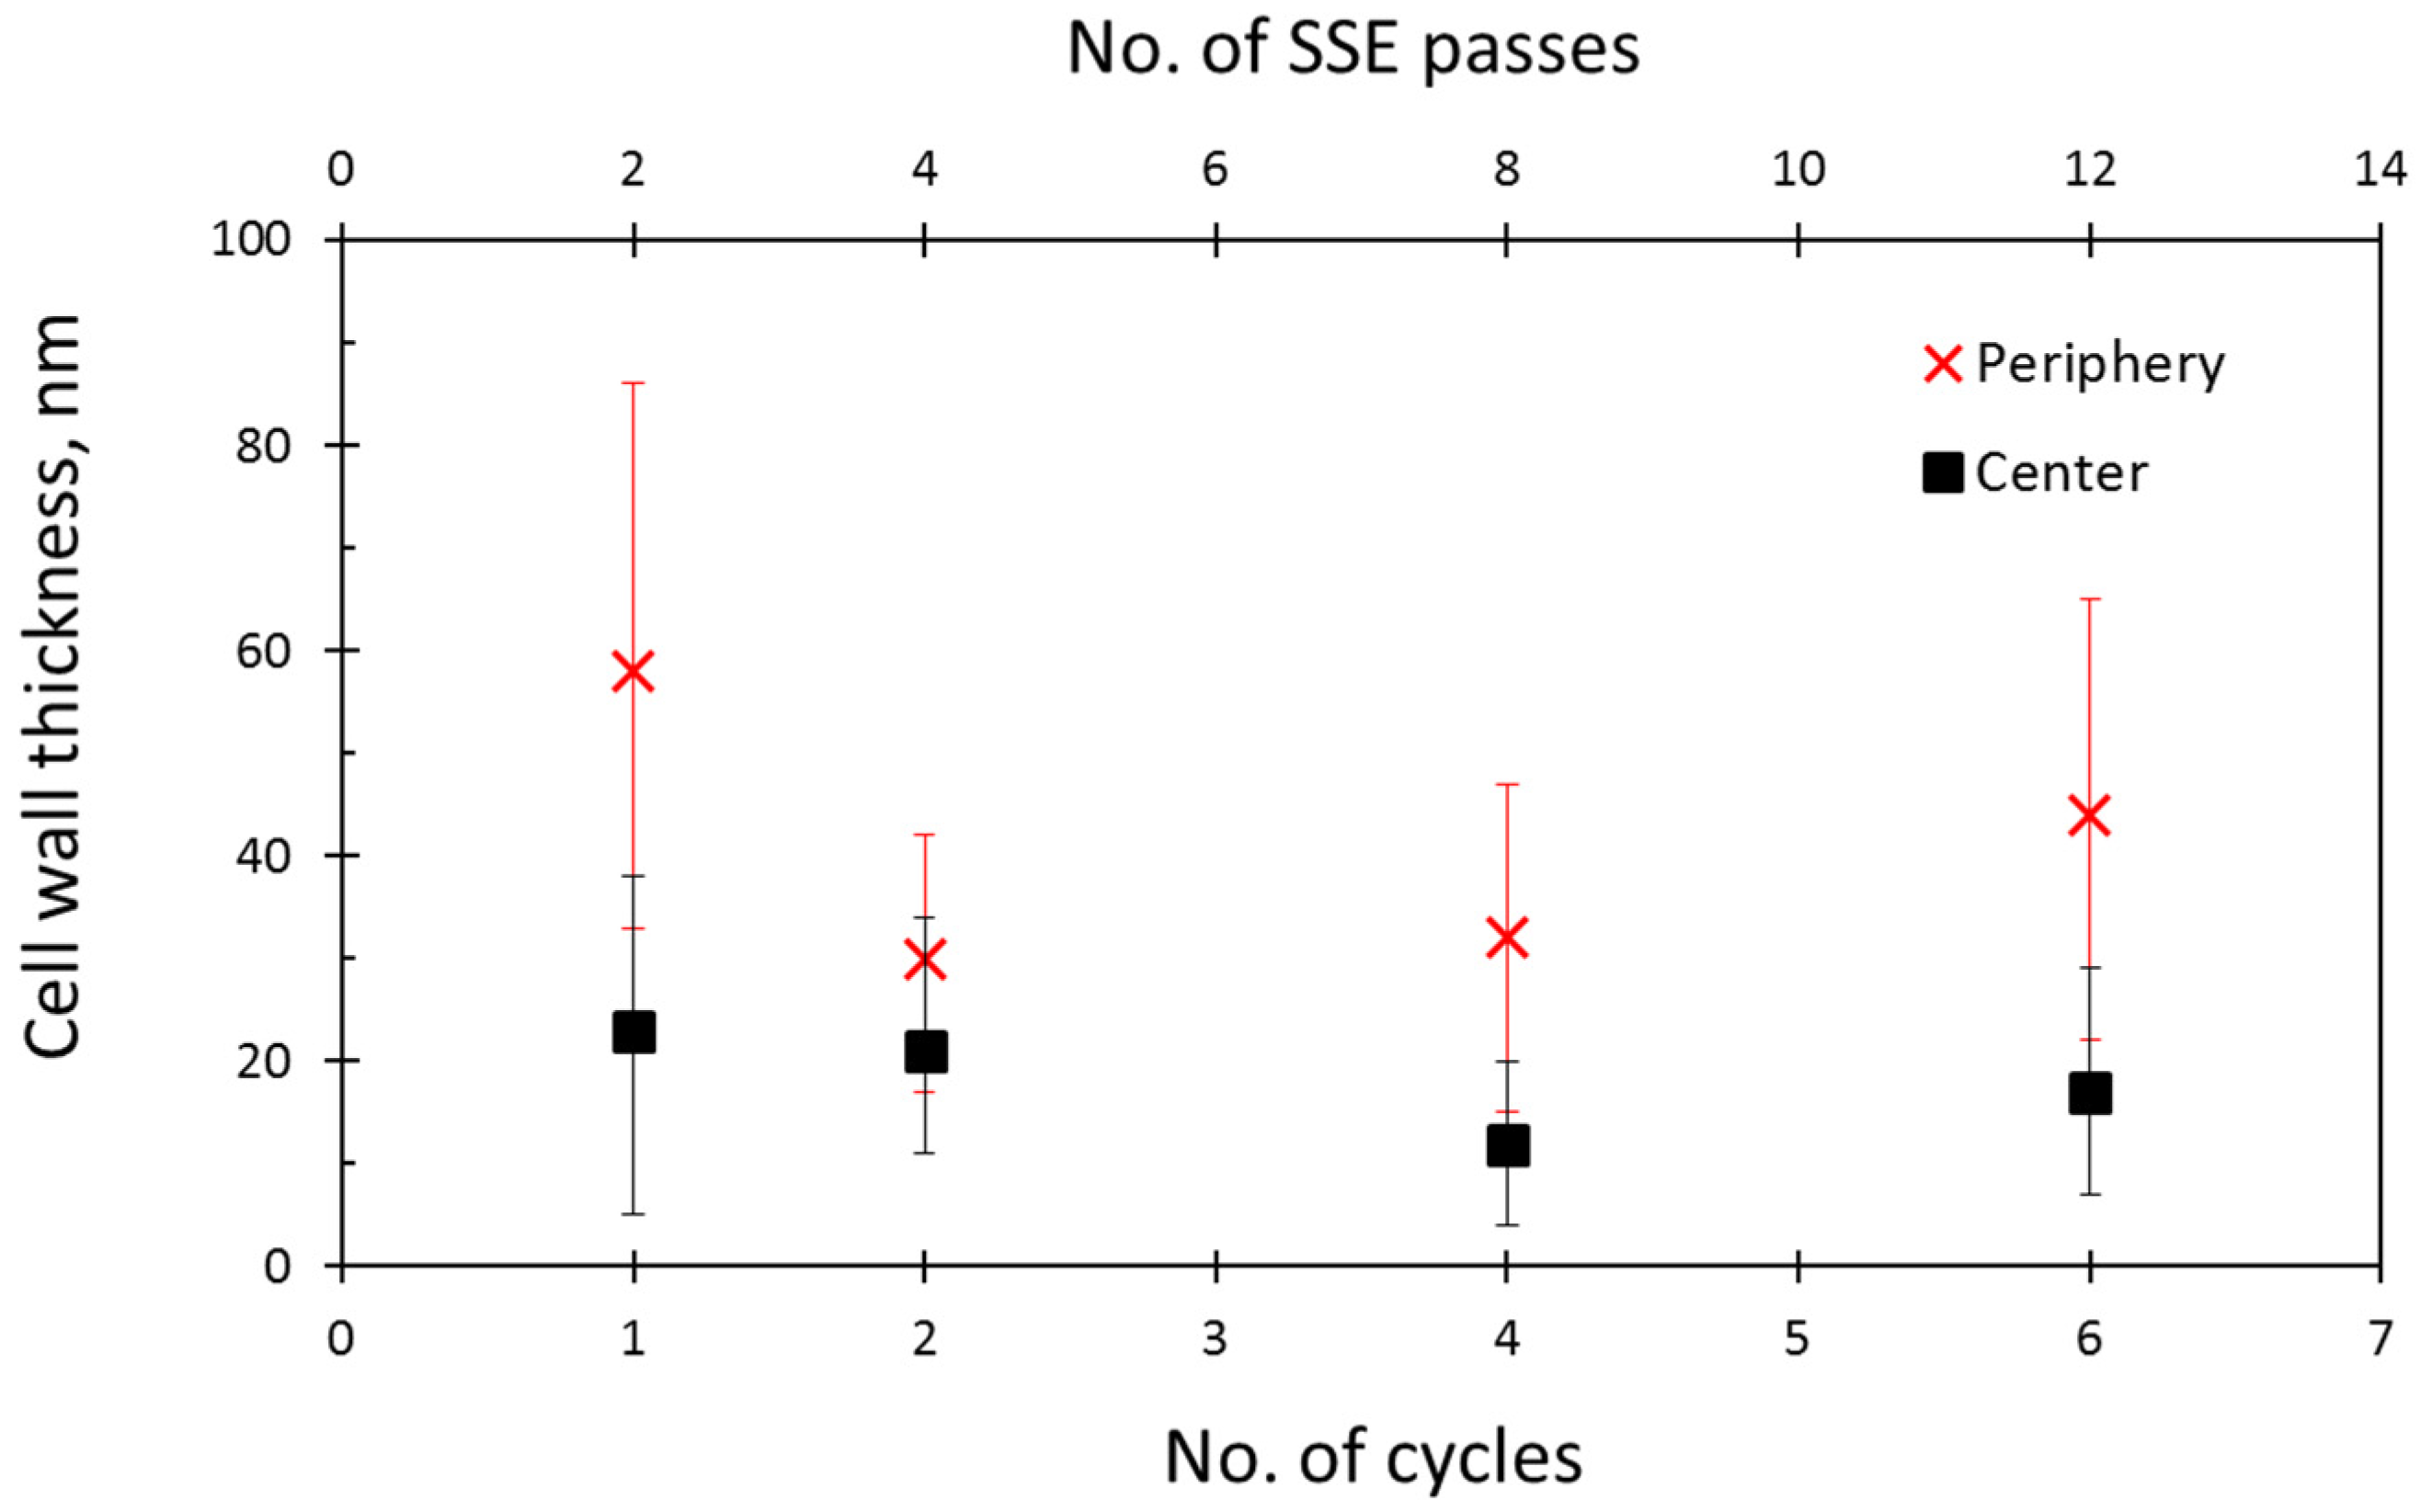
Figure 7 shows the typical cell boundaries in the periphery and center of samples after different cycles. Also, the change in the average cell wall thickness (CWT) of Cu samples after multi-cycles of SSE, which was calculated by measuring the thickness of 50 boundaries for each sample, is illustrated in Figure 8. Generally, the CWT was higher for the periphery. Also, for the center, the trend of change in the CWT was similar to that of cell size. For the center, the CWT decreased gradually from the first to the fourth cycle, and then increased slightly. After about a 50% reduction in the CWT from the first to the fourth cycle, an ~20% increase was seen in the CWT from the fourth to the sixth cycle. For the periphery, the CWT decreased from one to two cycles. The decrease in the CWT at the periphery at this stage was about 48%. However, after that, the CWT increased gradually, which resulted in an ~46% increase in the CWT of the sample after six cycles in comparison to that of two cycles.
3.2. Texture Changes
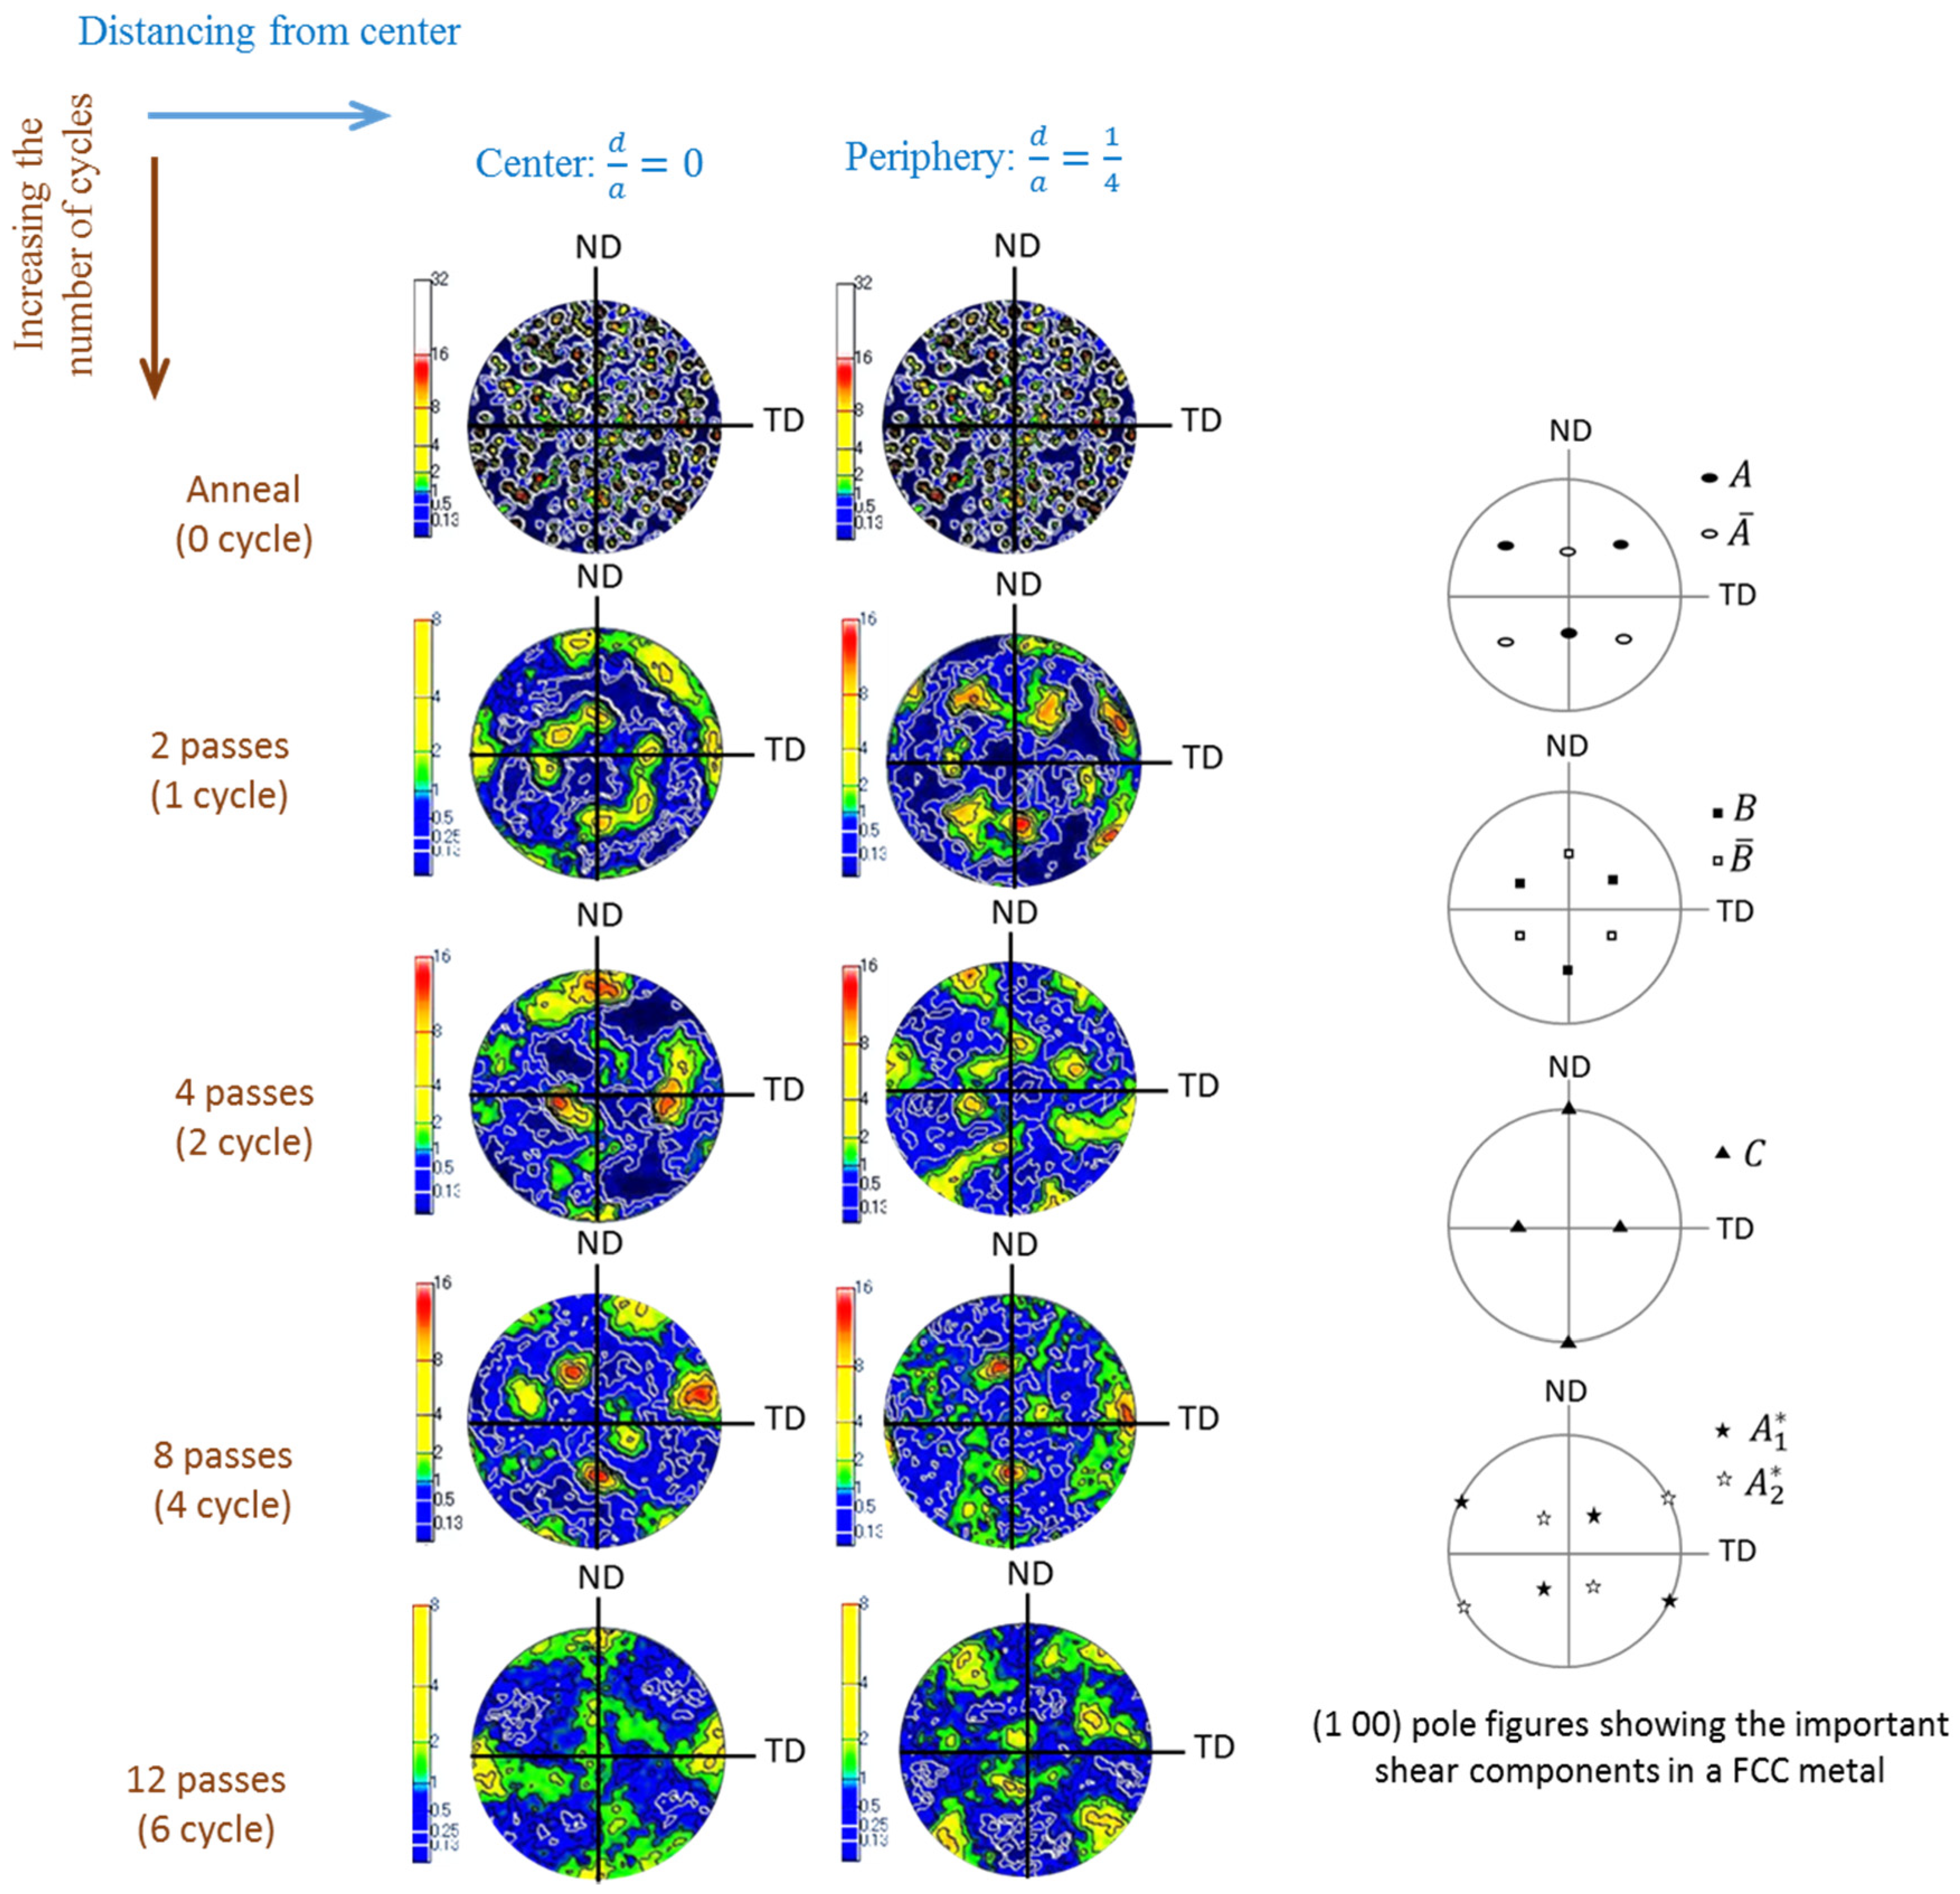
As shown in Figure 1 during the non-monotonic simple shear straining, the sample is distorted on the ED plane in the TD direction (that is, shear happens in the ND plane). Accordingly, it is realistic to contemplate the development of simple shear textures on the ED plane after the process. In this regard, a detailed comparison between the formed microtexture and the important shear textures would be helpful. It should be pointed out that the ideal components were observed in the FCC metals after the torsion test (as an ideal form of simple shear straining) [15]. The ideal orientations are collected in Table 1, and also presented in the (100) pole figures of the right side of Figure 9. While most of the orientations (, , , and ) are such that <uvw> is a close-packed direction of the FCC structure, components with superscript star ( and ) do not correspond to close-packed directions.
Figure 9 shows the (100) pole figures of the samples after multi-cycles of non-monotonic simple shear straining. The initial texture was nearly random in both the center and the periphery of the sample, as a result of the annealing treatment. In the center region, by increasing the non-monotonic shear strain, the component decreased, whereas the other components increased. In the first two cycles, the component was the most intense simple shear component, while the and components did not present. After four and six cycles, the and components decreased significantly, and the and components appeared and increased gradually. Careful examination of the pole figures discloses slight rotations of the ideal orientations about the ED.
In the periphery, after one cycle, there were not any simple shear components, and the texture was still randomly oriented. After two cycles, all of the important shear components appeared in the periphery. The most intense shear components were and , and the weakest of them were and . In the periphery of the sample of the fourth cycle, the , , and C components were the dominant shear components. Finally, after six cycles, and became stronger, and were observed in more grains, whereas and almost disappeared in the periphery. Similar to the center region, the components rotated about the ED slightly.
3.3. Tensile Properties
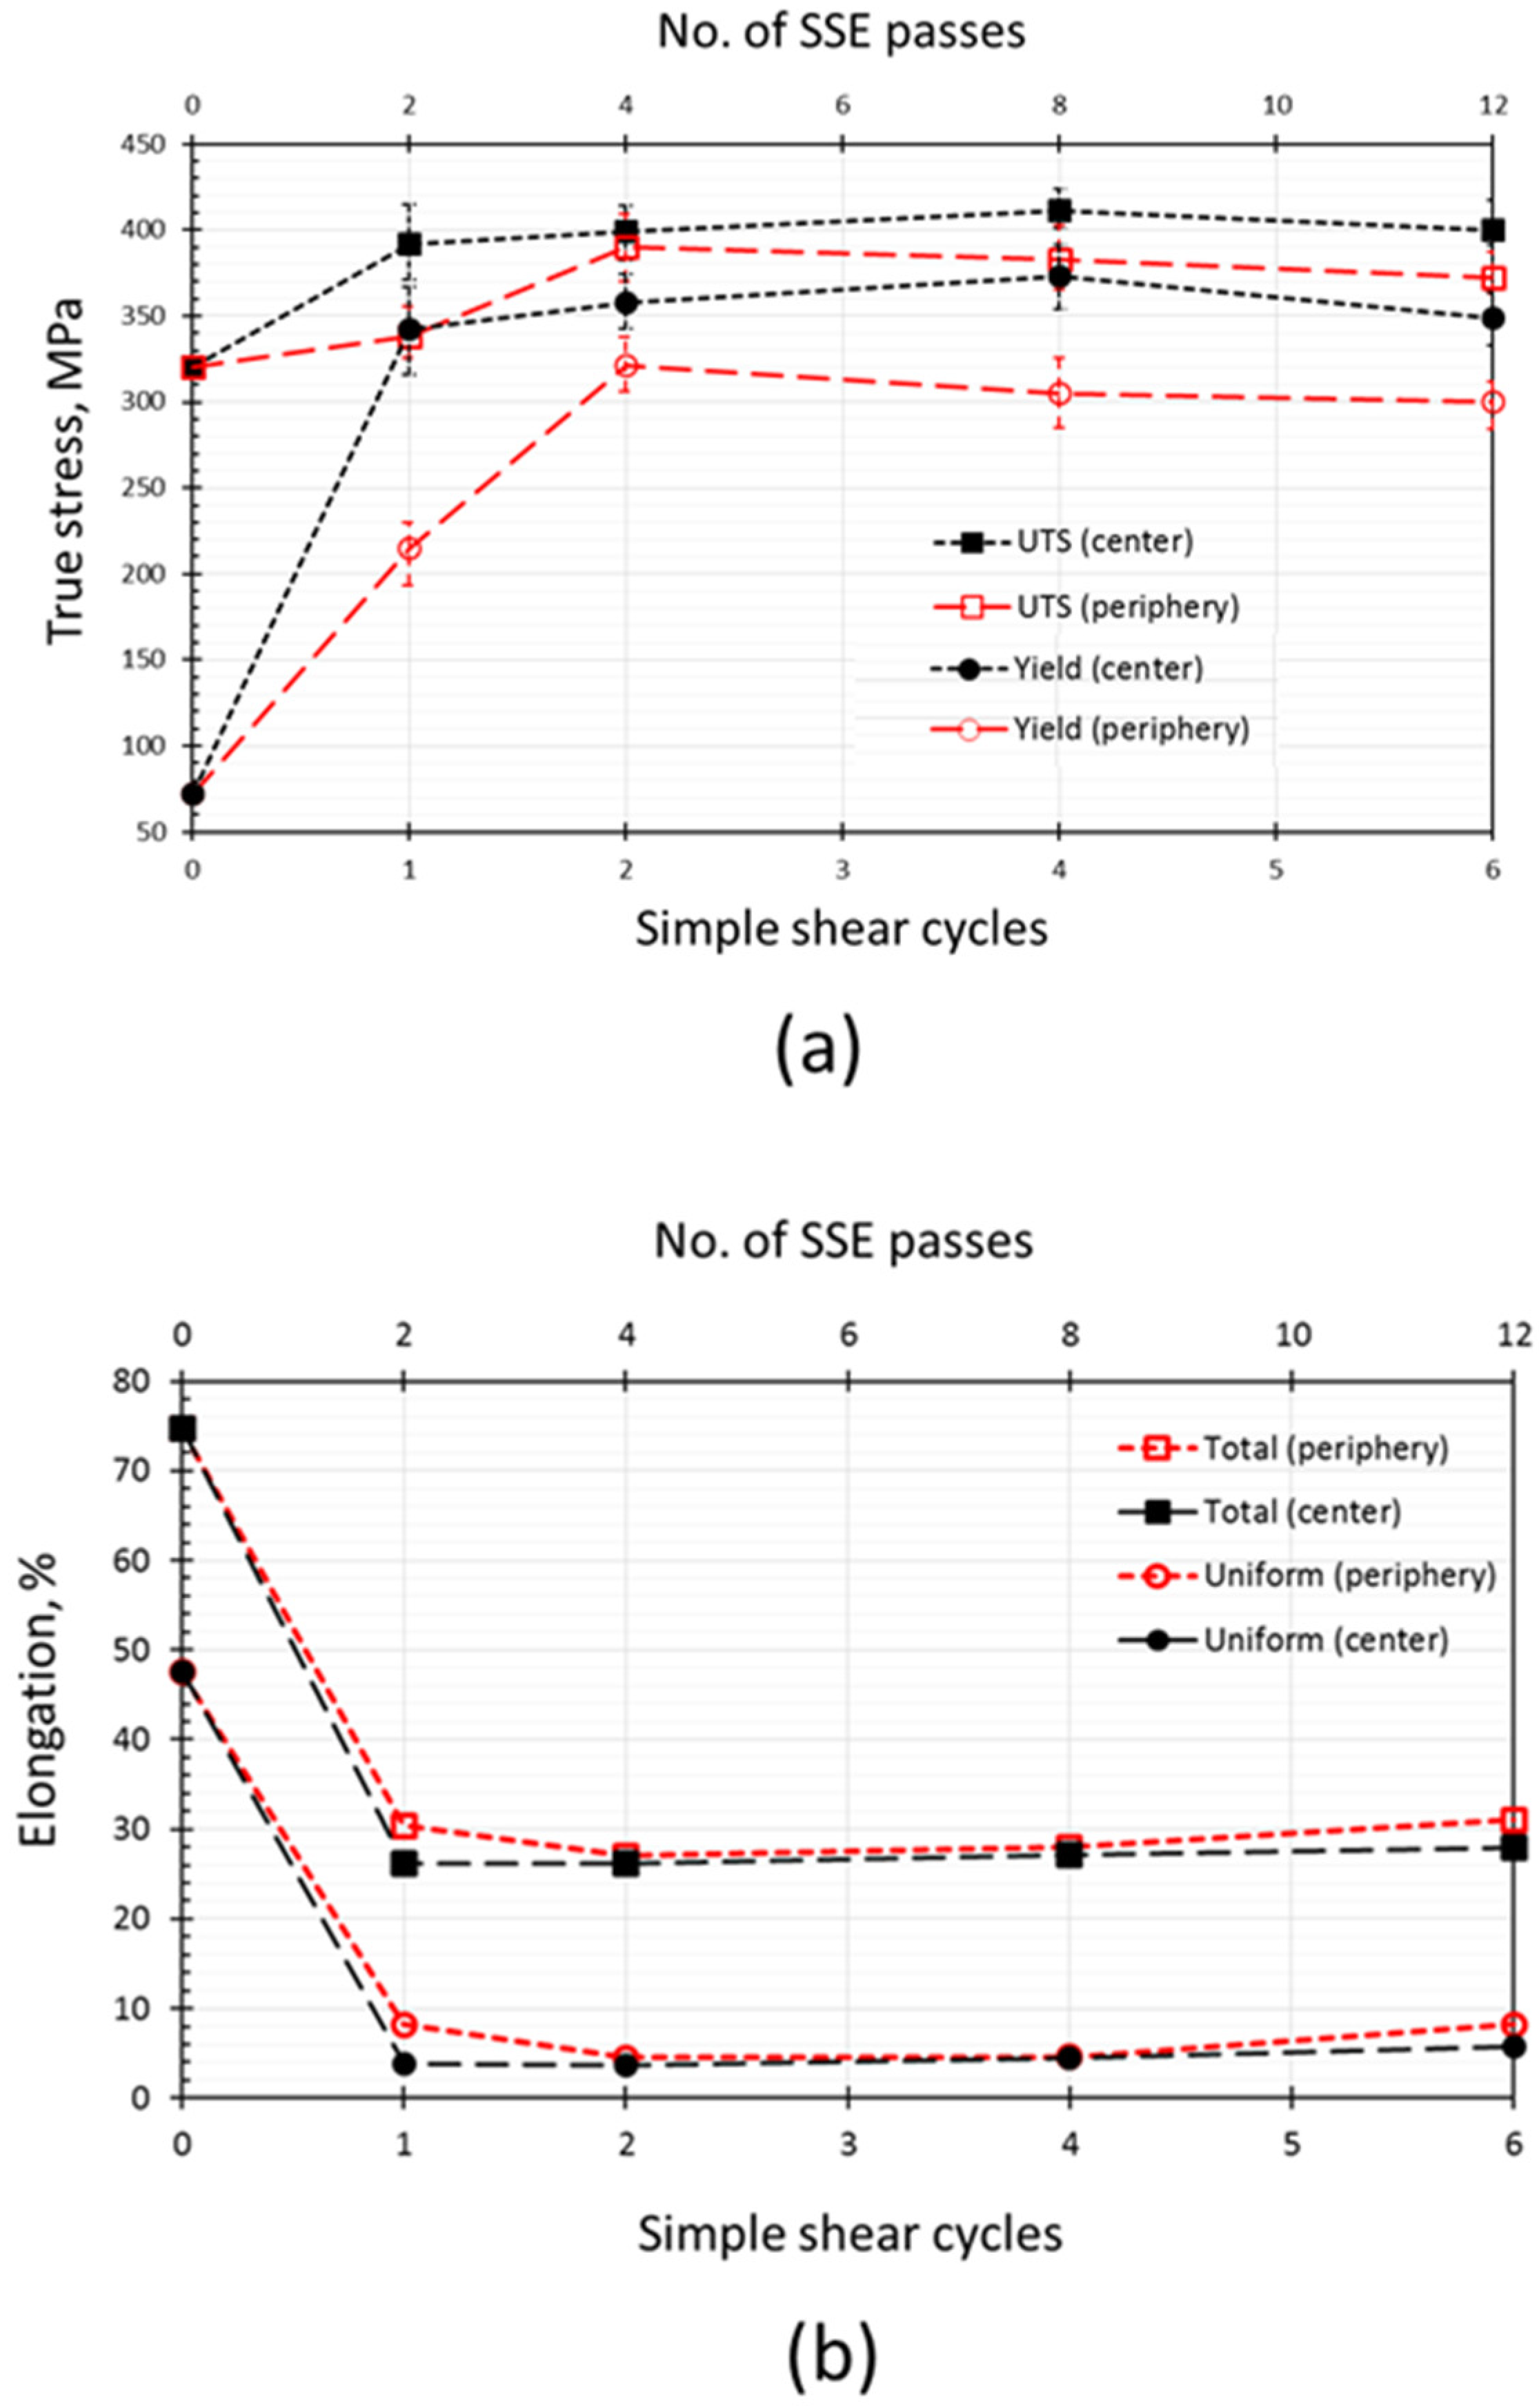
Figure 10a illustrates the variation of the yield strength (σy) and ultimate tensile strength (UTS) of the center and the periphery of the samples of different cycles. By increasing the number of cycles, σy and UTS increase gradually in the center region, and reach maximum values of 373 and 411 MPa, respectively, after four cycles. An approximate decrease of ~8% and 2.5% was observed in the σy and UTS of the sample, respectively, after six cycles, which corresponds to an σy of 343 MPa and an UTS of 400 MPa. For the periphery, σy and UTS increased from 0 to two cycles, and thereafter decreased gradually. The maximum value of σy and UTS in the periphery were 321 MPa and 390 MPa, respectively, which were achieved after two cycles (four passes). The amount of decrease in the σy and UTS values from two to six cycles was ~6.5 % and 5%, respectively.
The variation of the uniform and the total elongations of the samples at different cycles of non-monotonic shear strains are shown in Figure 10b. For the center and the periphery, both the total and the uniform elongations decreased from 0 to two cycles, and remained approximately constant. However, they increased from the fourth to the sixth cycle. The amount of increase in the total elongation of the center and the periphery were ~7% and ~14%, respectively. The increment in the uniform elongation of the center and periphery were ~50% and ~80%, respectively.
4. Discussions
As is reported in Section 3.1 and shown in Figure 5, the minimum mean cell size of the center region was achieved after four cycles, whereas the decrease in the cell size of the periphery continued until the sixth cycle. The smaller grain size of the periphery is attributed to the lower strain in this region. This was reported previously for pure Al [5,10], pure Cu [7,8,9], and twinning induced plasticity (TWIP) steel [16,17] in non-monotonic shear strains, both experimentally and by simulations. Different values of strain in the cross-section of the specimens can be described by the geometry of the process. At each quarter of a cycle, the die geometry forced the sample to move laterally in a simple shear manner. Consequently, the strain developed along a diagonal of the initial square cross-section. At the second quarter of a cycle, this phenomenon occurred in a reverse manner, in which strain contours proliferated along the other diagonal. As a result, the strain at the center was the highest, and decreasesd gradually from the center to the periphery symmetrically.
Paying attention to Figure 10a, the yield strength increased as the strain increased, cycle by cycle; it reached a maximum value, and then a small drop took place steadily. That the yield strength of the periphery is lower than that of the center is due to the lower effective strain in the periphery compared to the center. However, the point that these maximum values (yield strength) are not equal in the center and the periphery does not seem justifiable. In other words, since the theoretical accumulated strain of the periphery reaches that of the center but in higher passes, normally it is expected that the yield strength in the periphery reaches that of the center, but with a delay. However, it never reaches that value. This shows that the deformation mode is not the same in all of the regions of the cross-section of the sample. In addition, although in the center region, the variation of the tensile properties is consistent with the cell size changes; by distancing from the center, there are some deviations from the behavior that is predictable from the grain size (see Figure 10). According to the Hall–Petch relationship [18,19], the flow stress of a material corresponds inversely to the square root of its mean grain size. Therefore, it is reasonable to expect the ongoing increase in the strength of the periphery from 0 to six cycles where the cell size decreases gradually within this range. Nevertheless, unexpectedly, the maximum strength in the periphery was achieved after two cycles, and the yield strength and UTS decreased from two to six cycles. To justify these contradictions, note that beyond the proportion of the grain boundaries (high fraction of grain boundaries corresponds to the smaller grain size), other mechanisms and parameters can affect the strength of a material.
Cells morphology is the fundamental issue that should be taken into account. In FCC metals, large grains tend to refine by dislocation activities such as dislocation gliding, accumulation, interaction, tangling, and spatial rearrangement. According to the grain subdivision mechanism [20], through plastic deformation, dislocation accumulation results in the formation of the non-equilibrium grain boundaries [21], which introduces an excess energy and elastic stresses into the structure. The development of the accumulation of dislocations into the dislocation boundaries results in the formation of two types of dislocation boundaries with different morphologies: the incidental dislocation boundaries (IDBs) and the geometrically necessary boundaries (GNBs) [22]. The IDBs have mainly a tangled dislocation structure, are formed by the reciprocated trapping of glide dislocations, and subdivide the grains into cells. On the other hand, the activation of different slip system in adjacent grains or the partitioning of total shear strain among a set of slip planes results in the formation of GNBs. More plastic strain leads to a decrease in the boundary spacing of both IDBs, and GNBs increases in the misorientation angle. The gradual change of the dislocation boundaries that were produced at low strains into the high-angle boundaries at large strains is called the in situ or continuous dynamic recrystallization [23]. This mechanism is responsible for the grain refinement in the forward shear. Therefore, in large strains, smaller grains (cells) show more resistance to the grain refinement. As shown in Figure 6, the smallest detected cells in the center of the samples are mostly free of dislocations with sharp, high-angle boundaries. The trend of change in the size of smallest cells (see the lower range of error bars in Figure 8) in the center region is same as the variation of mean cell size. On the other hand, several dislocations are visible in the smallest cells in the periphery, which is achieved after two cycles (see the lower range of error bars in Figure 8). Also, this cell has lower dislocations. Besides, two of its boundaries are high-angle boundaries. Finally, it can be concluded that the variation in the strength in each region is similar to the variation in the size of the smallest cells in that region.
The second parameter that is responsible for the dissemination of the tensile behavior is the CWT. As discussed in Section 3.1, for the center and the periphery, the cell walls became thinner from 0 to four cycles and from 0 to two cycles, respectively. For the center, the trend of variation in the CWT is similar to the trend of change in the cell size. On the other hand, in the periphery, the CWT changes in a different manner from the grain size. The minimum CWT was achieved after four and two cycles for the center and the periphery, respectively. Since thinner cell walls are better obstacles for the dislocation activities, higher strength is seen in the specimens or regions with thinner cell walls.
The last parameter involving the tensile behavior of a material is its texture. From the results of Section 3.2, it is obvious that after multi-cycles of non-monotonic shear straining, the subsequent texture of the samples is more random, and resembles the dominant textures in simple shear less. In both the center and the periphery of the Cu sample after large non-monotonic shear strains, the dominant shear textures were and orientations, but with different intensities. The intensity of the simple shear textures was higher in the periphery. However, despite the lower intensity of the shear textures in the periphery, that of the component (C component) of the simple shear texture is equal to the intensity of the aforementioned textures of and . To relate the texture of a material to its mechanical behavior, the qualitative analysis of the texture is not sufficient, and it is important to investigate the texture quantitatively.
According to the Taylor model [24], during the deformation of a polycrystalline material, all of the grains experience the same shape change in order to minimize the energy consumed in the slip. The aforementioned model reveals that the general shape change achieved a homogeneous slip on five independent slip systems, assuming the same critical resolved shear stress for all of the active slip systems. Having the critical resolved shear stress on each of the activated slip systems () and the externally applied stress (), Taylor factor (M) has been defined as . It is clear that the Taylor factor is supposed to determine the stresses required to activate a slip system, which essentially means that M plays an important role in the tensile behavior of a polycrystalline material. The importance of M in the strengthening of a material can be concluded from its contribution in the dislocation strengthening ( [25,26] as follows:
in which G is the shear modules, α is a numerical factor, b is the Burgers vector, and ρ is the dislocation density that is stored in both the cells’ boundaries and the cells’ interiors.
Figure 11 shows the variation of the Taylor factor by increasing the non-monotonic cyclic shear strains in the center and periphery of the Cu samples. As observed, for all of the passes, the value of the M is higher for the center region. The least difference between the Taylor factor of the center and the periphery is seen in the sample of two cycles (four passes), which is consistent with the variation of the tensile behavior (see Figure 10). For both the center and the periphery, the Taylor factor increases in the first cycle, where it achieves its highest value, and decreases sharply after that, from one to two cycles. Interestingly, in the center region after two cycles, the M value remains approximately constant. On the other hand, M decreases gradually from two to six cycles in the periphery. The discussed behavior can describe the dissimilar tensile behavior of the center and the periphery of the samples well.
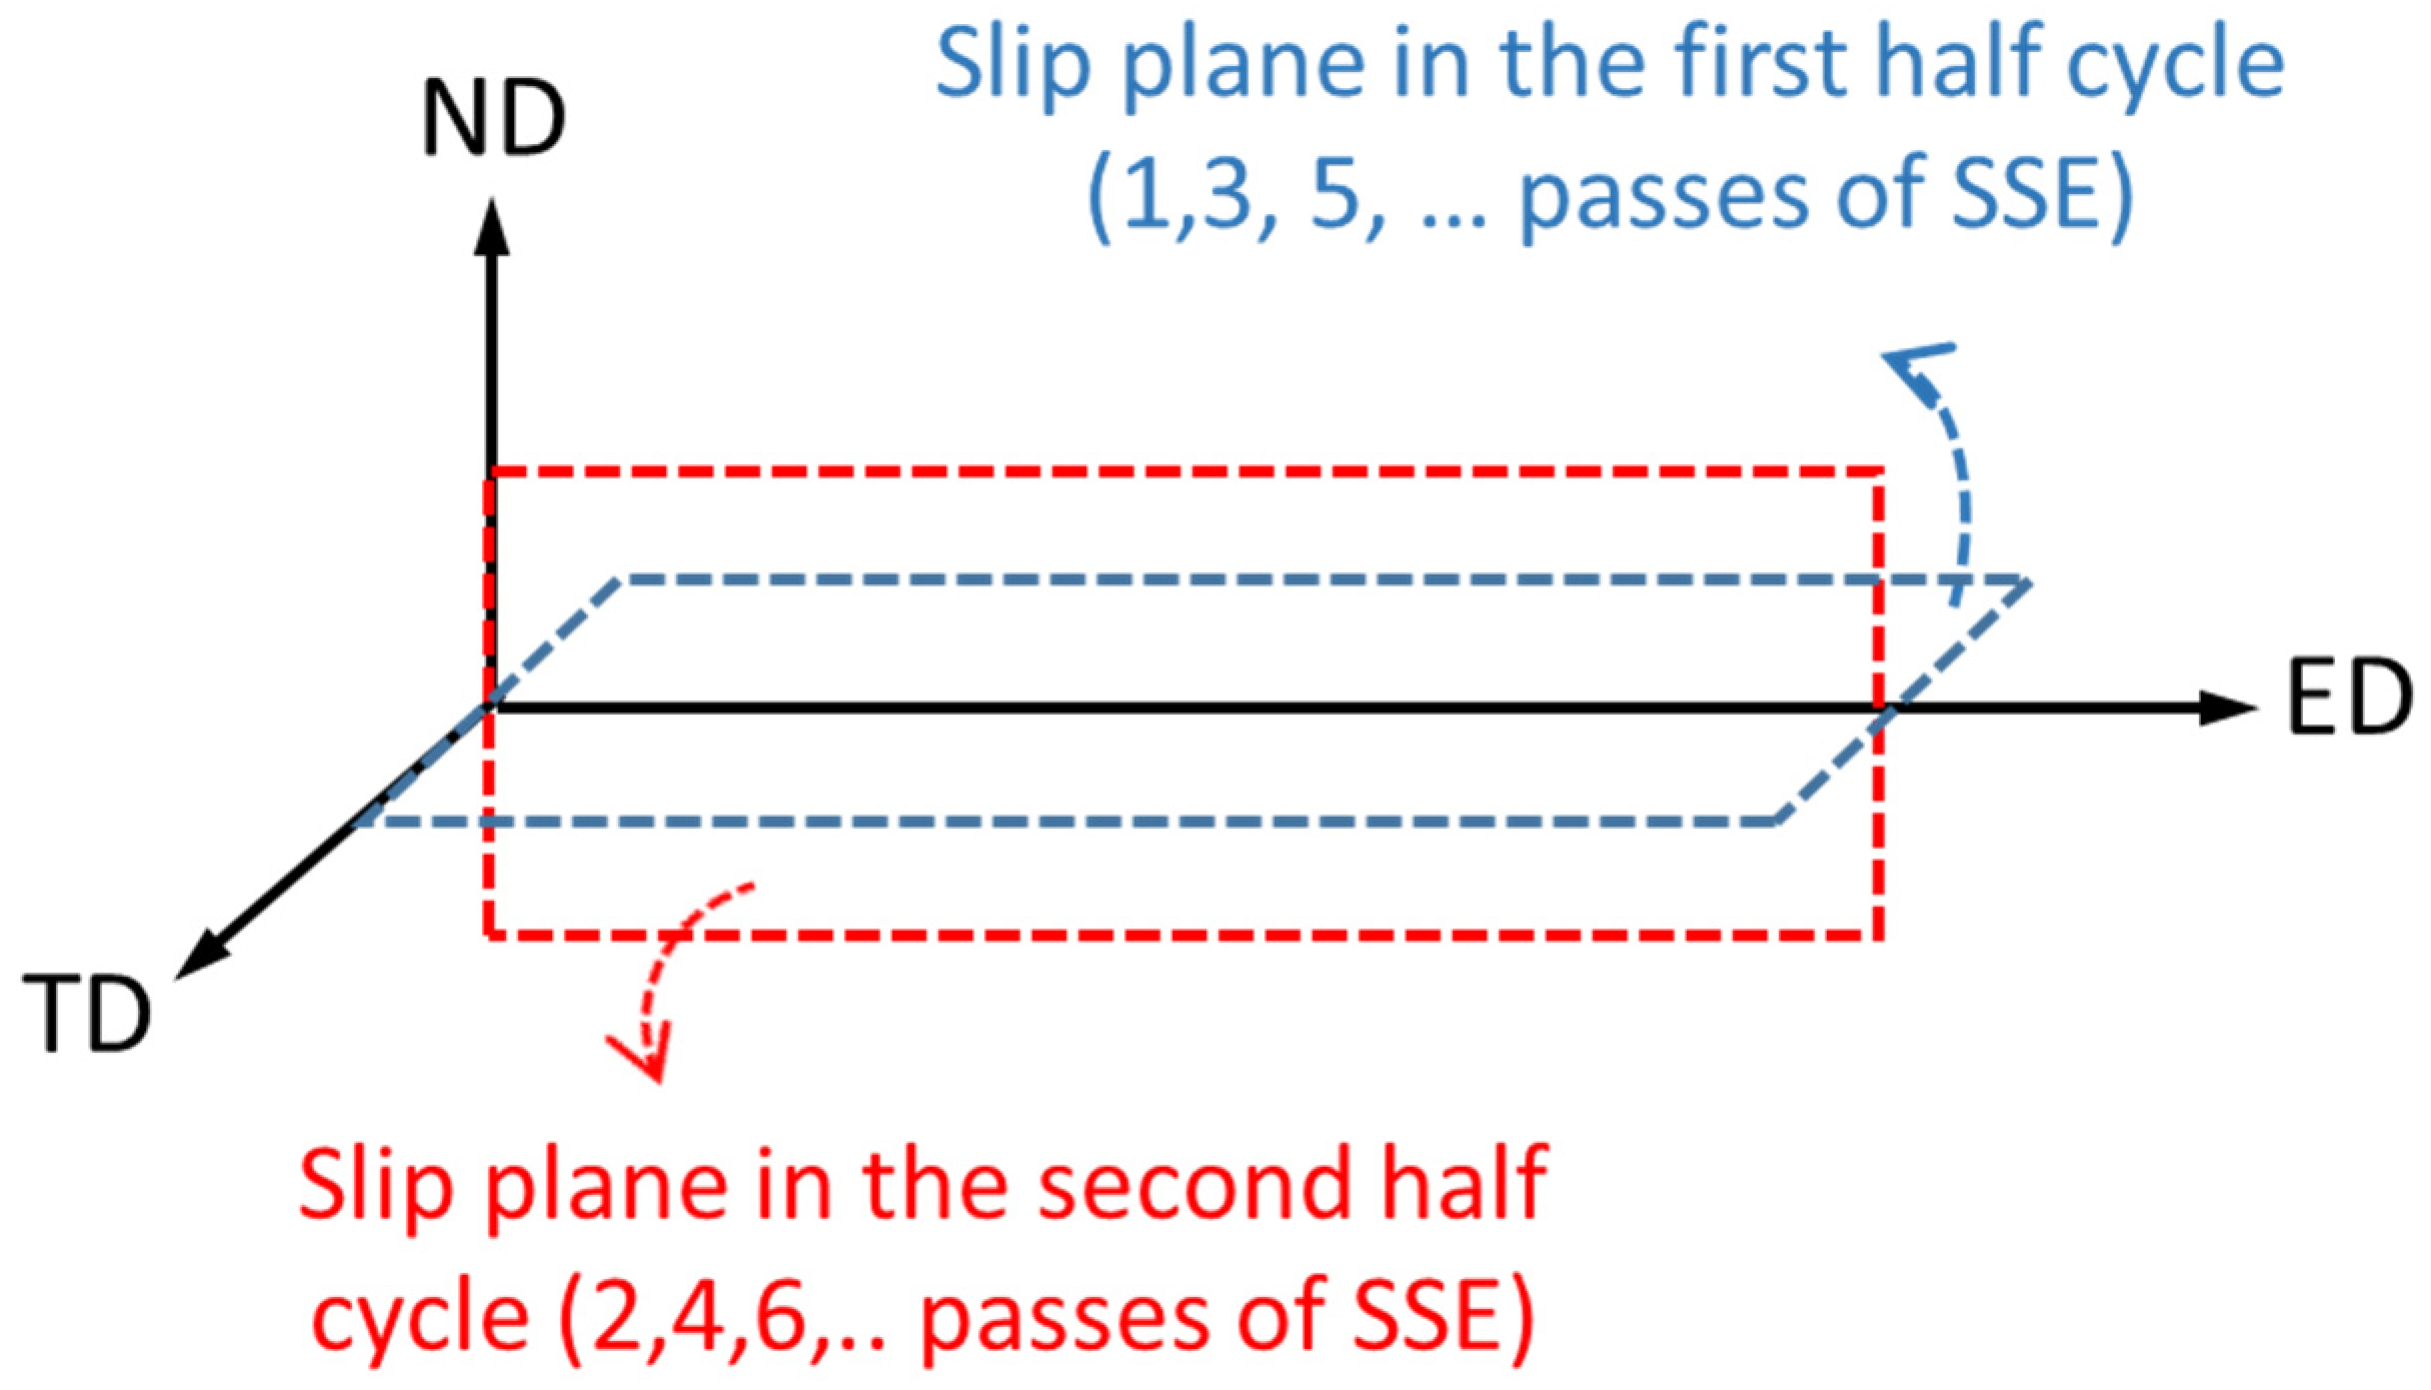
From all of the above discussions, the mechanisms involved in the microstructural and textural evolution and the change in the tensile properties of the Cu samples in particular, and the FCC metals in general, after imposing large non-monotonic simple shear strains is described in the following. In Figure 1, it is obvious that a cycle of the present non-monotonic shear process has two perpendicular shear planes, and each of them are active in one half of a cycle (a pass of SSE). As presented in Figure 12, in one half of a cycle, the shear plane is parallel to the ND plane, which is in the other half. The slip plane is parallel to the TD plane. On the other hand, in every quarter of a cycle (half of a pass), the direction of the shear is reversed. Therefore, in a cycle, there are two different slip planes, and two pairs of shear directions on two different axes. This complicated straining path results in a unique microstructural and texture evolution. However, the mechanism of grain refinement still is in situ or continuous dynamic recrystallization.
In the first quarter of a cycle where the slip happens on an ND plane in the positive direction of TD, a random dislocation distribution rearranges itself into elongated dislocation cells. By increasing the amount of shear in this stage, the boundary misorientation increases, and the aforementioned cells become elongated sub-grains. In the case that the shear amount in this stage is equal to one, the grains are elongated ideally in an inclined direction, in a clockwise rotation, through an angle of ~45° to TD. By increasing the shear, this angle becomes lower. In the second quarter of a cycle where shear happens on the ND plane but in the negative direction of TD, the shear direction is reversed, and the dislocation fluxes are reversed as well, which leads to the decrease of the stored excessive dislocations introduced in the boundaries and disintegration of misfit dislocations. Therefore, reversing the shear direction might lead to diminishing the misorientation angle and/or the elimination of the dislocation boundaries results in postponing the grain refinement [8]. Also, the mean angle between the elongated cell boundaries and TD increases. Furthermore, the boundaries become thicker.
In the second half of a cycle, shear happens on a TD plane in the positive direction of ND. Assuming the imposing shear strain of one in the third quarter of a cycle, elongated sub-grains were formed through the same mechanisms as in the first quarter but this time, the sub-grains are inclined to the ND through an angle of ~45°. Finally, by reversing the direction of shear in the same slip plane, the fraction of high angle grain boundaries decreases, and the mean angle between the elongated cell boundaries and ND increases.
The same mechanism happens in the other cycles. Nevertheless, each cycle changes some of the microstructural features of the previous one, due to the back and forth straining between the cycles. More importantly, since the direction of the shear and/or the shear plane change frequently in every quarter cycle, the texture of a sample after multi-cycles of the process resembles more the random orientation, and the simple textures are not expected.
The mechanism of grain refinement, texture formation, and strengthening in the center and the periphery is the same. However, since the imposed strain in the periphery in each quarter of the process is lower than that in the center, the shear reversal has more effect on the periphery. Therefore, grain refinement postpones in the periphery, and the strength of the periphery is lower than the center.
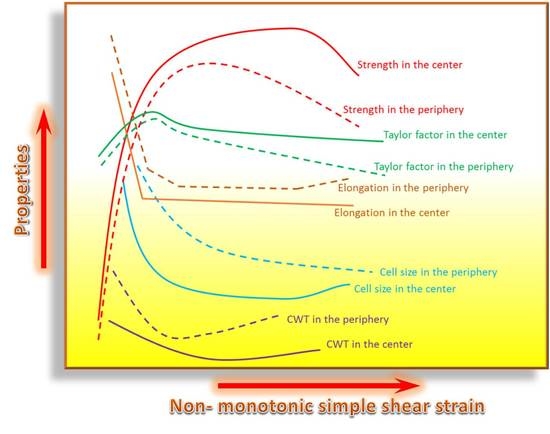
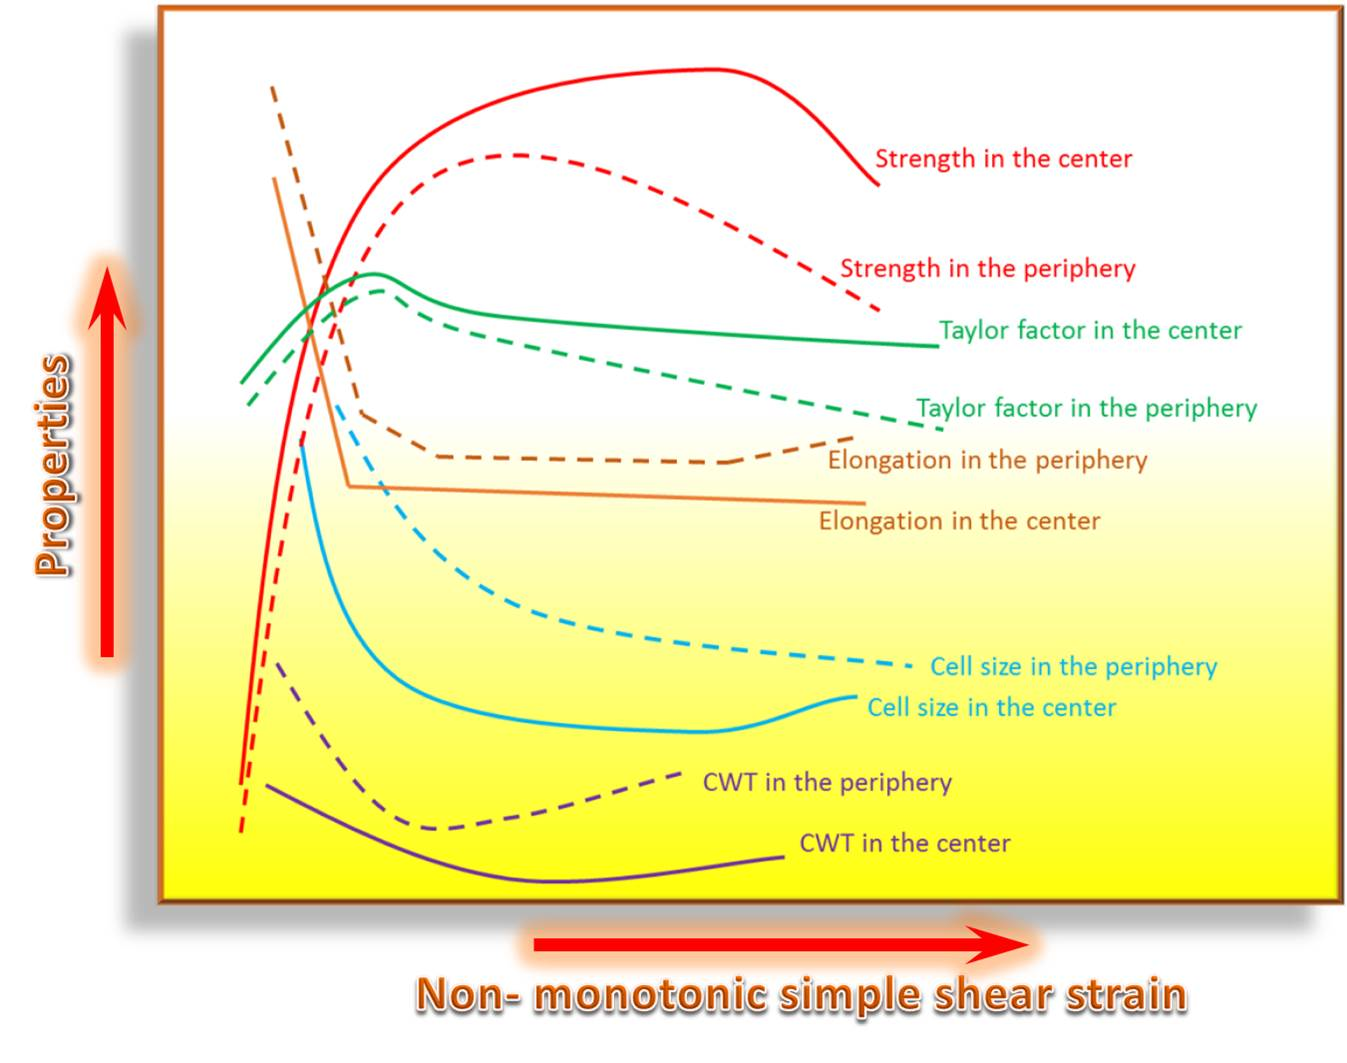
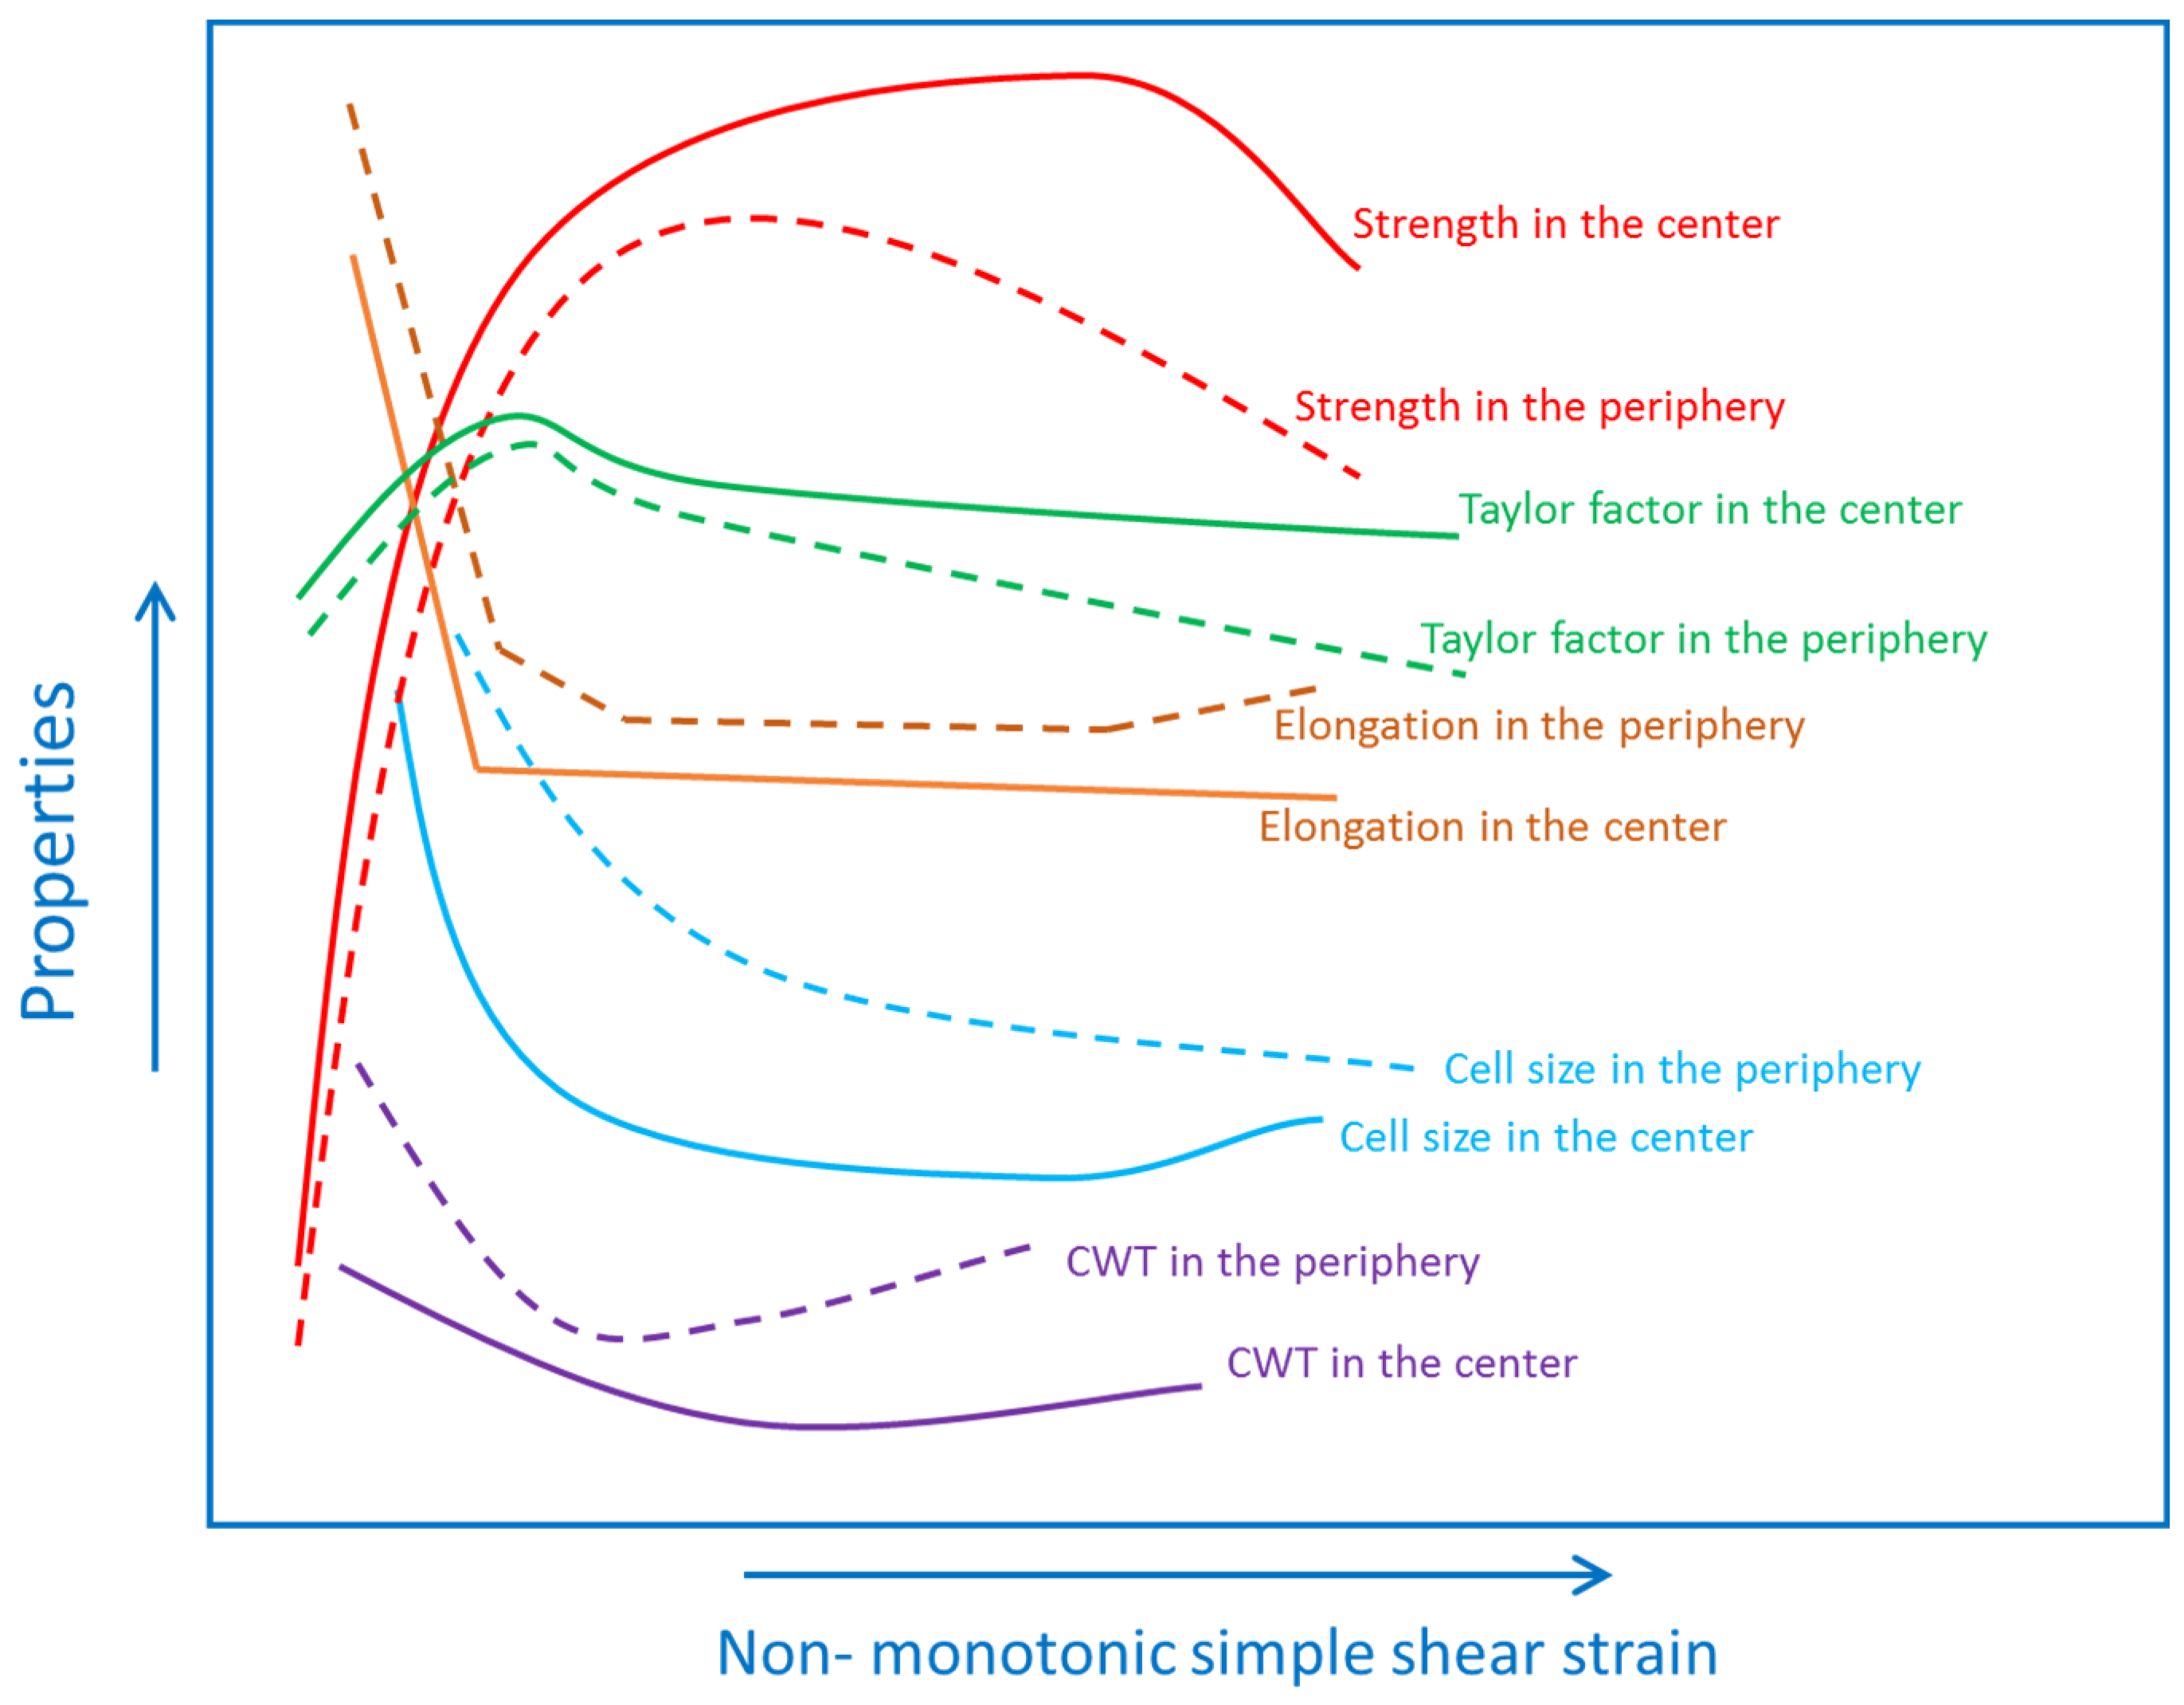
Finally, to summarize the microstructure evolution, texture changes, and variation in the tensile properties of the FCC metals in large non-monotonic simple shear strains, all of the mentioned properties and parameters are presented schematically in a single diagram in Figure 13. The uniformity in the properties and parameters is predictable by the concurrent and mutual effects of cell size, cell wall thickness, and Taylor factor. Furthermore, the trend of change in the texture, Taylor factor, cell size, cell wall thickness, strength, and ductility of the FCC materials is predictable with the aforesaid mechanism.
5. Summary and Conclusions
The effect of large strains on the uniformity of the tensile properties was studied for the non-monotonic simple shear straining. The microstructure and texture of the samples were studied using EBSD analysis and TEM investigations. The investigated microstructural parameters are cell size and morphology, SAD patterns, and cell wall thicknesses. The measured tensile parameters are the yield strength, the UTS, and the elongation. The behavior of the center of the samples could be described by the variation of cell size. On the other hand, the tensile behavior of the periphery could not be defined by the variation of the cell size independently, and the effects of other parameters were considered. It was concluded that the most important parameters that are responsible for the tensile behavior of deformed FCC metals by large non-monotonic shear strains are the mean cell size, the minimum cell size, the thickness of the cell wall, and the Taylor factor. Therefore, in order to predict the behavior of the FCC metals during non-monotonic simple shear straining, all of the aforementioned parameters should be taken into consideration altogether. Interestingly, the tensile behavior and microstructure of the samples are affected by the complicated straining path of the process. While the reversion in the direction of the shear in each quarter of a cycle results in the elimination of some GNBs, the increase in the cell wall thickness, and the decrease in the Taylor factor, the change in the shear plane in each half of a cycle results in the formation of cell boundaries in a different alignment, which leads to more equiaxed cells with more random orientation. The mechanism of grain refinement, texture formation, and strengthening in the center and the periphery is the same. However, since the amount of the imposed strain in the periphery in each quarter of the process is lower than that in the center, the shear reversal has more effect on the periphery. Therefore, grain refinement postpones in the periphery, and the strength of the periphery is lower than that of the center.
Author Contributions
E.B. designed and conducted the experiments, analyzed the data, and wrote the original draft; F.Q., R.E., and H.M. designed the experiments, supervised the research, and revised the final manuscript; R.E. and H.M. funded the project.
Funding
This research received no external funding.
Acknowledgments
The financial support of the Semnan and the Shiraz Universities gratefully appreciated. The authors would like to thank the financial support of the Metallic Materials Science Laboratory of Doshisha University for the application of electron microscopes (SEM-EBSD/TEM). They also express their appreciation to Prof. Laszlo S. Toth for his valuable suggestions.
Conflicts of Interest
The authors declare no conflict of interest.
References
- Valiev, R.Z.; Estrin, Y.; Horita, Z.; Langdon, T.G.; Zehetbauer, M.J.; Zhu, Y.T. Fundamentals of superior properties in bulk nanospd materials. Mater. Res. Lett. 2016, 4, 1–21. [Google Scholar] [CrossRef]
- Valiev, R.Z.; Estrin, Y.; Horita, Z.; Langdon, T.G.; Zechetbauer, M.J.; Zhu, Y.T. Producing bulk ultrafine-grained materials by severe plastic deformation. JOM 2006, 58, 33–39. [Google Scholar] [CrossRef] [Green Version]
- Zhilyaev, A.P.; Langdon, T.G. Using high-pressure torsion for metal processing: Fundamentals and applications. Prog. Mater. Sci. 2008, 53, 893–979. [Google Scholar] [CrossRef]
- Beygelzimer, Y.; Varyukhin, V.; Synkov, S.; Orlov, D. Useful properties of twist extrusion. Mater. Sci. Eng. A 2009, 503, 14–17. [Google Scholar] [CrossRef] [Green Version]
- Pardis, N.; Ebrahimi, R. Deformation behavior in simple shear extrusion (sse) as a new severe plastic deformation technique. Mater. Sci. Eng. A 2009, 527, 355–360. [Google Scholar] [CrossRef]
- Beygelzimer, Y.; Prilepo, D.; Kulagin, R.; Grishaev, V.; Abramova, O.; Varyukhin, V.; Kulakov, M. Planar twist extrusion versus twist extrusion. J. Mater. Process. Technol. 2011, 211, 522–529. [Google Scholar] [CrossRef]
- Bagherpour, E.; Qods, F.; Ebrahimi, R.; Miyamoto, H. Microstructure evolution of pure copper during a single pass of simple shear extrusion (sse): Role of shear reversal. Mater. Sci. Eng. A 2016, 666, 324–338. [Google Scholar] [CrossRef]
- Bagherpour, E.; Qods, F.; Ebrahimi, R.; Miyamoto, H. Microstructure quantification of ultrafine grained pure copper fabricated by simple shear extrusion (sse) technique. Mater. Sci. Eng. A 2016, 674, 221–231. [Google Scholar] [CrossRef]
- Bagherpour, E.; Qods, F.; Ebrahimi, R.; Miyamoto, H. Nanostructured pure copper fabricated by simple shear extrusion (sse): A correlation between microstructure and tensile properties. Mater. Sci. Eng. A 2017, 679, 465–475. [Google Scholar] [CrossRef]
- Bagherpour, E.; Qods, F.; Ebrahimi, R. Effect of geometric parameters on deformation behavior of simple shear extrusion. IOP Conf. Ser. Mater. Sci. Eng. 2014, 63, 012046. [Google Scholar] [CrossRef] [Green Version]
- Frint, P.; Hockauf, M.; Halle, T.; Strehl, G.; Lampke, T.; Wagner, M.F.X. Microstructural features and mechanical properties after industrial scale ecap of an al 6060 alloy. Mater. Sci. Forum 2010, 667–669, 1153–1158. [Google Scholar] [CrossRef]
- Xu, C.; Furukawa, M.; Horita, Z.; Langdon, T.G. The evolution of homogeneity and grain refinement during equal-channel angular pressing: A model for grain refinement in ecap. Mater. Sci. Eng. A 2005, 398, 66–76. [Google Scholar] [CrossRef]
- Pardis, N.; Ebrahimi, R. Different processing routes for deformation via simple shear extrusion (sse). Mater. Sci. Eng. A 2010, 527, 6153–6156. [Google Scholar] [CrossRef]
- Bagherpour, E.; Ebrahimi, R.; Qods, F. An analytical approach for simple shear extrusion process with a linear die profile. Mater. Des. 2015, 83, 368–376. [Google Scholar] [CrossRef]
- Montheillet, F.; Cohen, M.; Jonas, J.J. Axial stresses and texture development during the torsion testing of al, cu and α-fe. Acta Metall. 1984, 32, 2077–2089. [Google Scholar] [CrossRef]
- Bagherpour, E.; Reihanian, M.; Ebrahimi, R. Processing twining induced plasticity steel through simple shear extrusion. Mater. Des. 2012, 40, 262–267. [Google Scholar] [CrossRef]
- Bagherpour, E.; Reihanian, M.; Ebrahimi, R. On the capability of severe plastic deformation of twining induced plasticity (twip) steel. Mater. Des. (1980–2015) 2012, 36, 391–395. [Google Scholar] [CrossRef]
- Hall, E.O. The deformation and ageing of mild steel: Iii discussion of results. Proc. Phys. Soc. Sect. B 1951, 64, 747–753. [Google Scholar] [CrossRef]
- Petch, N.J. The cleavage strength of polycrystals. J. Iron Steel Inst. 1953, 174, 25–28. [Google Scholar]
- Hughes, D.A.; Hansen, N. High angle boundaries formed by grain subdivision mechanisms. Acta Mater. 1997, 45, 3871–3886. [Google Scholar] [CrossRef]
- Valiev, R.Z.; Islamgaliev, R.K.; Alexandrov, I.V. Bulk nanostructured materials from severe plastic deformation. Prog. Mater. Sci. 2000, 45, 103–189. [Google Scholar] [CrossRef]
- Hansen, N.; Mehl, R.F.; Medalist, A. New discoveries in deformed metals. Metall. Mater. Trans. A 2001, 32, 2917–2935. [Google Scholar] [CrossRef]
- Sakai, T.; Belyakov, A.; Kaibyshev, R.; Miura, H.; Jonas, J.J. Dynamic and post-dynamic recrystallization under hot, cold and severe plastic deformation conditions. Progress Mater. Sci. 2014, 60, 130–207. [Google Scholar] [CrossRef]
- Taylor, G.I. Plastic strain in metals. J. Inst. Met. 1938, 62, 307–324. [Google Scholar]
- Hansen, N. Hall–petch relation and boundary strengthening. Scr. Mater. 2004, 51, 801–806. [Google Scholar] [CrossRef]
- Kamikawa, N.; Huang, X.; Tsuji, N.; Hansen, N. Strengthening mechanisms in nanostructured high-purity aluminium deformed to high strain and annealed. Acta Mater. 2009, 57, 4198–4208. [Google Scholar] [CrossRef]
Figure 1.
Schematic representations of (a) the simple shear extrusion (SSE) process, and (b) the strain path during different passes of the SSE process.
Figure 1.
Schematic representations of (a) the simple shear extrusion (SSE) process, and (b) the strain path during different passes of the SSE process.

Figure 2.
Variation of the shear strain during two cycles of the process.

Figure 3.
Regions for the electron back-scattering diffraction (EBSD) analysis, the places where the tensile specimens were prepared from, and the dimension of the tensile samples.
Figure 3.
Regions for the electron back-scattering diffraction (EBSD) analysis, the places where the tensile specimens were prepared from, and the dimension of the tensile samples.

Figure 4.
TEM images and corresponding SAD patterns taken from the center and periphery after multi-cycles of the process (d is the distance from the center, and a is the side length of the initial square cross section). Red lines in the TEM images of the samples after one and two cycles indicate the boundaries of the elongated cells.

Figure 5.
Variation of the mean cell size by increasing the number of cycles.

Figure 6.
Smallest cells detected in the center and periphery of the samples after one to six cycles.
Figure 6.
Smallest cells detected in the center and periphery of the samples after one to six cycles.

Figure 7.
Typical cell boundaries in the periphery and center of samples of different cycles.

Figure 8.
Variation of the cell wall thickness by increasing the number of cycles.

Figure 9.
(1 0 0) pole figures of the center and the periphery of the samples after multi-cycles of the process.
Figure 9.
(1 0 0) pole figures of the center and the periphery of the samples after multi-cycles of the process.

Figure 10.
Variation of (a) the yield stress and ultimate tensile strength (UTS) and (b) uniform elongation by increasing the non-monotonic simple shear strains in the center and the periphery.
Figure 10.
Variation of (a) the yield stress and ultimate tensile strength (UTS) and (b) uniform elongation by increasing the non-monotonic simple shear strains in the center and the periphery.

Figure 11.
Variation of the Taylor factor by increasing the non-monotonic simple shear strains in the center and the periphery.
Figure 11.
Variation of the Taylor factor by increasing the non-monotonic simple shear strains in the center and the periphery.

Figure 12.
Two perpendicular shear planes in a cycle of SSE.

Figure 13.
A schematic representation of the change in the microstructural parameters and tensile properties of FCC materials in the center and the periphery by increasing the non-monotonic simple shear strains.
Figure 13.
A schematic representation of the change in the microstructural parameters and tensile properties of FCC materials in the center and the periphery by increasing the non-monotonic simple shear strains.


Table 1.
Main ideal simple shear components of FCC materials.
| Notation | Symbol | Crystal mimic | |
|---|---|---|---|
 |  | ||
 |  | ||
 |  | ||
 |  | ||
 |  | ||
 |  | ||
 |  |
© 2018 by the authors. Licensee MDPI, Basel, Switzerland. This article is an open access article distributed under the terms and conditions of the Creative Commons Attribution (CC BY) license (http://creativecommons.org/licenses/by/4.0/).
Share and Cite
MDPI and ACS Style
Bagherpour, E.; Qods, F.; Ebrahimi, R.; Miyamoto, H. Microstructure and Texture Inhomogeneity after Large Non-Monotonic Simple Shear Strains: Achievements of Tensile Properties. Metals 2018, 8, 583. https://doi.org/10.3390/met8080583
AMA Style
Bagherpour E, Qods F, Ebrahimi R, Miyamoto H. Microstructure and Texture Inhomogeneity after Large Non-Monotonic Simple Shear Strains: Achievements of Tensile Properties. Metals. 2018; 8(8):583. https://doi.org/10.3390/met8080583
Chicago/Turabian StyleBagherpour, Ebad, Fathallah Qods, Ramin Ebrahimi, and Hiroyuki Miyamoto. 2018. "Microstructure and Texture Inhomogeneity after Large Non-Monotonic Simple Shear Strains: Achievements of Tensile Properties" Metals 8, no. 8: 583. https://doi.org/10.3390/met8080583
Note that from the first issue of 2016, this journal uses article numbers instead of page numbers. See further details here.