Modeling and Simulation of the Static Recrystallization of 5754 Aluminium Alloy by Cellular Automaton

1
Light Alloy Research Institute, Central South University, Changsha 410083, China
2
State Key Laboratory of High-performance Complicated Manufacturing, Central South University, Changsha 410083, China
3
School of Mechanical and Electrical Engineering, Central South University, Changsha 410083, China
*
Author to whom correspondence should be addressed.
Metals 2018, 8(8), 585; https://doi.org/10.3390/met8080585
Submission received: 28 June 2018
/
Revised: 24 July 2018
/
Accepted: 24 July 2018
/
Published: 26 July 2018
Abstract
:To study the factors that affect the mechanical properties of materials, double-pass hot compression tests were performed under different deformation parameters using a Gleeble-3500 thermo-simulation machine. The static softening behavior of 5754 aluminium alloy during testing was analyzed by the 0.2% offset-stress method. The results show that the static softening fraction was greatly influenced by deformation parameters and rapidly increased with increasing delay time, strain rate and deformation temperature. In addition, a mesoscopic cellular automaton (CA) model was employed to simulate the microstructural evolution of the static recrystallization (SRX) during the double-pass hot compression test of the 5754 aluminium alloy. The results show that the SRX nuclei first formed along the grain boundaries, where the energy was sufficient, and deformation parameters had a significant influence on the SRX of the 5754 aluminium alloy. The recrystallized volume fraction increased with increasing temperature, strain rate, and delay time among deformation stages. The mean recrystallized grain size increased with increasing deformation temperature and delay time. However, the mean grain size was slightly reduced with an increase in the strain rate from 0.1 s−1 to 1 s−1 at constant temperature and delay time.
1. Introduction
The heating process used to form materials is of remarkable importance, as it affects the quality of the products [1,2]. However, previous studies have shown that complex metallurgical structural changes that occurred during multi-pass hot rolling and hot compression processes resulted from competing work hardening and softening mechanisms [3,4]. In addition, static softening behavior plays a crucial role in the hot compression process, as it has a great influence on the forming load and the microstructural evolution during each pass [5]. Therefore, static softening behavior has received increasing attention in practical manufacturing processes. For example, Llanos et al. [6] and Jiang et al. [7] studied the static softening behavior of vanadium micro-alloyed with high manganese austenitic steel and 7150 aluminium alloy, respectively.
It is well known that static recrystallization may occur during the inter-pass holding intervals between double pass and multi-pass hot compression. The extent of static softening can be quantified by assessing the fraction of static recrystallization [8]. Hence, it is necessary to evaluate the static recrystallization process with different deformation parameters. Recrystallization normally begins at atypical locations in the average microstructure of a deformed material, and the characteristics of the microstructure evolution are related in a complex and nonlinear fashion to the deformation process and the chemistry of the materials [9]. With the continuous improvement of material testing and analysis technology in recent years, an increasing number of scholars have established multiscale grain evolution models for materials during the forming process. Stochastic modeling, which provides the basis for constructing multiscale models, uses probabilistic methods to study grain growth and evolution, including random distribution of grain sizes, grain orientation, and topography, and the energy and structure during tissue evolution owing to random fluctuations in growth conditions. At present, the Monte Carlo (MC) method, phase field method and cellular automata (CA) method are commonly used in mesoscale microstructure evolution simulation. However, because the MC method uses the sampling method for calculation, there are many shortcomings. For example, the real-time and the simulation time are difficult to correspond, the key parameters such as the nucleation position and nucleation rate of the recrystallization process are not necessarily related to the dynamics, and the calculation amount is large and the operation time is long. The phase field method uses the numerical difference method to solve it iteratively, which makes the calculation amount very large and constitutes a certain limitation for the development of the simulation work.
The CA method uses a typical "bottom-up" modeling approach, which is the thinking mode used by most complex systems research methods. In addition, the powerful computing power of cellular automata is a powerful tool for simulating the highly complex phenomena of microstructure evolution. A multiscale phenomenon is first shown by means of a multilevel CA by Beygelzimer and Spuskanyuk [10]. This approach can be useful in simulation, which inherits the microstructure and microstresses from the previous plastic deformation level. Radd et al. [11] proposed a probabilistic CA model and solved the problem of spatiotemporal inhomogeneity of recrystallized grain growth rate. As an important stochastic modeling method, CA has frequently been used to successfully simulate the process of organizational evolution, such as static recrystallization (SRX) [12,13,14,15,16] and dynamic recrystallization (DRX) [17,18,19,20,21,22]. CA combines the advantages of probabilistic statistical and deterministic methods to describe the evolution of more complex microstructures with a clearer physical meaning. In this research, a 2D CA model was used. Compared with the 3D model, it has less computational complexity and is widely used to simulate the microstructure evolution process.
Al-Mg alloys have been used widely in transportation, electronics, and the aerospace industry owing to their characteristic high specific strength, low density, and high formability [23,24,25]. The 5754 aluminium alloy has high corrosion resistance and has broad application prospects in the manufacture of ship and automobile structures. However, its application is greatly restricted due to formability issues at room temperature [3]. Lohmar et al. [26] and Jiang et al. [27] pointed out that the mechanical properties of materials are closely coupled with the microstructure. Accordingly, it is an important task to study the static softening mechanisms and SRX processes of 5754 aluminium alloy, so that we can maximize the material properties by adjusting the deformation parameters.
In this study, hot compression tests were performed using a Gleeble-3500 thermo-simulation machine at different deformation parameter settings. The static softening behavior of 5754 aluminium alloy was analyzed by the 0.2% offset-stress method. In addition, a two-dimensional probabilistic CA model was employed to analyze the influence of temperature, strain rate, and delay time during the SRX. The main objective of this paper is to establish a mesoscopic, physically based model to predict the evolution of SRX during hot compression to compare with the experimental results. Furthermore, the process parameters for hot compression are optimized by focusing on how static softening and SRX respond to controlled deformation parameters, including: temperature, strain rate, and delay time.
2. Experimental Procedure and Materials
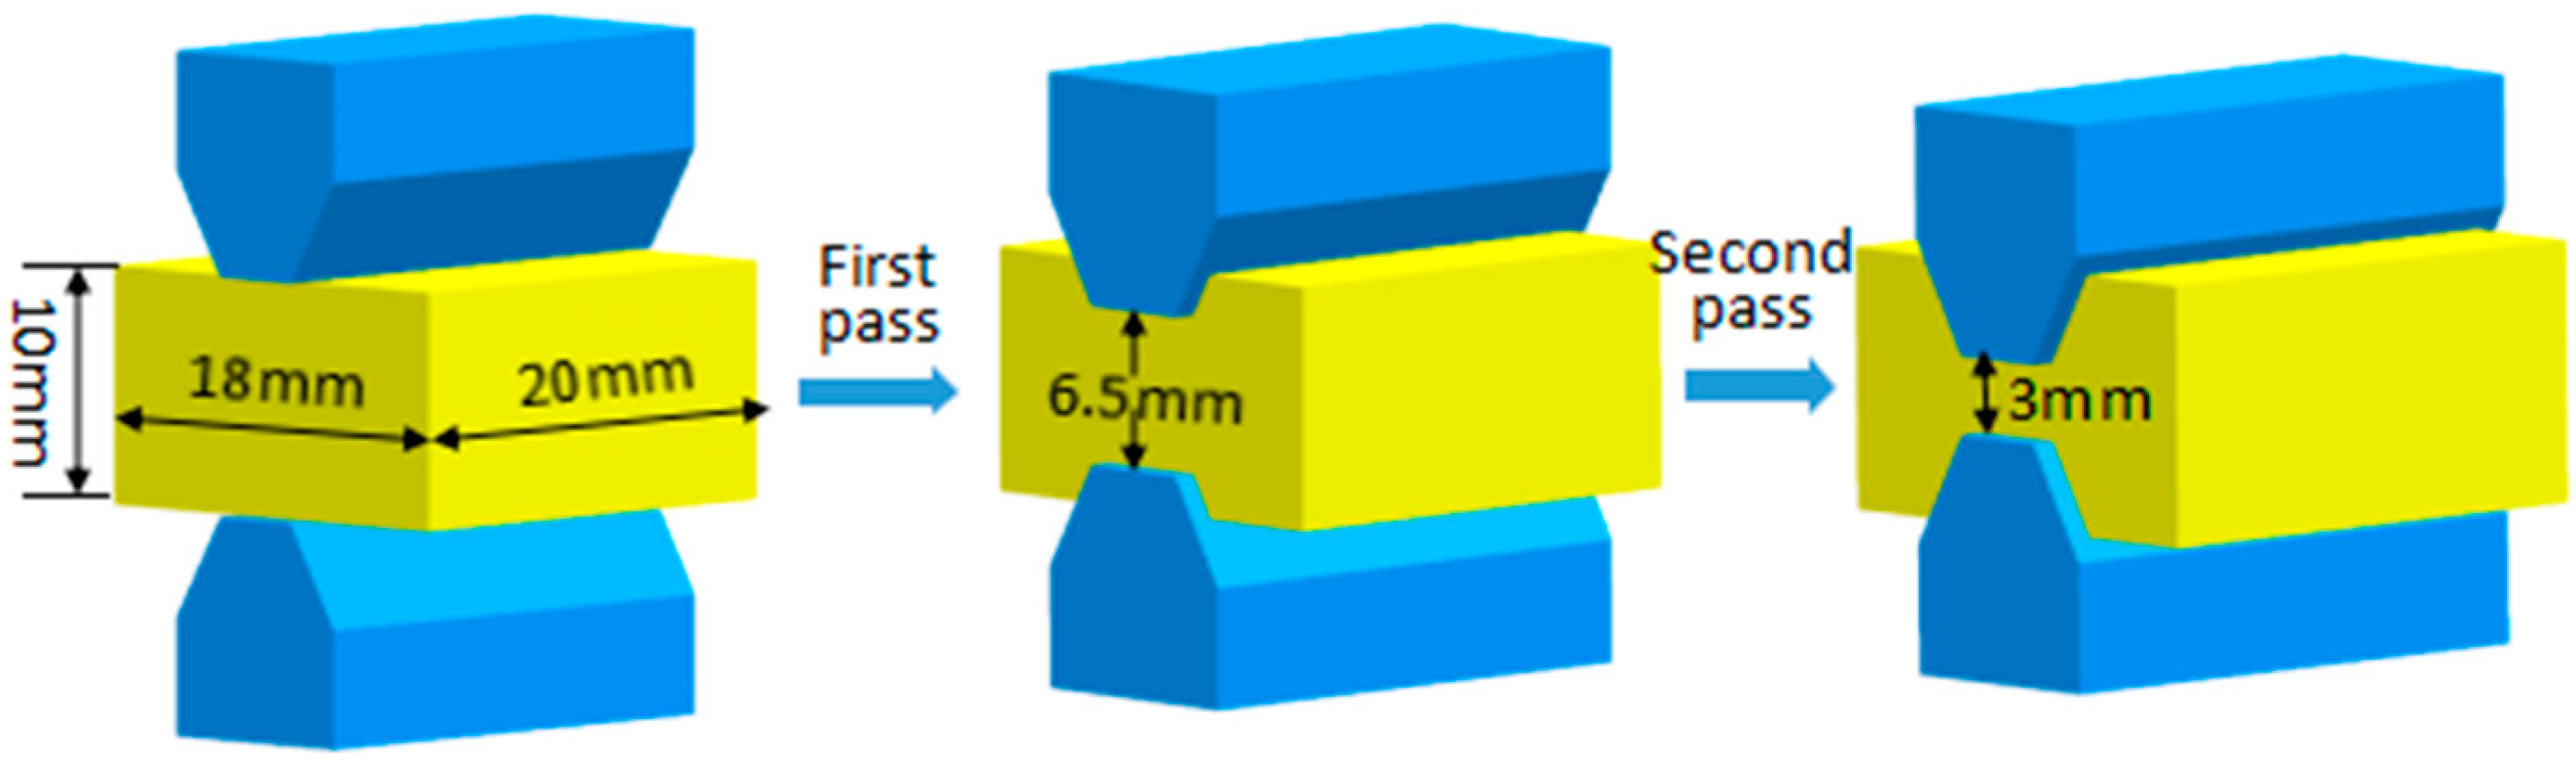
The double-pass hot compression tests were performed using a Gleeble-3500 (Dynamic System Institution, New York, NY, USA). The main chemical components (wt. %) of 5754 aluminium alloy are shown in Table 1. To facilitate testing, specimens were cut into cuboids with geometric shapes and sizes shown in Figure 1.
Samples were heated to 450 °C at a rate of 10 °C/s and insulation for 240 s to eliminate thermal gradients. The samples were then cooled to different deformation temperatures at a speed of 5 °C/s. Two different deformation temperatures (350 and 450 °C) and two strain rates (0.1 and 1.0 s−1) were used. The compression process in the first pass ended when the compression deformation reached 35%. Then, compression continued at 35% until the compression process was finished. The delay times during interrupted compression varied between 5 s, 30 s, and 60 s. The samples were quenched immediately after the tests. The entire test process is shown in Figure 2.
Samples compressed using different deformation parameters were cut along the compressed direction, mounted, polished, and anode-coated using a fluoroboric acid solution (10 mL fluoroboric acid in 400 mL water) for 60 s at 20 V. The microstructure of the specimens was observed by optical microscopy.
3. Results and Discussion
3.1. Static Softening Behavior of 5754 Aluminium Alloy
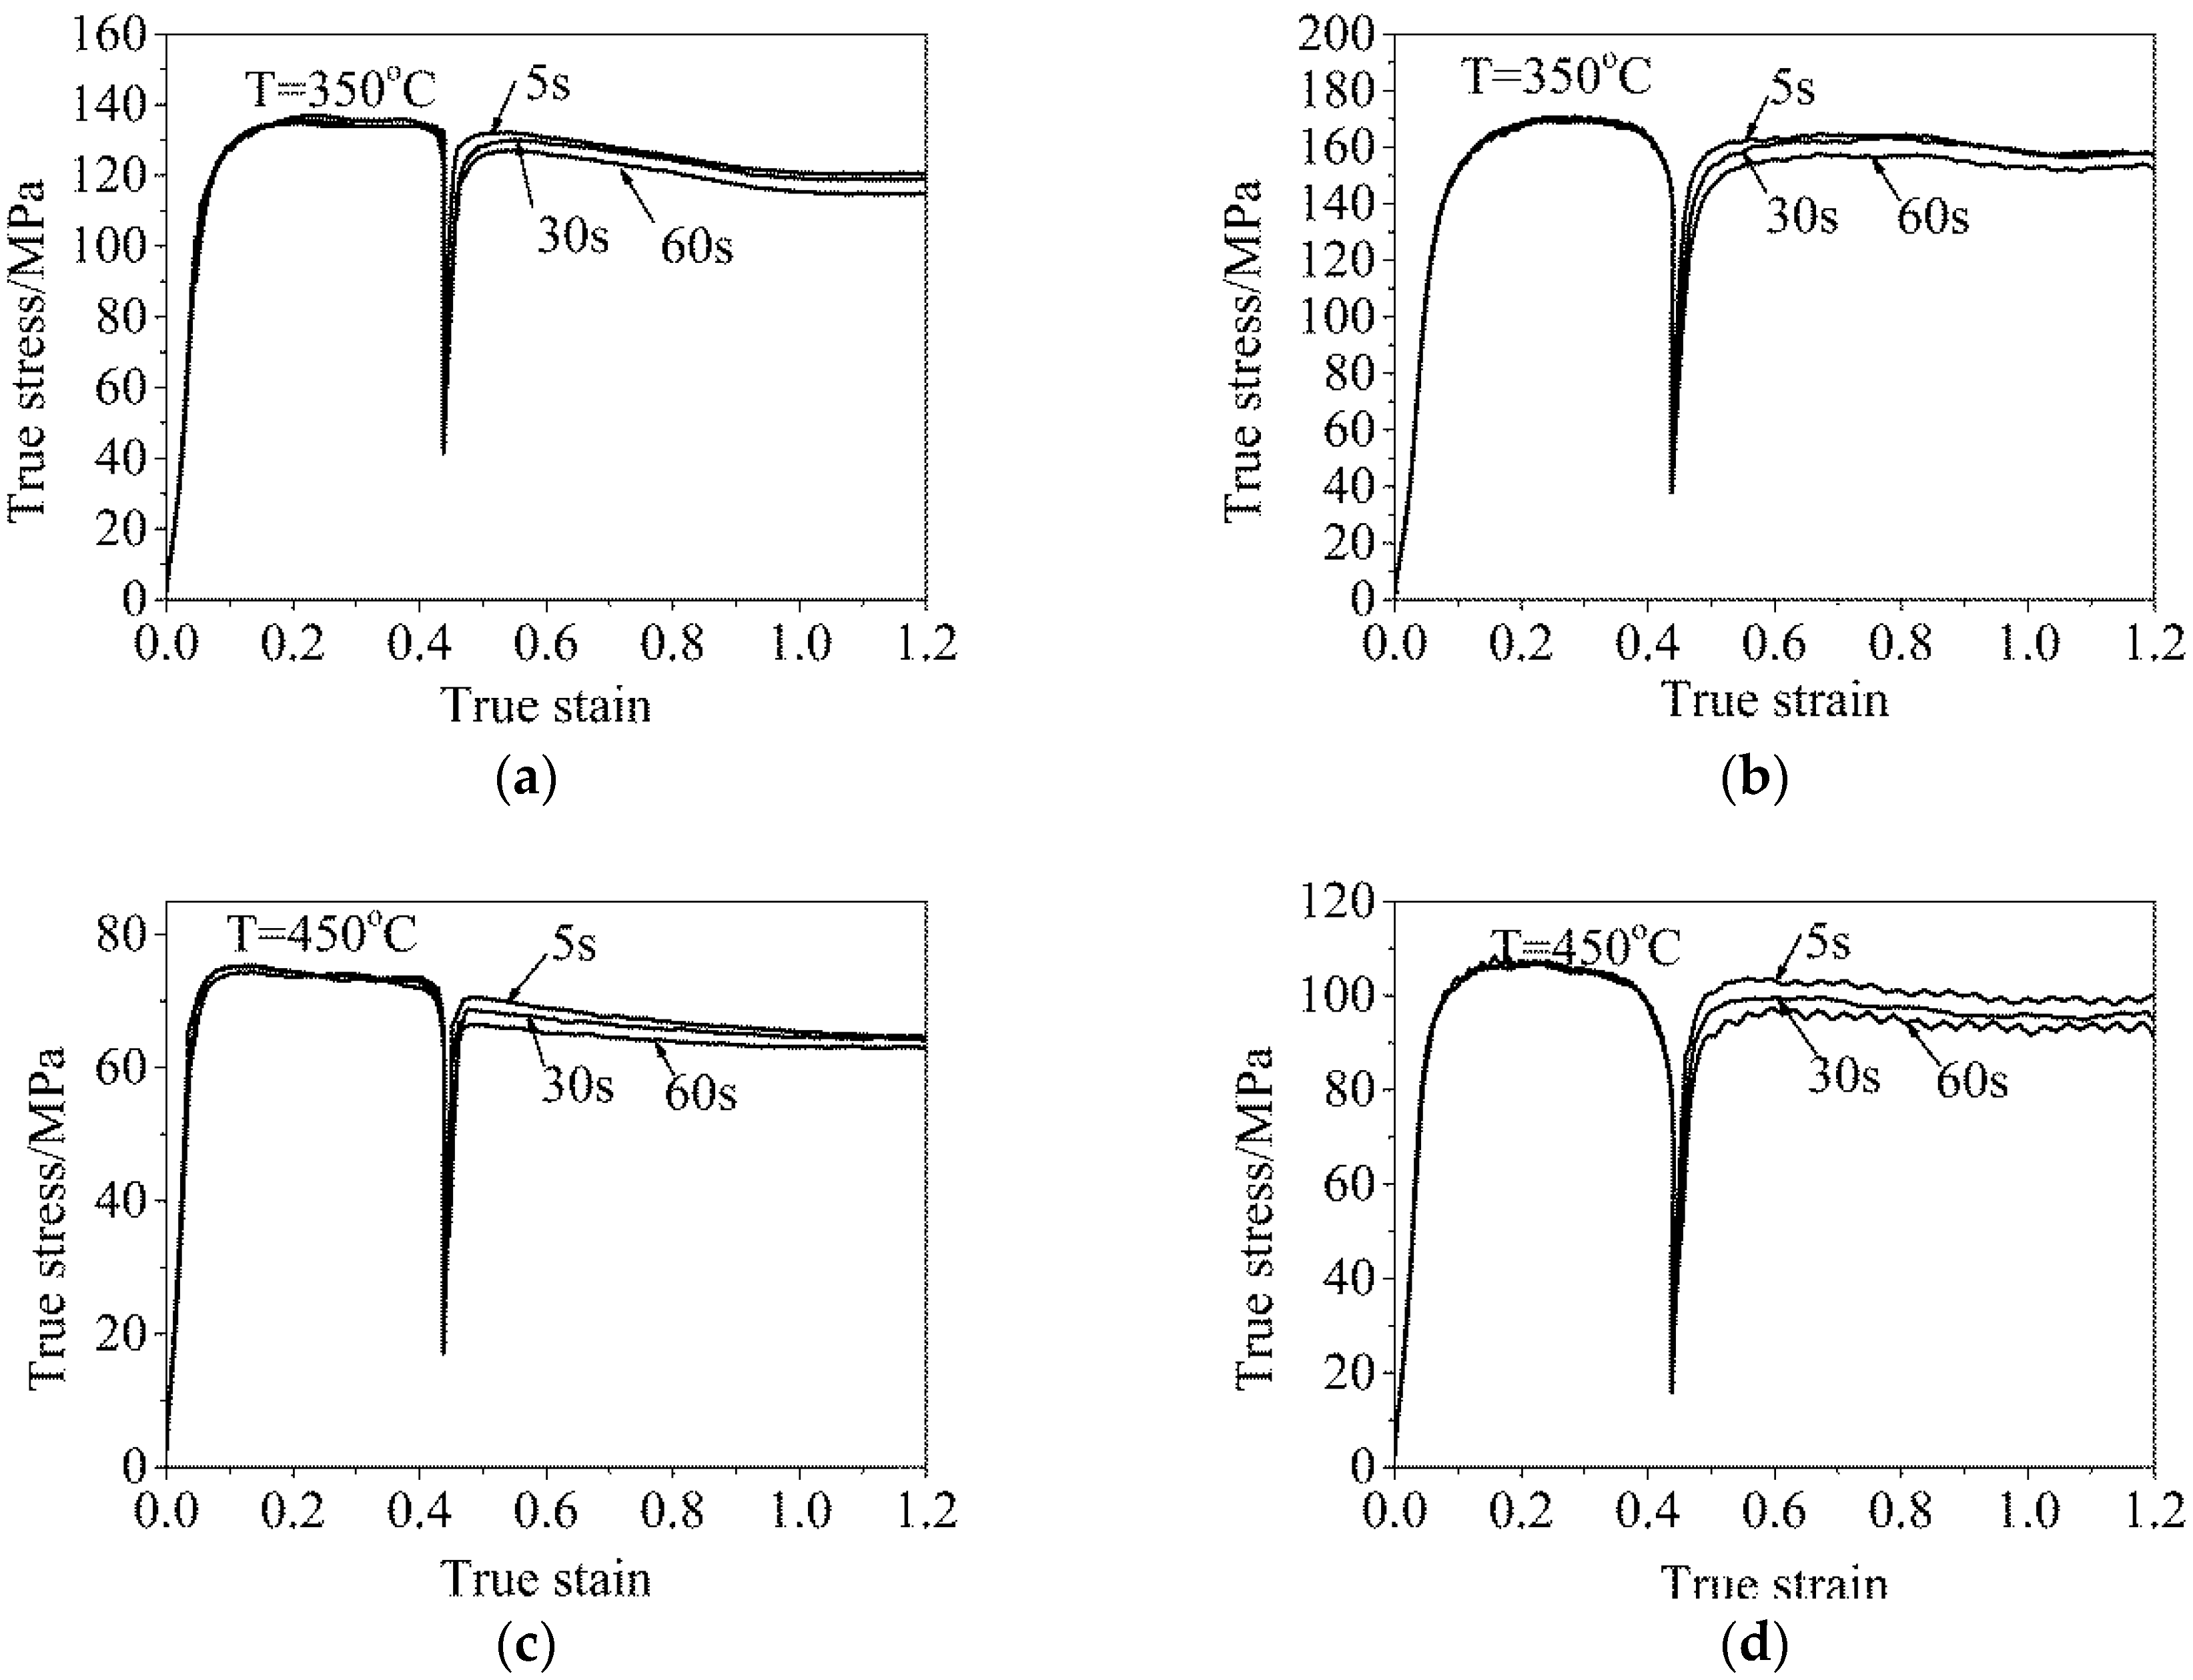
The flow curves used to study the static softening mechanism of the hot rolling process were obtained from double-pass isothermal compression tests that were conducted for various time intervals and deformation conditions. As shown in Figure 3, the flow curves from the first pass under the same deformation conditions are almost identical and are controlled by work hardening (WH) and dynamic recovery (DRV) as described in Reference [3]. Although the dynamic softening mechanism during the second pass is similar to the first pass, the flow curves of the second pass show a significant difference for various time intervals. Due to the static softening effect, the flow stress decreases as the delay time increases. In addition, it can be seen from Figure 3d that the 5754 aluminium alloy exhibits a typical Portevin-Le Chatelier (PLC) effect at the deformation temperature of 450 °C and strain rate of 1.0 s−1. The stress-strain curves are characterized by the hopping type B bands at the delay time of 5 s and 60 s. The sawteeth oscillates between the upper and lower envelope curves of the stress, and the drop amplitude and density are not large. The feature of the hopping type B bands typically occurs at intermediate strain rates and temperatures. The most recognized microscopic mechanism of the PLC effect is dynamic strain aging, which is the dynamic interaction of solute atoms with movable dislocations. More details about the PLC effect of the aluminium alloy can be found in reference [28,29].
To quantify the static softening fraction () during double pass compression, the 0.2% offset-stress method [30] was employed as follows:
where is the flow stress before unloading during the first pass, and and are the yield stresses for the first pass and second pass, respectively.
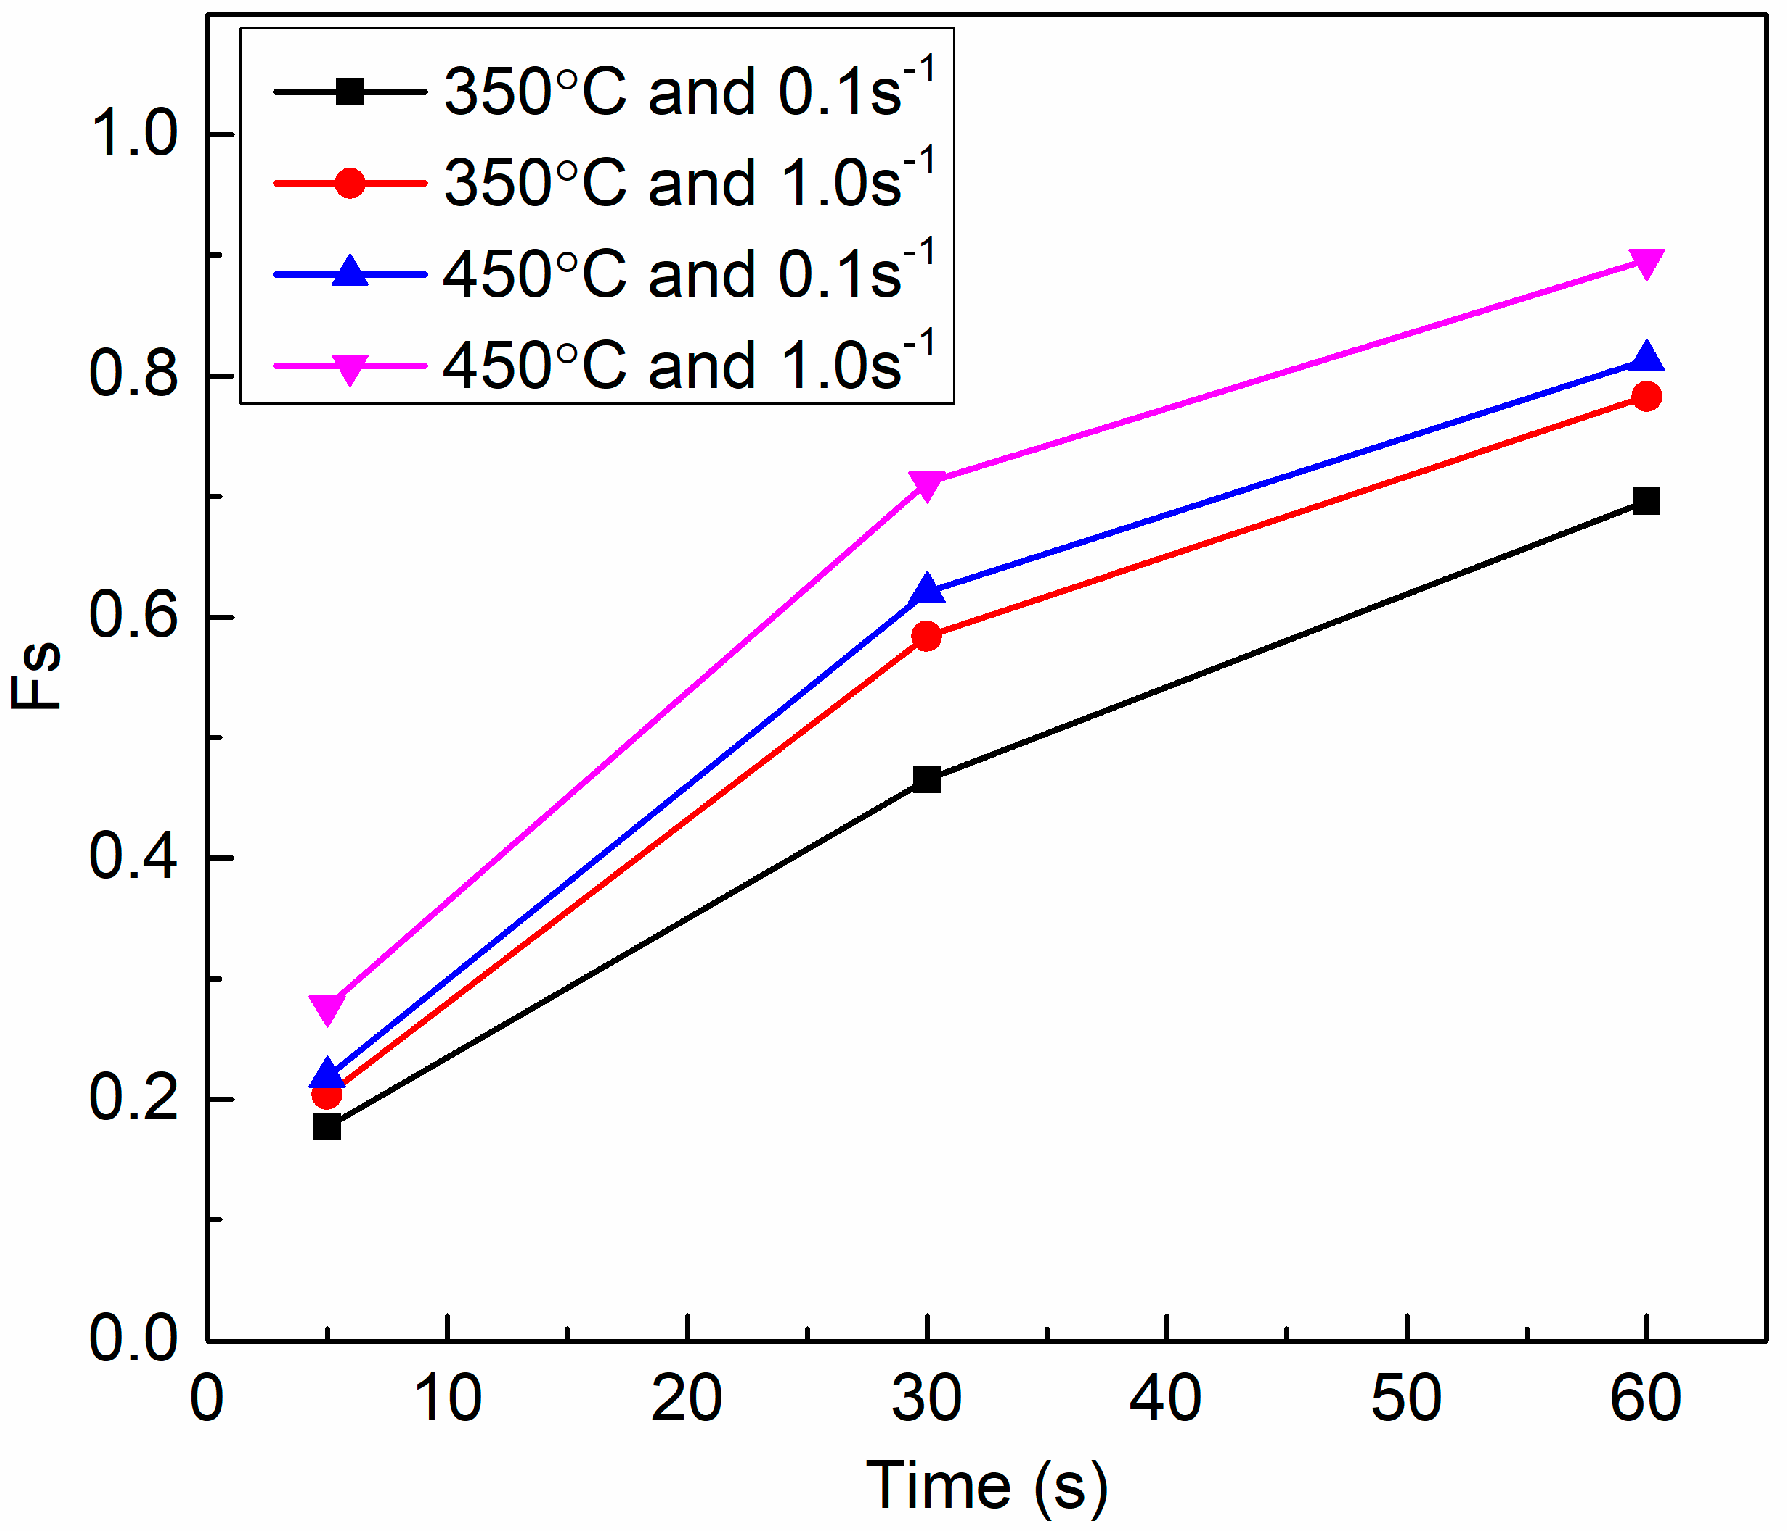
Figure 4 shows the calculated softening fraction. The fraction quickly increases as the delay time increases. However, the growth rate of the softening fraction decreases gradually as the delay time increases. The nucleation and growth of SRX absorb a large number of dislocations generated during the deformation stage, which is the main reason for the softening fraction increasing with the increasing delay time. Then, the driving force for SRX decreases with the increasing delay time due to the decreasing of dislocation density. Thus, the growth rate of SRX decreases as the time increases.
As shown in Figure 4, the static softening fraction increases as the strain rate increases under the specific deformation temperature (350 or 450 °C) and delay time. At the deformation stage, the dislocation is easier to accumulate at high strain rates, which increase the driving force for the static softening fraction. Besides, the static softening fraction increases as the temperature increases due to the rapid SRX at high temperature. However, when the temperature is 350 °C and the delay time is 60 s, the growth rate of the softening fraction tends to zero, which indicates that SRX occurs incompletely. The static softening mechanisms are thermally activated processes. High temperatures can promote nucleation and lead to high grain boundary mobility.
3.2. SRX Kinetic Model of 5754 Aluminium Alloy
The Avrami equation can be employed to describe the SRX kinetics of 5754 aluminium alloy [31,32], as follows:
where is the softening fraction calculated in Section 3.1, assuming that represents the percentage of SRX, is delay time, is the material constant, and is the time taken to achieve a 50% static softening fraction. The term is calculated as follows:
where and are the material constants, is the activity energy for SRX (), is the gas constant (8.31 ), is the strain rate (s−1), and is the absolute deformation temperature ().
Equation (4) is obtained by taking the logarithm twice on both sides of Equation (2).
By substituting and into Equation (4), the value of n (n = 0.755) can be calculated from the mean slope of the lines in Figure 5 by linear regression of and .
The value of can be deduced from the relationship between and . The following equation can be obtained by taking the logarithm of both sides of Equation (3).
The value of , and can be obtained by substituting the known parameters of , , , and . Finally, multiple linear regression is used to solve the coefficients of the equation.
Hence, the static recrystallization kinetic model of 5754 aluminium alloy during the multi-pass can be obtained as follows:
3.3. The Simulation of Static Recrystallization of 5754 Aluminium Alloy
3.3.1. Deformation-Stored Energy
The stored energy caused by the previous pass is an important factor in the occurrence of SRX. The stored energy () can be expressed based on the density of dislocations during hot working of the material as:
where is 0.5, and are the shear modulus and Burgers vector respectively, and represents the change in dislocation density. The dislocation density is often expressed as follows:
where is the flow stress, and the meaning of the remaining variables is described above. Equation (10) can be derived by combining Equations (8) and (9).
where and are the flow stress before unloading and the yield stress, respectively.
3.3.2. Nucleation Model for Static Recrystallization
Static recrystallization involves both nucleation and growth processes. The nucleation rate is closely related to the deformation stored energy of the previous deformation. Therefore, the value of the nucleation rate can be obtained from Equation (11), as described by Reference [33].
where and are materials parameters, is the stored energy produced by the previous deformation, and is the critical energy of static recrystallization. and are calculated by Equation (12).
3.3.3. Grain Growth Model
The growth of crystal nuclei is the result of grain boundary movement. The driving pressure and grain boundary mobility are the main factors affecting the speed of grain boundary movement (), and can be expressed as follows [34]:
where is the driving pressure, and is the grain boundary mobility, which is mainly affected by temperature and can be expressed as follows:
where , , , , are the grain boundary self-diffusion constant, grain boundary thickness, Burgers vector, Boltzmann constant, and thermal activation energy, respectively. More details about grain boundary movement velocity (), grain boundary mobility (), and related parameters can be found in reference [35,36]. The driving pressure at the grain boundary is mainly provided by the stored energy ( as expressed by Equation (10)) and the grain boundary energy (). Hence, the driving pressure can be determined by Equation (15).
The grain boundary energy is as follows:
where is the grain surface energy, which is expressed by Equation (17) [13], and is the grain boundary curvature, which is expressed by Equation (19).
where is the grain boundary misorientation, is the low-angle grain boundary misorientation, and is high-angle grain boundary energy, which is described as follows:
where is the Poisson ratio, and the remaining variables are described above.
where is the topological constant ( = 1.28). is the cell size (2 ). is the number of the nearest and second nearest neighboring cell (N = 24). is the number of cells in the neighborhood of grain . [37] is the number of cells in the neighborhood of grain (where = 15 for a flat interface). The material and physical constants for 5754 aluminium alloy are listed in Table 2 and Table 3.
3.4. The Construction of CA Model
CA is a method that can simulate a physical system for discrete time and space intervals [38]. The space consists of a finite number of cells with a specific shape. Each cell has a corresponding state variable that describes its physical behaviour. The state of the cell at each subsequent time step is determined by the CA’s transition rule. The discrete time interval () is determined by the Equation (20).
where is the dislocation line energy (). The meaning of other variables is the same as Equations (8)–(10), (13), and (19).
In the present study, the simulation space is divided into a 500 × 500 grid of square cells. Each cell is 2 and consists of a square grid. The state variables applied to cells include dislocation density, grain orientation, recrystallization grain number, and moving distance. The dislocation density variable is applied to calculate the stored energy, the grain orientation variable is applied to determine the grain boundary energy, and the recrystallization grain number is used to determine the recrystallization fraction. Values of 0 and >0 are used to indicate primary grains and recrystallized grains, respectively. The number of recrystallized grains is greater than zero. The moving distance is used to count the total distance of movement along a grain boundary. The specimen had an average initial grain size of 95 .
In the simulation of nucleation, it is assumed that the nucleation of static recrystallization occurs mainly on high-angle grain boundaries. The probability of nucleation in each cell within a unit of time () can be calculated by Equation (21).
where is the nucleation rate, is the unit cell area and is the discrete time interval (in maximum migration speed). When the random number (0~1) generated by system is less than , then the boundary cell is converted into a recrystallized nucleus.
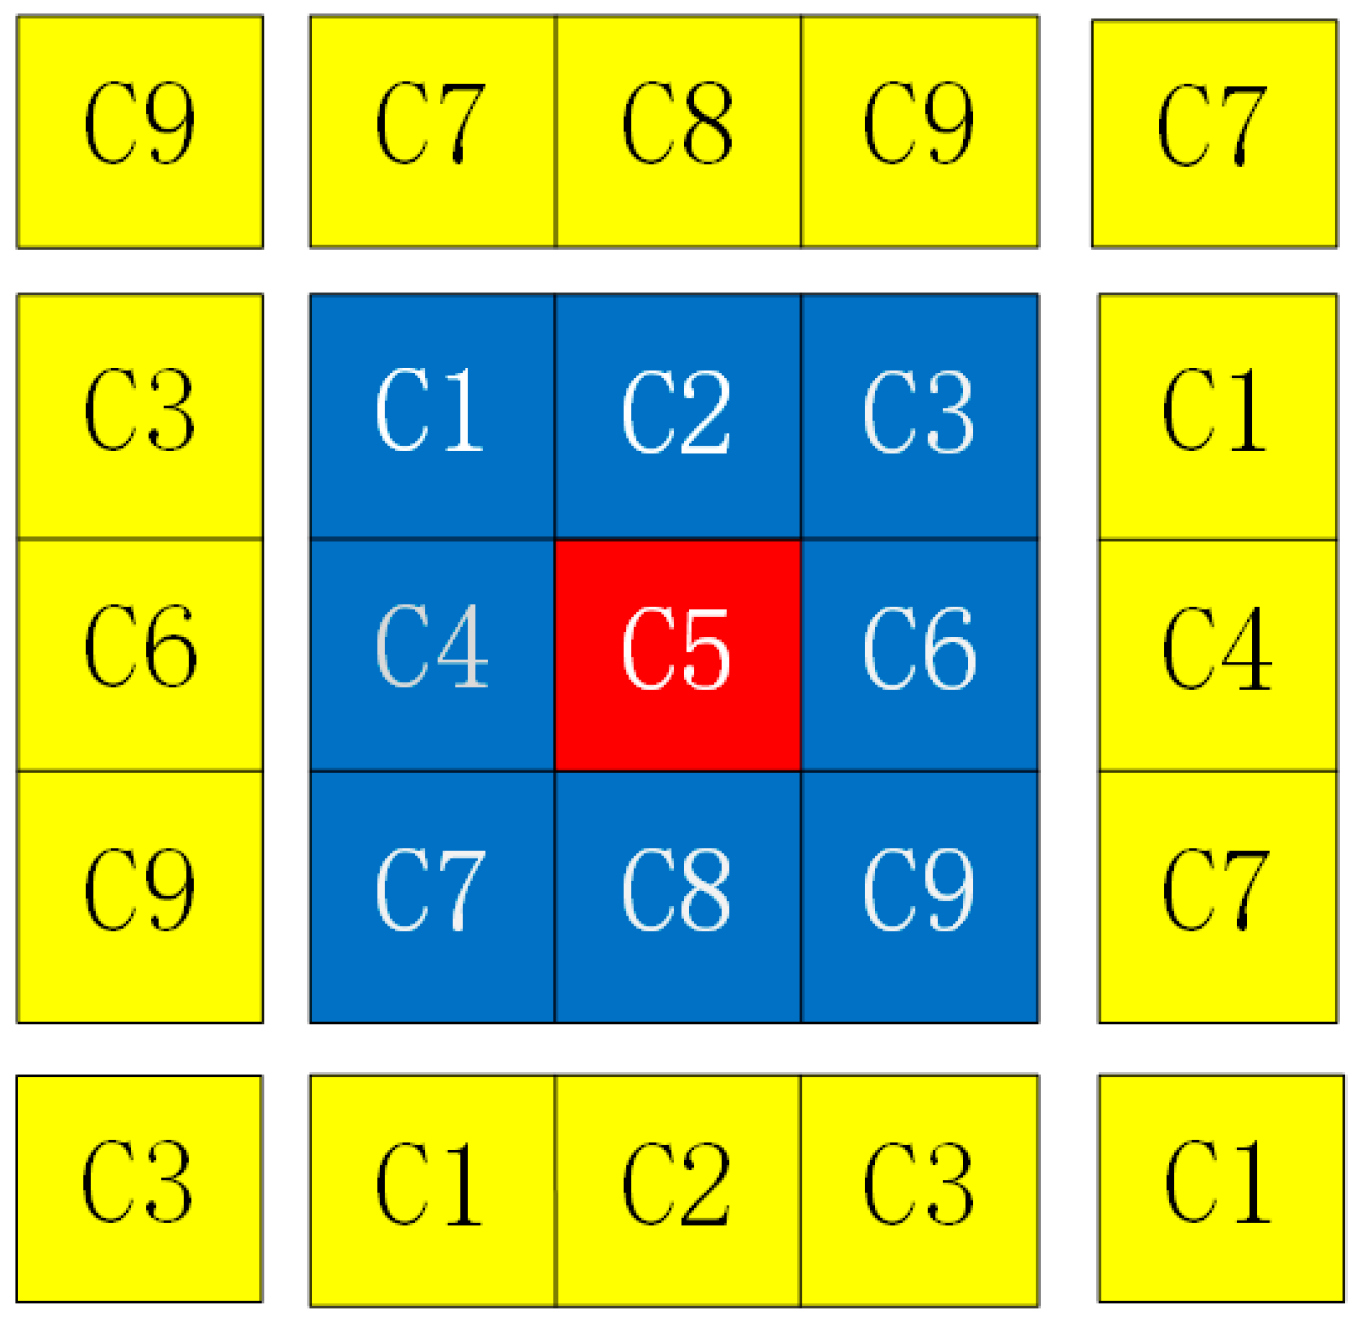
In this paper, the Moore neighbors and periodic boundary conditions are adopted (Figure 6). Each cell has eight neighbors. The grain growth follows the following three rules:
1. The cell is not a recrystallized grain, and there are recrystallized grains in the neighbors;
2. The random number generated by system is greater than the random transition probability, , of each cell;
where represents the number of recrystallized grains in the neighborhood, and is the total number of neighbors ( = 8).
3. The driving pressure is greater than zero, and the grain boundary migration distance is larger than the cell size, , ().
where is the speed of grain boundary movement, which can be calculated by Equation (13).
4. Simulation Results of the CA Model
4.1. The Initial Microstructure
The initial microstructure with the specified mean grain size and equiaxed grain structure was generated by running the CA model for the condition of homogeneous recrystallization with site-saturated nucleation, as shown in Figure 7.
4.2. Deformation Temperature Effect
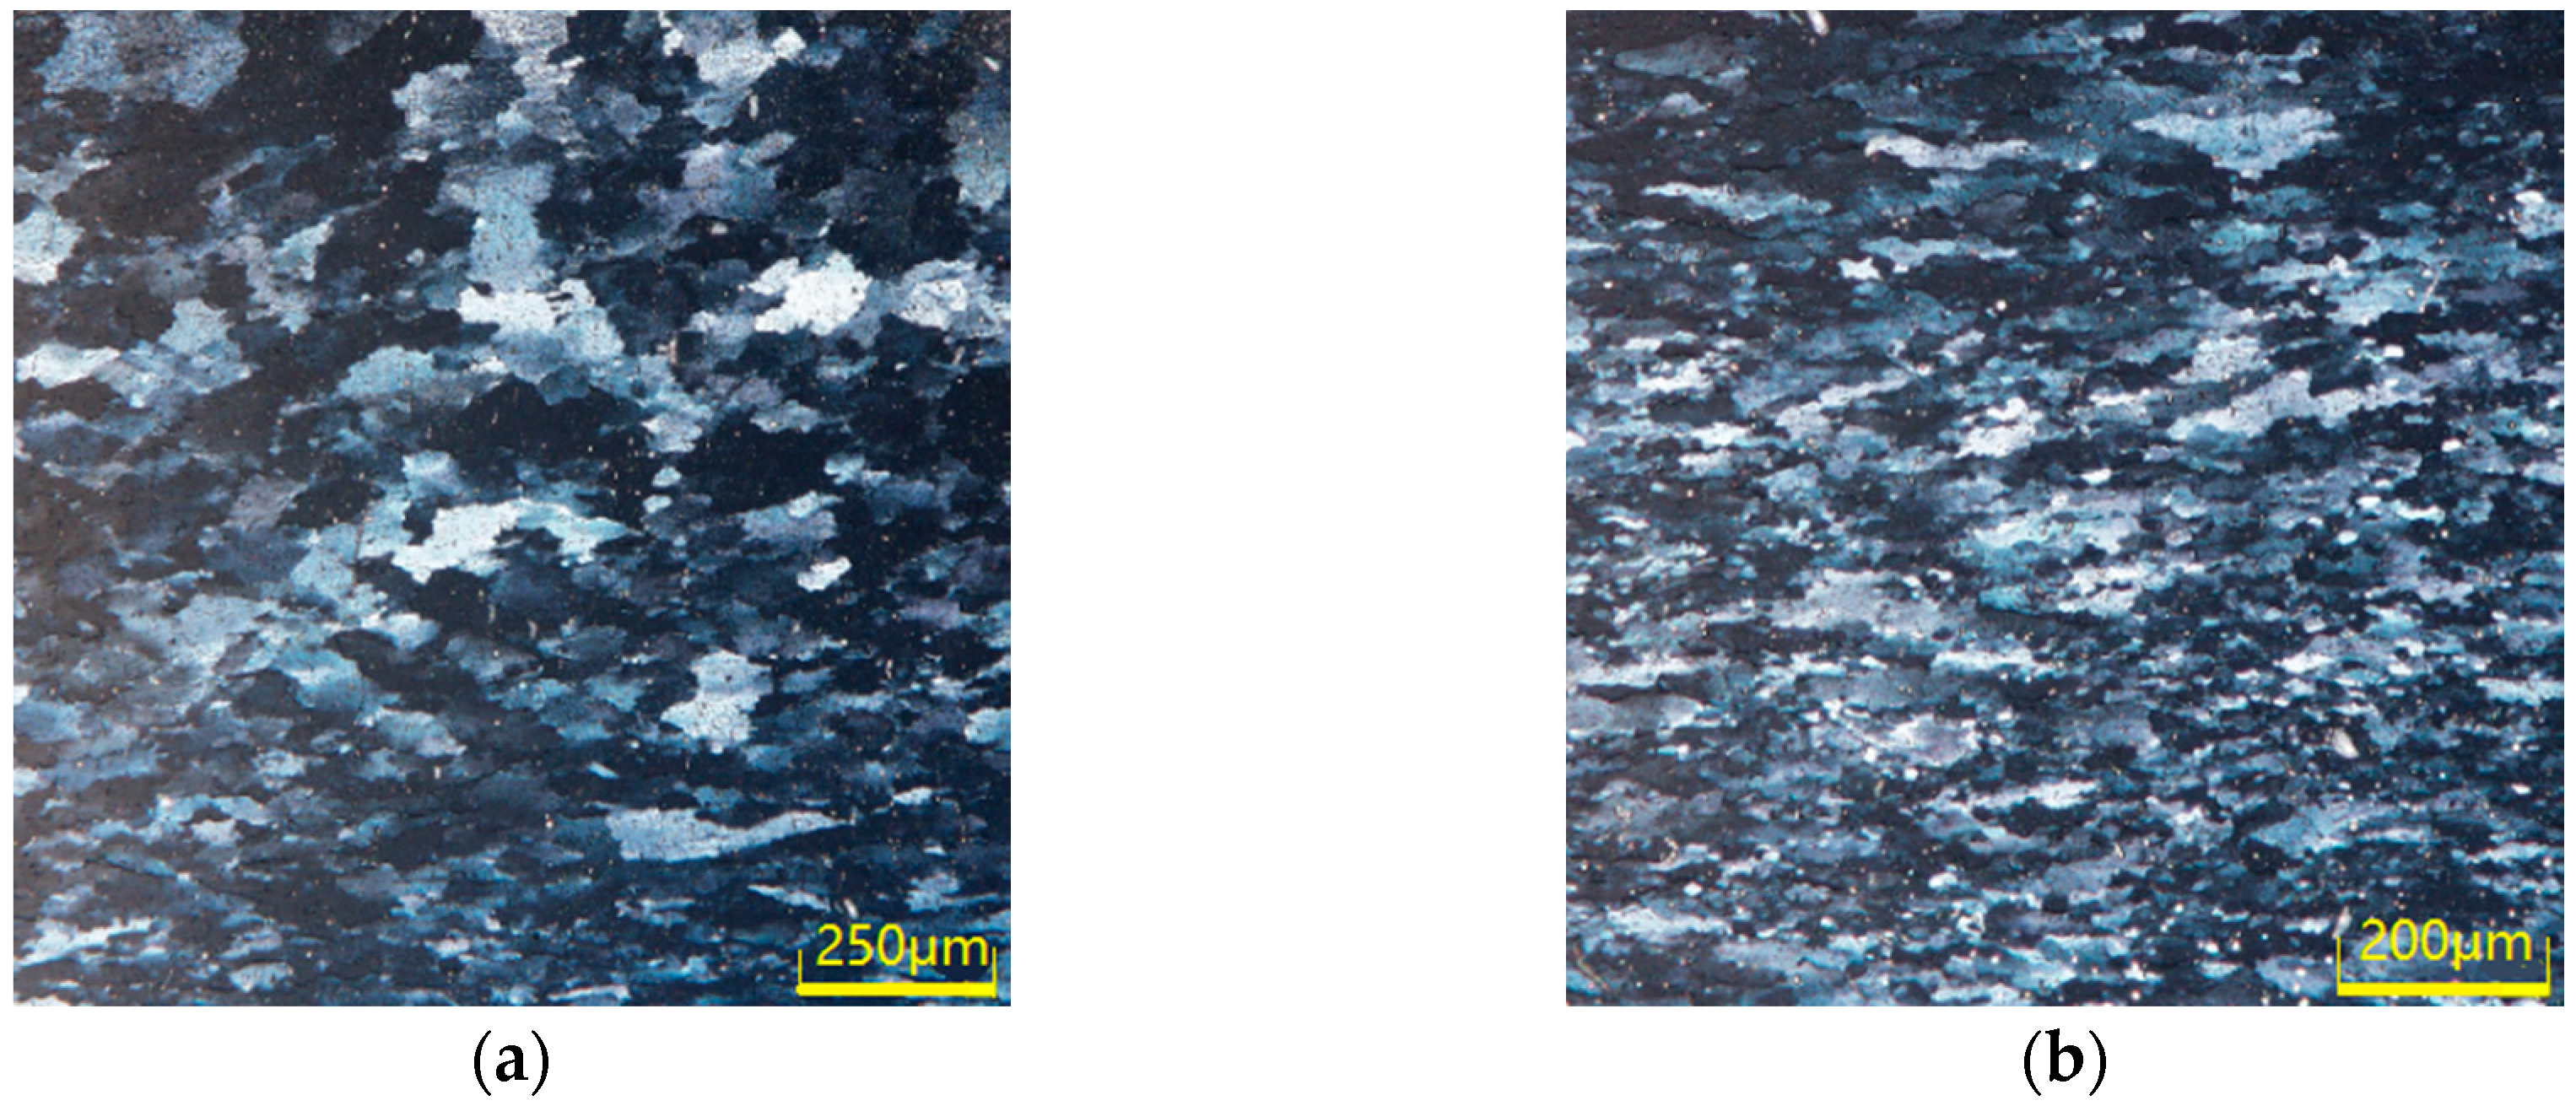
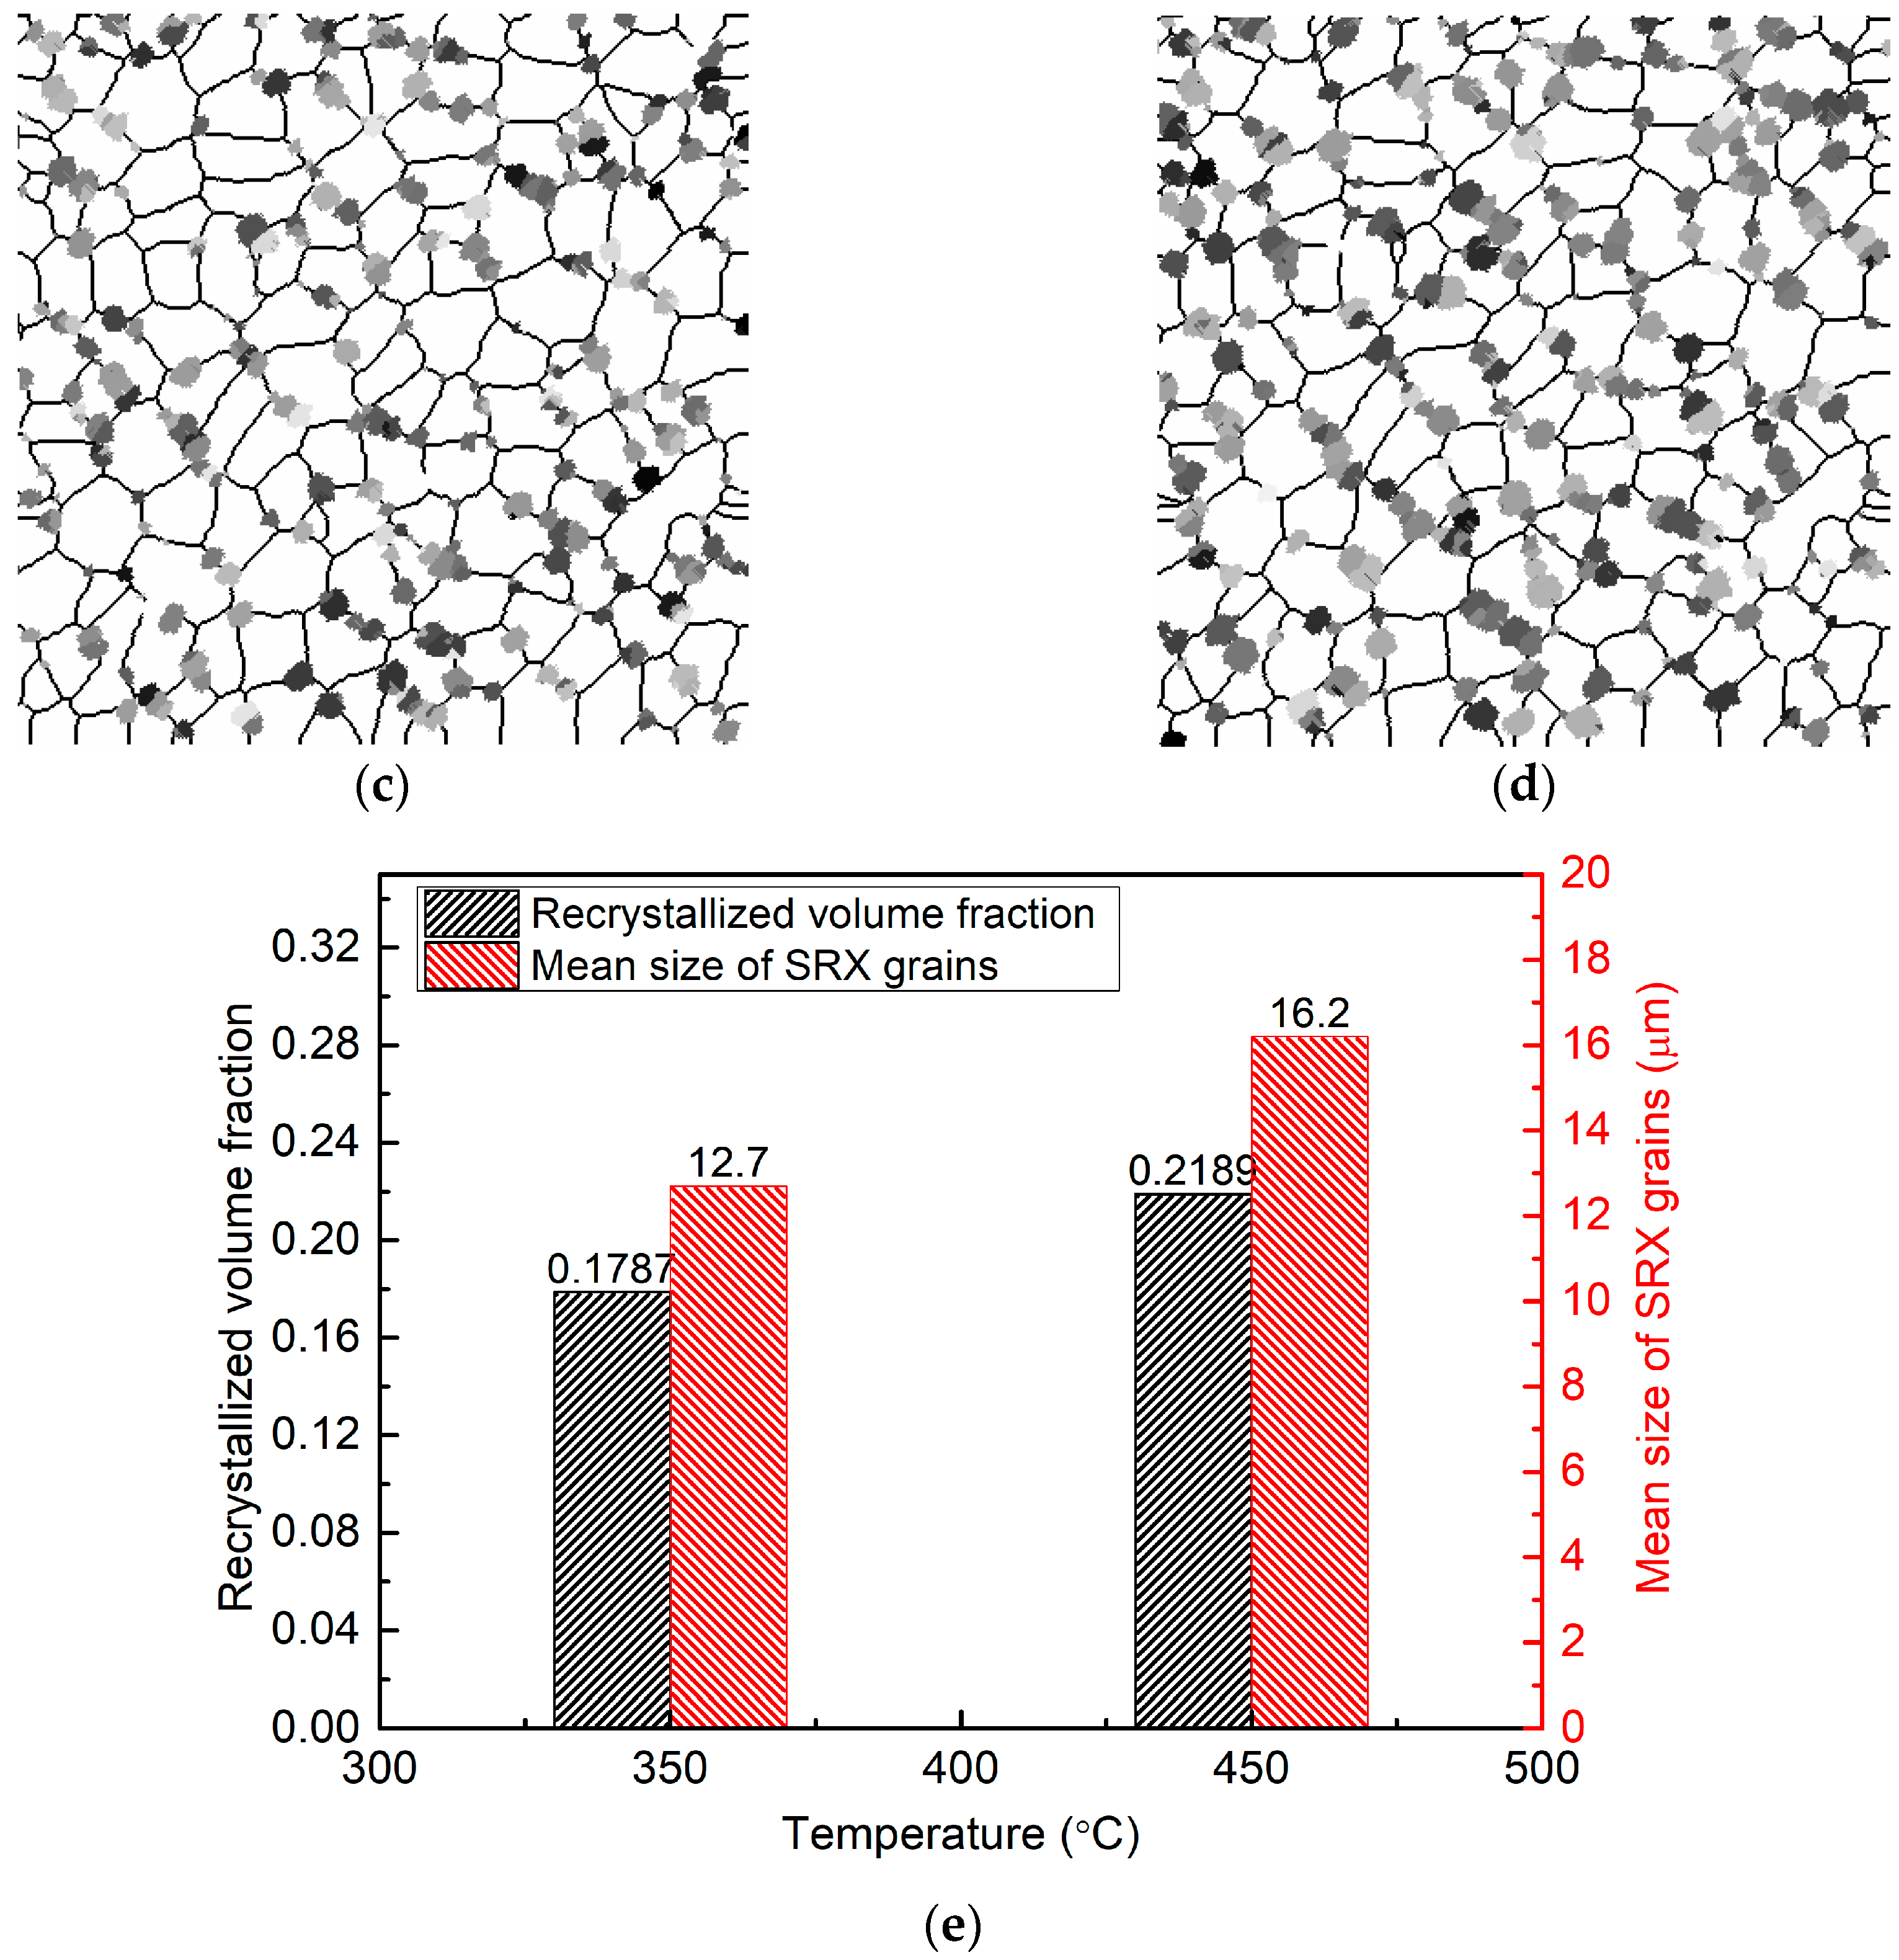
The simulation results of microstructures developed at different temperatures at the strain rate of 0.1 s–1, the strain of 0.35 and a delay time of 5 s are given in Figure 8. White areas are the initial grains, while dark areas represent the SRX grains as shown in Figure 8c,d. Obviously, the SRX nucleation first appeared on grain boundaries because of the high energy in this location. It can be concluded from Figure 8c,d that temperature provides the necessary energy for nucleation and grain growth, and the recrystallized volume fraction and the mean size of recrystallized grains are increased as the temperature increases. The recrystallized volume fraction is 17.87% at 350 °C and 21.89% at 450 °C, and the mean size of SRX grains also increases from 12.70 to 16.20 as shown in Figure 8e. When the deformation temperature is high, the activity of dislocation increases, which provides a sufficient driving force to initiate SRX. In addition, a high deformation temperature enhances the thermal activation of atoms in the alloy for the progress of nucleation, which can effectively promote the development of SRX and greatly increase the recrystallized volume fraction. Meanwhile, high temperatures alter the state of the inside microstructure of the alloy by promoting the solubility of trace elements in the matrix, thereby reducing the inhibition caused by precipitation during the SRX, and increasing grain boundary mobility at the same time. Therefore, the growth of recrystallized grains will increase, and the grains will become larger.
4.3. Strain Rate Effect
The simulation results for microstructures formed at various strain rates and a constant deformation temperature (450 °C), constant strain (0.35), and constant delay time (60 s) are shown in Figure 9. The results show that the recrystallized volume fraction increases with increasing strain rate and yields 80.07% at 0.1 s−1 and 86.06% at 1 s−1. However, the average grain size is slightly reduced with increasing strain rate and is 62.50 at 0.1 s−1 and 45.45 at 1 s−1. During the hot deformation test, the dislocation density increases rapidly with an increasing strain rate, and a great quantity of deformation energy for recrystallization nucleation and grain growth is generated, which increases the recrystallized volume fraction. However, too much nucleation inhibits the growth of grains, and as a result, the average grain size decreases slightly. Therefore, improving the strain rate is propitious for increasing the volume fraction and size of recrystallized grains.
4.4. Delay Time Effect
The evolution of SRX and the change in the recrystallized volume fraction at different delay times at a temperature of 450 °C and strain rate of 0.1 s−1 are shown in Figure 10. Obviously, the recrystallized volume fraction and the recrystallized grain size increase with the increasing delay time, but the rate of increase gradually decreases. The recrystallized volume fraction is 21.89% at 5 s and 80.07% at 60 s, while the mean size of recrystallized grains also increases from 16.20 to 62.50 . Longer delay times provide sufficient time for the growth of recrystallization of grains. However, the process of grain growth is often accompanied by a reduction in energy. As the driving force of grain growth, the dislocation difference is gradually reduced to zero during the SRX, resulting in a gradual decrease in the rate of increase.
4.5. Validation of the CA Model
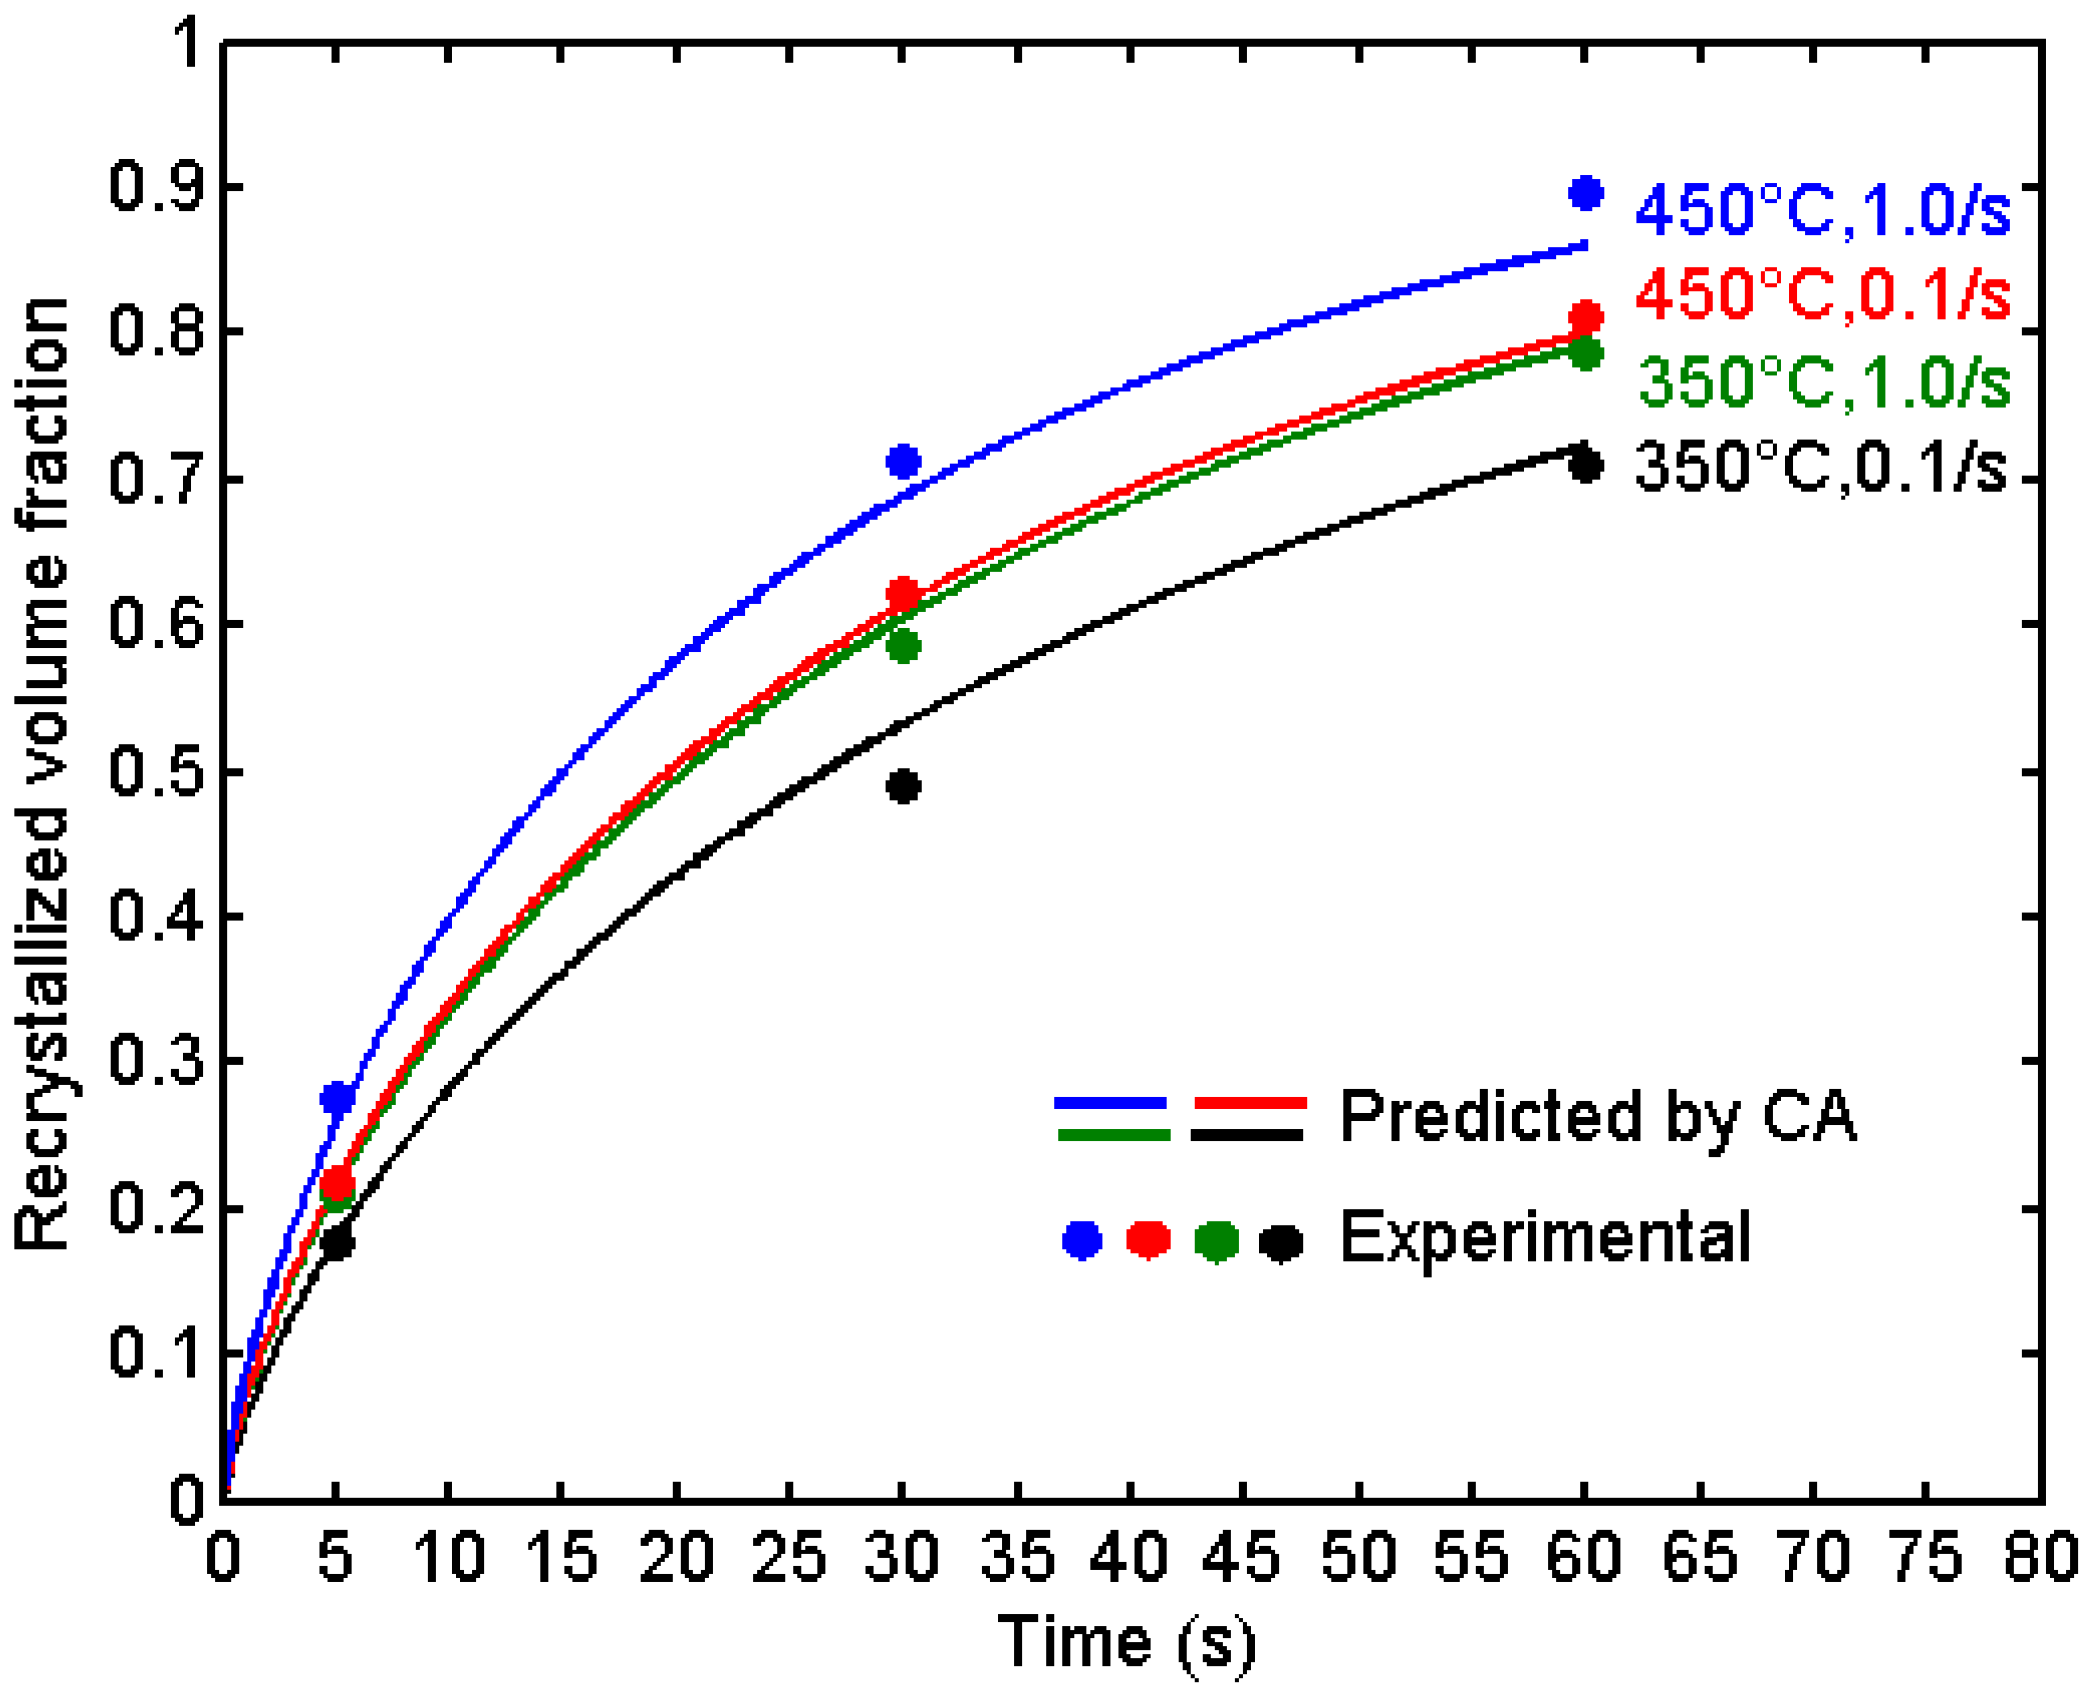
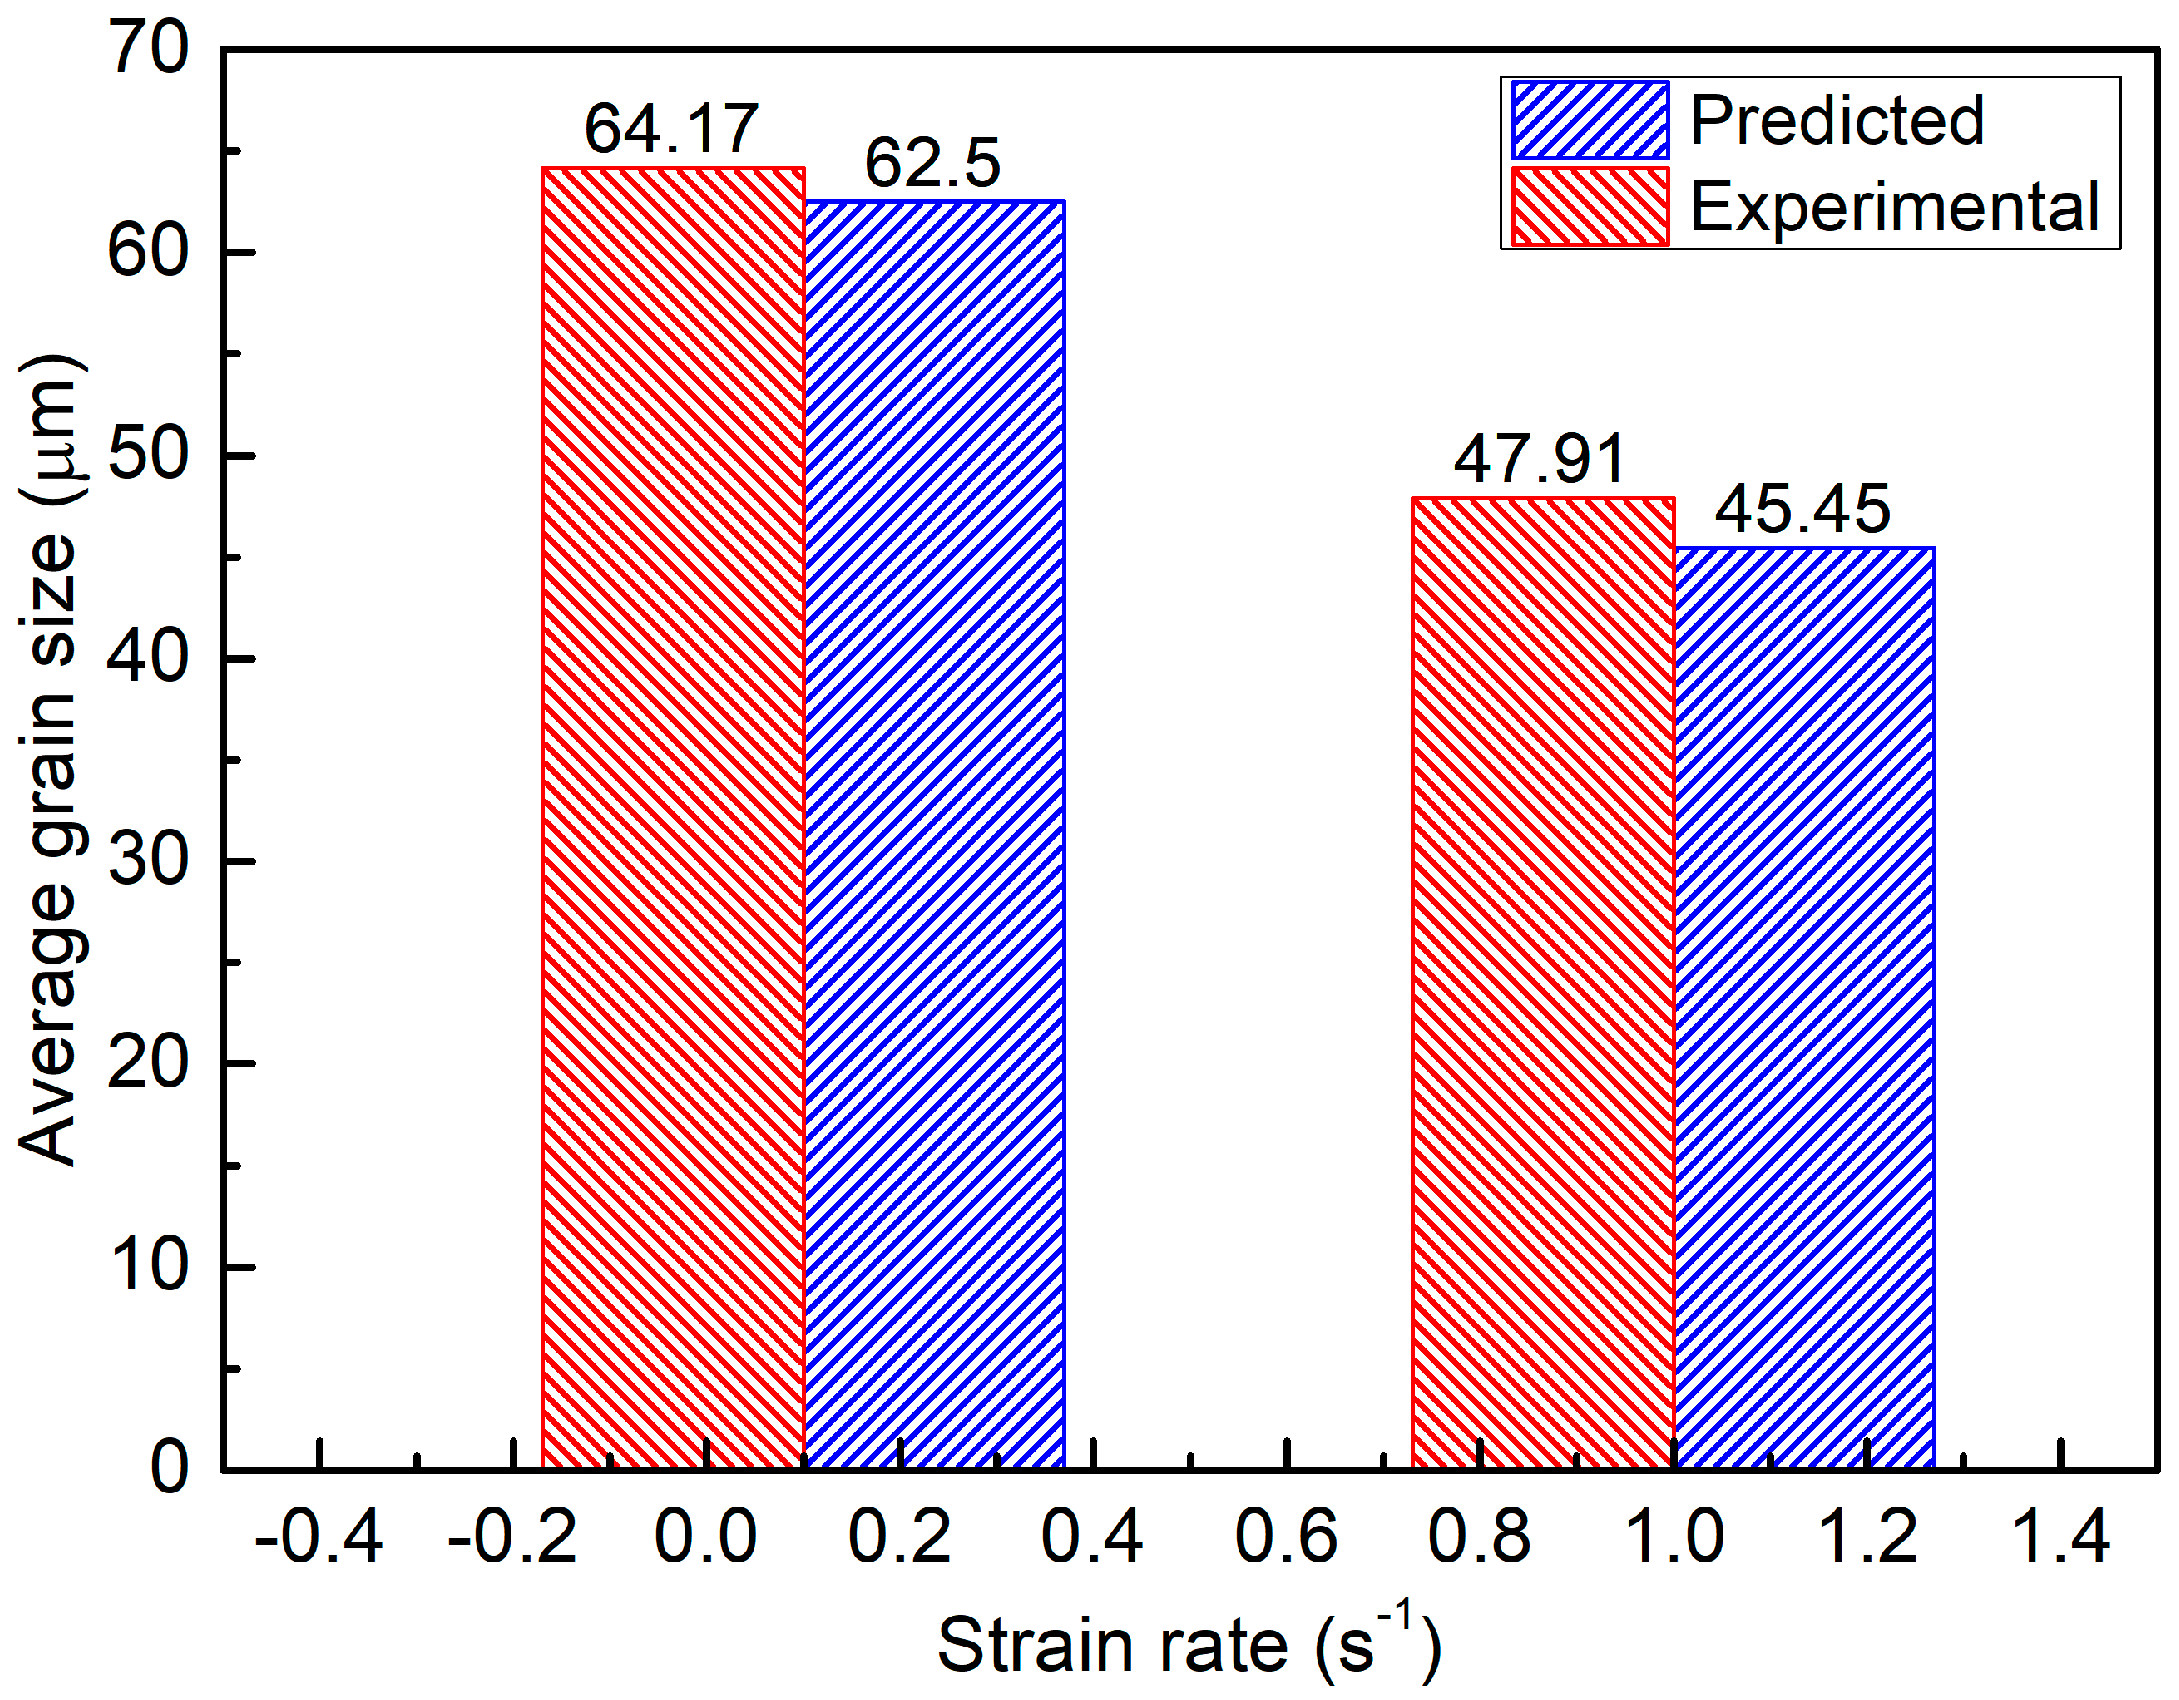
The average grain size of the CA model and the test material at a temperature of 450 °C and strain rates of 0.1–1 s−1 are shown in Table 4. The recrystallized volume fraction and average grain size of the test material and CA model at different deformation temperatures, strain rates and delay times are shown in Figure 11 and Figure 12. It can be concluded from these figures that the predicted average grain size and recrystallized volume fraction agree well with the test data.
5. Conclusions
1. Due to the static softening effect, the flow stress was decreased as the delay time and deformation temperature increased. The static softening fraction was analyzed by the 0.2% offset-stress method, and the results showed that the static softening fraction was greatly influenced by the deformation parameters, which increased with increasing deformation time, strain rate, and deformation temperature.
2. The mesoscopic physically based CA models coupled with metallurgical principles were established to predict the microstructural evolution of 5754 aluminium during hot working. In addition, nucleation, grain growth, and SRX kinetic models were also taken into account.
3. The simulated CA shows that the nuclei of SRX were first formed on the grain boundaries as a result of their high energy. In addition, the deformation parameters have a significant influence on the SRX of the 5754 aluminium alloy. The recrystallized volume fraction and the recrystallized mean grain size increased with the increasing deformation temperature and delay time. The recrystallized volume fraction increased with the increase of the strain rate, but the average grain size was slightly reduced.
4. The predicted recrystallized volume fraction and the average grain size agree well with the experimental data. Therefore, the developed CA model is capable of studying microstructure evolution to a greater extent during the pass interval period.
Author Contributions
Changqing Huang conceived and designed the experiments; Xiaodong Jia performed the experiments; Changqing Huang, Xiaodong Jia, and Zhiwu Zhang analyzed the data; Changqing Huang wrote the manuscript, and Xiaodong Jia contributed to the revision of the paper.
Funding
This research was funded by the National Natural Science Foundation of China. The grant number is 51275533.
Acknowledgments
The authors appreciate financial support from the Natural Science Foundation of China under Grant 51275533, and by the State Key Laboratory of High-Performance Complex Manufacturing (Contract No. zzyjkt2013-10B), Central South University, China, and partly by the Academician Workstation Foundation of Yinhai Aluminum Industry Co., LTD., Liuzhou, China.
Conflicts of Interest
The authors declare no conflicts of interest.
References
- Huang, C.Q.; Deng, J.; Wang, S.X.; Liu, L.L. An Investigation on the Softening Mechanism of 5754 Aluminum Alloy during Multistage Hot Deformation. Metals 2017, 7, 107. [Google Scholar] [CrossRef]
- Sang, D.; Li, Y. The Hot Deformation Activation Energy of 7050 Aluminum Alloy under Three Different Deformation Modes. Metals 2016, 6, 49. [Google Scholar] [CrossRef]
- Huang, C.-Q.; Liu, L.-L. Application of the Constitutive Model in Finite Element Simulation: Predicting the Flow Behavior for 5754 Aluminum Alloy during Hot Working. Metals 2017, 7, 331. [Google Scholar]
- Brand, A.J.; Kalz, S.; Kopp, R. Microstructural simulation in hot rolling of aluminium alloys. Comput. Mater. Sci. 1996, 7, 242–246. [Google Scholar] [CrossRef]
- Yanagida, A.; Yanagimoto, J. Formularization of softening fractions and related kinetics for static recrystallization using inverse analysis of double compression test. Mater. Sci. Eng. A 2008, 487, 510–517. [Google Scholar] [CrossRef]
- Llanos, L.; Pereda, B.; Lopez, B.; Rodriguez-Ibabe, J.M. Hot deformation and static softening behavior of vanadium microalloyed high manganese austenitic steels. Mater. Sci. Eng. A 2016, 651, 358–369. [Google Scholar] [CrossRef]
- Jiang, F.; Zhang, H.; Li, L.; Chen, J. The kinetics of dynamic and static softening during multistage hot deformation of 7150 aluminum alloy. Mater. Sci. Eng. A 2012, 552, 269–275. [Google Scholar] [CrossRef]
- Pouraliakbar, H.; Pakbaz, M.; Firooz, S.; Jandaghi, M.R.; Khalaj, G. Study on the dynamic and static softening phenomena in Al-6Mg alloy during two-stage deformation through interrupted hot compression test. Measurement 2016, 77, 50–53. [Google Scholar] [CrossRef]
- Mukhopadhyay, P.; Loeck, M.; Gottstein, G. A cellular operator model for the simulation of static recrystallization. Acta Mater. 2007, 55, 551–564. [Google Scholar] [CrossRef]
- Beygelzimer, Y.E.; Spuskanyuk, A.V. The thick yield surface: Idea and approach for investigating its structure. Philos. Mag. A 1999, 79, 2437–2459. [Google Scholar] [CrossRef]
- Raabe, D. Cellular automata in materials science with particular reference to recrystallization simulation. Annu. Rev. Mater. Res. 2002, 32, 53–76. [Google Scholar] [CrossRef]
- Lin, Y.C.; Liu, Y.X.; Chen, M.S.; Huang, M.H.; Ma, X.; Long, Z.L. Study of static recrystallization behavior in hot deformed Ni-based superalloy using cellular automaton model. Mater. Des. 2016, 99, 107–114. [Google Scholar] [CrossRef]
- Zheng, C.; Xiao, N.; Li, D.; Li, Y. Microstructure prediction of the austenite recrystallization during multi-pass steel strip hot rolling: A cellular automaton modeling. Comput. Mater. Sci. 2009, 44, 507–514. [Google Scholar] [CrossRef]
- Kugler, G.; Turk, R. Study of the influence of initial microstructure topology on the kinetics of static recrystallization using a cellular automata model. Comput. Mater. Sci. 2006, 37, 284–291. [Google Scholar] [CrossRef]
- Salehi, M.S.; Serajzadeh, S. Simulation of static recrystallization in non-isothermal annealing using a coupled cellular automata and finite element model. Comput. Mater. Sci. 2012, 53, 145–152. [Google Scholar] [CrossRef]
- Zhang, Y.; Jiang, S.; Hu, L.; Zhao, Y.; Sun, D. Investigation on primary static recrystallization in NiTiFe shape memory alloy subjected to cold canning compression by coupling crystal plasticity finite element method with cellular automaton. Model. Simul. Mater. Sci. Eng. 2017, 25. [Google Scholar] [CrossRef]
- Sitko, M.; Pietrzyk, M.; Madej, L. Time and length scale issues in numerical modelling of dynamic recrystallization based on the multi space cellular automata method. J. Comput. Sci. 2016, 16, 98–113. [Google Scholar] [CrossRef]
- Chen, M.S.; Yuan, W.Q.; Li, H.B.; Zou, Z.H. Modeling and simulation of dynamic recrystallization behaviors of magnesium alloy AZ31B using cellular automaton method. Comput. Mater. Sci. 2017, 136, 163–172. [Google Scholar] [CrossRef]
- Wang, L.; Fang, G.; Qian, L. Modeling of Dynamic Recrystallization of Magnesium Alloy using Cellular Automata Considering Initial Topology of Grains. Mater. Sci. Eng. A 2017, 711, 268–283. [Google Scholar] [CrossRef]
- Azarbarmas, M.; Aghaie-Khafri, M. A New Cellular Automaton Method Coupled with a Rate-dependent (CARD) Model for Predicting Dynamic Recrystallization Behavior. Metall. Mater. Trans. A 2018, 49, 1916–1930. [Google Scholar] [CrossRef]
- Li, X.; Li, X.; Zhou, H.; Zhou, X.; Li, F.; Liu, Q. Simulation of dynamic recrystallization in AZ80 magnesium alloy using cellular automaton. Comput. Mater. Sci. 2017, 140, 95–104. [Google Scholar] [CrossRef]
- Chen, M.S.; Yuan, W.Q.; Lin, Y.C.; Li, H.B.; Zou, Z.H. Modeling and simulation of dynamic recrystallization behavior for 42CrMo steel by an extended cellular automaton method. Vacuum 2017, 146, 142–151. [Google Scholar] [CrossRef]
- Zheng, B.; Ertorer, O.; Li, Y.; Zhou, Y.; Mathaudhu, S.N.; Tsao, C.Y.A.; Lavernia, E.J. High strength, nano-structured Mg-Al-Zn alloy. Mater. Sci. Eng. A 2011, 528, 2180–2191. [Google Scholar] [CrossRef]
- Filatov, Y.A.; Yelagin, V.I.; Zakharov, V.V. New Al-Mg-Sc alloys. Mater. Sci. Eng. A 2000, 280, 97–101. [Google Scholar] [CrossRef]
- Matsuda, K.; Ikeno, S.; Terayama, K.; Matsui, H.; Sato, T.; Uetani, Y. Comparison of precipitates between excess Si-type and balanced-type Al-Mg-Si alloys during continuous heating. Metall. Mater. Trans. A 2005, 36, 2007–2012. [Google Scholar] [CrossRef]
- Lohmar, J.; Bambach, M.; Hirt, G. Comparison of Semi-empirical and Dislocation Density based Material Equations for Fast Modeling of Multistage Hot Working of Steel. Procedia Eng. 2014, 81, 268–273. [Google Scholar] [CrossRef]
- Jiang, F.; Zhang, H.; Su, J.; Sun, Y. Constitutive characteristics and microstructure evolution of 7150 aluminum alloy during isothermal and non-isothermal multistage hot compression. Mater. Sci. Eng. A 2015, 636, 459–469. [Google Scholar] [CrossRef]
- Zhemchuzhnikova, D.А.; Lebyodkin, M.A.; Lebedkina, T.A.; Kaibyshev, R.O. Unusual behavior of the Portevin-Le Chatelier effect in an AlMg alloy containing precipitates. Mater. Sci. Eng. A 2015, 639, 37–41. [Google Scholar] [CrossRef]
- Ma, P.C.; Zhang, D.; Zhuang, L.Z.; Zhang, J.S. Effect of alloying elements and processing parameters on the Portevin-Le Chatelier effect of Al-Mg alloys. Int. J. Miner. Metall. Mater. 2015, 22, 175–183. [Google Scholar] [CrossRef]
- Fernández, A.I.; López, B.; RodríGuez-Ibabe, J.M. Relationship between the austenite recrystallized fraction and the softening measured from the interrupted torsion test technique. Scr. Mater. 1999, 40, 543–549. [Google Scholar] [CrossRef]
- Sheppard, T.; Duan, X. Modelling of static recrystallisation by combining FEM with empirical models. J. Mater. Process. Technol. 2002, 130, 250–253. [Google Scholar] [CrossRef]
- Toloui, M.; Serajzadeh, S. Modelling recrystallization kinetics during hot rolling of AA5083. J. Mater. Process. Technol. 2007, 184, 345–353. [Google Scholar] [CrossRef]
- Ivasishin, O.M.; Shevchenko, S.V.; Vasiliev, N.L.; Semiatin, S.L. A 3-D Monte-Carlo (Potts) model for recrystallization and grain growth in polycrystalline materials. Mater. Sci. Eng. A 2006, 433, 216–232. [Google Scholar] [CrossRef]
- Hallberg, H.K. Approaches to Modeling of Recrystallization. Metals 2011, 1, 16–48. [Google Scholar] [CrossRef] [Green Version]
- Lee, H.W.; Im, Y.T. Numerical modeling of dynamic recrystallization during nonisothermal hot compression by cellular automata and finite element analysis. Int. J. Mech. Sci. 2010, 52, 1277–1289. [Google Scholar]
- Humphreys, F.J.; Hatherly, M. Recrystallization and Related Annealing Phenomena, 2nd ed.; Elsevier: New York, NY, USA, 2004; pp. 219–224. [Google Scholar]
- Kremeyer, K. Cellular Automata Investigations of Binary Solidification. J. Comput. Phys. 1998, 142, 243–262. [Google Scholar] [CrossRef]
- Ulam, S. Sets, Numbers, and Universes: Selected Works; MIT Press: Cambridge, MA, USA, 1974. [Google Scholar]
Figure 1.
The shapes and sizes of the specimens used for hot compression testing.

Figure 2.
Experimental process for the double pass compression tests.
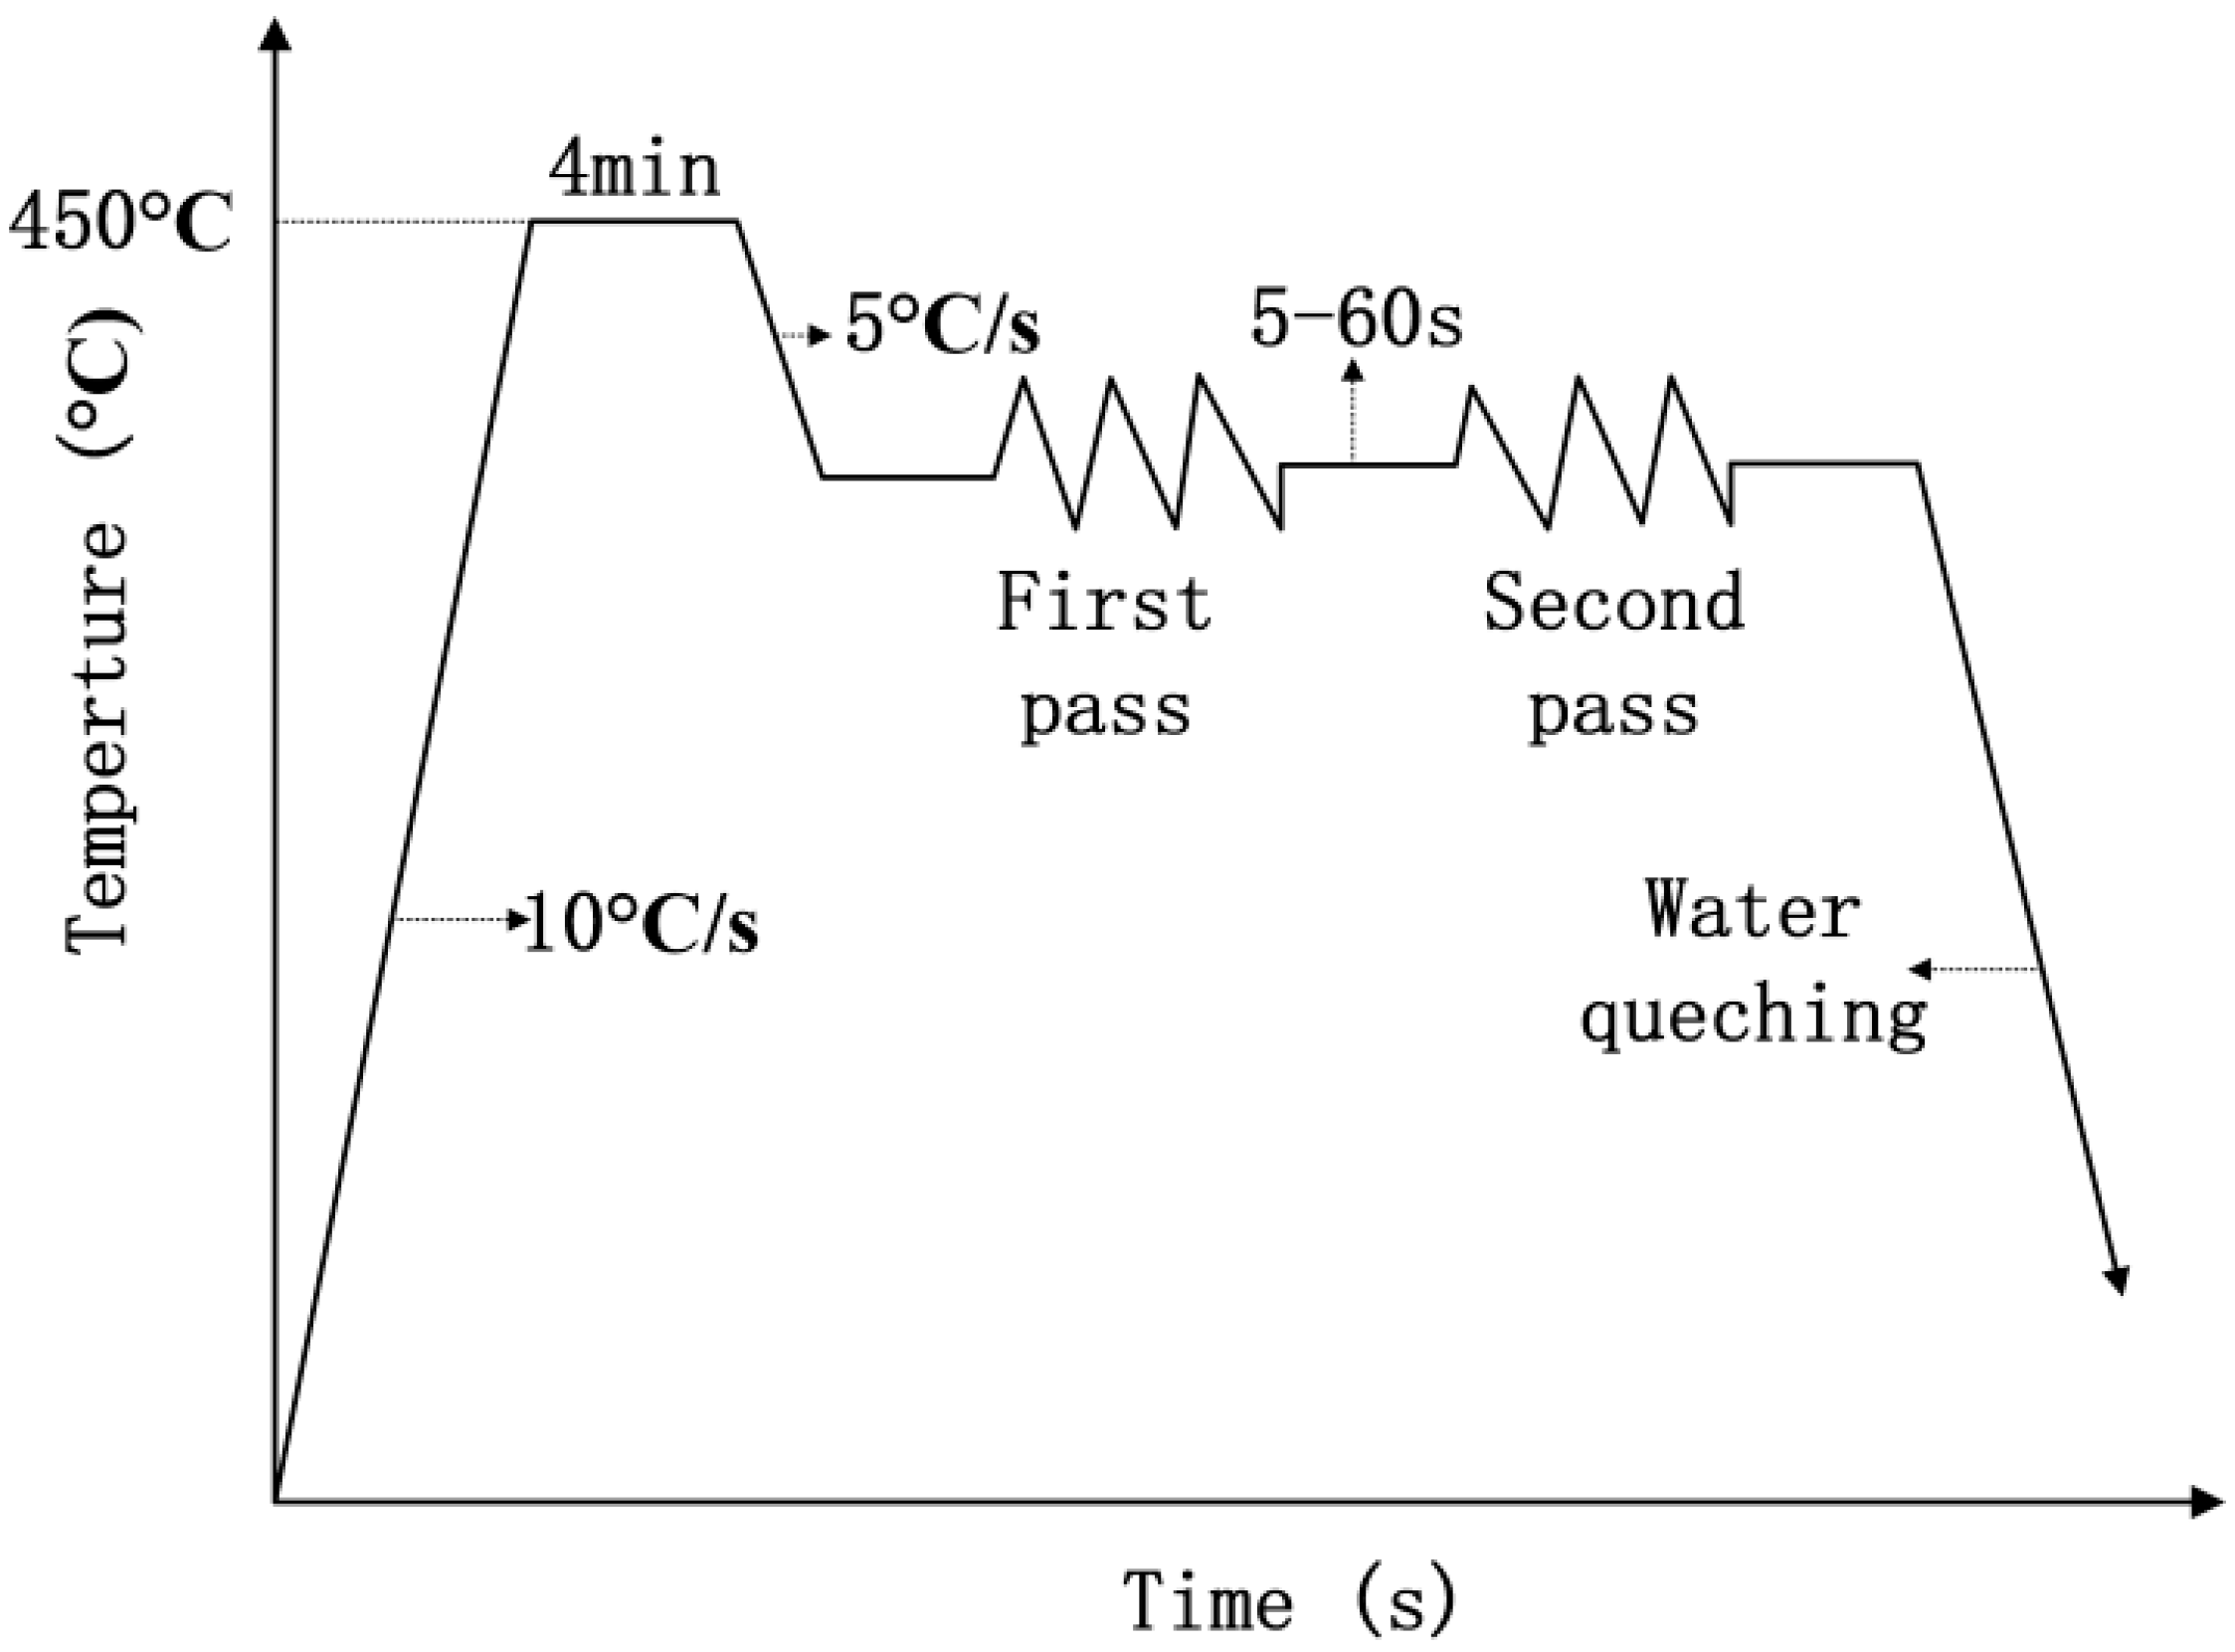
Figure 3.
Flow curves resulting from different deformation parameters: (a) 350 °C, 0.1 s−1; (b) 350 °C, 1.0 s−1; (c) 450 °C, 0.1 s−1; (d) 450 °C, 1.0 s−1.
Figure 3.
Flow curves resulting from different deformation parameters: (a) 350 °C, 0.1 s−1; (b) 350 °C, 1.0 s−1; (c) 450 °C, 0.1 s−1; (d) 450 °C, 1.0 s−1.

Figure 4.
The contrast of the static softening fraction at different strain rates and deformation temperatures.
Figure 4.
The contrast of the static softening fraction at different strain rates and deformation temperatures.

Figure 5.
The relationship between and .
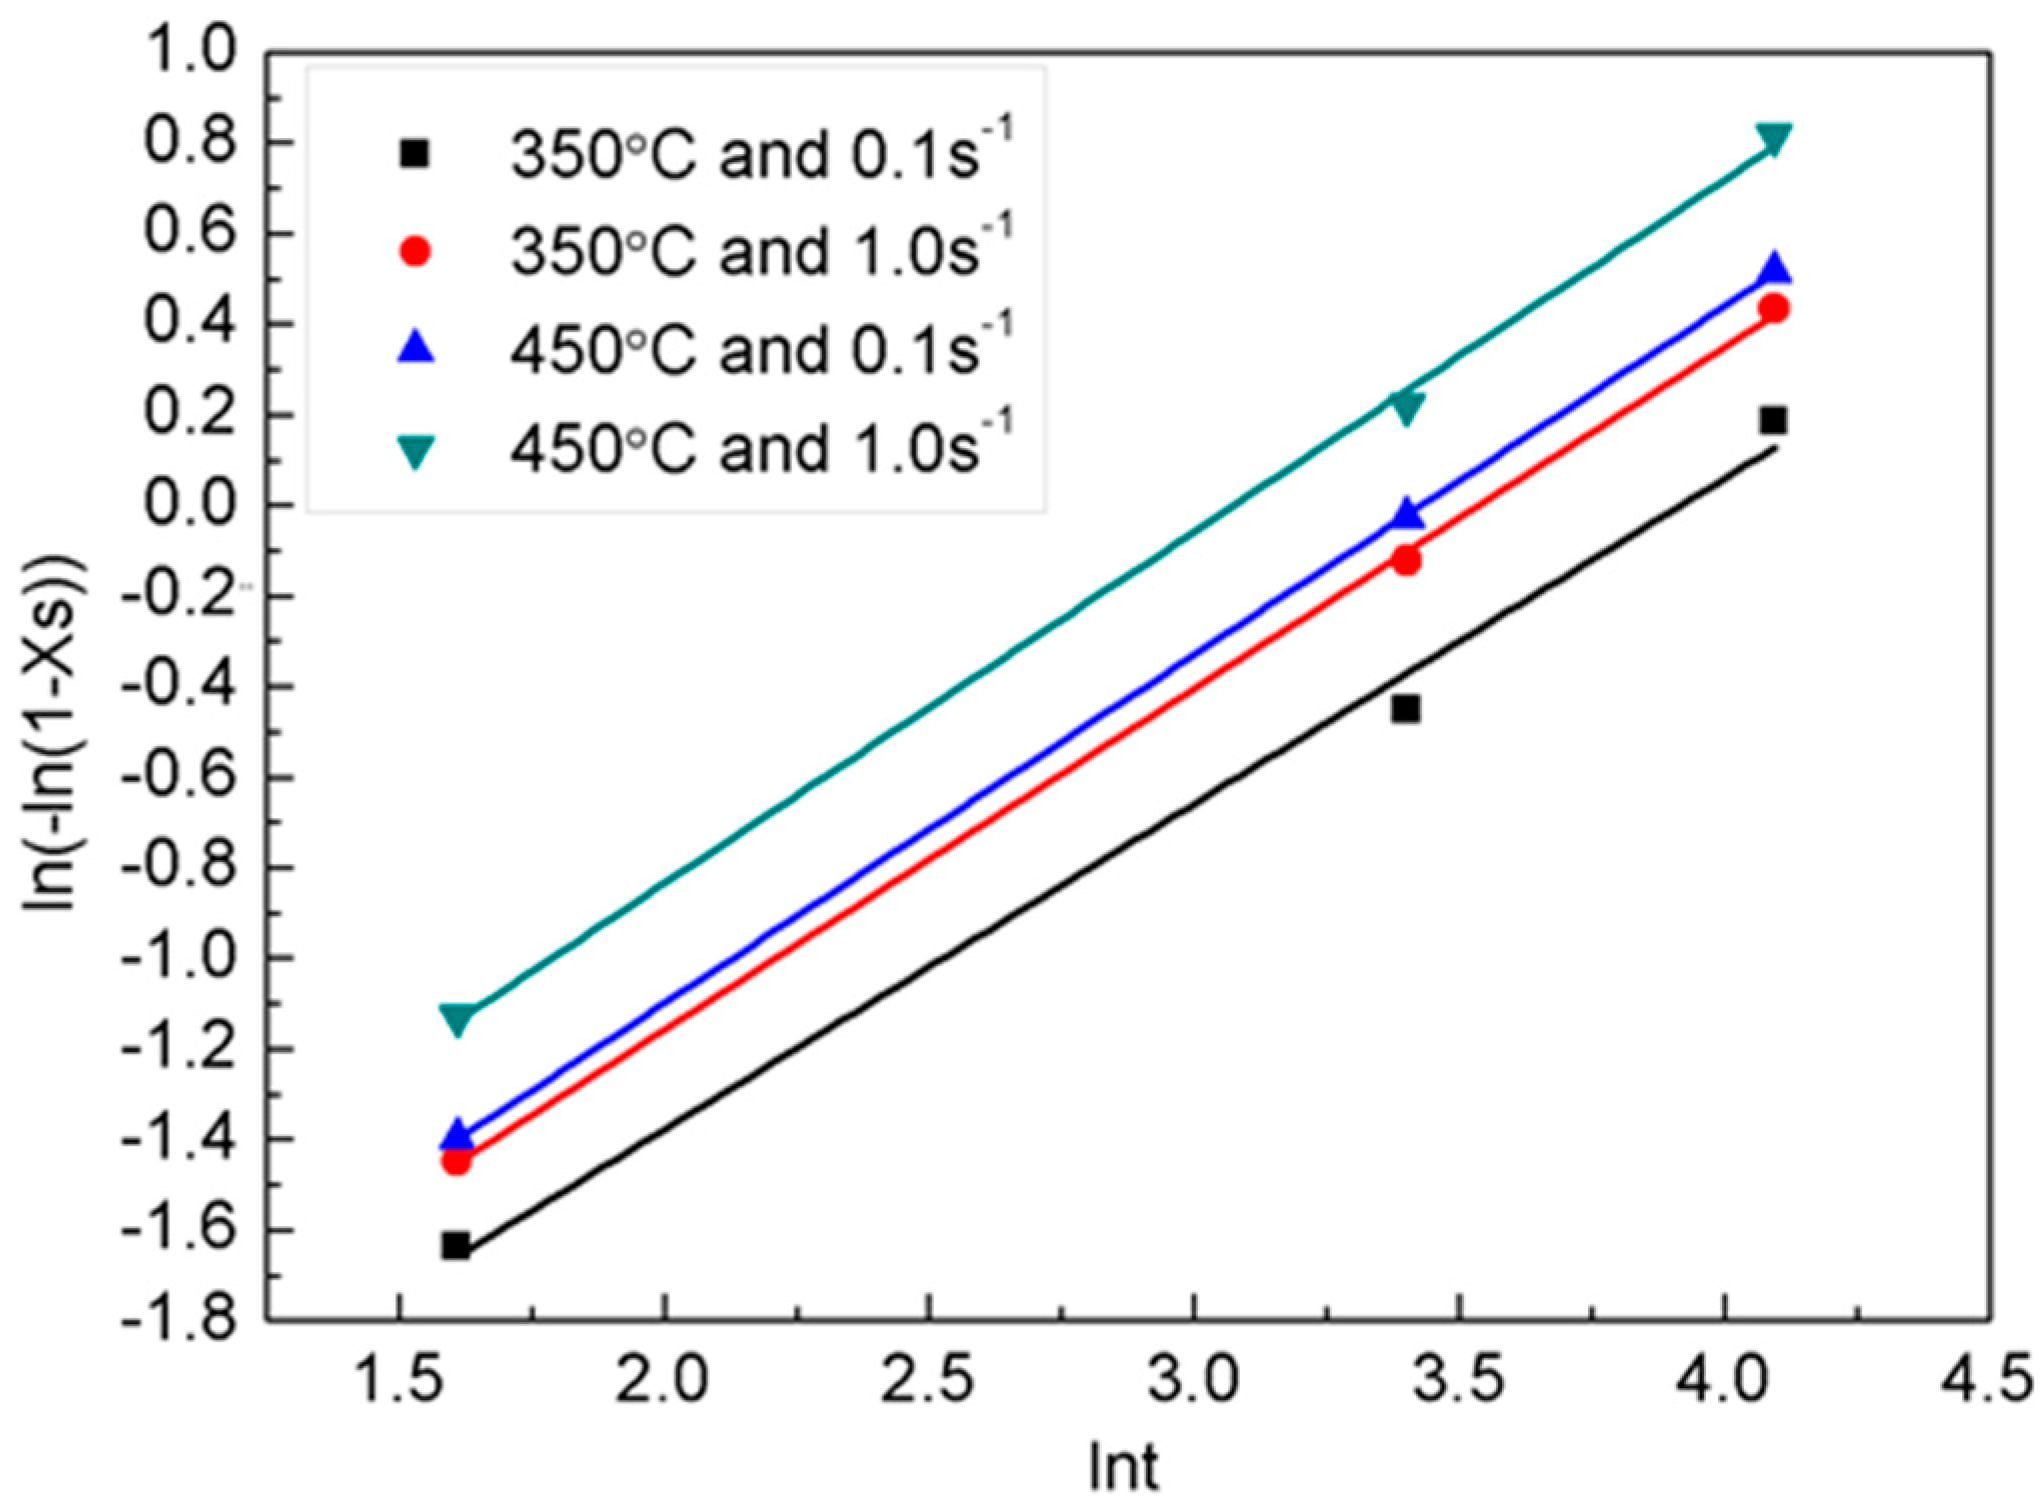
Figure 6.
The Moore neighborhood and symmetric boundary condition.

Figure 7.
The initial microstructure of the 5754 aluminium alloy.
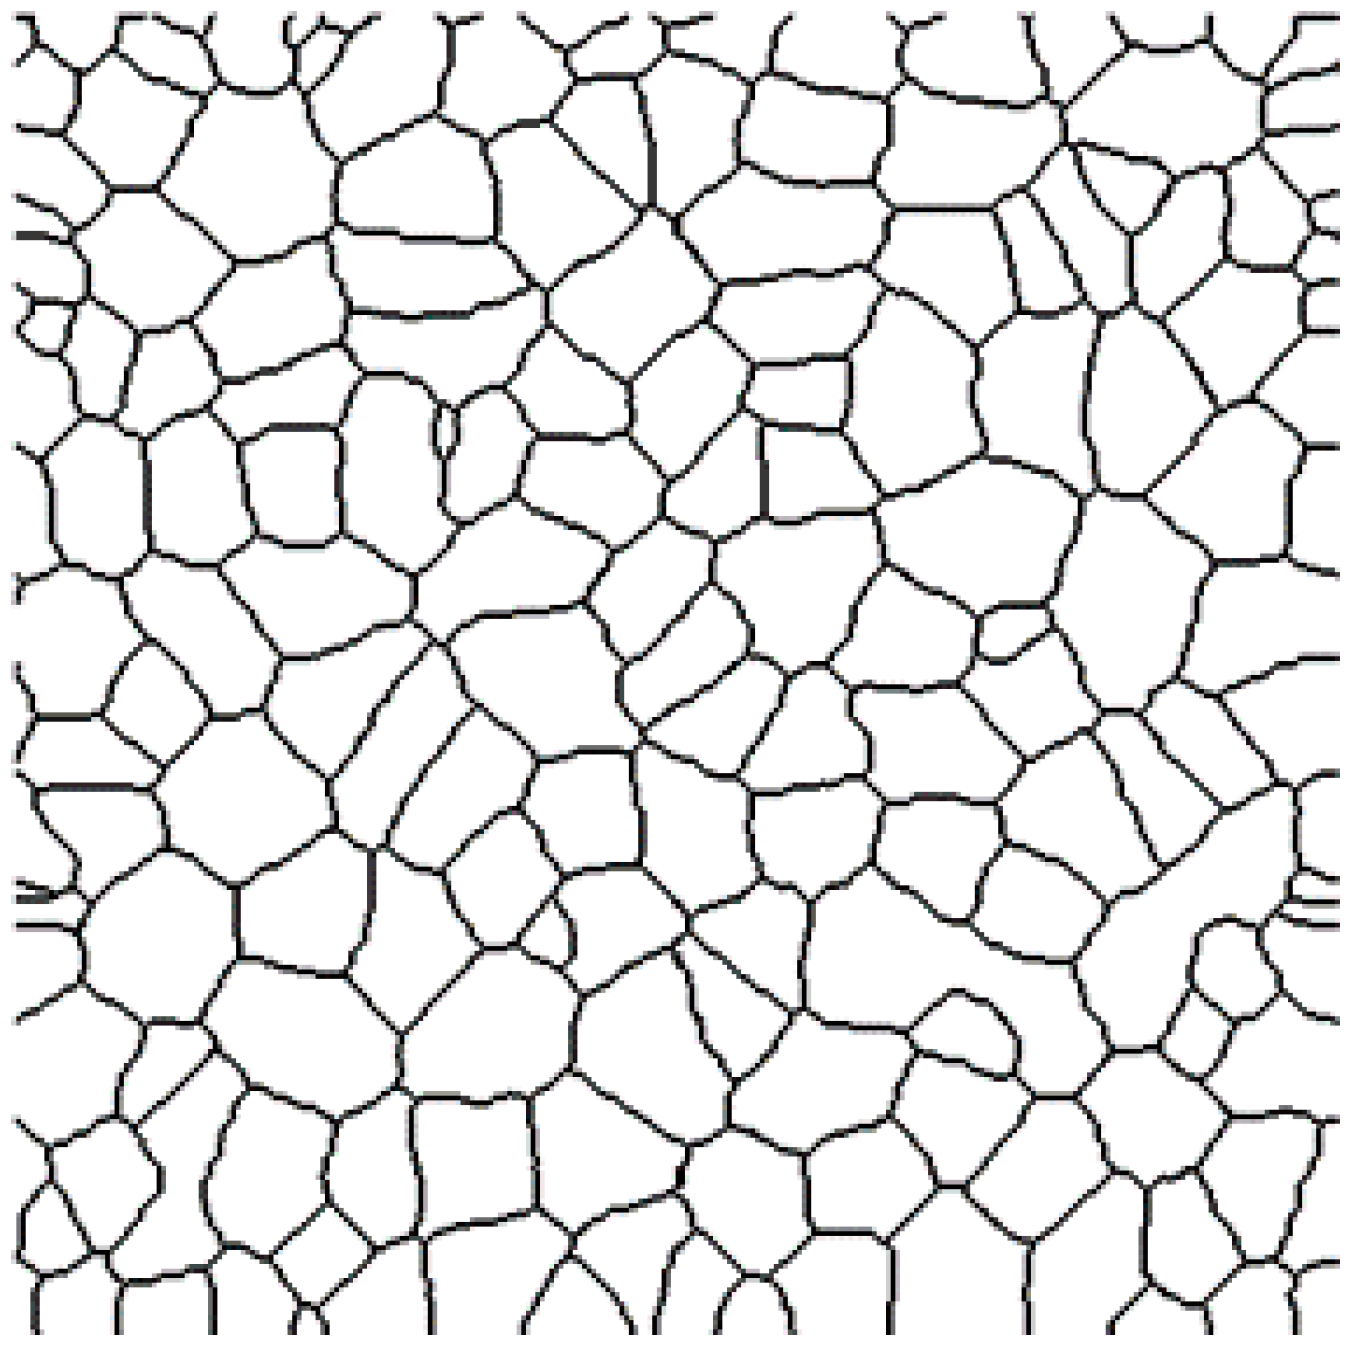
Figure 8.
The experimental (a,b) and CA (c,d) results for microstructures formed at deformation temperatures of 350 °C (a,c) and 450 °C (b,d); (e) the variation of the recrystallized volume fraction and the mean grain size at temperatures of 350 °C and 450 °C.
Figure 8.
The experimental (a,b) and CA (c,d) results for microstructures formed at deformation temperatures of 350 °C (a,c) and 450 °C (b,d); (e) the variation of the recrystallized volume fraction and the mean grain size at temperatures of 350 °C and 450 °C.


Figure 9.
The experimental (a,b) and CA (c,d) results for microstructures formed at a strain rate of 0.1 s−1 (a,c) and 1.0 s−1 (b,d); (e) the variation of the recrystallized volume fraction and the mean grain size at strain rates of 0.1 and 1 s−1.
Figure 9.
The experimental (a,b) and CA (c,d) results for microstructures formed at a strain rate of 0.1 s−1 (a,c) and 1.0 s−1 (b,d); (e) the variation of the recrystallized volume fraction and the mean grain size at strain rates of 0.1 and 1 s−1.
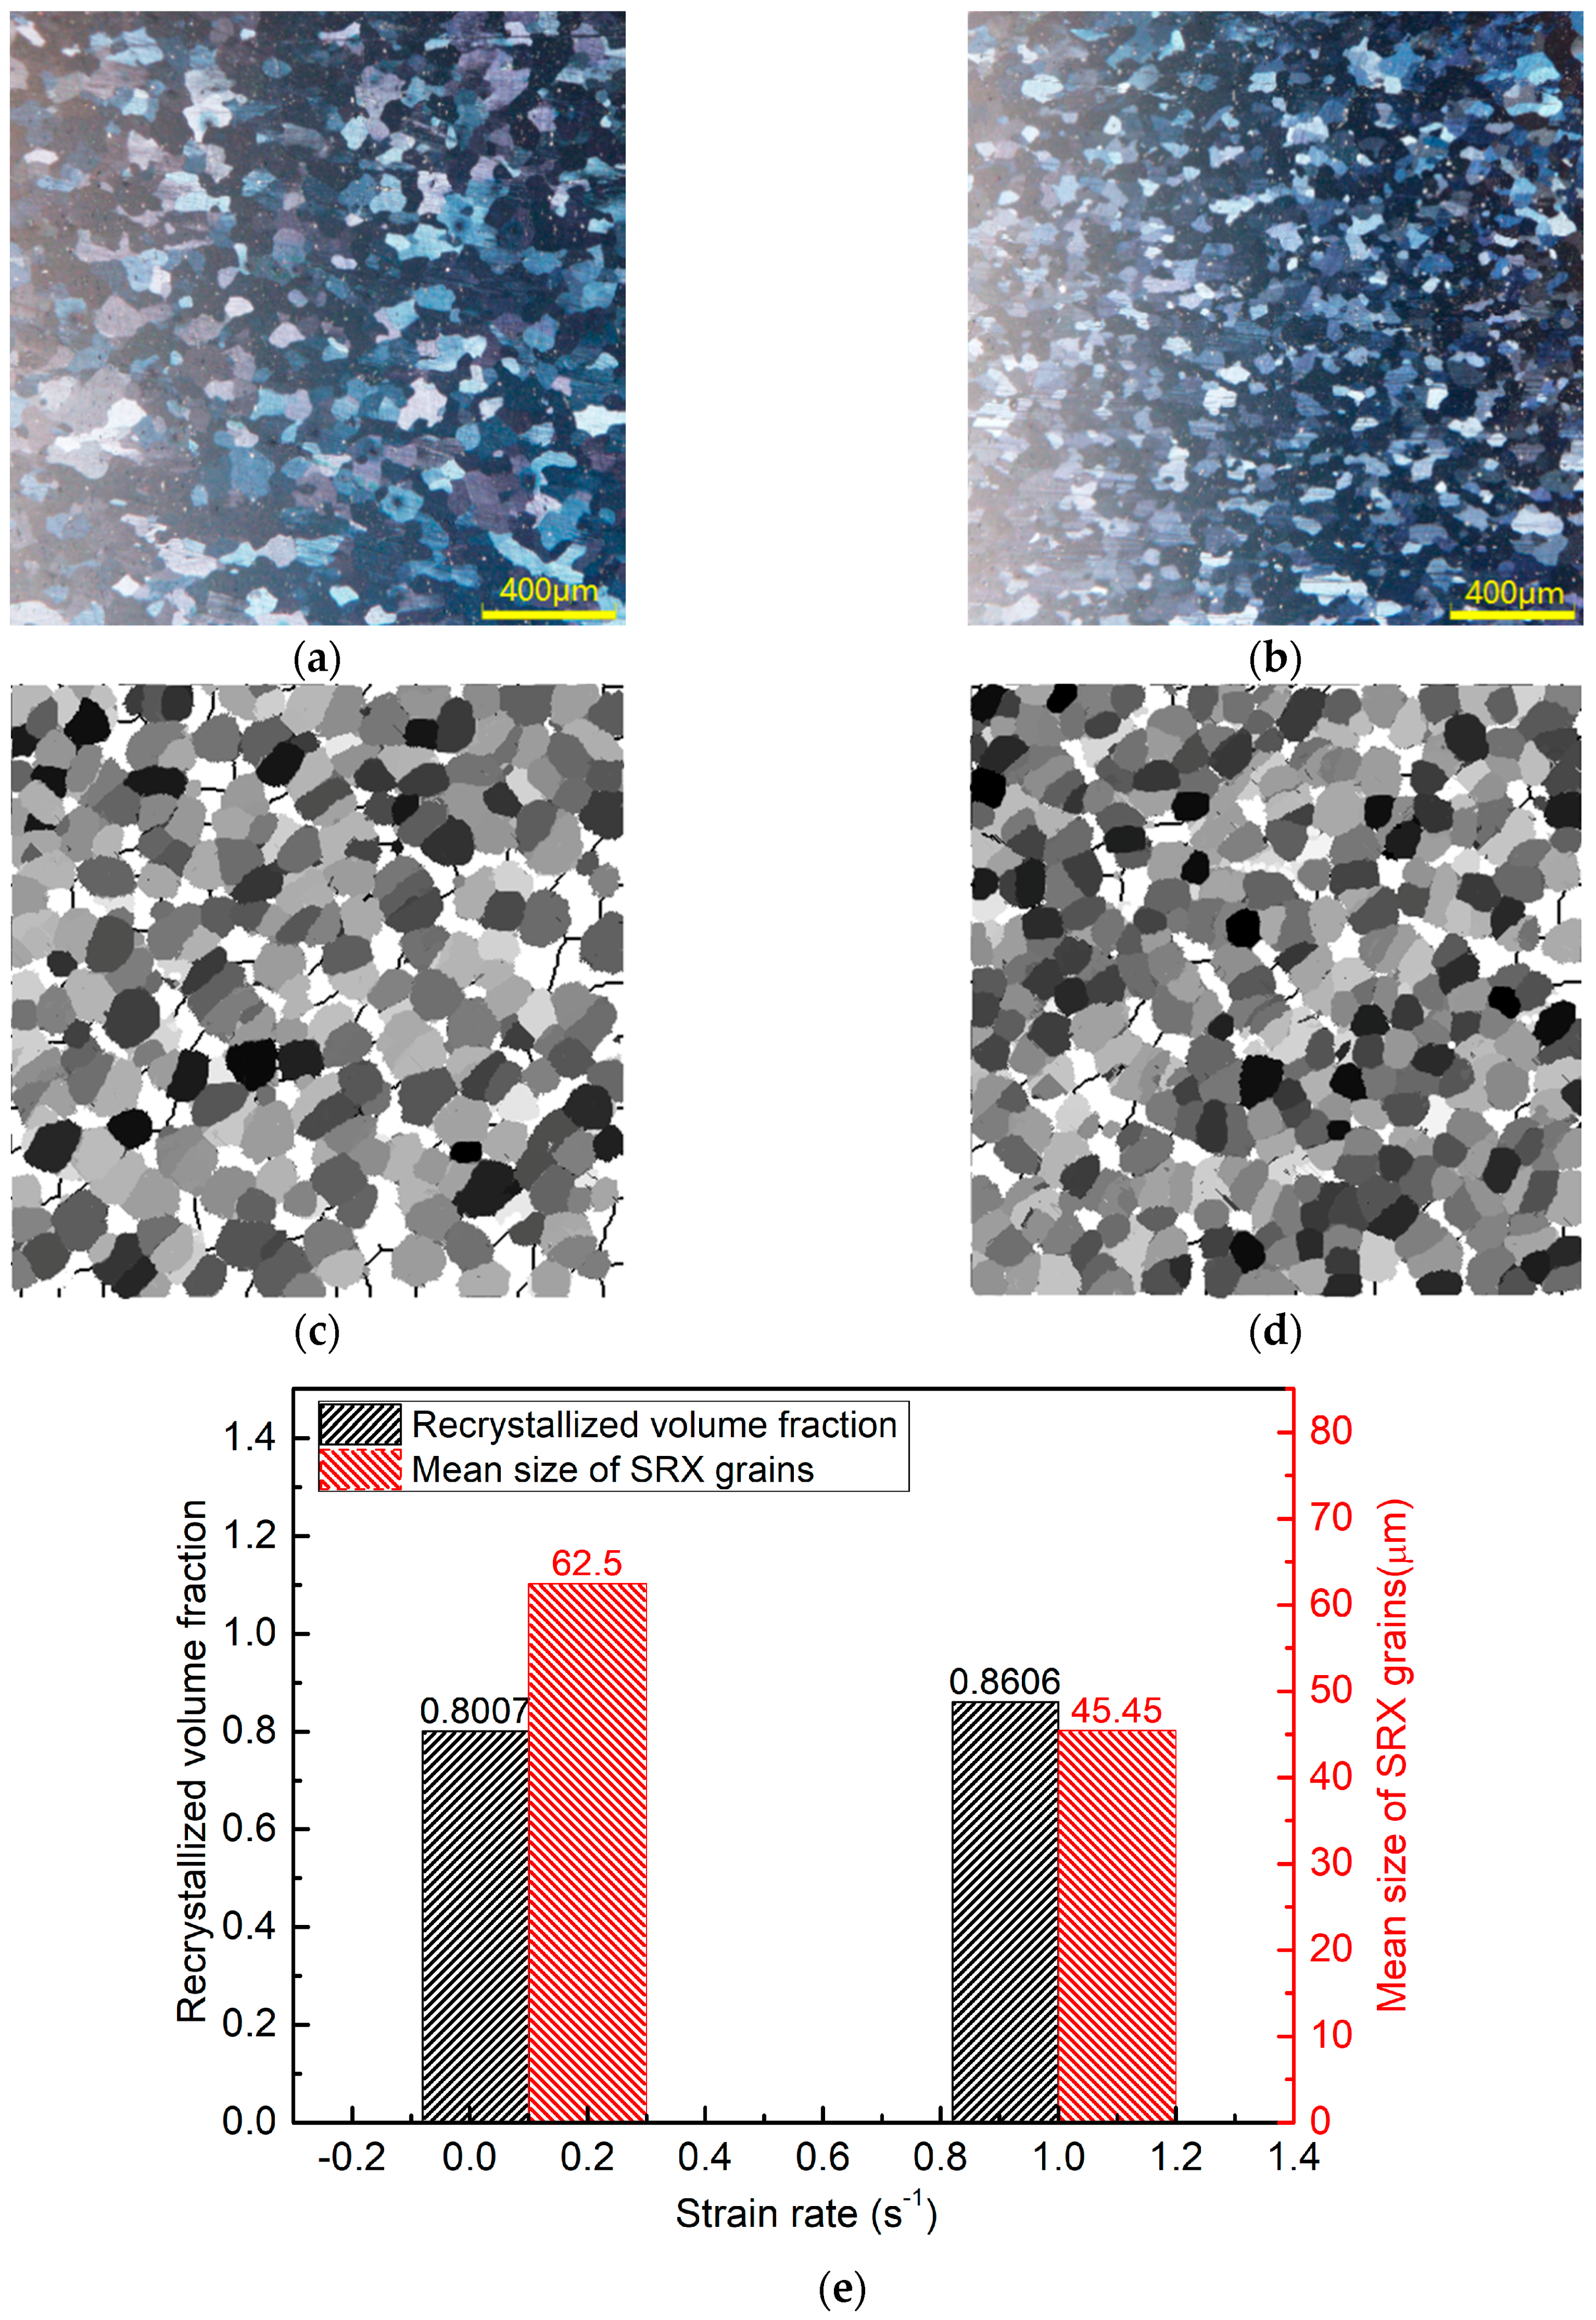
Figure 10.
Changes in the recrystallized volume fraction as a function of delay time.
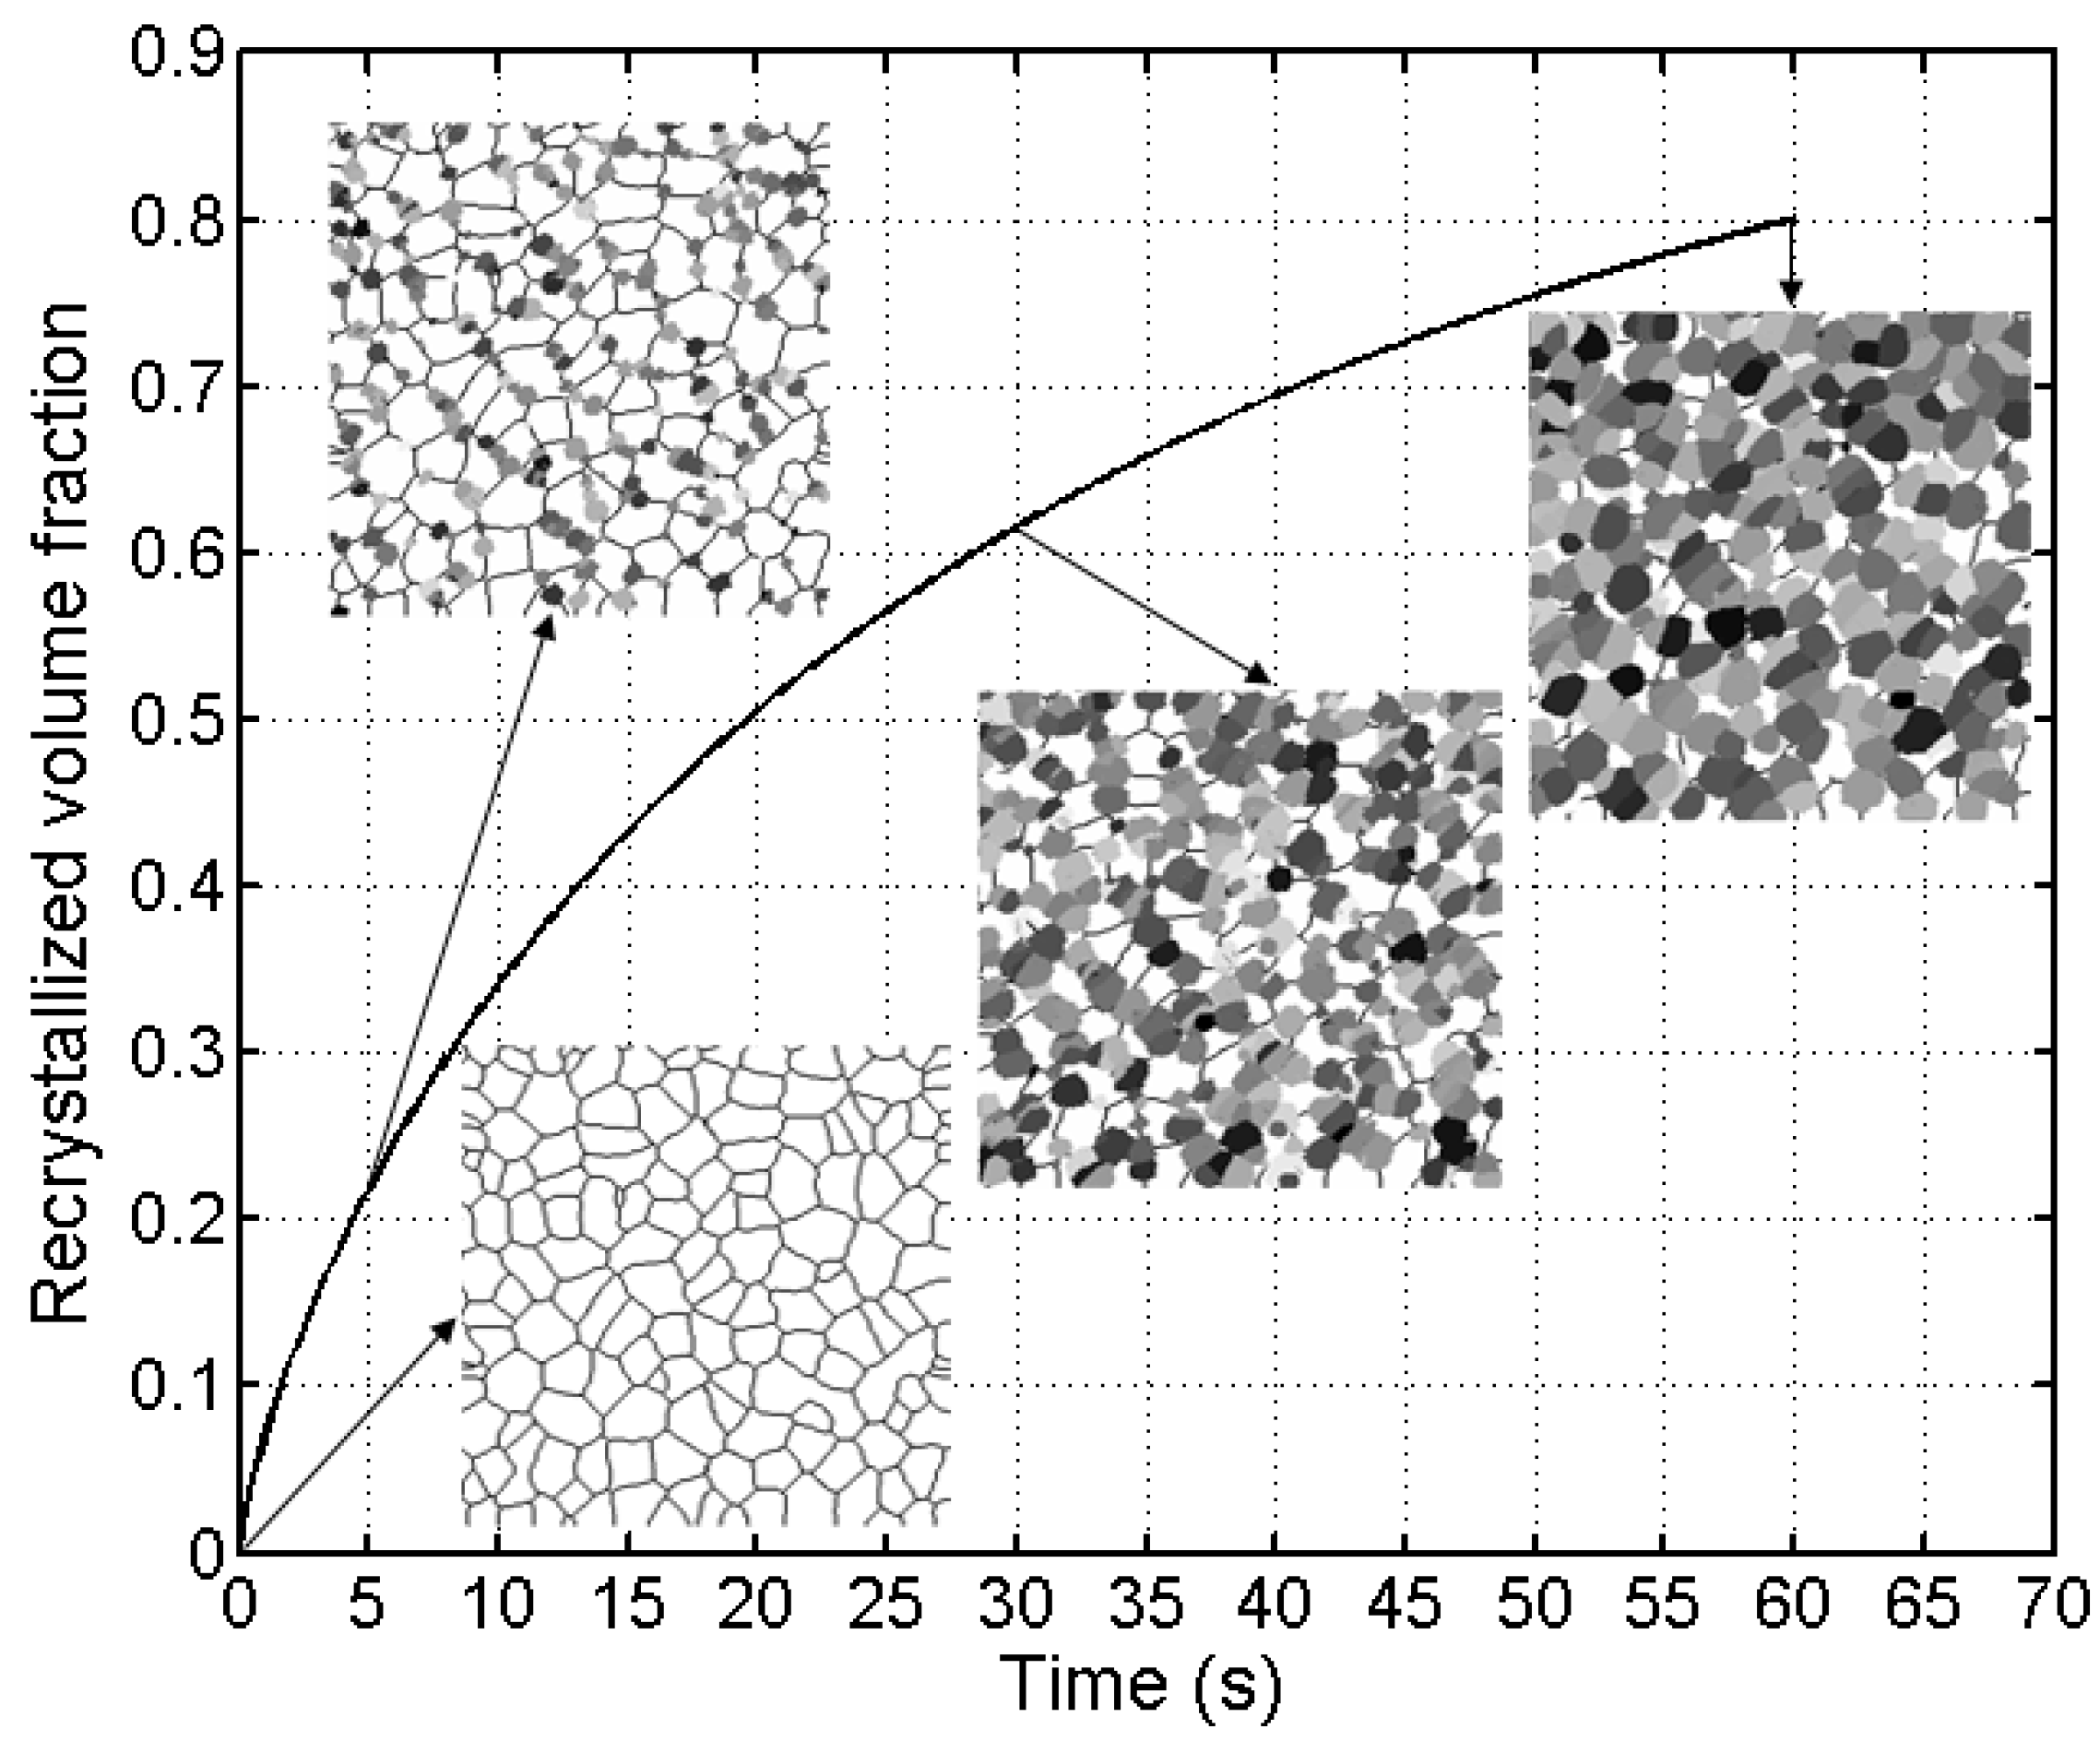
Figure 11.
The recrystallized volume fraction of the test and CA models.

Figure 12.
Comparison of the average grain size obtained from the tests and cellular automaton (CA) results at a temperature of 450 °C and strain rates of 0.1 and 1 s−1.
Figure 12.
Comparison of the average grain size obtained from the tests and cellular automaton (CA) results at a temperature of 450 °C and strain rates of 0.1 and 1 s−1.


Table 1.
Chemical elements and content of 5754 aluminium alloy.
| Chemical Elements | Mg | Mn | Si | Fe | Cr | Zn | Ti | Cu | Al |
|---|---|---|---|---|---|---|---|---|---|
| Content (wt. %) | 3.1 | 0.50 | 0.40 | 0.40 | 0.30 | 0.20 | 0.15 | 0.10 | Balance |
Table 2.
The material constants of 5754 aluminium alloy in this paper.
| Parameter | ||||||
|---|---|---|---|---|---|---|
| Value | 2.6 × 10⁻¹⁰ | 26 | 8 × 10⁻¹⁴ | 1.38 × 10⁻²³ | 0.33 | 0.5 |
Table 3.
The physical parameters for 5754 aluminium alloy obtained by regression and used in this paper.
Table 3.
The physical parameters for 5754 aluminium alloy obtained by regression and used in this paper.
| Parameter | |||
|---|---|---|---|
| Value | 1.56966 × 10⁶ | 73,220.3 | 108,000 |
Table 4.
Comparison of the average grain size obtained from the tests and cellular automaton (CA) results.
Table 4.
Comparison of the average grain size obtained from the tests and cellular automaton (CA) results.
| Temperature/°C | Strain Rate/s−1 | CA Model/ | Experiment/ |
|---|---|---|---|
| 450 °C | 0.1 | 62.50 | 64.17 |
| 1.0 | 45.45 | 47.91 |
© 2018 by the authors. Licensee MDPI, Basel, Switzerland. This article is an open access article distributed under the terms and conditions of the Creative Commons Attribution (CC BY) license (http://creativecommons.org/licenses/by/4.0/).
Share and Cite
MDPI and ACS Style
Huang, C.; Jia, X.; Zhang, Z. Modeling and Simulation of the Static Recrystallization of 5754 Aluminium Alloy by Cellular Automaton. Metals 2018, 8, 585. https://doi.org/10.3390/met8080585
AMA Style
Huang C, Jia X, Zhang Z. Modeling and Simulation of the Static Recrystallization of 5754 Aluminium Alloy by Cellular Automaton. Metals. 2018; 8(8):585. https://doi.org/10.3390/met8080585
Chicago/Turabian StyleHuang, Changqing, Xiaodong Jia, and Zhiwu Zhang. 2018. "Modeling and Simulation of the Static Recrystallization of 5754 Aluminium Alloy by Cellular Automaton" Metals 8, no. 8: 585. https://doi.org/10.3390/met8080585
Note that from the first issue of 2016, this journal uses article numbers instead of page numbers. See further details here.