Article

Additional Phases at High Boron Content in High-Temperature Co–Re–Cr Alloys

1
Nuclear Physics Institute of the CAS, Řež 130, 25068 Řež, Czech Republic
2
Institut für Werkstoffe, Technische Universität Braunschweig, Langer Kamp 8, 38106 Braunschweig, Germany
3
Heinz Maier-Leibnitz Zentrum (MLZ), Technische Universität München, Lichtenbergstr. 1, 85747 Garching, Germany
4
Department of Physics of Materials, Faculty of Mathematics and Physics, Charles University, Ovocný trh 5, 11636 Prague, Czech Republic
*
Author to whom correspondence should be addressed.
Metals 2018, 8(8), 621; https://doi.org/10.3390/met8080621
Submission received: 28 June 2018 / Revised: 27 July 2018 / Accepted: 2 August 2018 / Published: 7 August 2018
(This article belongs to the Special Issue High Temperature Materials Development beyond Ni-Base Superalloys)

Abstract

:
Boron largely increases the ductility of polycrystalline high-temperature Co–Re–Cr alloys. Therefore, the effect of boron addition on the alloy structural characteristics is of large importance for the stability of the alloy at operational temperatures. Along with the Co-solid solution matrix phase transformation from hcp to fcc structure, additional structural effects were observed in situ at very high temperatures (up to 1500 °C) using neutron diffraction (ND) in boron-containing Co–17Re–23Cr alloys. Increasing boron content up to 1000 wt. ppm lowers the temperature at which sublimation of Co and Cr from the matrix occurs. As a result, the composition of the matrix in the surface region is changed leading to the formation of a second and a third matrix hcp phases at high temperatures. The consideration on the lattice parameter dependence on composition was used to identify the new phases appearing at high temperatures. Energy-dispersive spectroscopy and ND results were used to estimate the amount of Co and Cr which sublimated from the surface region of the high-boron sample. In the sense of alloy development, the sublimation of Co and Cr is not critical as the temperature range where it is observed (≥1430 °C) is significantly above the foreseen operation temperature of the alloys (1200 °C).

1. Introduction

Co–Re–Cr-based alloys [1] containing boron are promising candidates for high-temperature application in gas turbines beyond Ni-based superalloys. The Co matrix in Co–Re–Cr alloys has a stable hexagonal close-packed (hcp, alternatively denoted ε) structure at room temperature and undergoes an allotropic transformation to a cubic face-centered structure (fcc or γ) at high temperatures. Boron addition significantly increases the ductility of the polycrystalline alloys [2].
The high-temperature structure and microstructure as well as their stability are of a great importance for applications and deserve attention. Neutron diffraction (ND) was already successfully used for in-situ structural studies of these alloys at high temperatures [3,4,5]. The structure and phase transformation of boron-containing Co–Re–Cr alloys at high temperatures (HT) were investigated in the neutron-scattering experiment described in [6]. It was shown that boron significantly changes the allotropic transformation temperature of the Co solid solution matrix, i.e., transformation temperature from low-temperature hexagonal close-packed phase (hcp, alternatively denoted ε) to high-temperature cubic face centered structure (fcc or γ). It was found that the decrease in the transformation temperature is not monotonic with increasing boron content but rather exhibits minimum at the low boron amount of 200 ppm B. It was concluded that the reason for this effect is the interplay between the amount of boron addition and the amount of σ phase as well as the boride content in the alloy.
Moreover, it was also found that the alloys with higher boron content (500 and 1000 ppm B) have a more complex high-temperature microstructure. Particularly, additional hexagonal matrix phases appear. In this paper, occurrence and formation of these additional phases in Co–Re–Cr alloys containing boron is studied. The cause for their appearance and possible consequences for the development of Co–Re–Cr alloys are discussed.

2. Materials and Methods

2.1. In-Situ Thermal Cycle during Neutron Diffraction Measurement

In order to determine the influence of boron content on the high temperature structure and matrix transformation temperature, several Co–17Re–23Cr alloys (nominal alloy composition 17 at % Re and 23 at % Cr) with varying boron content (50, 100, 150, 200, 500 and 1000 wt. ppm of boron, i.e., 0.04, 0.07, 0.11, 0.15, 0.36 and 0.72 at %) were investigated. The alloys were homogenized after melting and casting by standard solution heat treatment (ST) in vacuum which consisted of the following steps: 1350 °C/5 h + 1400 °C/5 h + 1450 °C/5 h + Argon quenching. Cylindrical samples of 6 mm diameter were used for neutron diffraction (ND). The surfaces were machined smooth before the in-situ measurement.
The diffractometers SPODI [7,8], which is equipped with a bank of 80 position sensitive detector tubes, and Stress-Spec [9], equipped with a two-dimensional position sensitive detector, of Heinz Maier-Leibnitz-Zentrum (MLZ) at FRM II, Garching, Germany, were used for ND measurements. SPODI high-resolution neutron powder diffractometer covering the angular range (2θ) up to 154° was used for precise determination of phase content at RT before in situ heating for all the samples. The used neutron wavelength was equal to 0.1548 nm.
Stress-Spec neutron diffractometer equipped with a high-temperature vacuum furnace was used for in-situ neutron diffraction (ND) measurements up to 1490 or 1500 °C at high-vacuum (10−5–10−6 mbar). The experiment using the Stress-Spec instrument was performed with a neutron wavelength of 0.164 nm. The diffractograms were collected predominantly in a limited angular range (2θ) between 42.5° and 56° (which contains the important reflections) during heating or during the hold (10 min, one detector position) at a particular temperature. Nevertheless, each sample was also measured in the full accessible angular range 2θ between 35° and 115° (eight detector positions with a total of 100 min holding at a temperature, including detector movement) at room temperature (RT) before and after the in situ cycle, as well as at the highest achieved temperature. One temperature scan (i.e., temperature heating and cooling) using the Stress-Spec with a sufficient neutron count and a sufficiently dense list of the tested temperatures (10 K step in the important temperature region where the matrix transformations occur) took 16–20 h per sample.
A relatively large absorption of neutrons exists in Co–Re–Cr alloys due to the presence of Re and Co, which have an order of magnitude larger absorption cross section than, e.g., Fe, and two orders larger than Al. The mean path of neutrons in the sample is only a few millimeters (the macroscopic absorption cross section is equal to 2.97 cm−1 for Co–17Re–23Cr alloy, even without boron, which is a strong absorber of neutrons). That means that the 1/e penetration path is 3.4 mm when considering absorption only, and 3.0 mm when assuming absorption plus incoherent scattering. The scattered (and subsequently detected) neutrons thus come mainly from the region below the surface of the sample. The volume up to the depth of approximately 1 mm below the surface of the cylindrical sample mainly scatters. This information is crucial for subsequent discussions and is mentioned here in order to underline the importance of the signal from the surface region of the Co–Re–Cr samples in this neutron diffraction investigation.
Out of the investigated sample series with varying boron content, the samples with high boron content (500 and 1000 wt. ppm B, i.e., 0.36 and 0.72 at %) exhibited splitting of the ε matrix phase peaks at HT [6]. After the in-situ HT cycle, it was observed that these two samples (500 and 1000 wt. ppm B) exhibited dramatic changes on the surface. In Figure 1, the samples without boron addition and with 1000 ppm B are compared after the in-situ measurement at HT. Both samples were heated up to 1490 °C. Clearly, the sample with high boron content shows a very rough surface as compared to the sample without boron.

2.2. SEM and EDS

To interpret the ND results, the microstructure of the samples was investigated by scanning electron microscope (SEM). The microstructure of the initial state of the samples from the various alloys (ST condition) was presented in the earlier paper [6]. The microstructures after the in-situ neutron diffraction measurement at HT are presented here. For this purpose, the cylindrical samples were cut in the middle and the micrographs were taken on the cross-section. The advantage of this approach is that both the microstructure at the center of the sample and near the surface (from which neutron scattering signal mainly emerged) could be investigated and compared.
A dual beam scanning electron microscope from FEI, Hillsboro, OR, USA (model: Helios Nanolab 650i) fitted with the Trident analytical system from EDAX, Mahwah, NJ, USA (with energy dispersive spectroscopy—EDS) was used in this study. For imaging, mostly the secondary or the backscatter electrons (SE and BSE), respectively, were used. In addition to the SEM imaging [10], the EDS measurements were done to study the composition and the elemental distribution in the samples. The composition at various locations in the micrographs was measured quantitatively by EDS using standard-less Cliff-Lorimer method [11]. The 30 mm2 silicon drift detector (SDD) provided large EDS counts for quick elemental and phase mapping.

3. Results

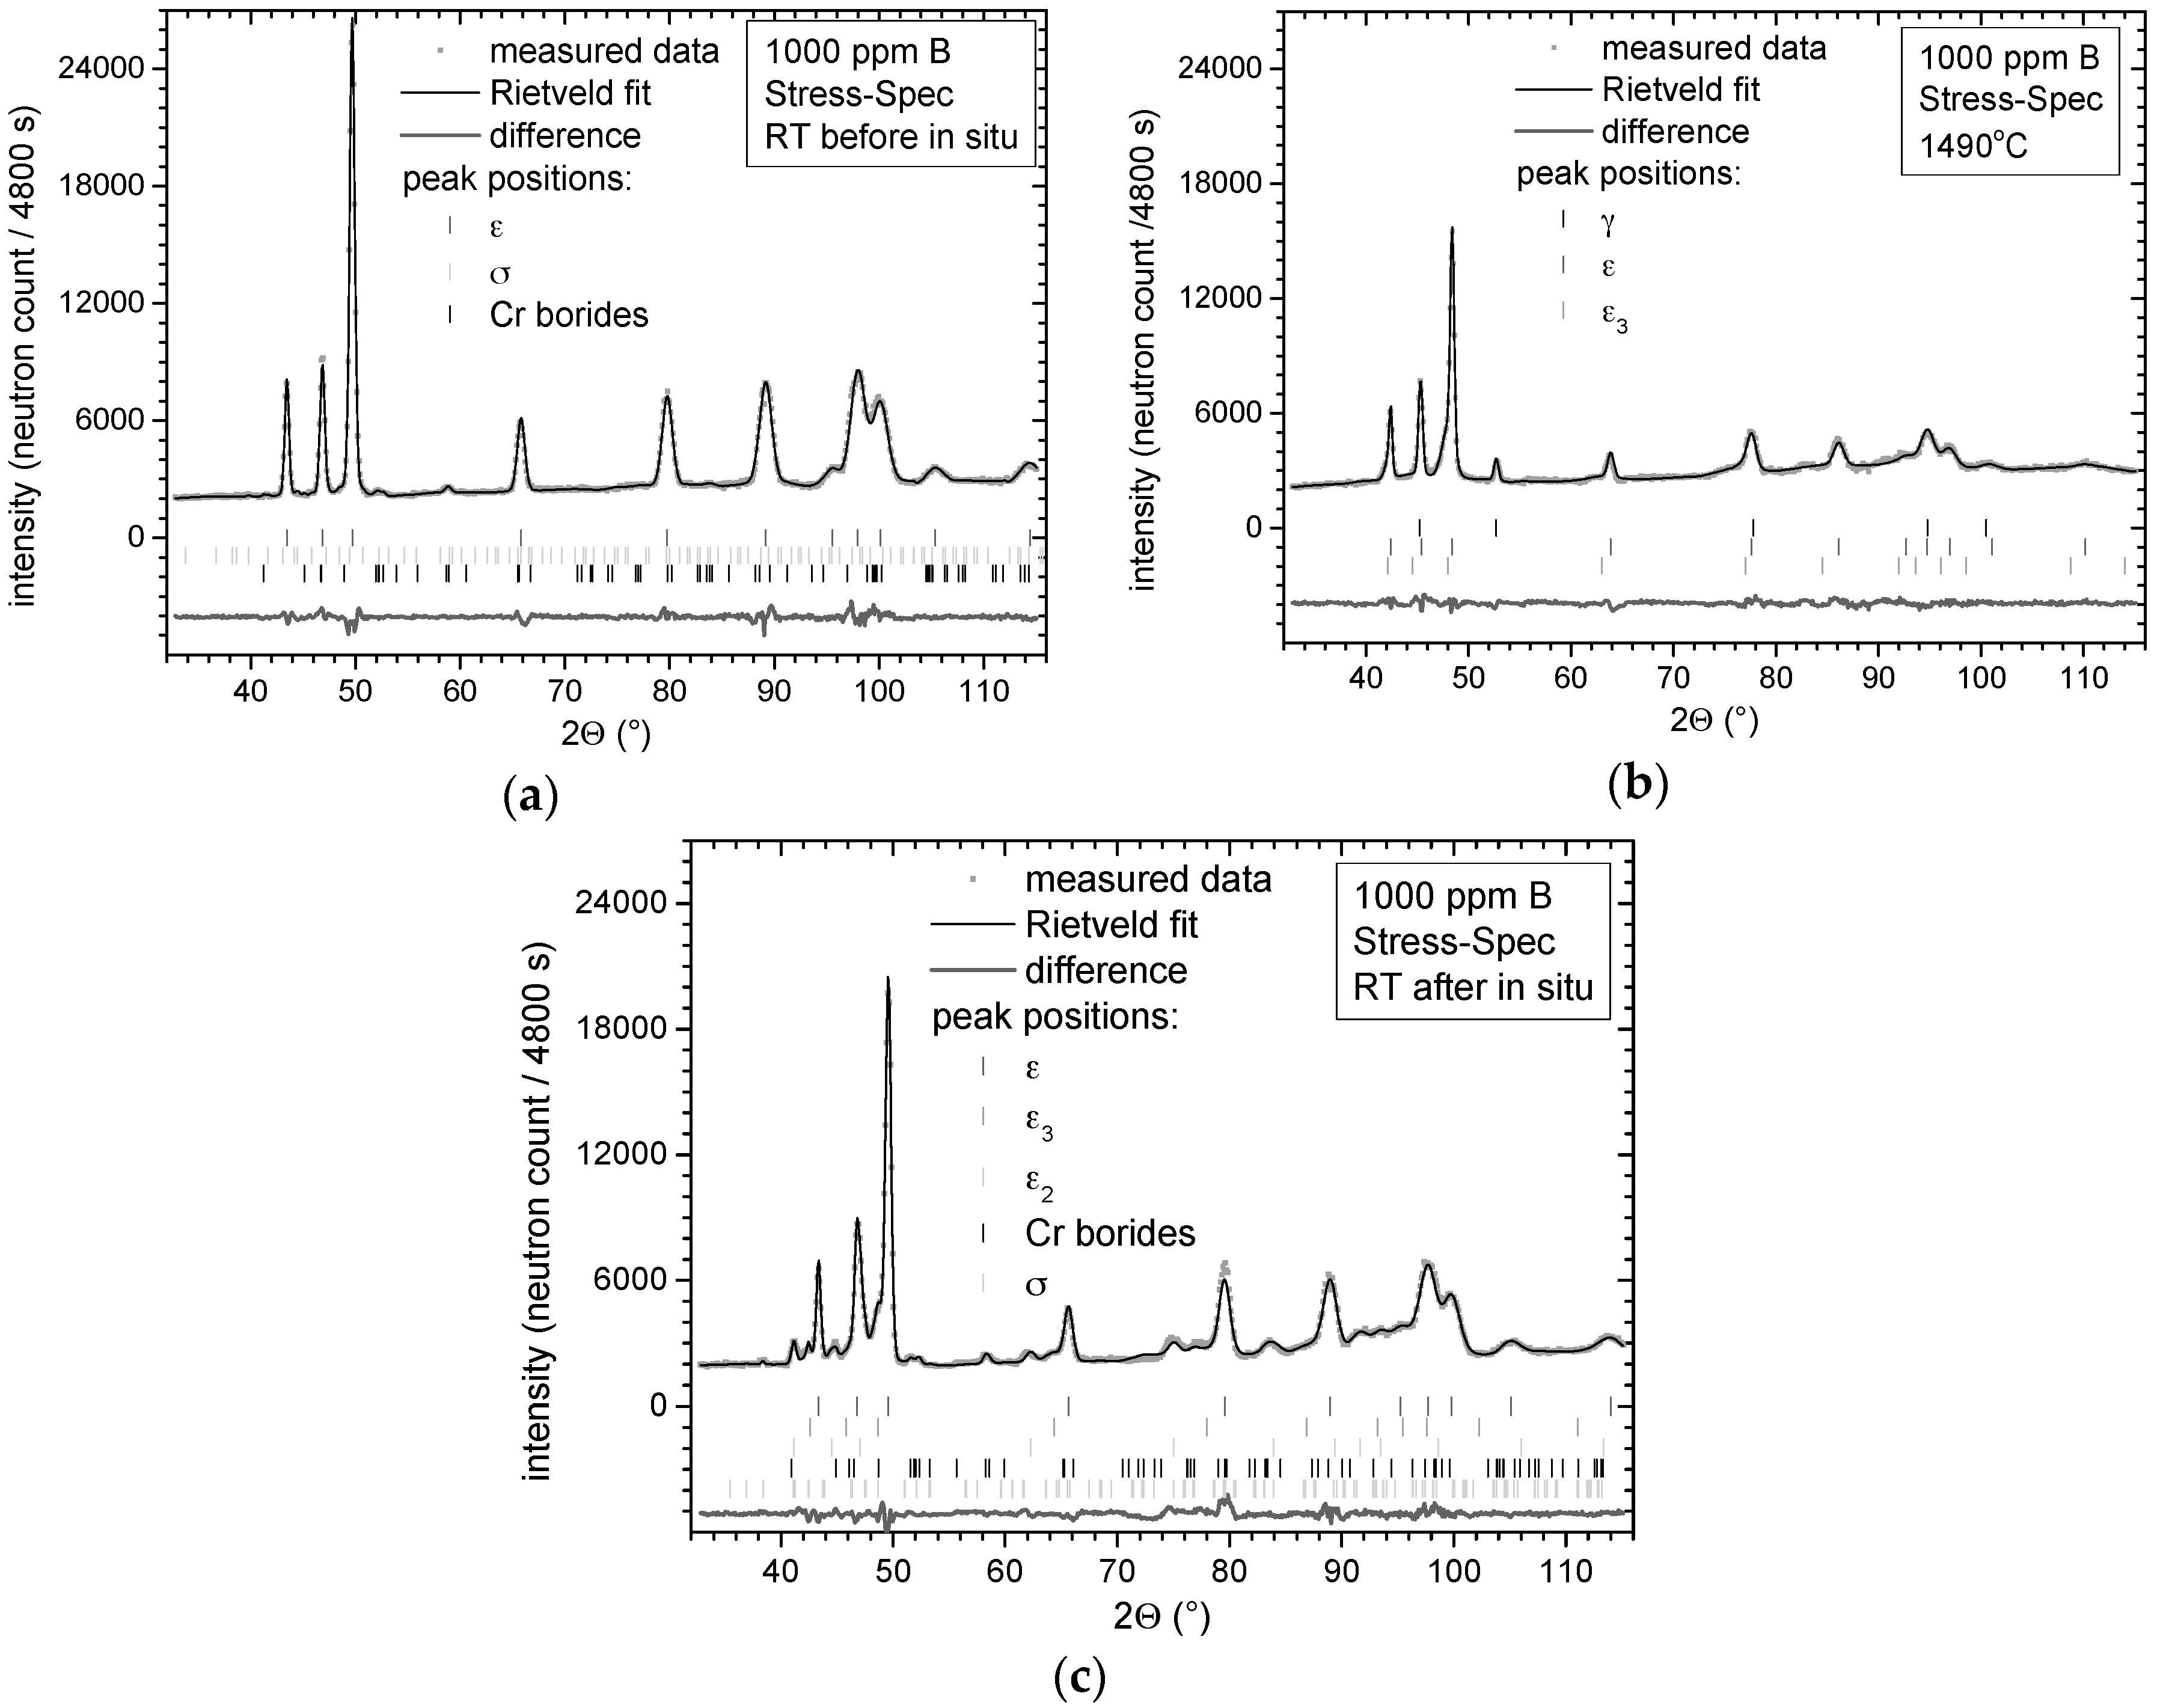
3.1. Neutron Diffraction Measurements at RT

High-resolution neutron diffraction data measured at SPODI at room temperature before in-situ heating (Figure 2) gives information on phase content in the samples after standard heat treatment. For some samples, mainly those with high B content (500 and 1000 wt. ppm of boron), a split of the hcp matrix phase reflections in the range of 0.3% lattice parameter change (i.e., of the order of 0.01 Å) at large diffraction angles was observed (see the Figure 2b). This shows the presence of two distinct ε-Co solid solution matrix phases in these alloys, with very similar lattice parameters. It suggests that the matrix phase chemistry in the alloys could be inhomogeneous, particularly prominent for the high-boron containing samples. Such inhomogeneities have been frequently observed in cast Co–Re alloys due to strong Re segregation in the dendritic and inter-dendritic regions [12]. The Re segregation sometimes remains even after the given homogenization heat treatment (ST). It is known that the melting range is broadening due to B addition and it stands to reason that a broadened melting range is a promotion of segregation.

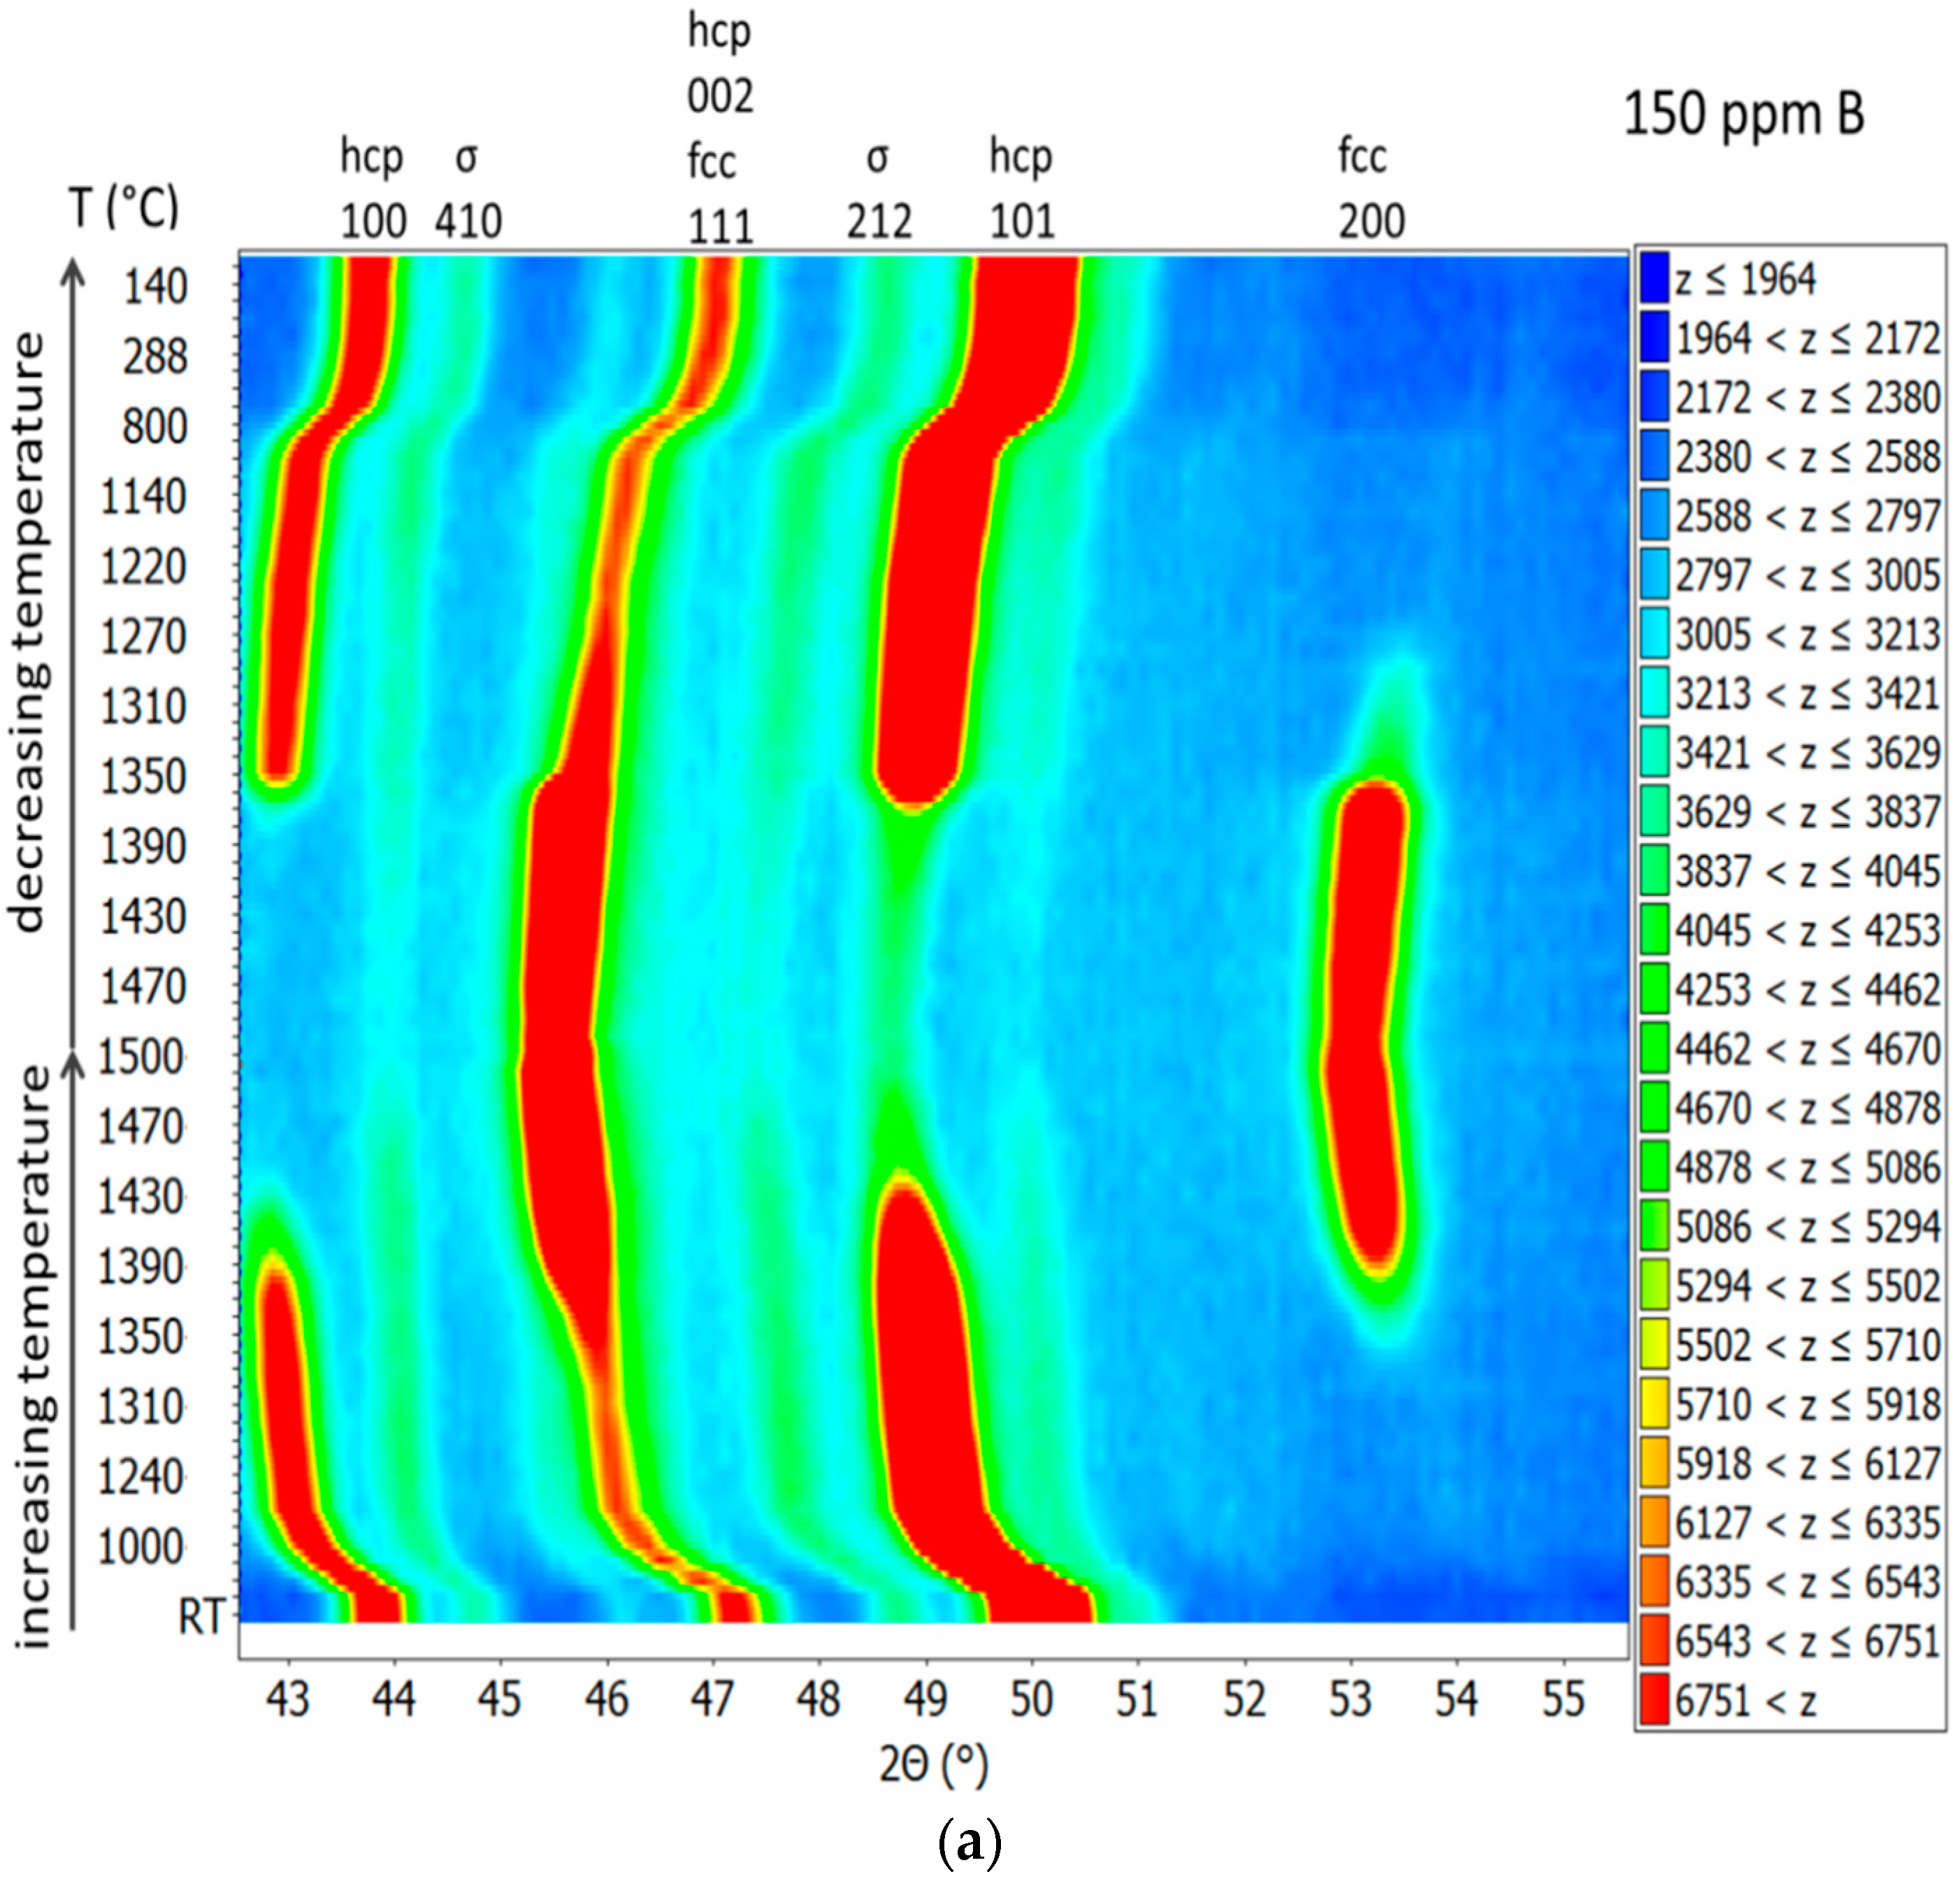
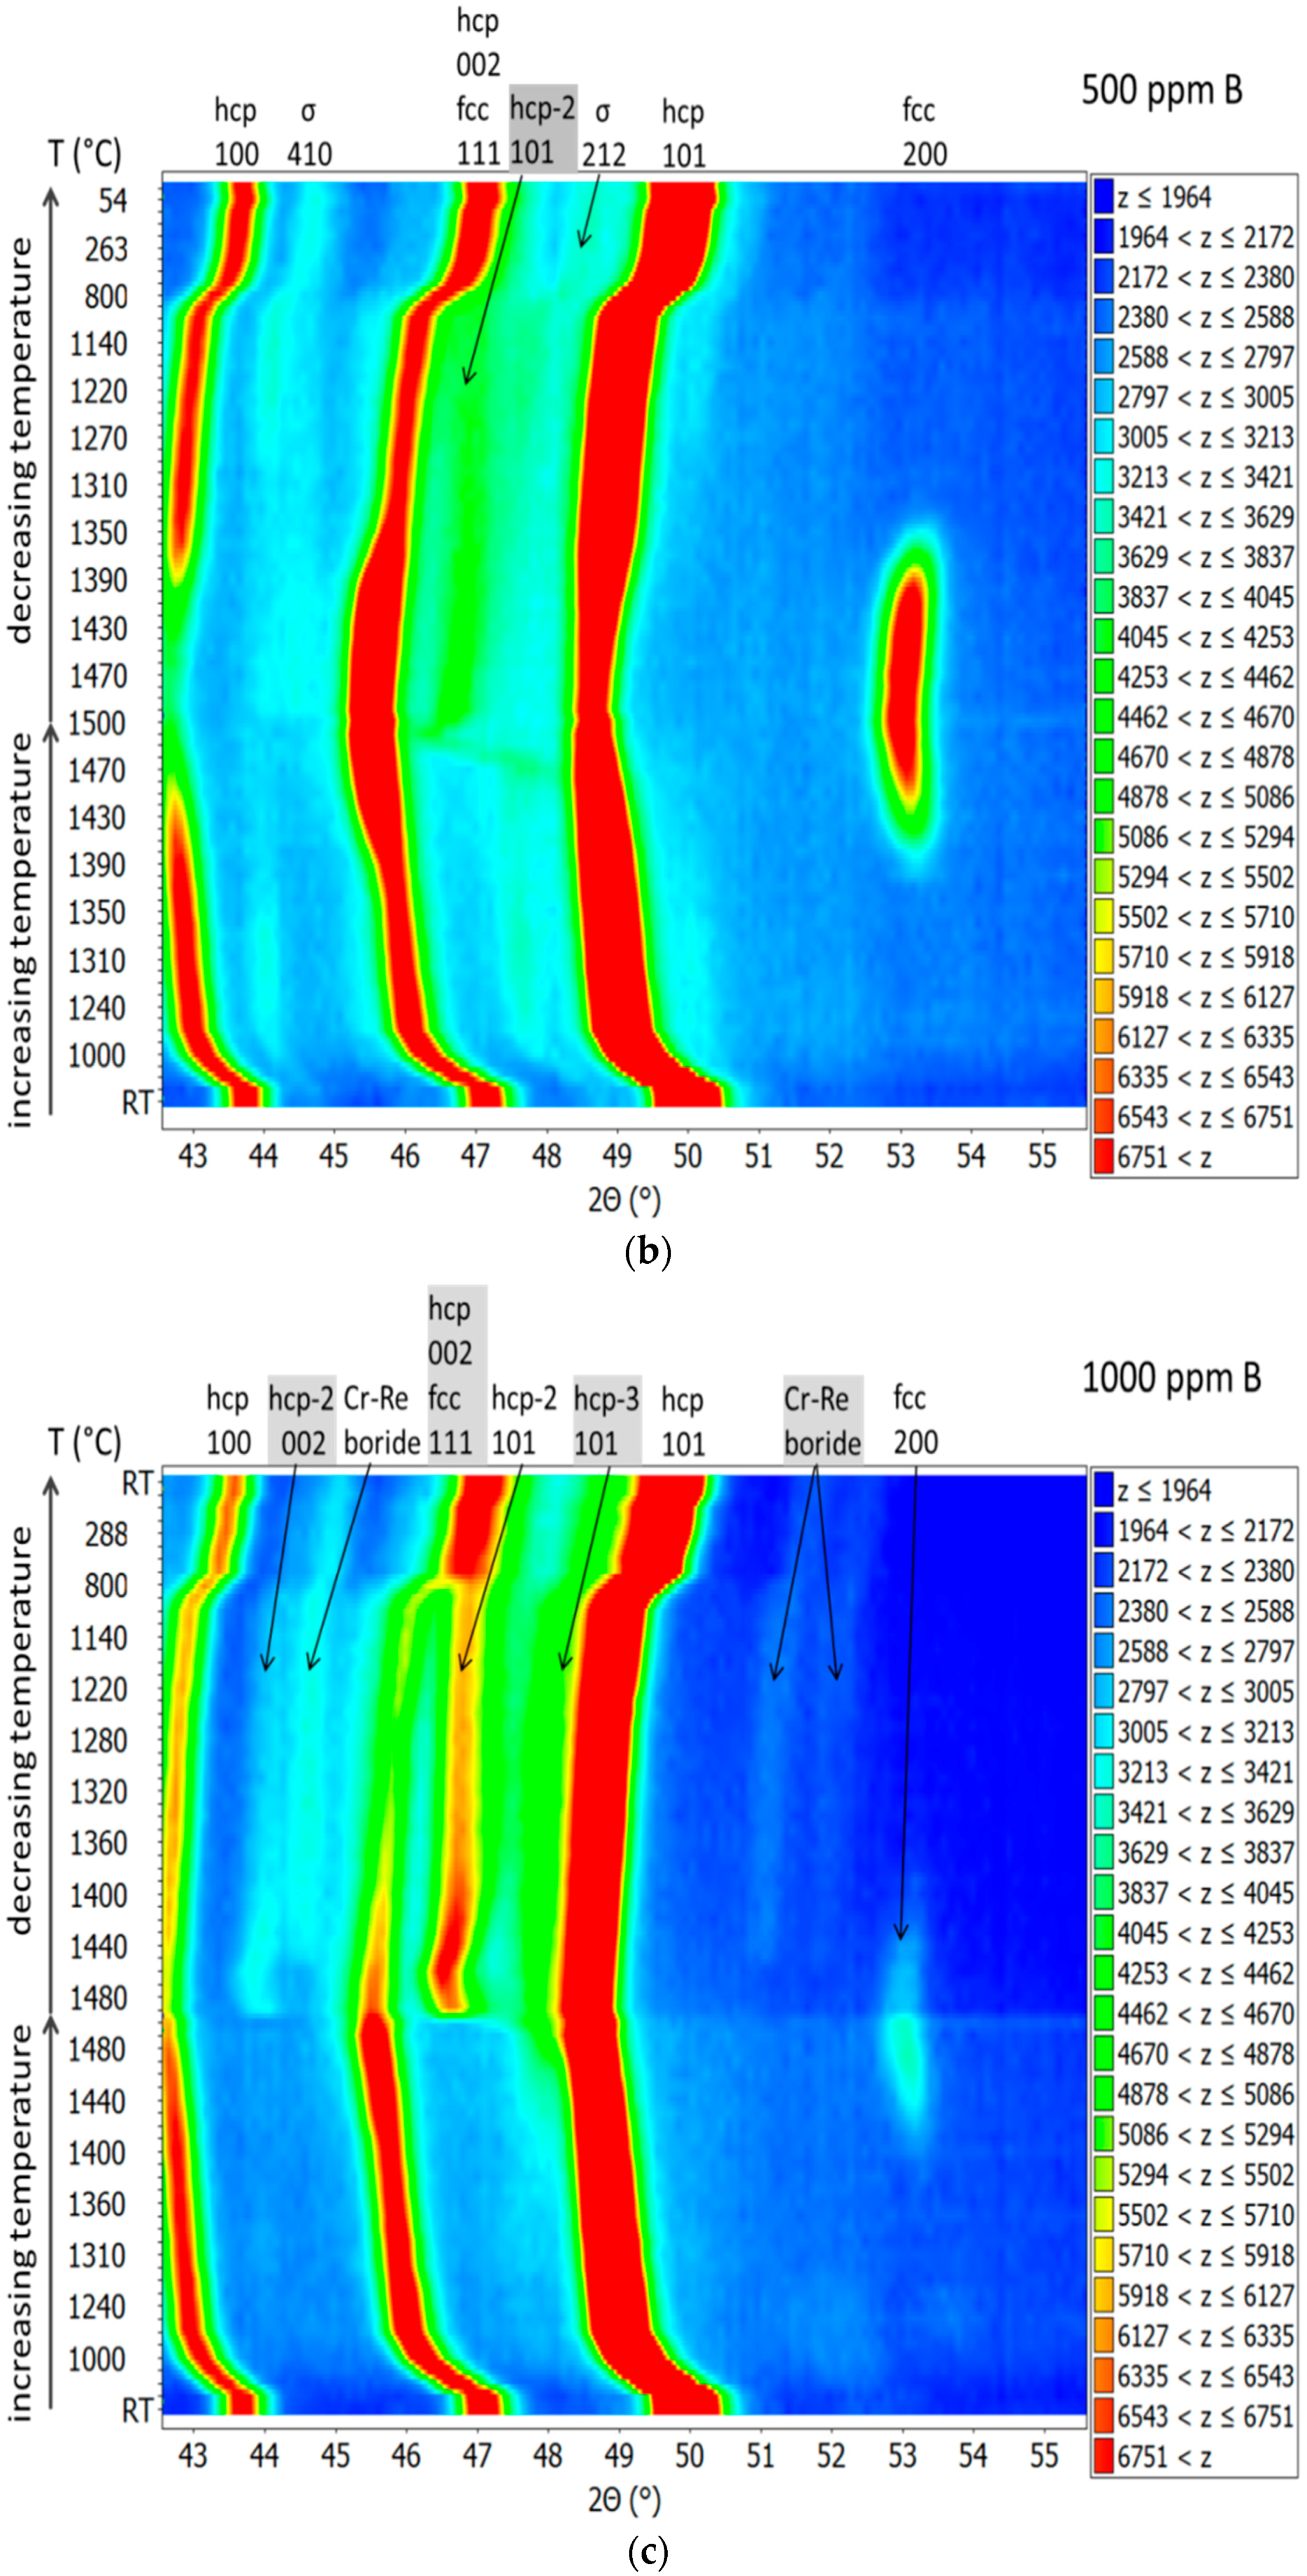
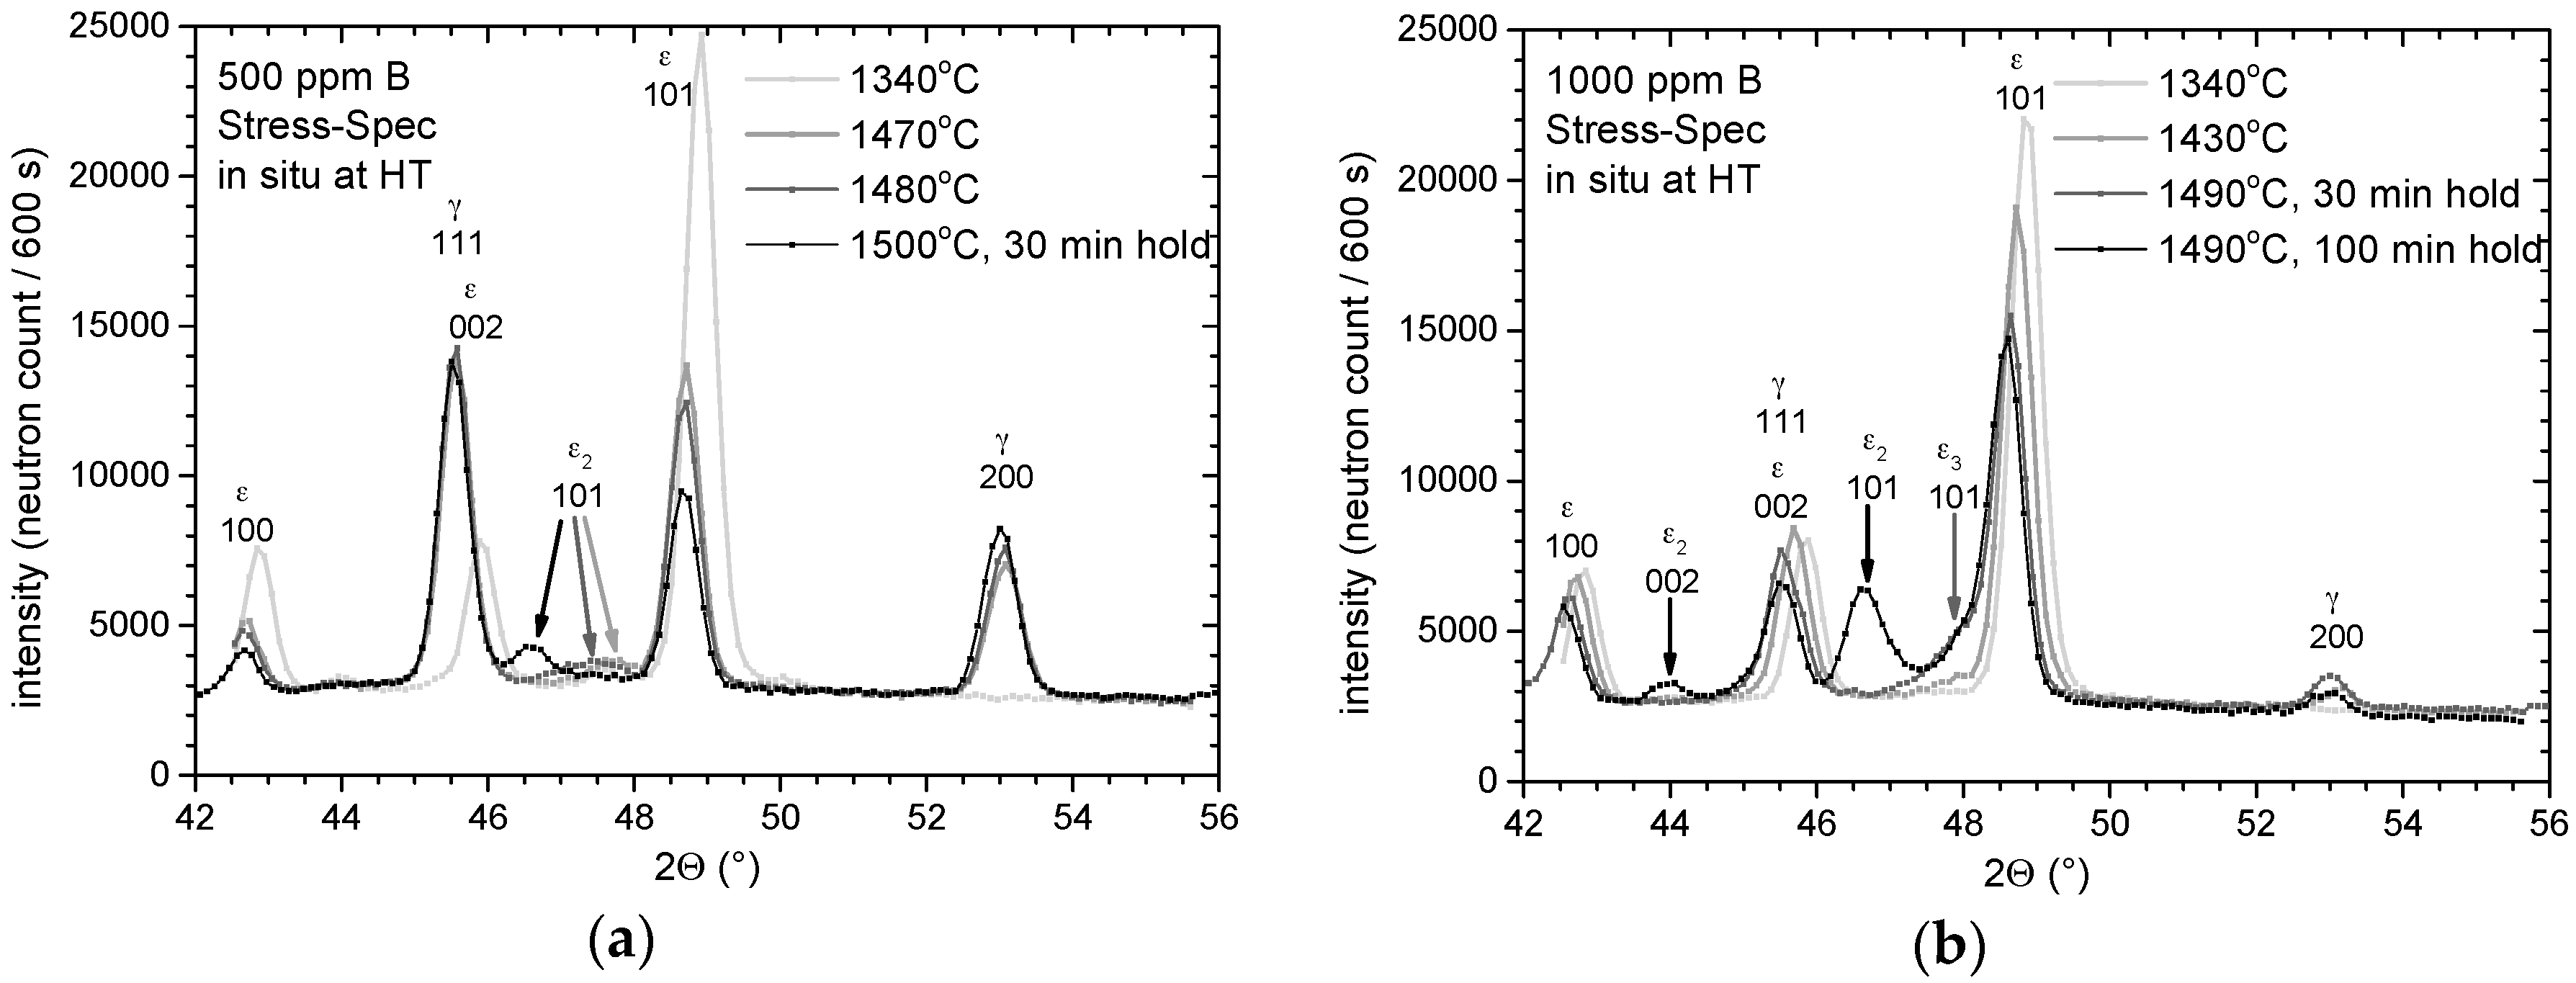
3.2. Neutron Diffraction Measurements at HT
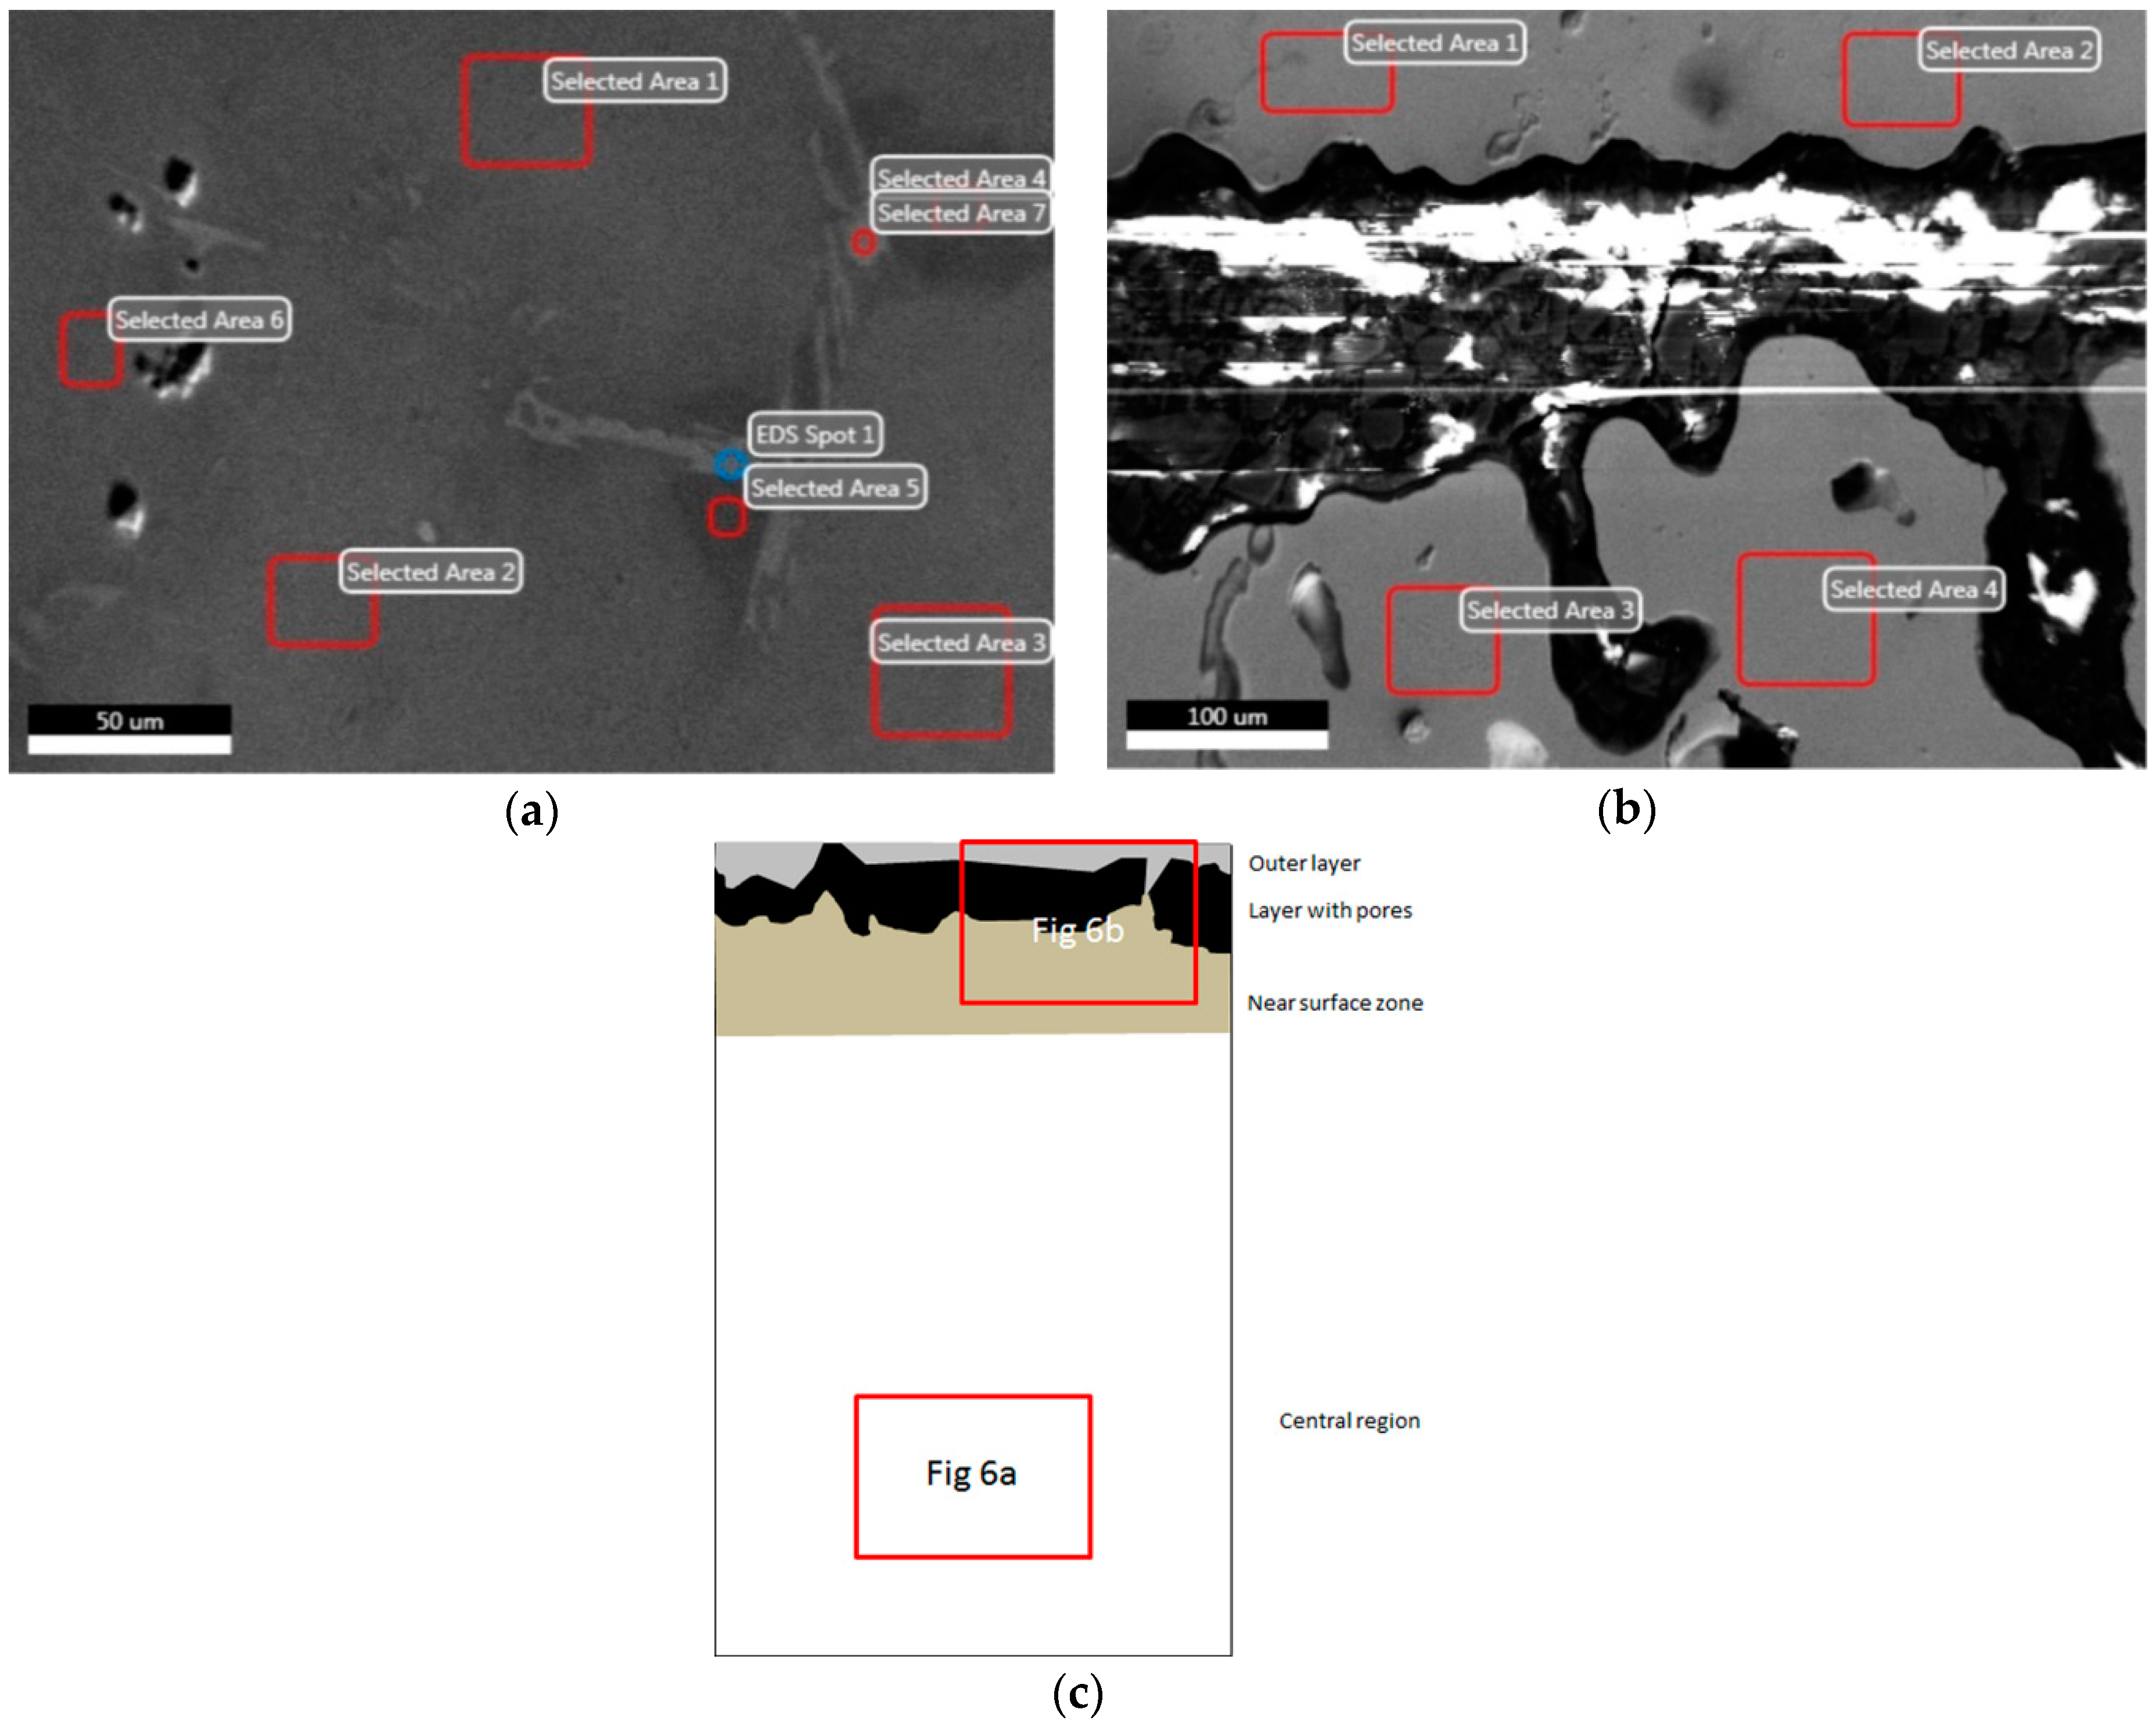
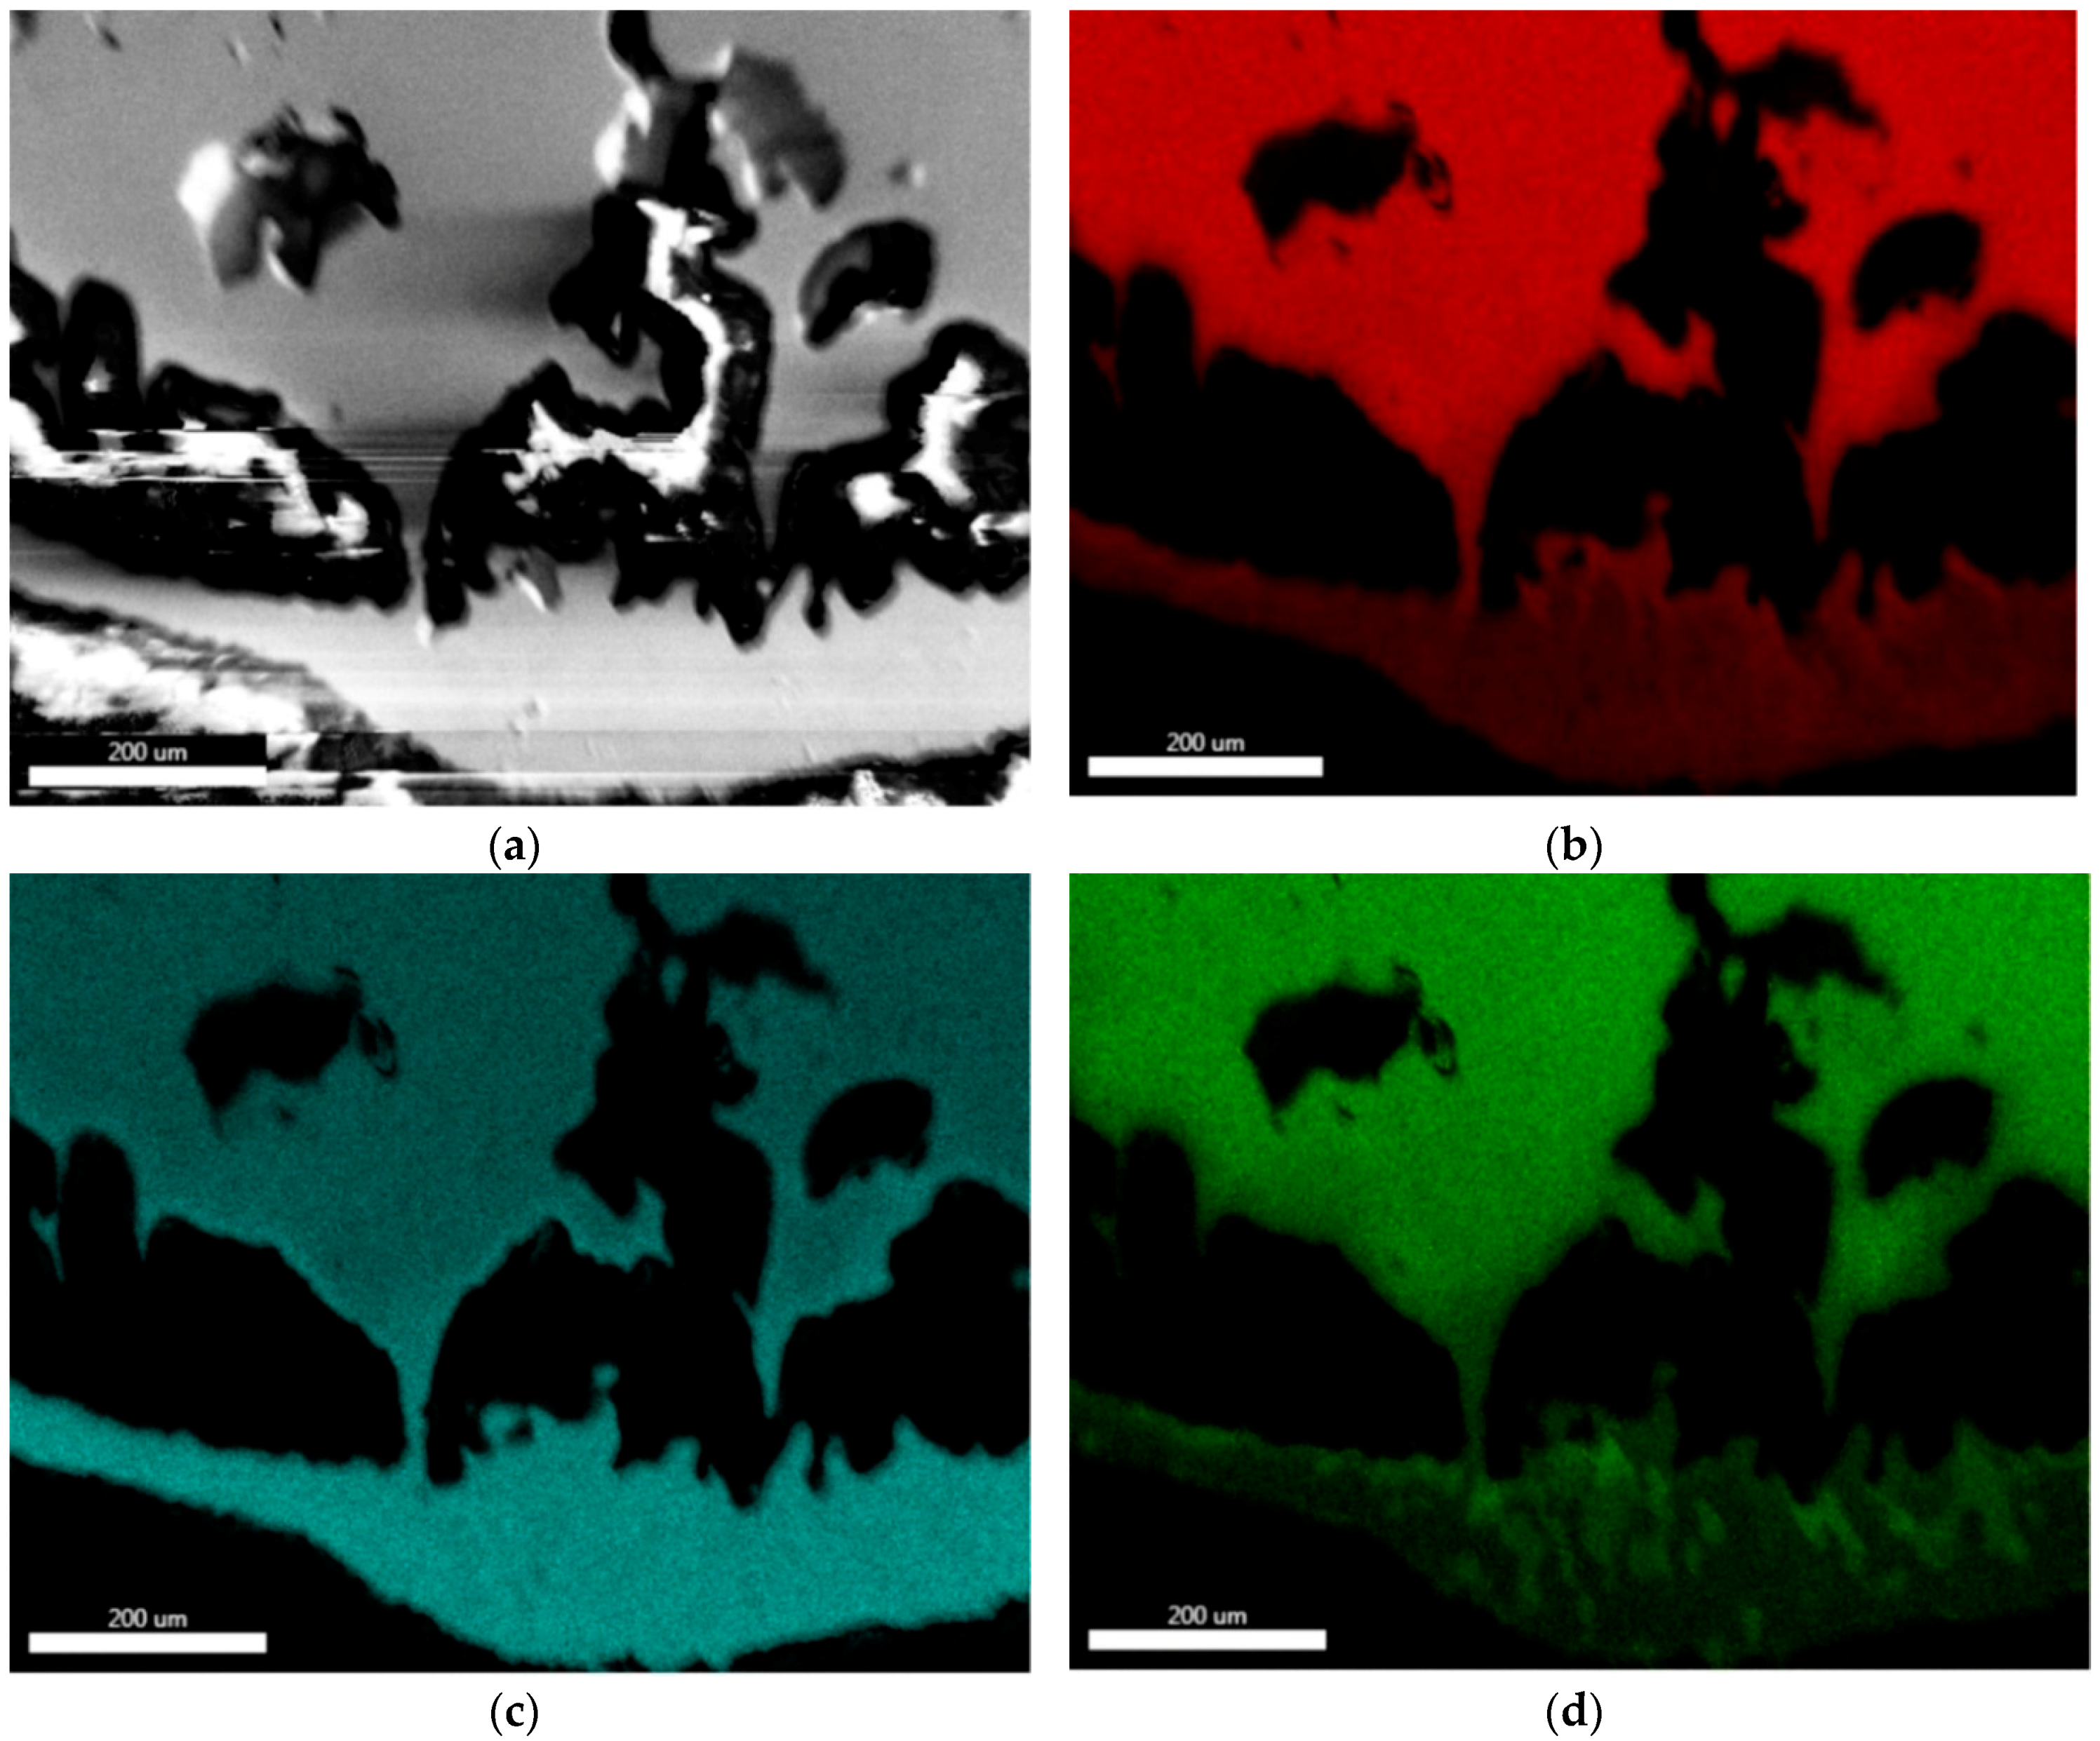
In Figure 3 (taken from [6]), the intensity maps are reported from the diffractograms taken during the in-situ thermal cycles for three of the studied samples (150, 500 and 1000 wt. ppm of boron). Selected diffractograms at certain temperatures are presented in the further figures to highlight some details important for discussion in this study.
The full angular range of the diffractograms from the sample with 1000 ppm B at RT before in-situ heating, at 1490 °C (i.e., the highest temperature for this sample) and at RT after the in-situ heating cycle are displayed in Figure 4. Together with the measured data, the figures also contain the optimum fits by Rietveld analysis [13] to the data. These will be discussed further below.
The evolution of diffractograms for 500 and 1000 ppm B samples in the important angular region around the 2θ diffraction angle of 49° at selected high temperatures near the highest applied temperature is shown in Figure 5. The appearance of new hexagonal phases can be seen (marked by arrows) in the samples with increasing temperature. The structural evolution with temperature is, however, different for the two samples.

3.3. SEM and EDS

The microstructure after in-situ ND measurement from the central part of the samples with different boron content (150, 500 and 1000 wt. ppm B) were presented in Figure 2 of the paper [6] and showed that—in addition to the primary and secondary σ phases—a Cr and Re-rich boride phase is present in the alloys. All phases are embedded in a ε-Co solid solution matrix. In this paper, we mainly present the microstructures at or near the surface of the cylindrical samples, which is relevant for this study, and compare them with the central region.
In Figure 6, the selected micrographs are shown. Figure 6a is from the central region of the 1000 ppm B sample while Figure 6b is from the surface region. The areas marked by red color in Figure 6a,b are areas from which compositions were determined quantitatively using EDS measurement. In Figure 6a,b, the central and the surface regions in the 1000 ppm B sample after the in-situ measurement are depicted and compared. The central region (Figure 6a) is not affected by any surface activities caused by heating, and the composition of the matrix (in areas 1 and 3) is not significantly different from the nominal composition of the alloy. The measured compositions (at %) from the selected area 1 of Figure 6a is Co 61.6, Re 17.6, Cr 20.8, and from the selected area 3 Co 61.6, Re 17.4, Cr 21.0. The average composition in the center is reported in Table 1.
The matrix region below the surface of the same sample is shown in Figure 6b. Two distinct parts of this region can be recognized: an outer layer (i.e., from the surface down to 200 μm under the surface) and a near-surface zone (200–500 μm under the surface). In this region, the matrix phase composition differs in the near-surface zone (selected area 3—Co 54.8, Re 35.6, Cr 9.6—and selected area 4—Co 51.6, Re 40.1, Cr 8.3—in Figure 6b) and in the outer layer (selected area 1—Co 23.1, Re 74.5, Cr 2.4—and selected area 2—Co 23.9, Re 73.1, Cr 3.0—in Figure 6b). In the near-surface zone, Cr content decreased more than 2×, and Re content increased more than 2× with respect to the central region of the sample. In the outer layer, the composition change is still larger. There is only a small amount of Cr in the outer layer, and the most abundant element is Re (about three-quarters of all atoms). The average compositions of the outermost layer and of the near-surface zone are reported in Table 1.
For comparison, the compositions after the in-situ ND measurement determined by EDS in the 150 ppm B sample was Co 60.5, Re 17.3, Cr 22.2 for the central region, and Co 60.7, Re 17.4, Cr 21.9 for the near-surface zone, i.e., the matrix did not differ significantly from the nominal composition of the alloy there and both regions were thus unaffected by heating. There was, however, also an outer layer with a significantly different composition (Co 35.4, Re 39.1, Cr 25.5) in the 150 ppm B sample after the in-situ ND measurement. Nevertheless, unlike for the high-boron samples, this outer layer was only 20 μm thick. That means that this layer was 10× thinner than in the 1000 ppm B sample and, consequently, its volume was too small to be detectable by ND.
Figure 7a shows microstructure right at the surface from which the EDS elemental distribution maps (Figure 7b–d) were determined in the 1000 ppm B sample. Formation of pores on the surface and also subsurface porosities is prominent, as expected from the observed surface structure shown in Figure 1b. The secondary electron (SE) image in Figure 7a shows that the outermost layer, separated by the pores in the image, is still brighter than the rest of the subsurface matrix surrounding the pore area. It should be noted, that the 150 ppm B sample did not exhibit so pronounced porosity near the surface.
The micrographs in Figure 7b–d show the elemental distribution in the surface region of the 1000 ppm B sample shown in Figure 7a. Co, Re and Cr are mapped in Figure 7b–d, respectively. The elemental maps clearly show that the outermost layer is very rich in Re but depleted in Co and Cr. The near surface zone surrounding the pores has significant amounts of Co and Cr in addition to Re. The porosities and the element distribution indicate that surface sublimation occurred in this sample.

3.4. Parameters Summary

The selected composition of phases measured by EDS and other relevant parameters (average atomic radius, hcp lattice parameters of Co-solid solution matrix calculated from average atomic radius, hcp matrix lattice parameters measured at RT after in-situ at HT, mass density of the phase calculated from the lattice parameters and composition, incoherent scattering cross section of the phases) are also reported in Table 1. These parameters are needed for the further discussion.

4. Discussion

4.1. Appearance of Additional Hexagonal Phases

The neutron diffraction data from the 500 ppm B sample measured at Stress-Spec (full angular range) at 1500 °C and at RT after the in-situ heating were fitted by Rietveld analysis using FullProf software (version 5.30, March 2012, ILL Grenoble, France) [13]. For the fitting, two hcp matrix phases (denoted hcp-1 and hcp-2 in what follows) were necessary. The hcp-1 is the Co-solid-solution-matrix ε phase originally present in the alloy after ST condition, and hcp-2 is the new phase that evolved during in-situ heating at very high temperatures. hcp-2 phase has very different (about 5%) cell parameters compared to the hcp-1 phase. The selection of the fitted data showing the refinement in the important angular range is shown in Figure 8. The difference in cell parameters between hcp-1 and hcp-2 phases (about 0.13 Å) is approximately the same at both 1500 °C and RT temperature after the in-situ cycle. This difference in the cell parameters of both hcp phases is significantly larger than the one observed in the SPODI data at RT shown in Figure 2 (where the difference was of the order of 0.01 Å).
In Table 2, the refined volume fractions of the individual phases at RT before heating, at the highest reached temperature of 1500 °C, and at RT after the in-situ cycle are listed both for 500 ppm B and for 1000 ppm B samples.
The volume fraction of hcp-2 phase at RT after the in-situ cycle is 4.5% in the 500 ppm B sample. The amount of σ phase in this sample increased from 2% to 5.5% during cooling the sample to RT from 1500 °C. At high temperature, a significant amount of γ-Co solid-solution matrix (fcc) is present as well (52%). The measurement at RT after in-situ heating is significantly influenced by the appearance of the hcp-2 phase and the compositional effects connected with it. It can significantly affect also the σ phase content.
It can be seen from the Figure 3b that the hcp-2 phase appears on heating to about 1460 °C in the 500 ppm B sample. With increasing temperature to 1500 °C, the angular position of the reflection 101 of the hcp-2 phase makes a large jump towards lower angles, which corresponds to a large increase in the cell parameter. This tendency does not continue during the hold at 1500 °C and the position of the reflection 101 of the hcp-2 phase remains stable. During cooling, 101 hcp-2 peak position changes only a little and this change can be ascribed to the thermal shrinkage.
The sample with 1000 ppm of boron has still more complex ND pattern at high temperatures. Structural evaluation for three full-angular-range ND patterns (Figure 4, measured at RT before in-situ heating, at 1490 °C and at RT after in-situ cooling) was carried out. The evaluation of the diffraction data revealed that three different hcp-phases (denoted hcp-1, hcp-2 and hcp-3) are present in this alloy after heating to very high temperatures. Above 1410 °C, γ-Co solid-solution matrix (fcc) is present as well. At the highest applied temperatures, neither σ phase nor borides were detected by ND. They were, nevertheless, present again after cooling to RT. The volume fractions of the individual phases obtained from Rietveld analysis of ND patterns are listed in Table 2.
The evolution of the diffraction pattern with temperature (for the selected angular region of 1000 ppm B sample measured at Stress-Spec) is presented in Figure 3c. In this alloy, the hcp-2 phase appeared during the long hold at 1490 °C. Figure 5 shows that it is not present at the beginning of the hold at 1490 °C (i.e., neither after 10 min, nor after 30 min), but it is clearly visible after 100 min hold at 1490 °C. Therefore, this phase appears rather suddenly sometimes during the hold time 30–100 min at 1490 °C. It also appears (Figure 5 and Table 2) that the new hcp-2 phase formed at the expense of all phases at HT (hcp-1, hcp-3 and fcc); nevertheless, the phase which decreased the most was the fcc matrix phase (see the decrease in fcc 200 reflection intensity—around 53°—during the hold at 1490 °C in Figure 3c or in Figure 5). The fcc phase decreased to less than half of its original volume fraction at 1490 °C. Preferential transformation of fcc to hcp-2 during the hold at 1490 °C can be understood if there is an enhancement of this phase by Cr and/or Re (which are hcp stabilizers). Then, the γ-fcc would be unstable and transform back to the hcp phase.
Even before the hcp-2 phase appears during the hold at 1490 °C, another hcp peak appears at a lower temperature of 1430 °C at around the angle of 47.9° in the 1000 ppm B sample (see Figure 5b). This peak belongs to hcp phase denoted hcp-3 and forms on the wing of the largest hcp-1 peak 101. Therefore, the hcp matrix splits in fact to three hcp phases at high temperatures in the highest boron content alloy.
The lattice parameters of the hcp-1 matrix phase for the sample with 1000 ppm B refined from the full angular range ND patterns are a = 2.55708(20) Å, c = 4.12395(33) Å at RT before the in-situ experiment and a = 2.61806(58) Å, c = 4.2480(10) Å at 1490 °C. The cell parameter of fcc matrix phase for the same sample is a = 3.69478(90) Å. The lattice parameters for hcp-1, hcp-2 and hcp-3 phases determined at RT after the in-situ treatment for the 1000 ppm B samples are recorded in Table 1.
Both hcp-2 and hcp-3 phases remain in the alloy on slow cooling to RT. Hence these phases are not a metastable or intermediate state. Nevertheless, the analysis of ND data shows, that there is a decrease of the hcp-2 in 1000 ppm B sample from approximately 24.5% at 1490 °C to 13% at RT on cooling.
The reason for the detected decrease of hcp-2 phase amount (Table 2) in both 500 and 1000 ppm B samples during cooling to RT can be twofold. Firstly, delamination of the part of the outer layer (composed of hcp-2) can occur during cooling. It can be promoted by different thermal expansion coefficients of hcp-2 and the other hcp phases. Secondly, Figure 7d shows Cr-rich and Cr-lean areas in the outer layer. Probably, the outermost layer then consists of hcp matrix and σ at RT with a significant amount of σ phase. σ could form in some areas of the outermost layer on cooling. In these areas, the remaining hcp-phase is severely depleted in Cr and the results suggest that its lattice parameters become similar to that of rhenium. Figure 7d suggests that σ precipitation does not occur everywhere in the outer layer and, therefore, also hcp-2 phase remains, but its volume is decreased. The combination of both abovementioned mechanisms is also possible.

4.2. Background Intensity

One striking feature in the ND data is the fact that the diffractograms from the samples with higher boron content (≥500 ppm B) have a lower diffuse background in the diffraction patterns (see e.g., the intensity maps in Figure 3 in the 2θ region around 55°, far away from the Bragg peaks). The background for three samples with different boron content is summarized in Table 3. The background at RT before the thermal cycle and at HT is by 10–12% lower for the 1000 ppm B sample than for the 150 ppm B sample. The background level for 500 ppm B sample is in between the background levels for 1000 and 150 ppm B samples.
This can be explained on the basis of larger absorption of neutrons by boron in the high-boron samples [14]. The background is predominantly (84%) caused by incoherent scattering from Co atoms as they have the incoherent scattering cross section equal to 4.8 barn (compared to 0.9 barn for Re and 1.83 barn for Cr; 1 barn = 10−24 cm−2) and, moreover, the element Co is the most abundant element in the studied Co-based Co–17Re–23Cr alloys (~60 at %). The absorption cross section in Co–17Re–23Cr alloy without boron is 2.97 cm−1, while it is 3.40 cm−1 for the 1000 ppm B sample, i.e., 14% higher. For the neutron path through the sample of a several millimeters length (which is the case here), it causes the abovementioned larger attenuation of the neutrons in the high-boron samples with respect to the low-boron samples. Particularly, the abovementioned decrease in the background intensity by 10–12% for 1000 ppm B sample with respect to the 150 ppm B sample would occur when the mean path of neutrons through the Co–Re alloy is 3 mm, which is reasonable (see the Materials and Methods section). For 3 mm flight path, the transmission is 0.324 for the 1000 ppm B alloy whereas it is 0.361 for the 150 ppm B alloy, i.e., roughly by 11% larger.
More important—and surprising at the same time—is, however, the decrease of the background during the hold at the highest measured temperature for the high-boron samples. This feature is clearly visible for the 1000 ppm B sample and—less pronounced but still present—for the 500 ppm B sample. The decrease of the background intensity during the 2 h hold at the temperature of 1490 °C is roughly 14% for the 1000 ppm B sample. This effect occurs at the same time at which the hcp-2 phase appears.
This effect can be explained by incoherent scattering change due to the lowering of the Co and Cr amount from the surface. Sublimation could lower the Co and possibly also Cr content in the matrix near the surface of the sample. The gauge volume for ND experiment is—due to the relatively large absorption in the Co-Re alloy—positioned mainly within 1 mm below the sample surface (see the Materials and Methods section). Lowering of Co and Cr concentration in the gauge volume should then result in the decrease of incoherent background from Co and Cr atoms.

4.3. Explanation of the Formation of New Phases

The hcp-2 and hcp-3 phases were formed only in 500 and 1000 ppm B samples at high temperatures (Figure 3b,c, Figure 5 and Figure 8).
There is an indication of sublimation on the surface of the in-situ HT samples, which were held at 1490 or 1500 °C under vacuum (Figure 1). The signs of sublimation are the largest for the 1000 ppm B sample. EDS results (Figure 6 and Table 1) further indicate that the surface region of high B sample has a different composition than the center of the sample, particularly depletion of Co and Cr in the subsurface region is noticed. The incoherent scattering considerations also point to a decrease of Co (and possibly also Cr) concentration in the region down to 1 mm below the surface.
Therefore, the explanation for the formation of the new phases hcp-2 and hcp-3 can be connected to the loss of Co and Cr from the surface through sublimation. The depletion of Co in the surface layer would cause a shift of the lattice parameter of the hcp matrix phase towards larger values as the matrix becomes Re-rich. This is exactly the observation in the ND measurements when the hcp peaks split into hcp-1 and hcp-2 peaks. The samples heated to 1490 °C (1000 ppm B) or 1500 °C (500 ppm B) contain a surface layer of hcp phase but with very much shifted cell parameters (denoted hcp-2 in this article). The center of the sample is, however, not affected and retains the original hcp-1 cell parameters. The cell parameters on the surface region had quickly evolved, which can be explained by progressive Co sublimation. This would lead to hcp matrix phase splitting into two phases (hcp-1 and hcp-2) where the hcp-1 phase remains the same as the original solid solution (unaltered composition) while the hcp-2 phase is also a solid solution, but with strongly altered composition due to sublimation.
There can also be a transitional layer between hcp-1 and hcp-2 which is only slightly depleted by Co (i.e., enriched by Re). This phase, denoted hcp-3, has then slightly (by about 1.5%) shifted lattice parameters. It appears earlier (i.e., at lower temperature 1430 °C on heating) than the formation of the hcp-2 layer in 1000 ppm B sample.
The formation of new phases can be thus at least qualitatively explained by Co and Cr sublimation from the sample surface.

4.4. Identification of Phases

In order to assign the hcp-2 and hcp-3 phases in the 1000 ppm B sample determined by ND to the various concentrations of elements measured by EDS in the different regions of the sample (see Figure 6 and Table 1), the following analysis was done.
The model crystallographic cell parameters were calculated from the compositions determined by EDS using the atomic radii for Co (rCo = 1.26 Å), Re (rRe = 1.51 Å) and Cr (rCr = 1.39 Å) taken from [15]. The average atomic radii rhcp1, rhcp2 and rhcp3, were calculated using the EDS determined atomic concentrations and are reported in Table 1 for different regions of 1000 ppm B sample. It was assumed that the difference of the lattice parameter (a as well as c) for the individual new hexagonal matrix phases hcp-2 and hcp-3 with respect to the original hcp-1 lattice parameter is proportional to the difference between the average atomic radii of the elements in these phases. The slope of the linear dependence was calculated using the average covalent atomic radius rhcp1 in the center of the sample (where only hcp-1 phase is expected) and ND-measured lattice parameters for hcp-1 phase (ahcp1 and chcp1, see Table 1) as well as for pure Re (which is hexagonal with lattice parameters aRe = 2.761 Å and cRe = 4.456 Å). Therefore, the model lattice parameters were calculated using the formula
a hcpi = a hcp 1 + a Re a hcp 1 r Re r hcp 1 ( r hcpi r hcp 1 ) ,
where ahcpi stands for either lattice parameter ahcp2 of the hcp-2 phase or ahcp3 of the hcp-3 phase. The same kind of formula is used for chcp2 or chcp3. The model lattice parameters calculated in this way for the typical elemental concentrations measured by EDS near and at the sample surface are written in Table 1 (the column header “hcp lattice parameters calculated”). In the next column of Table 1, also the ND-measured lattice parameters of hcp-2 and hcp-3 phases are reported for 1000 ppm B sample at RT after the in-situ heating experiment. The ND-measured lattice parameters for hcp-2 and hcp-3 were written to those rows of Table 1, in which the most similar model lattice parameters are. In this way, hcp-2 and hcp-3 phases found by ND are correlated in the table with the EDS results and, consequently, identified in the micrographs. The hcp-2 phase is in the selected areas 1 and 2 of the micrograph in Figure 6b, the hcp-3 phase is in the selected areas 3 and 4 of that micrograph. The hcp-2 phase is thus the outer layer of the sample which is about 100 μm thick. The hcp-3 phase is the near-surface zone, which is the transition region between the outer layer and the center of the sample.
When using the volume fractions of the individual hcp phases at RT after the in-situ measurement from Table 2, and the EDS determined concentrations in these phases (Table 1), one can estimate the concentration of the elements in the gauge volume examined by ND to be Co 54.8%, Re 29.5%, Cr 15.7% (at %). It can be thus concluded that the sublimation depletes the 1 mm layer nearby the 1000 ppm B sample surface (with respect to the state before the in-situ measurement) by 11% in Co and by 25% in Cr, and that this evolution caused—at the same time—the relative Re enhancement by 69%.
Further, the observed 14% decrease in the incoherent background at 1490 °C for the 1000 ppm B sample can be explained by a decrease in Co concentration of similar magnitude at HT, and partly also by Cr concentration change. If we assume the phase composition at HT in the gauge volume according to Table 2, and the corresponding incoherent cross sections for the phases according to Table 1 (the last column), then the average incoherent scattering cross section decreased to 0.323 cm−1 from the original value at RT before in-situ measurement of 0.364 cm−1. It is 11% decrease, mainly due to the lower average concentration of Co. Eleven percent lower incoherent scattering cross section fits rather well with the observed drop in the background intensity by 14% during the two-hour hold at the temperature of 1490 °C. Therefore, also the background decrease during the hold at the highest reached temperature can be explained well by Co and Cr sublimation from the sample surface.

4.5. Boron Influence

It is obvious from the presented ND measurements that the higher boron content enhances the sublimation of Co from the surface. The sample with the highest boron content 1000 ppm B, heated to 1490 °C has more hcp-2 phase (and additionally also the presence of hcp-3 phase—see Table 2) than the sample having only half of the boron content (500 ppm B) and heated to even higher temperature of 1500 °C. Also, the low-boron content samples do not exhibit formation of hcp-2 and hcp-3 phase at high temperatures at all [6], and Co sublimation from the surface is thus either negligible or of much lower extent in them.
It is well known [16] that one major influence of boron addition to Co and Ni alloys is lowering the melting point. In case B is freely available in the matrix, it would probably have a similar effect also in Co–Re alloys. Lowering of the melting point would enhance the tendency to sublimation as well. One possible explanation why the higher B content in Co–Re alloys leads to a stronger sublimation of Co and Cr is thus that the boron is not captured in borides at very high temperatures anymore (unlike at RT and lower temperatures). If the borides are dissolved in the matrix, the free boron could promote the sublimation of Co and Cr. Although it is not possible to determine at which temperature the borides dissolve on heating in 1000 ppm B sample due to the higher background, it can be deduced from Figure 3c that borides are formed on cooling from HT at around 1460 °C.
The influence of boron content on the sublimation of Co and Cr must be carefully considered and tested for the high-temperature application of Co-Re alloys. The present experiments were done under high vacuum, but experiments also in atmospheric pressure should be done. Further, it should be tested not only at the high temperatures (over 1400 °C) as in the present case, but also for longer hold periods at lower temperatures 1200–1300 °C which is actually the anticipated service temperature for Co–Re alloys in gas turbines. However, it may also be mentioned that gas turbine components from Co–Re alloys for such high temperatures are likely to be protected by a surface coatings (like the present Ni-superalloy components) and thus the sublimation effect can be quite different.

5. Conclusions

It is clear from the present measurements that the higher boron content in the Co–Re–Cr alloy promotes the sublimation of Co and Cr from the surface at high temperatures. The effect is enhanced with increasing boron content. Co and Cr sublimation from the sample surface leads to the enrichment of the matrix with Re, particularly in the surface region of the samples. The Re enrichment results in the appearance of second, hcp-2, or even third, hcp-3, matrix hcp phases at and near the sample surface.
By correlating the lattice parameters measured by ND with the composition measured by EDS, it was possible to identify the newly formed phases in the alloy that appeared at HT. EDS and ND results were used to estimate the amount of Co and Cr which was lost due to the sublimation from the near-surface region of the high-boron content samples.
From the point of view of alloy development, sublimation of Co and Cr in B-rich Co-Re alloys can be rather seen as not critical because the temperature range where the sublimation is observed (≥1430 °C) is relatively high compared to the aimed application temperature of the Co-Re alloys (~1200 °C). Moreover, it may be stressed that the service environment in gas turbines is usually not high vacuum (as was the case in the present in-situ tests). Also, turbine blades are coated with a complex multilayer coating system. It is envisaged that Co-Re alloys in similar applications will also be always used with a coating. The coating not only creates a thermal barrier (allowing higher gas temperature), it also protects the alloy from oxidation. In the same context, they will also prevent sublimation from the substrate.
Although Co and Cr sublimation seems not to be a critical issue for the alloy development, the boron-content influence on sublimation of Co and Cr has to be carefully considered and tested in case of prospective high-temperature application of Co-Re alloys. Therefore, in-situ studies should be conducted under pressure in future as well. Further, tests should not only be done at temperatures over 1400 °C but also at lower operation temperatures of 1200–1300 °C but with long holding.

Author Contributions

Conceptualization, D.M., P.S. and J.R.; Methodology, D.M. and P.S.; Software, P.B.; Validation, P.S., D.M. and P.B.; Formal Analysis, P.B., P.S. and D.M.; Investigation, P.S., D.M., P.B., R.G., L.K., M.H. (Michael Hofmann), M.H. (Markus Hoelzel) and G.F.; Resources, D.M. and J.R.; Data Curation, P.S., D.M., P.B. and R.G.; Writing—Original Draft Preparation, P.S.; Writing—Review & Editing, P.S., D.M., P.B. and R.G.; Visualization, P.B., P.S. and D.M.; Supervision, P.S., D.M. and R.G.; Project Administration, P.S.; Funding Acquisition, J.R., R.G., D.M., P.S.

Funding

This research was funded by DFG grants number RO 2045/31-1 and GI 242/4-1, GAČR grant number 14-36566G, and by MŠMT grant number LM2015056.

Acknowledgments

The authors would like to thank the German Research Foundation (DFG) for providing the financial support for the joint Co–Re alloy development project at TU Braunschweig and TU München (RO 2045/31-1 and GI 242/4-1, respectively). The authors thank MLZ Garching, Germany, and CANAM (NPI Řež, CZ MSMT infrastructural project No. LM2015056), Czech Republic, for providing the beamtime for neutron scattering measurements and tests. P. Strunz, P. Beran and G. Farkas acknowledge support by GACR project no. 14-36566G.

Conflicts of Interest

The authors declare no conflict of interest.

References

  1. Rösler, J.; Mukherji, D.; Baranski, T. Co-re-based alloys: A new class of high temperature materials? Adv. Eng. Mater. 2007, 9, 876–881. [Google Scholar] [CrossRef]
  2. Mukherji, D.; Rösler, J.; Kruger, M.; Heilmaier, M.; Bolitz, M.-C.; Volkl, R.; Glatzel, U.; Szentmiklosi, L. The effects of boron addition on the microstructure and mechanical properties of Co–Re-based high-temperature alloys. Scr. Mater. 2012, 66, 60–63. [Google Scholar] [CrossRef]
  3. Mukherji, D.; Strunz, P.; Gilles, R.; Hofmann, M.; Schmitz, F.; Rösler, J. Investigation of phase transformations by in-situ neutron diffraction in a Co–Re-based high temperature alloy. Mater. Lett. 2010, 64, 2608–2611. [Google Scholar] [CrossRef]
  4. Mukherji, D.; Strunz, P.; Piegert, S.; Gilles, R.; Hofmann, M.; Hoelzel, M.; Rösler, J. The Hexagonal Close-Packed (HCP) to Face-Centered Cubic (FCC) Transition in Co–Re-Based Experimental Alloys Investigated by Neutron Scattering. Metall. Mater. Trans. A 2012, 43, 1834–1844. [Google Scholar] [CrossRef]
  5. Gilles, R.; Strunz, P.; Mukherji, D.; Hofmann, M.; Hoelzel, M.; Roesler, J. Stability of phases at high temperatures in CoRe based alloys being developed for ultra-high temperature applications. J. Phys. 2012, 340, 012052. [Google Scholar] [CrossRef] [Green Version]
  6. Strunz, P.; Mukherji, D.; Beran, P.; Gilles, R.; Karge, L.; Hofmann, M.; Hoelzel, M.; Rösler, J.; Farkas, G. Matrix transformation in boron containing high-temperature Co–Re–Cr alloys. Met. Mater. Int. 2018, 24, 934–944. [Google Scholar] [CrossRef]
  7. Gilles, R.; Hoelzel, M.; Schlapp, M.; Elf, F.; Krimmer, B.; Boysen, H.; Fuess, H. First test measurements at the new structure powder diffractometer (SPODI) at the FRM-II. Z. Kristallogr. Suppl. 2006, 23, 183–188. [Google Scholar] [CrossRef]
  8. Hoelzel, M.; Senyshyn, A.; Juenke, N.; Boysen, H.; Schmahl, W.; Fuess, H. High-resolution neutron powder diffractometer SPODI at research reactor FRM II. Nucl. Instr. Meth. A 2012, 667, 32–37. [Google Scholar] [CrossRef]
  9. Hofmann, M.; Schneider, R.; Seidl, G.A.; Kornmeier, J.; Wimpory, R.; Garbe, U.; Brokmeier, H.G. The new materials science diffractometer STRESS-SPEC at FRM-II. Physica B 2006, 385–386, 1035–1037. [Google Scholar] [CrossRef]
  10. Mukherji, D. Electron Microscopy: A Versatile Tool for Material Characterization. Available online: https://bookboon.com/en/electron-microscopy-ebook (accessed on 2 August 2018).
  11. Cliff, G.; Lorimer, G.W. Quantitative-analysis of thin specimens. J. Microscopy 1975, 103, 203–207. [Google Scholar] [CrossRef]
  12. Beran, P.; Mukherji, D.; Strunz, P.; Gilles, R.; Hofmann, M.; Karge, L.; Dolotko, O.; Rösler, J. Effect of composition on the matrix transformation of the Co–Re–Cr-Ta–C. alloys. Met. Mater. Int. 2016, 22, 562–571. [Google Scholar] [CrossRef]
  13. Rodríguez-Carvajal, J. Recent advances in magnetic-structure determination by neutron powder diffraction. Phys. B Condens. Matter 1993, 192, 55. [Google Scholar] [CrossRef]
  14. Kester, L.; Rauch, H.; Seymann, E. Neutron scattering lengths: A survey of experimental data and methods. At. Data Nucl. Data Tables 1991, 49, 65–120. [Google Scholar]
  15. Cordero, B.; Gómez, V.; Platero-Prats, A.E.; Revés, M.; Echeverría, J.; Cremades, E.; Barragán, F.; Alvarez, S. Covalent radii revisited. Dalton Trans. 2008, 21, 2832–2838. [Google Scholar] [CrossRef] [PubMed]
  16. Huang, X. Low-Melting Boron-Free Braze Alloy Compositions. U.S. Patent 8,197,747, 12 June 2012. [Google Scholar]
Figure 1. Samples (6 mm diameter) after in-situ measurement at HT (up to 1500 °C): (a) without boron, (b) 1000 ppm B sample.
Metals 08 00621 g001
Figure 2. (a) Diffractogram measured at RT (in ST condition) on the sample 1000 ppm B. Two hcp phases and the tetragonal σ phase were needed to describe the diffraction data. The graph (b) shows the hcp phase diffraction peaks at large angles, where their splitting (ε, ε’) can be clearly observed.
Metals 08 00621 g002
Figure 3. Temperature dependence of the diffractograms for three measured samples: (a) 150 ppm B, (b) 500 ppm B, and (c) 1000 ppm B. The important reflections are marked. The marking on the left denotes the temperature on heating (bottom part) and cooling (upper part). The temperature steps were fine (10 K) in the important temperature region where the matrix transformations occur (i.e., at high temperatures), while they were large at low and intermediate temperatures (from RT up to at 1000 °C). The color-map intensity levels (the color range is shown on the right) were selected in such a way that the weaker reflections are also clearly visible. The graphs are reproduced from [6], with permission from Springer Nature, 2018.
Metals 08 00621 g003aMetals 08 00621 g003b
Figure 4. Diffractograms for 1000 ppm B sample (a) at RT before in-situ cycle, (b) at 1490 °C and (c) at RT after in-situ cycle.
Metals 08 00621 g004
Figure 5. Evolution of HT diffractograms for (a) 500 ppm B and (b) 1000 ppm B samples nearby the highest reached temperature of 1500 °C (for 500 ppm B) and 1490 °C (for 1000 ppm B). The sequence of hcp phase splitting, which is different for both samples, can be observed.
Metals 08 00621 g005
Figure 6. Micrographs used for EDS analysis. (a) 1000 ppm B sample after in-situ measurement, central region, (b) 1000 ppm B sample after in-situ measurement, surface region (the bottom part depicts the near-surface zone, the upper part corresponds to the outer layer), (c) scheme (not to scale) of the position of Figure 6a,b with respect to the surface.
Metals 08 00621 g006
Figure 7. (a) The micrograph of the surface of the 1000 ppm B sample, showing pore formation due to sublimation (here, the bottom part depicts the outer layer) and used for elemental distribution mapping, (b) Co elemental distribution map, (c) Re elemental distribution map and (d) Cr elemental distribution map.
Metals 08 00621 g007
Figure 8. The section of the diffractograms (a) at 1500 °C and (b) at RT after the in-situ thermal cycle for 500 ppm B sample, showing the refinement in the important angular range. The arrows depict the positions of hcp-2 reflections 100, 002 and 101.
Metals 08 00621 g008
Table 1. Compositions of phases measured by EDS and other measured and calculated parameters for 1000 ppm B sample.
EDS Region 2EDS Spot 3Composition (at %)Average Atomic Radius rhcp (Å)hcp Lattice Parameters Calculated 4Phasehcp Lattice Parameters Measured 5Density Calculated (g/cm3)Incoherent Scat. 6 (cm−1)
Co ReCr ahcpi (Å)chcpi (Å) a (Å)c (Å)
center1 and 3 in Figure 6a61.617.520.91.3309- 1- 1hcp-12.5631 (2)4.1321 (3)11.270.364
outer layer1 and 2 in Figure 6b23.573.82.71.44802.69254.3439hcp-22.6928 (4)4.326 (1)18.980.211
near surface zone3 and 4 in Figure 6b53.237.89.01.36622.60214.1960hcp-32.606 (1)4.213 (3)14.260.350
1 The values measured in the center by ND are taken as input values for calculation of lattice parameters in the other parts of the sample; therefore, the calculation is obsolete here; 2 EDS region 2 of 1000 ppm B sample; 3 average of the selected area; 4 hcp lattice parameters calculated using average atomic radius; 5 hcp lattice parameters measured by ND at RT (after in-situ at HT) for the individual hcp phases, and their assignment to the observed EDS concentrations; 6 incoherent scattering cross section.
Table 2. Volume fractions of individual phases from the refinement of full ND patterns of 500 ppm B and 1000 ppm B samples. The errors in brackets are standard deviations resulting from the Rietveld refinement.
SamplePhaseVolume Fraction at RT before In-Situ Treatment (%)Volume Fraction at 1500 (500 ppm B) or 1490 °C (1000 ppm B) (%)Volume Fraction at RT after In-Situ Treatment (%)
500 ppm Bhcp-198(0.6)%34(0.7)%90(0.7)%
hcp-2-12(0.7)%4.6(0.4)%
fcc-52(0.7)%-
σ2(0.3)%2(0.5)%5.4(0.4)%
1000 ppm Bhcp-196.3(0.6)%(1.2)53.8%62.2(1.4)%
hcp-2-0% 112.9(0.5)%
hcp-3-34.6(1.1)%18.8(1.3)%
fcc-11.6(0.3)%-
σ2.1(0.1)%-3.9(0.3)%
Cr2B1.6(0.3)%-2.2(0.2)%
1 The hcp-2 phase, however, appeared during 100 min hold at 1490 °C in large amount (at 1480 °C during subsequent cooling, the phase composition refined using diffractogram taken in the limited angular range was hcp-1: 42.5%, hcp-2: 24.5%, hcp-3: 28.1%, fcc: 4.9%).
Table 3. The background intensity at 2θ = 55° for three boron containing samples. The estimated error is ±50 for all the values in the table.
Background (in 600 s)
Sample (Boron Content)At RT before the In-Situ Thermal CycleAt HTAt RT after the In-Situ Thermal Cycle
150 ppm B245027402440
500 ppm B237025302240
1000 ppm B21502460 before hcp-2 formation,
2110 after hcp-2 formation
1900

