1. Introduction
Copper powders have found a wide industrial application for a very long time [
1]. Cu in a powder form is often used in the electrical and electronic industries due to its excellent electrical and thermal characteristics. The self-lubricating bearing is probably the most common application of Cu powder and about 70% of the total Cu powder production in a granular form is used for that purpose. This application takes advantage of the ability to produce a component with controlled interconnected and surface-connected porosity. Copper powders are also used in such nonstructural applications as brazing, cold soldering, and mechanical plating, as well as for medals and medallions, metal-plastic decorative products and a variety of chemical and medical purposes.
The Cu powder production methods can be divided into electrolytic and non-electrolytic (or chemical) methods. Processes such as ultrasonic spray pyrolysis [
2], solvothermal synthesis [
3], cementation [
4], chemical reduction methods [
5,
6,
7,
8], the high-energy electrical explosion method [
9], atomization [
10], pyrolysis [
11], polyol processes [
12,
13,
14], hydrometallurgy [
15], etc. belong to the group of non-electrochemical or chemical processes of synthesis. The chemical reduction method is often referred to as electroless deposition [
15,
16]. Various reducing agents, such as ascorbic acid [
5,
8,
16], hydrazine hydrate [
7], sodium borohydride [
6], and formaldehyde [
15], are used in the chemical reduction processes. Copper, in the form of nanoparticles, can be synthesized in ethylene glycol (EG) using copper sulphate as a precursor, and vanadium sulfate as an atypical reductant [
17]. Metal nanoparticles can also be obtained by biosynthesis processes using the microorganisms, which has clear advantages compared to chemical synthesis methods [
18]. The biosynthesis processes are environmentally friendly, no toxic chemicals or reagents are needed for these processes, and it is possible to synthesize particles that cannot be obtained using chemical synthesis methods.
Aside from the above-mentioned methods of synthesis, electrolysis is often used for Cu powder synthesis. The advantage of this method of synthesis can primarily be attributed to the fact that the shape and size of particles can be easily regulated by the choice of electrolysis regime and parameters [
19]. The regimes, both constant (potentiostatic [
20] and galvanostatic [
21,
22,
23]) and periodically changing [
19,
24,
25,
26], are used for the Cu synthesis in powder form. The electrolysis parameters that affect the final shape of the particles, are: the type and composition of electrolytes, presence of additives, temperature, type of cathode, electrolysis time, etc. [
19,
21,
25,
27,
28,
29,
30]. Special attention has been dedicated to the effect of the hydrogen evolution reaction as the parallel reaction to Cu electrolysis in the production range of Cu powder [
20,
24].
The shape of Cu powder particles is related to their synthesis method. The four various forms of Cu particles can be identified as: almost ideal micro spheres, irregular rough particles, disperse cauliflower-like particles and dendrites. Dendrites are the most commonly observed shape of particles and they can be obtained by both electrolysis and some chemical methods such as the galvanic replacement reaction method [
31]. The very disperse cauliflower-like particles are formed by the electrolysis in conditions of strong hydrogen evolution as the parallel reaction [
19,
20]. Irregular particles are obtained by water atomization [
32] while spherical particles are obtained by the gas-atomizing process [
32]. Aggregates of non-uniform irregular particles are obtained by the polyol process [
12]. Almost ideal Cu spheres can be also obtained by the polyol process [
12]. Polyhedral, non-agglomerated monodispersed particles are obtained using ascorbic acid as the reducing agent [
4]. The non-agglomerated almost spherical particles are obtained by ultrasonic spray pyrolysis [
2].
Recently, a strong correlation between the morphologies of silver powder particles and their crystal structure was found [
33,
34]. Here, this type of investigation has been continued with the aim of establishing the existence of the same correlation for Cu powders. For this reason, the three completely various morphologies of Cu powder particles were analyzed and correlated with their crystal structure. Two of them are obtained by electrolysis under completely different conditions, without and with vigorous hydrogen evolution. The third type was commercially supplied, and on the basis of morphological characteristics, it is clear that it was obtained by some non-electrochemical method. In order to examine the effect of the shape of particles on the decisive characteristics that define the behavior of the powders as a collection of particles, the specific surface area (SSA) and particle size distribution (PSD) were also analyzed.
2. Materials and Methods
Electrolyte, formed by dissolution of 0.10 mol·dm
−3 CuSO
4 in 0.50 mol·dm
−3 H
2SO
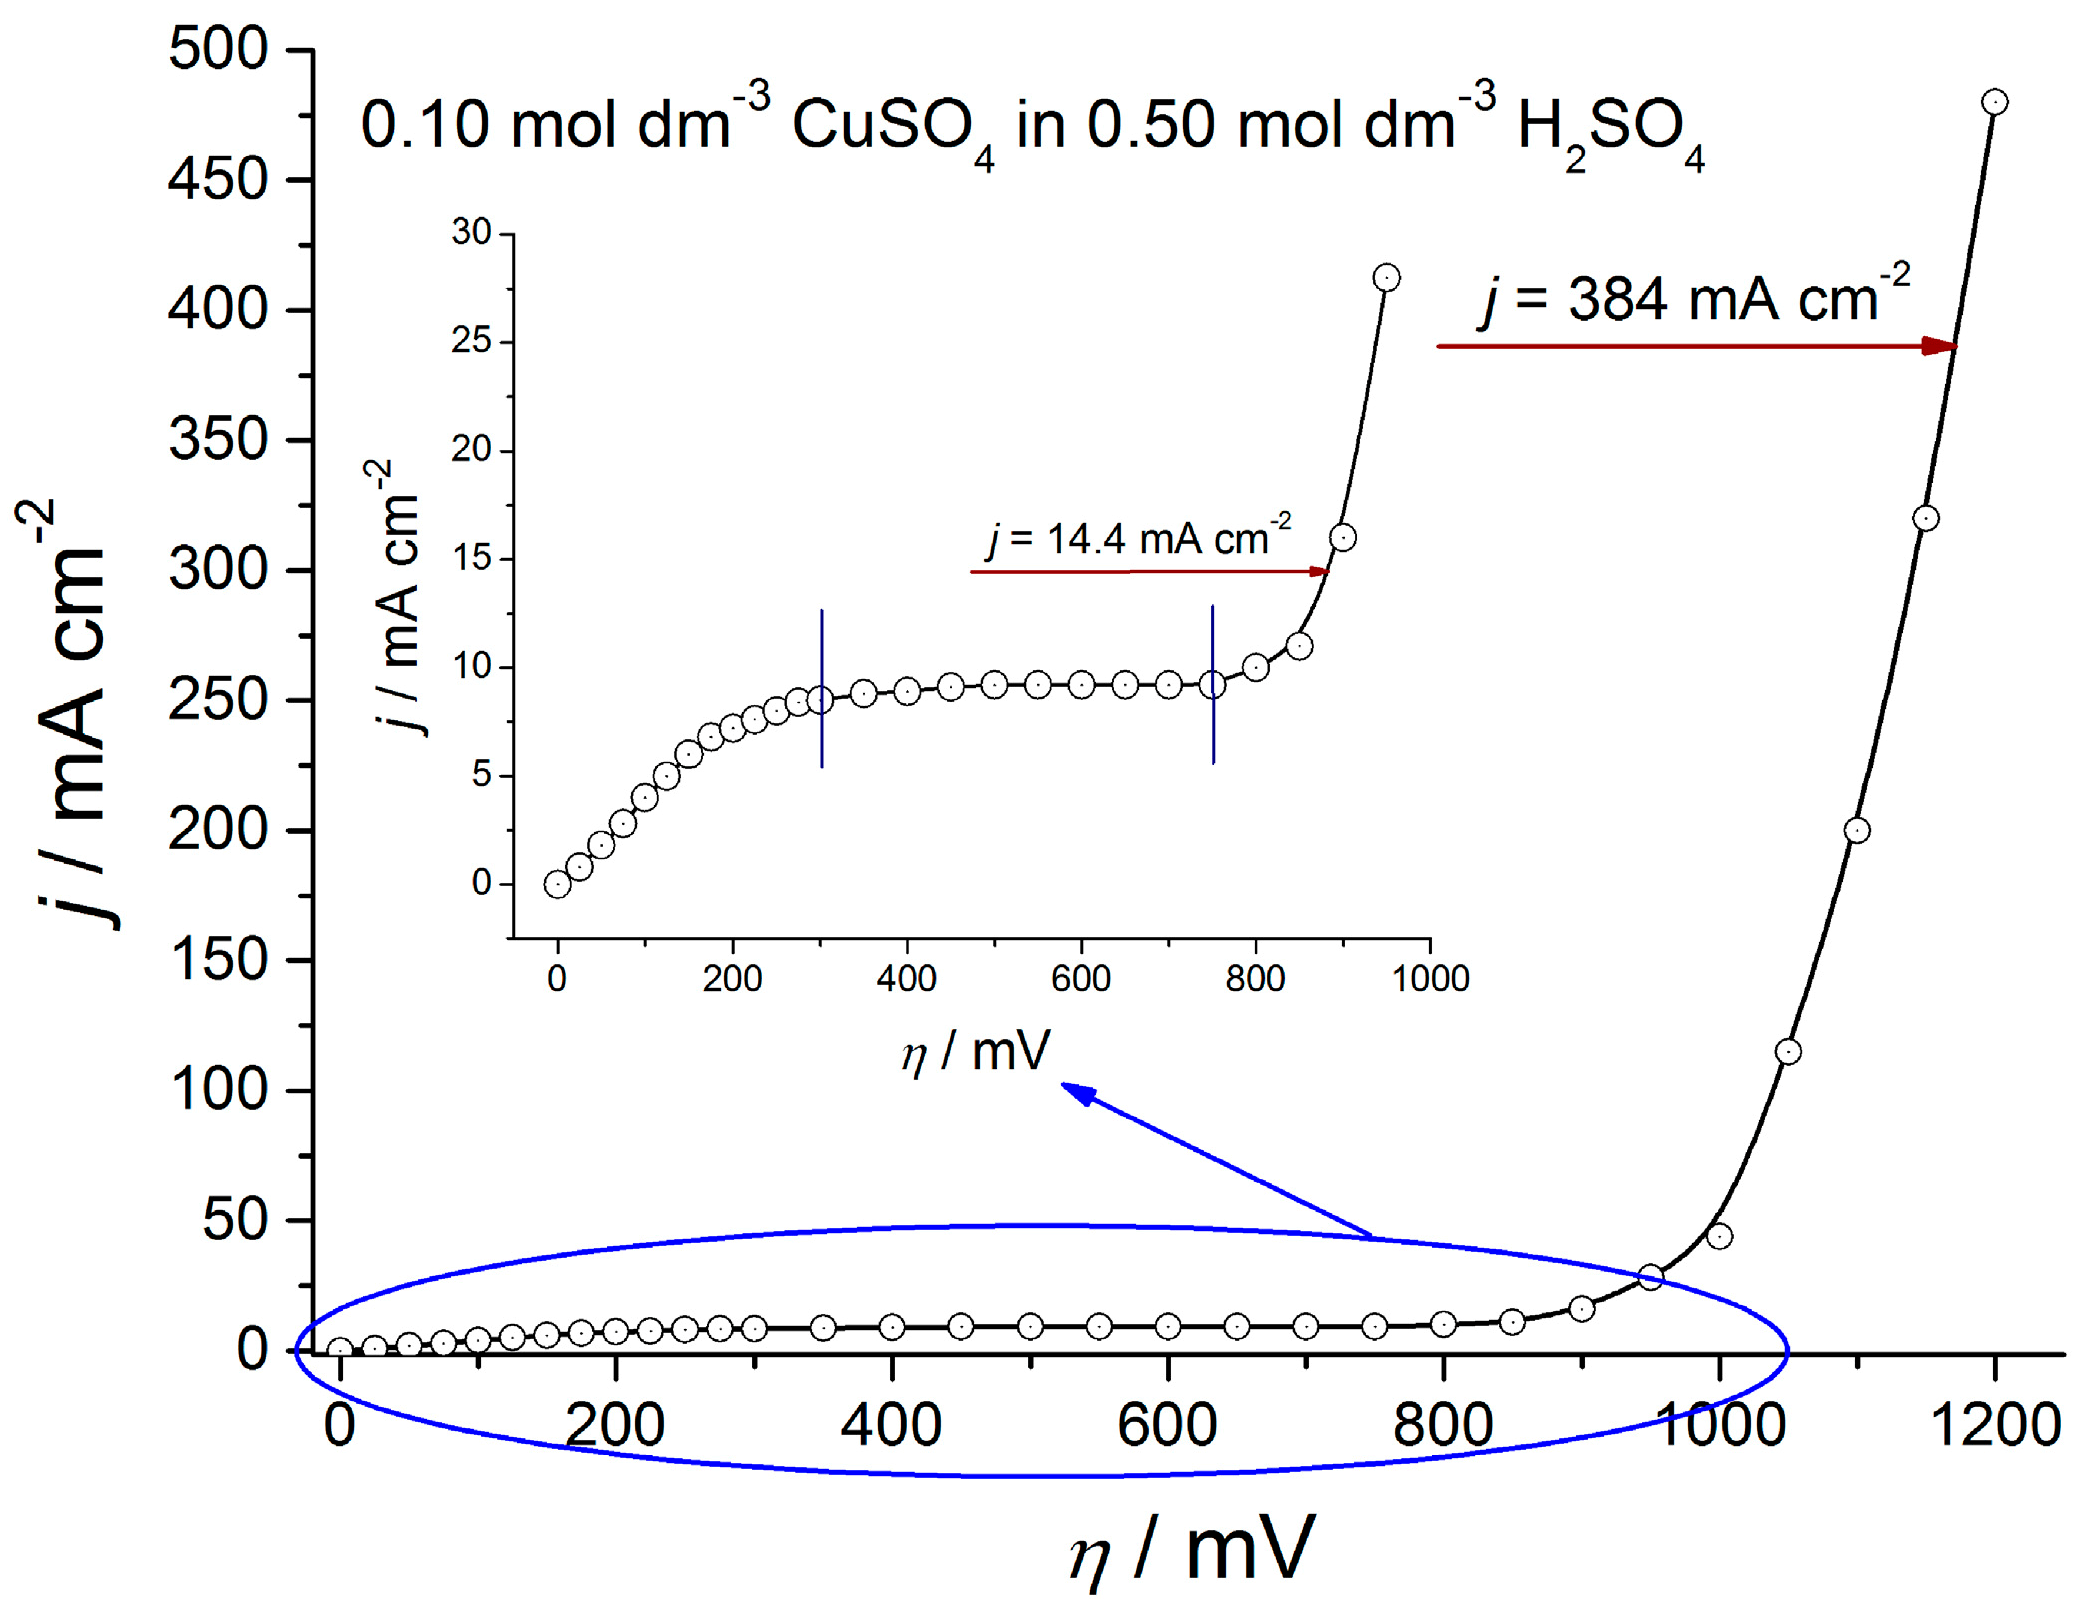
4, was used for the electrolytic production of Cu powders. Cu powder was galvanostatically produced at the current densities of 14.4 and 384 mA·cm
−2. Hereinafter, these powders are denoted as Cu(14.4) for powder produced at 14.4 mA·cm
−2 and Cu(384) for powder produced at 384 mA·cm
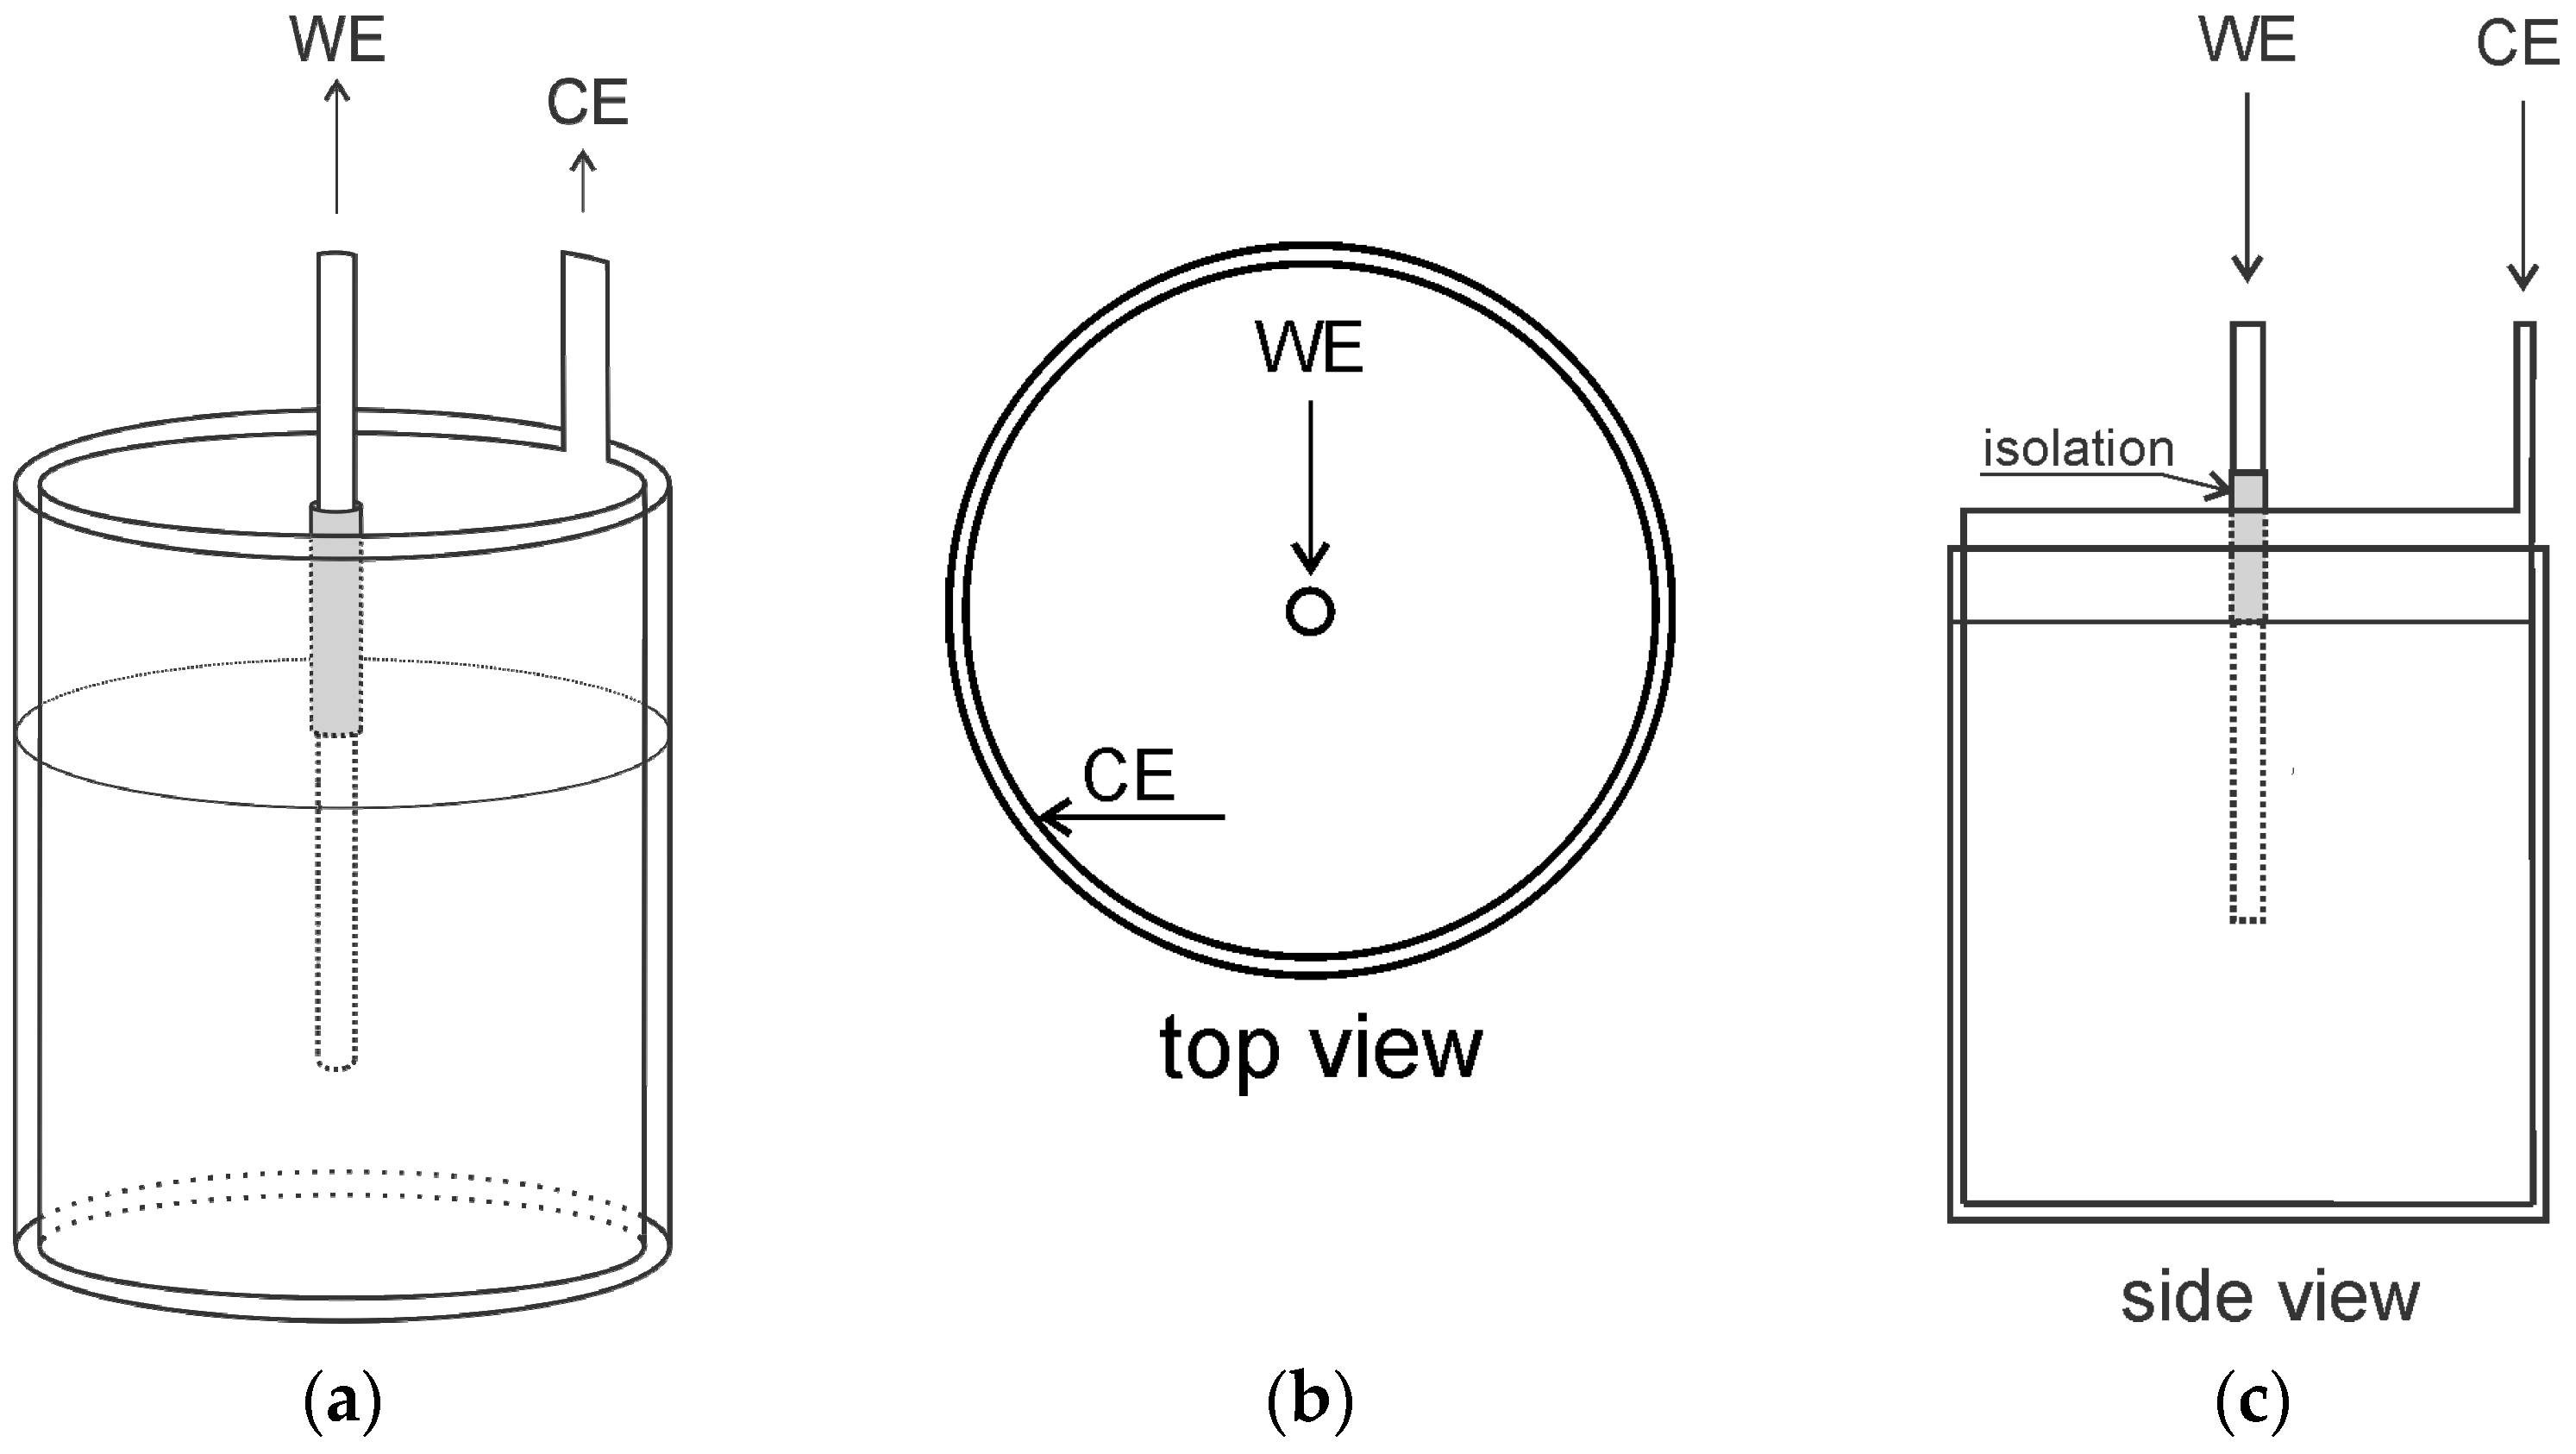
−2. Electrolysis was carried out at a temperature of 21.0 ± 0.5 °C in an open cell of cylindrical shape. The cylindrical Cu wire of the overall surface area 0.50 cm
2 was used as the working electrode. The counter electrode was Cu foil.
Figure 1 shows a configuration of electrodes in the cell. The ultra-pure water and p.a. reagents (CuSO
4 × 5H
2O, H
2SO
4) were used for electrolyte preparation for the Cu powder synthesis. Powder was produced with the electricity amount of 10 mA·h·cm
−2, and removed from the electrode surface after this amount of electricity was reached.
The electrolytically produced powder was compared to the commercially supplied powder, Sigma-Aldrich company (Saint Louis, MO, USA), product No. 326453 (powder (spheroidal), 14–25 μm, 99%). Hereinafter, this powder is denoted as Cu(CHEM).
A scanning electron microscope (SEM)—TESCAN Digital Microscopy company (model VEGA3, Brno, Czech Republic) was used for the morphological characterization of the produced particles.
The Rigaku Ultima IV diffractometer (Rigaku Co. Ltd., Tokyo, Japan) with CuK
α radiation was used to study the crystal structure of the produced powders. Four reflections in the 2
θ range between 30° and 95° were recorded in order to determine the preferred orientation of powder particles. For this purpose, calculation of the Texture Coefficient,
TC(
hkl) and Relative Texture Coefficient,
RTC(
hkl), based on an analysis of data obtained by the X-ray diffraction (XRD) method, was made. It was made in the following way: using an intensity of each reflection (
hkl) plane, the following ratios (in percentage) were calculated by applying Equation (1) [
35]:
where
I(
hkl) is the intensity of each (
hkl) reflection plane, while
represents the sum of intensities of all recorded reflection planes. Note: the values of intensities are given in cps.
Then, using the determined
R(
hkl) coefficients, the values of the Texture Coefficient,
TC(
hkl), were calculated by applying Equation (2):
where
Rs(
hkl) is determined in the same way as presented in Equation (1), but taking into consideration the Cu standard (04-0836).
In this way, accurate quantitative information about the absolute intensity of each of these reflections were obtained determining the
TC(
hkl) coefficients. Also, the intensity of each reflection plane in relation to the other reflection planes represents the relevant information, and is defined as the Relative Texture Coefficient,
RTC(
hkl) according to Equation (3):
The RTC(hkl) coefficient defines the intensity of the considered (hkl) orientation in relation to the standard which is included in the TC values.
A MALVERN Instruments MASTERSIZER 2000 (MALVERN Instruments Ltd., Malvern, Worcestershire, UK) device was used to determine the particle size distribution (PSD) and specific surface area (SSA) of the powders. Malvern Software (Version 5.60, MALVERN Instruments Ltd., Malvern, Worcestershire, UK) was used in order to obtain the SSA values.
4. Discussion
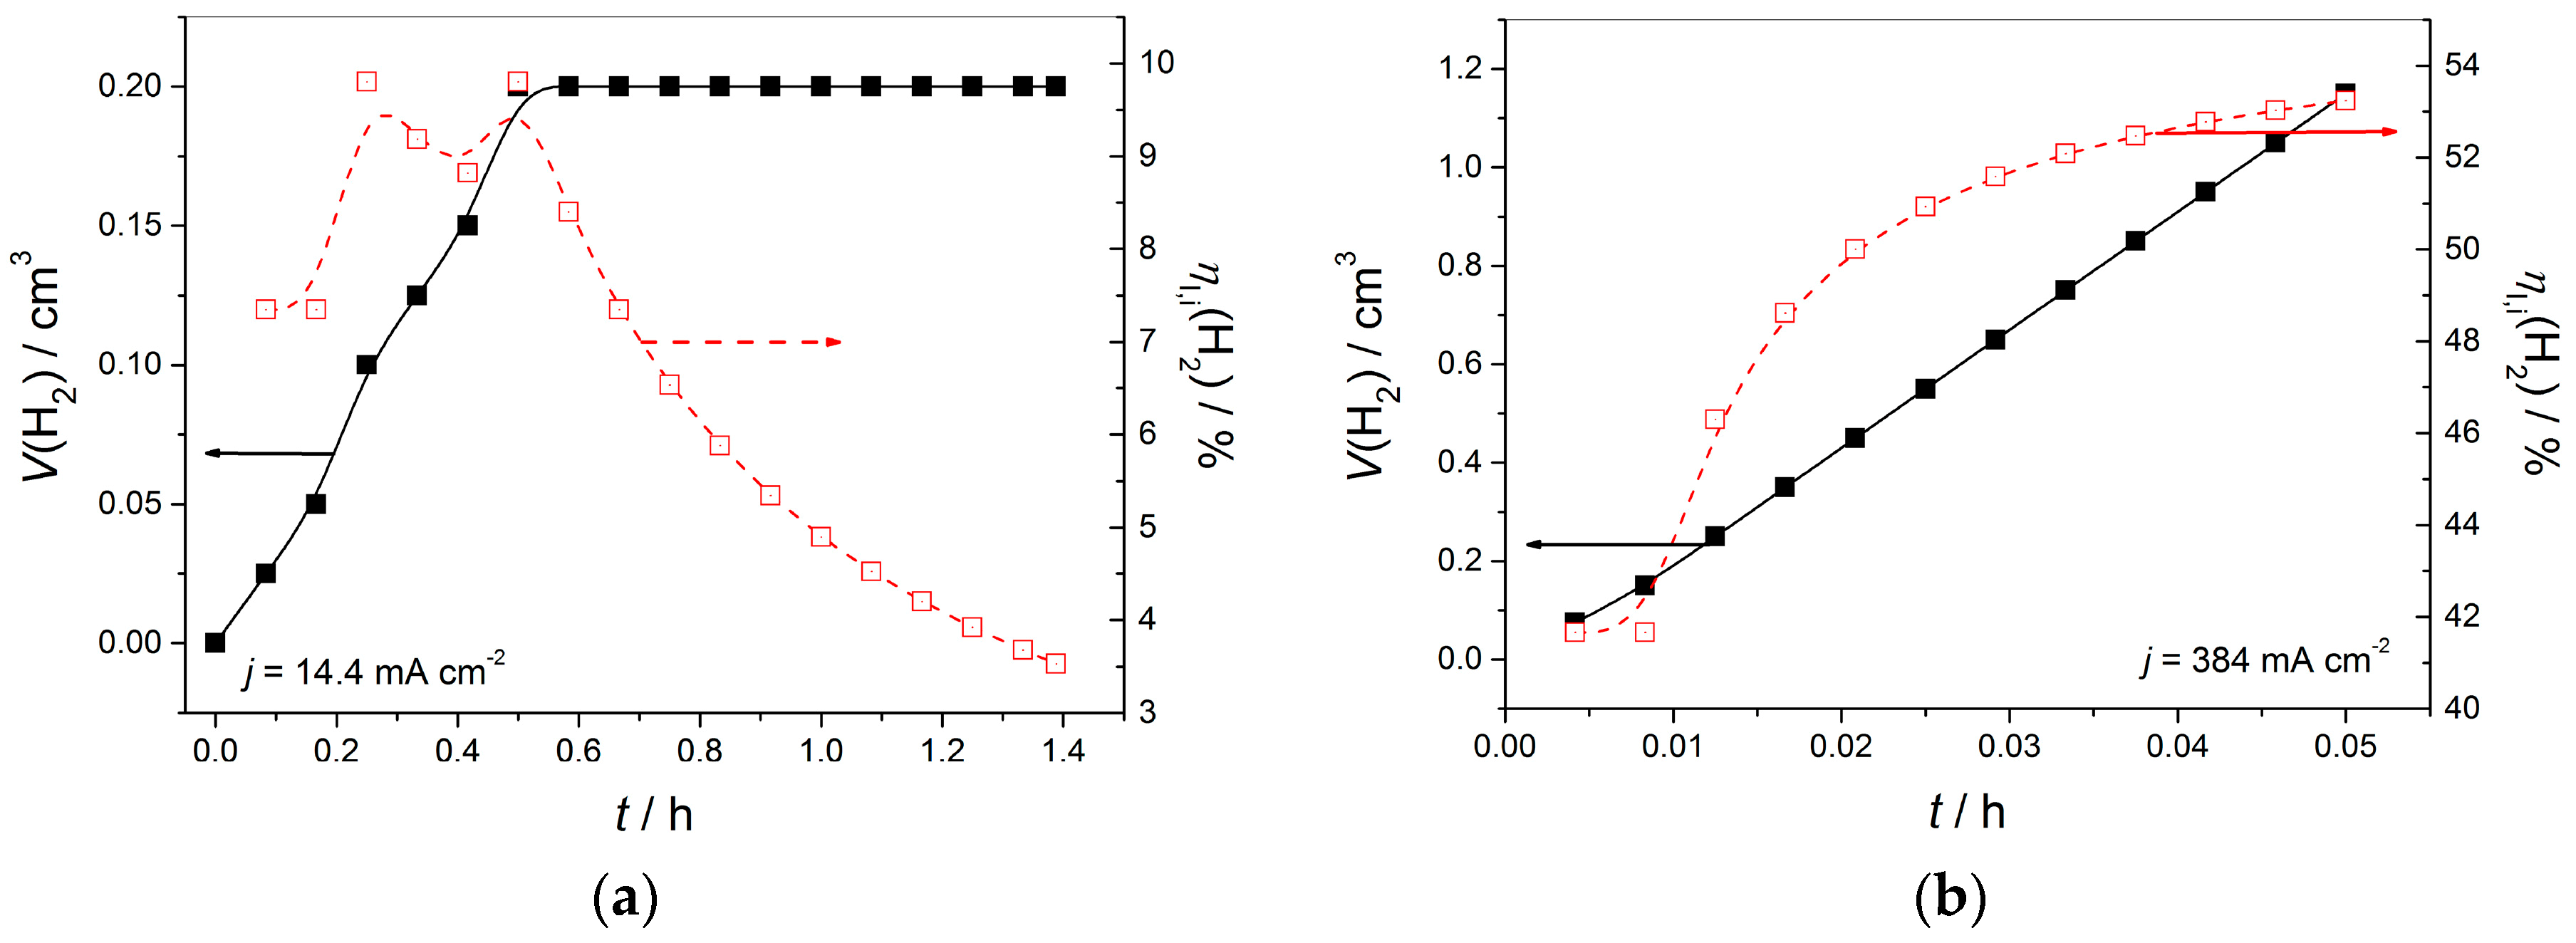
Three different morphologies of Cu particles were analyzed in this study: the 3D dendrites, disperse cauliflower-like agglomerates of Cu grains and compact agglomerates of Cu grains. Two of these were obtained by the electrolysis processes: 3D dendrites and disperse cauliflower-like agglomerates of Cu grains. Hydrogen evolution, as a parallel reaction to the Cu electrolysis at high current densities and overpotentials, had a crucial role in creating the final morphology of these particles. The amount of produced hydrogen is quantified by determination of the average current efficiency for hydrogen evolution, as presented in
Figure 9 for the Cu electrolysis at current densities of 14.4 and 384 mA·cm
−2.
Figure 9 shows the dependencies of the evolved hydrogen volume and current efficiency for the hydrogen evolution reaction in a time
ti on the electrolysis time obtained at current densities of 14.4 (
Figure 9a) and 384 mA·cm
−2 (
Figure 9b). It is clear that increasing the current density leads to a strong intensification in hydrogen evolution. The values of the average current efficiency for the hydrogen evolution reaction, obtained at the current densities of 14.4 and 384 mA·cm
−2, are given in
Table 3.
The amount of hydrogen that evolved at a current density of 14.4 mA·cm
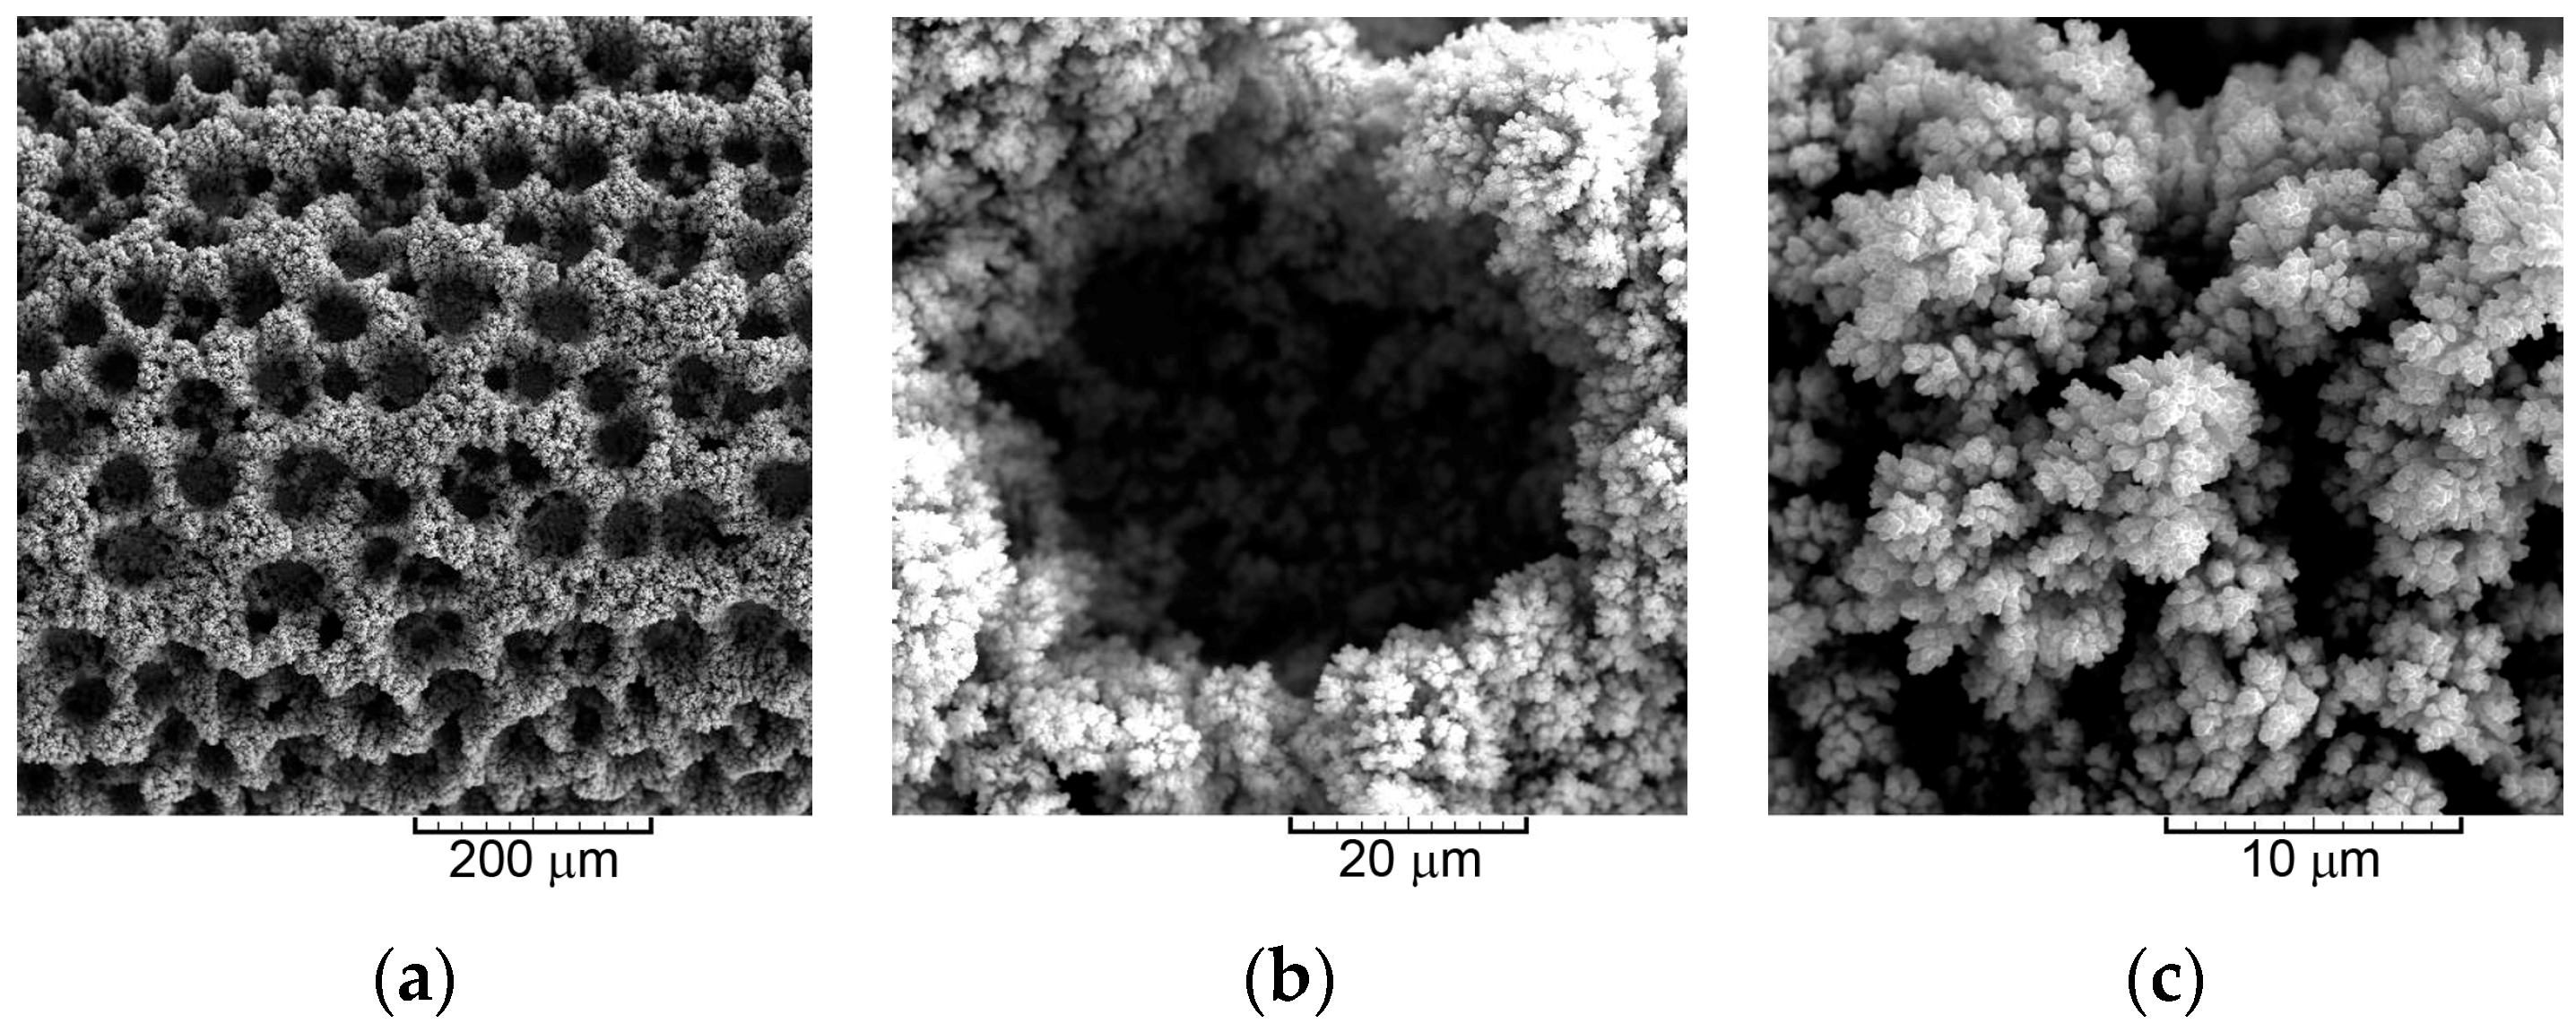
−2 was not sufficient to have any effect on the hydrodynamic conditions in the near-electrode layer. The proof for this is the rare holes formed from detached hydrogen bubbles and a somewhat non-uniform electrode surface determined by very branched 3D dendrites and cauliflower-like agglomerates of Cu grains (
Figure 3a,b). As already mentioned, the 3D dendrites shown here represent a novel type of dendrite observed for the first time in this investigation. Formation of this type of dendrites can be explained from an electrochemical point of view in the following way: decrease of potential occurs with the electrolysis time in the galvanostatic regime of electrolysis. In this case, the potential at the end of electrolysis processes, corresponding to an amount passed electricity of 10 mA·h·cm
−2, was about 275 mV. This potential corresponds to the mixed activation-diffusion control at which formation of globules like those shown in
Figure 3 occurs [
19,
38].
On the other hand, a very uniform honeycomb-like structure was formed at a current density of 384 mA·cm
−2 (
Figure 4). The amount of evolved hydrogen at this current density was vigorous enough to have a strong effect on the hydrodynamic conditions in the near-electrode layer. Namely, hydrogen generated during electrolysis causes a strong stirring of electrolyte in the near-electrode layer, leading to a decrease in diffusion layer thickness, an increase in the limiting diffusion current density, and a decrease in the degree of diffusion control in the electrodeposition process. The mechanism for the formation of the very disperse cauliflower-like particles, shown in
Figure 4, was completely different to the one responsible for the formation of the dendritic particles (
Figure 3). The concept of “effective overpotential” can be applied to the formation of this particle type [
19,
39]. According to this concept, when hydrogen evolution is vigorous enough, the electrodeposition process occurs at an overpotential that is effectively lower than the specified one, and this overpotential is denoted as “effective” in the deposition process. From the morphological point of view, this means that the morphologies of metal deposits become similar to those obtained at some lower overpotentials at which the hydrogen evolution does not occur or is very slow. Formation of the cauliflower-like particles instead of dendrites confirms that there is a lower degree of diffusion control at this current density than at 14.4 mA·cm
−2.
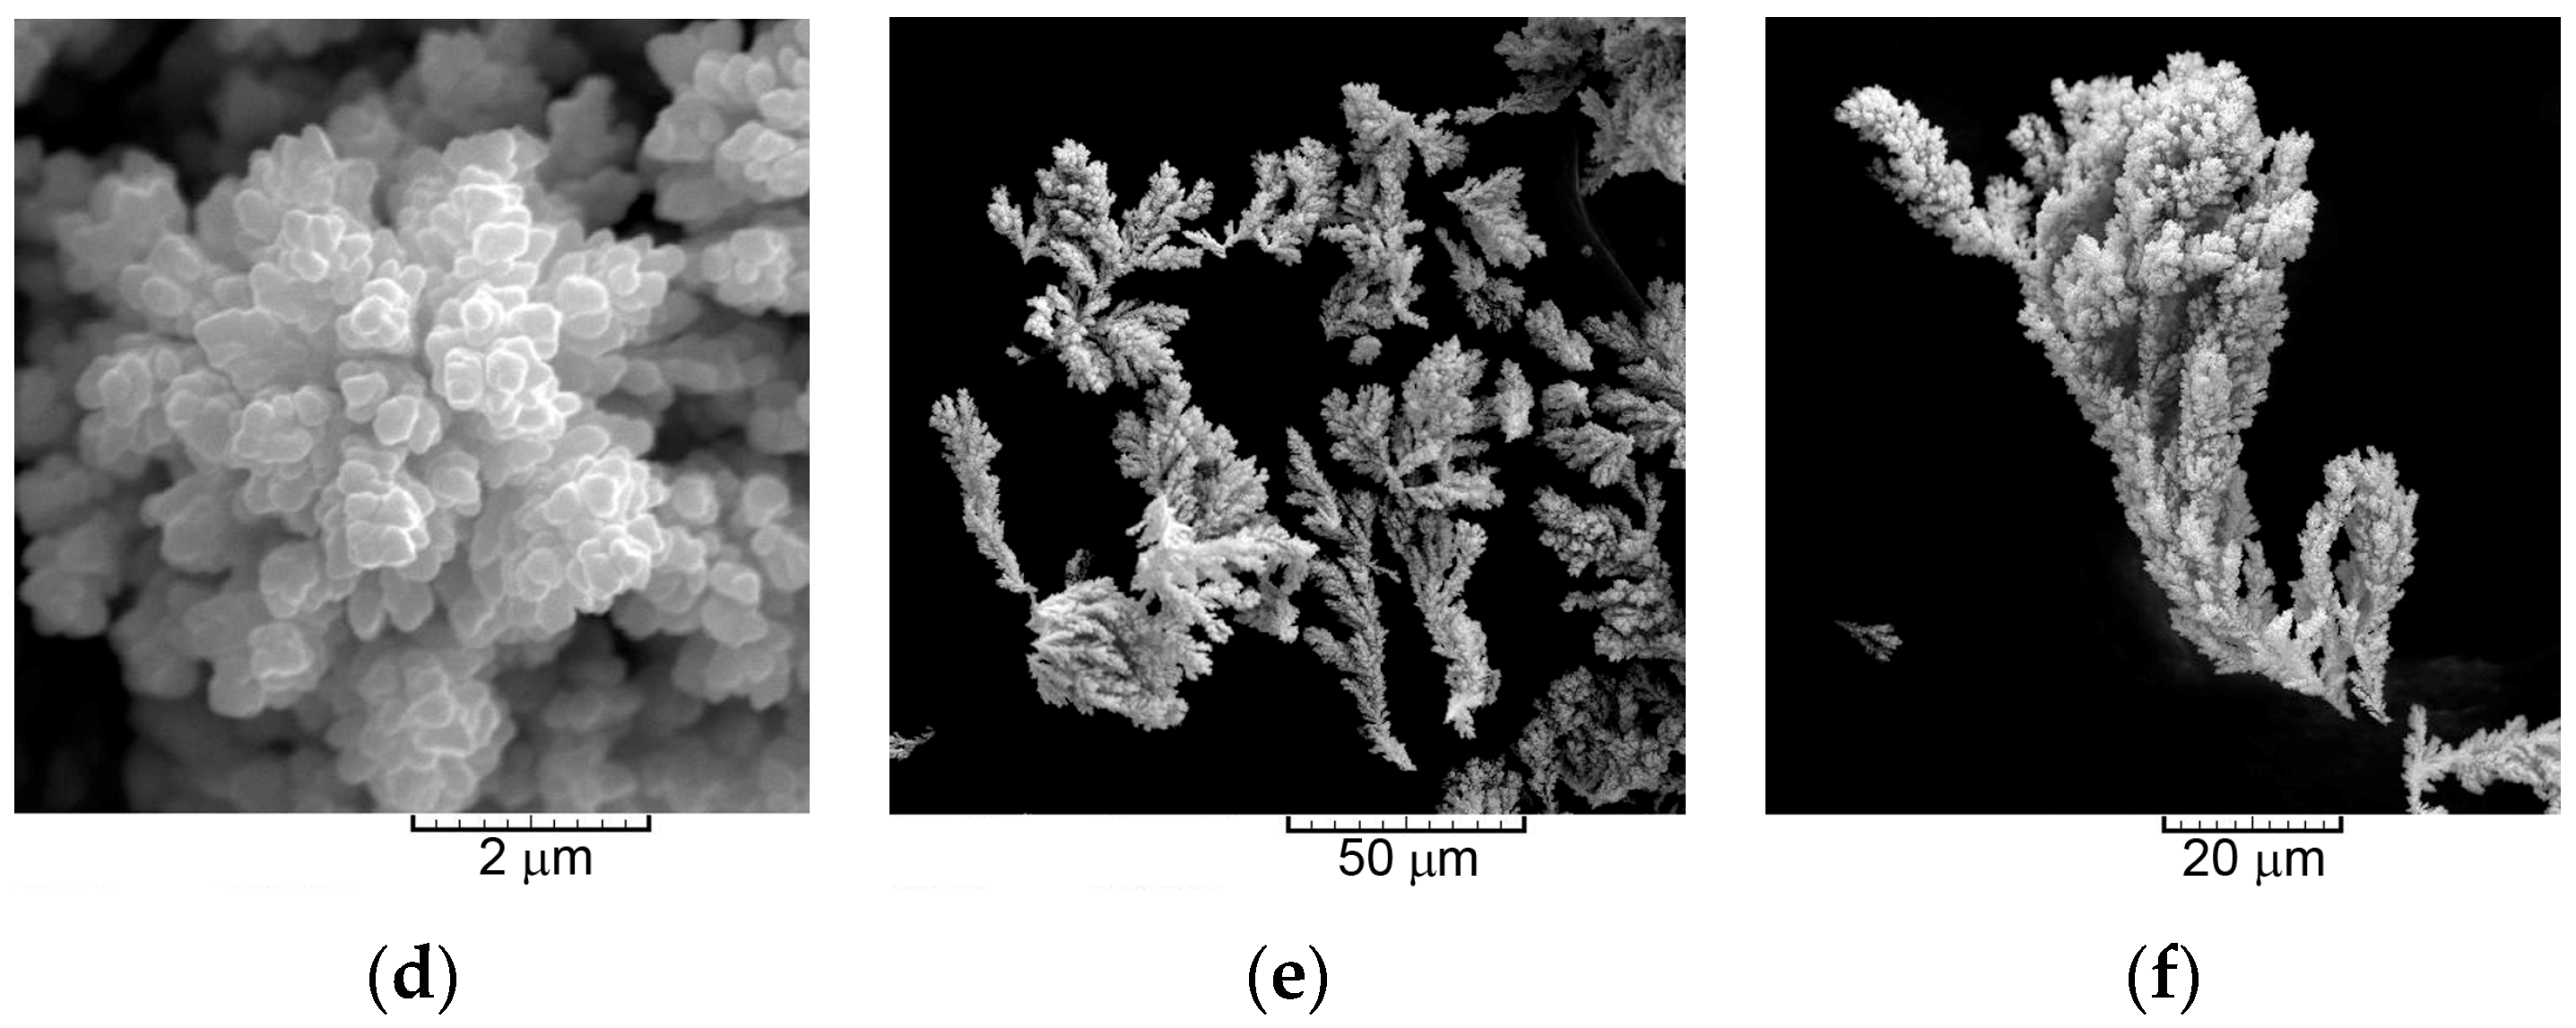
The third type of particles are irregular compact agglomerates of Cu grains (
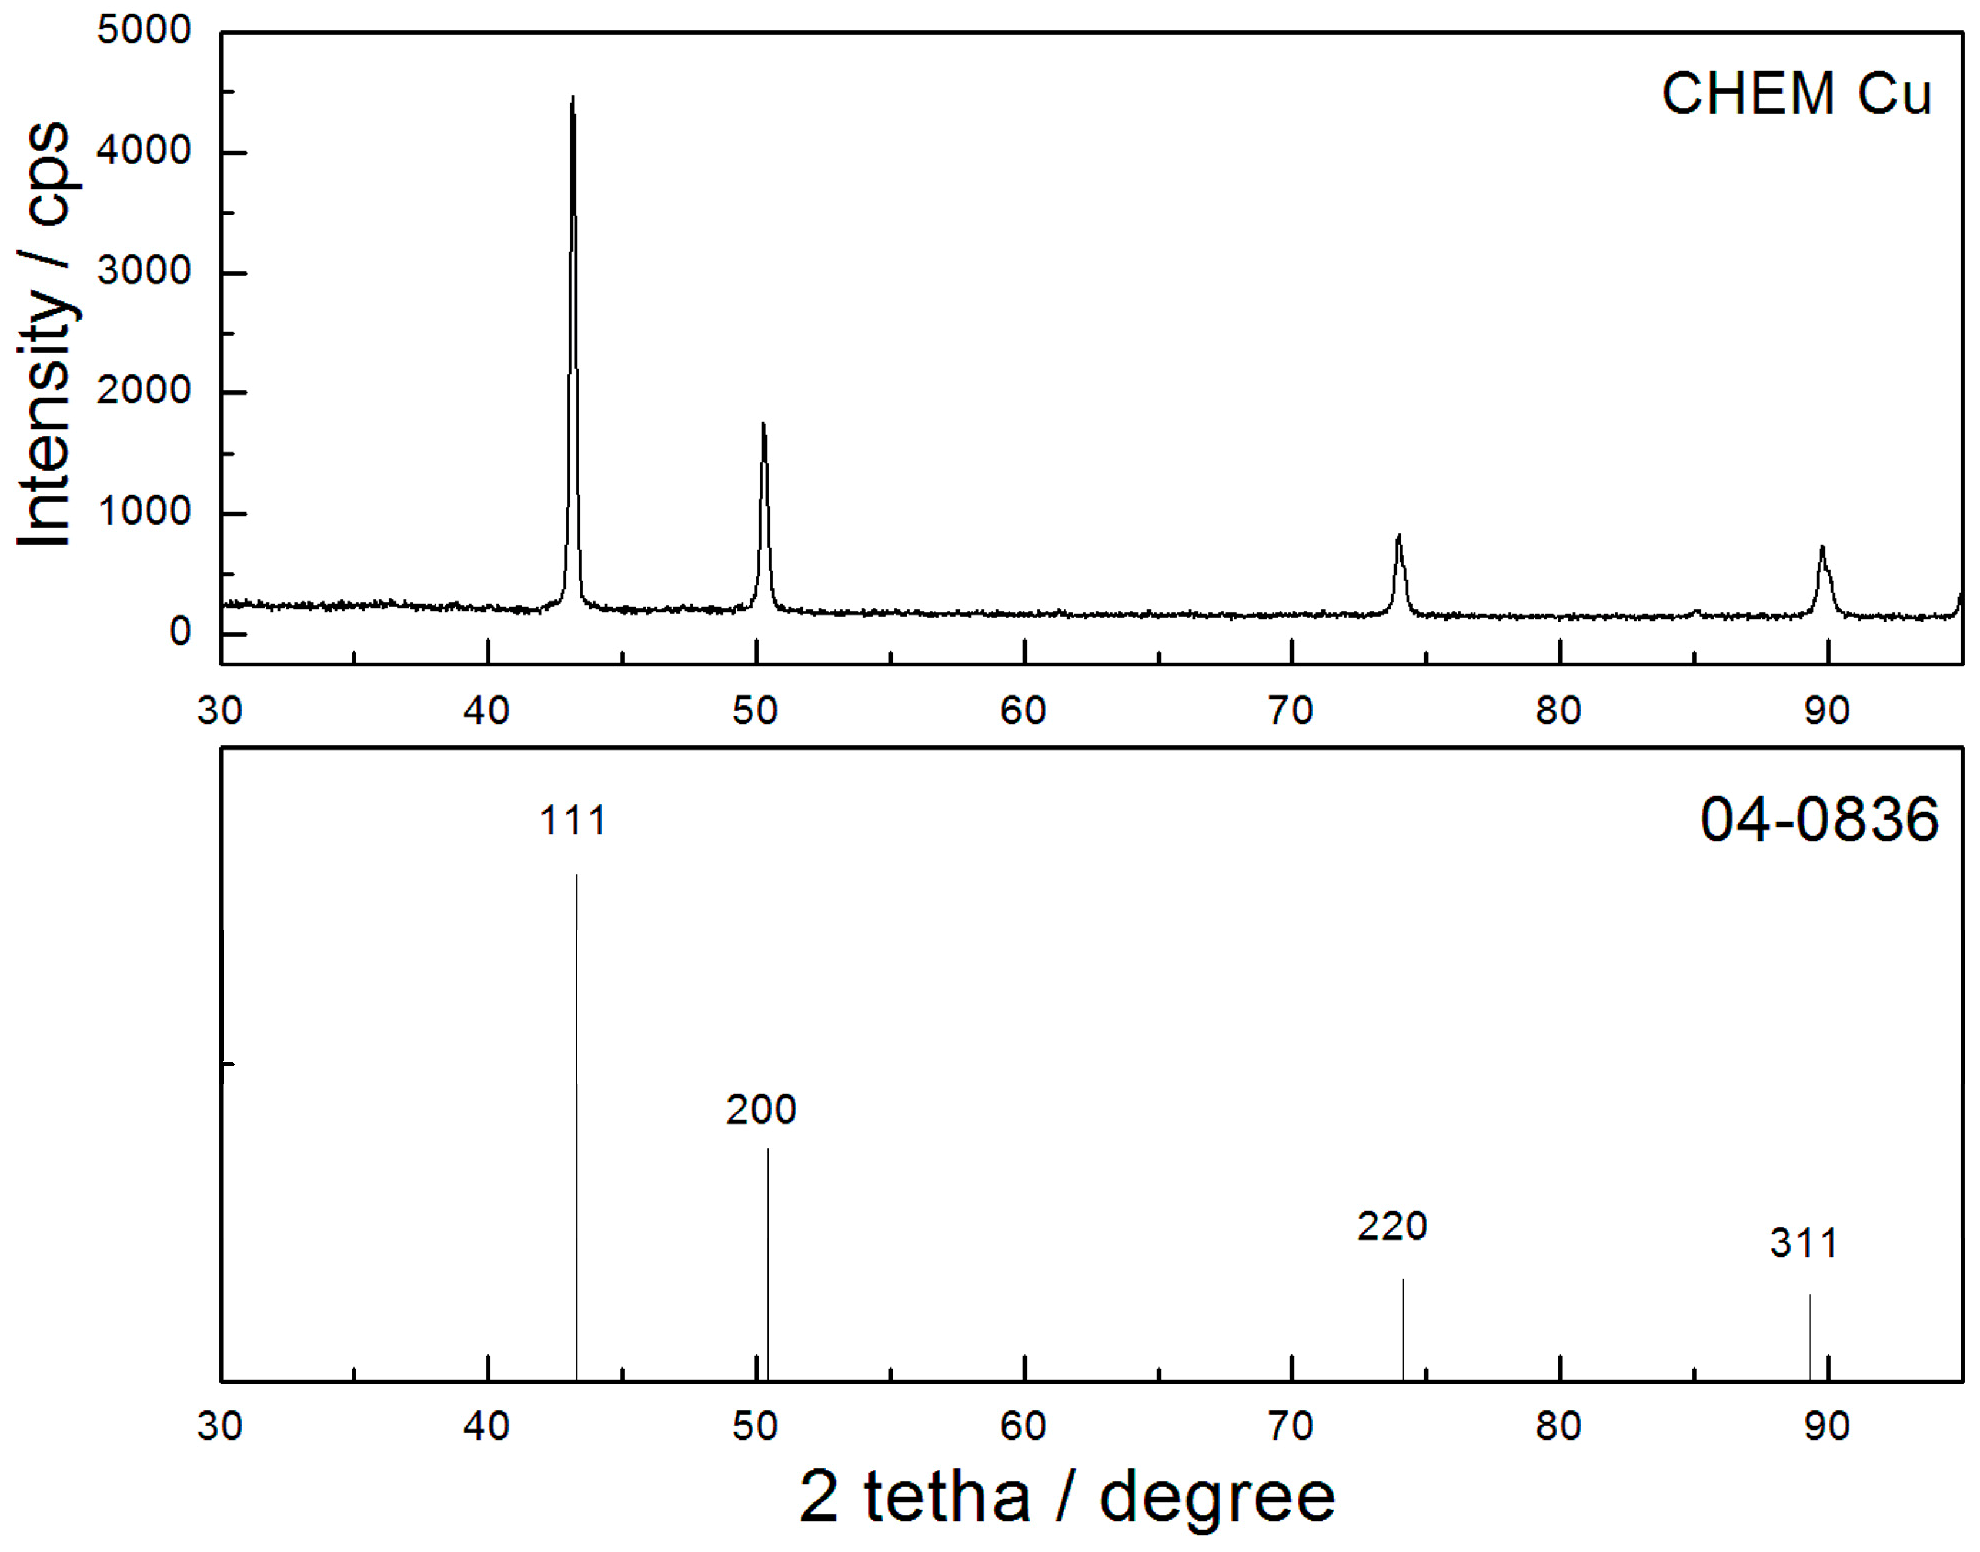
Figure 5). On the basis of the macromorphology, which is determined by the compact irregular shapes, it is clear that the particles were formed by some non-electrochemical method of synthesis.
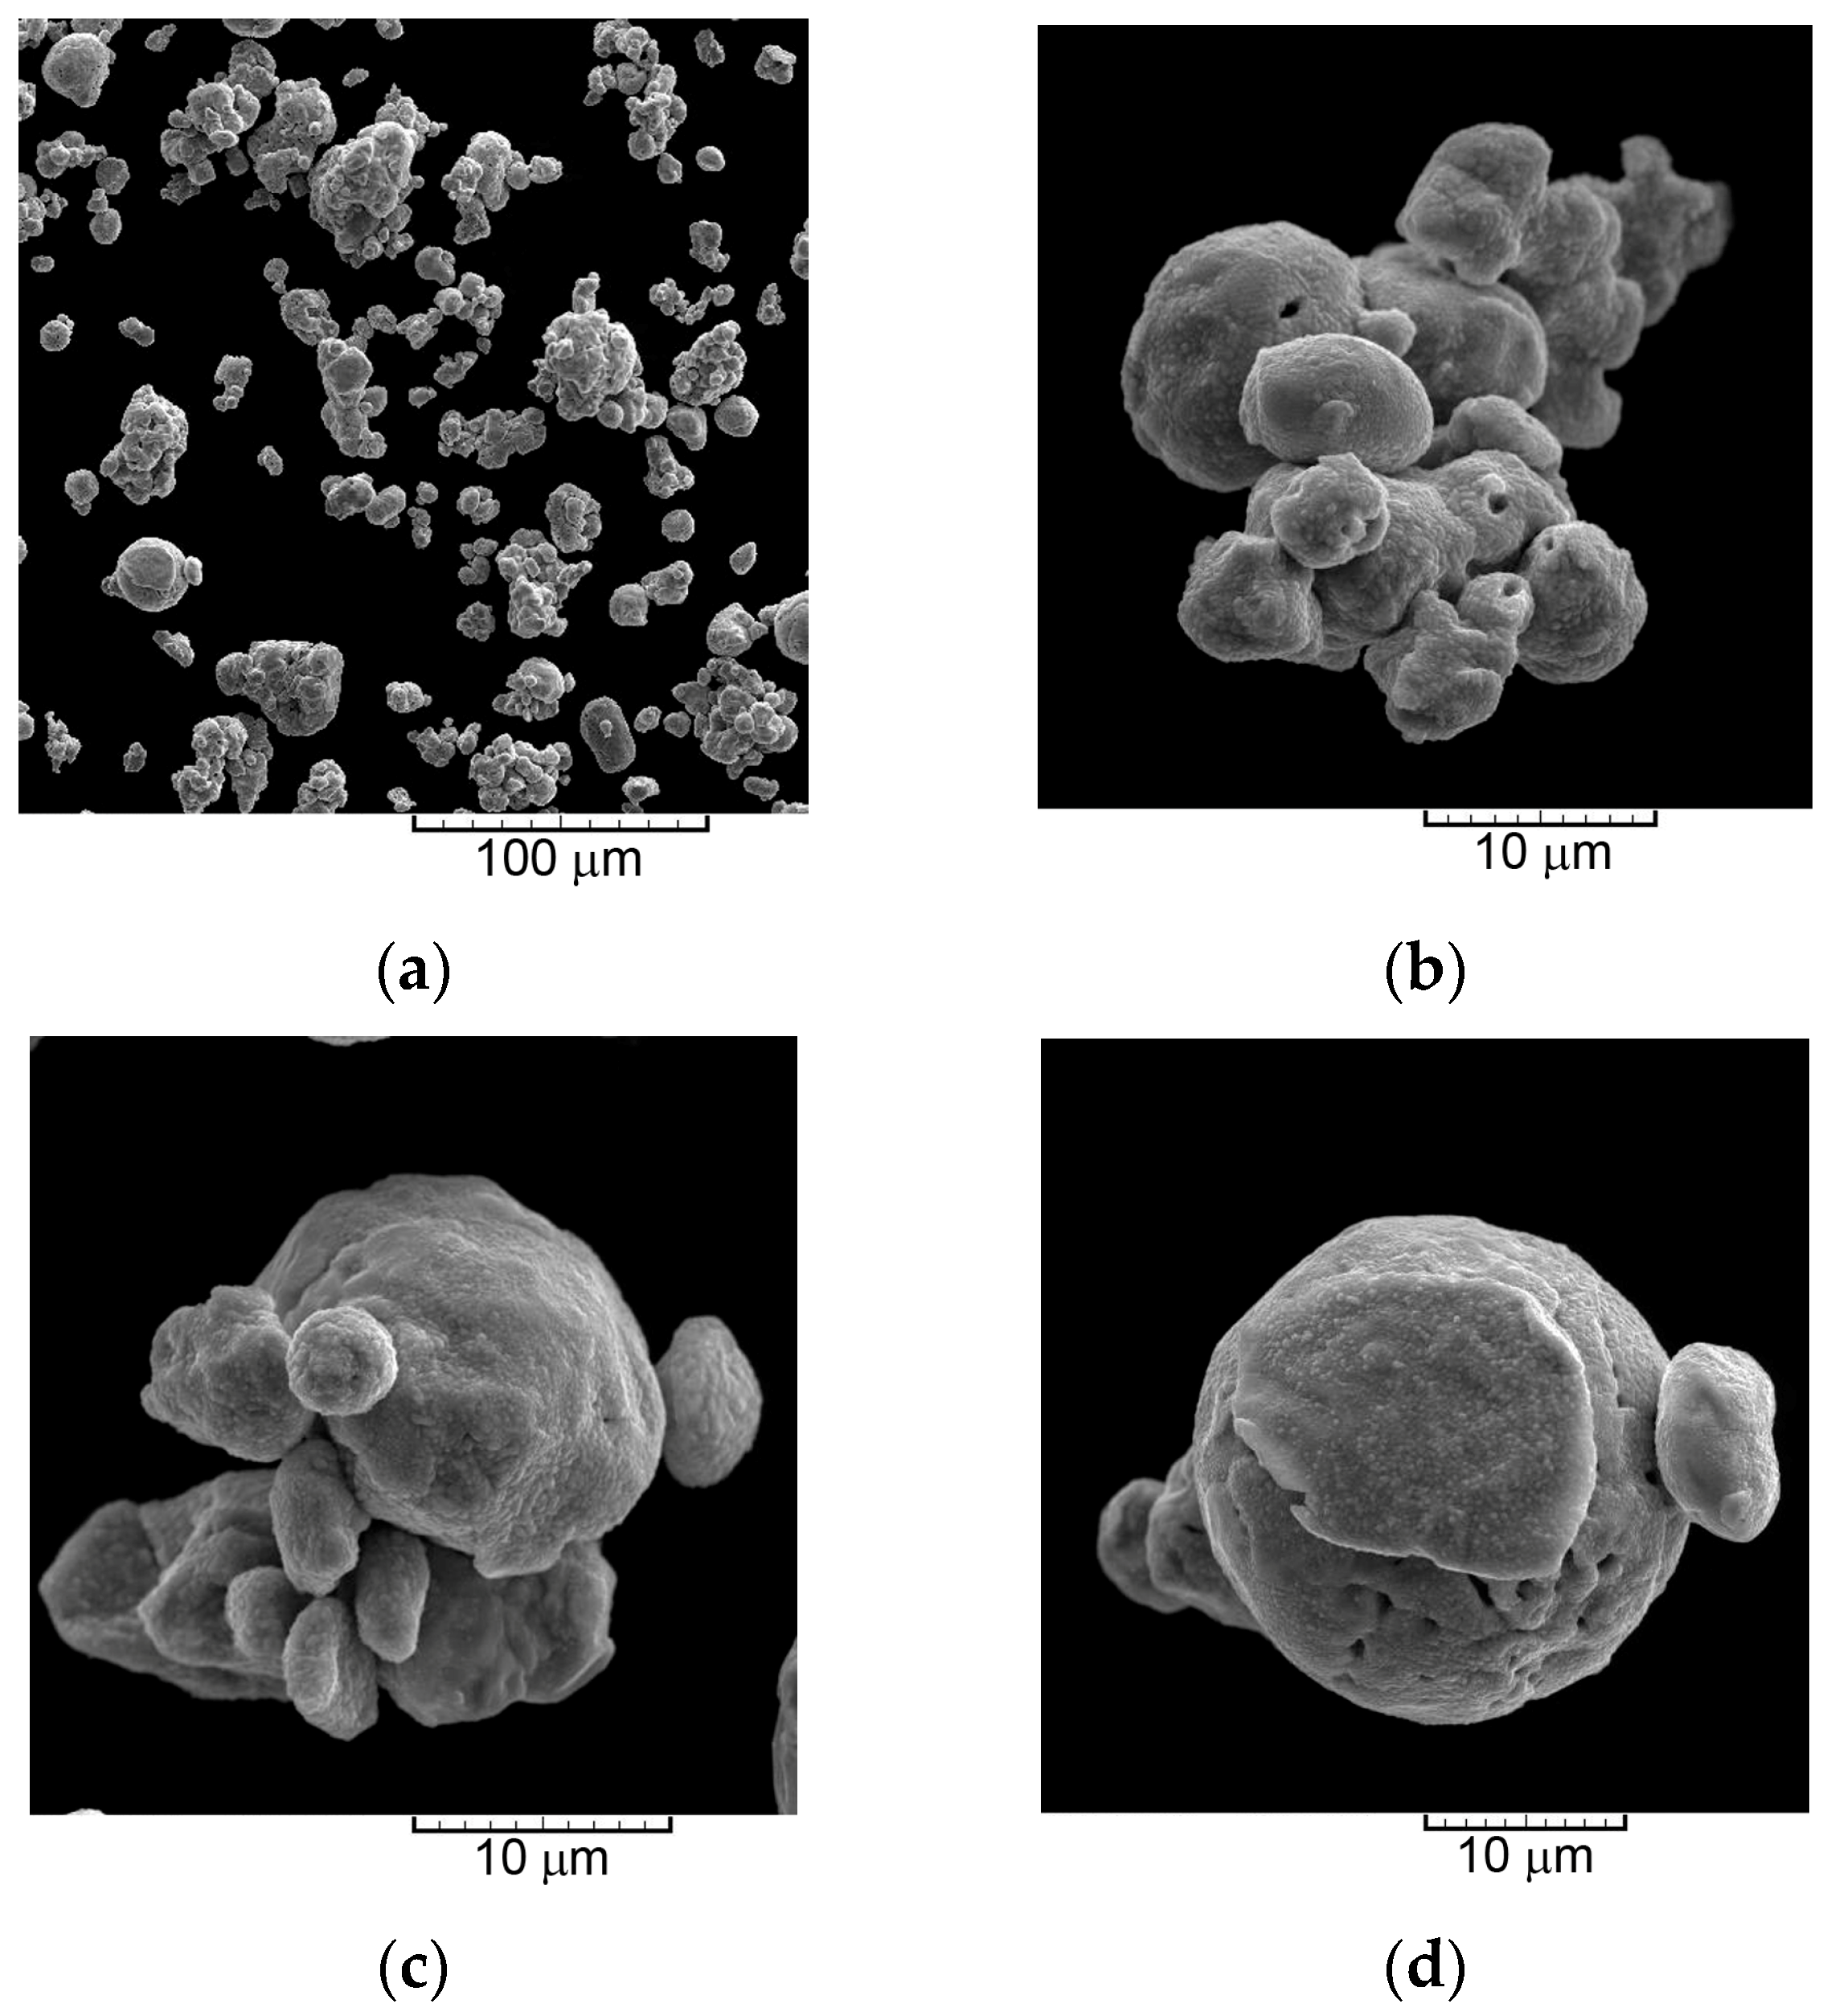
The XRD analysis showed that the chemically obtained particles and those obtained by electrolysis at 14.4 mA·cm
−2 were randomly oriented. Unlike these, the electrolytically obtained particles at 384 mA·cm
−2 showed (220) and (311) preferred orientation. The different preferred orientation of the particles produced by the galvanostatic regime of electrolysis can be explained from the electrochemical point of view using the basic laws related to the metal electrocrystallization processes [
19]. Namely, the (111) plane is a “slow-growing” one, while the other planes ((200), (220) and (311)) are the “fast-growing” planes [
33,
40]. In the growth process, the “fast-growing” planes disappear, while the “slow-growing” (111) plane survives. This explains the predominant orientation of Cu crystallites in the (111) plane in particles obtained at both current densities. On the other hand, a nucleation rate depends on the potential according to Equation (6) [
19]:
where
J is the nucleation rate,
K1 and
K2 are the constants independent of potential, and
E is the potential. According to Equation (6), the nucleation rate increases with increasing the potential of electrolysis. At current density of 14.4 mA·cm
−2, a potential response was in the (275–900) mV range, while at 384 mA·cm
−2, this response was in the (1100–1250) mV range. Therefore, the nucleation rate was considerably larger at 384 mA·cm
−2 than at 14.4 mA·cm
−2, causing the formation of a larger number of nuclei in the initial stage of electrolysis at 384 mA·cm
−2 than at 14.4 mA·cm
−2. With the increased number of initially formed nuclei, there is an increased probability that the larger number of the “fast-growing” planes survive the growth process. In this way, the larger number of Cu crystallites oriented in (220) and (311) planes in the particles produced at 384 mA·cm
−2 than at 14.4 mA·cm
−2 can be explained.
The correlation between the morphology of the particles and crystal structure is also observed for some types of chemically synthesized particles. Namely, Cu nanowires synthesized under hydrothermal conditions using oleyl amine (OLA) and glucose as a reducing agent showed an XRD pattern with a higher intensity (200) peak than (111) peak [
41]. The larger ratio of Cu crystallites oriented in the (200) plane than in (111) plane can be ascribed to the existence of a nanocubic structure [
42], where a relatively large number of nanocubes coexist with the nanowires synthesized using OLA.
It is clear from the above consideration that electrolysis processes have certain advantages in the metal powder production over other methods. The advantages of this method include the easy control of the shape and size of particles by the choice of parameters of electrolysis. On the other hand, the particles obtained by chemical processes show a tendency towards aggregation [
43], as observed here, which is avoided in the electrolysis processes by a vigorous hydrogen evolution reaction that can prevent this process. It is clear that the “current of hydrogen” formed through the interior of cauliflower-like particles (
Figure 4e,f) prevents this aggregation.
Author Contributions
L.A. performed the formation of copper powders by an electrolytic procedure; V.M.M. performed the XRD analysis and discussion of the corresponding data; Z.B. performed the SEM characterization of copper powders; N.I. performed the PSD analysis of copper powders; R.M. performed the preparation of powders for the SEM, XRD and PSD analysis; M.B. provided the reagents and equipment for the electrochemical experiments; and N.D.N. conceived and wrote the paper.
Funding
This research received no external funding.
Acknowledgments
This work was supported by the Ministry of Education, Science, and Technological Development of the Republic of Serbia under the research Project: “Electrochemical Synthesis and Characterization of Nanostructured Functional Materials for Application in the New Technologies” (Project No. 172046).
Conflicts of Interest
The authors declare no conflict of interest.
References
- Copper and Copper Alloy Powder Metallurgy Properties and Applications. Available online: https://www.copper.org/resources/properties/129_6 (accessed on 13 November 2018).
- Stopić, S.; Dvorak, P.; Friedrich, B. Synthesis of spherical nanosized copper powder by ultrasonic spray pyrolysis. World Metall. 2005, 58, 195–201. [Google Scholar]
- Meshram, P.; Sinha, M.K.; Sahu, S.K.; Khan, P.; Pandey, B.D.; Mankhand, T.R. Solvothermal synthesis of high value copper powder from copper bleed solution of an indian copper smelter. Powder Technol. 2013, 233, 335–340. [Google Scholar] [CrossRef]
- Jhajharia, R.; Jain, D.; Sengar, A.; Goyal, A.; Soni, P.R. Synthesis of copper powder by mechanically activated cementation. Powder Technol. 2016, 301, 10–15. [Google Scholar] [CrossRef]
- Wu, S. Preparation of Fine Copper Powder using ascorbic acid as reducing agent and its application in MLCC. Mater. Lett. 2007, 61, 1125–1129. [Google Scholar] [CrossRef]
- Sinha, A.; Das, S.K.; Vijaya Kumar, T.V.; Rao, V.; Ramachandrarao, P. Synthesis of nanosized copper powder by an aqueous route. J. Mater. Synth. Process. 1999, 7, 373–377. [Google Scholar] [CrossRef]
- Wu, S.P.; Meng, S.Y. Preparation of micron size copper powder with chemical reduction method. Mater. Lett. 2006, 60, 2438–2442. [Google Scholar] [CrossRef]
- Wu, S.P.; Ding, X.H. Preparation of fine copper powder with chemical reduction method and its application in MLCC. IEEE Trans. Compon. Packag. Technol. 2007, 30, 434–438. [Google Scholar] [CrossRef]
- Lee, S.; Lee, D.; Lee, S.-Y.; Cho, S.-S.; Uhm, S. Fabrication of nano-sized copper powders in liquid media via high-energy electrical explosion method: Use of high purity copper recovered from waste jelly-filled cable as raw material. Mater. Test. 2016, 58, 161–164. [Google Scholar] [CrossRef]
- Neikov, O.; Naboychenko, S.; Mourachova, I.; Gopienko, V.; Frishberg, I.; Lotsko, D. Production of copper and copper alloy powders. In Handbook of Non-Ferrous Metal Powders: Technologies and Applications; Elsevier: Oxford, UK, 2009; Chapter 16; pp. 331–332. [Google Scholar]
- Rosenband, V.; Gany, A. Preparation of nickel and copper submicrometer particles by pyrolysis of their formats. J. Mater. Process. Technol. 2004, 153, 1058–1061. [Google Scholar] [CrossRef]
- Chokratanasombat, P.; Nisaratanaporn, E. Preparation of ultrafine copper powders with controllable size via polyol process with sodium hydroxide addition. Eng. J. 2012, 16, 39–46. [Google Scholar] [CrossRef]
- Amit, S.; Sharma, B.P. Preparation of copper powder by glycerol process. Mater. Res. Bull. 2002, 37, 407–416. [Google Scholar] [CrossRef]
- Chow, G.M.; Kurihara, L.K.; Kemner, K.M.; Schoen, E.; Elam, W.T.; Ervin, A.; Keller, S.; Zhang, Y.D.; Budnick, J.; Ambrose, T. Structural, morphological, and magnetic study of nanocrystalline cobalt-copper powders synthesized by the polyol process. J. Mater. Res. 1995, 10, 1546–1554. [Google Scholar] [CrossRef]
- Djokić, S.S. Production of Metallic Powders from Aqueous Solutions without an External Current Source. In Electrochemical Production of Metal Powders, Series: Modern Aspects of Electrochemistry; Djokić, S.S., Ed.; Springer: New York, NY, USA, 2012; Volume 54, pp. 369–398. [Google Scholar]
- Djokić, S.S.; Djokić, N.S. Electroless deposition of metallic powders. J. Electrochem. Soc. 2011, 158, D204–D209. [Google Scholar] [CrossRef]
- Reverberi, A.P.; Salerno, M.; Lauciello, S.; Fabiano, B. Synthesis of copper nanoparticles in ethylene glycol by chemical reduction with vanadium (+2) salts. Materials 2016, 9, 809. [Google Scholar] [CrossRef] [PubMed]
- Park, T.J.; Lee, K.G.; Lee, S.Y. Advances in microbial biosynthesis of metal nanoparticles. Appl. Microbiol. Biotechnol. 2016, 100, 521–534. [Google Scholar] [CrossRef] [PubMed]
- Popov, K.I.; Djokić, S.S.; Nikolić, N.D.; Jović, V.D. Morphology of Electrochemically and Chemically Deposited Metals; Springer: New York, NY, USA, 2016; pp. 1–368. [Google Scholar]
- Nikolić, N.D.; Pavlović, Lj.J.; Pavlović, M.G.; Popov, K.I. Morphologies of electrochemically formed copper powder particles and their dependence on the quantity of evolved hydrogen. Powder Technol. 2008, 185, 195–201. [Google Scholar] [CrossRef]
- Orhan, G.; Hapci, G. Effect of electrolysis parameters on the morphologies of copper powder obtained in a rotating cylinder electrode cell. Powder Technol. 2010, 201, 57–63. [Google Scholar] [CrossRef]
- Orhan, G.; Gezgin, G.G. Effect of electrolysis parameters on the morphologies of copper powder obtained at high current densities. J. Serb. Chem. Soc. 2012, 77, 651–665. [Google Scholar] [CrossRef] [Green Version]
- Ostanina, T.N.; Rudoi, V.M.; Patrushev, A.V.; Darintseva, A.B.; Farlenkov, A.S. Modelling the dynamic growth of copper and zinc dendritic deposits under the galvanostatic electrolysis conditions. J. Electroanal. Chem. 2015, 750, 9–18. [Google Scholar] [CrossRef]
- Nikolić, N.D.; Branković, G.; Pavlović, M.G. Correlate between morphology of powder particles obtained by the different regimes of electrolysis and the quantity of evolved hydrogen. Powder Technol. 2012, 221, 271–277. [Google Scholar] [CrossRef]
- Nekouei, R.K.; Rashchi, F.; Joda, N.N. Effect of organic additives on synthesis of copper nano powders by pulsing electrolysis. Powder Technol. 2013, 237, 554–561. [Google Scholar] [CrossRef]
- Popov, K.I.; Pavlović, Lj.J.; Ivanović, E.R.; Radmilović, V.; Pavlović, M.G. The effect of reversing current deposition on the apparent density of electrolytic copper powder. J. Serb. Chem. Soc. 2002, 67, 61–67. [Google Scholar] [CrossRef]
- Pavlović, M.G.; Pavlović, Lj.J.; Maksimović, V.M.; Nikolić, N.D.; Popov, K.I. Characterization and morphology of copper powder particles as a function of different electrolytic regimes. Int. J. Electrochem. Sci. 2010, 5, 1862–1878. [Google Scholar]
- Nekouei, R.K.; Rashchi, F.; Ravanbakhsh, A. Copper nanopowder synthesis by electrolysis method in nitrate and sulfate solutions. Powder Technol. 2013, 250, 91–96. [Google Scholar] [CrossRef]
- Nekouei, R.K.; Rashchi, F.; Amadeh, A.A. Using design of experiments in synthesis of ultra-fine copper particles by electrolysis. Powder Technol. 2013, 237, 165–171. [Google Scholar] [CrossRef]
- Lou, W.; Cai, W.; Li, P.; Su, J.; Zheng, S.; Zhang, Y.; Jin, W. Additives-assisted electrodeposition of fine spherical copper powder from sulfuric acid solution. Powder Technol. 2018, 326, 84–88. [Google Scholar] [CrossRef]
- Bakthavatsalam, R.; Ghosh, S.; Biswas, R.K.; Saxena, A.; Raja, A.; Thotiyl, M.O.; Wadhai, S.; Banpurkar, A.G.; Kundu, J. Solution chemistry-based nano-structuring of copper dendrites for efficient use in catalysis and superhydrophobic surfaces. RSC Adv. 2016, 6, 8416–8430. [Google Scholar] [CrossRef]
- Copper Powder. Available online: http://www.cnpcpowder.com/products/copper/ (accessed on 13 November 2018).
- Avramović, Lj.; Pavlović, M.M.; Maksimović, V.M.; Vuković, M.; Stevanović, J.S.; Bugarin, M.; Nikolić, N.D. Comparative morphological and crystallographic analysis of electrochemically- and chemically-produced silver powder particles. Metals 2017, 7, 160. [Google Scholar] [CrossRef]
- Avramović, Lj.; Ivanović, E.R.; Maksimović, V.M.; Pavlović, M.M.; Vuković, M.; Stevanović, J.S.; Nikolić, N.D. Correlation between crystal structure and morphology of potentiostatically electrodeposited silver dendritic nanostructures. Trans. Nonferr. Met. Soc. China 2018, 28, 1903–1912. [Google Scholar] [CrossRef]
- Berube, L.P.; Esperance, G.L. A quantitative method of determining of the degree of texture of zinc electrodeposits. J. Electrochem. Soc. 1989, 136, 2314–2315. [Google Scholar] [CrossRef]
- Sivasubramanian, R.; Sangaranarayanan, M.V. Electrodeposition of silver nanostructures: From polygons to dendrites. CrystEngComm 2013, 15, 2052–2056. [Google Scholar] [CrossRef]
- Xia, Y.; Xiong, Y.; Lim, B.; Skrabalak, S.E. Shape-controlled synthesis of metal nanocrystals: Simple chemistry meets complex physics? Angew. Chem. Int. Ed. 2009, 48, 60–103. [Google Scholar] [CrossRef] [PubMed]
- Popov, K.I.; Živković, P.M.; Jokić, B.; Nikolić, N.D. The shape of the polarization curve and diagnostic criteria for the metal electrodeposition process control. J. Serb. Chem. Soc. 2016, 81, 291–306. [Google Scholar] [CrossRef]
- Nikolić, N.D.; Popov, K.I.; Pavlović, Lj.J.; Pavlović, M.G. The effect of hydrogen codeposition on the morphology of copper electrodeposits. I. The concept of effective overpotential. J. Electroanal. Chem. 2006, 588, 88–98. [Google Scholar] [CrossRef]
- Nikolić, N.D.; Maksimović, V.M.; Branković, G. Morphological and crystallographic characteristics of electrodeposited lead from the concentrated electrolyte. RSC Adv. 2013, 3, 7466–7471. [Google Scholar] [CrossRef]
- Ravi Kumar, D.V.; Kim, I.; Zhong, Z.; Kim, K.; Lee, D.; Moon, J. Cu(II)–alkyl amine complex mediated hydrothermal synthesis of Cu nanowires: Exploring the dual role of alkyl amines. Phys. Chem. Chem. Phys. 2014, 16, 22107–22115. [Google Scholar] [CrossRef] [PubMed]
- Yang, H.-J.; He, S.-Y.; Chen, H.-L.; Tuan, H.-Y. Monodisperse copper nanocubes: Synthesis, self-assembly, and large-area dense-packed films. Chem. Mater. 2014, 26, 1785–1793. [Google Scholar] [CrossRef]
- Lu, L.; Sevonkaev, I.; Kumar, A.; Goia, D.V. Strategies for tailoring the properties of chemically precipitated metal powders. Powder Technol. 2014, 261, 87–97. [Google Scholar] [CrossRef] [Green Version]
Figure 1.
(a) Scheme of the cell used for production of the Cu powders by electrolysis. WE—working electrode; CE—counter electrode, (b) top view, (c) side view.
Figure 2.
Polarization curve for the Cu electrodeposition from 0.10 mol·dm−3 CuSO4 in 0.50 mol·dm−3 H2SO4.
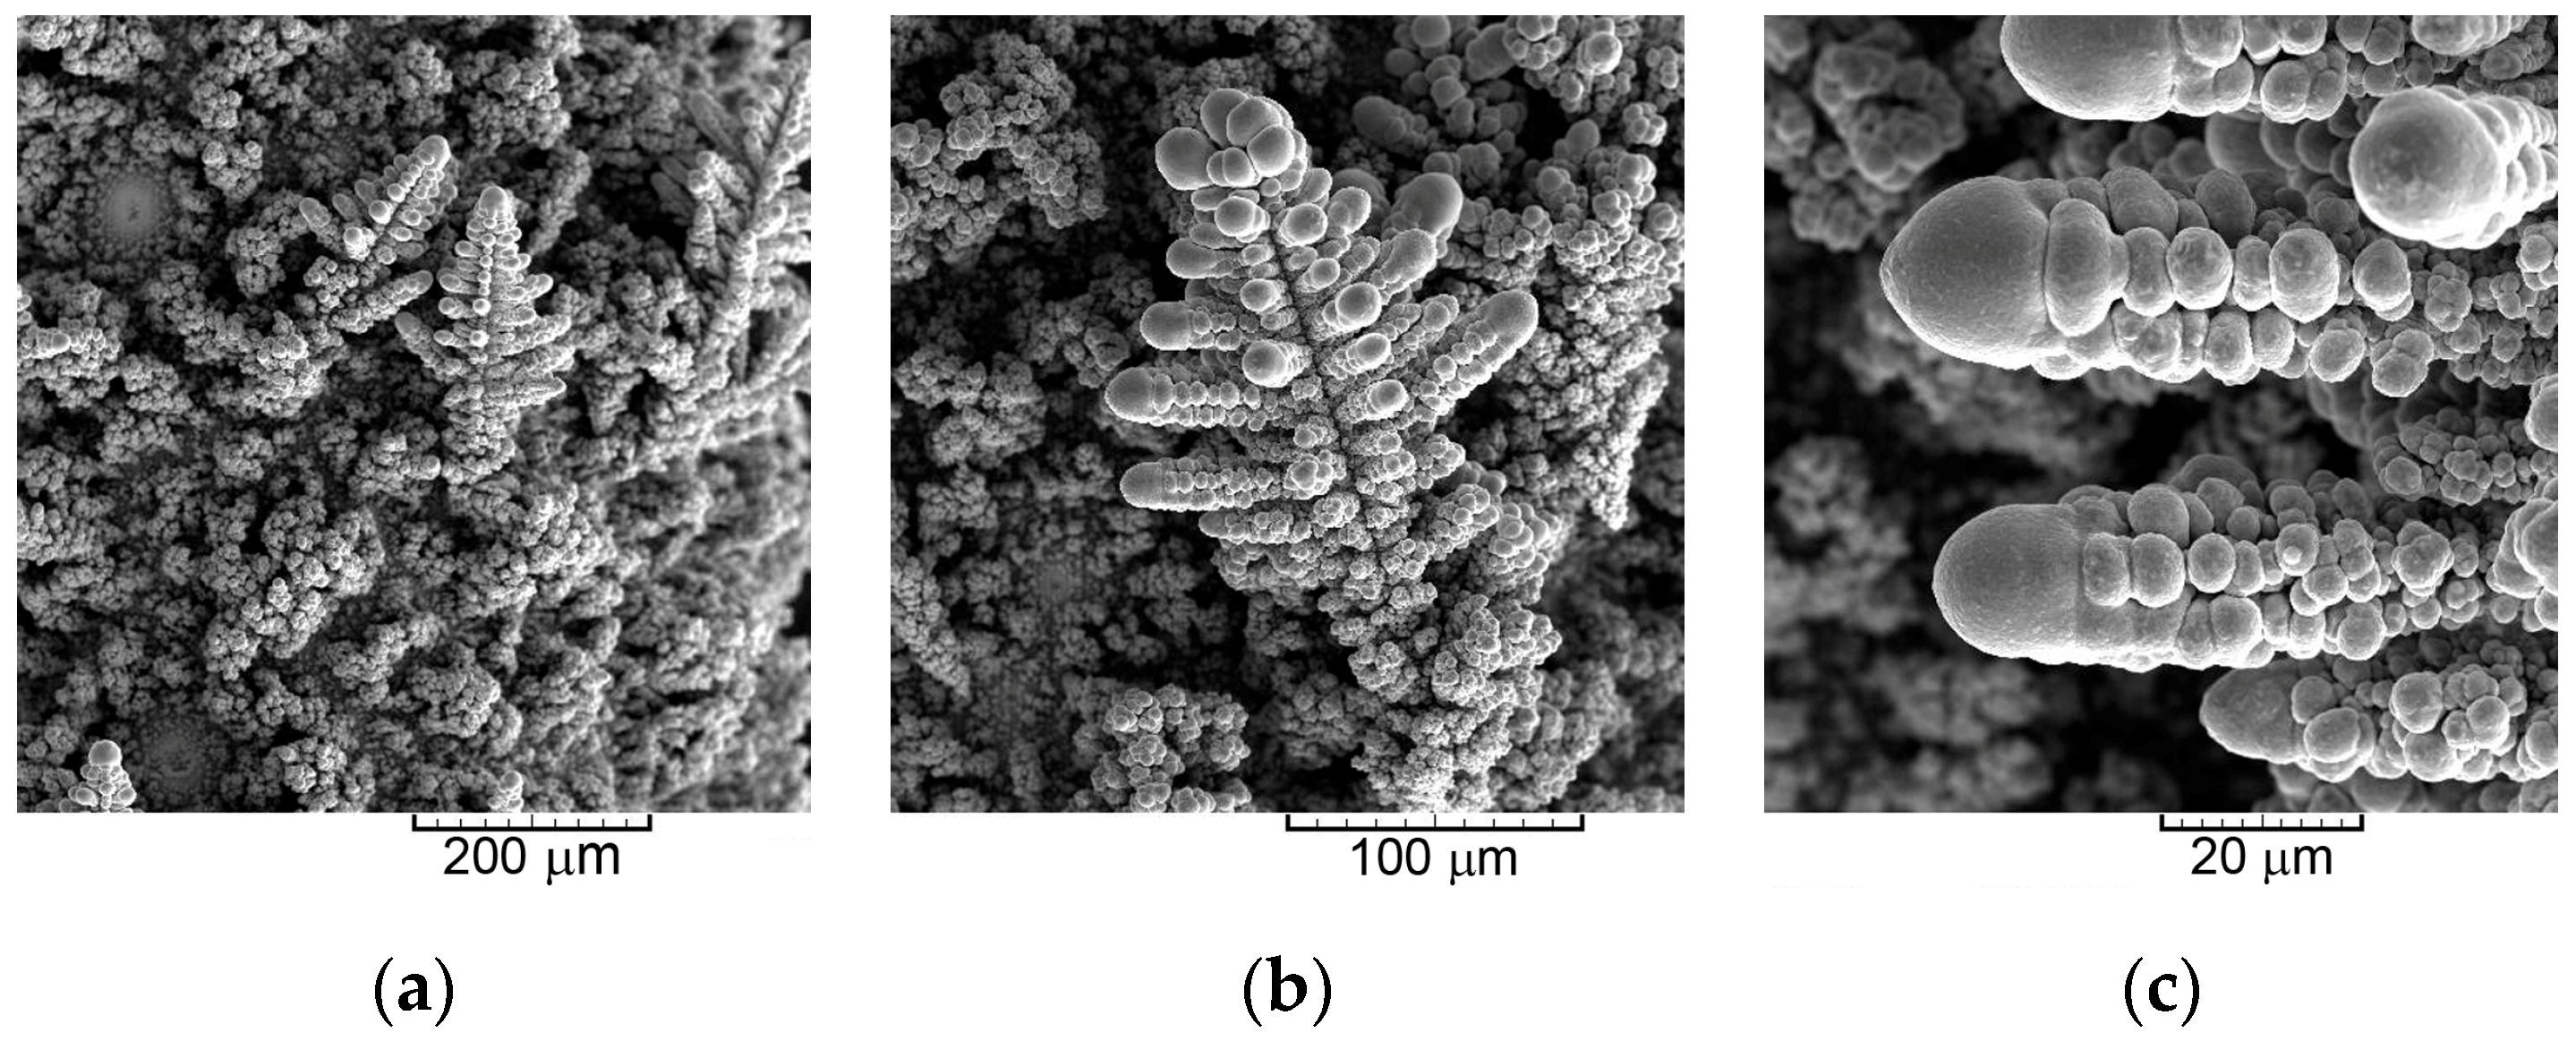
Figure 3.
Morphologies of the powdered copper obtained at a current density of 14.4 mA·cm−2: (a) appearance of electrode surface after the process of electrolysis, (b) dendrite, (c) tops of branches of dendrite, (d) top of trunk of dendrite, (e) cauliflower-like agglomerates of Cu grains formed among dendrites and holes, (f,g) particles obtained after removal from the electrode surface.
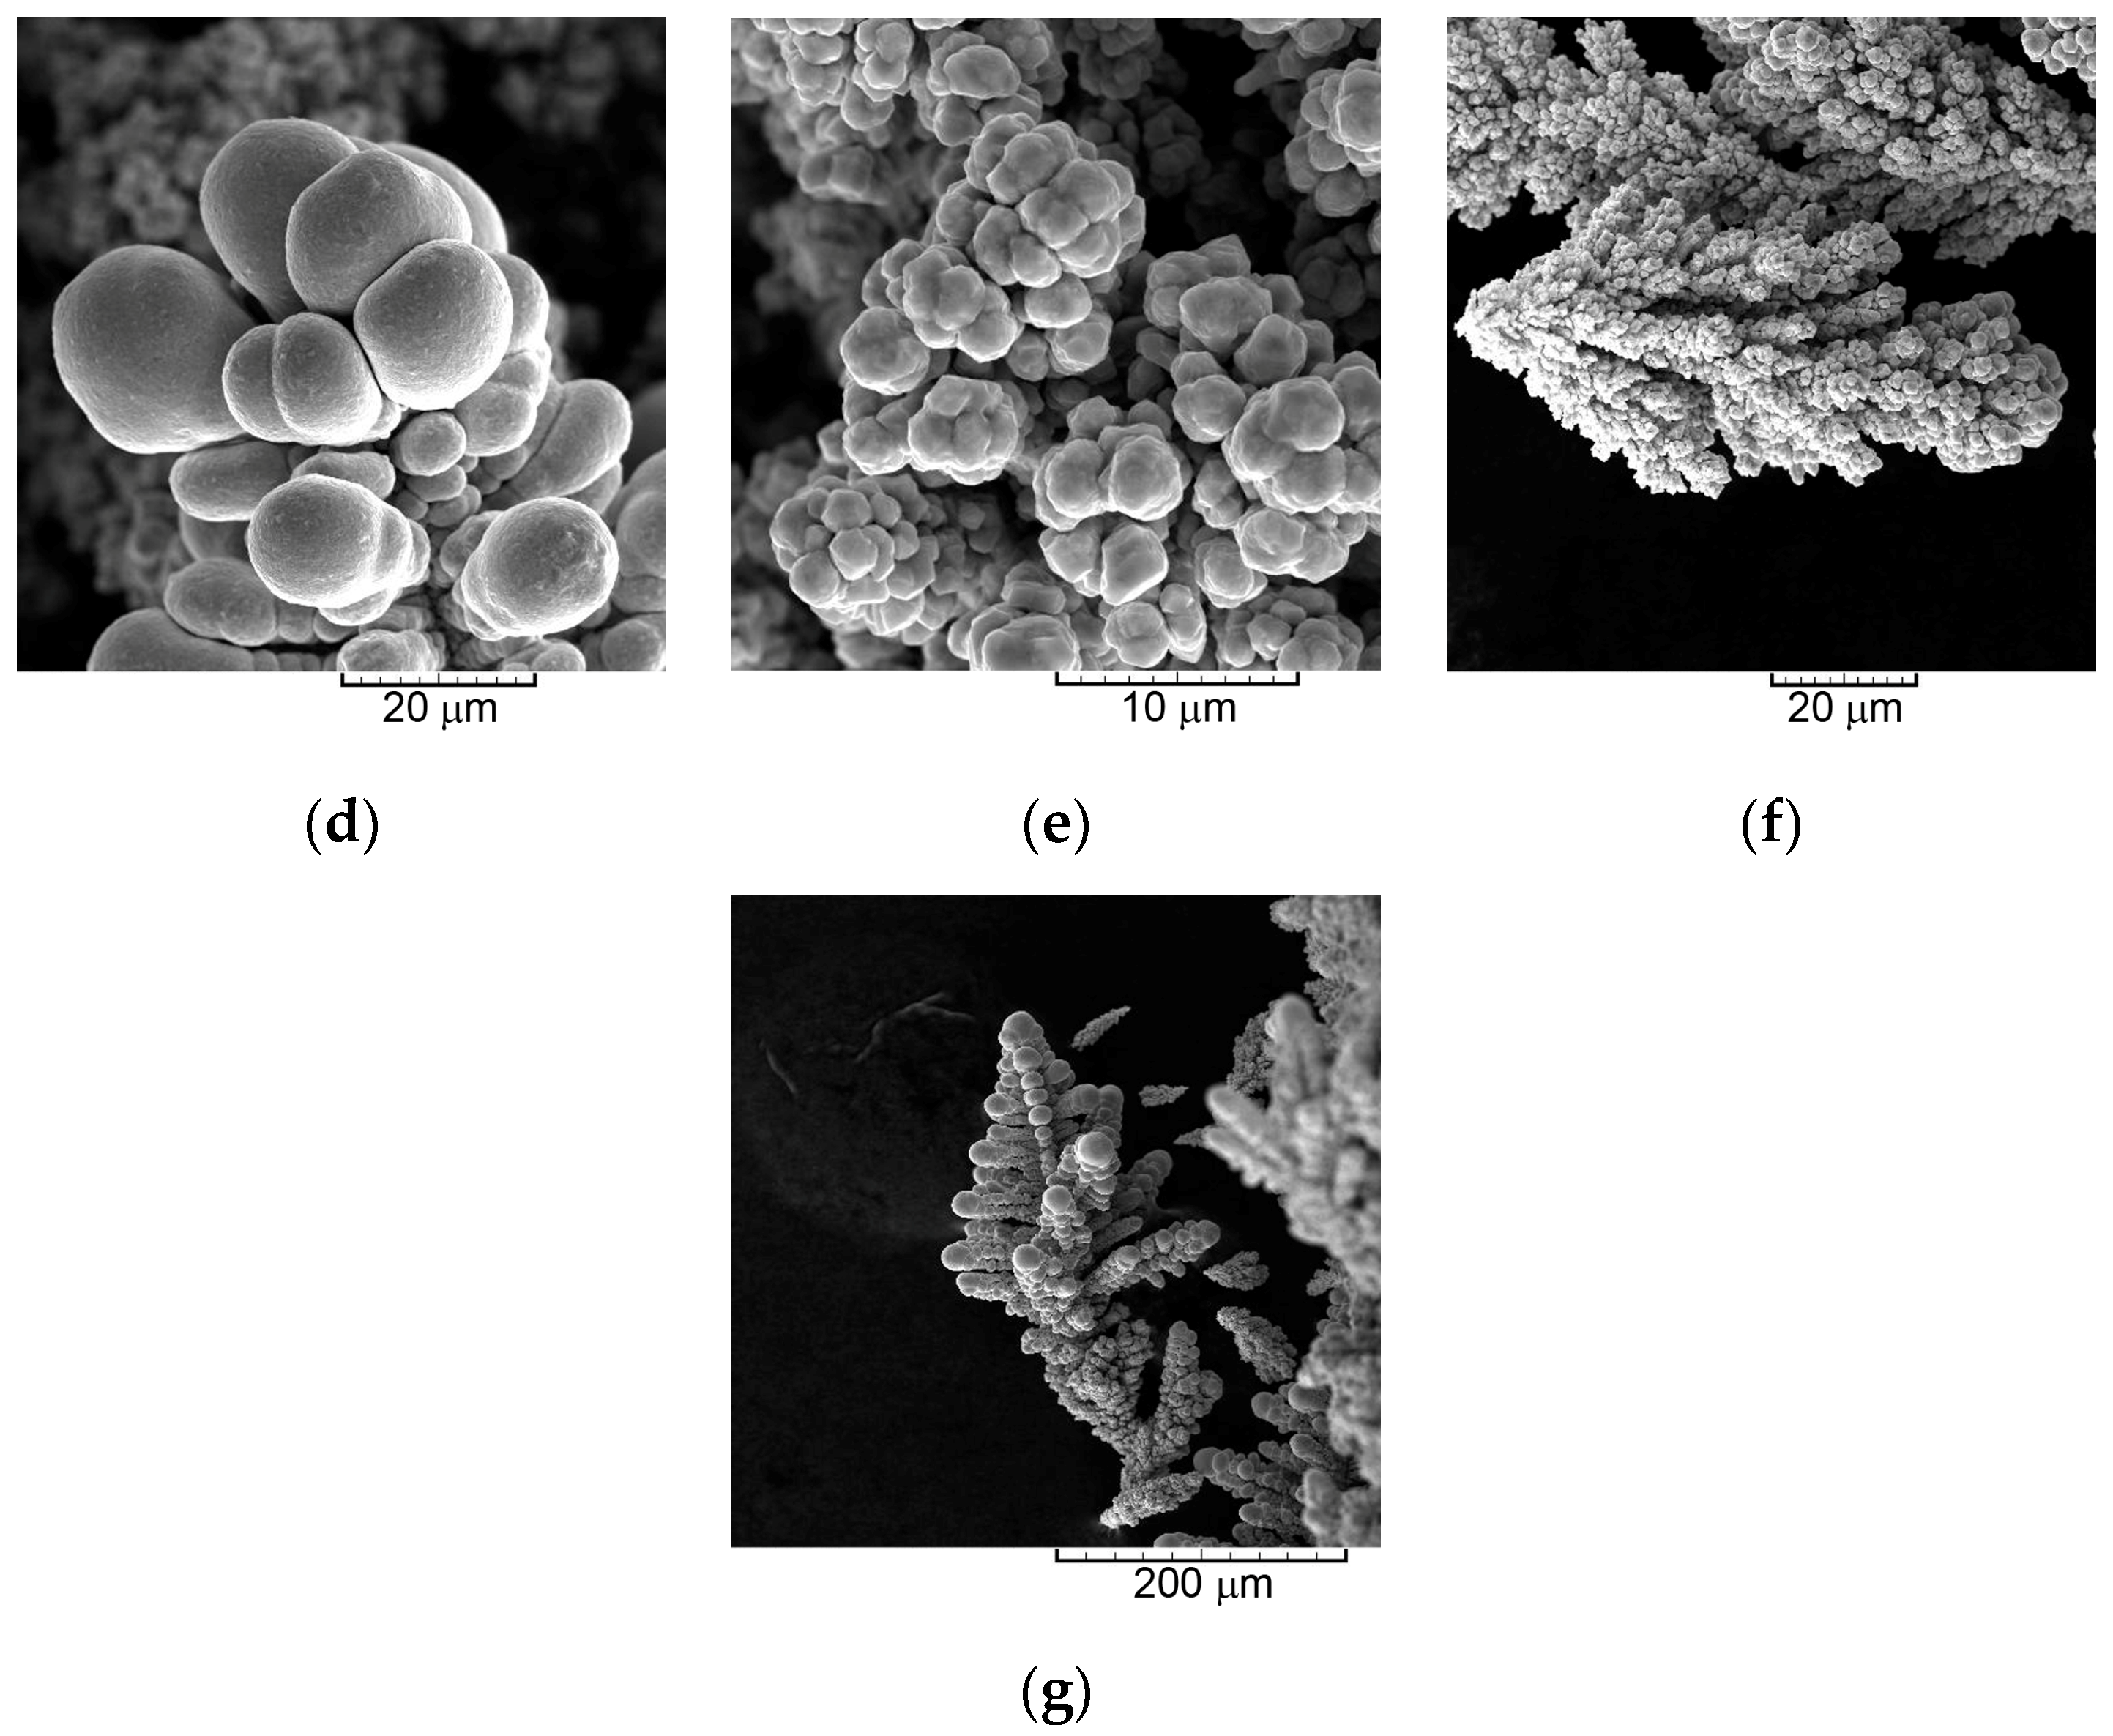
Figure 4.
Morphologies of the powdered copper obtained at a current density of 384 mA·cm−2: (a) appearance of the electrode surface after the process of electrolysis (honeycomb-like structure), (b) hole formed from the detached hydrogen bubble, (c) disperse cauliflower-like agglomerates of Cu grains formed around holes, (d) typical agglomerate constructing disperse cauliflower-like agglomerates, (e,f) particles obtained after removal from the electrode surface.
Figure 5.
Typical copper particles obtained by chemical processes: (a) ×500, (b) ×4000, (c) ×4500, (d) ×3500.
Figure 6.
XRD patterns of Cu particles obtained at current densities of 14.4 and 384 mA·cm−2, and Cu standard (04-0836).
Figure 7.
XRD pattern of chemically synthesized Cu powder, and Cu standard (04-0836).
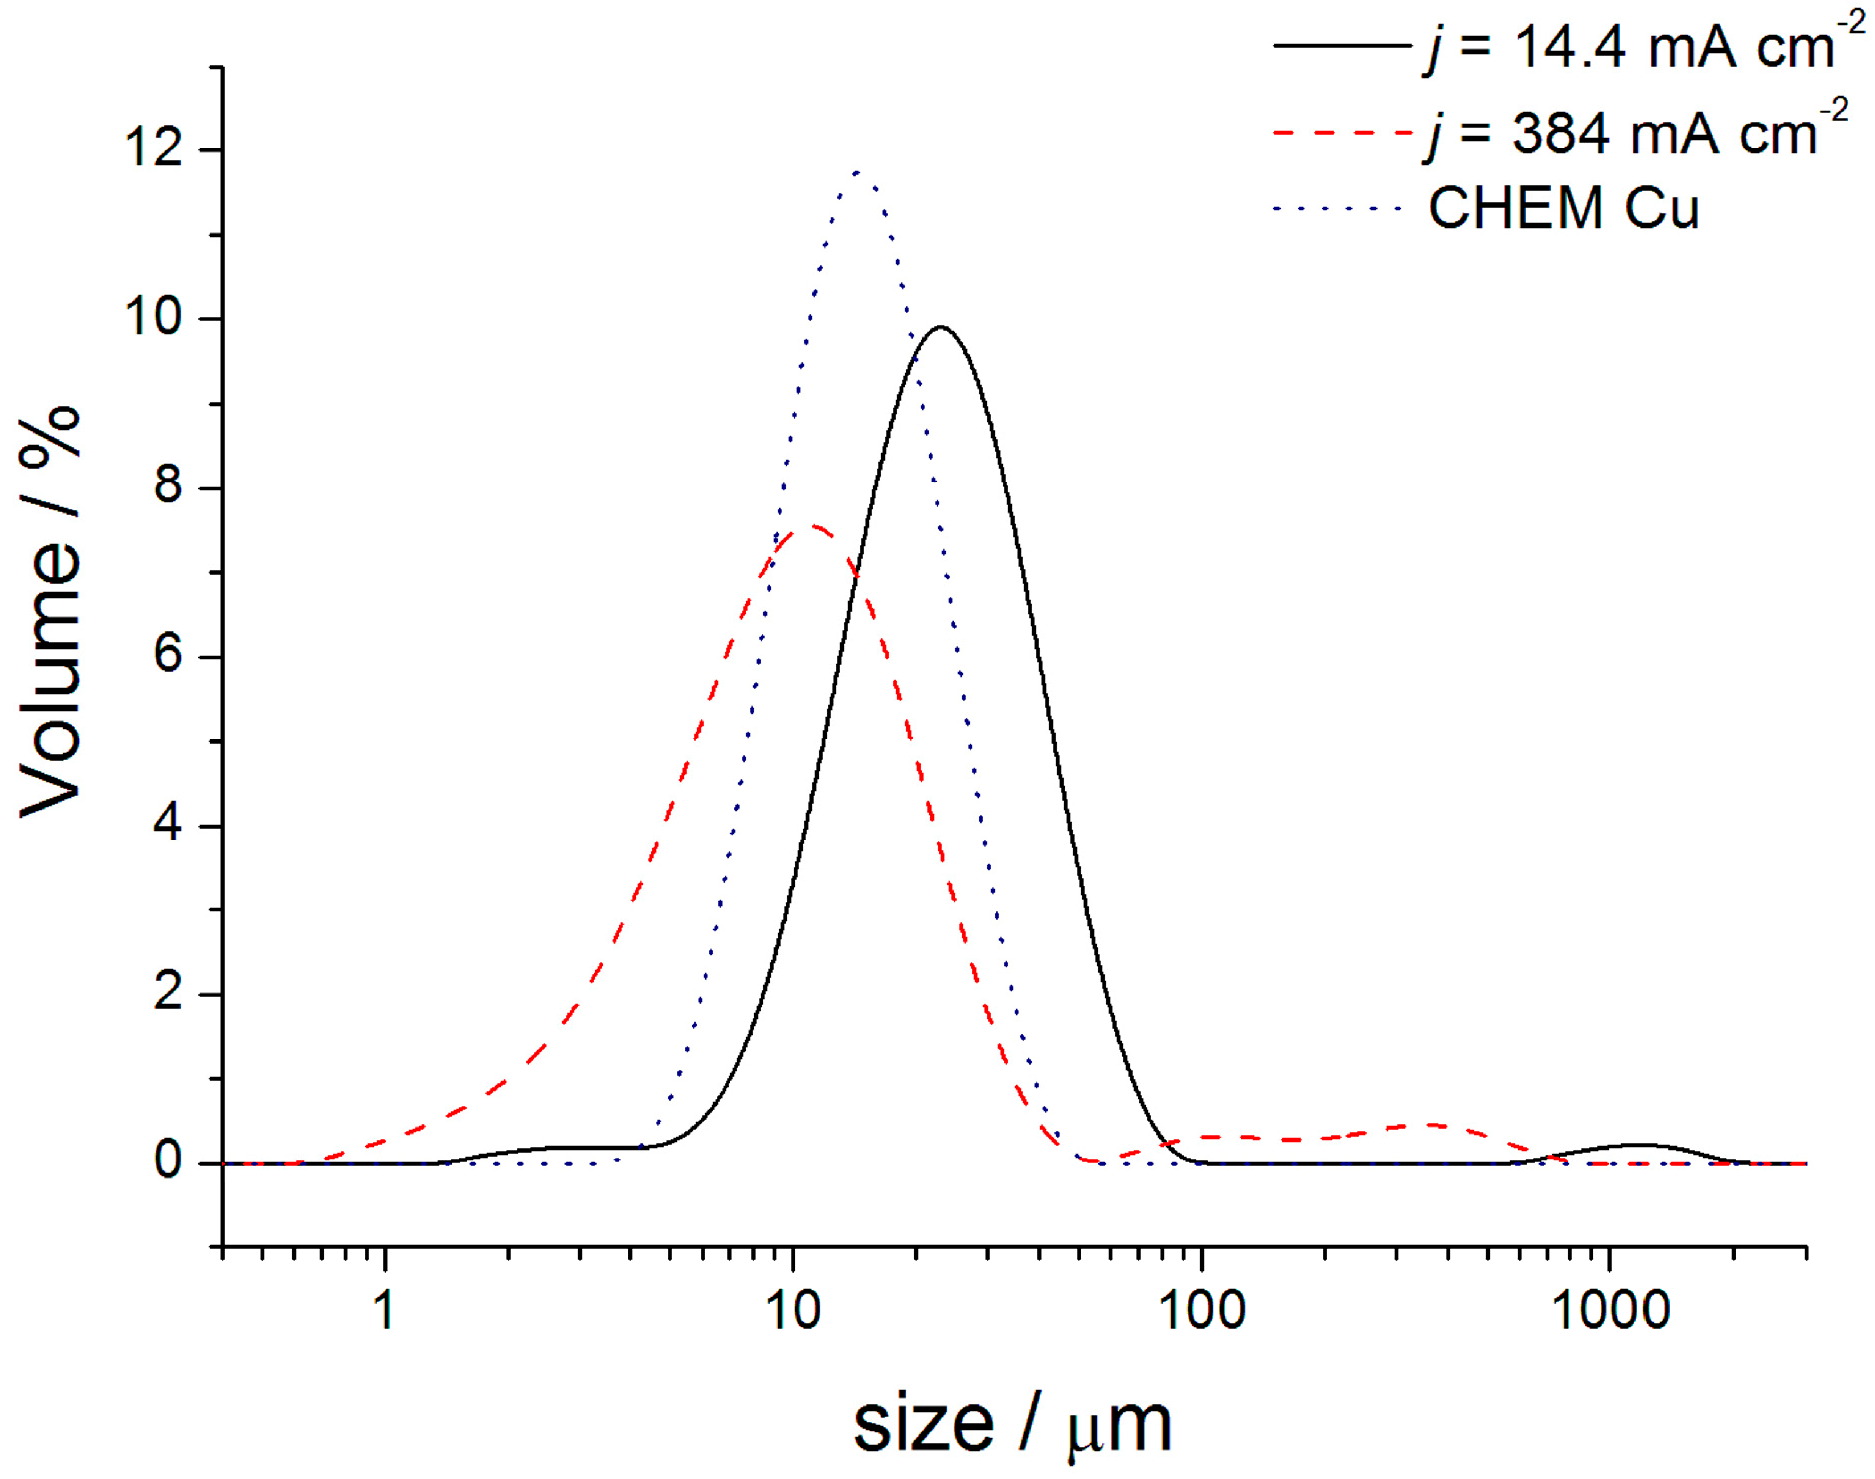
Figure 8.
Particle size distribution (PSD) curves obtained for the particles produced at current densities of 14.4 and 384 mA·cm−2, and chemically synthesized powder.
Figure 9.
The dependencies of the evolved hydrogen volume and current efficiency for the hydrogen evolution reaction on the electrolysis time obtained at current densities of: (a) 14.4 mA·cm−2 and (b) 384 mA·cm−2.
Table 1.
Ratios of intensities of the diffraction peaks for the analyzed powders and Cu standard.
| Type | Ratio of Intensities: |
|---|
| of Powder Particles | (111)/(200) | (111)/(220) | (111)/(311) |
|---|
| Cu(14.4) | 2.4 | 4.1 | 5.3 |
| Cu(384) | 1.9 | 2.6 | 3.4 |
| Cu(CHEM) | 2.5 | 5.2 | 6.0 |
| Cu standard (04-0783) | 2.2 | 5.0 | 5.9 |
Table 2.
Texture calculations for Cu powders obtained by the galvanostatic regime at current densities (j) of 14.4 and 384 mA·cm−2 and for commercially available powder (j = 14.4 mA·cm−2—14.4, j = 384 mA·cm−2—384, commercially available powder—CHEM, s—Cu standard).
| Plane (hkl) | R (in %) | Rs (in %) | TC | RTC (in %) |
|---|
| R14.4 | R384 | RCHEM | TC14.4 | TC384 | TCCHEM | RTC14.4 | RTC384 | RTCCHEM |
|---|
| (111) | 54.1 | 45.3 | 57.3 | 54.6 | 0.99 | 0.83 | 1.05 | 23.6 | 17.3 | 26.6 |
| (200) | 22.5 | 24.1 | 22.3 | 25.1 | 0.90 | 0.96 | 0.89 | 21.5 | 20.0 | 22.5 |
| (220) | 13.1 | 17.2 | 10.9 | 10.9 | 1.20 | 1.58 | 1.00 | 28.6 | 32.9 | 25.3 |
| (311) | 10.3 | 13.4 | 9.5 | 9.4 | 1.10 | 1.43 | 1.01 | 26.3 | 29.8 | 25.6 |
Table 3.
Values of specific surface area (SSA), particle size with the maximum volume ratio (PSMVR), and the average current efficiency for hydrogen evolution reaction (ηI,av(H2)) for powders obtained by electrolysis at current densities of 14.4 mA·cm−2 (Cu(14.4)) and 384 mA·cm−2 (Cu(384)), and chemically synthesized powder (Cu(CHEM)).
| The Type of Powder Particle | ηI,av(H2) % | SSA m2 g−1 | PSMVR μm |
|---|
| Cu(14.4) | 6.63 | 0.0389 | 23.2 |
| Cu(384) | 49.7 | 0.0997 | 10.9 |
| Cu(CHEM) | / | 0.0544 | 14.6 |
© 2019 by the authors. Licensee MDPI, Basel, Switzerland. This article is an open access article distributed under the terms and conditions of the Creative Commons Attribution (CC BY) license (http://creativecommons.org/licenses/by/4.0/).


 ,
, 


