Article

Serrated Flow Behavior of Hot-Rolled Fe-6.5wt.%Si Sheet with Layered Structure

1
State Key Laboratory for Advanced Metals and Materials, University of Science and Technology Beijing, Beijing 100083, China
2
Department of Mechanical Engineering, The Hong Kong Polytechnic University, Hong Kong 999077, China
*
Author to whom correspondence should be addressed.
Metals 2019, 9(10), 1023; https://doi.org/10.3390/met9101023
Submission received: 19 August 2019 / Revised: 16 September 2019 / Accepted: 18 September 2019 / Published: 20 September 2019

Abstract

:
The microstructures and mechanical properties of the hot-rolled Fe-6.5wt.%Si sheet are analyzed. The microstructure of the hot-rolled sheet is layered along the thickness direction. The surface exhibits fine and equiaxed grains, whereas the center part shows coarse and elongated grains with a <101> fiber texture along the rolling direction. Serrated flow behavior is observed during tensile deformation of both the hot-rolled sheet and its center samples at 350 °C; thus, the serrated flow of the hot-rolled sheet is mainly attributed to the serration of the center part. The analyses of dislocation configurations, ordered structures, and crystal orientation show that the serrated flow behavior results from the interaction of solutes with mobile dislocations. Mobile dislocations are pinned by combining parallel forest dislocations with the pipe diffusion of solution atoms. This study provides a new perspective for the deformation mechanism of the Fe-6.5wt.%Si alloy.

1. Introduction

Fe-6.5wt.%Si alloy exhibits excellent soft magnetic properties, such as high permeability, low coercivity, and near-zero magnetostriction, which result in favorable application of this alloy in high-frequency transformers [1,2]. However, its intrinsic brittleness and poor formability resulting from the ordered phases (B2 and D03 ordered structures) limit the fabrication of Fe-6.5wt.%Si alloy sheets by the conventional casting-rolling process, which hinders the development and application of the alloy [3,4,5].
The formability of the hot-rolled sheet can be enhanced by warm deformation [6,7]. Recently, Li et al. [7] found that the warm deformation may induce work softening by the deformation-induced disordering and dynamic recovery. Liang et al. [6] fabricated the alloy sheet by hot–warm–cold rolling. Accordingly, warm deformation is significant for deformation mechanism research and preparation of the alloy.
During warm deformation, serrated flow behavior is usually accompanied by repetitive yielding and plastic instability in the stress–strain curves [8]. Some special deformation mechanisms and the structural evolution during deformation can be reflected by the serration characteristics. Therefore, the serrated flow behavior is of great theoretical value for plastic deformation, which has attracted wide attention and interest. The serrated flow behavior has been found in materials such as aluminum alloys, magnesium alloys, bulk metallic glass, transformation-induced plasticity (TRIP)-assisted steel, and China low-activation martensitic steel [8,9,10,11,12,13].
The Fe-6.5wt.%Si alloy is a body centered cubic (BCC) alloy together with B2 (FeSi) or D03 (Fe3Si) ordered structures [14]. Recently, Honjo et al. [15,16,17] studied the serrated plastic flow of L12-type ordered intermetallics, including Ni3(Si, Ti), Ni3Al, and Co3Ti alloys, at intermediate temperature. The activation energy of pipe diffusion in the dislocation core is very close to the activation energy of the serrated plastic flow. However, the serrated flow behavior in the Fe-6.5wt.%Si alloy has not been widely investigated. Fu et al. [18,19] observed serrated plastic flow during warm deformation in the elongated-grained Fe-6.5wt.%Si alloy obtained by directional solidification. They revealed that the deformation twinning is responsible for the serrated flow behavior. However, it is not clear whether the serrated flow behavior in the elongated-grained Fe-6.5wt.%Si alloy fabricated by rolling occurs. The mechanisms of serrated flow in Fe-6.5wt.%Si alloy need to be further discussed and analyzed.
In this study, the microstructures and tensile deformation behavior of hot-rolled Fe-6.5wt.%Si alloy were investigated. Serrated flow behavior during tensile deformation was observed. The layered structure of the hot-rolled Fe-6.5wt.%Si alloy provided sound evidence that the grain morphology, degree of order, and orientation can result in varied deformation behavior. The results are expected to provide a theoretical supplement for the serrated flow behavior and deformation mechanism of the Fe-6.5wt.%Si alloy.

2. Materials and Methods

A Fe-6.5wt.%Si alloy ingot was prepared by melting pure iron (99.5 wt.%) and metallic silicon (99 wt.%) in a vacuum induction furnace at medium frequency, and the vacuum degree is approximately 50 Pa. A 200 kg flat ingot with a size of 600 mm in length, 400 mm in width, and 90 mm in thickness was cast, and the cast temperature was set at approximately 1500 °C. The ingot was then slowly cooled to reduce cracks. The chemical composition is listed in Table 1.
After homogenization at 1100 °C for 5 h, the flat ingot was directly hot rolled into sheets with a size of 2300 mm in length, 250 mm in width, and 2.5 mm in thickness in the temperature range of 900–1100 °C. The reduction of each pass during hot rolling is listed in Table 2. The samples were cut during rolling due to excessive length. After the fourth pass, the sample was reheated in the furnace.
The microstructures and crystallographic orientation were detected by an electron backscattered diffraction (EBSD) detector in scanning electron microscopy (SEM, ZEISS SUPRA 55, Carl Zeiss, Jena, Germany). High-temperature tensile samples with a thickness of 0.5 mm were cut from the surface and center of the hot-rolled sheet. The sampling position corresponds to the rectangular region in Figure 1. The tensile axis of the samples was parallel to the rolling direction. Tensile properties were tested by DDL-50 electronic universal testing machine (DDL-50, Changchun Research Institute for Mechanical Science Co., Ltd., Changchun, China) at 350 °C and 450 °C with a strain rate of 5 × 10⁻⁴ s−1. The samples were heated to the deformation temperature at an average rate of approximately 0.25 °C/s, and held for 10 min under isothermal condition. The fracture surface was observed by SEM (ZEISS SUPRA 55, Carl Zeiss, Jena, Germany).
Dislocation configurations of the hot-rolled sheet were observed by transmission electron microscopy (TEM, JEM-2100, JEOL, Tokyo, Japan). The specimens for TEM analysis were fabricated by electrochemical polishing in a mixed solution of 6% perchloric acid and 94% ethanol at 30 V and −20 °C.

3. Results

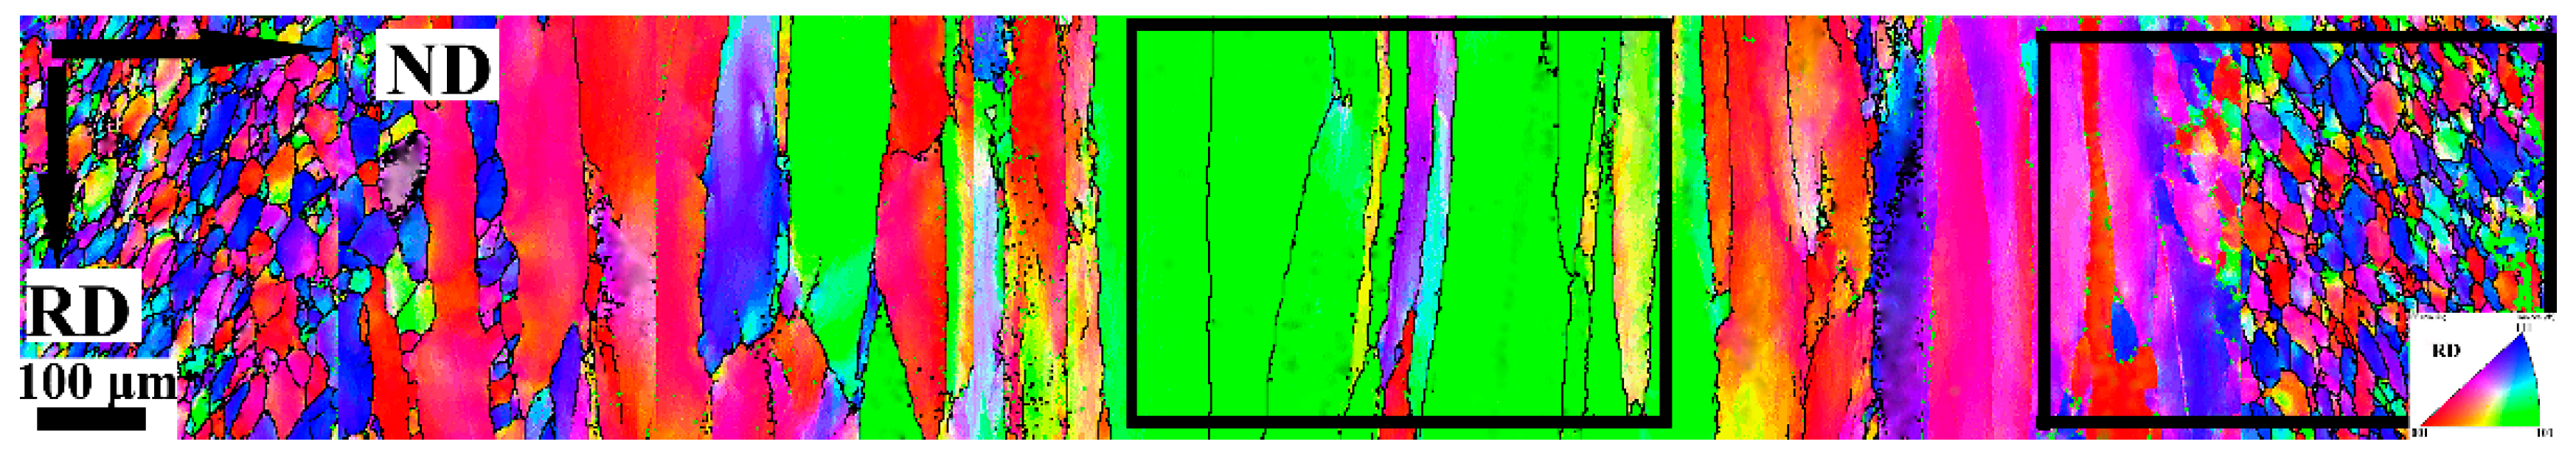
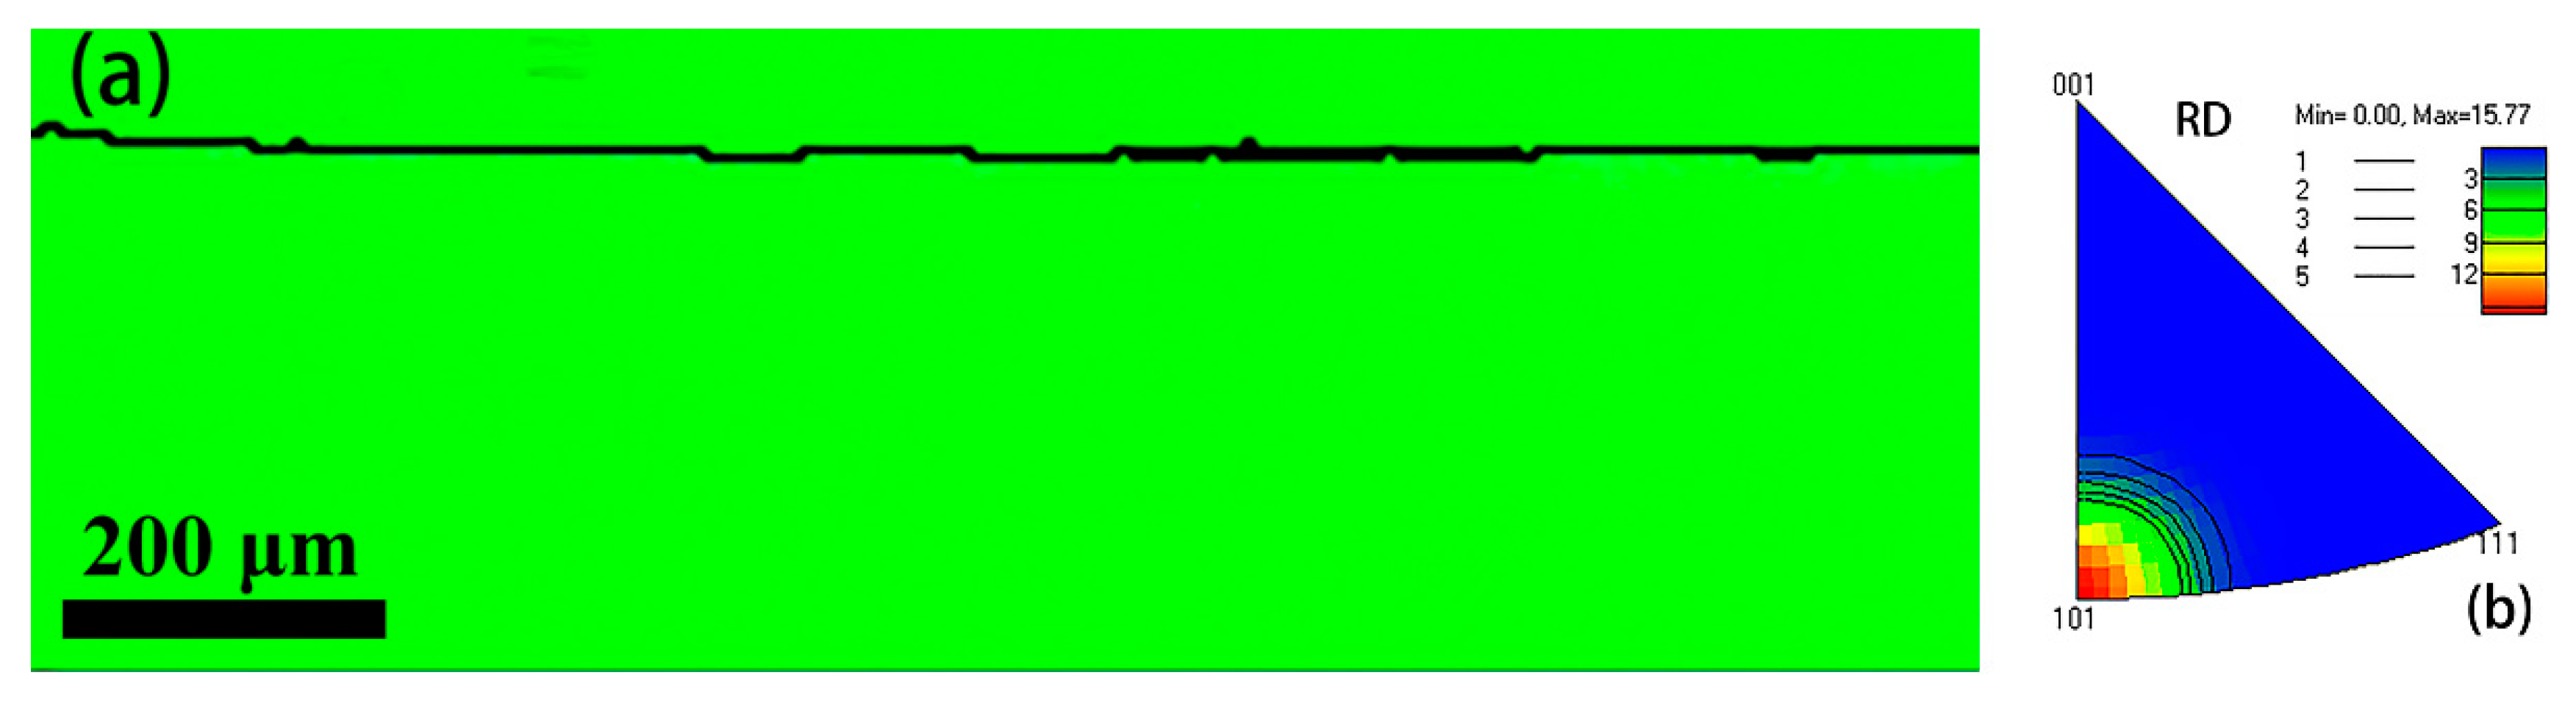
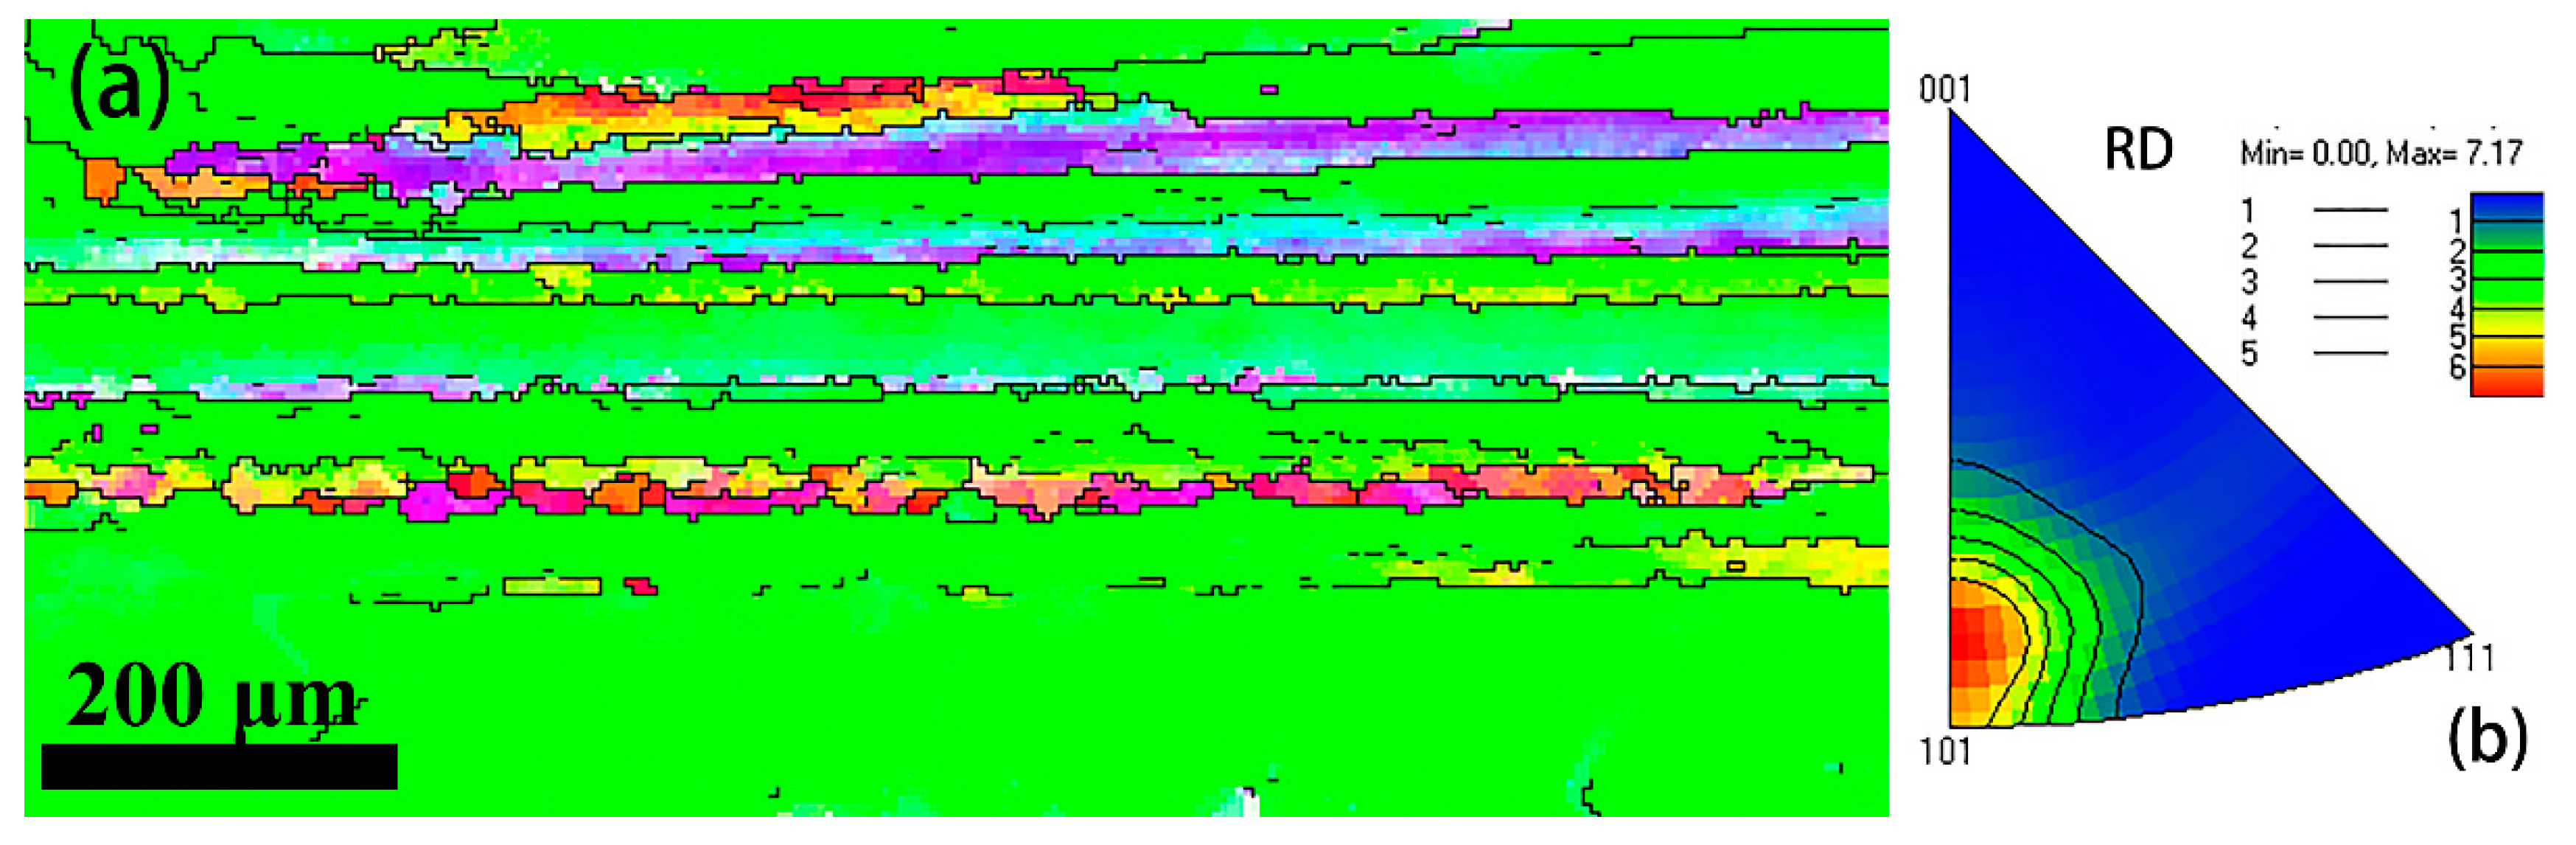
3.1. Grain Morphology and Orientation of the Hot-Rolled Sheet

Figure 1 shows grain morphology and orientation of the hot-rolled sheet. A significant difference in orientations and grain morphology is visible along the thickness direction, namely, the normal direction (ND). The surface part was composed of equiaxed grains with random orientations, and the size of the equiaxed grains was approximately 30 μm. For the center, the elongated grains with a strong <101> fiber texture along the rolling direction were obtained, and the width of the elongated grains was approximately 110 μm. A transition region between the surface and center part consisted of elongated grains with a <001> fiber texture.

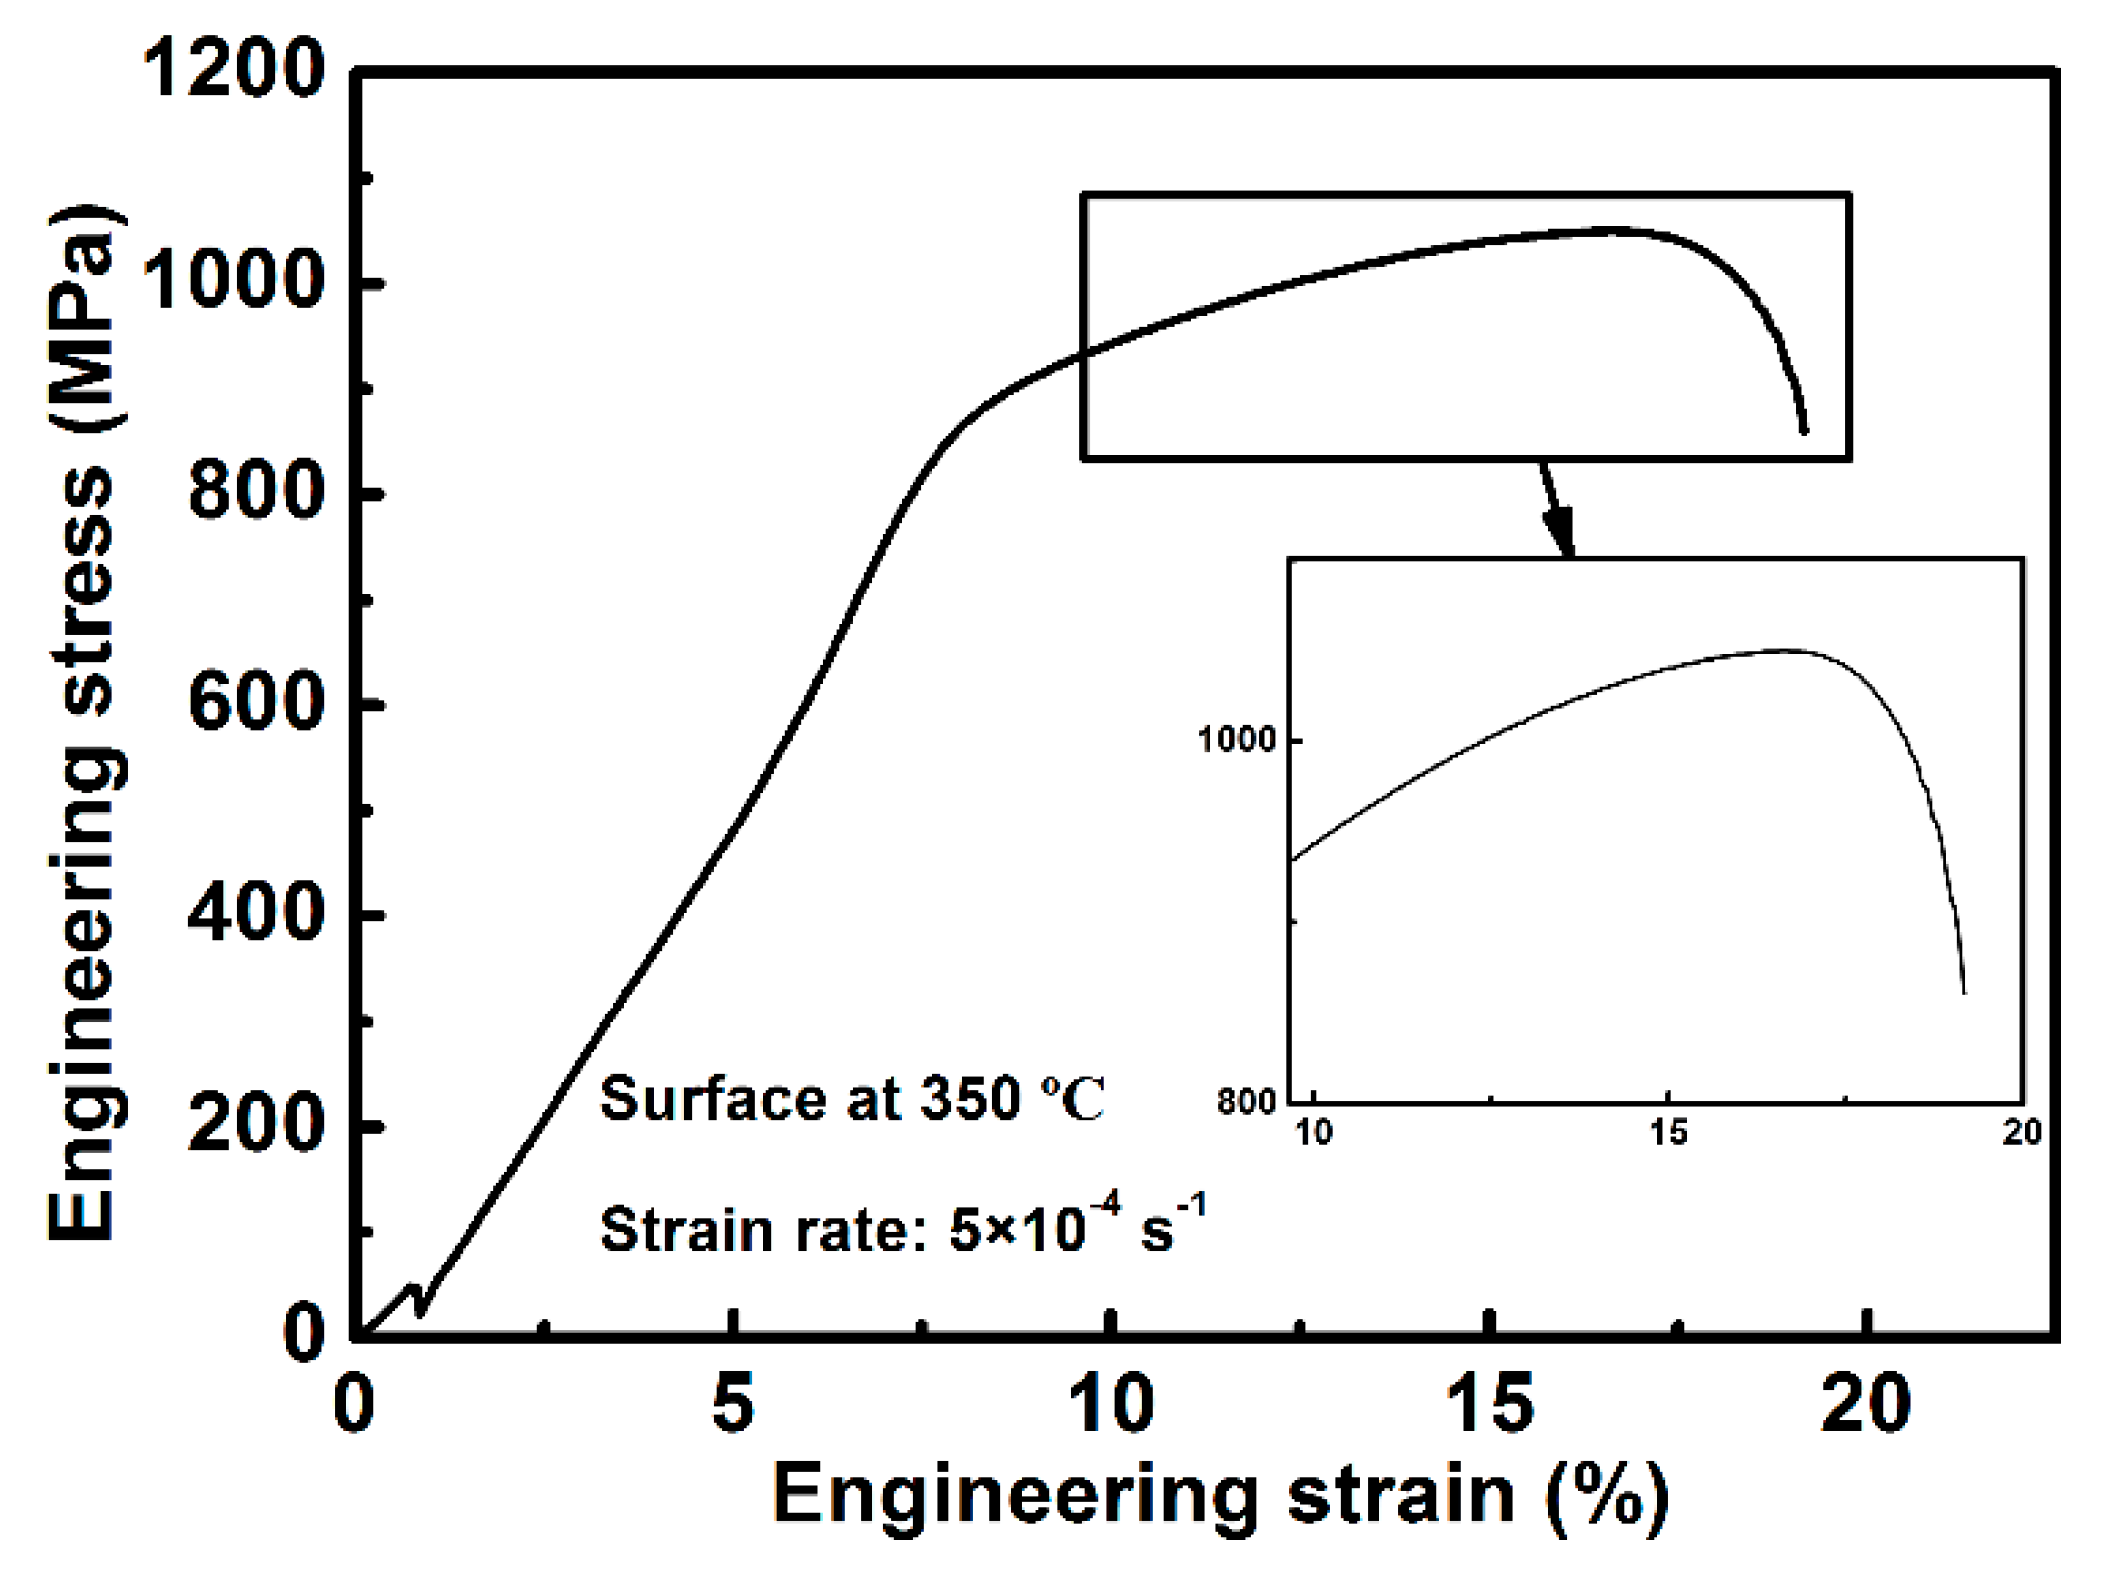
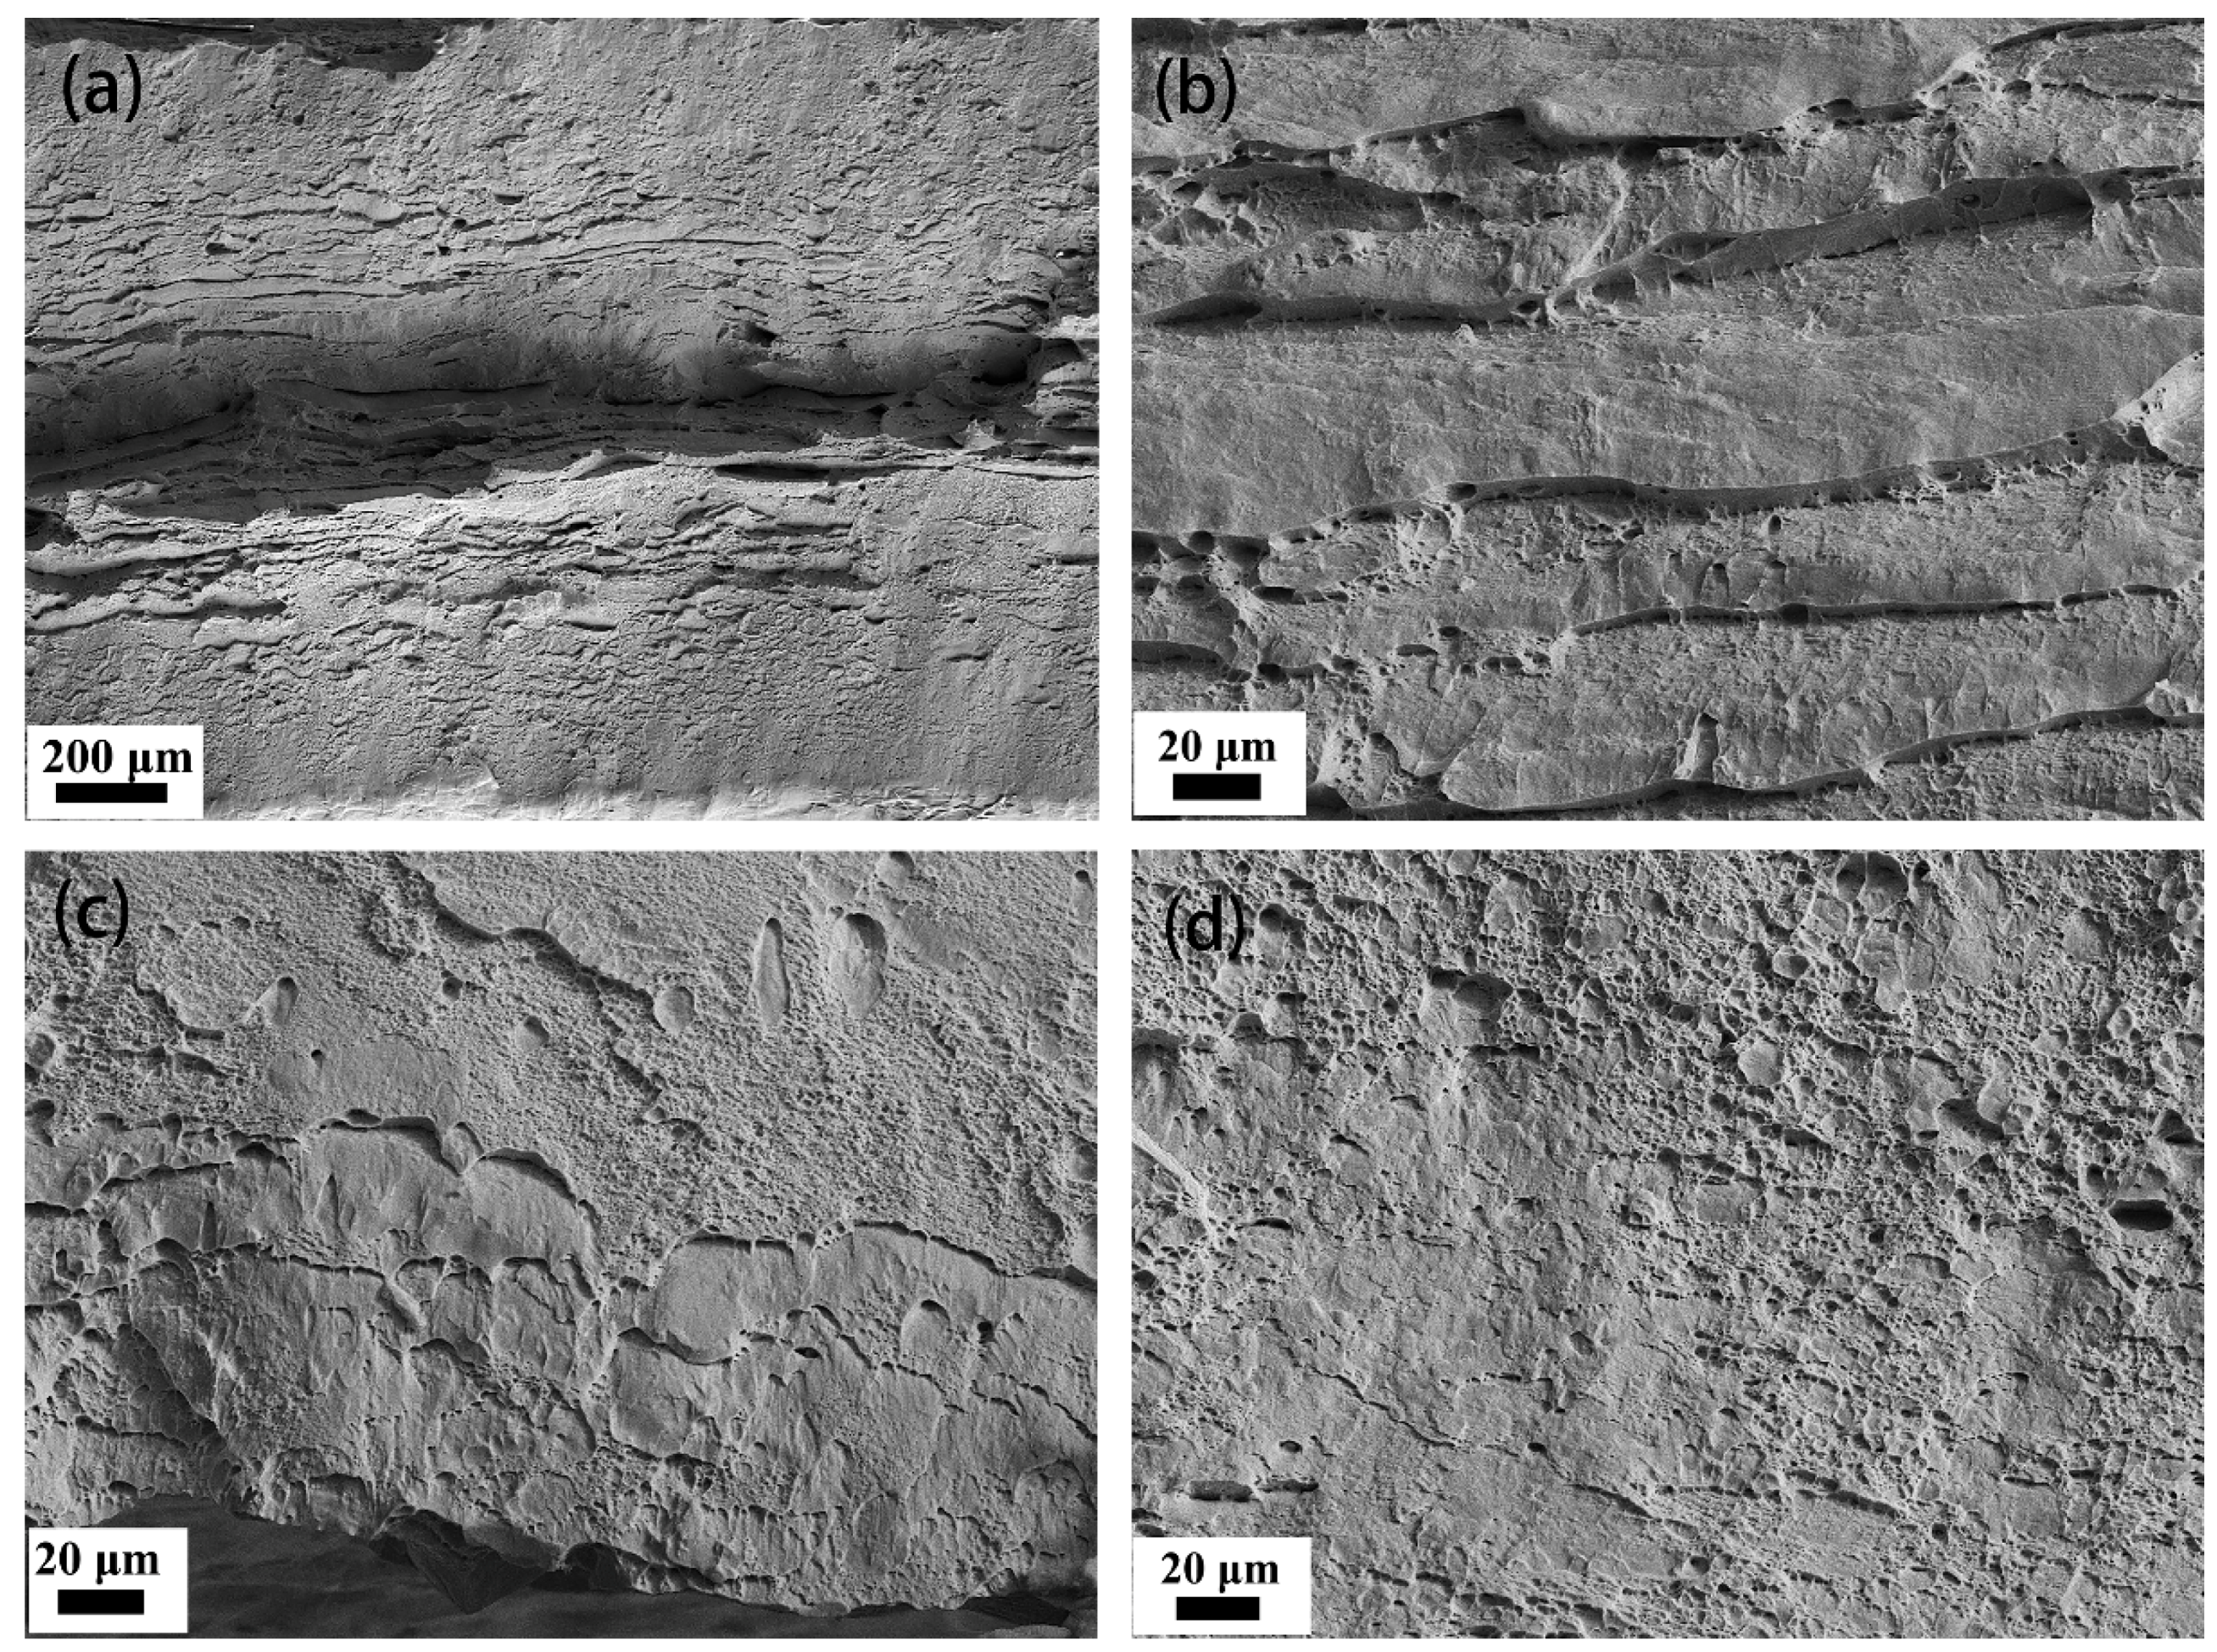
3.2. Tensile Properties and Fracture Morphology

Figure 2 shows the tensile curves of the hot-rolled sheet with a thickness of 2.5 mm at 350 °C and 450 °C. Serrations appeared in the tensile curve at 350 °C after the ultimate tensile strength, as shown in Figure 2a, whereas no serrations occurred at 450 °C (Figure 2b). The serrated stress amplitude was approximately 30 MPa in the tensile curve at 350 °C, and the critical strain corresponding to the transition from stable to unstable flow is approximately 18.2%.
Because the microstructure of the hot-rolled sheet was not homogenous, as shown in Figure 1, tensile properties of the surface and center part were tested to analyze the origin of the serrated plastic flow. For the surface and center tensile samples, the sampling position corresponds to the rectangular region in Figure 1.
Tensile curves of the center part at 350 °C and 450 °C are shown in Figure 3. Serrated flow behavior in tensile curves of the center part at 350 °C was observed in Figure 3a. The density of serrations was higher than that of the hot-rolled sheet with a thickness of 2.5 mm (Figure 2a), and the serrated stress amplitude was approximately 15 MPa. The serrations started to occur after a certain strain (20%), as shown in the curve 1 in Figure 3a. Figure 3a also shows the results for an unloading and re-loading process during tensile test (curves 2 and 3). The tensile stress was unloaded when the serration occurred. After the critical strain for serration, the center samples were loaded again. The serrated flow behavior still occurred in the re-loading process, as shown in the curve 3 in Figure 3a. At 450 °C, serrations were hardly observed from the tensile curve, as shown in Figure 3b. For the surface sample, the tensile curve was smooth during deformation at 350 °C, and no serrated flow appeared, as shown in Figure 4.
The fracture morphologies after tensile tests are shown in Figure 5. Figure 5a presents the fracture surfaces of the whole sample with a thickness of 2.5 mm at 350 °C. Different fracture modes are shown in the surface and center part. Ductile dimples were deep in the center part, whereas brittle cleavage fracture occurred in the surface part. A mixture of brittle cleavage and ductile dimple fracture is observed in the center in Figure 5b,c, and the ductile dimples were deeper at 450 °C than those at 350 °C. The dimples in Figure 5d are somewhat flat, and a brittle cleavage fracture is mainly observed in the fracture surface.

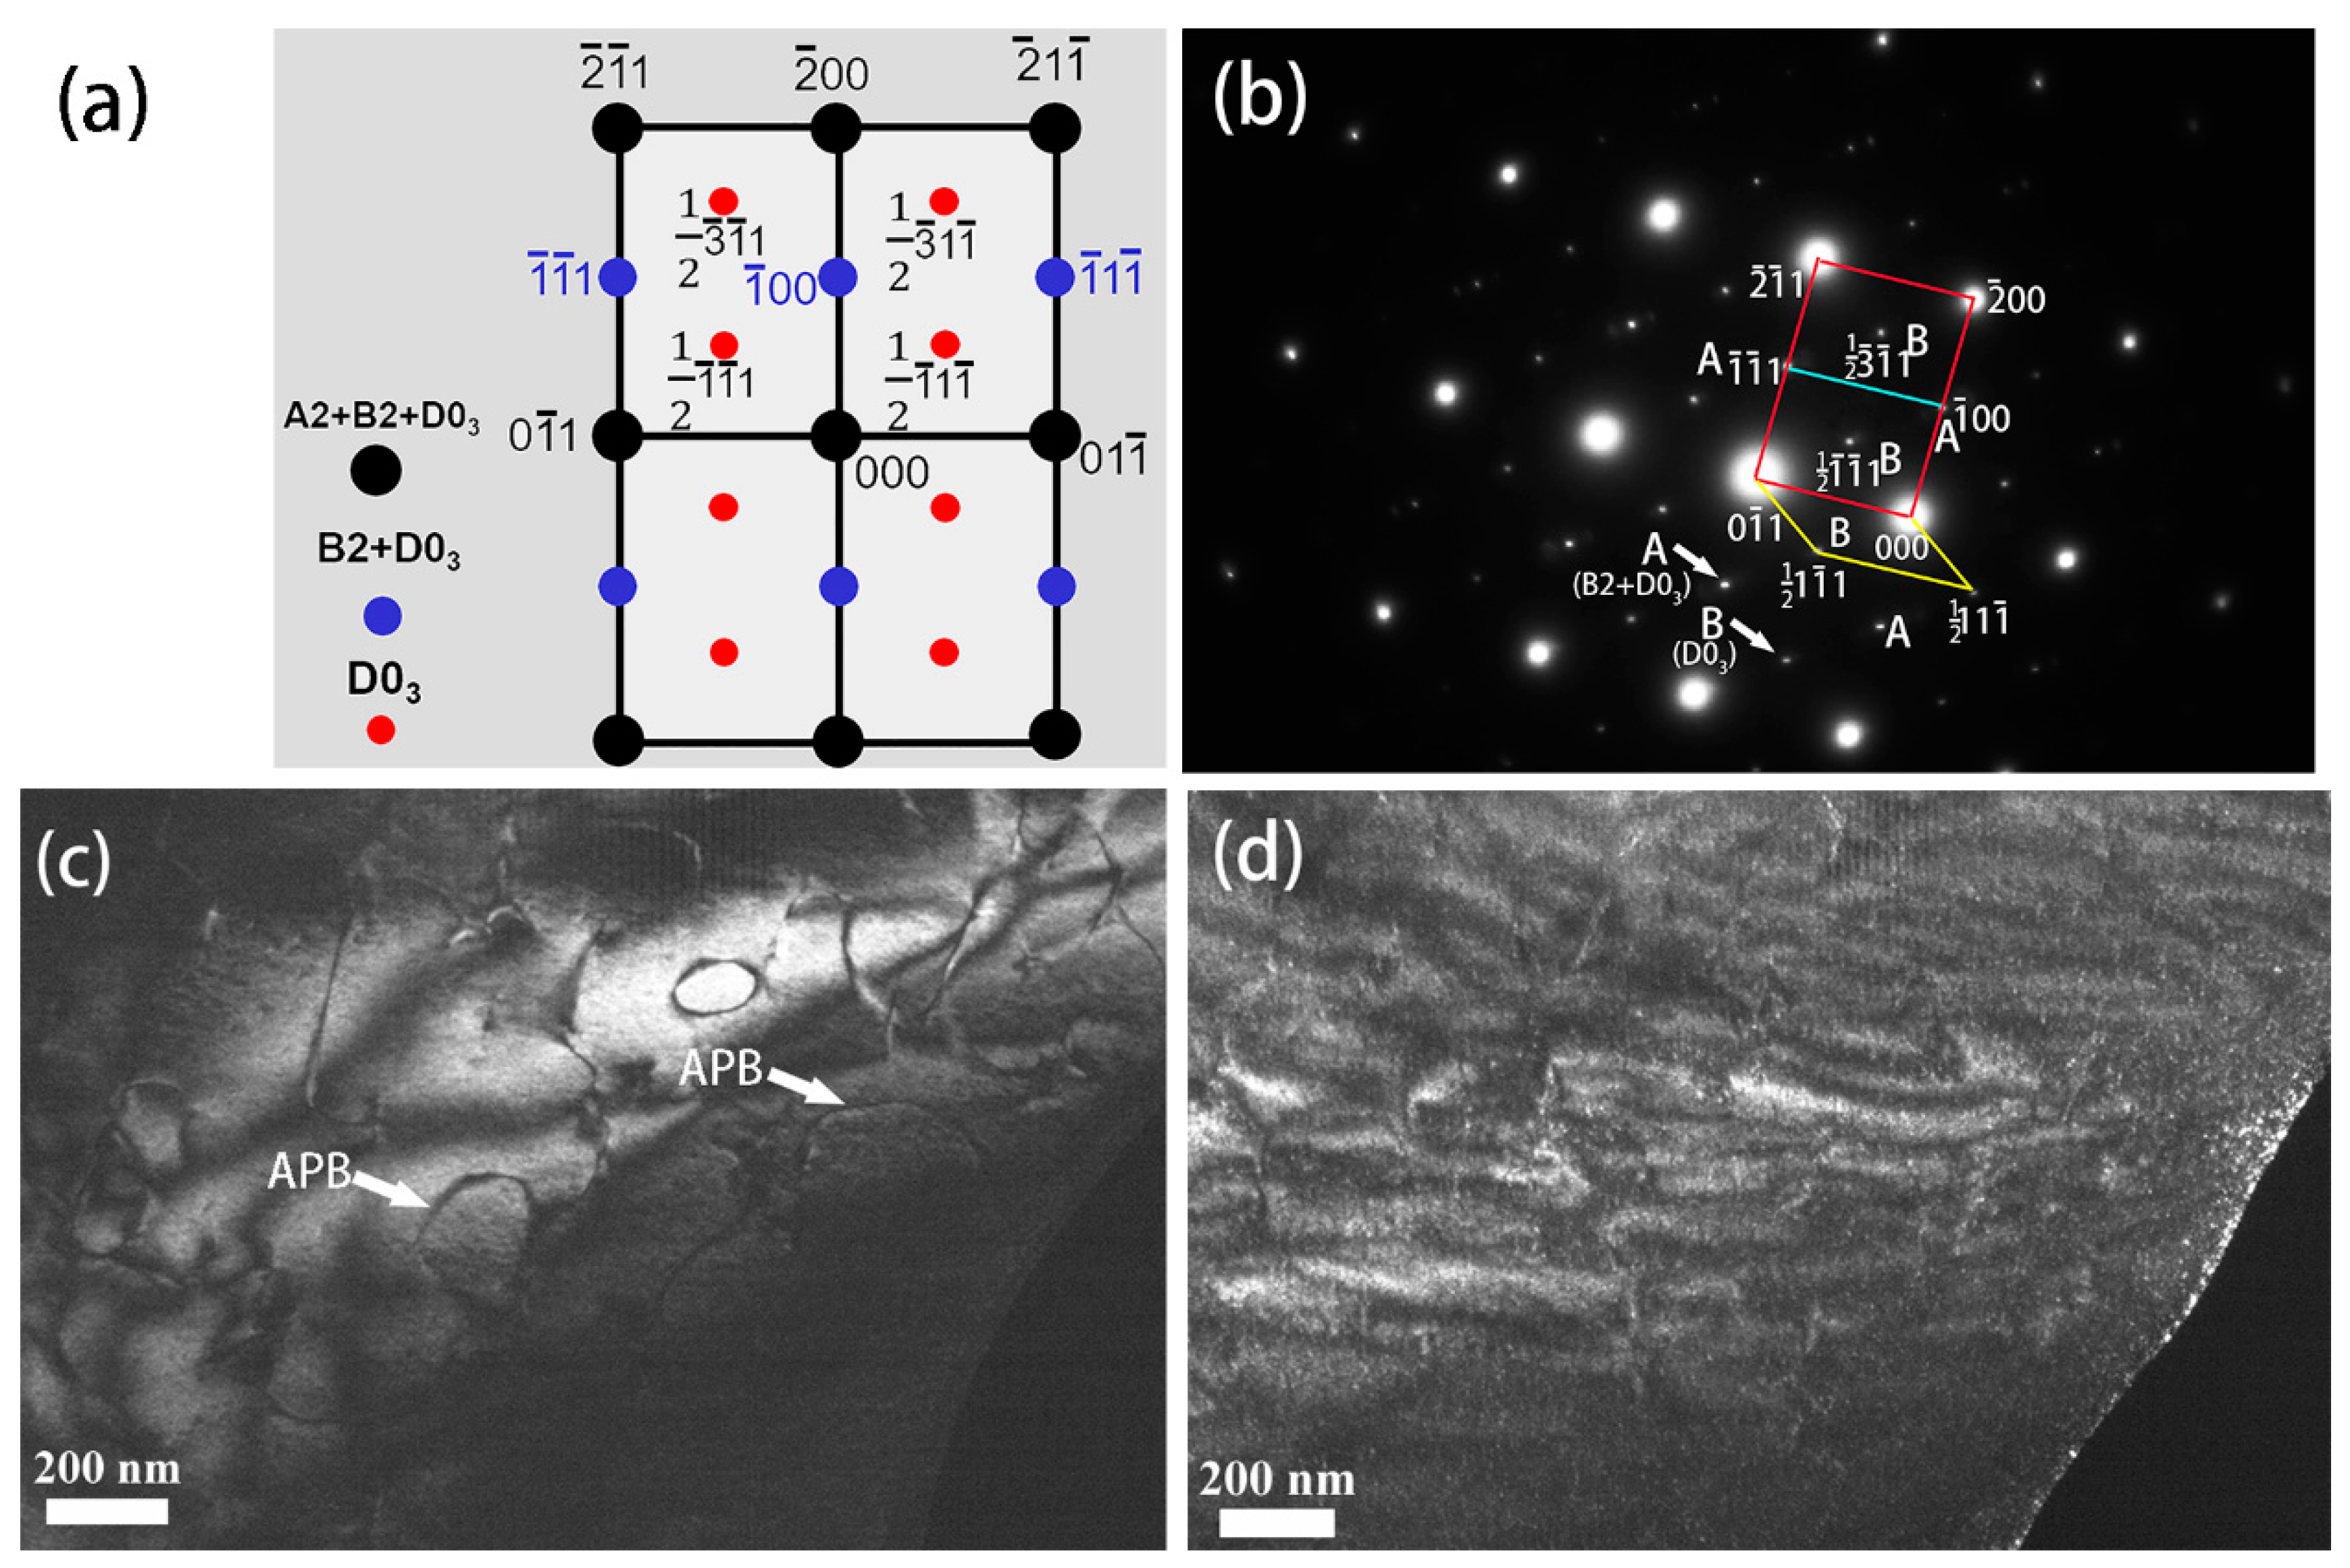
3.3. Orientation Variation during Warm Deformation

The crystallographic orientation of the loaded center samples at the critical strain and after tensile fracture (corresponding to curve 2 and curve 1 in Figure 3a) was observed by EBSD, as shown in Figure 6 and Figure 7. Some new orientations emerged during serrated flow deformation (Figure 7), and a slight turn in the grain orientation existed during deformation (Figure 6 and Figure 7). The elongated grains with a strong <101> fiber texture along the rolling direction were observed (Figure 6b and Figure 7b). The average misorientation angle between adjacent grains was approximately 8°, and the grain boundaries were straight.

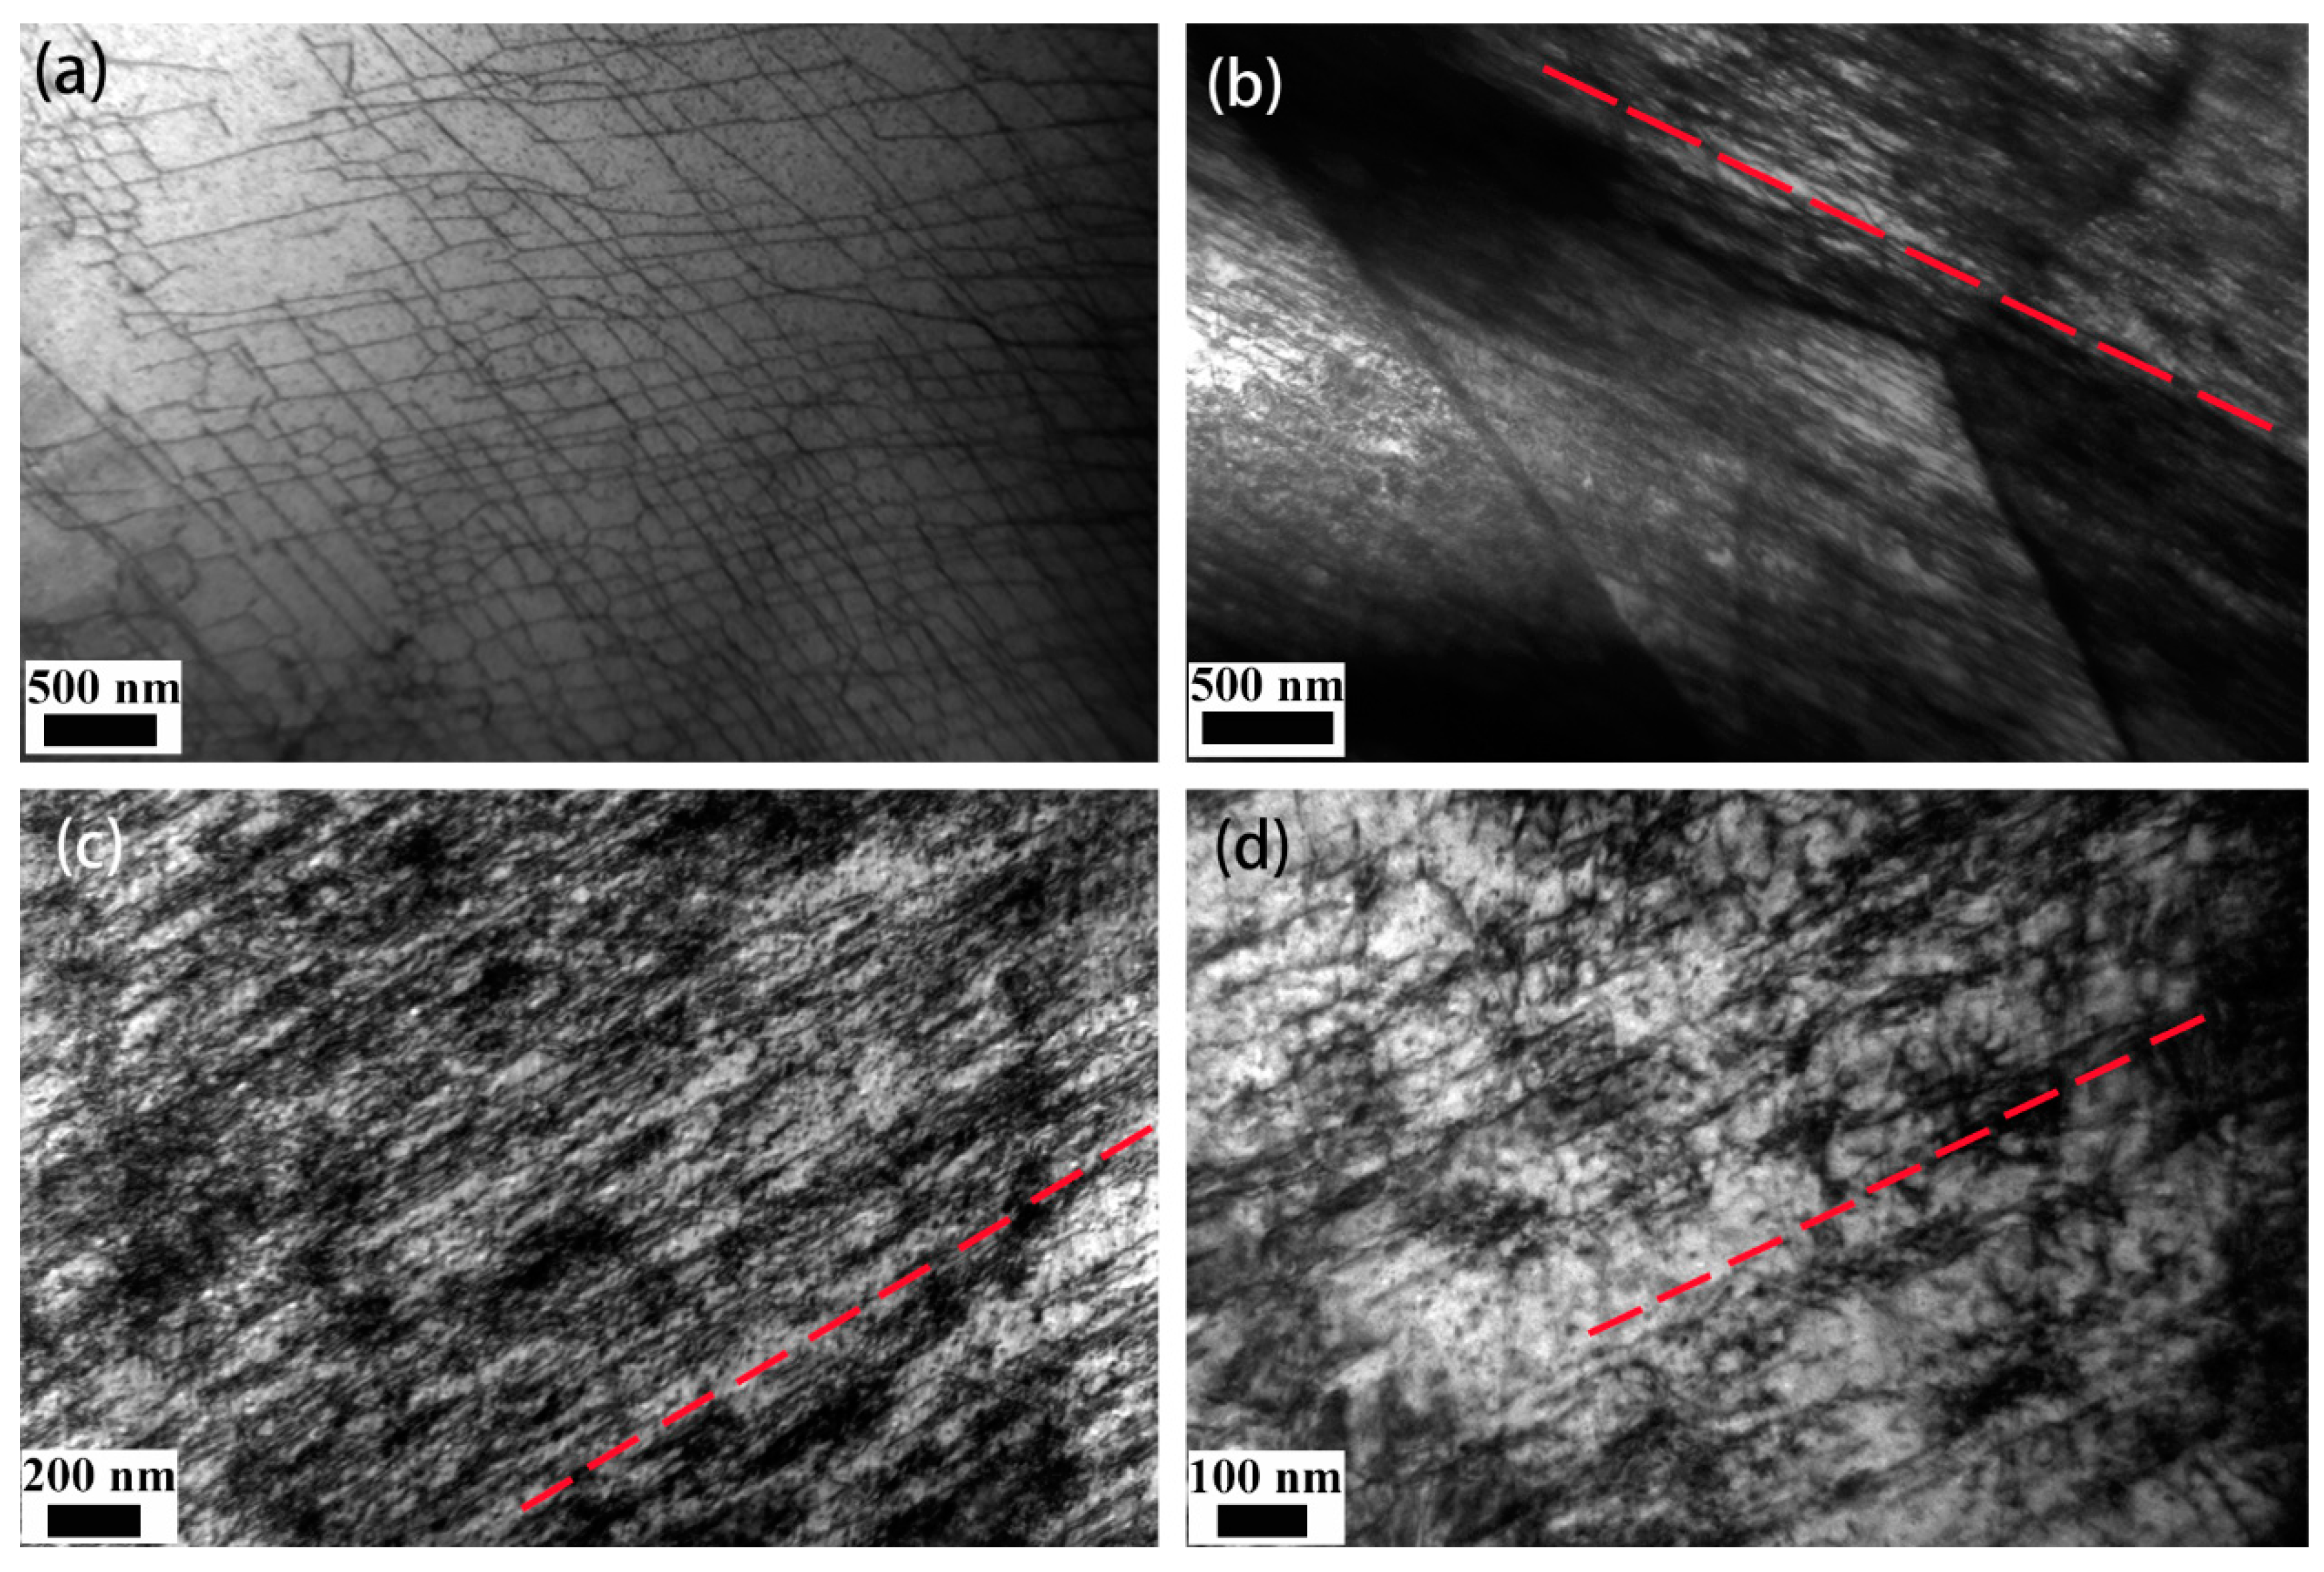
3.4. Variation of Dislocation Configurations during Warm Deformation

The center samples of the hot-rolled sheet before the tensile test were analyzed by TEM, as shown in Figure 8a. The dislocation density was relatively low, and the dislocation configuration basically exhibited the shape of the network before tensile tests.
Figure 8b shows the dislocation configuration of loaded center sample (corresponded to curve 2 in Figure 3a) before the critical strain at 350 °C. The density of dislocations increased compared with that observed in Figure 8a. Dislocations were mostly parallel to each other. Dislocations were not markedly piled up, and some dislocations passed through subgrain boundaries. Figure 8c,d show the dislocation configurations of the center samples after tensile tests at 350 °C. A large number of dislocations accumulated, forming approximately parallel forest dislocations.
During the tensile deformation, the dislocation density gradually increased and dislocations gradually piled up, forming areas of forest dislocations parallel to each other.

4. Discussion

4.1. Cause of the Serrated Flow

During the tensile tests at 350 °C, serrated flow did not appear in the surface sample (Figure 4), whereas serrated flow was observed in the center sample (Figure 3a). Therefore, the serrated flow of the hot-rolled sheet in Figure 2 is attributed to the serration in the center part.
The serrated flow was considered to be related to the flow units in crystal materials, which are dislocations, plastic-deformation twins, adiabatic shear-softening bands, and even phase-transformation regions [20,21]. Adiabatic shear failure is one of the most important failure modes in metallic materials under impact loading. In terms of force and loading, tensile deformation is different from impact loading. Therefore, the possibility for adiabatic shear can be ruled out. According to the Fe-Si phase diagram [22], below 500 °C, there is no rapid phase transformation in Fe-6.5wt.%Si alloy. At a low temperature, the critical stress of twins is usually reached first, whereas at an intermediate temperature, dislocations are the flow units [20]. Therefore, the serrated flow behavior can be mainly related to deformation twinning or the interaction of solutes with dislocations.
According to the study of deformation twins of Fe-6.5wt.%Si alloy by Fu et al. [18,19], deformation twins tended to occur in grains with a tensile orientation near the <001> corner [18,19]. However, in this work, the orientation of the center samples was near a <101> orientation ( 1,6 , and 7), which is far from a <100> orientation; thus, deformation twins do not easily occur.
In addition, B2 and D03 ordered phases were observed in the center samples before deformation, as shown in Figure 9. The schematic diagram of the selected area electron diffraction (SAED) patterns can indicate the superlattice diffraction spots of the B2 and D03 ordered phases (Figure 9a). The B2 ordered domains are visible in the dark field (DF) image by using the 1/2{200} or {111} superlattice reflection (Arrow A), and D03 ordered domains are visible by using the 1/2{111} or 1/2{311} superlattice reflection (Arrow B) [22]. The diffraction patterns in Figure 9b indicate that there exist B2 and D03 ordered phases. It can be seen from Figure 9c that the size range of B2 ordered domain is 200–400 nm. A smoothly curved anti-phase boundary (APB) can be clearly observed. Figure 9d is the DF image taken from the 1/2{111} diffraction spot. It is found that the D03 ordered domain is granular.
The degree of order plays an important role in activating deformation twinning in ordered body centered cubic (BCC) alloys. High degree of order in ordered BCC alloys inhibited the formation of deformation twins even under the external conditions favorable to their appearance [23].
A second-order ordering transition (A2–B2) is more reasonably described as an ordered domain growth [24]. It is direct and reliable to characterize the order of degree by ordered domain size. Coarse ordered domain signifies a high degree of ordering. The ordered domain size (200–400 nm) in Figure 9 is much larger than that (20–200 nm) in the study of deformation twinning by Xie’s group [18,19,25]. A coarse B2 ordered structure and granular D03 ordered structure were observed in the center samples (Figure 9), and the degree of order is high. Therefore, the probability of the serrated flow caused by twinning is low.
Furthermore, the results of the EBSD and TEM show that the deformation twins were not found in the center samples after tensile test at 350 °C, and thus the interaction of solutes and dislocations is probably the reason.

4.2. Mechanism and Evolution of the Serrated Flow

The serrated plastic flow associated with dislocations is expected to take place, when the velocity of solute diffusion is identical to the velocity of mobile dislocations [17,26]. Before the critical strain, dislocations are not piled up. The average speed of dislocation may be higher than the diffusion velocity of solutes atoms. With the increase in strain, on the one hand, the dislocation density increases and dislocations are piled up highly, so that the velocity of mobile dislocations decreases. On the other hand, the increase in dislocation density leads to a large number of vacancies and diffusion channels [27], which further promotes the pipe diffusion and segregation of solute atoms near parallel forest dislocations (Figure 8c,d). At the critical strain in the tensile curve at 350 °C (Figure 3a), the velocity of solute diffusion is identical to the velocity of mobile dislocations.
According to observation of the dislocation configurations during tensile deformation, forest dislocations parallel to each other are formed in the center samples with the low-angle grain boundary (Figure 7 and Figure 8). The dislocation configurations are similar to those (thick dislocation walls or nearly parallel vein structures indicating localized slip) in single crystals of Al0.3CoCrFeNi high-entropy alloy [28] and NiAl alloy [29] in the study of the serrated flow. The slip distance in the dislocation of coarse elongated grains in the center is longer than that of fine equiaxed grains in the surface. The dislocations in the elongated grains tend to be uniform and nearly parallel in slip plane. As a result, serrations take place as a mobile dislocation interacts with these parallel dislocations during deformation.
Combining with previous research [26] and experimental results (Figure 8), the evolution of the serrated flow is shown in Figure 10. Dynamic strain aging is a cooperative process where large groups of dislocations interact. However, in order to facilitate understanding and interpretation, this model of a single dislocation is proposed in this study. The actual dynamic strain aging should be the result of the superposition and mixing of large groups of dislocations based on this model.
First, before the mobile dislocations are blocked, solute atoms have been segregated around parallel forest dislocations (Figure 10a). Second, when the mobile dislocations are blocked by forest dislocations, solute atoms around the forest dislocations move along the core of the dislocation toward the mobile dislocation to create additional pinning, and then the solute motion in the distortion field causes some strengthening in the intersection points between mobile and forest dislocations (Figure 10a,b). As the deformation continues, the stress increases (intersection strengthening). Finally, the mobile dislocations are free from pinning due to the increasing stress, and there is an instantaneous increase in the mobile dislocation density (Figure 10c). The stress begins to relax [27]. As the mobile dislocations continue to move forward, they are hindered by the next forest dislocation (Figure 10c).

5. Conclusions

The microstructures and tensile deformation behavior of hot-rolled Fe-6.5wt.%Si alloy were investigated.
(1)
The hot-rolled Fe-6.5%Si sheet exhibits a layered structure along the thickness direction. The surface part is composed of equiaxed grains, whereas the center part shows elongated grains with a <101> fiber texture parallel to the rolling direction.
(2)
Serrated flow behavior occurs in both the hot-rolled sheet and its center region sample at 350 °C, whereas serrated flow does not appear in the surface sample. Therefore, the serrated flow of the hot-rolled sheet is attributed to the serration in the center sample.
(3)
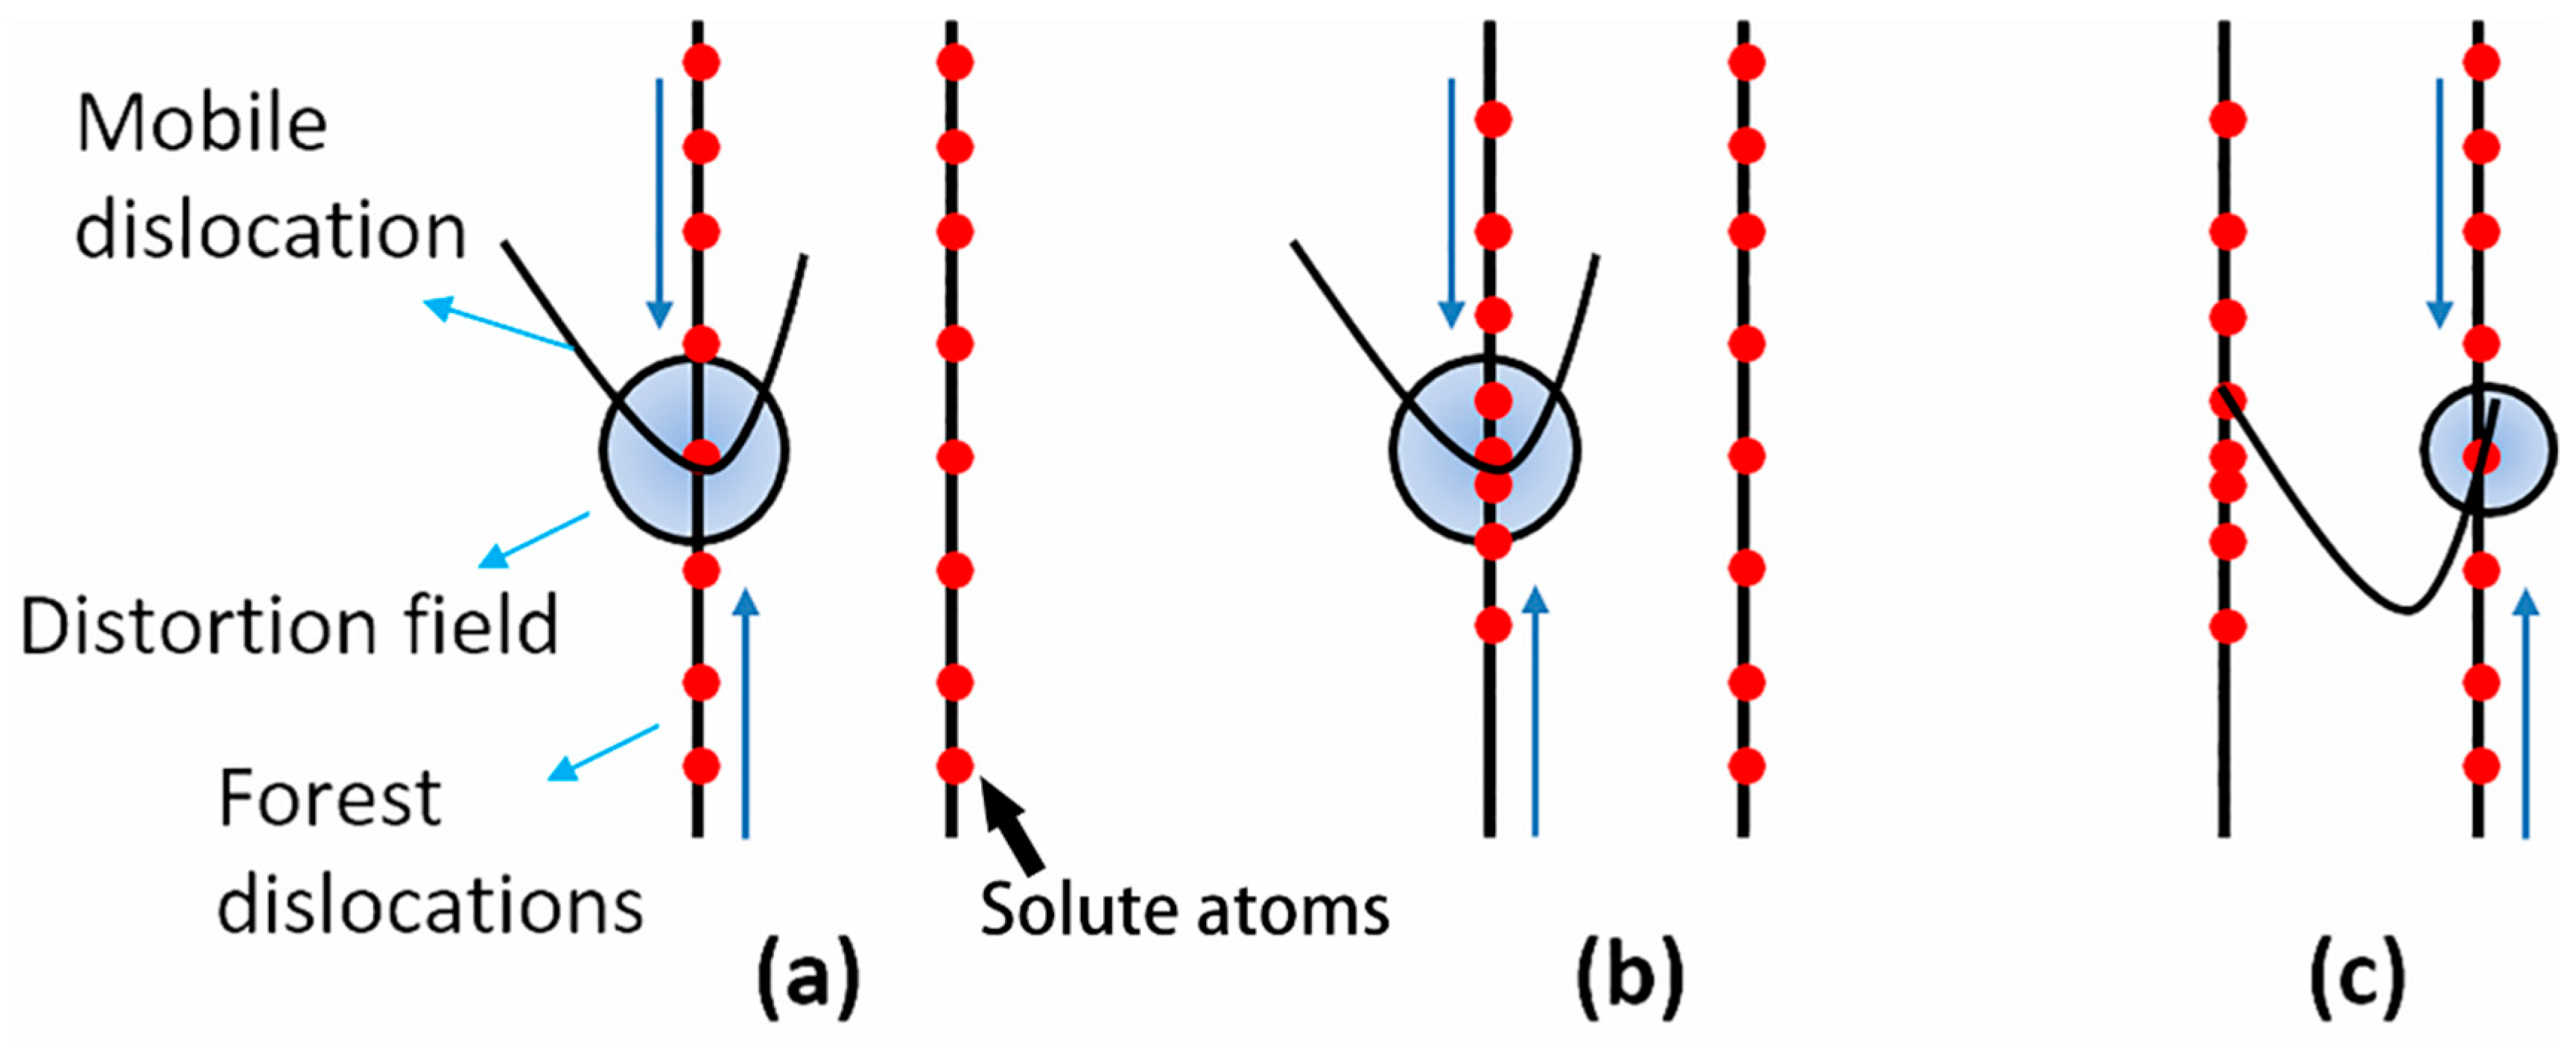
Based on analyses of the degree of order, grain orientation, and dislocation configurations, it can be deduced that the serrated flow behavior may be caused by the interaction of solutes and mobile dislocations. This model of dynamic strain aging is proposed, and the serrated flow behavior is the result of the superposition and mixing of large groups of dislocations based on this model.

Author Contributions

X.S. conceived, designed and performed the experiments; B.Z. contributed to the EBSD work; B.L. contributed to ideas and intensive discussions. X.S. wrote the manuscript; F.Y., Y.L. and Z.D. supervised the work.

Funding

This research was funded by National Natural Science Foundation of China (51471031, U1660115), Program of Introducing Talents of Discipline to Universities (B07003), and the State Key Laboratory for Advanced Metals and Materials (2016Z-17).

Acknowledgments

Financial supports from the National Natural Science Foundation of China (51471031, U1660115), the State Key Laboratory for Advanced Metals and Materials (2016Z-17), and the Program of Introducing Talents of Discipline to Universities (No. B07003) are gratefully acknowledged.

Conflicts of Interest

The authors declare no conflict of interest.

References

  1. Ouyang, G.; Chen, X.; Liang, Y.; Macziewski, C.; Cui, J. Review of Fe-6.5 wt% Si high silicon steel—A promising soft magnetic material for sub-kHz application. J. Magn. Magn. Mater. 2019, 481, 234–250. [Google Scholar] [CrossRef]
  2. Phway, T.P.P.; Moses, A.J. Magnetostriction trend of non-oriented 6.5% Si-Fe. J. Magn. Magn. Mater. 2008, 320, e611–e613. [Google Scholar] [CrossRef]
  3. Raviprasad, K.; Tenwick, M.; Davies, H.A.; Chattopadhyay, K. The nature of ordered structures in melt spun iron-silicon alloys. Scr. Metall. 1986, 20, 1265–1270. [Google Scholar] [CrossRef]
  4. Matsumura, S.; Oyama, H.; Oki, K. Dynamical behavior of ordering with phase separation in off-stoichiometric Fe3Si alloys. Mater. Trans. JIM 1989, 30, 695–706. [Google Scholar] [CrossRef]
  5. Matsumura, S.; Tanaka, Y.; Koga, Y.; Oki, K. Concurrent ordering and phase separation in the vicinity of the metastable critical point of order–disorder transition in Fe-Si alloys. Mater. Sci. Eng. A 2001, 312, 284–292. [Google Scholar] [CrossRef]
  6. Liang, Y.F.; Ye, F.; Lin, J.P.; Wang, Y.L.; Chen, G.L. Effect of annealing temperature on magnetic properties of cold rolled high silicon steel thin sheet. J. Alloys Compd. 2010, 491, 268–270. [Google Scholar] [CrossRef]
  7. Li, H.; Liang, Y.F.; Yang, W.; Ye, F.; Lin, J.P.; Xie, J.X. Disordering induced work softening of Fe-6.5wt%Si alloy during warm deformation. Mater. Sci. Eng. A 2015, 628, 262–268. [Google Scholar] [CrossRef]
  8. Fu, S.; Cheng, T.; Zhang, Q.; Hu, Q.; Cao, P. Two mechanisms for the normal and inverse behaviors of the critical strain for the Portevin—Le Chatelier effect. Acta Mater. 2012, 60, 6650–6656. [Google Scholar] [CrossRef]
  9. Cai, Y.L.; Yang, S.L.; Wang, Y.H.; Fu, S.H.; Zhang, Q.C. Characterization of the deformation behaviors associated with the serrated flow of a 5456 Al-based alloy using two orthogonal digital image correlation systems. Mater. Sci. Eng. A 2016, 664, 155–164. [Google Scholar] [CrossRef]
  10. Min, J.; Hector Jr, L.G.; Zhang, L.; Sun, L.; Carsley, J.E.; Lin, J. Plastic instability at elevated temperatures in a TRIP-assisted steel. Mater. Des. 2016, 95, 370–386. [Google Scholar] [CrossRef]
  11. Sun, B.A.; Liu, C.T.; Yang, Y. Rate dependence of serrated flow and its effect on shear stability of bulk metallic glasses. J. Iron. Steel Res. Int. 2016, 23, 24–30. [Google Scholar] [CrossRef]
  12. Wang, W.H.; Wu, D.; Shah, S.S.A.; Chen, R.S.; Lou, C.S. The mechanism of critical strain and serration type of the serrated flow in Mg-Nd-Zn alloy. Mater. Sci. Eng. A 2016, 649, 214–221. [Google Scholar] [CrossRef]
  13. Xu, Z.; Shen, Y. Serrated flow and work-hardening behavior of China low activation martensitic steel (CLAM). Metals 2018, 8, 413. [Google Scholar] [CrossRef]
  14. Wen, S.; Xue, S.; Han, C.; Liu, B.; Liang, Y.; Ye, F. Fabrication technology and material characterization of hot rolled cylindrical Fe-6.5 wt.% Si bars. Metals 2018, 8, 371. [Google Scholar] [CrossRef]
  15. Honjo, H.; Kaneno, Y.; Inoue, H.; Takasugi, T. Plastic flow instabilities of L12Ni3Al alloys at intermediate temperatures. J. Mater. Sci. 2004, 39, 3677–3681. [Google Scholar] [CrossRef]
  16. Honjo, H.; Kaneno, Y.; Inoue, H.; Takasugi, T. Plastic flow instabilities of L12Ni3 (Si, Ti) alloys at intermediate temperature. J. Mater. Res. 2002, 17, 705–711. [Google Scholar] [CrossRef]
  17. Takasugi, T.; Honjo, H.; Kaneno, Y.; Inoue, H. Plastic flow instabilities of Ll2Co3Ti alloys at intermediate temperatures. Acta Mater. 2002, 50, 847–855. [Google Scholar] [CrossRef]
  18. Fu, H.; Zhang, Z.; Jiang, Y.; Xie, J. Applying the grain orientation dependence of deformation twinning to improve the deformation properties of an Fe-6.5wt%Si alloy. J. Alloys Compd. 2016, 689, 307–312. [Google Scholar] [CrossRef]
  19. Xie, J.; Fu, H.; Zhang, Z.; Jiang, Y. Deformation twinning feature and its effects on significant enhancement of tensile ductility in columnar-grained Fe-6.5wt.%Si alloy at intermediate temperatures. Intermetallics 2012, 23, 20–26. [Google Scholar] [CrossRef]
  20. Zhang, Y.; Qiao, J.W.; Liaw, P.K. A brief review of high entropy alloys and serration behavior and flow units. J. Iron. Steel Res. Int. 2016, 23, 2–6. [Google Scholar] [CrossRef]
  21. Zhang, Y.; Liu, J.P.; Chen, S.Y.; Xie, X.; Liaw, P.K.; Dahmen, K.A.; Wang, Y.L. Serration and noise behaviors in materials. Prog. Mater. Sci. 2017, 90, 358–460. [Google Scholar] [CrossRef]
  22. Li, H.; Liang, Y.F.; Ye, F. Effect of heat treatment on ordered structures and mechanical properties of Fe-6.5mass%Si Alloy. Mater. Trans. 2015, 56, 759–765. [Google Scholar] [CrossRef]
  23. Cahn, R.W. Twinning in iron-aluminium alloys. Acta Metall. 1961, 9, 138–148. [Google Scholar] [CrossRef]
  24. Cui, S.; Ouyang, G.; Ma, T.; Macziewski, C.R.; Levitas, V.I.; Zhou, L.; Kramer, M.J.; Cui, J. Thermodynamic and kinetic analysis of the melt spinning process of Fe-6.5wt.%Si alloy. J. Alloys Compd. 2019, 771, 643–648. [Google Scholar] [CrossRef]
  25. Zhang, Z.; Wang, W.; Fu, H.; Xie, J. Effect of quench cooling rate on residual stress, microstructure and mechanical property of an Fe-6.5Si alloy. Mater. Sci. Eng. A 2011, 530, 519–524. [Google Scholar] [CrossRef]
  26. Klose, F.B.; Ziegenbein, A.; Weidenmüller, J.; Neuhäuser, H.; Hähner, P. Portevin–LeChatelier effect in strain and stress controlled tensile tests. Comput. Mater. Sci. 2003, 26, 80–86. [Google Scholar] [CrossRef]
  27. Rodriguez, P. Serrated plastic flow. Bull. Mater. Sci. 1984, 6, 653–663. [Google Scholar] [CrossRef]
  28. Yasuda, H.Y.; Shigeno, K.; Nagase, T. Dynamic strain aging of Al0.3CoCrFeNi high entropy alloy single crystals. Scr. Mater. 2015, 108, 80–83. [Google Scholar] [CrossRef]
  29. Weaver, M.L.; Kaufman, M.J.; Noebe, R.D. Manifestations of dynamic strain aging in soft-oriented NiAl single crystals. Metall. Mater. Trans. A 1996, 27, 3542–3557. [Google Scholar] [CrossRef] [Green Version]
Figure 1. Orientation imaging of the hot-rolled sheet. A color-coded map referred to the rolling direction is shown on the lower right side. (RD: rolling direction; ND: normal direction of the rolled plane).
Metals 09 01023 g001
Figure 2. Tensile curve of the whole sample and partial enlarged detail at (a) 350 °C and (b) 450 °C.
Metals 09 01023 g002
Figure 3. Tensile curves of the center sample at (a) 350 °C (curve 1: tensile curve; curve 2: loaded curve before the critical strain of the serrated flow; curve 3: reloaded curve) and (b) 450 °C.
Metals 09 01023 g003
Figure 4. The tensile curve of the surface at 350 °C.
Metals 09 01023 g004
Figure 5. Tensile fracture morphologies of the Fe-6.5wt.%Si alloy at 350 °C and 450 °C. (a) Whole sample at 350 °C; (b) center sample at 350 °C; (c) center sample at 450 °C; (d) surface sample at 350 °C.
Metals 09 01023 g005
Figure 6. Microstructures of the center samples at the critical strain of the serrated flow behavior. (a) EBSD orientation map at 350 °C; (b) inverse pole figure.
Metals 09 01023 g006
Figure 7. Microstructures of samples after tensile deformation. (a) EBSD orientation map at 350 °C; (b) inverse pole figure.
Metals 09 01023 g007
Figure 8. Dislocation configurations in the center samples. (a) Before the tensile tests; (b) the loaded center sample at the critical strain at 350 °C; (c) samples after tensile deformation at 350 °C in the location with high dislocation density; (d) samples after tensile deformation at 350 °C in the location with low dislocation density.
Metals 09 01023 g008
Figure 9. TEM micrographs before deformation along the [011] zone axis. (a) Schematic diagram of the SAED patterns; (b) SAED patterns. Arrow A designates g = 1/2{200} or {111} reflection, and arrow B designates g = 1/2{111} or 1/2{311} reflection; (c) DF image by using 1/2{200} diffraction spot; (d) DF image by using 1/2{111} diffraction spot.
Metals 09 01023 g009
Figure 10. The evolution of the serrated flow. (a) Mobile dislocations are hindered by forest dislocations; (b) solute atoms (red dots) move along the dislocation line toward the mobile dislocation; (c) mobile dislocations are free from pinning.
Metals 09 01023 g010
Table 1. Chemical composition of Fe-6.5wt.%Si alloy (wt.%).
SiCNMnPSFe
6.470.00520.00260.0190.0050.0019Bal
Table 2. The reduction of each pass during hot rolling.
PassThickness (mm)Reduction (mm)Reduction Ratio (%)
09000
1811010.0
2711312.3
3561621.1
4362035.7
5181850.0
611733.3
75.15.857.5
82.52.651.0

