Article

Examination of Formability Properties of 6063 Alloy Extruded Profiles for the Automotive Industry

by
Athanasios Vazdirvanidis
1,*,
Ioannis Pressas
1,
Sofia Papadopoulou
1,
Anagnostis Toulfatzis
1,
Andreas Rikos
1,
Marianna Katsivarda
1,
Grigoris Symeonidis
2 and
George Pantazopoulos
1,*
1
ELKEME Hellenic Research Centre for Metals S.A., 61st km Athens—Lamia National Road, 32011 Oinofyta, Greece
2
ETEM Extrusion Company, bul. “Iliyantsi” 119, 1220 Sofia, Bulgaria
*
Authors to whom correspondence should be addressed.
Metals 2019, 9(10), 1080; https://doi.org/10.3390/met9101080
Submission received: 19 August 2019 / Revised: 25 September 2019 / Accepted: 30 September 2019 / Published: 7 October 2019
(This article belongs to the Special Issue Failure Mechanisms in Alloys)

Abstract

:
Bendability is a crucial property of automotive parts, which describes the ability of extruded profiles to be formed to shape, without the appearance of discontinuities that will have an adverse effect on the mechanical properties and their energy absorption capacity (crashworthiness). Anisotropic behavior exhibited by Al alloy extrusions has been documented due to the nature of the hot working process. In the present article an attempt is made in order to determine the main factors influencing bending properties in longitudinal and transverse to extrusion direction, which are also related with anisotropic behavior. Mechanical testing, microscopic examination and finite element analysis were applied in the frame of the current investigation. The findings were indicative that grain morphology and orientation (texture), especially on the surface zone of the extruded profiles, as well as morphology and distribution of the constituent particles are strongly related with formability.

1. Introduction

Previous works in this field have highlighted the role of process parameters on microstructure and texture and it has been found that the fracture mode of tensile specimens and therefore the ductility is strongly related with the cooling rate that followed the soaking thermal treatment [1,2,3,4]. More specifically, slower cooling rates, i.e., air cooling, resulted in a higher amount of intergranular fracture and lower ductility, relatively to the amount of transgranular ductile fracture that was observed after water quenching.
In one of the studies, the effect of microstructure on formability is examined, where the anisotropic behavior of extruded samples is attributed to both grain morphology and distribution of primary particles [5]. The role of the constituent particles, as well as the dispersoid particles is also discussed by S. Das et al. [6] and A. Vazdirvanidis et al. [7]—while investigation of AlFeSi particles formation and their transformation during heat treatment is discussed in [8,9,10]. In reference [11], the role of directionality in mechanical properties is mentioned. Lower bending angles were reported with the bending axis parallel to extrusion direction, while a correlation between bendability and ductility was found. D.J. Lloyd noticed macroscopic cracking on the outer bent surface with the following sequence and by increasing bending strain: (i) slip band and shear bands formation within the grains, (ii) rotation and displacement of grain boundaries, (iii) increase of the number of grain boundaries exhibiting displacement, (iv) final rupture assisted by cracking of intermetallics, and development of discontinuities by shear bands and also on grain boundaries due to precipitates [12].
The role of texture is also crucial in the examination of automotive alloys properties [13]. It has been reported that a high amount of deformation texture compared to random texture on the surface zone of the profiles leads to an increase of shear bands formation during bending within each grain [14]. In the same work, the role of the size and distribution of constituent particles, especially on the free surface of bent specimens, is highlighted. Texture examination including Taylor factor maps are correlated with bendability in work presented by H. Inoue [15]. Extrusion temperature also plays a significant role in mechanical strength development of 6xxx Al-alloys. According to Reference [16], extrusions processing at a temperature below recrystallization (120 °C), offers a great advantage towards strength and ductility, stimulating dynamic precipitation and/or accelerated precipitation processes. Based on Reference [17], pre-aging treatment of extruded 6082 Al alloy at 175 °C for 30 min, after solution heat treatment, has a beneficial role, eliminating the negative delay effect. It results in a stable alloy microstructure when kept at room temperature for 24 h, improving the final mechanical properties.
In this paper, the factors that influence formability of 6xxx series alloy extruded profiles for the automotive industry are examined by means of (i) microstructure characterization by optical, electron microscopy and electron backscatter diffraction (EBSD), (ii) mechanical testing involving tensile and bending tests and (iii) finite element analysis of stresses and strains in extrusions during mechanical testing.
The effects of grain structure and texture, especially near the surface and size and distribution of AlFeSi intermetallic particles on bendability are examined. The aim of the project is to determine the microstructure properties that are related with the mechanical properties of the material and through the proper configurations to optimize the manufacturing process in order to achieve high formability. The outcome of this study has significant value in understanding the contribution of texture and second phase particle orientation to the formability and failure susceptibility of Al 6xxx profile for automotive applications. This is an original industrial R&D work, while there is only limited published research addressing these issues from a consolidated point of view.

2. Materials and Methods

2.1. Materials Production

6xxx series extruded profiles were manufactured by industrial trials. The alloy studied in this work is 6063 (0.20–0.60% Si, 0.35% max Fe, 0.10% max Cu, 0.10% max Mn, 0.45–0.90% Mg, 0.10% max Cr, Zn, Ti, remainder Al, all are expressed in wt.%). The samples have been provided by ETEM Bulgaria S.A. Extrusions with complicated cross-sections differing in the wall thickness (2.9 mm vs. 3.2 mm) were produced. The profiles had been artificially aged under the same, industrial, aging process to peak age, reaching a T6 metallurgical condition.

2.2. Mechanical Testing

Tensile and three-point bending tests were performed using an Instron 5567 30 kN ((Instron, Norwood, MA, USA) electromechanical testing machine at ambient temperature. Tensile tests were conducted at a constant speed of 10 mm/min according to ISO 6892-1 standard. Tensile specimens were extracted from the original aluminum profile for testing parallel to the extrusion direction. Three-point bending tests (transverse and longitudinal) were performed using 20 mm/min speed, according to the instructions of VDA 238–100 and ISO 7438 standards. Tests stop criteria was set at 10% load drop. Roller span distance was set at two times the specimen thickness plus 0.2 mm. Specimens were extracted from the middle of the external profile face. Due to the profile geometry sample sizes of 50 × 25 mm2 were used. Measurement of bending angles was manually performed after the end of test. Higher bendability is associated with high bending angle values.

2.3. Microstructure Characterization

Macroscopic examination of the fracture surfaces from tensile tests and 3-point bend tests was performed by a Nikon SMZ 1500 (Nikon, Tokyo, Japan) stereo-microscope. Optical microscopy examination was conducted using a Nikon Epiphot 300 inverted metallographic microscope equipped with an image analysis software (Image Pro Plus, Rockville, MD, USA). The samples were first examined in as-polished condition for revealing AlFeSi intermetallics density and morphology. This information was provided as input to FEM software for modeling the 3D response of the material to tensile stresses. Polarized light illumination was applied after Barker’s electrolytic etch for revealing grain structure and bright field illumination after HF immersion etching.
High magnification microscopic and fractographic observation was performed using a FEI XL40 SFEG SEM (FEI, Eindhoven, The Netherlands). EBSD analysis was performed with an EDAX Hikari XP camera (EDAX, Mahwah, NJ, USA) on longitudinal cross-sections (extrusion direction coincides with TD and normal direction with ND coordinates).

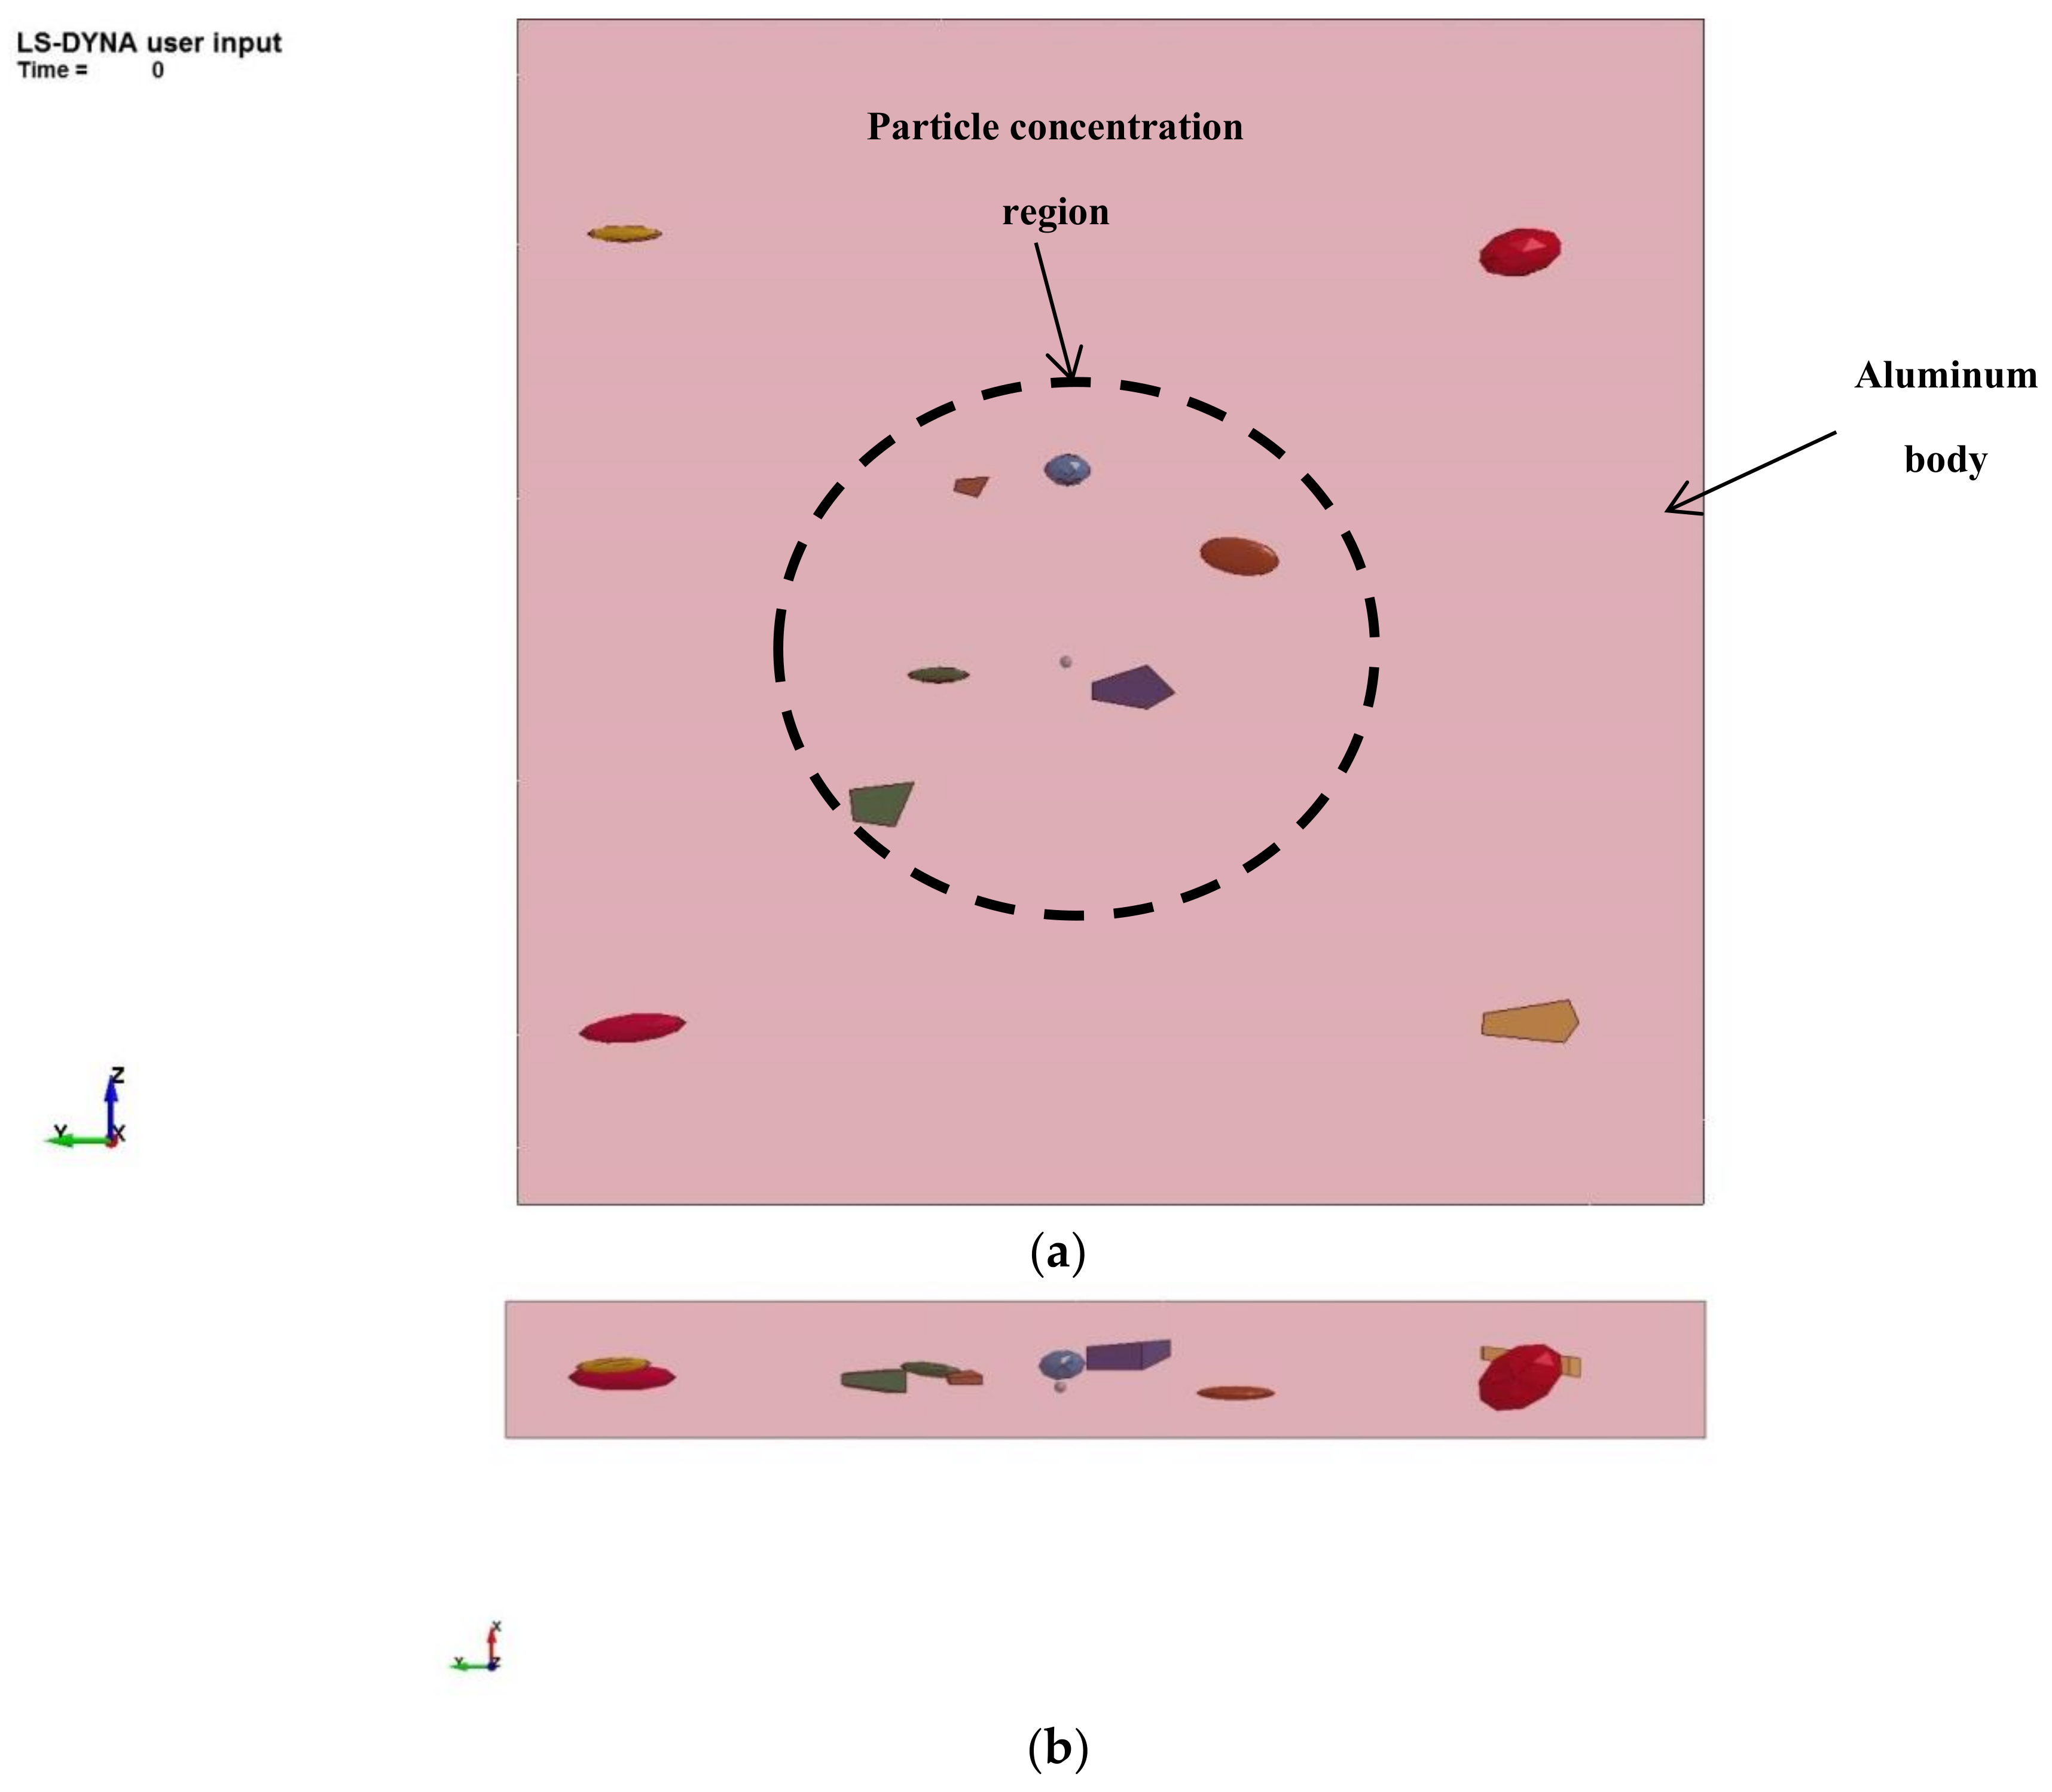
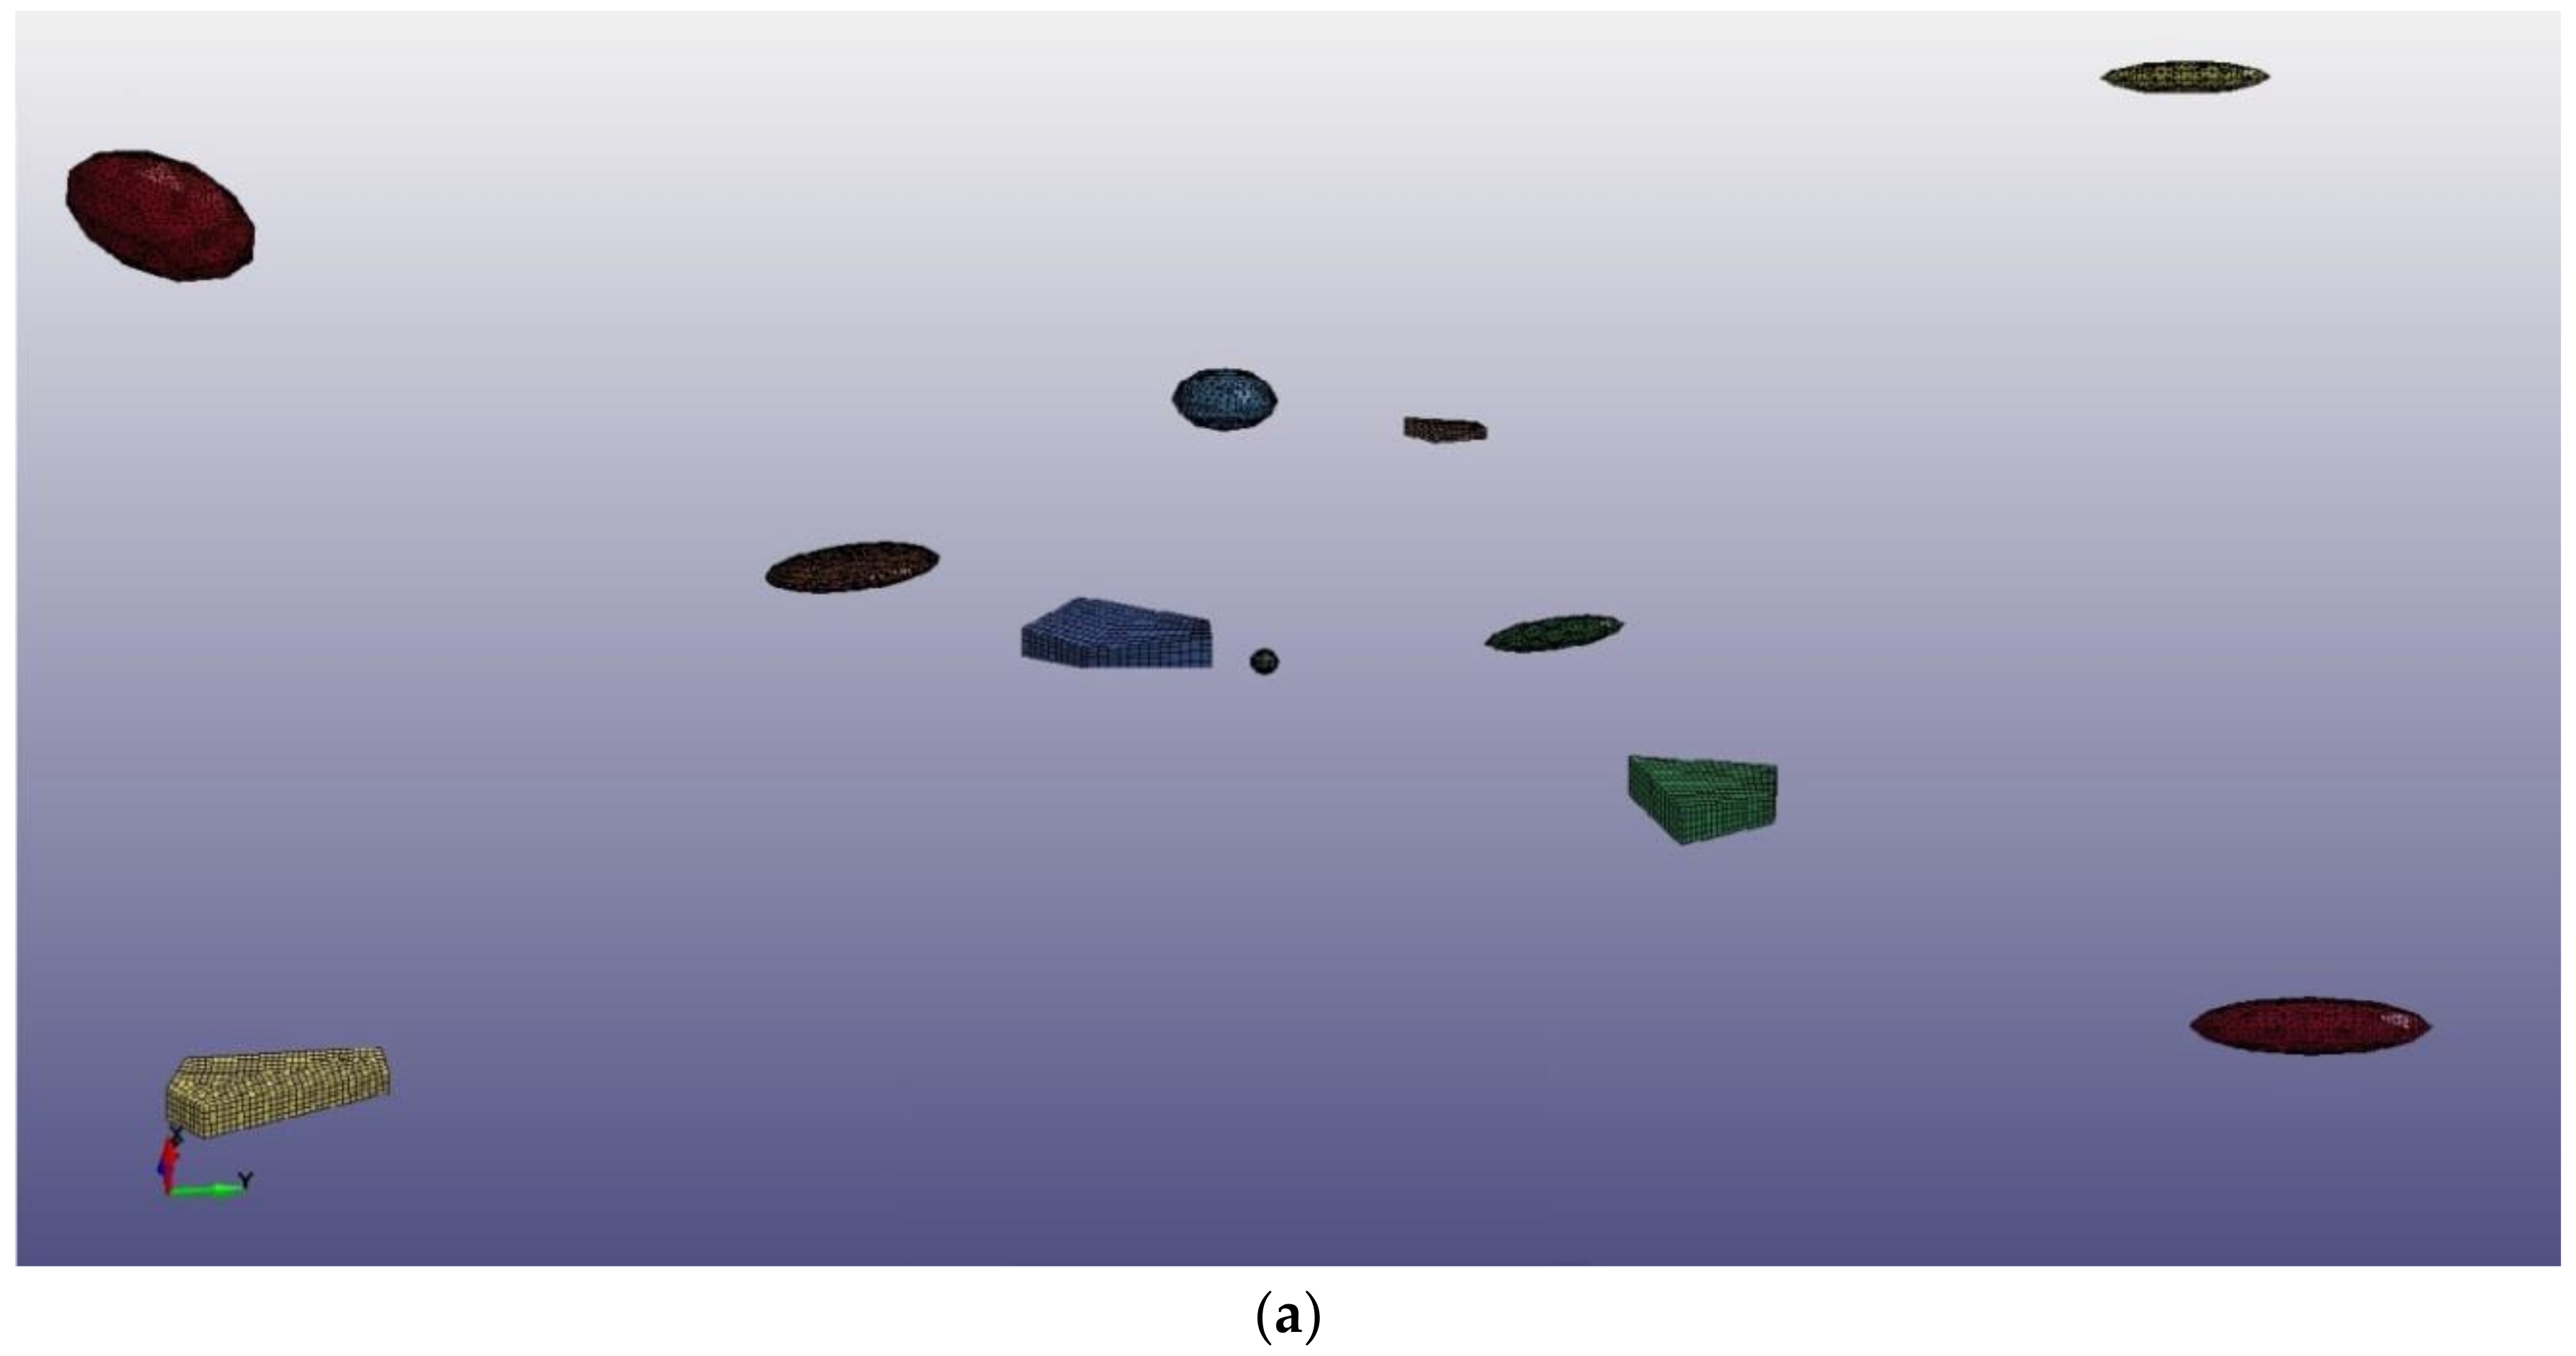
2.4. Finite Element Analysis

The morphology, size and distribution of the AlFeSi intermetallic particles together with their influence on the response of the different areas of the material to tensile stresses were simulated via finite element analysis (FEA). The present approach is to simulate the Al-matrix behaviour based primarily on the second phase particle morphology and the stress- fields, derived by the presence of harder particles distributed in the microstructure. Hence, it is considered that the density of the intermetallic phase is not a predominant factor of the presented results, as it is also supported by the non-coherency (absence of strong metallurgical bonding) of the second phase particles with the matrix. Further information concerning the influence of impurities on properties and processing of Al alloys are presented in Refs. [18,19]. The aim of this task was the detection of (i) areas where high stress concentration can occur, (ii) potential differences of stress and strain distribution between areas with dense or sparse intermetallic particles distribution and (iii) differences in the response of the material in the longitudinal and transverse to extrusion direction. For the simulation, the commercial FEA software LS-DYNA™ was used. The model consisted of a rectangular aluminum body with dimensions of 38.1 μm × 38.1 μm × 4.57 μm, while eleven particles were scattered inside the aluminum body. The distribution of the particles is presented in Figure 1.
The size of the particle ranges from approximately 0.4 to 3.2 μm in length and 0.4 to 1.5 μm in width. In order to be more realistic with the simulation, the size, shape and distribution of the particles were based on actual metallographic observations of the experimental samples, as presented in Figure 2. The particle shapes involved wedge type, needle type and circular type particles. The needle and circular type particles were modeled via icosahedra, in order to simplify the meshing process.
The numerical model was meshed using approximately 1.1 million tetrahedral elements. The generated mesh in both the aluminum body and the particles is presented in Figure 3. It is worth noting that the mesh in the particle cavities of the aluminum bodies matched that of the corresponding particles, in order to avoid any numerical flaws caused by mesh incompatibility.
The mechanical properties used for the current numerical analysis are presented in Table 1. Both for the aluminum body and the particles a bilinear elasto-plastic material model (MAT 24—PIECEWISE_LINEAR_PLASTICITY [20]) was used.
It is worth noting that due to the lack of material property references for the AlFeSi phase particles in literature and because this analysis is mainly aimed at the mechanical behavior of the Al body, the mechanical properties of Al3Fe mentioned by Belov et al. [18] and Gaillac et al. [21] were used for the particles. For the yield strength of the Al3Fe particles, the empirical rule deeming it equal to approximately HV/3 was used, as presented by Belov et al. [18] and Glazoff et al. [19]. The aluminum mechanical properties were exported from the tensile tests performed on the samples (see Section 3.1).
Via the finite element model, two different loading scenarios were investigated. In the first scenario, a uniform tensile load of 150 MPa was applied along two opposite sides of the aluminum body, aligned with the extrusion axis. In the second scenario, the same uniform tensile load of 150 MPa was applied in two opposite sides of the aluminum body, but transverse to the axis of extrusion. The two different loading scenarios are presented in Figure 4.

3. Results

3.1. Tensile Testing and Fracture Modes

Ten (10) tensile specimens were retrieved from each profile section (10 from the profile with 2.9 mm wall thickness and 10 from the profile with 3.2 mm wall thickness). The results of the tensile tests are summarized in Table 2. One representative stress-strain curve from each profile is given in Figure 5a (see also Figure 5b for extrusion section). It is shown that the 2.9 mm thick samples attained higher yield and tensile stress values (239 and 271 MPa), but lower elongation at fracture (10.3% vs. 12%) signifying lower ductility as this can be determined by elongation at fracture. The respective values for the 3.2 mm thick sample were 229 MPa yield strength, 261 MPa tensile strength and 12.0% elongation at fracture. The two materials were in the same metallurgical condition and had similar tensile to yield strength ratio values (1.13), which leads to the conclusion that the differences in the mechanical properties should be related with grain morphology. Stereoscopic micrographs of the fracture surfaces are given in Figure 5c,d. It is readily observed that the 3.2 mm thick sample exhibited higher amount of area reduction at fracture.
The fracture surfaces were also examined with an electron microscope. In Figure 6, it can be observed that the less ductile sample exhibited a high amount of intergranular fracture, especially on the subsurface regions and a low amount of dimple fracture (mixed fracture mode). The prevailing mechanism is microvoid coalescence on the grain boundaries caused by Mg2Si precipitation and nanoscale precipitates free zones formation [1,7]. Ductile dimpled fracture follows a significant extent of permanent plastic deformation, which is shown even macroscopically by cross section reduction (necking). At the microscopic level, voids are generated around second phase particles, and at the centre of the necked region, where the stress triaxiality is maximum. A recent review of the fracture mechanisms is presented in [22].
It is noteworthy that higher amount of intergranular fracture relatively to dimple fracture is observed on the surface region of the 2.9 mm sample.
On the other hand, the more ductile, 3.2 mm sample exhibited a uniform, equiaxed dimpled, fracture surface (Figure 7). No significant variation in the fracture mode between surface and inner regions was observed.
In both cases, no other microstructural defects such as inclusions or porosity, that could impair ductility, were identified with electron fractography in both samples.

3.2. Three Point Bending Testing

Three (3) transverse and three (3) longitudinal bend tests were performed with tests being interrupted at 10 percent load drop. The results of three-point bend tests are given in Table 3. Similar bending angle values were reported in longitudinal tests for all specimens (approximately 102°). Regarding the transverse tests, lower bending angle values were exhibited in 2.9 mm thick specimens (96°) and higher in the 3.2 mm thick specimens (115°). This is an indication that transverse testing could be preferred in the specific alloy and metallurgical condition, when highlighting of bendability in different samples is sought.
One representative load-distance curve from each test is given in Figure 8. Samples with 3.2 mm thickness attained higher load values in both longitudinal and transverse directions, as it was anticipated by their higher thickness values—especially in longitudinal direction where the bending angle was almost identical.
Metallographic examination of bent specimens revealed “roughening” at the surface and shear bands formation, accompanied by formation of intergranular discontinuities, mainly on the surface, but also in the subsurface regions (Figure 9). It is also shown that in 2.9 mm thick sample excessive cracking occurred in transverse tests compared to longitudinal tests which accounts for the drop of the load and the lower bending angle values (Figure 9a,b). In 3.2 mm sample transverse testing led to more intense surface “roughening”, but longer subsurface cracks were formed in longitudinal testing (Figure 9c,d).
In the same figure, it is also observed that even though both materials are fully recrystallized, with equiaxed microstructure, near the surface coarser grains that reduce mechanical properties can be found. The grain boundary interface of such grains is in many cases the stress concentration and cracking initiation region (see Figure 9d).
In Figure 10, Figure 11, Figure 12 and Figure 13 representative (a) macrographs of the bent areas at 10% load drop, (b) high magnification optical micrographs (cross-sections) of the bent areas, (c) and (d) SEM micrographs of the microstructure in HF etched condition and (e) macrographs of the bent areas at 180° bend angle, are given from longitudinal and transverse tests. From the examination it could be deduced that:
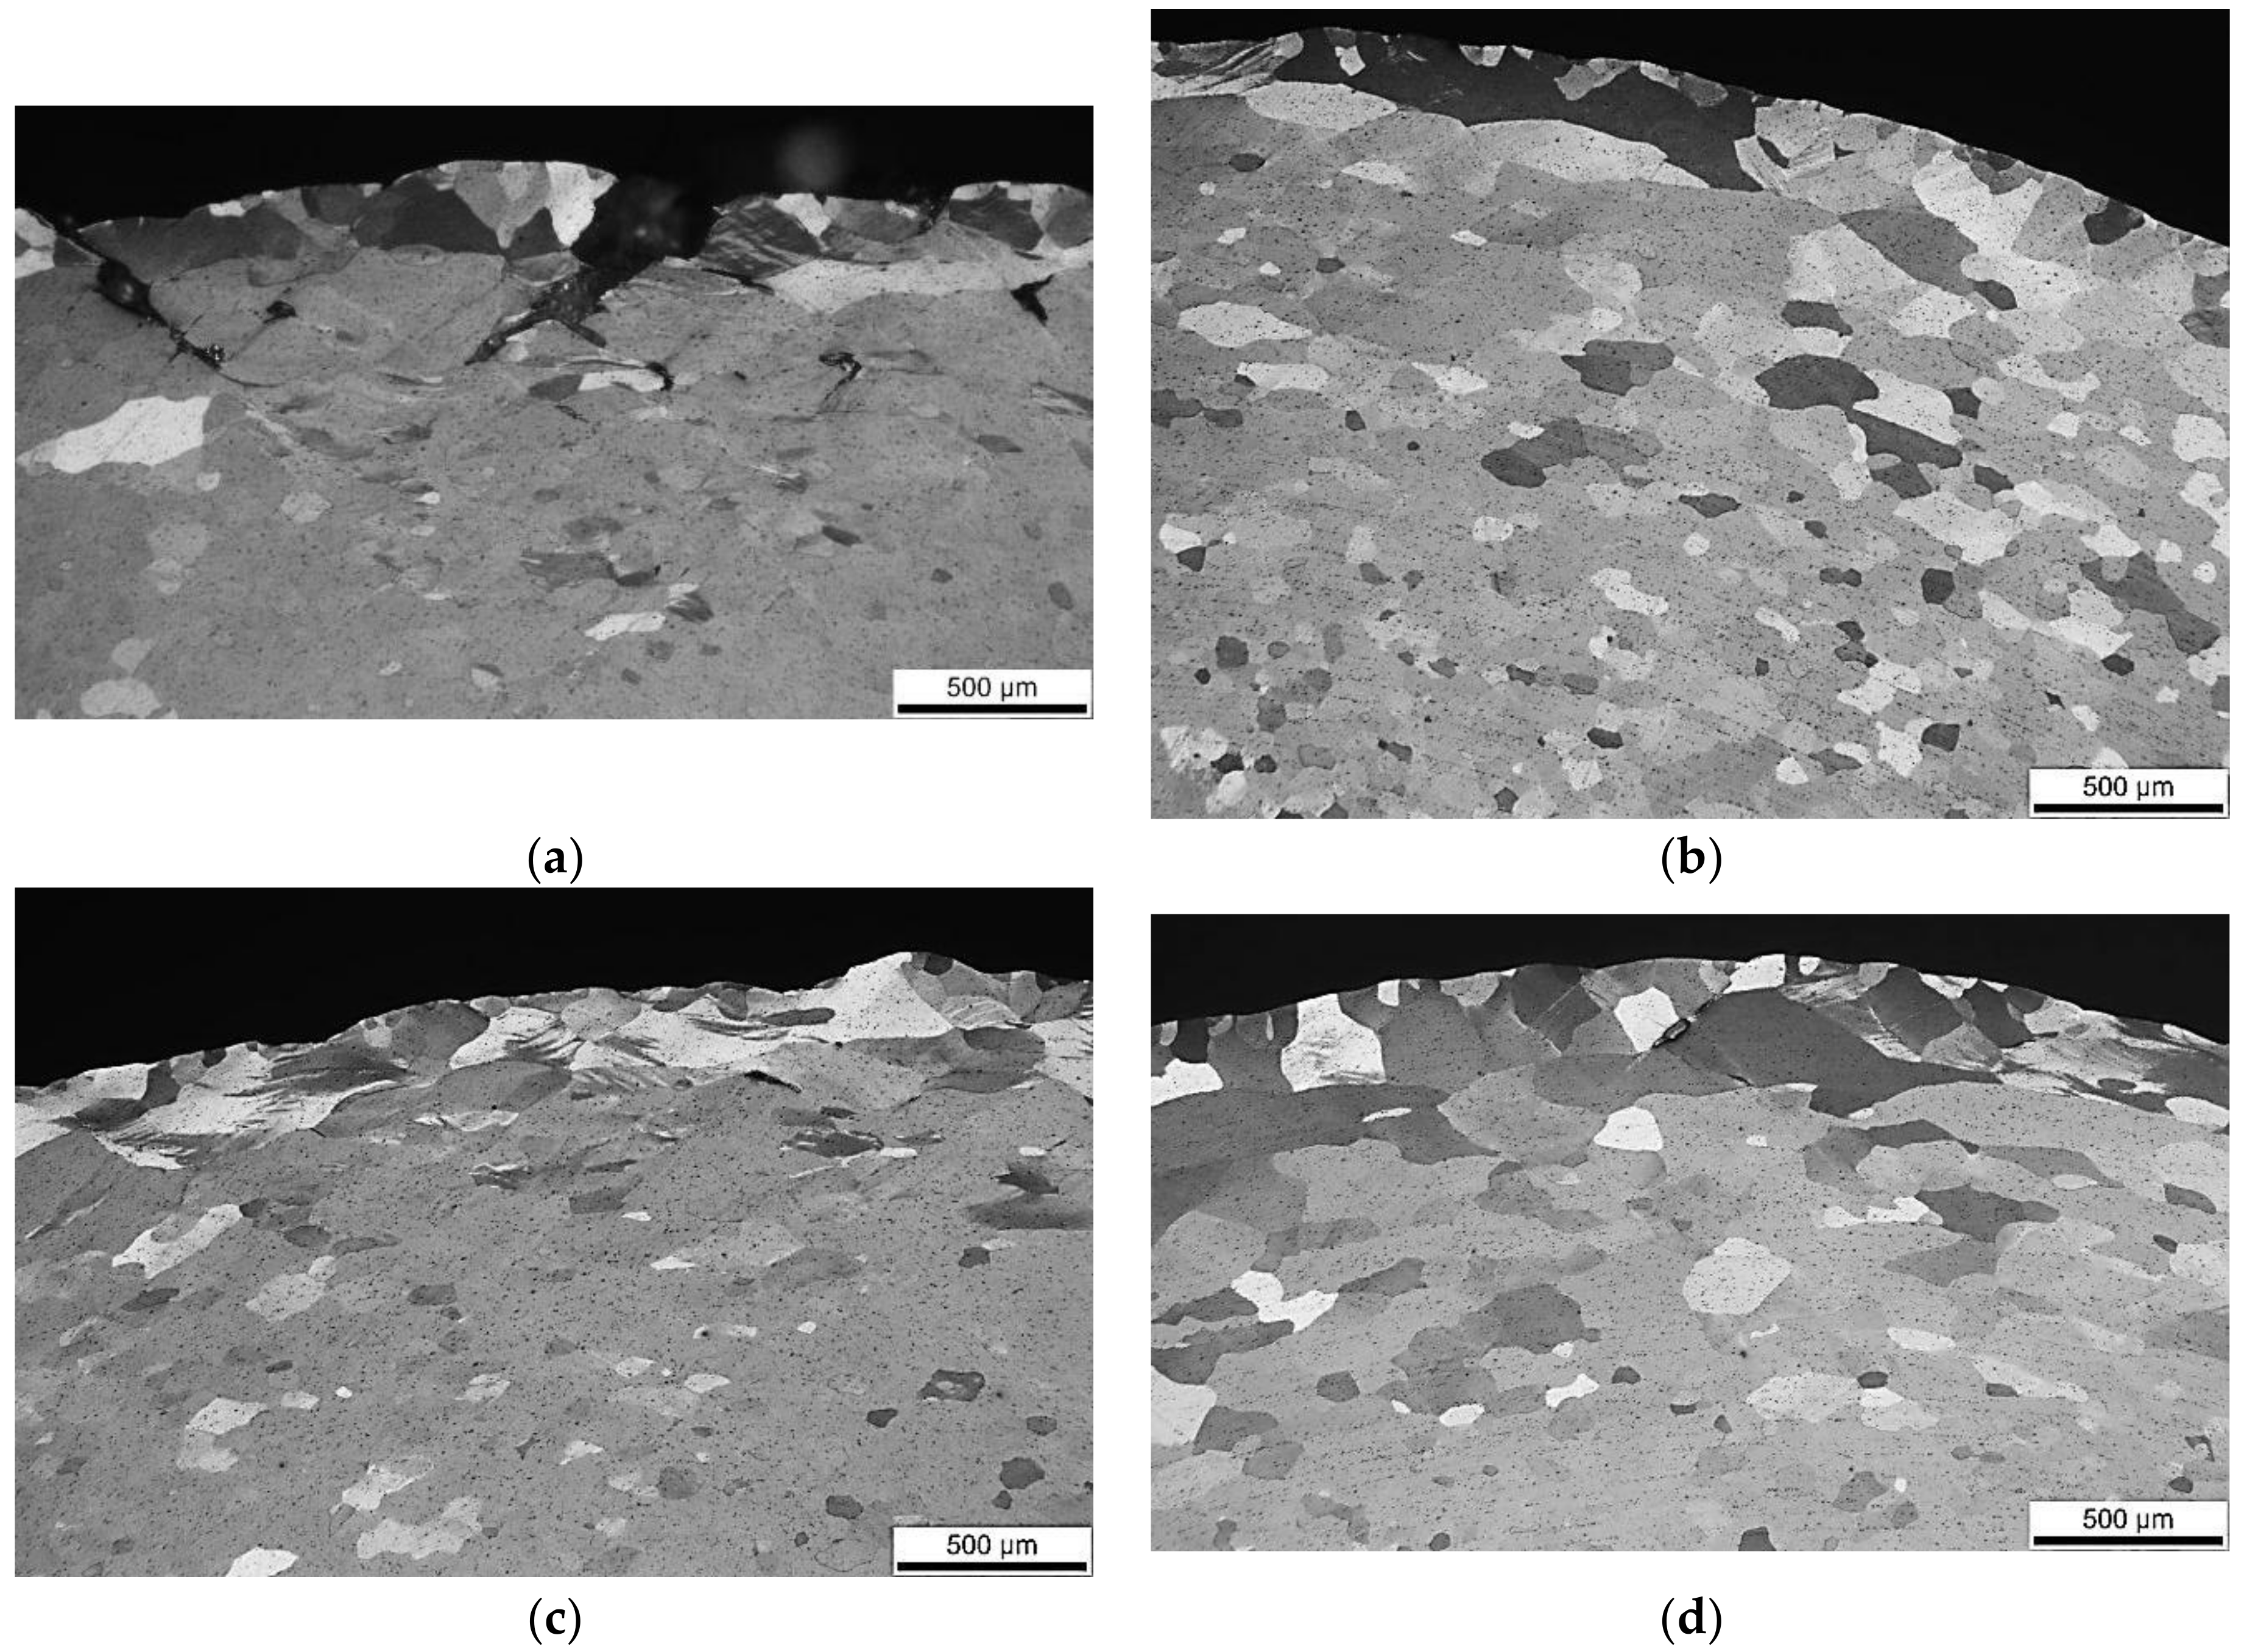
  • Formation of discontinuities can occur on grain boundaries as a result of different accommodation of strain in neighboring grains. Shear bands are observed traversing different grains on the surface and subsurface regions (see Figure 13b). In Figure 10b, Figure 11b and Figure 13b it is readily seen that the prevailing fracture mode is intergranular and cracking was preferentially formed in the subsurface regions.
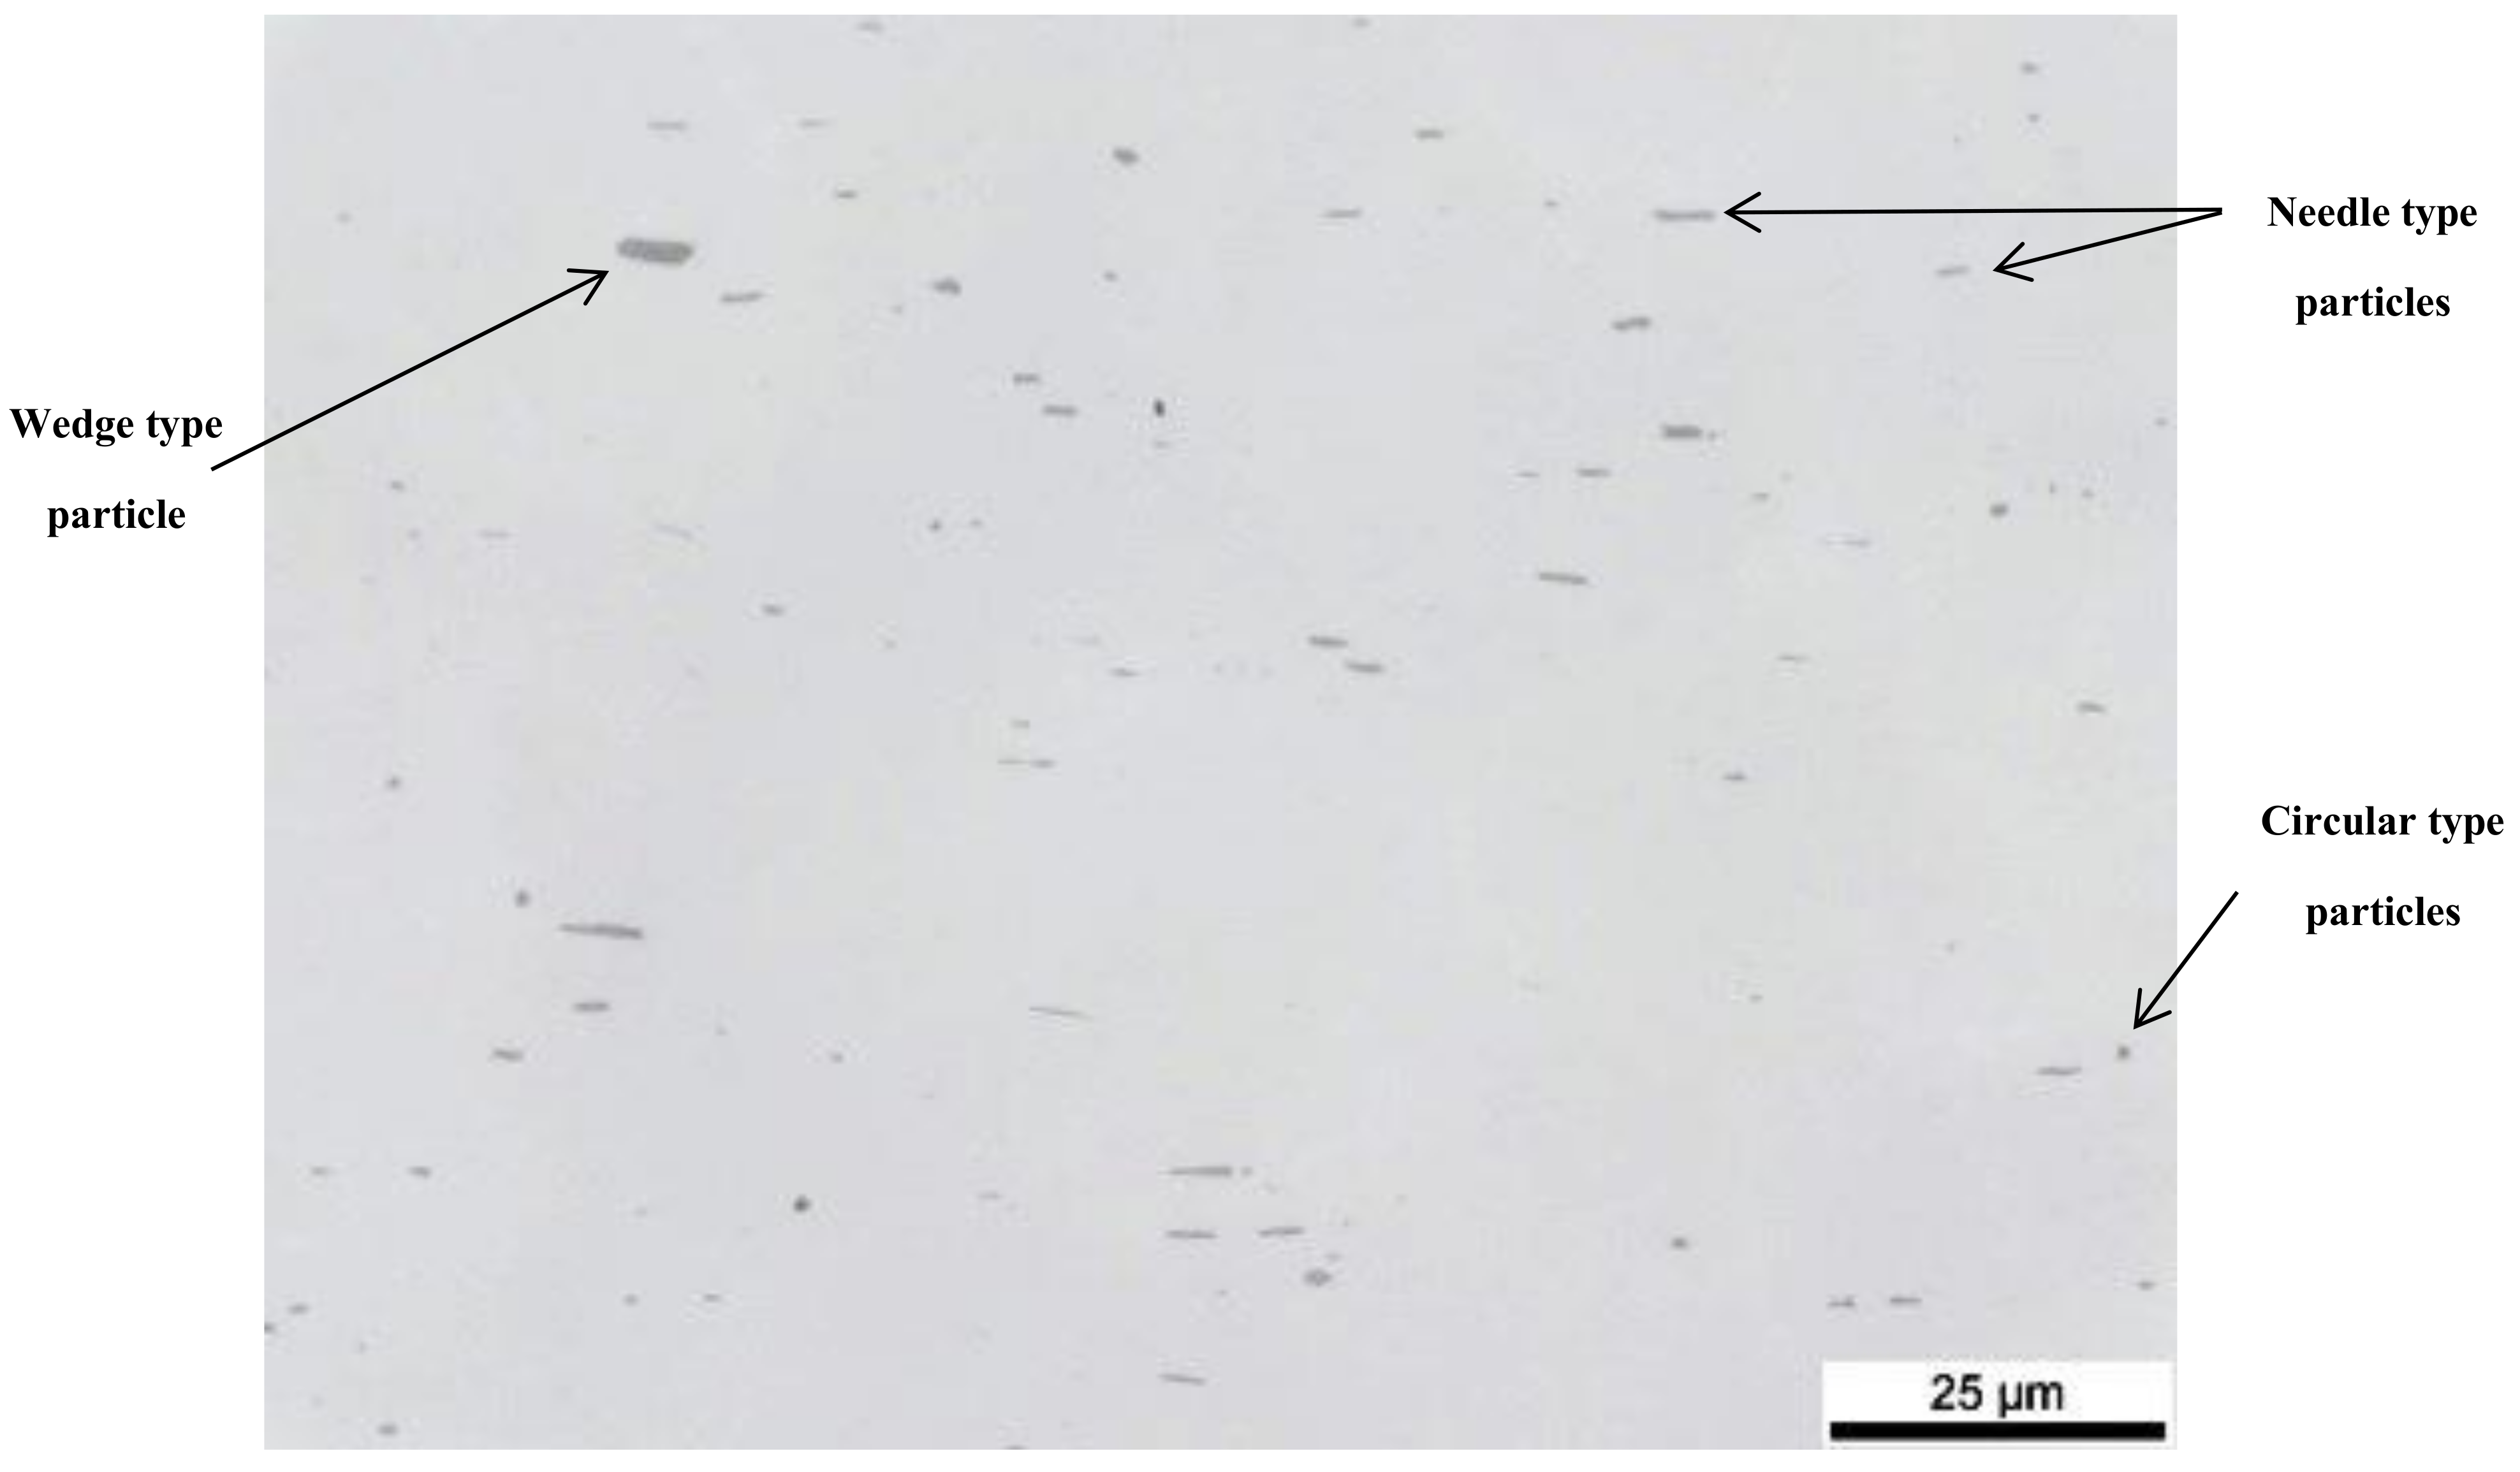
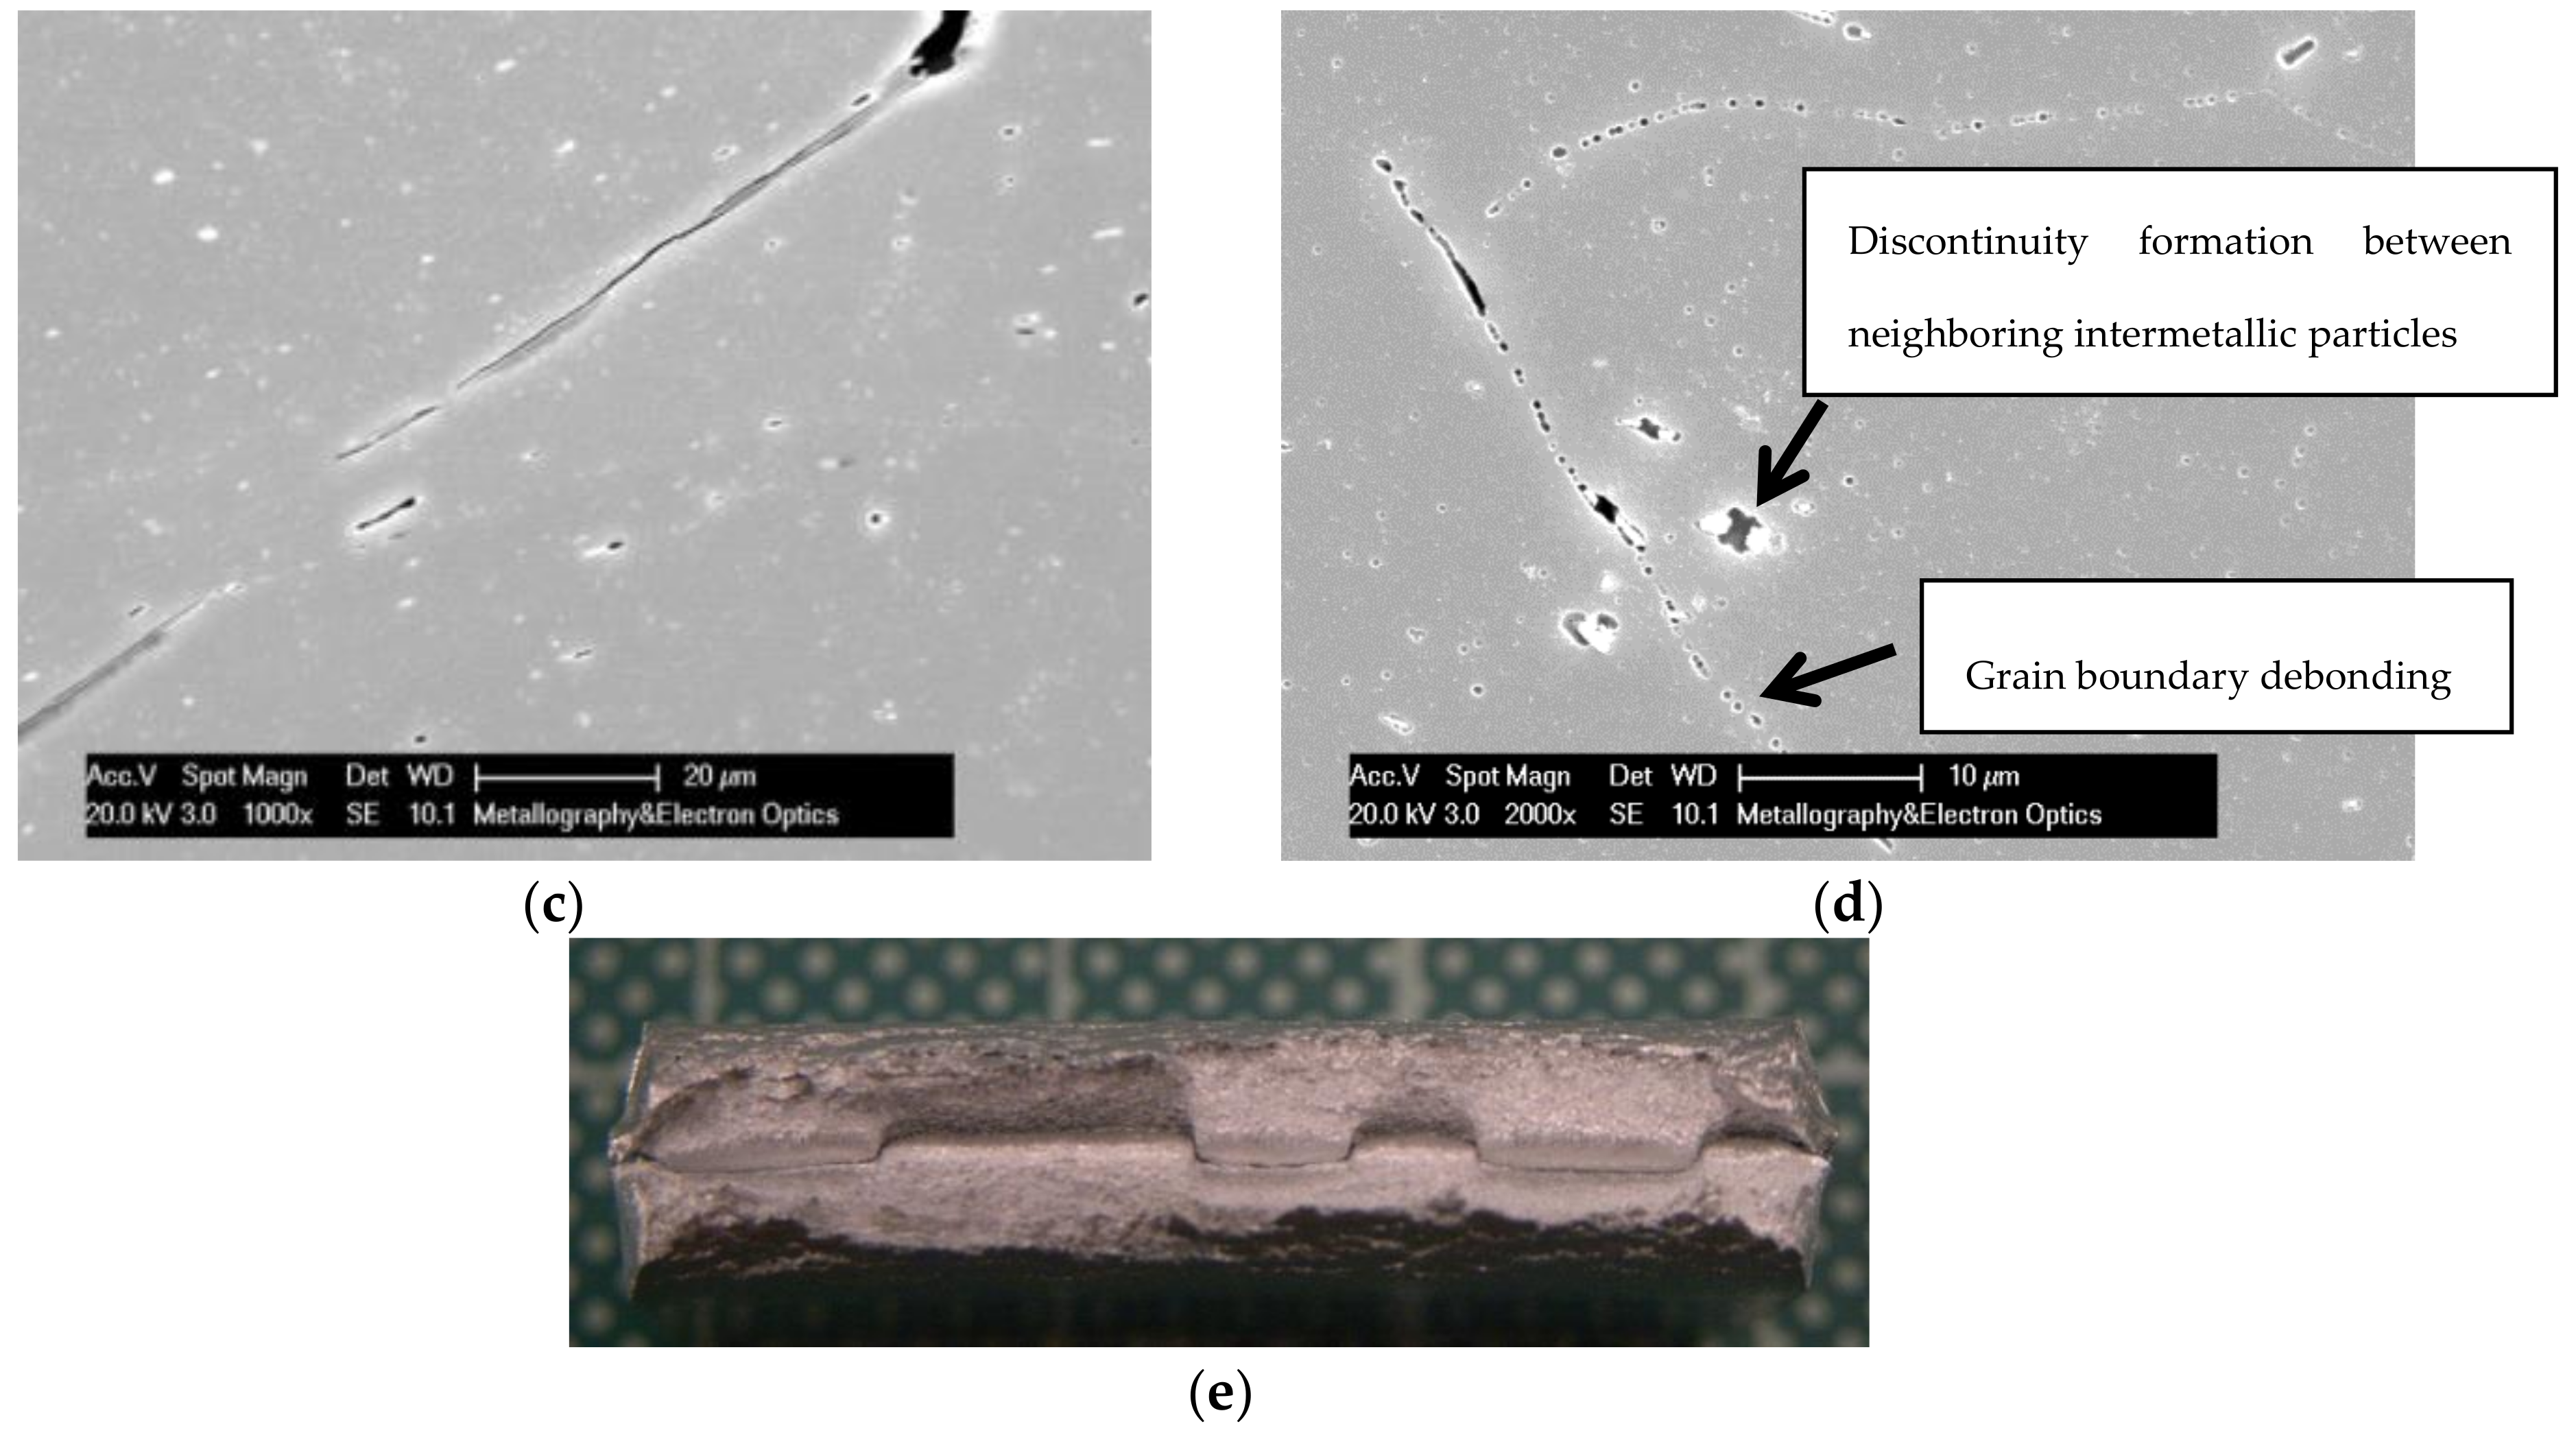
  • Formation of discontinuities also occurred between constituent intermetallic particles inter- and transgranularly. The size and morphology and general appearance of the intermetallic particles for this type of Al-alloy, as they have been identified by optical and electron microscopy constitute typical evidence of Al-Fe-Si secondary phase that have been subjected to deformation processing (extrusion). In Figure 10d and Figure 12d representative SEM micrographs are given showing discontinuities formed between adjacent particles inside the grains. In Figure 11d and Figure 13d it can be seen that during bending testing intermetallic particles also promoted cracking since strain could not be accommodated by such brittle phases.
  • Mg2Si precipitates contribute to voids nucleation on grain boundaries favoring the intergranular fracture mode. Precipitates are preferentially formed on double and triple grain boundary regions during artificial aging. Grain boundary debonding observed in Figure 10d, Figure 11c,d, Figure 12c and Figure 13c is associated with this precipitation behavior as well as the potential occurrence of precipitate free zones (PFZs), which are very narrow (expected to be tenths of nanometers thick in T6 condition) and therefore they can be only discerned by transmission electron microscopy (TEM).
  • The outer surfaces of the samples bent by 180 degrees were completely fractured for 2.9 mm sample in transverse testing (Figure 10e), but were only roughened in the other three cases (2.9 mm—longitudinal test, Figure 11e, 3.2 mm sample transverse and longitudinal tests, Figure 12e and Figure 13e).

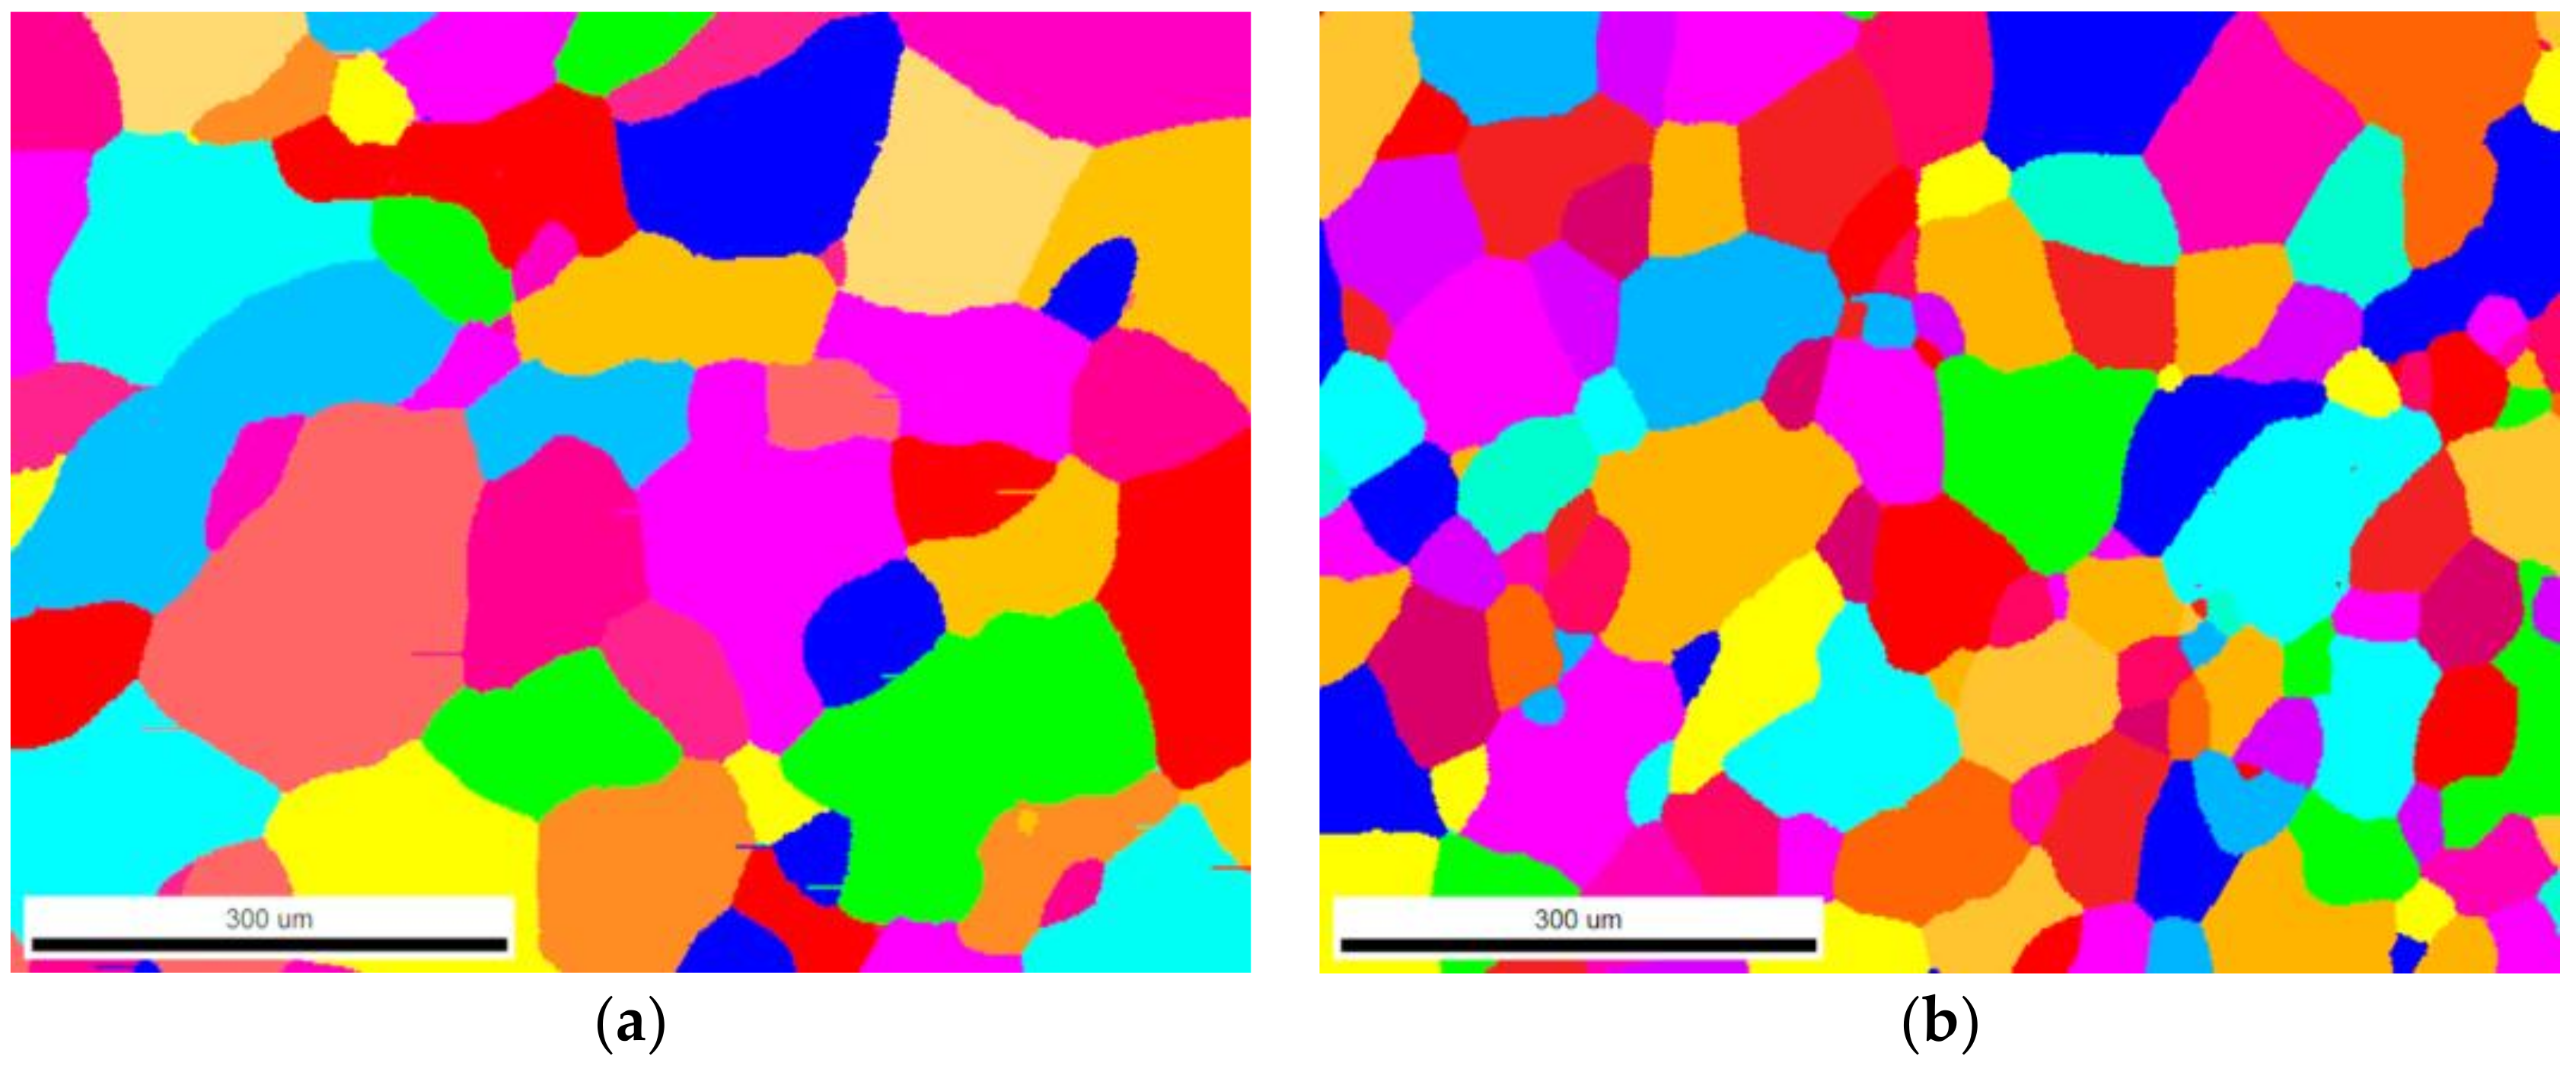
3.3. Electron Backscatter Diffraction (EBSD)

The microstructure and the texture of the extrusions was examined by electron backscatter diffraction. In Figure 14 the grain structure maps from a mid-thickness location for both 2.9- and 3.2-mm thick samples are given. The latter exhibited a finer microstructure with 59 μm average grain size versus 85 μm for the thinner section (both with equiaxed morphology).
Additionally, Taylor factor maps from the surface of the profiles were retrieved (Figure 15). Examination revealed secondary grain growth phenomena in 2.9 mm thick sample, which are expected to lead to premature failure in mechanical testing. Purple arrows indicate potential locations for stress concentration, attributed to the specific orientation of the neighboring grains. The higher the difference in Taylor factor values and the higher frequency of such interfaces the more possible is that the material will fail during bending or any other forming process.

3.4. Finite Element Analysis

3.4.1. Effect of Load Application Direction

From the finite element analysis, the Von Mises stress fields on the Al 6063 body were depicted and evaluated. Since the particles were located in different positions along the thickness (4.57 μm) of the aluminum body, various cross-sections of the sample were examined. In Figure 16, the Von Mises stress fields of a cross-section around the middle of the sample’s thickness for both loading scenarios are presented. The cross-sections presented in Figure 16 are located in a height of approximately 1.4 μm towards the positive values of the X-axis (the bottom of the aluminum body is located at a height of X = 0 μm in the model).
Observation over Figure 16 revealed a correlation between the loading direction and the induced stress fields on the sample. More specifically, in Figure 16a, where the load axis is aligned with the extrusion direction, and thus with the approximate alignment of the particles as well, some high stress values can be seen in the particles concentration region (also see Figure 1a). On the contrary, in Figure 16b, where the load axis is transverse to the extrusion direction, the lowest stress values are those observed in the particle concentration region, as the induced stress fields are “moving” around this area, thus indicating that higher energy is required to cross the aforementioned particle concentration area. This fact indicates that, given the direction of the loading, the presence of the particles can act either as a “path” or a “hindrance” for the induced stresses, as the particle elongation caused by the extrusion leads to high stress fields in the elongation direction over its transverse axis.
Furthermore, the aforementioned particles elongation can lead to stress fields merging in the case of collinear loading-to-extrusion direction scenario, given that the distance between two different particles in the direction of the loading is relatively small and the stress field intensity is high enough. This fact can be seen between the stress fields of “P3” and “P4”, “P4” and “P5” and between “P6”, “P7” and “P8”, although the addition of the stress field of “P7” in this case gets overshadowed from the wider “P6” stress field. On the other hand, a lower intensity, stress fields merging is observed in the case of the transverse load axis-to-extrusion direction scenario, only between the “P1” and “P10” and between the “P2” and “P11” particles, which are outside the particles concentration region.
Further examination of Figure 16 reveals a rather expected behavior, where high stress loci appear in the edges of the particles that are relatively (given that the particles are rotated from the extrusion direction axis by a few degrees) aligned to the loading axis, while low stress loci appear in the corresponding transverse direction. By taking into account that the relative rotations of the particles are in all three directions of the workspace, the existence of particles in different depths along the thickness of the sample can affect the induced stresses in higher of lower cross-sections. This is clarified in Figure 16a, where the existence of particle “P3” causes a branching of the stress merged in “P6” and “P4” stress fields.
Regarding the stress values observed in Figure 16, in both loading scenarios the induced stresses have locally surpassed the applied 150 MPa. The stress fields surpassing the applied value are mainly a result of stress concentration near the ends of the particles (with respects to the loading direction in each loading scenario), with the majority of stress fields being approximately 160–185 MPa in the first loading case (Figure 16a) and 150–170 MPa in the second loading scenario (Figure 16b). The maximum stress values observed in these scenarios appear near some sharp edges of certain particles, with their values approximately 190–210 MPa in Figure 16a (observed in “P4”, “P6”“P7” and “P8”) and 170–185 MPa in Figure 16b (observed in “P1”, “P6”, “P7” and “P10”). Given that all of the above-mentioned stress fields are present in the interfaces between the particles and the aluminum body, a debonding between the two is considered highly possible. Based on the definition of stress concentration factor K (Equation (1)), given by Carvill [23], the stress concentration factors for the above-mentioned stress fields are calculated in Table 4.
K = σ m a x σ a p p l i e d
Especially for the particles concentration region, a comparison between Figure 16a,b reveals that stress concentration in the first loading scenario is severely amplified, while the stress fields in the same region in the second loading scenario are rather relaxed. The respective stress concentration factors are approximately 1.07–1.23 for the first scenario, compared to 1.00–1.13 for the second scenario. Thus, it can be concluded that the particle elongation from the extrusion combined with their dense distribution can lead to high intensity stress field, which is not observed when the load is applied transversely to the particle elongation axis.

3.4.2. Effect of Particle Aspect Ratio

The importance of particles shape and aspect ratio is further clarified from the results presented in Figure 17 and Figure 18, respectively.
From the results presented in Figure 17, the importance of particle shape is examined. In this case, the two particles have similar alignment and comparable sizes, thus the induced stress fields are overall close in value. However, since “P8” is a wedge type particle with sharp edges, some significant stress fields are concentrated in the corners of the wedge. On the other hand, no such stress concentration exists in the case of the much smoother needle type particle “P6”. This observation is similar to both loading scenarios, although the induced stress values between the two are different.
In Figure 18, a comparison between the induced stress field in particles “P3” and “P7” is presented. In this case, the two particles are a needle type and a circular type respectively, with different aspect ratios and in both cases no sharp corners exist. From the comparison between the two, the induced stresses around the two particles have similar maximum values. However, because of the equiaxed morphology of “P7”, its induced stress field is continuous and has mostly the same intensity throughout its periphery, while the corresponding stress field of “P3” is varying across its periphery. Additionally, the stress fields of particle “P7” are very similar in both loading scenarios, while the same is not true for the stress fields of “P3”. From the above analysis, it can be concluded that globular particles can act as constant stress raiser points regardless of the direction of loading, while the effectiveness of load direction becomes more important in non-equiaxed particles.

4. Discussion

The fracture surface of 2.9 mm thick sample from tensile testing was mainly intergranular but also exhibited dimples, with the higher ratio of intergranular to transgranular fracture occurring on the surface regions. This could be explained by the high stress concentration occurring due to presence of secondary recrystallized grains with approximately millimeter size which lower the ductility. A very coarse grain is very likely to have many neighboring grains with high difference in Taylor factor values. As a consequence, these grains will respond in a different manner to applied stresses during forming (in this case bending) leading to high stress concentration and ultimately fracture. This is the case of the grain interfaces highlighted in Figure 15.
From the obtained results, it is clear that the sample with the finer mean grain size in the matrix and the surface layer with no coarse grains had better formability. It is therefore necessary to attain a fine, equiaxed microstructure when high bendability is sought. It was observed that the strength of the sample with the coarser structure was higher. This is attributed to the higher amount of precipitation that occurred on the 2.9 mm thick sample. The examination of the size and distribution of Mg2Si precipitates remains as future work (TEM) since their size could not be resolved with optical and scanning electron microscopy. The amount of natural aging that also affects seriously the resulting strength and that could lead to the observed differences in strength was not provided and should always be taken into account when mechanical properties of 6xxx series alloys is examined.
Both extrusion samples exhibited high bendability in longitudinal tests. However different behavior and generally bigger variation was observed on transverse tests. It is assumed that transverse bend testing is a more decisive mechanical test for determination of formability performance and for comparing different materials. Results also revealed that except from the 10 percent load drop tests it is suggested to perform 180 degrees bend tests, as the sample with the poor bendability was catastrophically fractured and the samples with the acceptable bendability were folded, exhibiting only orange peeling.
The formation of discontinuities in bending testing is strongly related with shear banding phenomena. Metallographic examination of bent samples showed that once stresses are concentrated on the grain boundaries, shearing can progress easily by “cutting” the neighboring grains in a mixed inter- and transgranular, fracture mode (low ductility fracture). The intergranular fracture mode is assisted by cracks formed between neighboring AlFeSi intermetallic particles producing microvoids and also by the fact that these particles are fractured during straining as a result of their brittle behavior. Consequently, the chemical composition of the alloy, which is directly related with the number of Fe-containing phases has a significant role in bendability, but should be regarded when comparing samples or alloys with different amount of Fe and Si.
Bendability is seriously affected by the metallurgical condition since this governs (i) the amount of Mg2Si precipitation and the potential of grain boundary dissipation which occurs due to the cross linking of grain boundary precipitates and (ii) the presence of PFZs that constitute lower strength inter-crystalline regions. Higher bendability could be expected in T7 condition where the matrix is considerably softened or in underaged condition where no appreciable hardening has been performed. Si content is crucial in reducing the amount of Si grain boundary crystals precipitation that decrease ductility.
The results of FEM analysis showed that high stress concentration occurs at the edges/tips of the intermetallic particles, especially on the more elongated and/or sharply angular particles. A maximum concentration factor of 1.4 was calculated for the collinear load axis-to-extrusion direction loading scenario, while 1.23 was calculated for transverse load axis loading scenario.
Noticeable differences in the stress fields and the response of the metal in the longitudinal and transverse to extrusion direction were observed. More specifically, the direction of loading and its relative angle to the extrusion direction can completely change the pathing of stress fields inside the aluminum body, and thus any possible crack path formed. However, the direction of loading seems to have little effect on the stress induced fields of smaller particles, which operate as constant stress raiser points.
Comparing the areas with dense and sparser distribution of intermetallic particles it is readily observed that between closely spaced particles the stress fields are quite more intensive by a factor of 1.07–1.23 in the collinear load axis-to-extrusion direction loading scenario and 1.00–1.13 in the transverse load axis-to-extrusion direction loading scenario. Also, in the case of the former loading scenario, stress field merging occurs, thus the induced stress field paths completely change.
Based on the calculated stress values and the concentration of high stresses around the aluminum-particle interfaces, the possibility of debonding between the two is highly probable. In this case, any such point can be considered as a crack initiation point.
According to these results it could be said that:
  • The resulting strength in tensile testing is strongly affected not only by grain structure but also by the amount of precipitation and the alloying addition as well as other factors affecting precipitation behavior such as natural aging, homogenization conditions, cooling rate after homogenization, solution heat treatment or extrusion (thermo-mechanical treatment) etc. This could provide an explanation for the higher strength of 2.9 mm thick sample, which had coarser microstructure than the 3.2 mm sample.
  • Ductility in tensile testing and bendability are strongly related with grain size and morphology especially on the subsurface zones as well as in the bulk material. It is believed that cracks are easily nucleated in coarse grained material and once formed they can propagate through low ductility grain boundary regions or highly stressing shear bands cutting the grains transgranularly. It is easier to reveal any differences in bendability through transverse tests either by selecting 10% load drop as stop criterion or simply by bending by 180 degrees.
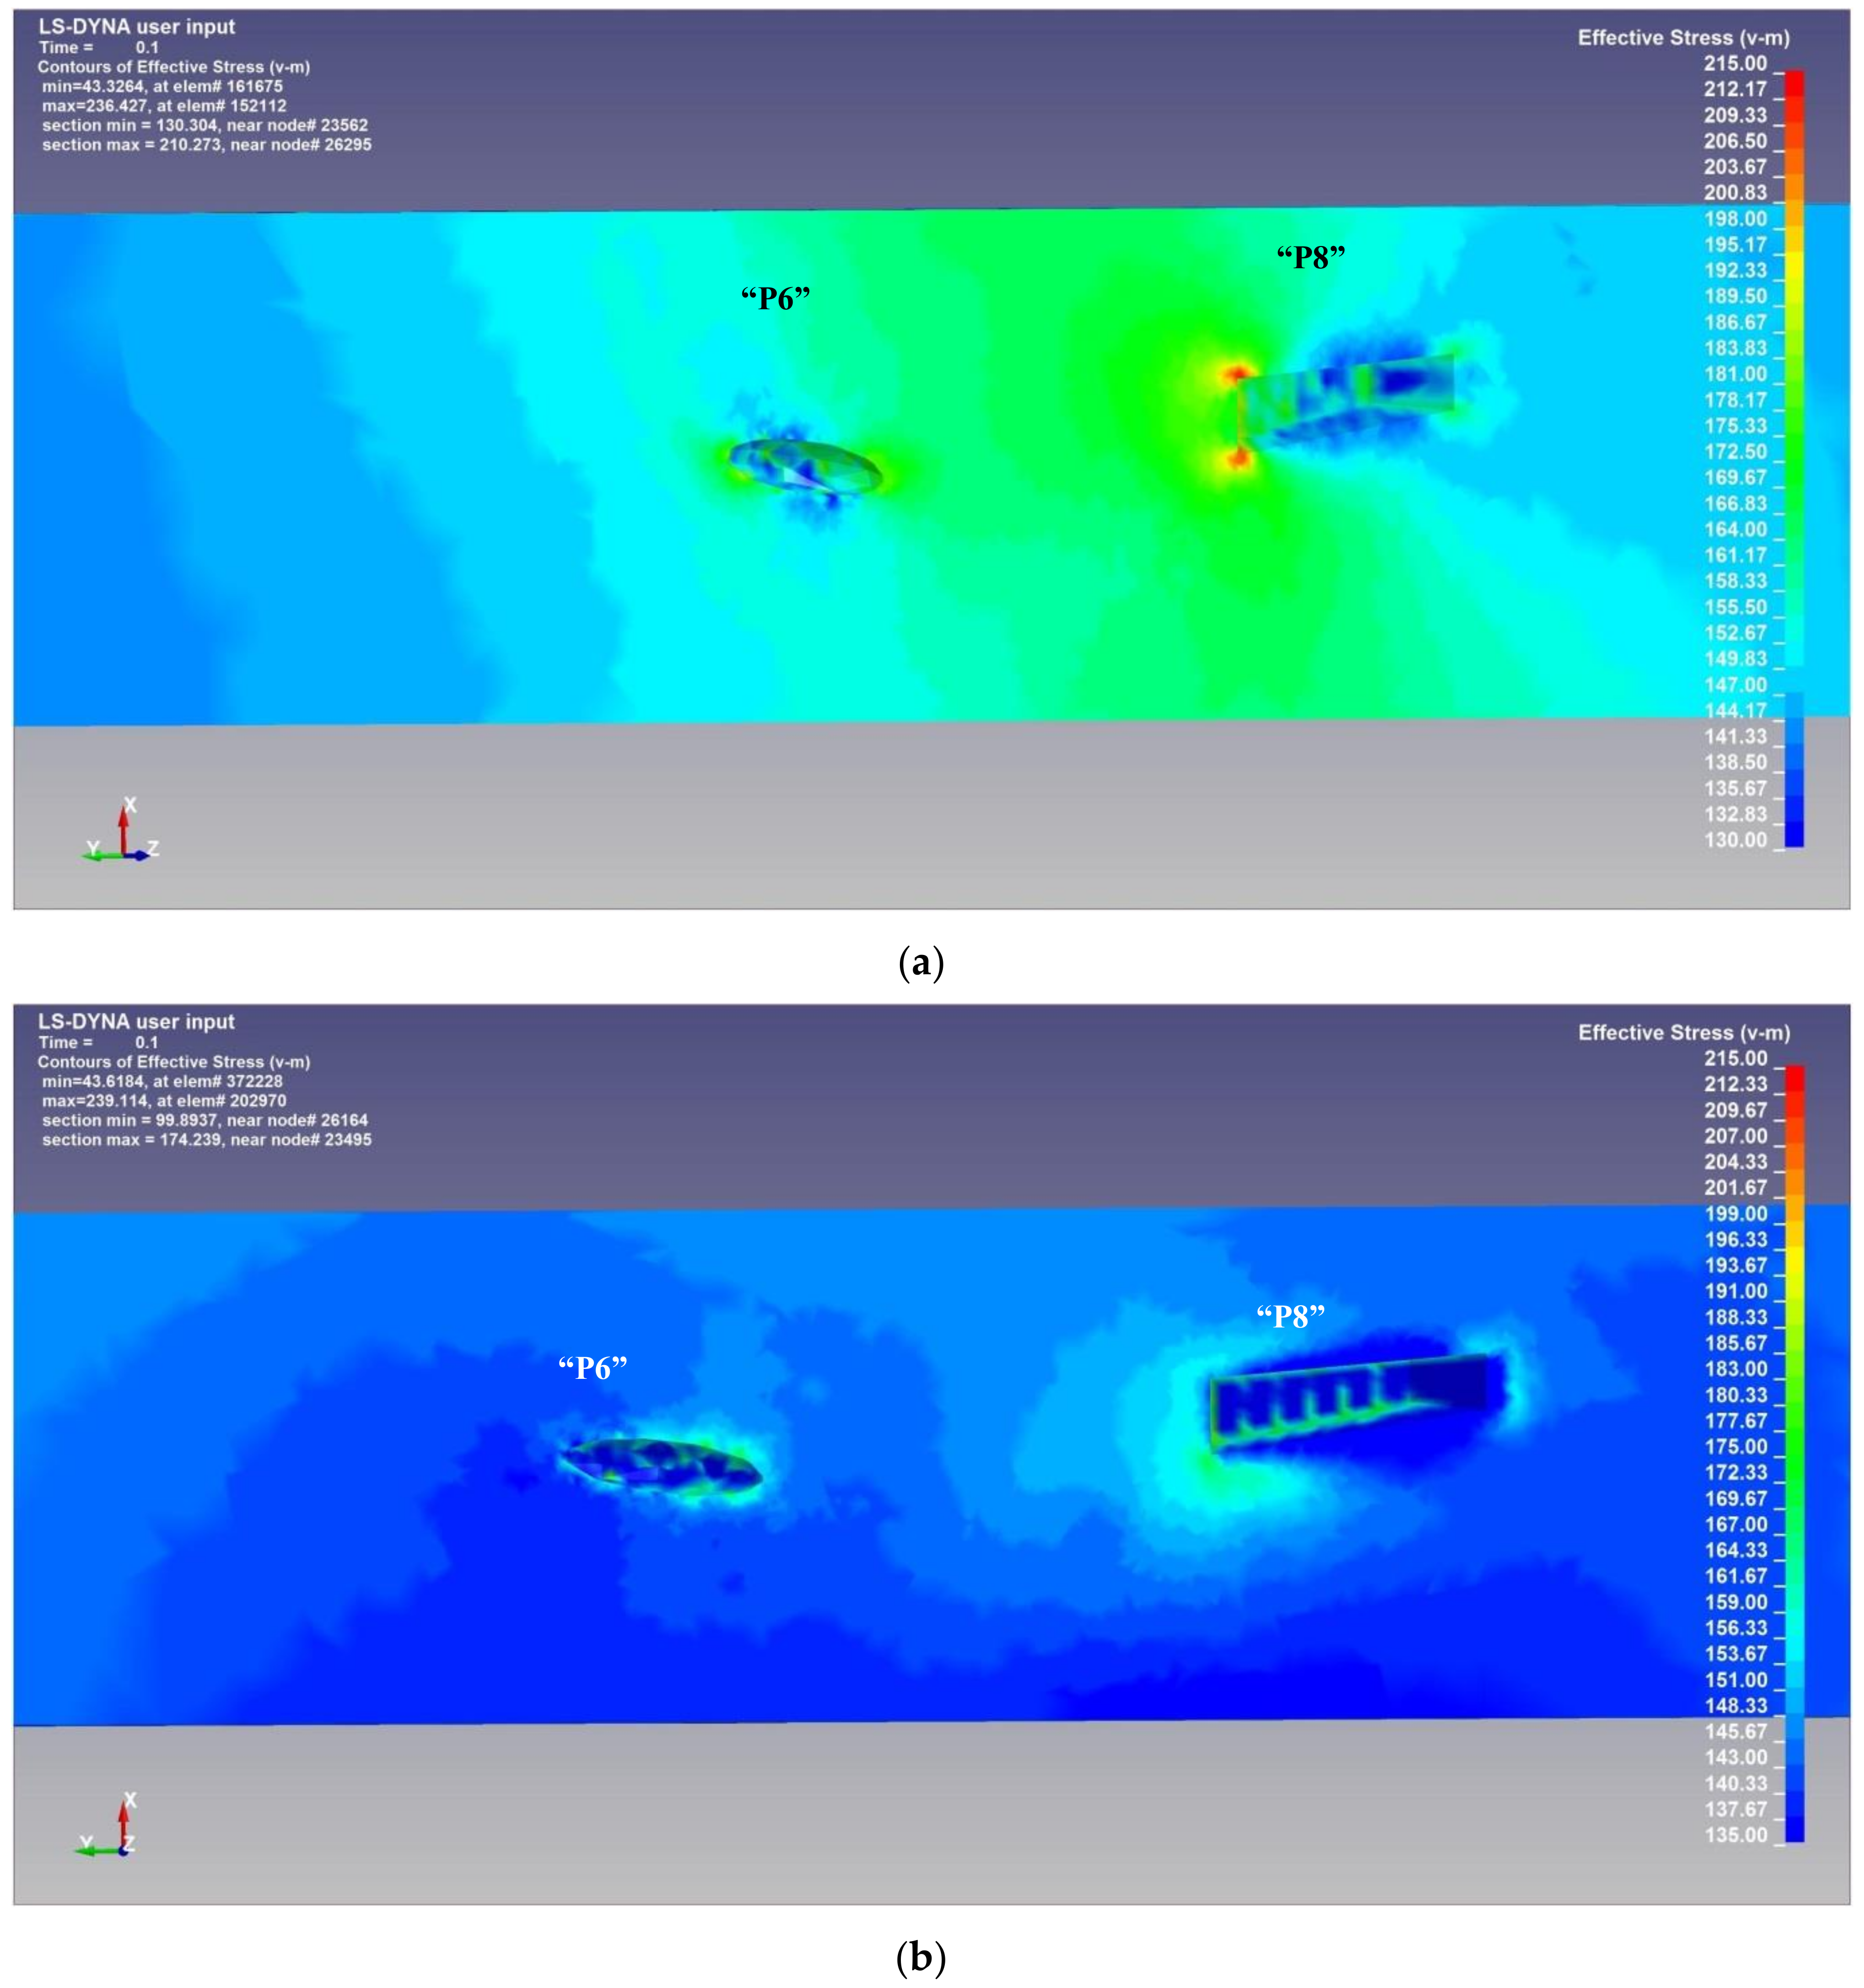
  • Fe and Si should be considered when comparing the bendability of different alloy samples. Constituent particles have been proved by FEM to create high stress intensity fields during stressing, in both longitudinal and transverse directions. Especially when they have wedge-type morphology, significant stress fields were derived in their corners’ area. This finding comes in agreement with metallographic examination findings where microvoids are formed between adjacent particles and this is the reason for the desired low Fe content in alloys with high crash performance and high ductility.
  • FEM was successfully performed by applying tensile stresses parallel and transverse to extrusion direction in order to simulate the performance of the α-AlFeSi particles in the surface region of the profiles during 3-point bending tests in the longitudinal and transverse direction respectively. A possible explanation for the fact that the maximum load values in 3-point bending tests were observed in transverse direction could be given by finite element analysis. The model showed that among closely spaced elongated intermetallic particles the stress fields that develop are higher in intensity in the longitudinal tests and therefore the profiles are more prone to crack initiation and propagation in the respective tests.
  • The role of globular particles is the same for transverse and longitudinal testing and this could apply not only for constituent particles but also for similar morphology precipitates.
  • EBSD analysis and Taylor factor mapping can provide a valuable means in characterization of bendability not only by presenting an accurate grain structure but mainly by revealing crystallographic data related with the response of the material to stresses signifying potential locations for crack initiation.

5. Conclusions and Further Research

A thorough study including microstructure characterization, mechanical testing and finite element analysis of 6063 alloy profile samples was performed in order to determine the factors governing strength, ductility, bendability and also de-codify the role of the intermetallic particles in applied stresses. It is proposed that bendability of 6xxx series alloy extrusions can be easily evaluated by three-point bending tests, especially on the transverse direction but also with ductility as this is calculated by tensile tests. Precipitation behavior and metallurgical condition are the more crucial parameters for strength while grain morphology is more important in bendability, when comparing samples with the same metallurgical condition.
  • The load direction was proved to be important by both actual tests and FEM. Transverse testing proved to be more decisive in the determination of the more formable material as both samples had the same bendability in the longitudinal tests. Statistical analysis of bending results was not in the scope of the present research, but has been planned as a future work.
  • Texture analysis should be included in formability related projects in order to perform a more complete characterization of the role of the resulting texture from extrusion especially in the more sensitive surface regions where stress is concentrated and fracture initiation is expected. This type of analysis would include Taylor factor mapping for revealing the frequency and location of interfaces with high Taylor factor values, mean grain size analysis which can be precisely performed by EBSD in aluminum alloys (fine grains cannot be resolved by optical microscopy affecting calculation of the mean grain size), calculation of the amount of recrystallization by grain boundary angle misorientation maps, etc.
  • Finite element analysis has been proved very useful in the explanation of resulting loads in 3-point bend tests by revealing the respective stress fields formed between the intermetallic particles in the aluminum matrix, while the role of these particles as stress raisers especially according to their morphology was revealed. It can be inferred that globular particles can act as constant stress raiser points regardless of the direction of loading, while the effectiveness of load direction becomes more important in non-equiaxed type particles.
  • Further testing and analysis by EBSD will follow in order to reveal the role of various recrystallization texture components, especially cube or rotated cube texture, as well as the role of grain boundaries misorientation in crack assisting or arrestment. Additional FEA will be also performed by simulation of bending testing in order to verify the observed bending performance of the extrusions and optimize their performance by selecting the proper heat treatment after extrusion.

Author Contributions

Conceptualization, A.V.; Methodology, A.V.; Software, I.P.; Validation, A.V., Formal Analysis, I.P.; Investigation, S.P., A.T., A.R. and M.K.; Resources, G.S. and G.P.; Writing – Original Draft Preparation, A.V. and I.P.; Writing – Review & Editing, G.P.; Visualization, A.V. and I.P.; Supervision, A.V.; Project Administration, G.P.

Funding

This research received no external funding.

Acknowledgments

Special thanks are directed to ELKEME S.A. General Director Mr. Kimon Daniilidis for supporting the interdepartmental work on automotive extrusions.

Conflicts of Interest

The authors declare no conflict of interest.

References

  1. Vazdirvanidis, A. Study on the Thermal Treatment of Aluminum 6xxx Series Extruded Products Aiming at the Optimization of Strength and Crashworthiness. Ph.D. Thesis, National Technical University of Athens (NTUA), Athens, Greece, 2016. [Google Scholar]
  2. Ye, Y.; Sanders, R., Jr.; Yang, X. The Influence of Microstructure on the Fracture Resistance of 6xxx Alloy Sheet. In Proceedings of the 16th International Aluminum Alloys Conference (ICAA16); Canadian Institute of Mining, Metallurgy & Petroleum: Westmount, QC, USA, 2018; ISBN 978-1-926872-41-4. [Google Scholar]
  3. Vazdirvanidis, A.; Koumarioti, A.; Pantazopoulos, G.; Rikos, A.; Toulfatzis, A.; Kostazos, P.; Manolakos, D. Examination of Buckling Behavior of Thin-Walled Al-Mg-Si Alloy Extrusions. In Proceedings of the 12th International Conference on Aluminium Alloys, Carnegie Mellon University. Pittsburgh, PA, USA, 3–7 June 2012. [Google Scholar] [CrossRef]
  4. Koumarioti, I.; Ping, S.; Vazdirvanidis, A.; Pantazopoulos, G.; Zormalia, S. Influence of Homogenizing and Ageing Practices on Microstructure and Dynamic Compression of Crash Relevant Al-Alloy Extrusions. In Proceedings of the 12th International Conference on Aluminium Alloys, The Japan Institute of Light Metals, Yokohama, Japan, 5–9 September 2010; pp. 1124–1129. [Google Scholar]
  5. Westermann, I.; Snilsberg, K.; Holmedal, B.; Hopperstad, O. Bendability and Fracture Behaviour of Heat-Treatable Extruded Aluminium Alloys. In Proceedings of the 12th International Conference on Aluminium Alloys, ICAA12, The Japan Institute of Light Metals, Yokohama, Japan, 5–9 September 2010; pp. 595–600. [Google Scholar]
  6. Das, S.; Heyen, M.; Kamat, R.; Hamerton, R. Improving Bendability of Al-Mg-Si Alloy Sheet by Minor Alloying Element Addition; Light Metals; Martin, O., Ed.; TMS, Springer: Berlin/Heidelberg, Germany, 2018; pp. 325–331. [Google Scholar]
  7. Vazdirvanidis, A.; Pantazopoulos, G.; Toulfatzis, A.; Rikos, A.; Manolakos, D. Effect of Natural Aging of 6xxx Series Extrusions on the Energy Absorbance Capacity, Materials Science Forum. In Proceedings of the 15th International Conference on Aluminium, ICAA 2017, Tsinghua University, Beijing, China, 6–9 July 2017; Volume 87, pp. 315–321. [Google Scholar] [CrossRef]
  8. Katsivarda, M. Homogenization Study of as Cast 6063 Aluminum Alloy Billets and Examination of the Effect of Cooling Rate on the Resulting. Ph.D. Thesis, National Technical University of Athens (NTUA), Athens, Greece, 2018. [Google Scholar]
  9. Katsivarda, M.; Vazdirvanidis, A.; Pantazopoulos, G.; Kolioubas, N.; Papadopoulou, S.; Rikos, A.; Spiropoulou, E.; Papaefthymiou, S. Investigation of the effect of homogenization practice of 6063 alloy billets on beta to alpha transformation and of the effect of cooling rate on precipitation kinetics. Mater. Sci. Forum 2018, 941, 884–889. [Google Scholar] [CrossRef]
  10. Vazdirvanidis, A.; Pantazopoulos, G.; Kolioubas, N.; Papadopoulou, S.; Katsivarda, M.; Rikos, A.; Spiropoulou, E. Investigation of the Effect of Homogenization Practice on the Microstructure of 6060 and 6082 Series Alloy Billets. In Proceedings of the 16th International Aluminum Alloys Conference (ICAA16); Canadian Institute of Mining, Metallurgy & Petroleum: Westmount, QC, USA, 2018; ISBN 978-1-926872-41-4. [Google Scholar]
  11. Snilberg, K.; Westermann, I.; Holmedal, B.; Hopperstad, O.S.; Langsrud, Y.; Marthinsen, K. Anisotropy of Bending Properties in Industrial Heat-Treatable Extruded Aluminium Alloys. In Materials Science Forum; Trans Tech Publications: Switzerland, 2010; Volume 638, pp. 487–492. [Google Scholar] [CrossRef]
  12. Lloyd, D. Aspects of Plasticity and Fracture Under Bending in Al Alloys. In Proceedings of the 16th International Aluminum Alloys Conference (ICAA16); Canadian Institute of Mining, Metallurgy & Petroleum: Westmount, QC, USA, 2018; ISBN 978-1-926872-41-4. [Google Scholar]
  13. Vazdirvanidis, A.; Skordilis, I.; Katsivarda, M.; Stavroulakis, P.; Papaefthymiou, S. Study of Grain structure and crystallographic orientation of extruded 6xxx series alloy profiles. In Proceedings of the 14th International Scientific Congress Machines, Technologies, Materials (MTM 2017), Varna, Bulgaria, 13–16 September 2017; Volume 11, pp. 457–459. [Google Scholar]
  14. Dao, M.; Li, M. A micromechanics study on strain-localization-induced fracture initiation in bending using crystal plasticity models. Philos. Mag. A 2001, 81. [Google Scholar] [CrossRef]
  15. Inoue, H. Prediction of in-plane anisotropy of bendability based on orientation distribution function for polycrystalline face-centered cubic metal sheets with various textures. Mater. Trans. 2015, 56. [Google Scholar] [CrossRef]
  16. Berndt, N.; Frint, P.; Wagner, M.F.-X. Influence of extrusion temperature on the aging behavior and mechanical properties of an AA6060 aluminum alloy. Metals 2018, 8, 51. [Google Scholar] [CrossRef]
  17. He, X.; Pan, Q.; Li, H.; Huang, Z.; Liu, S.; Li, K.; Li, X. Effect of artificial aging, delayed aging, and pre-aging on microstructure and properties of 6082 aluminum alloy. Metals 2019, 9, 173. [Google Scholar] [CrossRef]
  18. Belov, N.A.; Aksenov, A.A.; Dmitry, G. Eskin Iron in Aluminium Alloys: Impurity and Alloying Element; CRC Press: Boca Raton, FL, USA, 2002. [Google Scholar]
  19. Glazoff, M.V.; Zolotorevsky, V.S.; Belov, N.A. Casting Aluminum Alloys; Elsevier: Amsterdam, The Netherlands, 2010. [Google Scholar]
  20. LSTC. LS-DYNA Keyword User’s Manual; Volume II, Material Models; Livermore Software Technology Corporation (LSTC): Troy, MI, USA, 2001. [Google Scholar]
  21. Gaillac, R.; Pullumbi, P.; Coudert, F.-X. ELATE: An Open-Source Online Application for Analysis and Visualization of Elastic Tensors. J. Phys. Condens. Matter 2016, 28, 275201. Available online: http://progs.coudert.name/elate/mp?query=mp-984873 (accessed on 23 September 2019). [CrossRef] [PubMed]
  22. Pantazopoulos, G.A. A short review on fracture mechanisms of mechanical components operated under industrial process conditions: Fractographic analysis and selected prevention strategies. Metals 2019, 9, 148. [Google Scholar] [CrossRef]
  23. Carvill, J. 1—Strengths of Materials. In Mechanical Engineer’s Data Handbook; Butterworth-Heinemann: Oxford, UK, 1993; pp. 1–55. [Google Scholar]
Figure 1. Particles distribution in aluminum body for FEA: (a) Top view and (b) side view imaging.
Metals 09 01080 g001
Figure 2. Optical micrograph showing intermetallic particles in Al 6063 alloy sample (observation parallel to extrusion). Wedge, needle and circular type particles can be seen.
Metals 09 01080 g002
Figure 3. Generated mesh: (a) Particle mesh and (b) Aluminum body mesh.
Metals 09 01080 g003aMetals 09 01080 g003b
Figure 4. Loading scenarios: Load aligned with the extrusion direction (Scenario 1) or transverse to the extrusion direction (Scenario 2), (Top view). Each scenario was separately simulated.
Metals 09 01080 g004
Figure 5. (a) Stress-strain curves showing lower strength and higher ductility for the thicker sample. (b) Macrograph of the aluminum profile cross-section, showing the wall area from which the mechanical testing specimens were retrieved, the wall thickness corresponds to the initial tensile specimen thickness. Stereoscopic micrographs of the fracture surfaces from tensile tests, (c) 2.9 mm thick sample and (d) 3.2 mm thick sample. Higher reduction of area is observed in (d).
Metals 09 01080 g005
Figure 6. (ad) SEM fractographs, fracture surface of tensile specimen with 2.9 mm thickness. Mixed fracture mode consisting mainly of intergranular fracture and lower percentage exhibiting dimpled morphology. Grain facets and triple joints are highlighted.
Metals 09 01080 g006
Figure 7. (ad) SEM fractographs, fracture surface of tensile specimen with 3.2 mm thickness. Mostly dimpled ductile fracture is observed.
Metals 09 01080 g007aMetals 09 01080 g007b
Figure 8. Indicative load—extension curves for longitudinal (solid lines) and transverse (dashed lines) bend tests for 2.9- and 3.2-mm thick samples.
Metals 09 01080 g008
Figure 9. Bent specimens with tests being interrupted at 10% load drop, optical micrographs, polarized light illumination. Cross-section transverse to bending line showing roughening of the outer surface, shear bands formation and intergranular cracking initiation. (a) Sample 2.9 mm thickness (transverse test), (b) sample 2.9 mm thickness (longitudinal test), (c) sample 3.2 mm thickness (transverse test) and (d) sample 3.2 mm thickness (longitudinal test).
Metals 09 01080 g009
Figure 10. (a) Macroscopic image of bent specimen sample with 2.9 mm thickness (end of bending test at 10% load drop, transverse bend test with bend line parallel to extrusion direction). (b) Optical micrograph, cross-section A-A΄ showing heavy, partly intergranular cracking on the surface. (c,d) SEM micrographs, grain boundary debonding and rupture. (e) Macrograph, end of bending test at 180 degrees.
Metals 09 01080 g010aMetals 09 01080 g010b
Figure 11. (a) Macroscopic image of bent specimen sample with 2.9 mm thickness (end of bending test at 10% load drop, longitudinal bend test with bend line transverse to extrusion direction). (b) Optical micrograph, cross-section B-B΄ showing mainly intergranular cracking on the surface. (c,d) SEM micrographs, grain boundary debonding and rupture. (e) Macrograph, end of bending test at 180 degrees.
Metals 09 01080 g011aMetals 09 01080 g011b
Figure 12. (a) Macroscopic image of bent specimen sample with 3.2 mm thickness (end of bending test at 10% load drop, transverse bend test with bend line parallel to extrusion direction). (b) Optical micrograph, cross-section C-C΄ showing partly intergranular cracking on the surface. (c,d) SEM micrographs, grain boundary debonding and rupture. (e) Macrograph, end of bending test at 180 degrees.
Metals 09 01080 g012
Figure 13. (a) Macroscopic image of bent specimen sample with 3.2 mm thickness (end of bending test at 10% load drop, longitudinal bend test with bend line transverse to extrusion direction). (b) Optical micrograph, cross-section D-D΄ showing partly intergranular cracking on the surface. (c,d) SEM micrographs, grain boundary debonding and rupture. (e) Macrograph, end of bending test at 180 degrees.
Metals 09 01080 g013
Figure 14. Grain structure derived by electron backscatter diffraction (EBSD): (a) 2.9 mm thickness sample and (b) 3.2 mm thickness sample. The grain structure was finer in 3.2 mm sample in the middle of the section, but also on the surface region.
Metals 09 01080 g014
Figure 15. Taylor factor maps, secondary recrystallization was observed in 2.9 mm thick sample (a). Arrows indicate areas that exhibit anisotropic response to deformation and high stress concentration (a) sample with 2.9 mm thickness, (b) sample with 3.2 mm thickness. More prone to crack initiation are boundaries between blue and red colored grains.
Metals 09 01080 g015
Figure 16. Mid-thickness cross-section Von Mises stress fields (units in MPa): (a) Load aligned with extrusion direction and (b) load transverse to extrusion direction. The particle positions are given as reference.
Metals 09 01080 g016
Figure 17. Comparison between the induced stress fields of “P6” and “P8” (units in MPa): (a) first loading scenario and (b) second loading scenario.
Metals 09 01080 g017
Figure 18. Comparison between the induced stress fields of “P3” and “P7” (units in MPa): (a) first loading scenario and (b) second loading scenario.
Metals 09 01080 g018
Table 1. Mechanical properties used in the FE models.
MaterialDensity (kg/m3)Young’s Modulus (GPa)Poisson’s RatioYield Strength—YS (MPa)Tensile Strength—TS (MPa)Tangent Modulus (MPa)
Al 60632700700.33234272680.85
Particle material3580 [18]139.2 [21]0.31496 [21]2700 [18,19]--
Table 2. Tensile tests results (mean and standard deviation of ten measurements).
YS (MPa)TS (MPa) Percentage Elongation at Fracture (%)
2.9 mm3.2 mm2.9 mm3.2 mm2.9 mm3.2 mm
239 ± 14229 ± 9271 ± 2261 ± 110.3 ± 0.6
(95% Confidence level = ±1.2%)
12.0 ± 0.7
(95% Confidence level = ±1.4%)
Table 3. Results of bending tests (three tests in every category). Tests were interrupted at 10% load drop.
Longitudinal TestsTransverse Tests
2.9 mm wall thickness3.2 mm wall thickness2.9 mm wall thickness3.2 mm wall thickness
Bending Angle (o)Max Load (N)Bending Angle (o)Max Load (N)Bending Angle (o)Max Load (N)Bending Angle (o)Max Load (N)
102334010237259638201154830
Table 4. Stress concentration factors (K).
Stress FieldsLoading Scenario 1Loading Scenario 2
Majority of observed stress fields1.07–1.231.00–1.13
Maximum valued stress fields1.27–1.401.13–1.23

