Mechanical Properties and Microstructure Characterization of AISI “D2” and “O1” Cold Work Tool Steels


Mechanical Engineering Department, Faculty of Engineering, King Abdulaziz University, P.O. box 344, Rabigh 21911, Saudi Arabia
Metals 2019, 9(11), 1169; https://doi.org/10.3390/met9111169
Submission received: 25 September 2019
/
Revised: 27 October 2019
/
Accepted: 28 October 2019
/
Published: 30 October 2019
(This article belongs to the Special Issue Mechanical Properties and Microstructure of Forged Steel)
Abstract
:This research analyzes the mechanical properties and fracture behavior of two cold work tool steels: AISI “D2” and “O1”. Tool steels are an economical and efficient solution for manufacturers due to their superior mechanical properties. Demand for tool steels is increasing yearly due to the growth in transportation production around the world. Nevertheless, AISI “D2” and “O1” (locally made) tool steels behave differently due to the varying content of their alloying elements. There is also a lack of information regarding their mechanical properties and behavior. Therefore, this study aimed to investigate the plasticity and ductile fracture behavior of “D2” and “O1” via several experimental tests. The tool steels’ behavior under monotonic quasi-static tensile and compression tests was analyzed. The results of the experimental work showed different plasticity behavior and ductile fracture among the two tool steels. Before fracture, clear necking appeared on “O1” tool steel, whereas no signs of necking occurred on “D2” tool steel. In addition, the fracture surface of “O1” tool steel showed cup–cone fracture mode, and “D2” tool steel showed a flat surface fracture mode. The dimple-like structures in scanning electron microscope (SEM) images revealed that both tool steels had a ductile fracture mode.
1. Introduction
In the machining and forming industry, tool steels were invented to increase manufacturing economic efficiency due to their enhanced mechanical properties, such as high strength, wear resistance, hardness, and toughness. Metal machining and forming are essential for metal part production in many industries. The automotive industry, for example, has experienced an increase in car production, which has led to an increase in the demand for tool steels. The same increase in demand has also been experienced in other industries, such as aerospace, transport, and precision industries. The vast increase in production has resulted in substantial growth in the metal forming industry, at a rate of 3% to the year 2019 [1]. Tool steels are categorized into six classes: cold work, hot work, shock resisting, mold, high speed, and special-purpose tool steels [2]. The most important class of all is cold work tool steels. This research investigated two types of cold work tool steel that have a high content of carbon: “D2” and “O1”. These metals are used for many types of cutting and punching tools and dies and many other applications. They have high hardness, high wear resistance, and are inexpensive [3,4,5]. Previous studies have tested the two metals to determine their wearing properties and resistance, with “O1” tool steel being found to have excellent machinability, whereas “D2” had better wearing resistance [6,7,8].
The oil-hardening “O1” cold work steel (UNS# T31501) is a low-cost metal that has high hardness and wear resistance due to the high carbon content along with moderate levels of different elements, such as chromium (Cr) and silicon (Si). The high content of Si alloy element increases machinability and die life. In addition, the existence of tungsten (W) alloy element attains high abrasion resistance and highly sharp cutting edges. Thus, this tool steel is used in surface finishing tools and woodworking knives [3,9,10,11]. The high-carbon, high-chromium AISI “D2” cold work steel (UNS# T30402) is particularly poor in terms of machinability and toughness. In the fabrication process, “D2” is highly resistant to softening and wearing, with minimal microstructure distortion and high resistance to cracking during metal formation and fabrication [12]. Therefore, in long-duration fabrication processes, “D2” is preferable for manufacturers. In addition, “D2” tool steel is heavily used in piercing punches and dies, forging operations, and trimming tools due to its high wear resistance [9,13,14,15]. Moreover, it is generally known that “D2” tool steel is difficult to weld (nonweldable), and it is particularly hard to attain a high-quality welded joint by conventional welding methods due to its high carbon content and significant amount of carbides. A recent study [16] proposed a novel thixowelding technology for joining “D2” steels with different joining temperatures, holding time, and postweld heat treatment to investigate the joints’ mechanical and microstructural properties. The results demonstrated a significant improvement in its tensile strength for heat- vs. non-heat-treated joints. Another study [17] investigated the effect of post-tempering cryogenic treatment on the mechanical properties of “D2” tool steel. The results showed an improvement in fracture toughness, reduction in residual stresses, and no change in hardness and modulus values.
In the present study, the characteristics of mechanical properties are reported. Tensile strength, compression strength, hardness, elongation at fracture, and reduction area at fracture in addition to the plasticity and ductile fracture behavior of two tool steel metals—AISI “D2” and “O1”—under monotonic loading conditions were investigated. Furthermore, fracture surfaces, dimensional stability, and microstructure features were studied. Optical measurements and optical microscopic investigations were also conducted.
2. Experimental Procedure
2.1. Sample Preparation
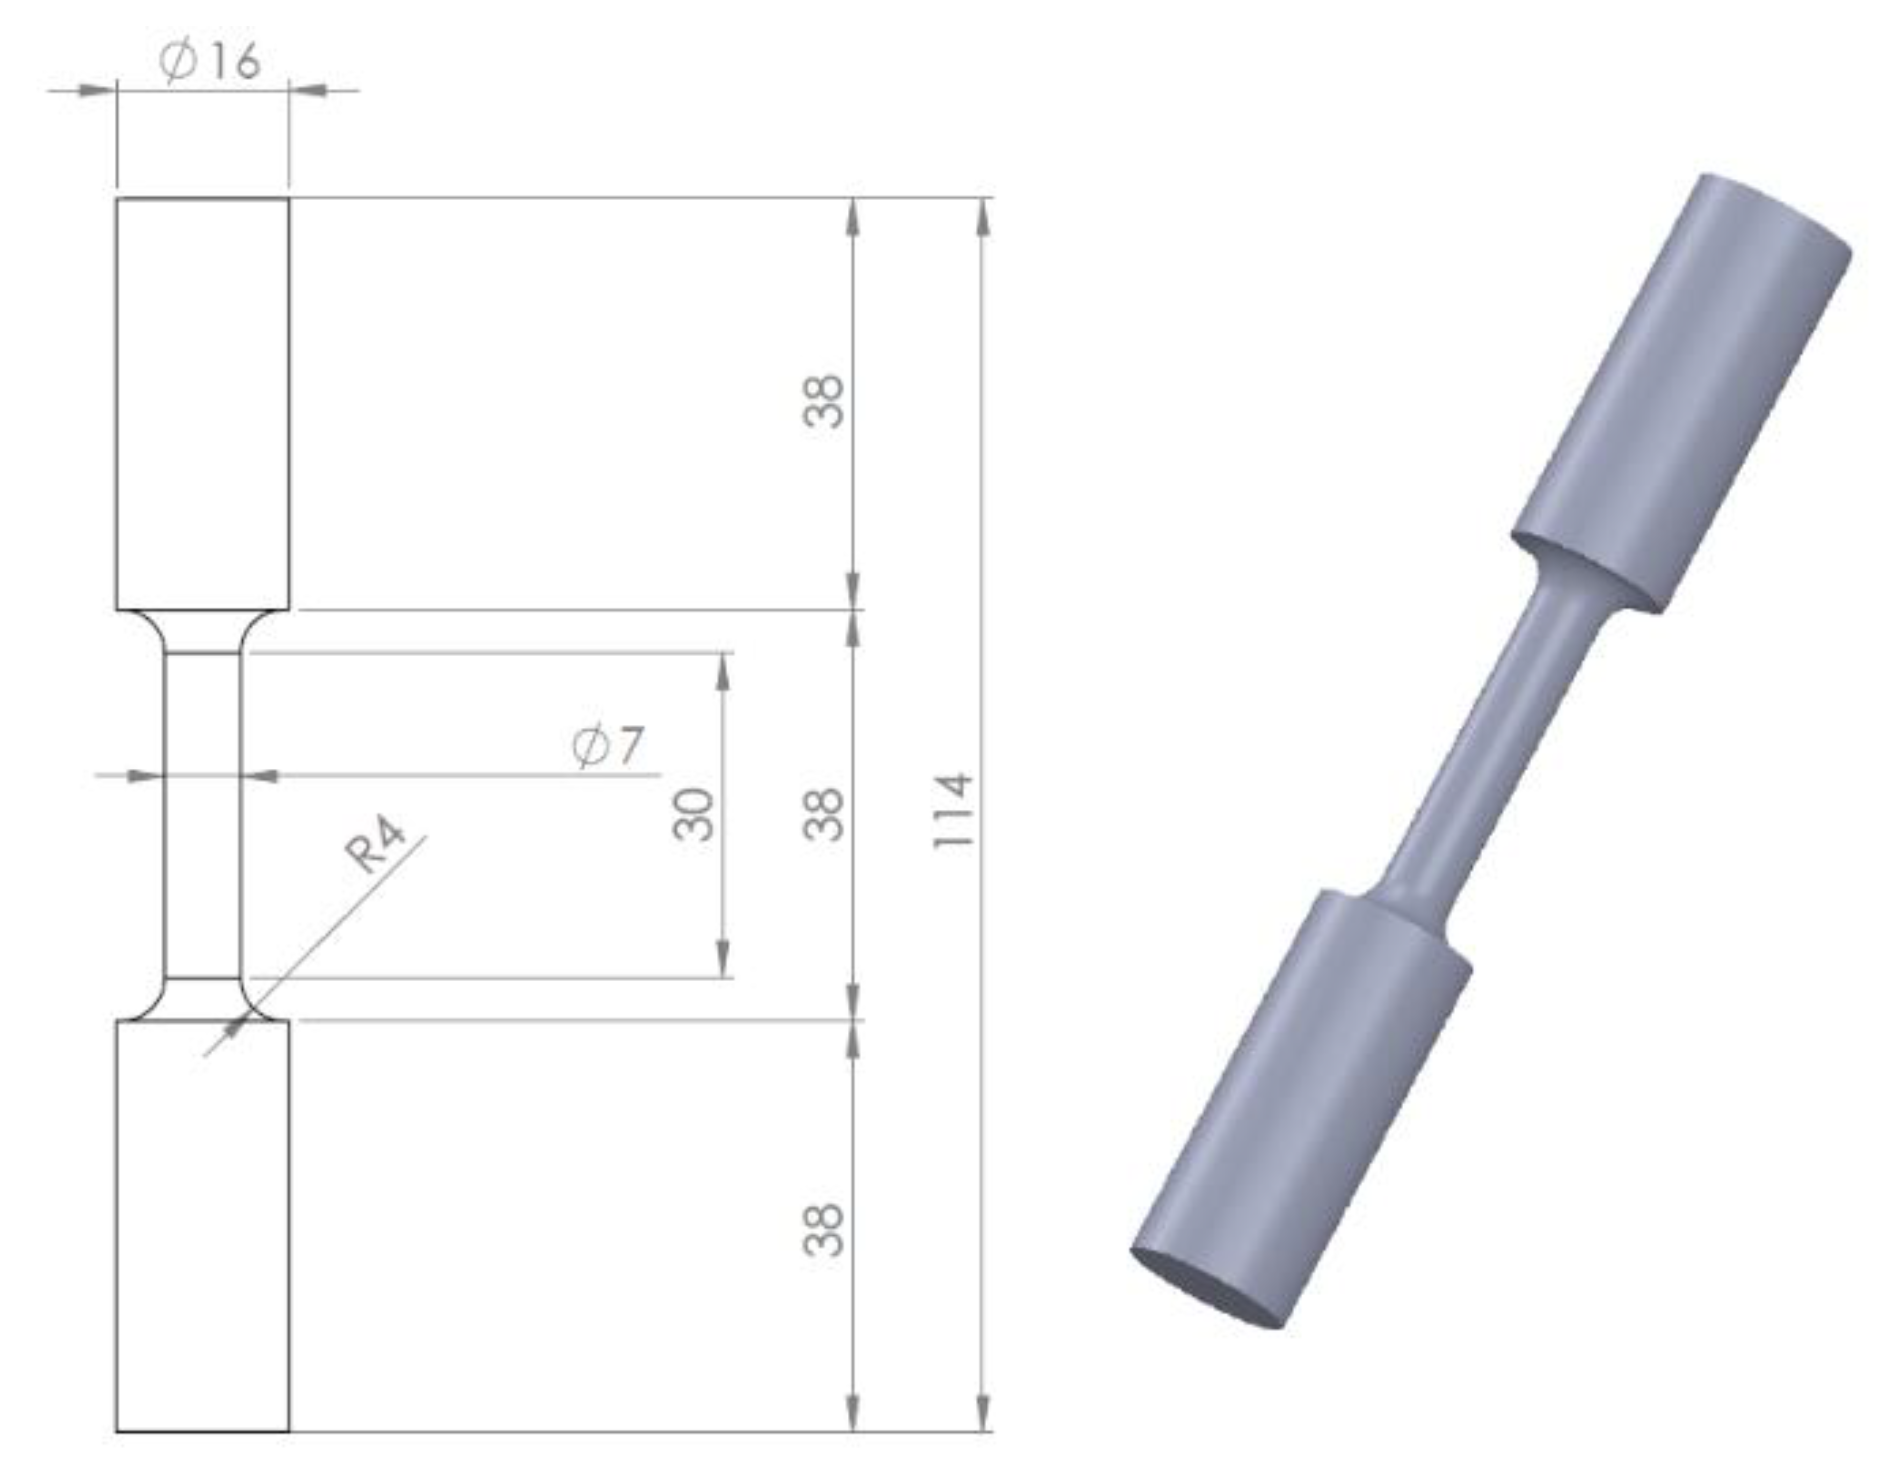
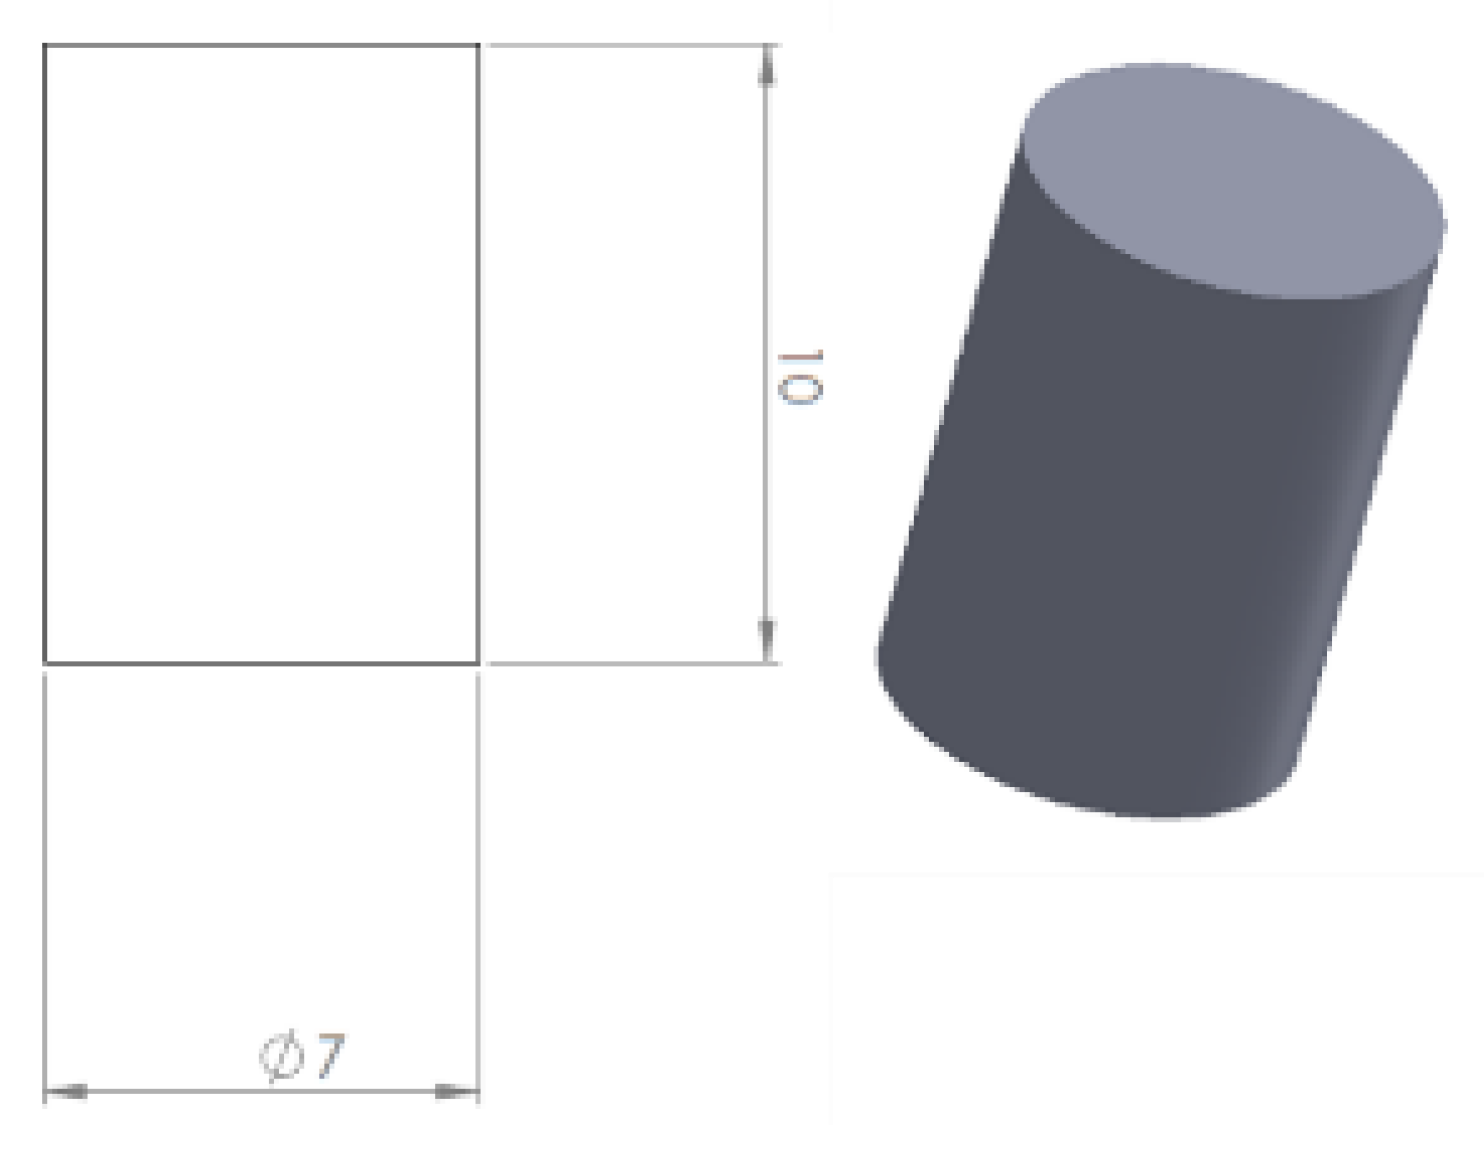
Two steel blocks of AISI “D2” and “O1” were purchased from an ASTM-certified local steel shop. The specimens were cut from the two steel blocks and were subjected to hardening and tempering heat treatment process. The tempering temperatures for “D2” and “O1” were 200 and 250 °C, respectively. The fabrication and machining of the specimens were done in two different shapes: (a) smooth round bar (Figure 1) and (b) cylindrical shape (Figure 2). The smooth round bar was designed for tensile tests, whereas the cylindrical specimen was designed for compression tests. The shape and dimensions of both specimens’ geometry are shown in mm in Figure 1 and Figure 2. Note that the smooth round bar and cylinder specimens of similar metals were machined from one steel block to ensure similarity in properties. The number of repetitions of each test was two; hence, a total of two tensile tests and two compression tests for each metal were carried out. The chemical compositions of AISI “D2” and “O1” are shown in Table 1. In addition, the critical and austenization temperatures are listed in Table 2.
2.2. Experiments
The load frame used was a servohydrolic testing machine manufactured by MTS systems corporations® in Eden Prairie, MN, USA with a 100 kN loading cell of tension and compression force limit. The tests were conducted at room temperature with a strain rate of 0.005 mm/s. The strain reading was captured and recorded using an optical measurement system termed digital imaging correlation (DIC) [18]. The DIC type was VIC-2D version 5 software made by Correlated Solutions Inc® in Irmo, SC, USA. DIC requires specific preparation (painting the steel specimen) prior to testing in order to provide sufficient contrast for the camera. The specimens were sprayed in white and spackled in black to create a fine contrast for the DIC to capture the strain.
3. Results and Discussion
3.1. Tensile and Compression Tests
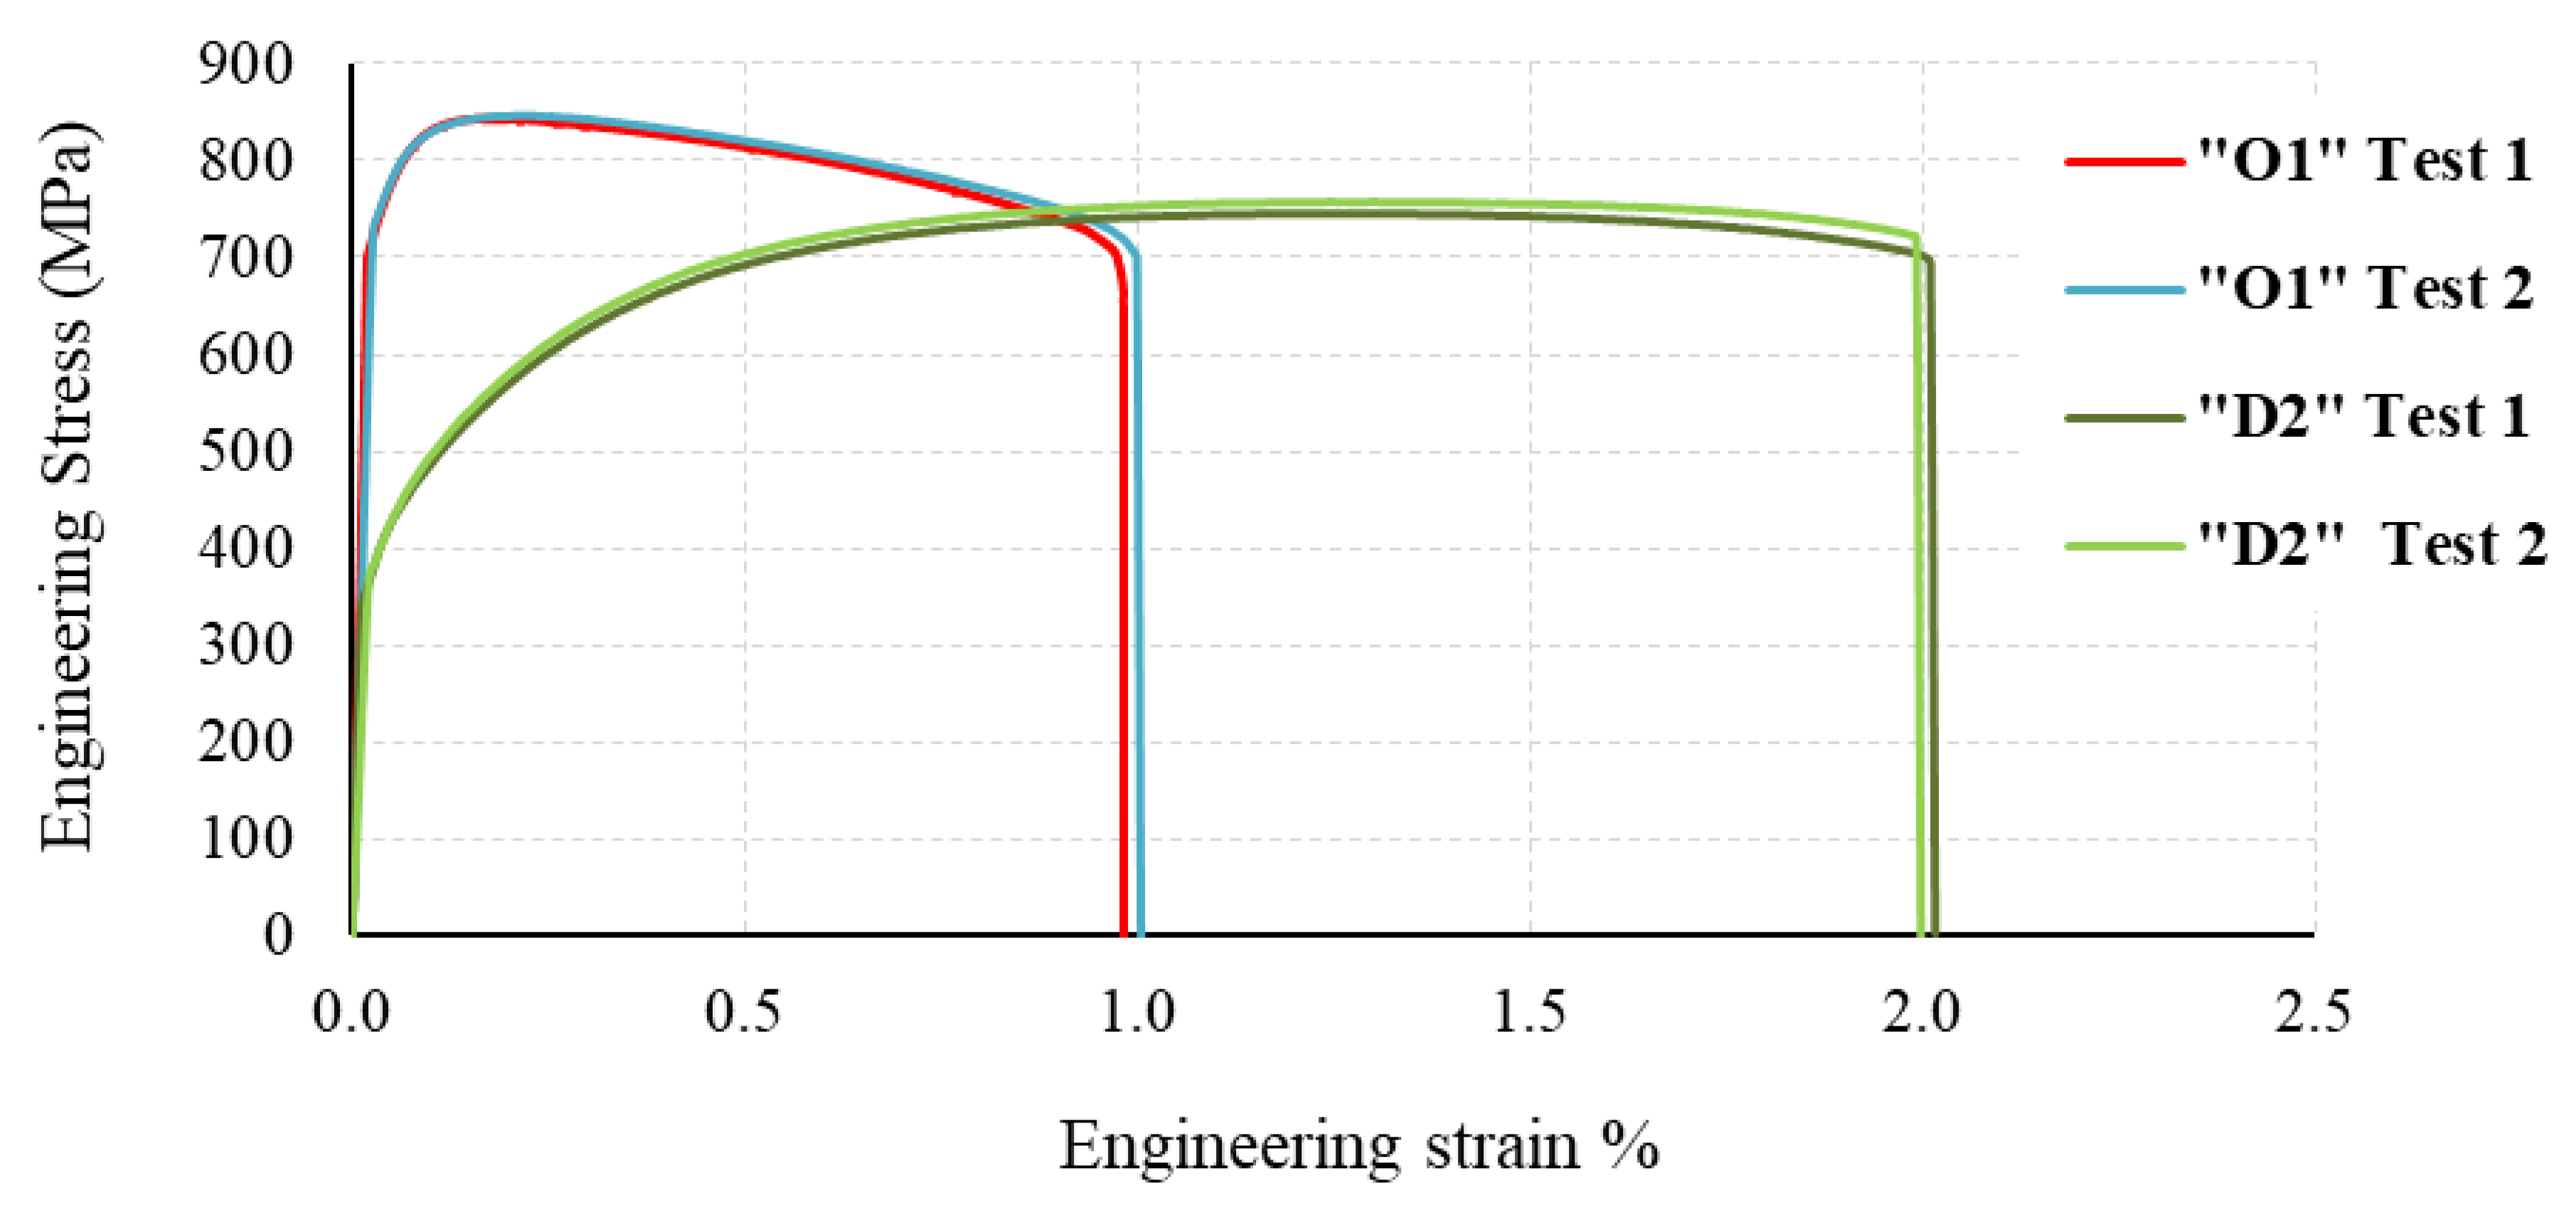
The engineering stress–strain flow performance (total elongation and tensile strength) of “D2” and “O1” subjected to tensile tests at room temperature are shown in Figure 3. The yield strength of “D2” and “O1” and other basic mechanical properties are listed in Table 3. The modulus of toughness (tensile toughness), fracture strength, fracture length, fracture strain, and gauge length are all shown in Table 4. The differences in content of the alloying elements in “D2” and “O1” tool steels changed the behavior of the stress–strain flow. For example, the higher ductility and toughness of “D2” over “O1” tool steels were due to the high content of molybdenum (Mo), vanadium (V), and Cr. On the other hand, the higher yield tensile strength and ultimate tensile strength (UTS) of “O1” compared to “D2” tool steels were due to the increased content of tungsten and manganese (Mn). The “D2” steel behavior under monotonic loading showed particularly high hardening and substantially low softening due to the high content of Mo and Cr. The range of hardness for “O1” and “D2” steels was 56–58 and 60–62 HRC, respectively. Note that all data reported are the mean value of many testing points for each specimen.
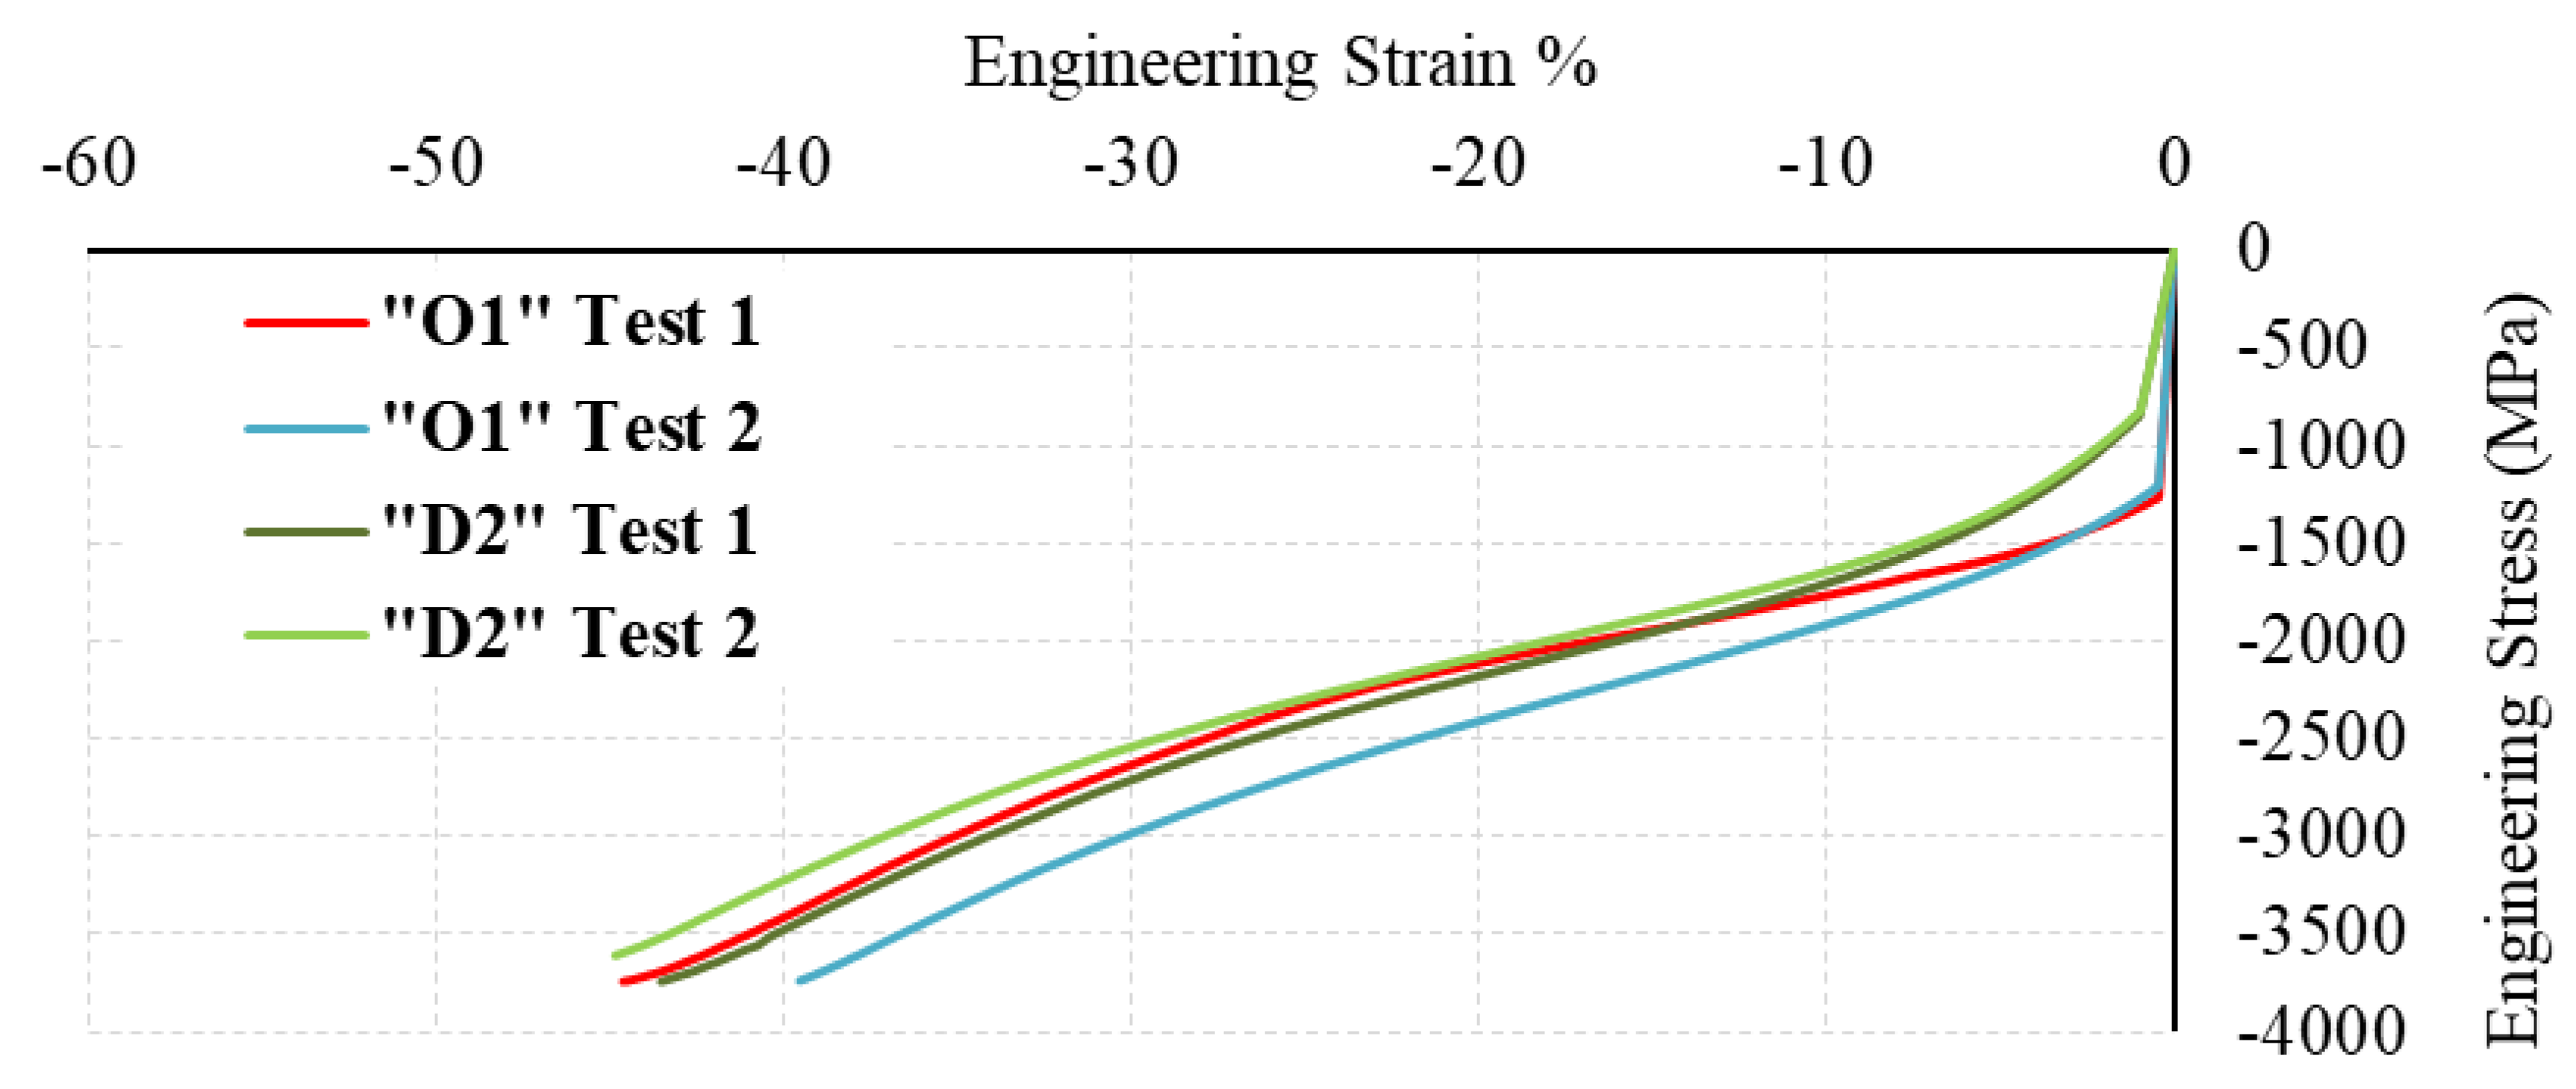
In contrast, the “O1” steel behavior under monotonic loading showed a highly narrow strain range during hardening (before UTS) and a higher range of strain in softening (beyond UTS). The high amount of metal softening during the tensile strength was seen during the experimental test in the form of necking before fracture. The compression stress–strain flow is shown in Figure 4. The cylinder specimens were compressed to approximately −90 kN (load cell maximum capacity is ±100 kN) at a strain rate of 0.005 mm/s while the strain flow was captured. The modulus of elasticity and compression yield of “O1” steel was higher than “D2” steel. The compression plasticity flow, shown in Figure 4, increased as the stresses increased due to the geometry change in the cylinder specimen.
Another observation is related to the necking behavior of both tool steels. The significant necking before fracture (Figure 5) of “O1” steel was represented in the form of softening beyond the UTS. The calculated area reduction at fracture was almost 20%. However, “D2” tool steel showed almost no necking prior to fracture (Figure 6).
3.2. Fracture of Specimens
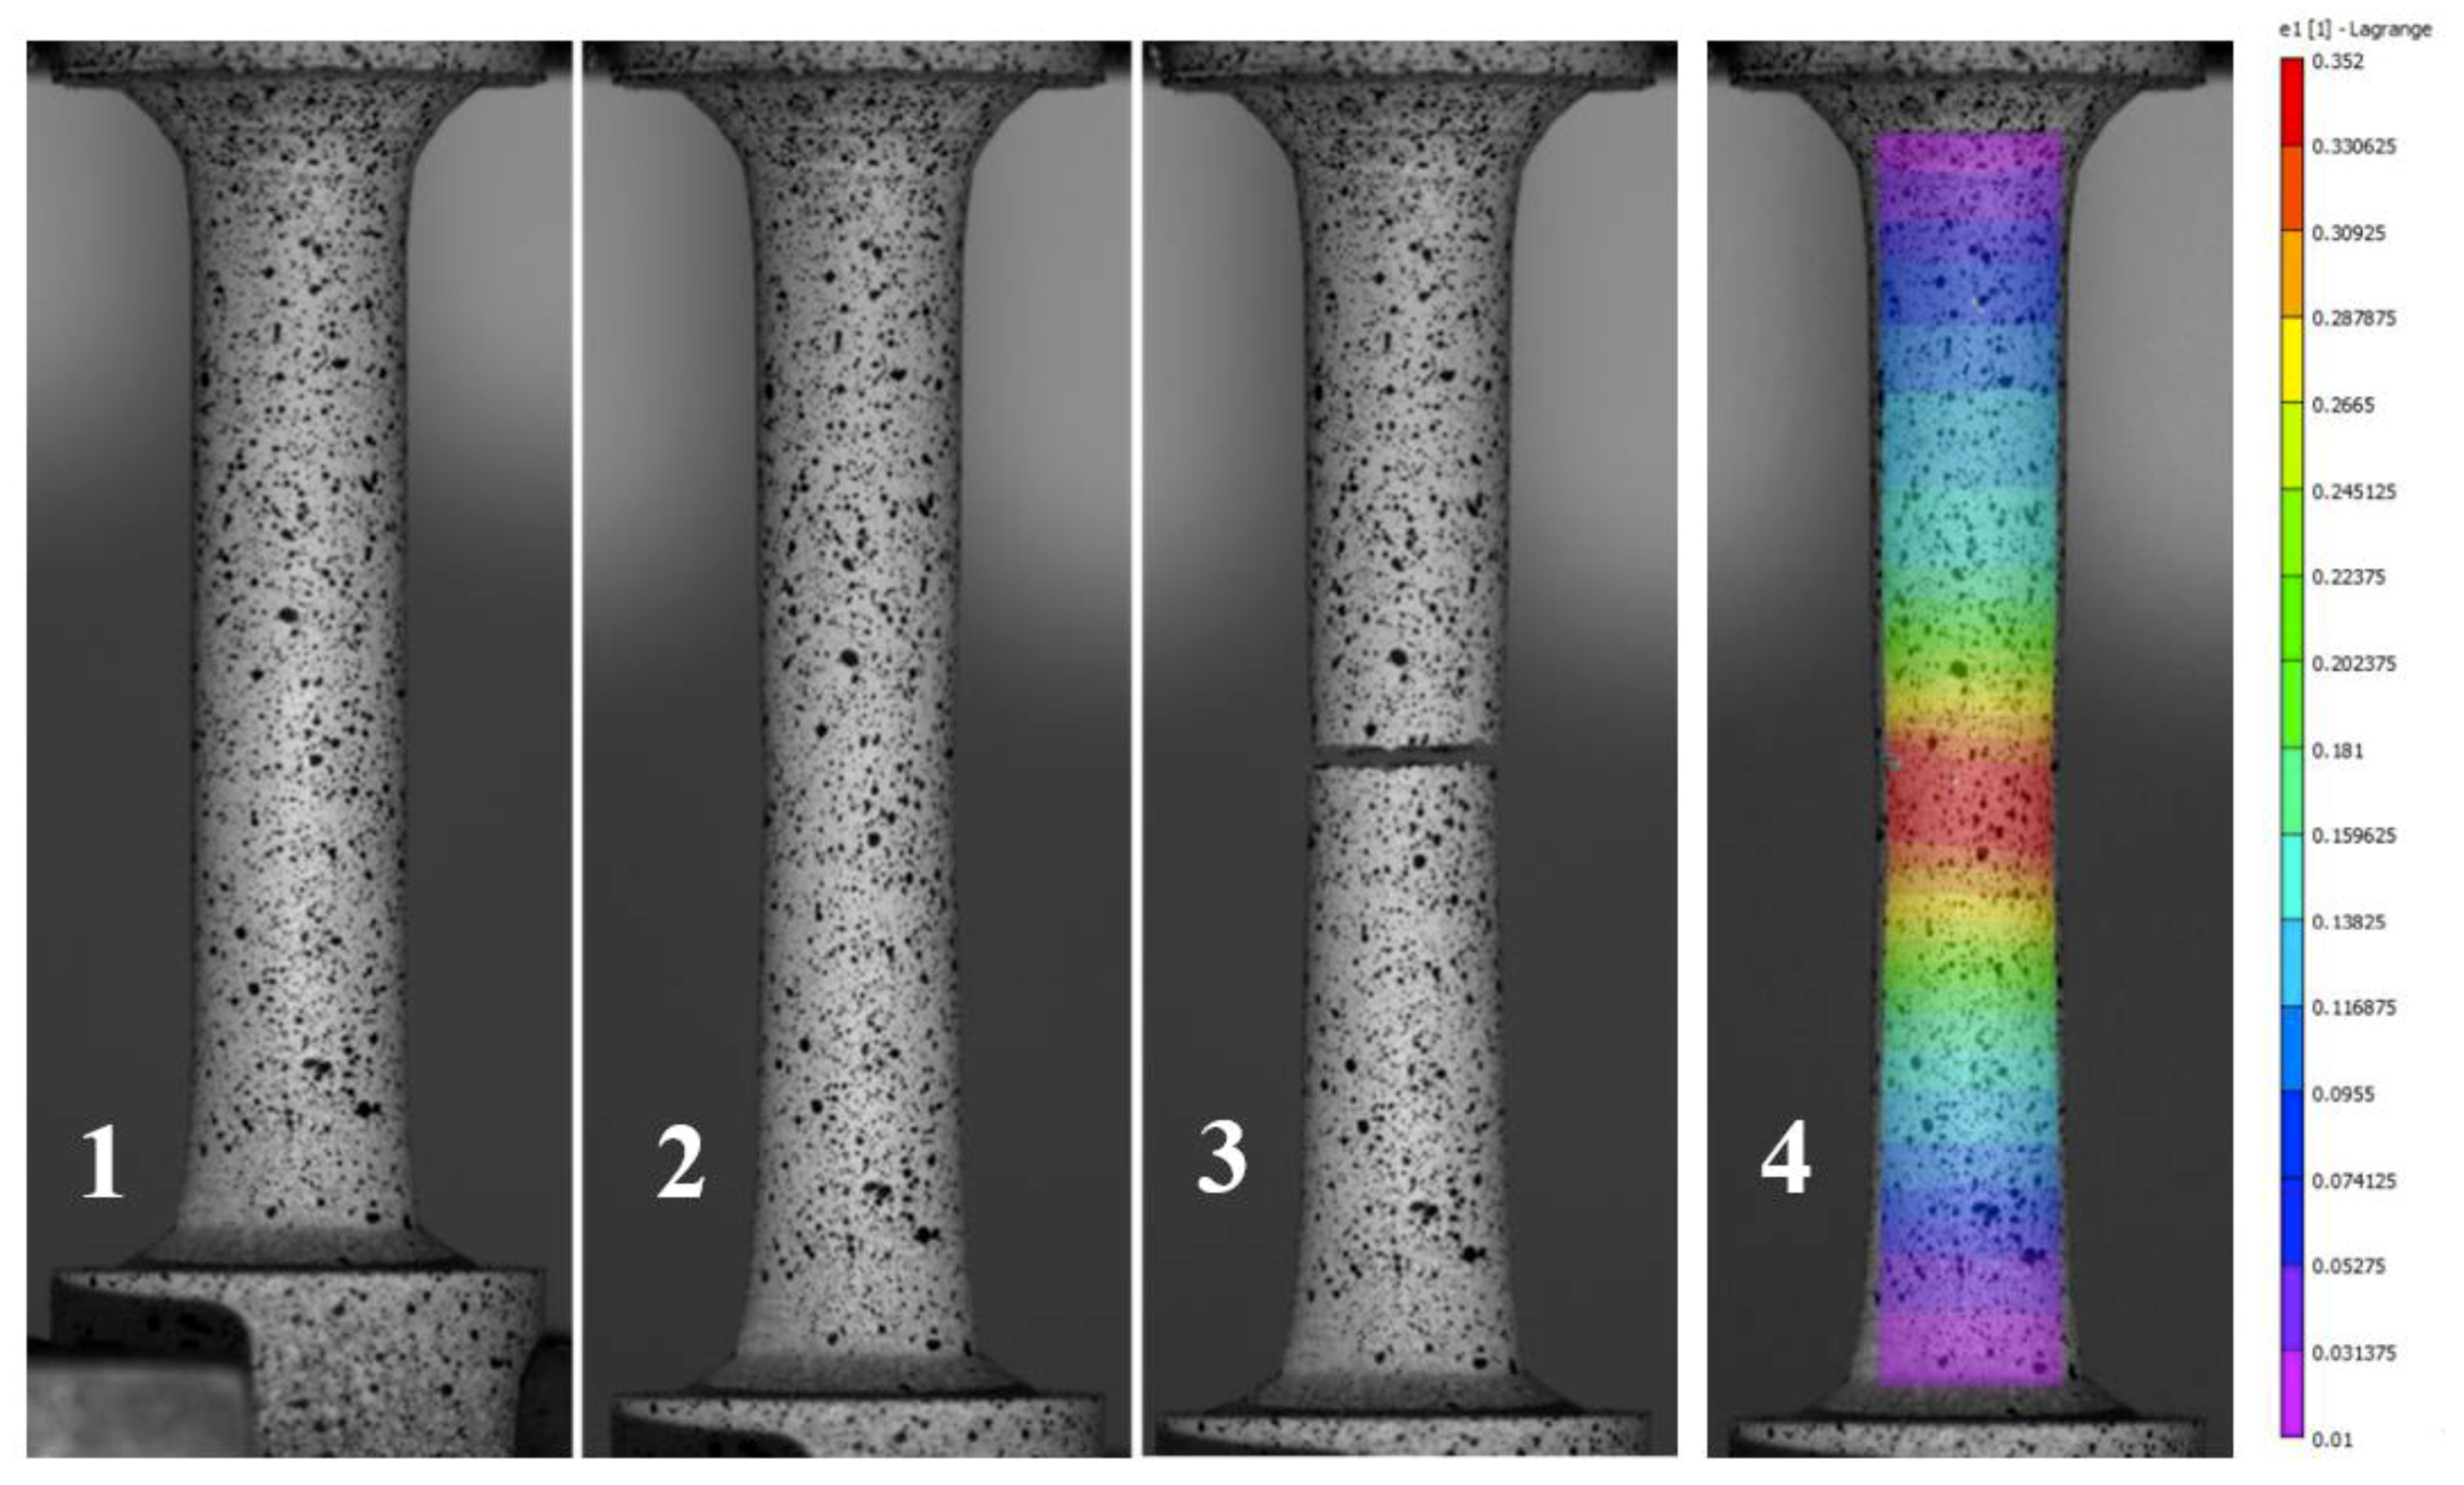
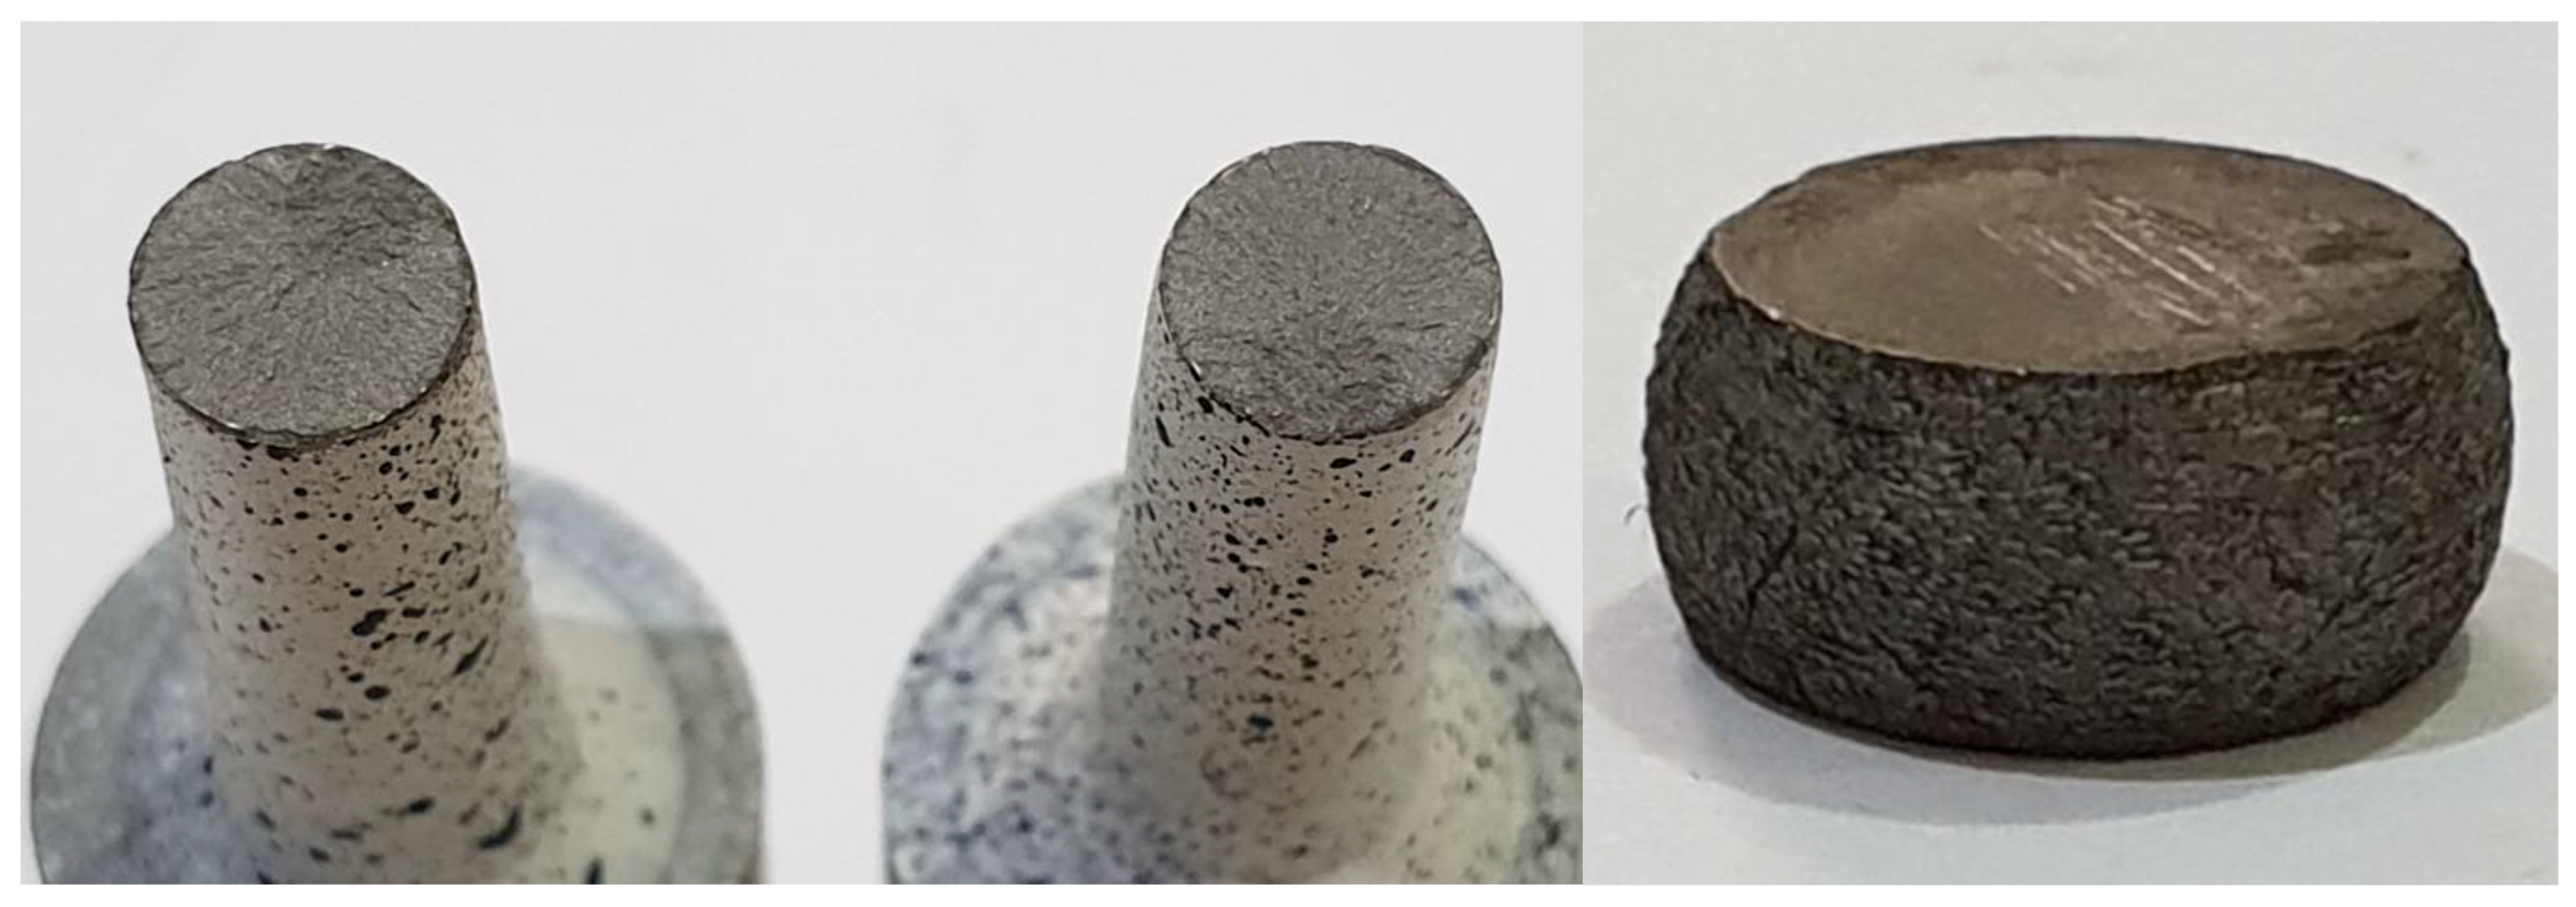
The “D2” tool steel specimen subjected to tensile loadings is shown in Figure 6. The images depict the sequential deformation process as a result of the tensile loading process. The testing specimen setting was set initially as in Figure 6(1). This image can be used as a reference for comparison. The maximum elongation is shown in Figure 6(2), where necking prior to fracture can hardly be seen. Based on the stress–strain curve of “O1” tool steel, shown in Figure 3, this type showed almost no softening behavior post UTS point, which explains the negligible necking behavior during the experiment. The crack initiated and instantly propagated toward the outer radius, similar to the “O1” tool steel specimen (Figure 6(3)). The strain measurements an instant before fracture are shown in Figure 6(4) with the use of DIC. DIC can also predict the crack initiation location. The crack initiation location and propagation path prediction by DIC have previously been investigated and proven in many studies. [19,20,21,22]. In the case of “O1” tool steel, Figure 6(4) shows high strain concentrations (in red) that resulted in metal cracks and fracture (Figure 6(3)). The fracture location prediction agreed with the experimental results. Finally, the failure mode showed a flat fracture surface (Figure 7). It is recommended that the reader refer to [23,24] in order to understand why the fracture surface shape differs from one metal to another.
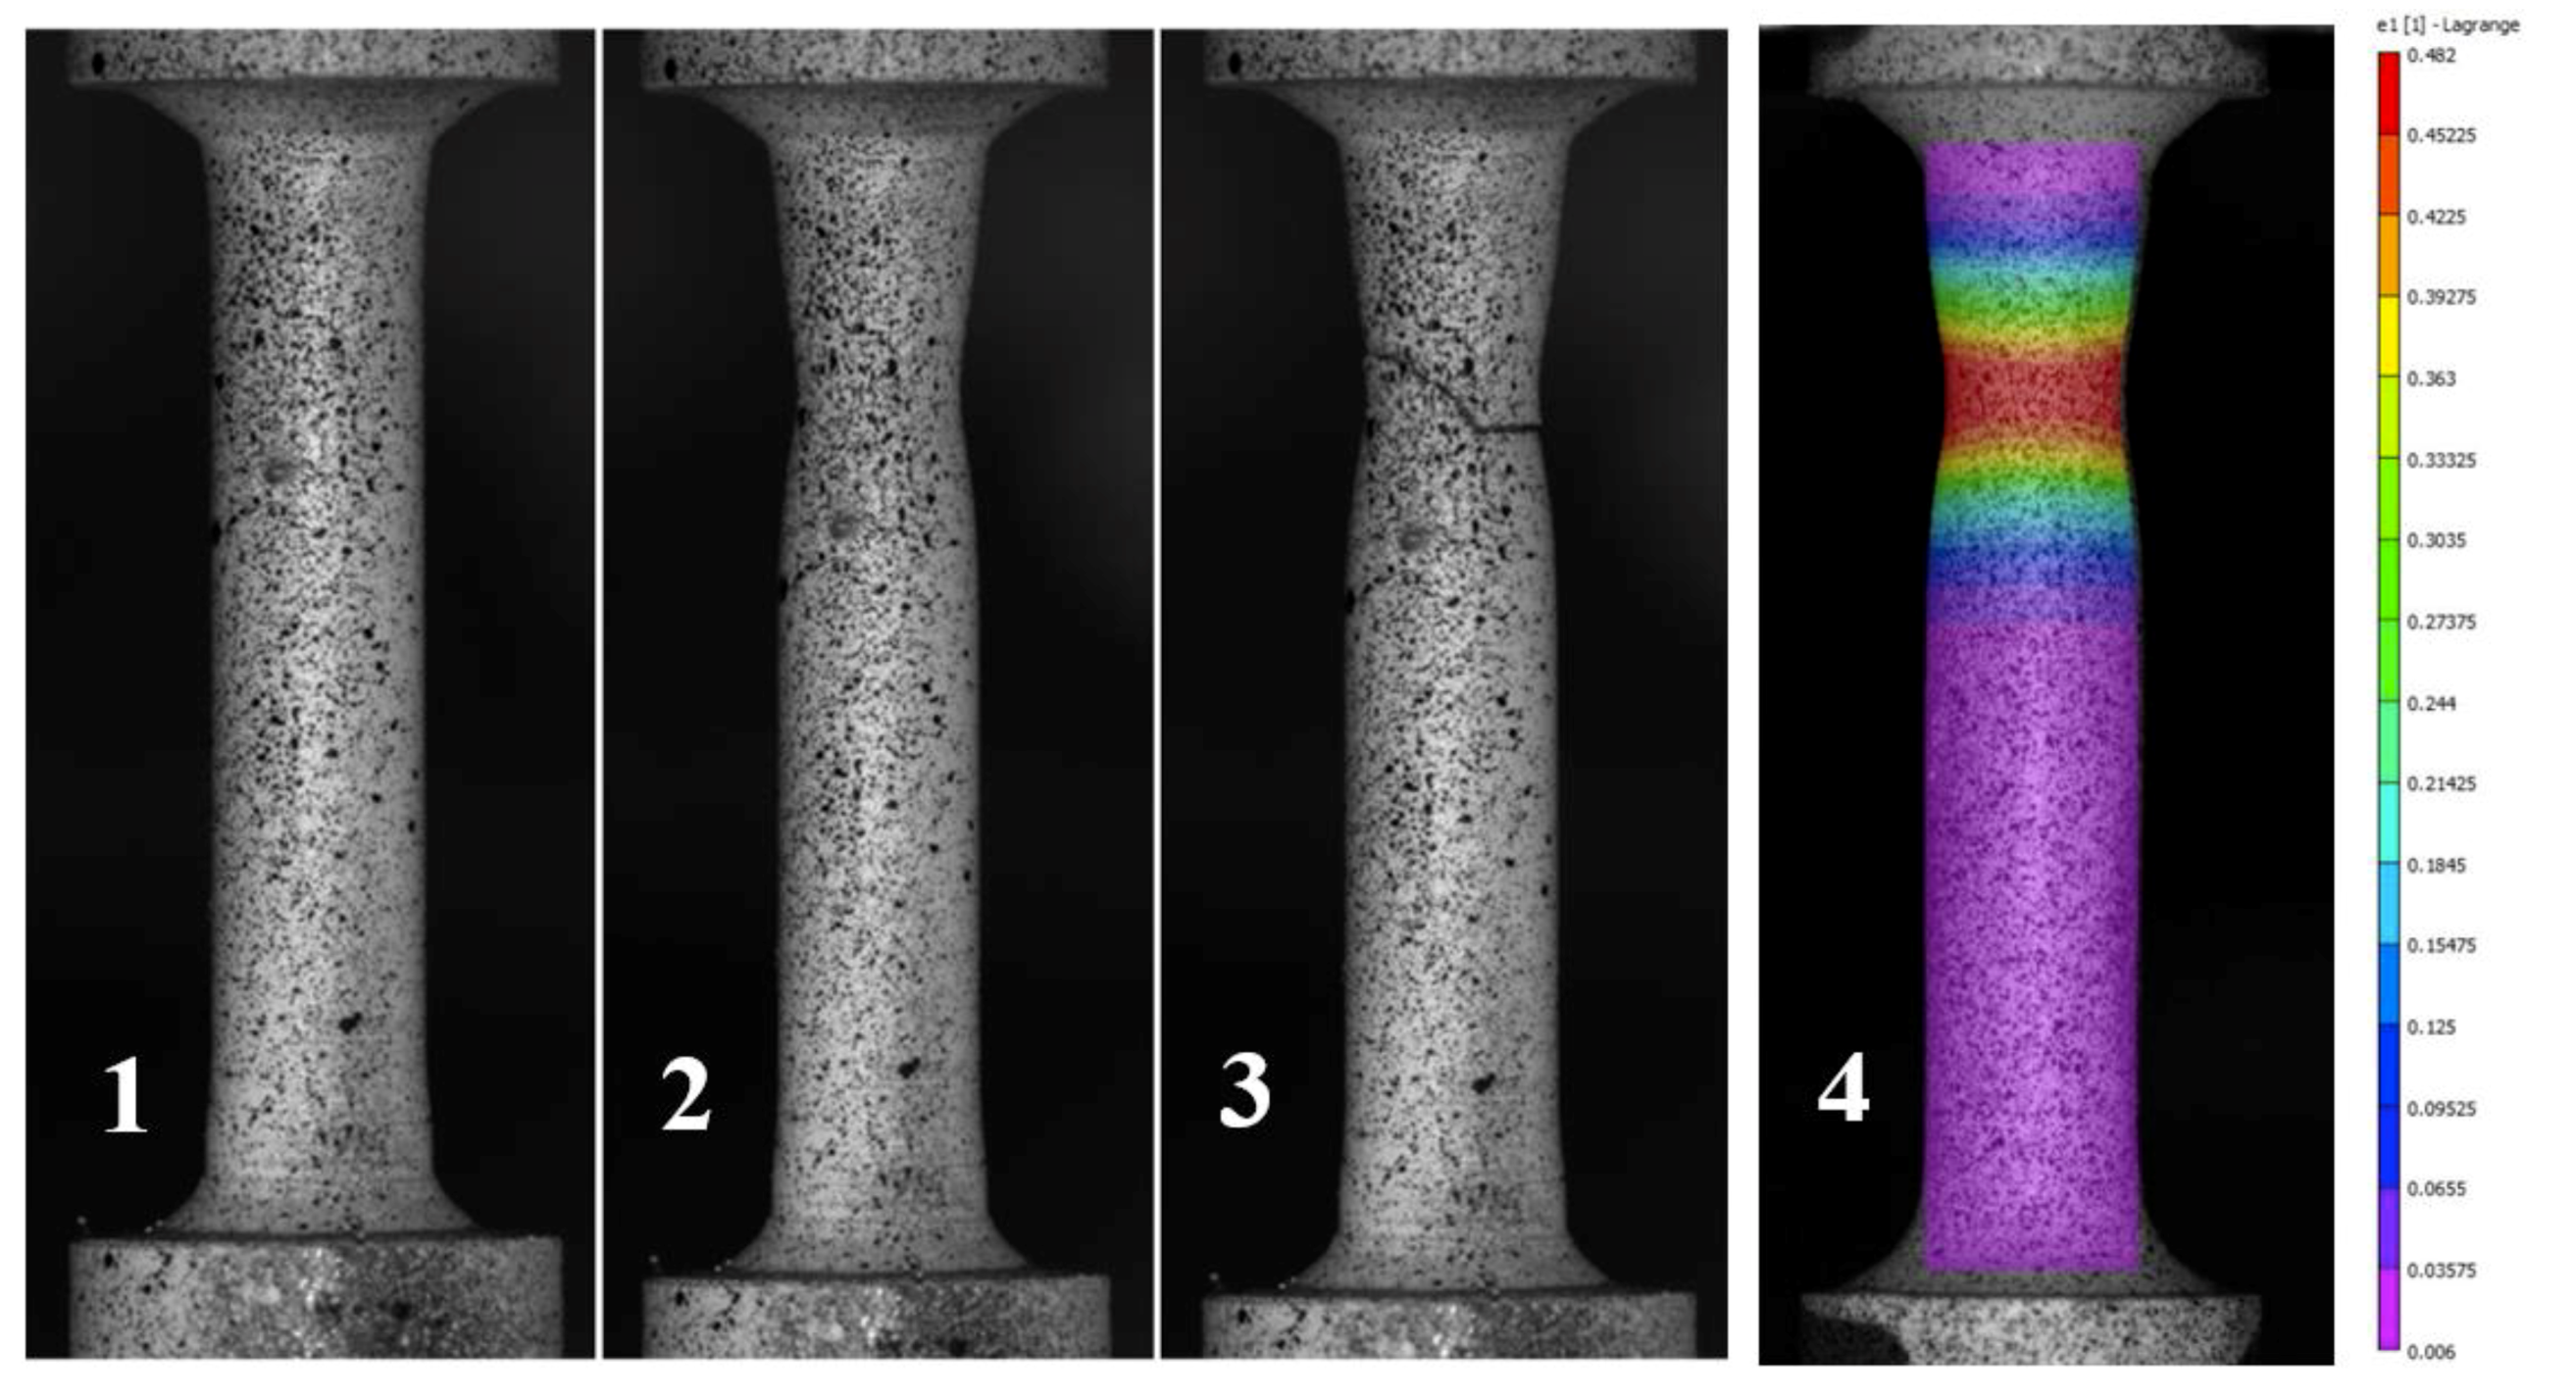
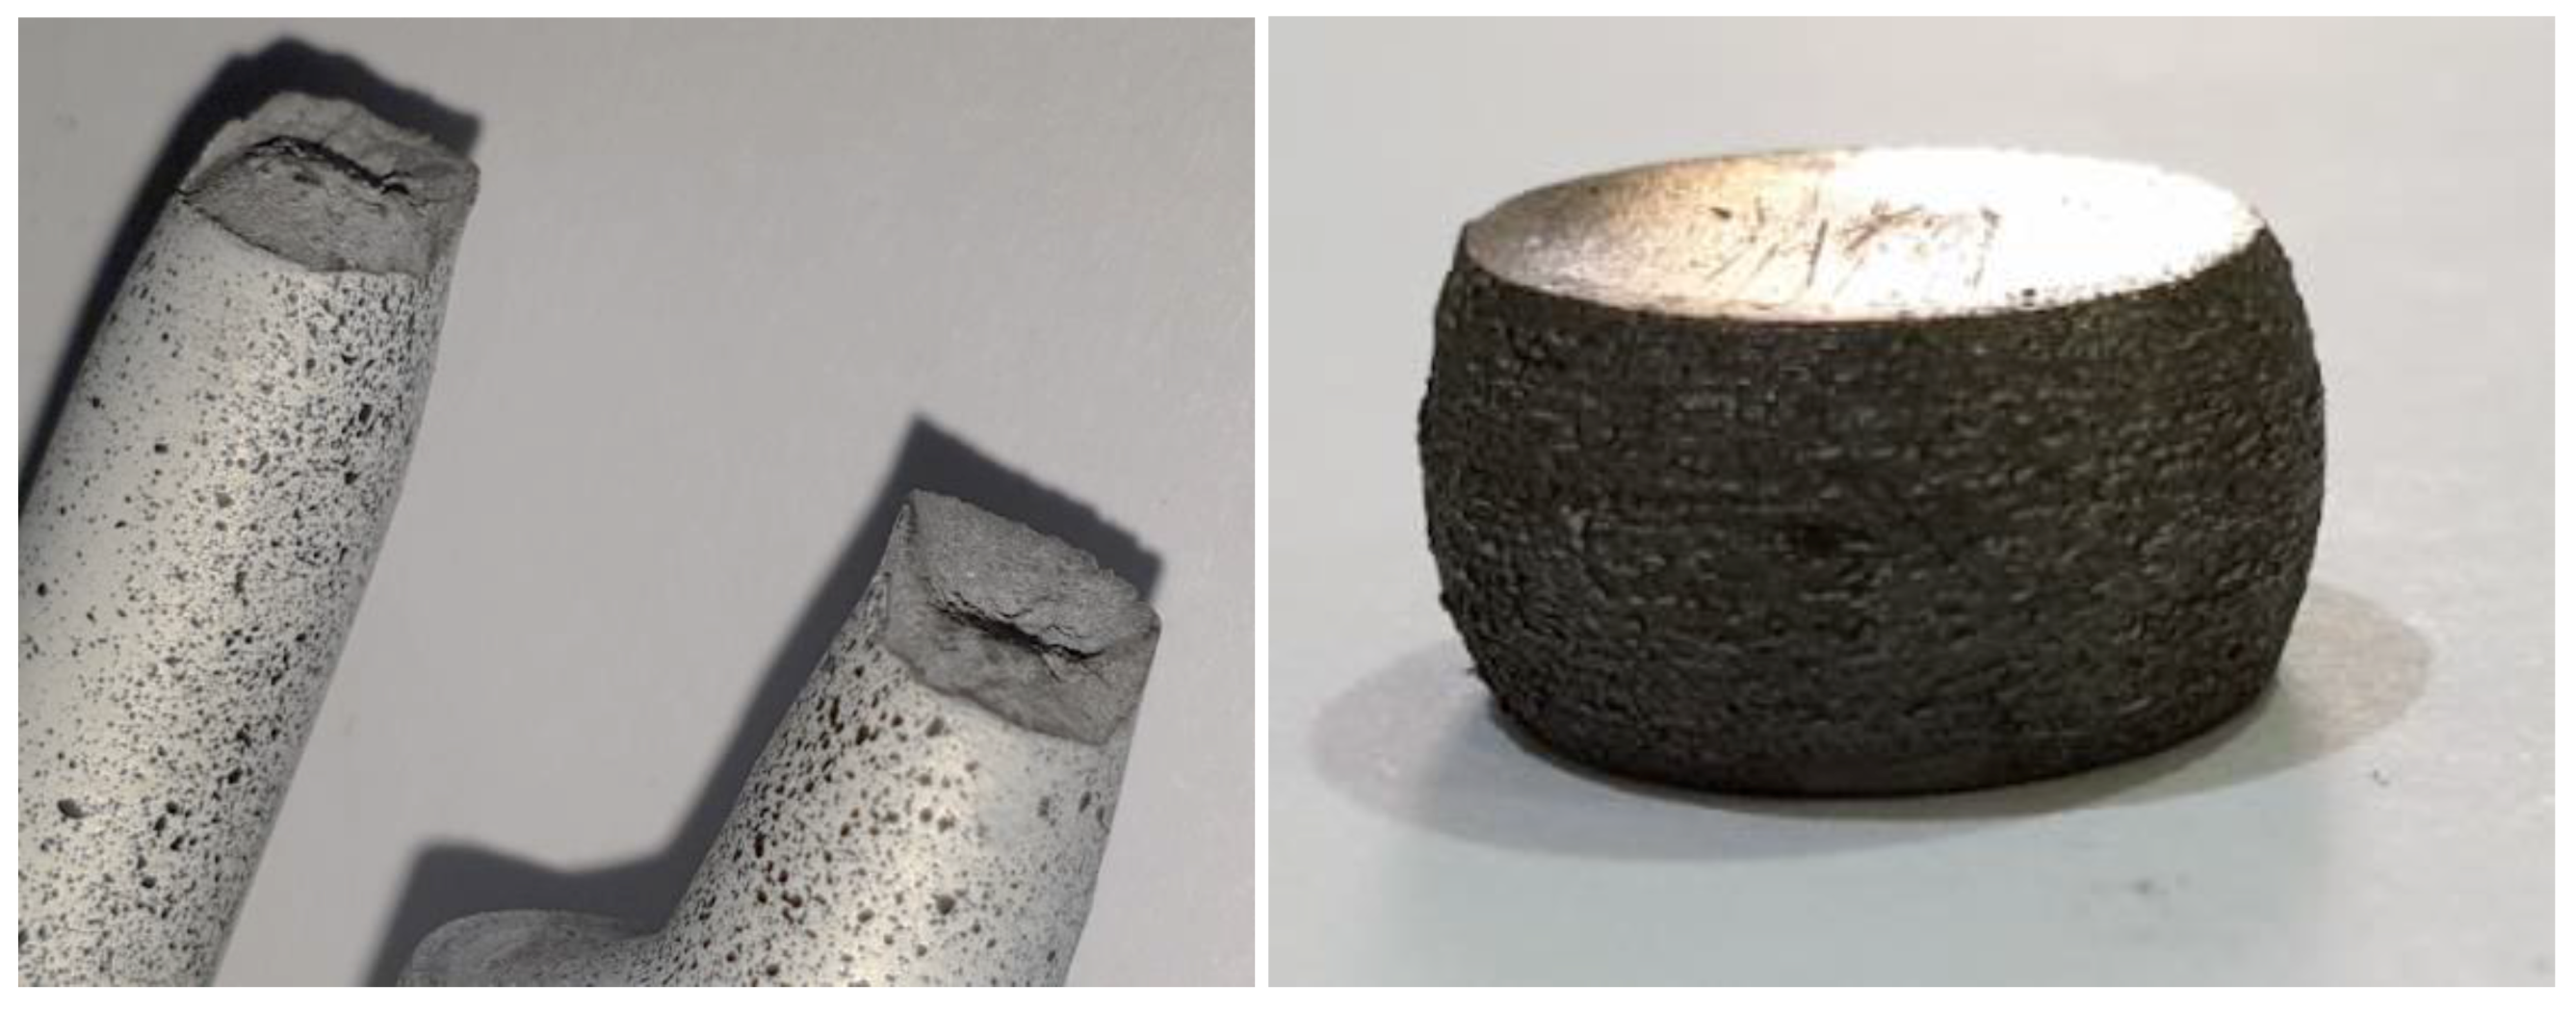
Similarly, the “O1” tool steel specimen subjected to tensile tests is shown in Figure 5. The collection of images in Figure 5 shows the deformation sequence during the loading process. Figure 5(1) shows the specimen prepared for testing before any loading was applied. This figure can be used for comparison and reference reasons. Figure 5(2) shows the specimen at its highest elongation capacity without fracturing. This moment records the maximum necking (localized area reduction) of the specimen. The necking occurred just before the crack initiated and instantly propagated toward the outer radius, causing full specimen fracture (Figure 5(3)). The color contour plot in Figure 5(4) shows the highest accumulation strain by the DIC just before the fracture occurred. The location of the highest accumulation strain is at the center of the necking area, colored in red. The crack initiation and propagation that appear in Figure 5(3) coincide with the high strain’s measurement location developed due to tensile loading in Figure 5(4). In both metals, the crack location prediction by DIC was in good agreement with the experiment results. Finally, the failure mode of the fracture surface on “O1” tool steel under tensile loading showed a cup–cone-like fracture pattern (Figure 8).
3.3. Microstructure
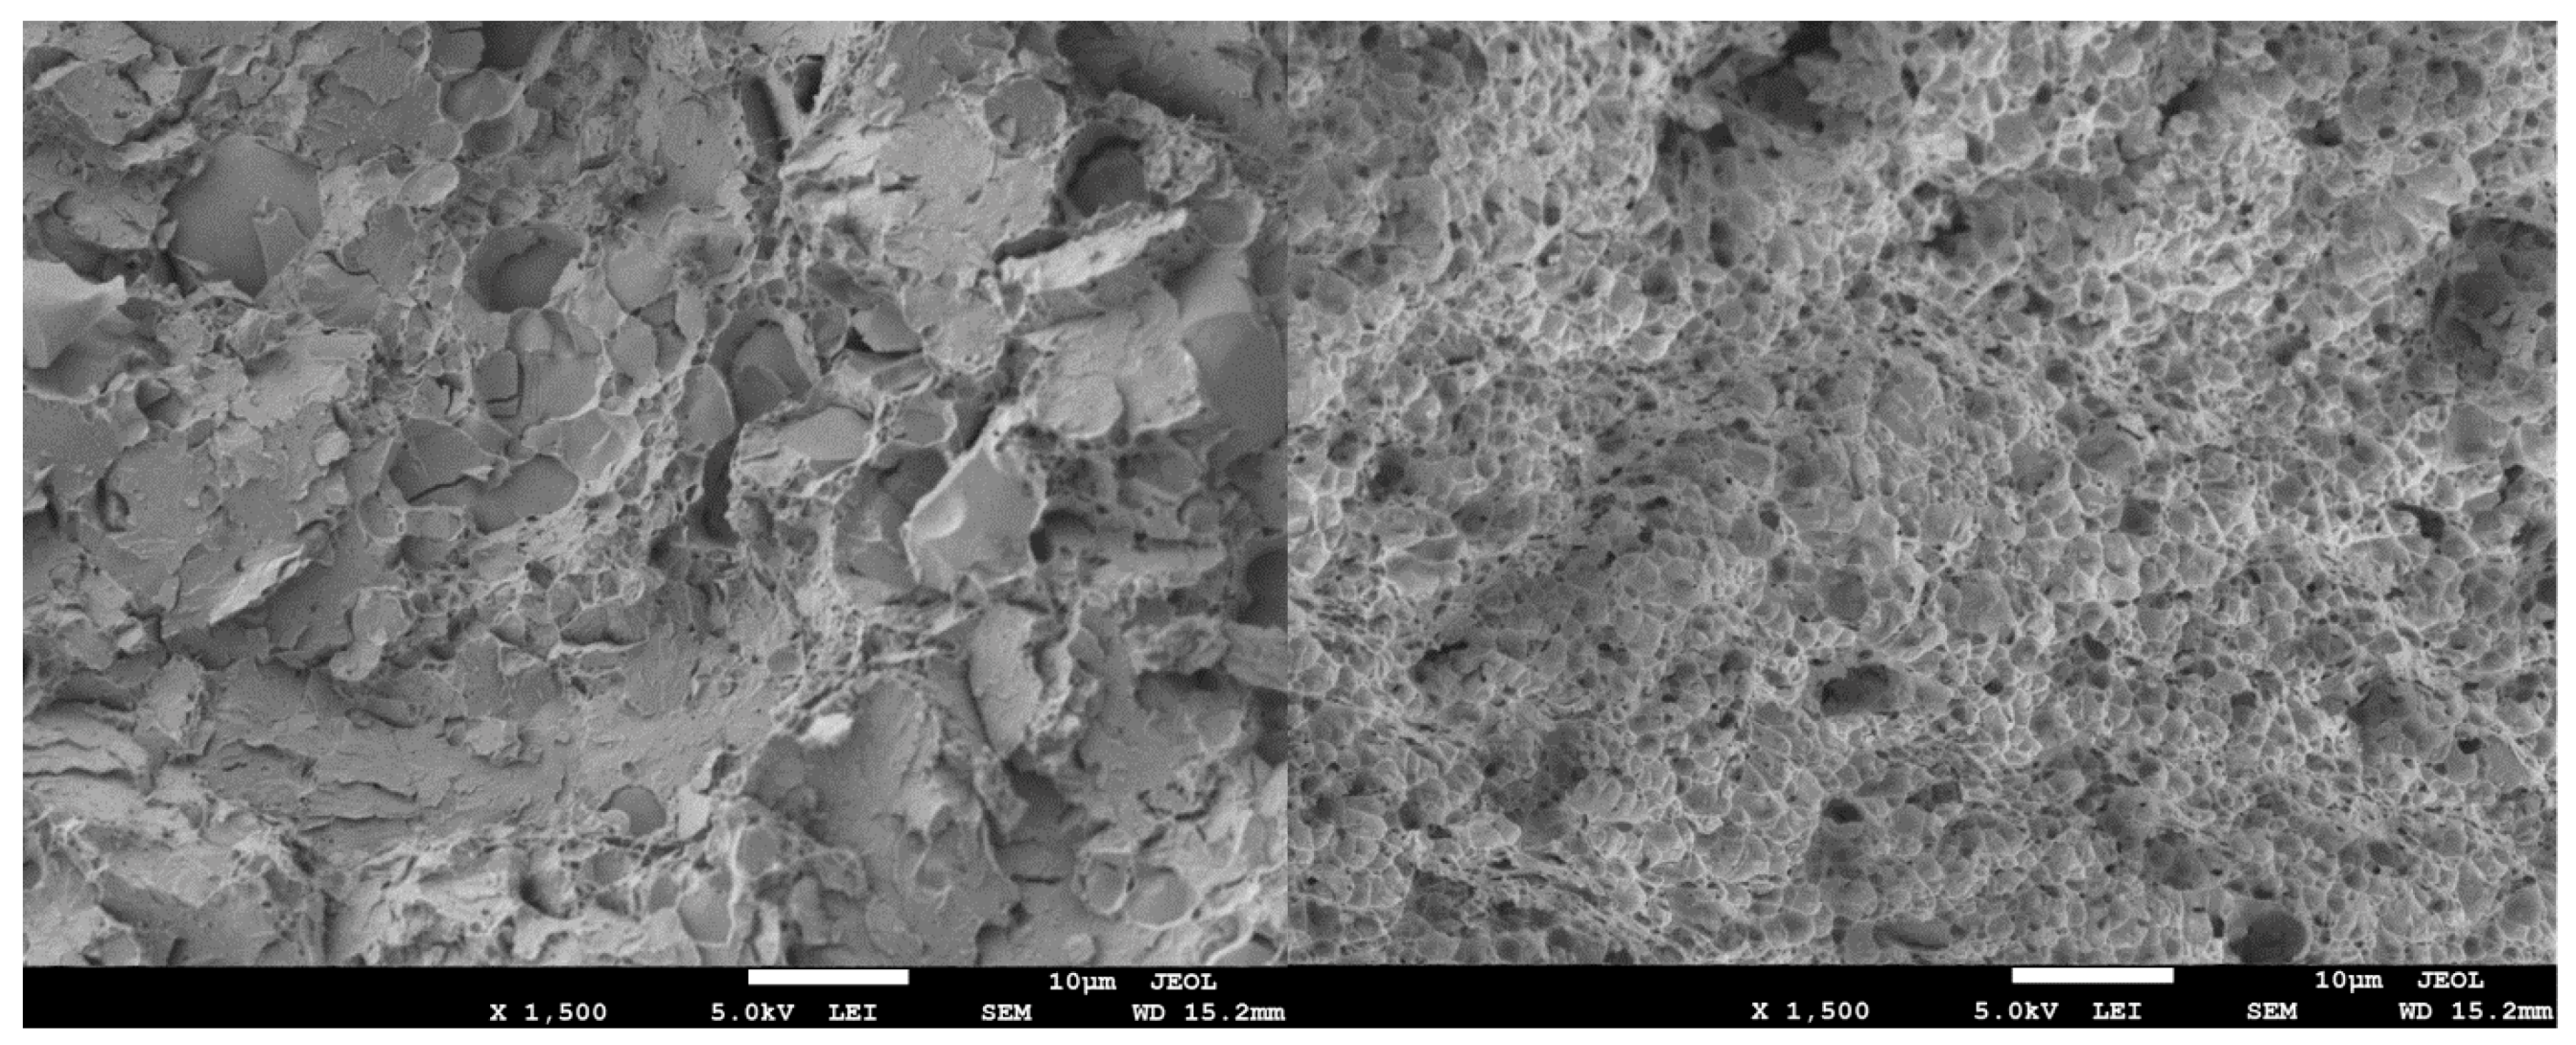
The microstructure on the fractured surfaces of the “O1” specimens with a cup–cone shape and the “D2” specimens with a flat shape were analyzed with different magnifications using a scanning electron microscope (SEM) type JSM-7610FPlus Schottky Field Emission made by JOEL ltd. (Tokyo, Japan). SEM analysis assists in determining the fracture mode for both tool steels [25]. The existence of the parabolic dimple-like structures in the SEM images revealed that both tool steels had a ductile fracture mode (Figure 9). However, for better analysis to assess the fracture mode and failure mechanism, in-situ X-ray tomography can be performed [26,27,28].
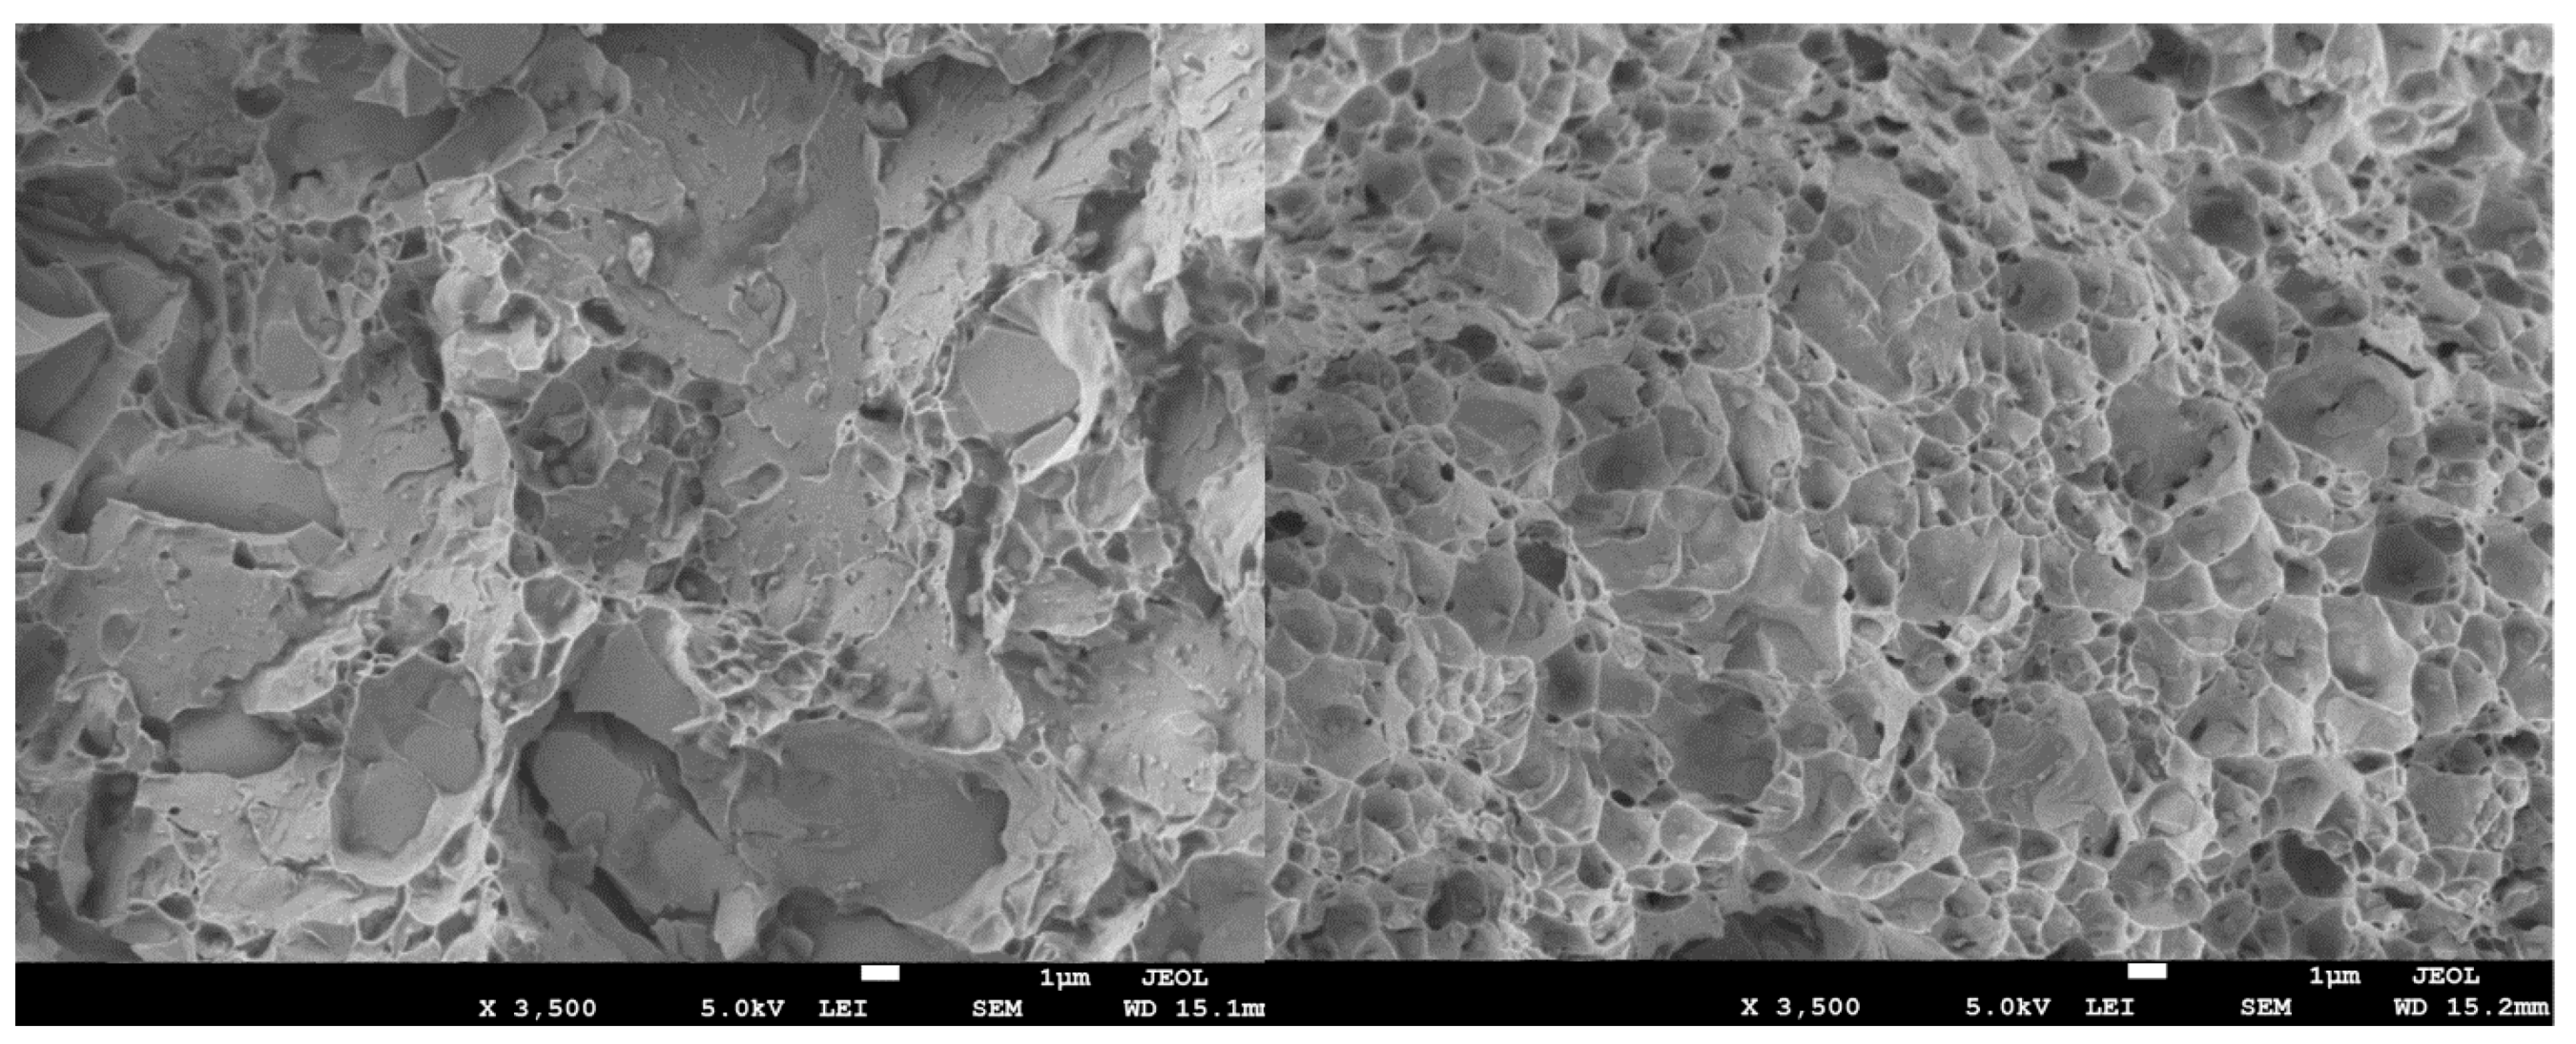
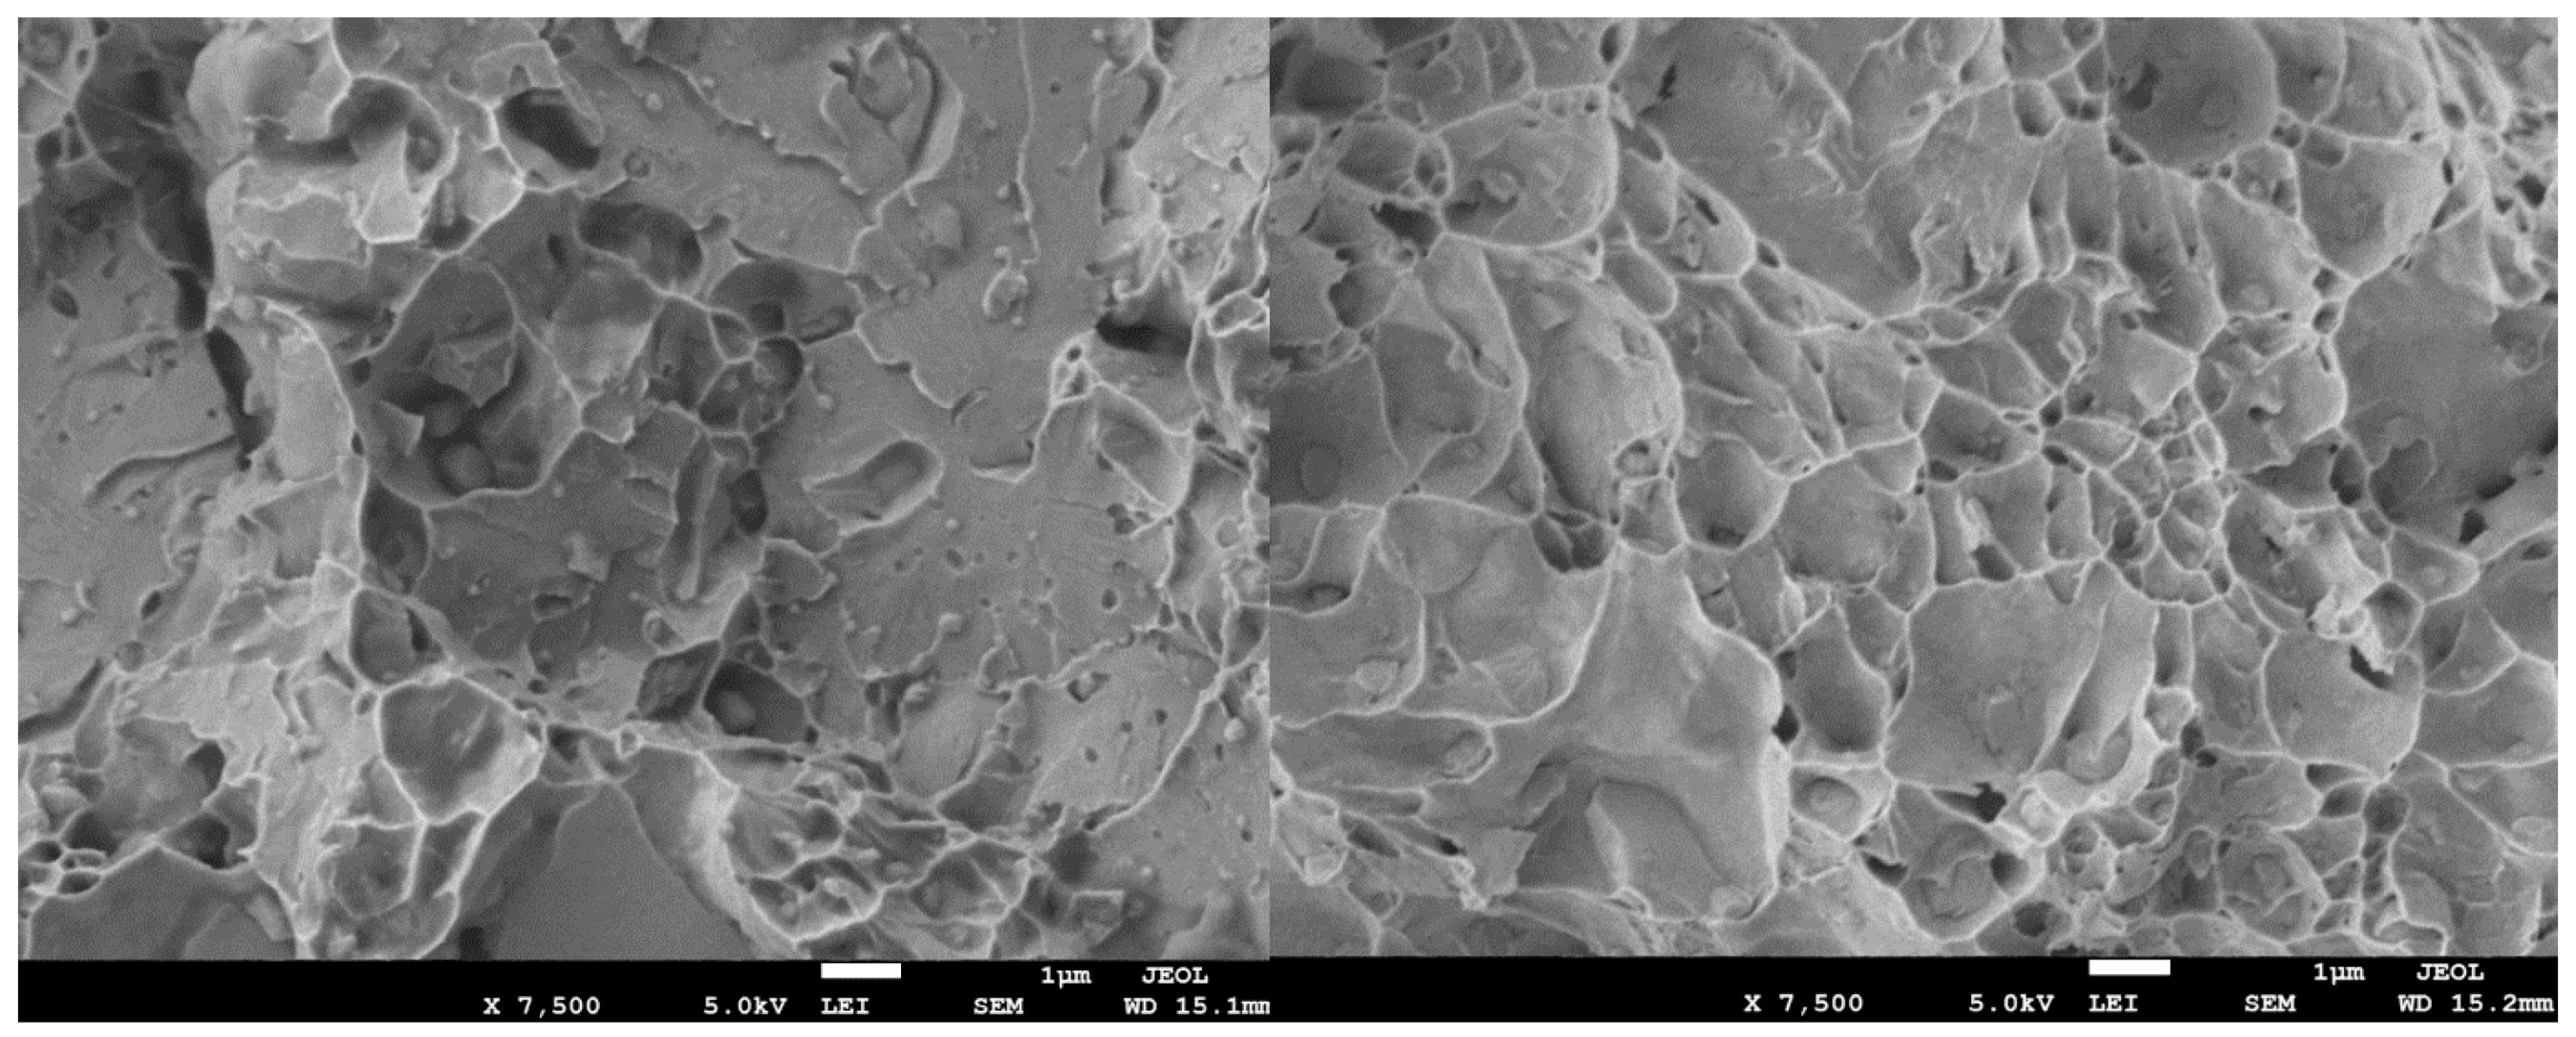
A careful inspection of both tool steels showed some small differences. The surface fracture morphology was rougher on the “D2” fractured surface compared to the “O1” fractured surface. However, the average size of microvoids in the “O1” specimens was smaller compared to the features in the “D2” specimens (Figure 10). Note that the average microvoid size increased as the hardness decreased for both steels, as can be seen on the “O1” and “D2” fractured surfaces in Figure 11. The SEM micrographs showed different microstructures when the two steel metals were compared. The microvoids were deeper on “O1” and sharper on “D2”. The fracture surfaces of “O1” had smaller dimples with fewer cleavage planes compared to “D2” (Figure 11). This observation reasonably explains the higher elongation in “D2” tool steel specimens.
4. Conclusions
In this research study, the plasticity and fracture behavior of two tool steels—AISI “D2” and “O1”—were investigated. The tool steels were purchased and fabricated locally, and the specimens were designed for two mechanical tests: tensile and compression. The results demonstrate that AISI “D2” is recommended for applications that require moderate toughness and dimensional stability. In contrast, AISI “O1” is more suitable for applications that require better machinability performance and an excellent combination of high hardness and toughness. The following points conclude the results of the research:
- The tensile yield strength of “O1” tool steel was higher than “D2” tool steel.
- The specimens of “O1” tool steel showed vivid necking prior to fracture with 19.7% area reduction, whereas the specimens of “D2” tool steel demonstrated no necking throughout the loading process (1.3% area reduction).
- The compression yield strength was higher for “O1” than for “D2” tool steel.
- The surface fracture for “O1” was cup–cone, whereas it was flat for “D2” tool steel.
- DIC was used to measure surface strains and predict cracks initiation location. The high localized strains identified in the DIC images pointed out where the cracks initiated. The crack initiation prediction was in good agreement with the results of the experiments for both tool steel types.
- The parabolic dimple-like structures in the SEM images revealed that both tool steels had a ductile fracture mode.
- The SEM images showed deeper microvoids on “O1” and sharper ones on “D2”. The fracture surfaces of “O1” had smaller dimples with less cleavage planes compared to “D2”.
Funding
This project was funded by the Deanship of Scientific Research (DSR), King Abdulaziz University, Jeddah, under grant No. (DF-309-829-1441). The author, therefore, gratefully acknowledges the DSR technical and financial support.
Conflicts of Interest
The authors declare no conflict of interest.
References
- Toboła, D.; Brostow, W.; Czechowski, K.; Rusek, P. Improvement of wear resistance of some cold working tool steels. Wear 2017, 382, 29–39. [Google Scholar] [CrossRef]
- Budinski, K.G.; Budinski, M.K. Engineering Materials: Properties and Selection; Prentice Hall: Upper Saddle River, NJ, USA, 2010; p. 756. [Google Scholar]
- Bourithis, L.; Papadimitriou, G.D.; Sideris, J. Comparison of wear properties of tool steels AISI D2 and O1 with the same hardness. Tribol. Inter. 2006, 39, 479–489. [Google Scholar] [CrossRef]
- Glaeser, W.A. Characterization of Tribological Materials; Momentum Press: New York, NY, USA, 2012. [Google Scholar]
- Kheirandish, S.; Saghafian, H.; Hedjazi, J.; Momeni, M. Effect of heat treatment on microstructure of modified cast AISI D3 cold work tool steel. J. Iron. Steel Res. Int. 2010, 17, 40–45. [Google Scholar] [CrossRef]
- Hutchings, I.; Shipway, P. Tribology: Friction and Wear of Engineering Materials; Butterworth-Heinemann: Oxford, UK, 2017. [Google Scholar]
- Straffelini, G. Materials for Tribology. In Friction and Wear; Springer: Berlin, Germany, 2015; pp. 159–199. [Google Scholar]
- Lansdown, A.R.; Price, A.L. Materials to Resist Wear; Pergamon Press: Elmsford, NY, USA, 1986. [Google Scholar]
- Roberts, G.A.; Kennedy, R.; Krauss, G. Tool Steels; ASM international: Cleveland, OH, USA, 1998. [Google Scholar]
- Kataria, R.; Kumar, J. A comparison of the different multiple response optimization techniques for turning operation of AISI O1 tool steel. J. Eng. Res. 2014, 2, 1–24. [Google Scholar] [CrossRef]
- Camacho, L.D.A.; Miranda, S.G.; Moreno, K.J. Tribological performance of uncoated and TiCN-coated D2, M2 and M4 steels under lubricated condition. J. Iron. Steel Res. Int. 2017, 24, 823–829. [Google Scholar] [CrossRef]
- Wei, M.-x.; Wang, S.-q.; Lan, W.; Cui, X.-h.; Chen, K.-m. Selection of heat treatment process and wear mechanism of high wear resistant cast hot-forging die steel. J. Iron. Steel Res. Int. 2012, 19, 50–57. [Google Scholar] [CrossRef]
- Koshy, P.; Dewes, R.C.; Aspinwall, D.K. High speed end milling of hardened AISI D2 tool steel (~58 HRC). J. Mater. Process. Technol. 2002, 127, 266–273. [Google Scholar] [CrossRef]
- Lima, J.G.; Avila, R.F.; Abrao, A.M.; Faustino, M.; Davim, J.P. Hard turning: AISI 4340 high strength low alloy steel and AISI D2 cold work tool steel. J. Mater. Process. Technol. 2005, 169, 388–395. [Google Scholar] [CrossRef]
- Ma, X.; Liu, R.; Li, D.Y. Abrasive wear behavior of D2 tool steel with respect to load and sliding speed under dry sand/rubber wheel abrasion condition. Wear 2000, 241, 79–85. [Google Scholar] [CrossRef]
- Mohammed, M.N.; Omar, M.Z.; Al-Zubaidi, S.; Alhawari, K.S.; Abdelgnei, M.A. Microstructure and mechanical properties of thixowelded AISI D2 tool steel. Metals 2018, 8, 316. [Google Scholar] [CrossRef]
- Sola, R.; Giovanardi, R.; Parigi, G.; Veronesi, P. A novel method for fracture toughness evaluation of tool steels with post-tempering cryogenic treatment. Metals 2017, 7, 75. [Google Scholar] [CrossRef]
- He, W.; Hayatdavoudi, A. A comprehensive analysis of fracture initiation and propagation in sandstones based on micro-level observation and digital imaging correlation. J. Pet. Sci. Eng. 2018, 164, 75–86. [Google Scholar] [CrossRef]
- Caminero, M.A.; Lopez-Pedrosa, M.; Pinna, C.; Soutis, C. Damage monitoring and analysis of composite laminates with an open hole and adhesively bonded repairs using digital image correlation. Composites Part B 2013, 53, 76–91. [Google Scholar] [CrossRef]
- Caminero, M.A.; Pavlopoulou, S.; Lopez-Pedrosa, M.; Nicolaisson, B.G.; Pinna, C.; Soutis, C. Analysis of adhesively bonded repairs in composites: Damage detection and prognosis. Compos. Struct. 2013, 95, 500–517. [Google Scholar] [CrossRef]
- Caminero, M.A.; Lopez-Pedrosa, M.; Pinna, C.; Soutis, C. Damage assessment of composite structures using digital image correlation. Appl. Compos. Mater. 2014, 21, 91–106. [Google Scholar] [CrossRef]
- Romanowicz, P.J. Experimental and numerical estimation of the damage level in multilayered composite plates. Materialwiss. Werkstofftech. 2018, 49, 591–605. [Google Scholar] [CrossRef]
- Algarni, M.; Bai, Y.; Choi, Y. A study of Inconel 718 dependency on stress triaxiality and Lode angle in plastic deformation and ductile fracture. Eng. Fract. Mech. 2015, 147, 140–157. [Google Scholar] [CrossRef]
- Tvergaard, V.; Needleman, A. Analysis of the cup–cone fracture in a round tensile bar. Acta Metall. 1984, 32, 157–169. [Google Scholar] [CrossRef]
- Lee, W.-S.; Lin, C.-F.; Liu, T.-J. Strain rate dependence of impact properties of sintered 316L stainless steel. J. Nucl. Mater. 2006, 359, 247–257. [Google Scholar] [CrossRef]
- Landron, C. Ductile Damage Characterization in Dual-Phase steels Using X-Ray Tomography. PhD Thesis, The National Institute of Applied Sciences of Lyon, Lyon, France, 21 December 2011. [Google Scholar]
- Weck, A.; Wilkinson, D.S.; Maire, E.; Toda, H. Visualization by X-ray tomography of void growth and coalescence leading to fracture in model materials. Acta Mater. 2008, 56, 2919–2928. [Google Scholar] [CrossRef]
- Toda, H.; Maire, E.; Yamauchi, S.; Tsuruta, H.; Hiramatsu, T.; Kobayashi, M. In situ observation of ductile fracture using X-ray tomography technique. Acta Mater. 2011, 59, 1995–2008. [Google Scholar] [CrossRef]
Figure 1.
Tensile test specimen shape and geometry in mm.

Figure 2.
Compression test specimen shape and geometry in mm.

Figure 3.
Tensile engineering stress–strain curves to fracture for “D2” and “O1” tool steels.

Figure 4.
Compression engineering stress–strain curves for “D2” and “O1” tool steels.

Figure 5.
“O1” specimen under tension test. (1) Specimen before testing, (2) necking prior to fracture, (3) specimen post fracture, and (4) contour plot showing the Lagrange strain localization before fracture in red (maximum stain) and purple (minimum strain).
Figure 5.
“O1” specimen under tension test. (1) Specimen before testing, (2) necking prior to fracture, (3) specimen post fracture, and (4) contour plot showing the Lagrange strain localization before fracture in red (maximum stain) and purple (minimum strain).

Figure 6.
“D2” specimen under tension test. (1) Specimen before testing, (2) no necking prior to fracture, (3) specimen post fracture, and (4) the contour plot showing the Lagrange strain localization before fracture in red (maximum stain) and purple (minimum strain).
Figure 6.
“D2” specimen under tension test. (1) Specimen before testing, (2) no necking prior to fracture, (3) specimen post fracture, and (4) the contour plot showing the Lagrange strain localization before fracture in red (maximum stain) and purple (minimum strain).

Figure 7.
A flat fracture mode surface for “D2” tool steel under tension (left) and flattened shape of the cylindrical specimen (right) under compression.
Figure 7.
A flat fracture mode surface for “D2” tool steel under tension (left) and flattened shape of the cylindrical specimen (right) under compression.

Figure 8.
A cup–cone mode fracture surface and clear necking for “O1” tool steel under tension (left) and flattened shape of the cylindrical specimen (right) under compression.
Figure 8.
A cup–cone mode fracture surface and clear necking for “O1” tool steel under tension (left) and flattened shape of the cylindrical specimen (right) under compression.

Figure 9.
SEM morphologies of fracture surfaces of “D2” (left) and “O1” (right) with ×1500 magnification.
Figure 9.
SEM morphologies of fracture surfaces of “D2” (left) and “O1” (right) with ×1500 magnification.

Figure 10.
SEM morphologies of fracture surfaces of “D2” (left) and “O1” (right) with ×3500 magnification.
Figure 10.
SEM morphologies of fracture surfaces of “D2” (left) and “O1” (right) with ×3500 magnification.

Figure 11.
SEM morphologies of fracture surfaces of “D2” (left) and “O1” (right) with ×7500 magnification.
Figure 11.
SEM morphologies of fracture surfaces of “D2” (left) and “O1” (right) with ×7500 magnification.


Table 1.
Chemical composition of “D2” and “O1” tool steels in mass percent (%).
| Metal Type | C | Mn | Si | Cr | Mo | W | V | Fe |
|---|---|---|---|---|---|---|---|---|
| “D2” | 1.52 | 0.34 | 0.31 | 12.05 | 0.76 | - | 0.92 | Balance. |
| “O1” | 0.94 | 1.2 | 0.32 | 0.52 | - | 0.53 | 0.19 | Balance. |
Table 2.
Critical and austenization temperatures of “D2” and “O1” tool steels.
| Metal Type | Ac1 | Ac3 | Ar1 | Ar3 | Austenization Temperature |
|---|---|---|---|---|---|
| “D2” | 788 °C | 845 °C | 769 °C | 744 °C | 1010–1024 °C |
| “O1” | 732 °C | 760 °C | 703 °C | 671 °C | 802–816 °C |
Table 3.
Basic mechanical properties of "D2" and "O1" tool steels.
| Specimen | Modulus of Elasticity | 0.2% Offset Yield Strength | Yield Strength | UTS |
|---|---|---|---|---|
| AISI “D2” | 203 GPa | 411 MPa | 350 MPa | 758 MPa |
| AISI “O1” | 211 GPa | 829 MPa | 758 MPa | 846 MPa |
Table 4.
Experimental tensile tests data summary of "D2" and "O1" tool steels.
| Specimen | Modulus of Toughness | Fracture Strength | Displacement at Fracture | Gauge Length | Fracture Strain | Area Reduction |
|---|---|---|---|---|---|---|
| AISI “D2” | 81 MPa | 723 MPa | 0.61 mm | 30 mm | 1.97% | 1.3% |
| AISI “O1” | 68 MPa | 703 MPa | 0.35 mm | 30 mm | 1.09% | 19.7% |
© 2019 by the author. Licensee MDPI, Basel, Switzerland. This article is an open access article distributed under the terms and conditions of the Creative Commons Attribution (CC BY) license (http://creativecommons.org/licenses/by/4.0/).
Share and Cite
MDPI and ACS Style
Algarni, M. Mechanical Properties and Microstructure Characterization of AISI “D2” and “O1” Cold Work Tool Steels. Metals 2019, 9, 1169. https://doi.org/10.3390/met9111169
AMA Style
Algarni M. Mechanical Properties and Microstructure Characterization of AISI “D2” and “O1” Cold Work Tool Steels. Metals. 2019; 9(11):1169. https://doi.org/10.3390/met9111169
Chicago/Turabian StyleAlgarni, Mohammed. 2019. "Mechanical Properties and Microstructure Characterization of AISI “D2” and “O1” Cold Work Tool Steels" Metals 9, no. 11: 1169. https://doi.org/10.3390/met9111169
Note that from the first issue of 2016, this journal uses article numbers instead of page numbers. See further details here.