Thermal Cycles and Deformation Characters During High-Speed Micro Friction Stir Welding Process of AA7075-T6 Sheets

1
School of Materials Science and Engineering, Northwestern Polytechnical University, Xi’an 710072, China
2
State Key Laboratory of Solidification, Xi’an 710072, China
3
Shaanxi Key Laboratory of Friction Welding Technologies, Xi’an 710072, China
*
Author to whom correspondence should be addressed.
Metals 2019, 9(11), 1236; https://doi.org/10.3390/met9111236
Submission received: 25 October 2019
/
Revised: 13 November 2019
/
Accepted: 14 November 2019
/
Published: 18 November 2019
(This article belongs to the Special Issue Advanced Process Technologies Based on Friction Stir Welding and Linear Friction Welding)
Abstract
:Thermal cycles and deformations during high-speed micro friction stir welding (μFSW) under different welding conditions were studied by experimental methods. The results show that the peak temperature and elevated-temperature exposure time (t150) increased with the increasing of rotational speed and decreased with the increasing of welding speed. Increasing rotational speed or welding speed led to an increase in both heating and cooling rates. The joint fabricated by the pinless tool experienced a lower peak temperature, a shorter elevated-temperature exposure time, and a larger temperature gradient than that by the pin tool. The welded sheet presented an anti-saddle deformation character, with convex bending in a longitudinal direction and concave angular bending in a transverse direction. In comparison to the pin tool, the longitudinal maximum bending deformation, Zmax, of the joint fabricated by the pinless tool was reduced by 12.35%, and the transverse angular deformation, α, was reduced by 6.67%. In comparison to the steel backing plate, the Zmax of the joint produced using a copper backing plate was reduced by 40.66%, but the α was increased by 53.27%.
1. Introduction
Friction stir welding (FSW) technology is considered to be one of the most important advancements in industrial manufacturing due to its energy efficiency, environment friendliness, and versatility [1,2]. Zhang et al. [3] conducted high-speed FSW experiments on an AA7075-T6 sheet, reporting that the higher welding speed resulted in narrower, stronger heat-affected zones (HAZs) and also higher hardness in the nugget zones (NZs). Zhang et al. [4] studied the microstructure and corrosion properties of high-speed FSW of AA7075 sheets. The results showed that the welds with higher speeds had a smaller corrosion sensitive area along with smaller HAZs, but the NZ became more corrosion susceptible. Azimzadegan et al. [5] investigated the microstructures and mechanical properties of AA7075-T6 during FSW at relatively high rotational speeds. The results showed that a fine grain structure was produced at a higher ratio of rotational speed to welding speed. As a variation of FSW, micro friction stir welding (μFSW) is gaining more and more attention for sheets with a thickness of 1 mm or less [6]. The thermal cycles during FSW play a crucial role in the deformation. In recent years, research on the thermal cycles of FSW has mainly focused on medium and thick plates [7,8,9]. However, there is little research on the thermal cycles for FSW of ultrathin sheets.
In comparison to fusion welding, FSW has a lower welding temperature, which is commonly referred to as “low stress and small deformation” welding technology. Although the peak temperature and temperature gradient of FSW are lower than that of fusion welding, it is still a process accompanied by a significant increase of temperature in the local area. This localized heating and cooling can lead to plastic strain in the welded plate, which cannot be completely recovered after FSW. Therefore, the existence of deformation after FSW is inevitable, and the unrecovered plastic strain is the source of the deformation [10]. Especially for thin-walled members with a large size, the residual deformation after FSW, which affects dimensional accuracy and assembly quality, cannot be ignored.
In previous studies, most of the specimens in FSW experiments and simulations have been medium and thick plates with small sizes, where the deformation after FSW was not obvious. Therefore, almost all previous investigations have only focused on the distribution [11,12,13,14,15,16], regulation [17,18,19], and simulation [20,21,22] of residual stress and have ignored the existence of the deformation. Shi et al. [9] studied the deformation of FSW on an Al-6013 plate with dimensions of 1000 × 630 × 3 mm3 by a three-dimensional coordinate measuring instrument. It was found that there was a significant out-of-plane deformation after FSW and that the residual deformation was in an anti-saddle shape. Woo et al. [23] investigated the angular deformation in a friction-stir-processed Al-6061 plate with both a stirring pin and a tool shoulder. The results showed that the angular deformation occurred when the plate was processed with the tool shoulder. Richter-Trummer et al. [24] studied the influence of the clamping force on the deformation of FSW. The results illustrated that a higher clamping force led to lower deformation. Recently, some studies have shown that with the increase of the workpiece size or the decrease of the workpiece thickness, the stiffness decreases and the out-of-plane deformation after FSW increases [25,26].
In this study, μFSW of AA7075-T6 sheets with a thickness of 0.5 mm was carried out. The influence of the welding process (welding parameters, tool geometry, and backing plate material) on the thermal cycles and deformations of μFSW was systematically investigated by experimental methods.
2. Experimental Procedure
2.1. FSW Experiment
AA7075-T6 ultrathin sheets with a thickness of 0.5 mm were butt-joined through μFSW. The sheets to be welded were cut into a desired size of 200 mm in length and 60 mm in width. Welding experiments were carried out on a FSW-TS-F08-DZ professional high-speed μFSW machine (Beijing FSW Technology Co., Ltd., Beijing, China). Welding parameters and tool geometries, as well as backing plate materials, were varied in order to study the influence of the welding process on the thermal cycles and deformations. The welding parameters used in the present study are summarized in Table 1.
The μFSW was performed with a pin tool and a pinless tool, which were made of H13 tool steel. Figure 1 shows the profiles of the pin tool and the pinless tool used in this study. Both tools had the same shoulder profile of three helical grooves, but the pin tool had an additional tapered pin.
To suppress the thickness reduction of the weld, the zero tilt angle of the FSW tool was kept during welding. The detailed dimensions of the two FSW tools are illustrated in Figure 2, where dp and dpl denote the penetration depth of the pin tool and the pinless tool, respectively. In the present study, dp and dpl were taken to be 0.36 mm and 0.14 mm, respectively. Since the pin length was 0.22 mm, they had the same shoulder penetration depth of 0.14 mm.
2.2. Coordinate Definition
To facilitate the subsequent deformation analysis, it was necessary to define a suitable coordinate system. Figure 3 illustrates the welding schematic and coordinate definition. A right-handed X–Y–Z coordinate system was used. The upper surface of the workpiece to be welded was defined as the X–Y plane. The Y axis was parallel to the welding direction and was located at the center of the weld. The Z axis was along the thickness direction of the workpiece and pointed from the bottom to the upper surface. The origin was located on the weld centerline and at the starting end of the workpiece. The clamping position, starting point, and ending point of welding were fixed under each welding process. According to the established coordinate system, the welding started at the position of y = 10 mm and ended at y = 190 mm.
2.3. Temperature Measurement
Figure 4 shows the schematic of temperature measurement. The thermal cycles were measured on the cross section of y = 100 mm (Figure 4). To obtain the thermal cycles at different locations of the joints, a groove was machined at the bottom of the backing plate. Five through-holes with a diameter of 0.8 mm were drilled in the groove and extended into the workpiece. The spacing between the two adjacent holes was 2.5 mm. Five K-type thermocouples were inserted into these holes separately so that the contacts reached the mid-plane of the workpiece. The thermal cycles at the five locations were recorded by a VM7000A paperless recorder (Ohkura Electric Co.,Ltd., Sakamoto, Japan) during FSW.
2.4. Deformation Measurement and Characterization
A Handyscan700 three-dimensional laser scanner (Creaform Corporation, Levis, QC, Canada) was used to measure the deformations. Marking points were placed on the sheets to facilitate the positioning of the laser scanner. The deformations of the welded sheets were measured before and after FSW, and the corresponding point cloud files were obtained. These data were processed and analyzed by Geomagic qualify software (Geomagic Corporation, Santa Clara, NC, USA). The final three-dimensional coordinates of the sheet surfaces before and after welding were obtained, and then the deformations during the welding process could be calculated.
Figure 5 illustrates the deformation characteristics of μFSW. The position in the Z direction indicates the out-of-plane deformation of the welded sheet. As shown in Figure 5a, on the whole, the welded sheet presented an anti-saddle deformation character, which was in contrast to conventional fusion welding and consistent with previous studies [27,28]. The highest position was located in the middle of the side edges of the welded sheet. The lowest position was in the middle of the starting and ending of the welded sheet. As shown in Figure 5b, the welded sheet exhibited convex bending deformation in a longitudinal direction. Therefore, the maximum bending deformation, Zmax, on the section of x = 0 mm could be used to evaluate the longitudinal deformation. As shown in Figure 5c, the welded sheet showed concave angular deformation in a transverse direction. Thus, the transverse deformation could be evaluated by the angular deformation, α, on the section of y = 100 mm. The value of α can be calculated by the following equations:
where α represents the total angular deformation, α1 is the angular deformation on the advancing side (AS), α2 is the angular deformation on the retreating side (RS), ZA–ZD denote the Z-direction coordinates of points A–D, and XC and XD represent the X-direction coordinates of points C and D, respectively.
3. Results and Discussion
3.1. Weld Morphology
Figure 6 shows the surface appearance of the welds produced using different welding conditions. The welding direction, rolling direction, and normal direction of the base metal (BM) were marked as WD, RD, and ND, respectively. Except for varying degrees of flash, good surface morphology was obtained under the various welding conditions. The flash on the RS was obviously larger than that on the AS for all the joints. In comparison to the other joints, the joint with the parameter of 6000-600-P-Fe (Figure 6b) had the largest flash on the whole, which can be explained by the higher peak temperature (Figure 8b) and the resulting stronger material flow ability for the joint of 6000-600-P-Fe. In addition, the joint with the parameter of 6000-600-PL-Fe (Figure 6d) exhibited a smoother weld surface than the other joints, which can be attributed to the weaker stirring effect for the pinless tool.
Figure 7 shows the transverse cross sections of the joints produced using different welding conditions. As shown in Figure 7, the stir zone (SZ) produced using different welding parameters presented a pan shape. Defect-free joints were obtained by the parameters of 6000-600-P-Fe, 6000-1200-P-Fe, and 6000-600-PL-Fe (Figure 7b–d). Kissing-bond defects were observed at the bottom of the joints with the parameters of 3000-600-P-Fe (Figure 7a) and 6000-600-P-Cu (Figure 7e). For the joint with the parameter of 3000-600-P-Fe, the kissing-bond defect was caused by insufficient heat input. For the joint with the parameter of 6000-600-P-Cu, the kissing-bond defect occurred at the weld bottom due to the large heat dissipation of the copper backing plate.
3.2. Thermal Cycles
The FSW process was accompanied by uneven heating and cooling in time and space, and the resulting thermal stress inevitably led to residual stress and deformation in the welded joint. Therefore, the deformation after FSW largely depended on the thermal cycles during the welding process. Figure 8 shows the temperature distribution of the joints under different welding conditions. The main parameters of the welding thermal cycles at the weld center are listed in Table 2. Some important findings can be obtained from Figure 8 and Table 2.
On the one hand, some common characteristics can be found. First, the maximum temperature of the joints appeared in the weld center under each welding condition. Second, the temperature was asymmetrically distributed with respect to the weld centerline, and the temperature on the AS was higher than that on the RS at the same distance from the weld center. This was because the forward velocity vector of the FSW tool was the same as the tangential velocity vector on the AS but opposite to the tangential velocity vector on the RS. Third, during the welding process, the temperature rose rapidly to peak temperature and then dropped slowly to room temperature.
On the other hand, via comparative analysis, some rules about the influence of the welding process on the thermal cycles can be obtained. First, as shown in Figure 8a,b, when the rotational speed increased from 3000 rpm to 6000 rpm, the peak temperature increased from 349.1 °C to 412.8 °C, and the elevated-temperature exposure time (t150) increased from 3.5 s to 4.3 s. Moreover, the heating and cooling rates also increased with the increasing of rotational speed. Second, as shown in Figure 8b,c, when the welding speed increased from 600 mm/min to 1200 mm/min, the peak temperature decreased from 412.8 °C to 342.6 °C and the elevated-temperature exposure time decreased from 4.3 s to 2.8 s. While the heating and cooling rates increased with the increasing of welding speed. Third, as shown in Figure 8b,d, the peak temperature and elevated-temperature exposure time of the joint produced by the pinless tool were slightly lower than that produced by the pin tool under the same shoulder penetration depth. This phenomenon can be attributed to the additional plastic deformation heat generated by the tool pin, which resulted in higher heat input generated by the pin tool than that by the pinless tool. In addition, in comparison to the joint produced using the pin tool, the joint produced using the pinless tool experienced faster heating and cooling rates. Fourth, the temperature gradient within the shoulder range of the weld produced by the pinless tool was larger than those produced by the pin tool. Compared to the pinless tool, the pin tool had a stronger stirring effect, which produced a better material flow and more uniform heat distribution in the stir zone. Consequently, the temperature gradient in the stir zone produced by the pin tool was smaller than that by the pinless tool.
3.3. Deformations
3.3.1. Deformation Comparison for Different Rotational Speeds
Figure 9 shows the deformation comparison of FSW sheets at different rotational speeds (3000-600-P-Fe and 6000-600-P-Fe). As shown in Figure 9a, for the longitudinal deformation at position x = 0, the rotational speed influenced not only the position of the deformation curve but also its shape. The curvature of the longitudinal deformation curve increased with the increasing of rotational speed. As shown in Figure 9b, for the transverse deformation at position y = 100 mm, the transverse deformation curves at different rotational speeds were almost parallel, while the higher rotational speed corresponded to the deformation curve at a higher position. As shown in Figure 9c, when the rotational speed was increased from 3000 rpm to 6000 rpm, the longitudinal maximum bending deformation, Zmax, increased from 7.6791 mm to 8.6362 mm and the transverse angular deformation, α, increased from 1.9709° to 2.2053°. The Zmax and α were increased by 12.46% and 11.89%, respectively. This indicates that the rotational speed had a greater influence on both the longitudinal bending deformation and the transverse angular deformation.
During the welding process, as the FSW tool moved forward, the material near the upper surface of the welded sheets was extruded and moved along the welding direction, resulting in a longitudinal extension of material on the upper surface. This longitudinal extension did not occur due to the rigid contact between the lower surface and the backing plate; therefore, the welded sheet bent upward along the longitudinal direction. Generally, the higher the temperature during the welding process, the greater the deformation after welding, and vice versa. This was the main reason why the deformation of FSW was less than that of arc welding. As can be seen from Figure 8a,b, when the rotational speed increased from 3000 rpm to 6000 rpm, the peak temperature and elevated-temperature exposure time increased. Therefore, the Zmax increased with the increasing of rotational speed. The angular deformation in the transverse direction was caused by the uneven plastic shrinkage between the upper and lower surfaces of the welded sheet. Due to the compatibility of the deformation on the welded sheet, the longitudinal bending deformation increased the transverse angular deformation [25]. Thus, the α also increased with the increasing of rotational speed.
3.3.2. Deformation Comparison for Different Welding Speeds
Figure 10 shows the deformation comparison of FSW sheets at different welding speeds (6000-600-P-Fe and 6000-1200-P-Fe). As shown in Figure 10a,b, both the longitudinal and transverse deformation curves basically coincided at different welding speeds, indicating that the welding speed had little effect on the deformations. As shown in Figure 10c, when the welding speed increased from 600 mm/min to 1200 mm/min, the Zmax decreased slightly from 8.6362 mm to 8.5172 mm and the α decreased from 2.2053° to 1.8923°. The Zmax and α were reduced by 1.38% and 14.19%, respectively. It was found that the welding speed had little effect on the longitudinal bending deformation but had a greater influence on the transverse angular deformation. As shown in Figure 8b,c, the peak temperature and elevated-temperature exposure time decreased with the increasing of welding speed. Therefore, the Zmax and α decreased with the increasing of welding speed.
3.3.3. Deformation Comparison for Different Tools
Figure 11 shows the deformation comparison of FSW sheets produced using the pin tool and pinless tool under the same welding condition (6000-600-P-Fe and 6000-600-PL-Fe). As shown in Figure 11a, the longitudinal deformation curve of the joint produced by the pinless tool had a smaller curvature and a lower position than that produced by the pin tool. In comparison to the joint produced using the pin tool, the transverse deformation curve of the joint produced using the pinless tool also had a lower position (Figure 11b). As shown in Figure 11c, when the joint was produced using the pin tool, Zmax and α were 8.6362 mm and 2.2053°, respectively. When the joint was produced using the pinless tool, Zmax and α were reduced to 7.5696 mm and 2.0583°, respectively. In comparison to the pin tool, the Zmax and α of the joint fabricated by the pinless tool were reduced by 12.35% and 6.67%, respectively. It was found that tool geometry had a greater impact on the longitudinal bending deformation and a minor impact on the transverse angular deformation. As shown in Figure 8b,d, the peak temperature and elevated-temperature exposure time of the joint produced by the pinless tool were lower than those fabricated by the pin tool, resulting in the residual deformation of the joint produced by the pinless tool being less than that by the pin tool. Therefore, the Zmax and α of the joint fabricated by the pinless tool were less than those fabricated by the pin tool.
3.3.4. Deformation Comparison for Different Backing Plates
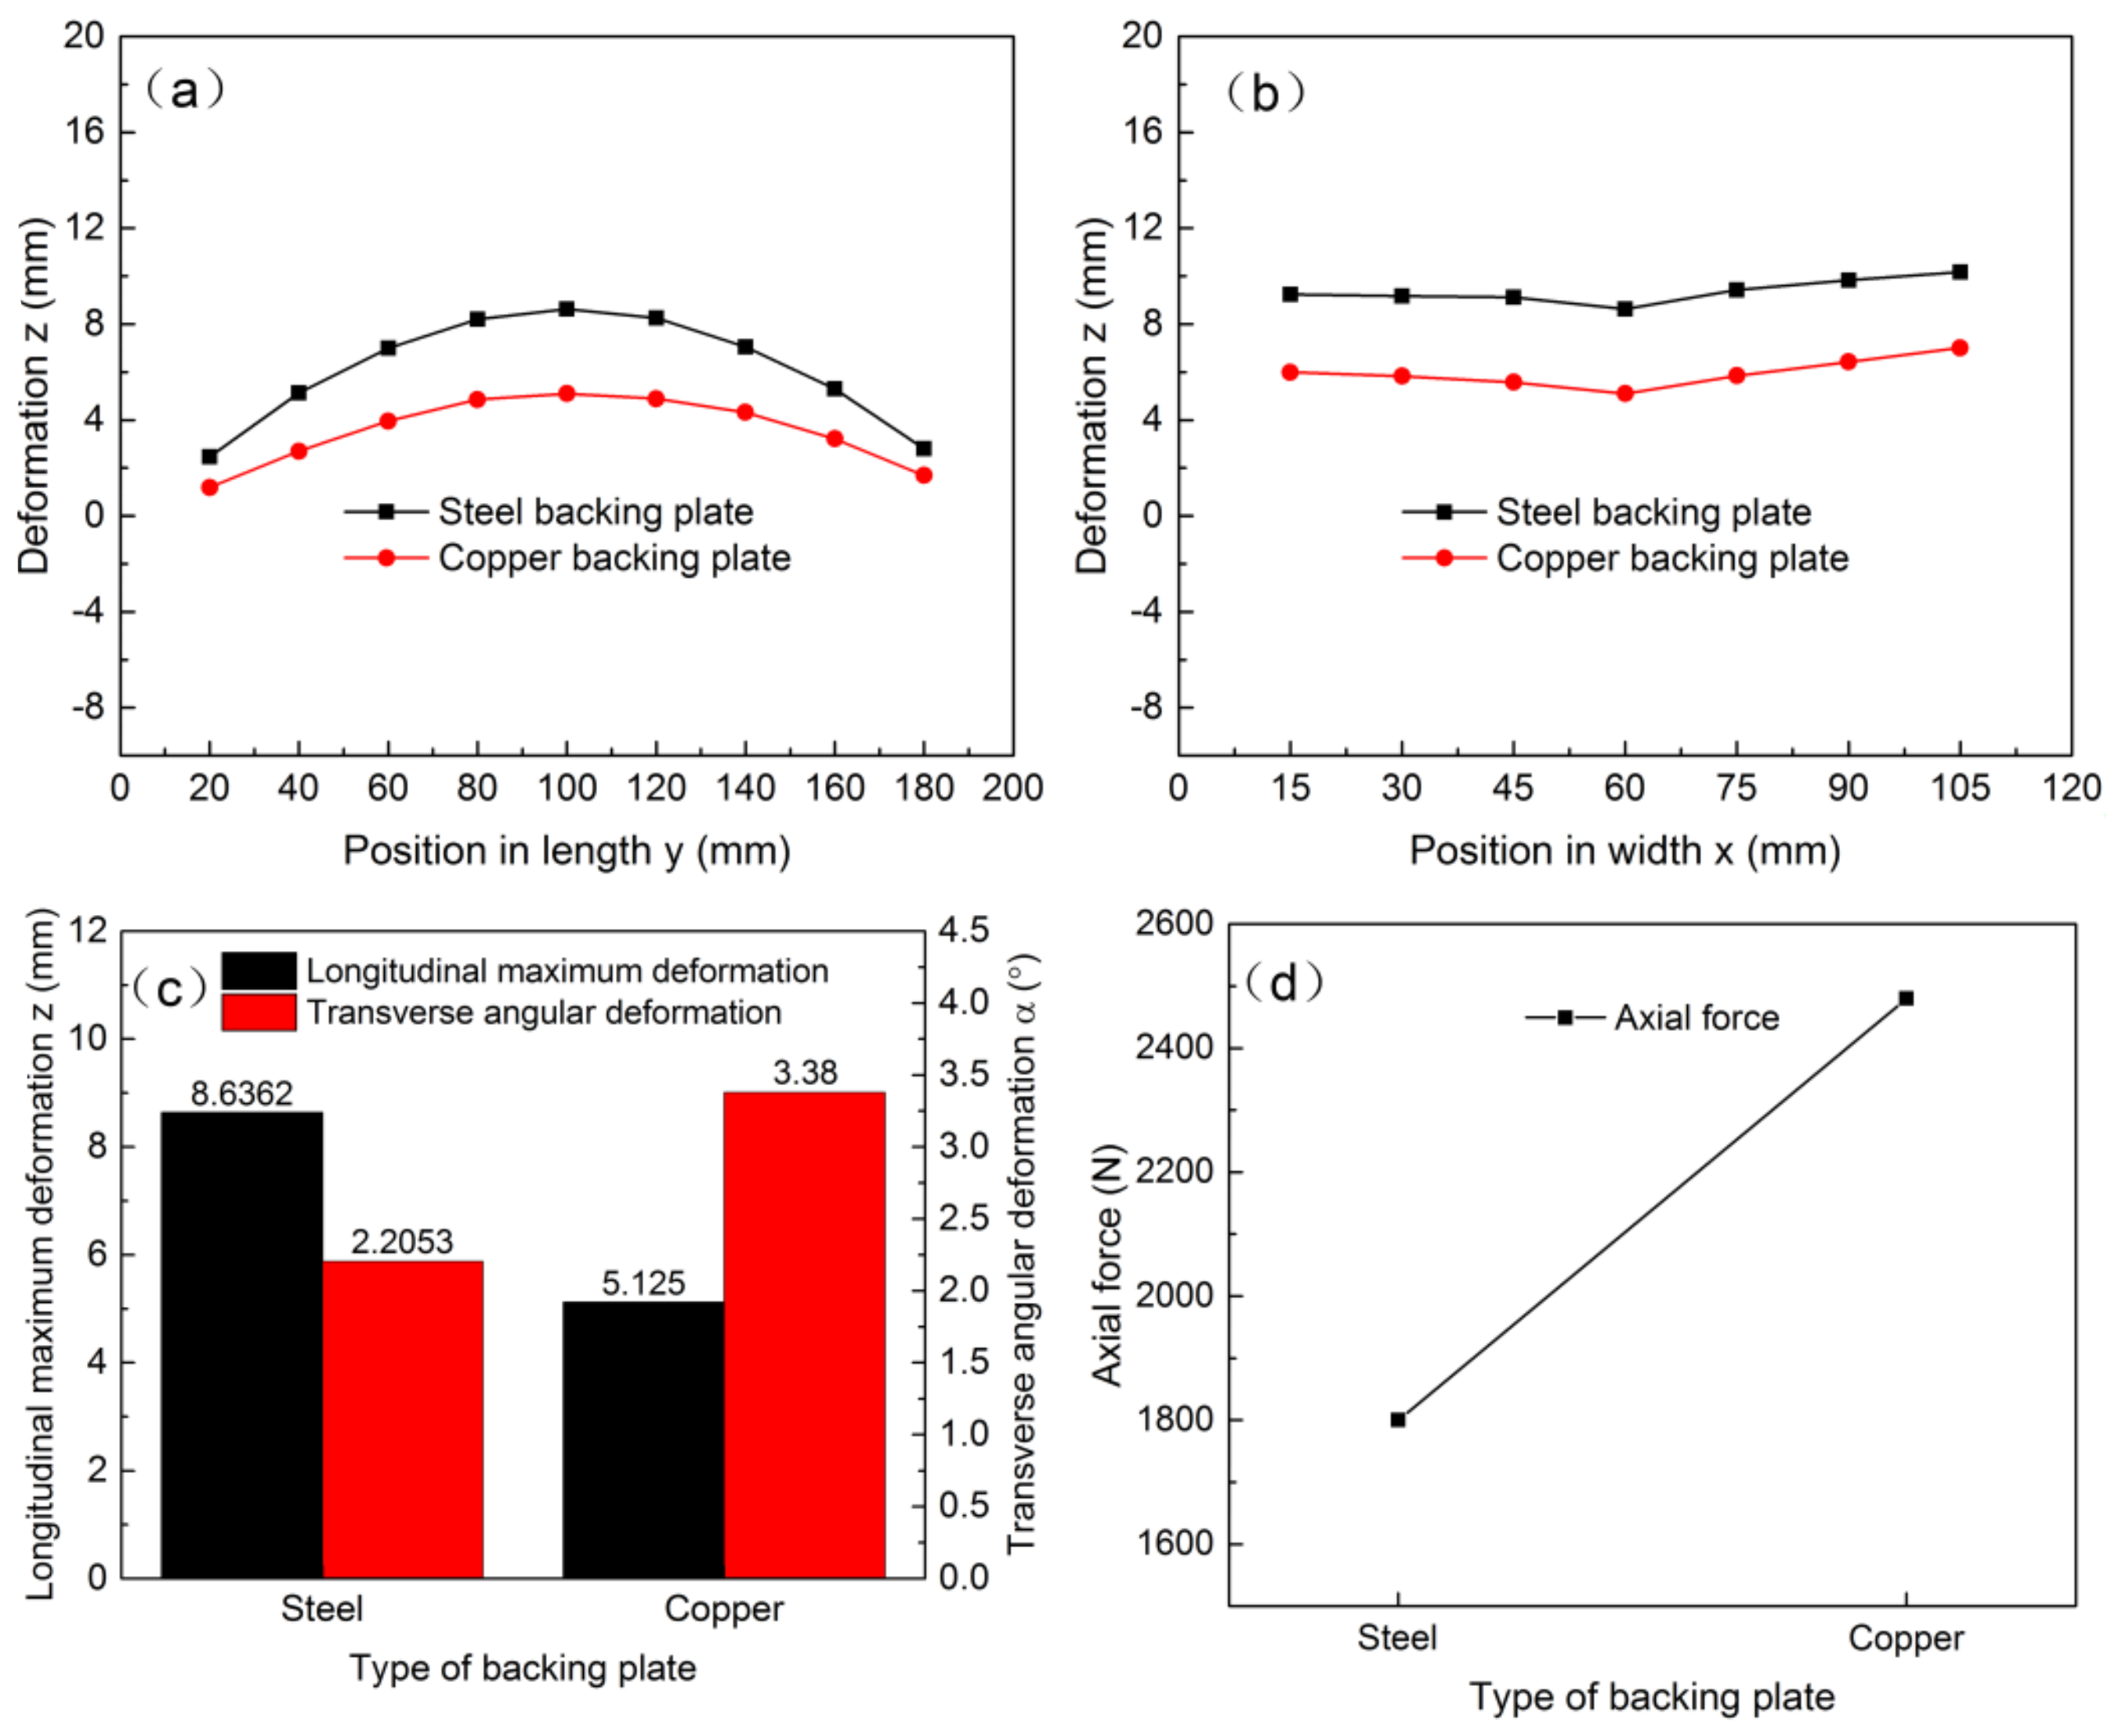
Figure 12 shows the deformation comparison of FSW sheets produced using the steel and copper backing plate under the same welding condition (6000-600-P-Fe and 6000-600-P-Cu). As shown in Figure 12a, compared to the steel backing plate, the longitudinal deformation curve of the joint produced using the copper backing plate had a much smaller curvature and a much lower position. As shown in Figure 12b, the transverse deformation curve of the joint produced using the copper backing plate also had a much lower position than that using the steel backing plate. As shown in Figure 12c, when the joint was produced using the steel backing plate, Zmax and α were 8.6362 mm and 2.2053°, respectively. When the joint was produced using the copper backing plate, Zmax was drastically reduced to 5.1250 mm, while α was greatly increased to 3.3800°. In comparison to the steel backing plate, the Zmax of the joint produced using the copper backing plate was reduced by 40.66% and the α was increased by 53.27%. It was found that the backing plate material had a significant impact on both the longitudinal bending deformation and the transverse angular deformation.
Compared with the steel backing plate (Fe, 16 W (m·K)−1), the copper backing plate (Cu, 386 W (m·K)−1) had a much higher thermal conductivity. The heat dissipation capacity of the copper backing plate was much stronger than that of the steel backing plate. Thus, when the copper backing plate was used, the welding temperature was much lower than when the steel backing plate was used under the same welding condition. Therefore, in comparison to the steel backing plate, the joint produced by the copper backing plate had a much smaller Zmax. As shown in Figure 12d, when the copper backing plate was used for welding, the axial force was 2480 N, which was significantly higher than the axial force of 1800 N when the steel backing plate was used. Therefore, when the copper backing plate was used for welding, the workpiece bore a large axial force at the low welding temperature, resulting in a significant plastic deformation around the weld zone. In addition, in comparison to the steel backing plate, when the copper backing plate was used for welding, the difference of the heat dissipation capacity between the upper and lower surfaces of the workpiece was much greater. Thus, when the copper backing plate was used, the difference in transverse plastic shrinkage between the upper and lower surfaces was also greater under the action of welding thermal cycling. Therefore, in comparison to the steel backing plate, the joint produced by the copper backing plate had a much greater α.
4. Conclusions
In this study, the μFSW of an AA7075-T6 sheet with a thickness of 0.5 mm was successfully performed under different welding conditions. The influence of the welding process on the thermal cycles and deformations of μFSW was systematically studied through experiments. The following conclusions can be drawn:
(1) In comparison to the pin tool, the joint fabricated by the pinless tool experienced a lower peak temperature, a shorter elevated-temperature exposure time, and a larger temperature gradient within the shoulder range under the same shoulder penetration depth;
(2) Tool geometry had a greater impact on the longitudinal bending deformation and a minor impact on the transverse angular deformation. In comparison to the pin tool, the Zmax and α of the joint fabricated by the pinless tool were reduced by 12.35% and 6.67%, respectively;
(3) The material of the backing plate had a significant impact on both the longitudinal bending deformation and the transverse angular deformation. In comparison to the steel backing plate, the Zmax of the joint produced using the copper backing plate was reduced by 40.66%, whereas the α was increased by 53.27%.
Author Contributions
Software, X.X.; formal analysis, D.Q.; investigation, Y.N. and Y.M.; resources, L.F.; writing—original draft preparation, Y.N.; writing—review and editing, Y.N. and L.F.; funding acquisition, L.F.
Funding
This research was funded by the National Natural Science Foundation of China (grant number 51575450), the Aeronautical Science Foundation of China (grant number 2016ZE53040), and the Natural Science Foundation of Shaanxi Province (grant number S2016YFJZ0164).
Conflicts of Interest
The authors declare no conflict of interest.
References
- Mishra, R.S.; Ma, Z.Y. Friction stir welding and processing. Mater. Sci. Eng. R 2005, 50, 1–78. [Google Scholar] [CrossRef]
- Shen, Z.K.; Ding, Y.Q.; Gerlich, A.P. Advances in friction stir spot welding. Crit. Rev. Solid State 2019. [Google Scholar] [CrossRef]
- Zhang, J.Y.; Upadhyay, P.; Hovanski, Y.; Field, D.P. High-speed friction stir welding of AA7075-T6 sheet: microstructure, mechanical properties, micro-texture, and thermal history. Metall. Mater. Trans. A 2018, 49, 210–222. [Google Scholar] [CrossRef]
- Zhang, J.Y.; Upadhyay, P.; Hovanski, Y.; Field, D.P. High-Speed FSW aluminum alloy 7075 microstructure and corrosion properties. In Friction Stir Welding and Processing, 9th ed.; Hovanski, Y., Mishra, R., Sato, Y., Upadhyay, P., Yan, D., Eds.; Springer: Cham, Switzerland, 2017; pp. 125–135. [Google Scholar]
- Azimzadegan, T.; Serajzadeh, S. An investigation into microstructures and mechanical properties of AA7075-T6 during friction stir welding at relatively high rotational speeds. J. Mater. Eng. Perform. 2010, 19, 1256–1263. [Google Scholar] [CrossRef]
- Sithole, K.; Rao, V.V. Recent developments in micro friction stir welding: A review. Mater. Sci. Eng. 2016. [Google Scholar] [CrossRef]
- Jamshidi Aval, H.; Serajzadeh, S.; Kokabi, A.H. Experimental and theoretical evaluations of thermal histories and residual stresses in dissimilar friction stir welding of AA5086-AA6061. Int. J. Adv. Manuf. Technol. 2012, 61, 149–160. [Google Scholar] [CrossRef]
- Wang, W.D.; Deng, D.A.; Mao, Z.T.; Tong, Y.G.; Ran, Y. Influence of tool rotation rates on temperature profiles and mechanical properties of friction stir welded AZ31 magnesium alloy. Int. J. Adv. Manuf. Technol. 2017, 88, 2191–2200. [Google Scholar] [CrossRef]
- Mao, Y.Q.; Ke, L.M.; Liu, F.C.; Chen, Y.H.; Li, X. Investigations on temperature distribution, microstructure evolution, and property variations along thickness in friction stir welded joints for thick AA7075-T6 plates. Int. J. Adv. Manuf. Technol. 2016, 86, 141–154. [Google Scholar]
- Shi, Q.Y.; Silvanus, J.; Liu, Y.; Yan, D.Y.; Li, H.K. Experimental study on distortion of Al-6013 plate after friction stir welding. Sci. Technol. Weld. Join. 2008, 13, 472–478. [Google Scholar] [CrossRef]
- Xu, W.F.; Liu, J.H.; Zhu, H.Q. Analysis of residual stresses in thick aluminum friction stir welded butt joints. Mater. Des. 2017, 32, 2000–2005. [Google Scholar] [CrossRef]
- Prime, M.B.; Gnaupel-Herold, T.; Baumann, J.A.; Lederich, R.J.; Bowden, D.M.; Sebring, R.J. Residual stress measurements in a thick, dissimilar aluminum alloy friction stir weld. Acta. Mater. 2006, 54, 4013–4021. [Google Scholar] [CrossRef]
- Zapata, J.; Toro, M.; Lopez, D. Residual stresses in friction stir dissimilar welding of aluminum alloys. J. Mater. Process. Technol. 2016, 229, 121–127. [Google Scholar] [CrossRef]
- Lombard, H.; Hattingh, D.G.; Steuwer, A.; James, M.N. Effect of process parameters on the residual stresses in AA5083-H321 friction stir welds. Mater. Sci. Eng. A 2009, 501, 119–124. [Google Scholar] [CrossRef]
- Liu, X.L.; Xie, P.; Wimpory, R.; Li, W.Y.; Lai, R.L.; Chen, D.F.; Liu, Y.T.; Zhao, H.Y. Residual stress, microstructure and mechanical properties in thick 6005A-T6 aluminium alloy friction stir welds. Metals 2019, 9, 803. [Google Scholar] [CrossRef]
- Wei, H.Y.; Tariq, M.; Hussain, G.; Khan, I.; Khan, M.I.; Khan, W.A. Butt joining of Bi-layered aluminum sheets through friction stir welding: Tensile stresses, bending stresses, residual stresses, and fractrography. Metals 2019, 9, 384. [Google Scholar] [CrossRef]
- Altenkirch, J.; Steuwer, A.; Withers, P.J.; Williams, S.W.; Poad, M.; Wen, S.W. Residual stress engineering in friction stir welds by roller tensioning. Sci. Technol. Weld. Join. 2009, 14, 185–192. [Google Scholar] [CrossRef]
- Richards, D.G.; Prangnell, P.B.; Williams, S.W.; Withers, P.J. Global mechanical tensioning for the management of residual stresses in welds. Mater. Sci. Eng. A 2008, 489, 351–362. [Google Scholar] [CrossRef]
- Hatamleh, O.; Rivero, I.V.; Swain, S.E. An investigation of the residual stress characterization and relaxation in peened friction stir welded aluminum-lithium alloy joints. Mater. Des. 2009, 30, 3367–3373. [Google Scholar] [CrossRef]
- Li, T.; Shi, Q.Y.; Li, H.K. Residual stresses simulation for friction stir welded joint. Sci. Technol. Weld. Join. 2007, 12, 664–670. [Google Scholar] [CrossRef]
- Buffa, G.; Ducato, A.; Fratini, L. Numerical procedure for residual stresses prediction in friction stir welding. Finite Elem. Anal. Des. 2011, 47, 470–476. [Google Scholar] [CrossRef]
- Feng, Z.; Wang, X.L.; David, S.A.; Sklad, P.S. Modelling of residual stresses and property distributions in friction stir welds of aluminium alloy 6061-T6. Sci. Technol. Weld. Join. 2007, 12, 348–356. [Google Scholar] [CrossRef]
- Woo, W.; Choo, H.; Brown, D.W.; Feng, Z.L.; Liaw, P.K. Angular distortion and through-thickness residual stress distribution in the friction-stir processed 6061-T6 aluminum alloy. Mater. Sci. Eng. A 2006, 437, 64–69. [Google Scholar] [CrossRef]
- Richter-Trummer, V.; Suzano, E.; Beltrao, M.; Roos, A.; dos Santos, J.F.; de Castro, P.M.S.T. Influence of the FSW clamping force on the final distortion and residual stress field. Mater. Sci. Eng. A 2012, 538, 81–88. [Google Scholar] [CrossRef]
- Yan, D.Y.; Wu, A.P.; Silvanus, J.; Shi, Q.Y. Predicting residual distortion of aluminum alloy stiffened sheet after friction stir welding by numerical simulation. Mater. Des. 2011, 32, 2284–2291. [Google Scholar] [CrossRef]
- Costa, M.I.; Leital, C.; Rodrigues, D.M. Parametric study of friction stir welding induced distortion in thin aluminium alloy plates: A coupled numerical and experimental analysis. Thin Wall Struct. 2019, 134, 268–276. [Google Scholar] [CrossRef]
- Wen, Q.; Ji, S.D.; Zhang, L.G.; Yue, Y.M.; Lv, Z. Temperature, stress and distortion of Ti–6Al–4V alloy low-temperature friction stir welding assisted by trailing intensive cooling. Trans. Indian Inst. Met. 2018, 71, 3003–3009. [Google Scholar] [CrossRef]
- He, W.L.; Li, M.S.; Song, Q.; Liu, J.L.; Hu, W. Efficacy of external stationary shoulder for controlling residual stress and distortion in friction stir welding. Trans. Indian Inst. Met. 2019, 72, 1349–1359. [Google Scholar] [CrossRef]
Figure 1.
Profiles of friction stir welding (FSW) tools: (a) pin tool and (b) pinless tool.

Figure 2.
Detailed dimensions of FSW tools: (a) pin tool and (b) pinless tool.
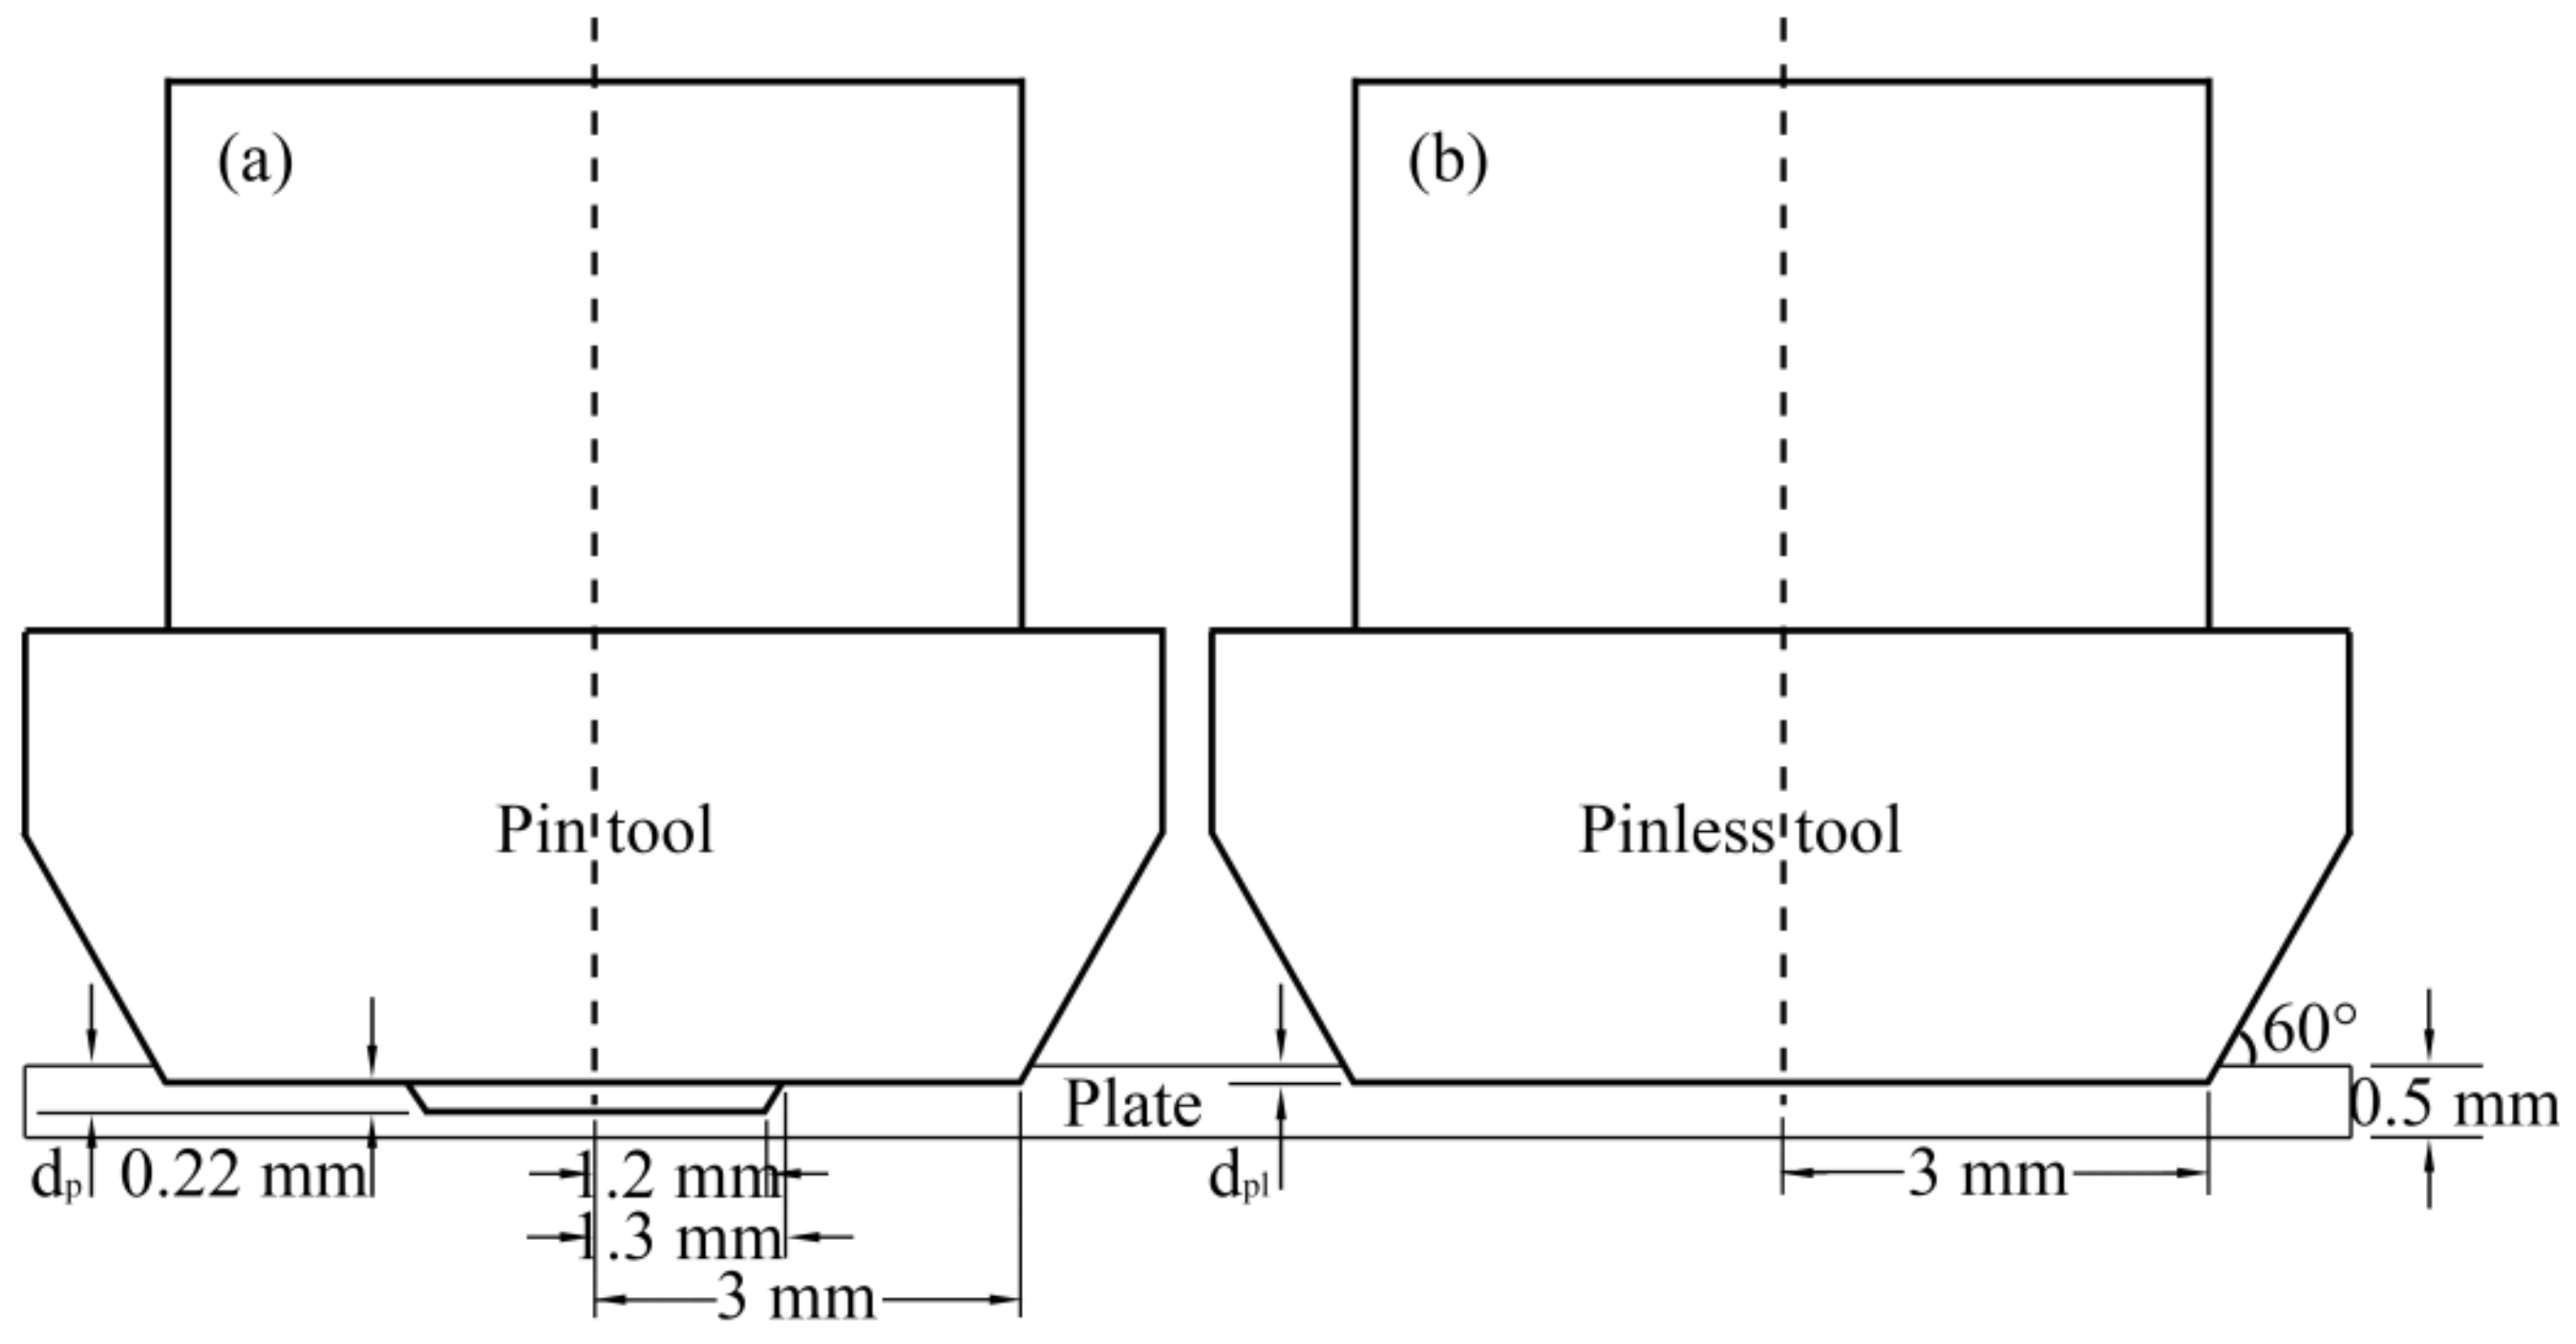
Figure 3.
Welding schematic diagram and coordinate definition.
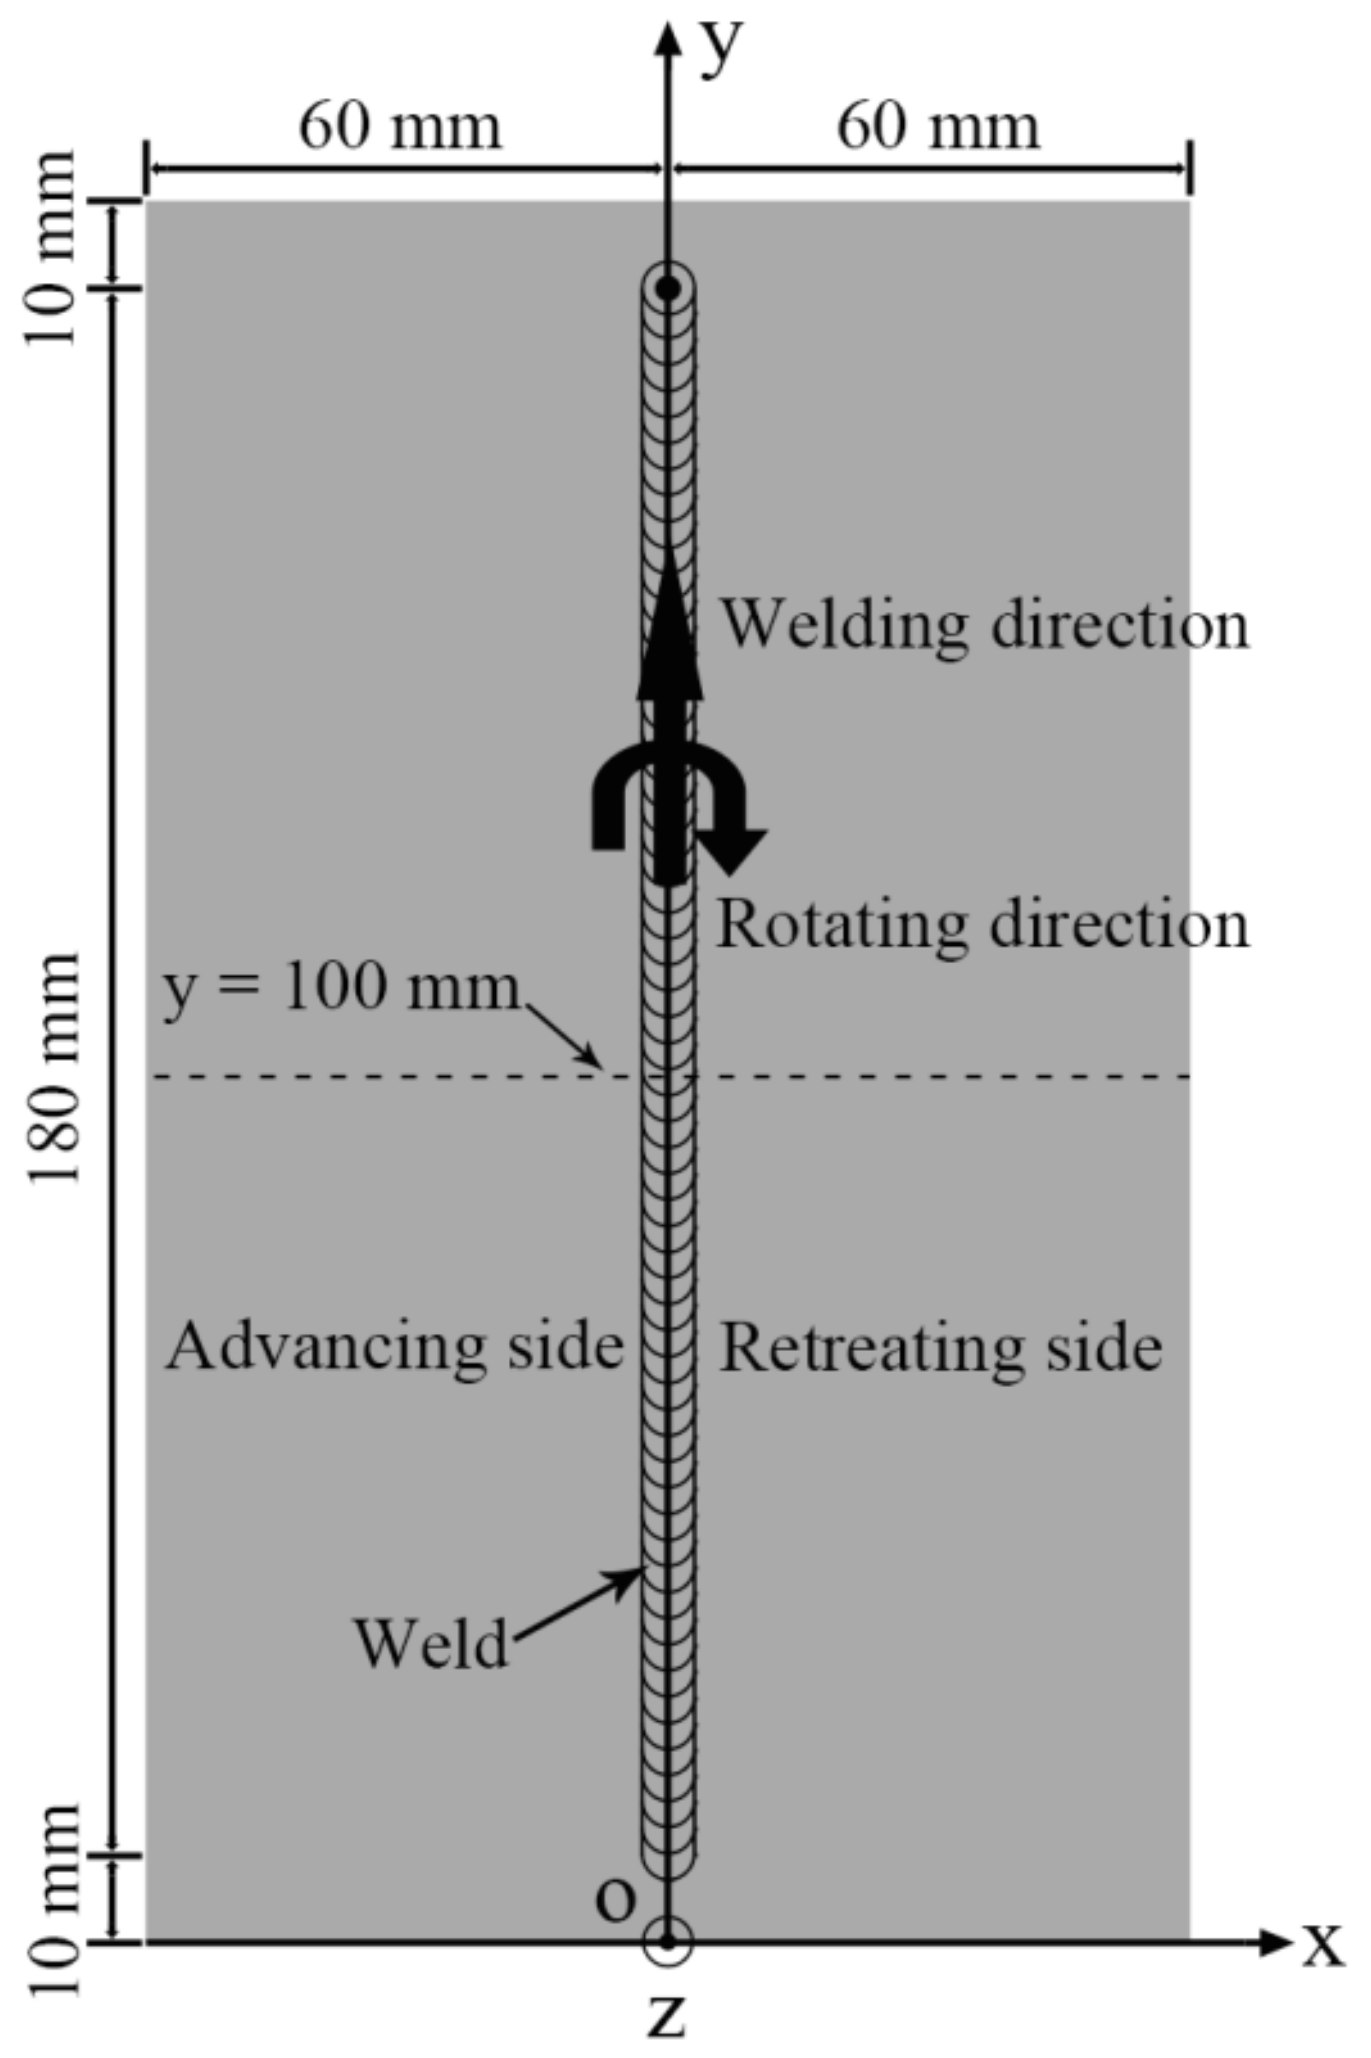
Figure 4.
Schematic of temperature measurement.
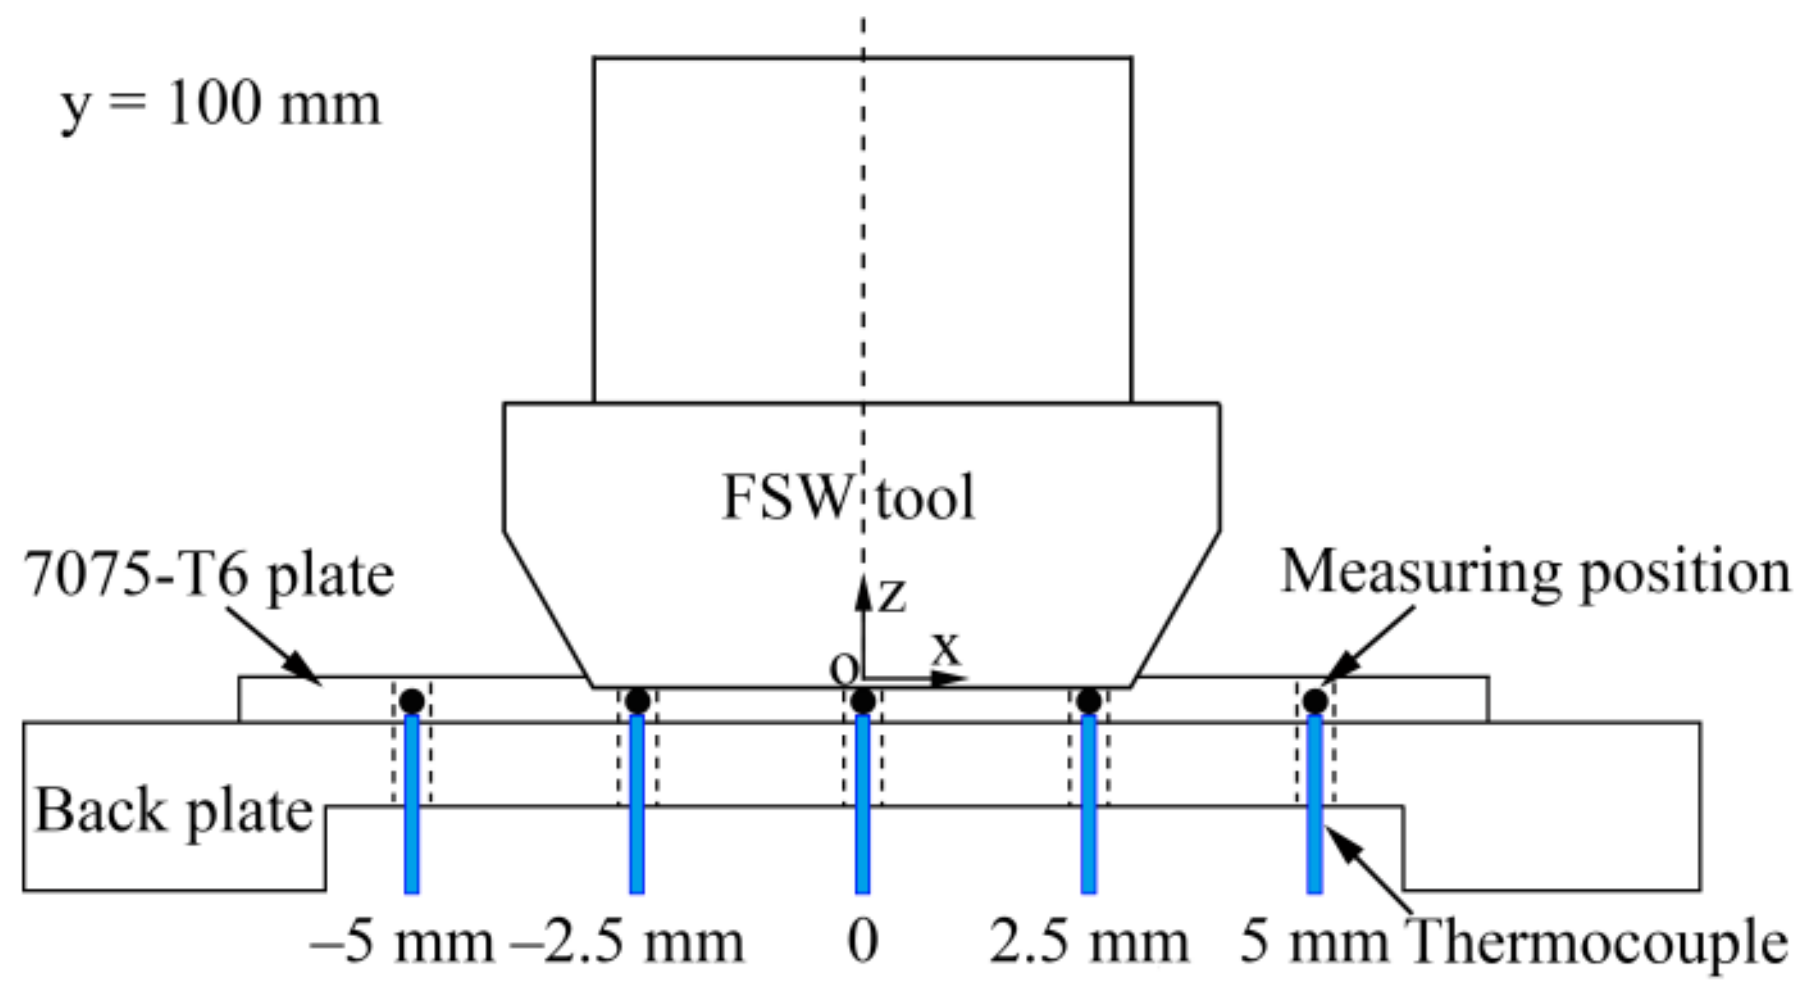
Figure 5.
Deformation characteristics of μFSW: (a) overall anti-saddle deformation, (b) longitudinal bending deformation, and (c) transverse angular deformation.
Figure 5.
Deformation characteristics of μFSW: (a) overall anti-saddle deformation, (b) longitudinal bending deformation, and (c) transverse angular deformation.
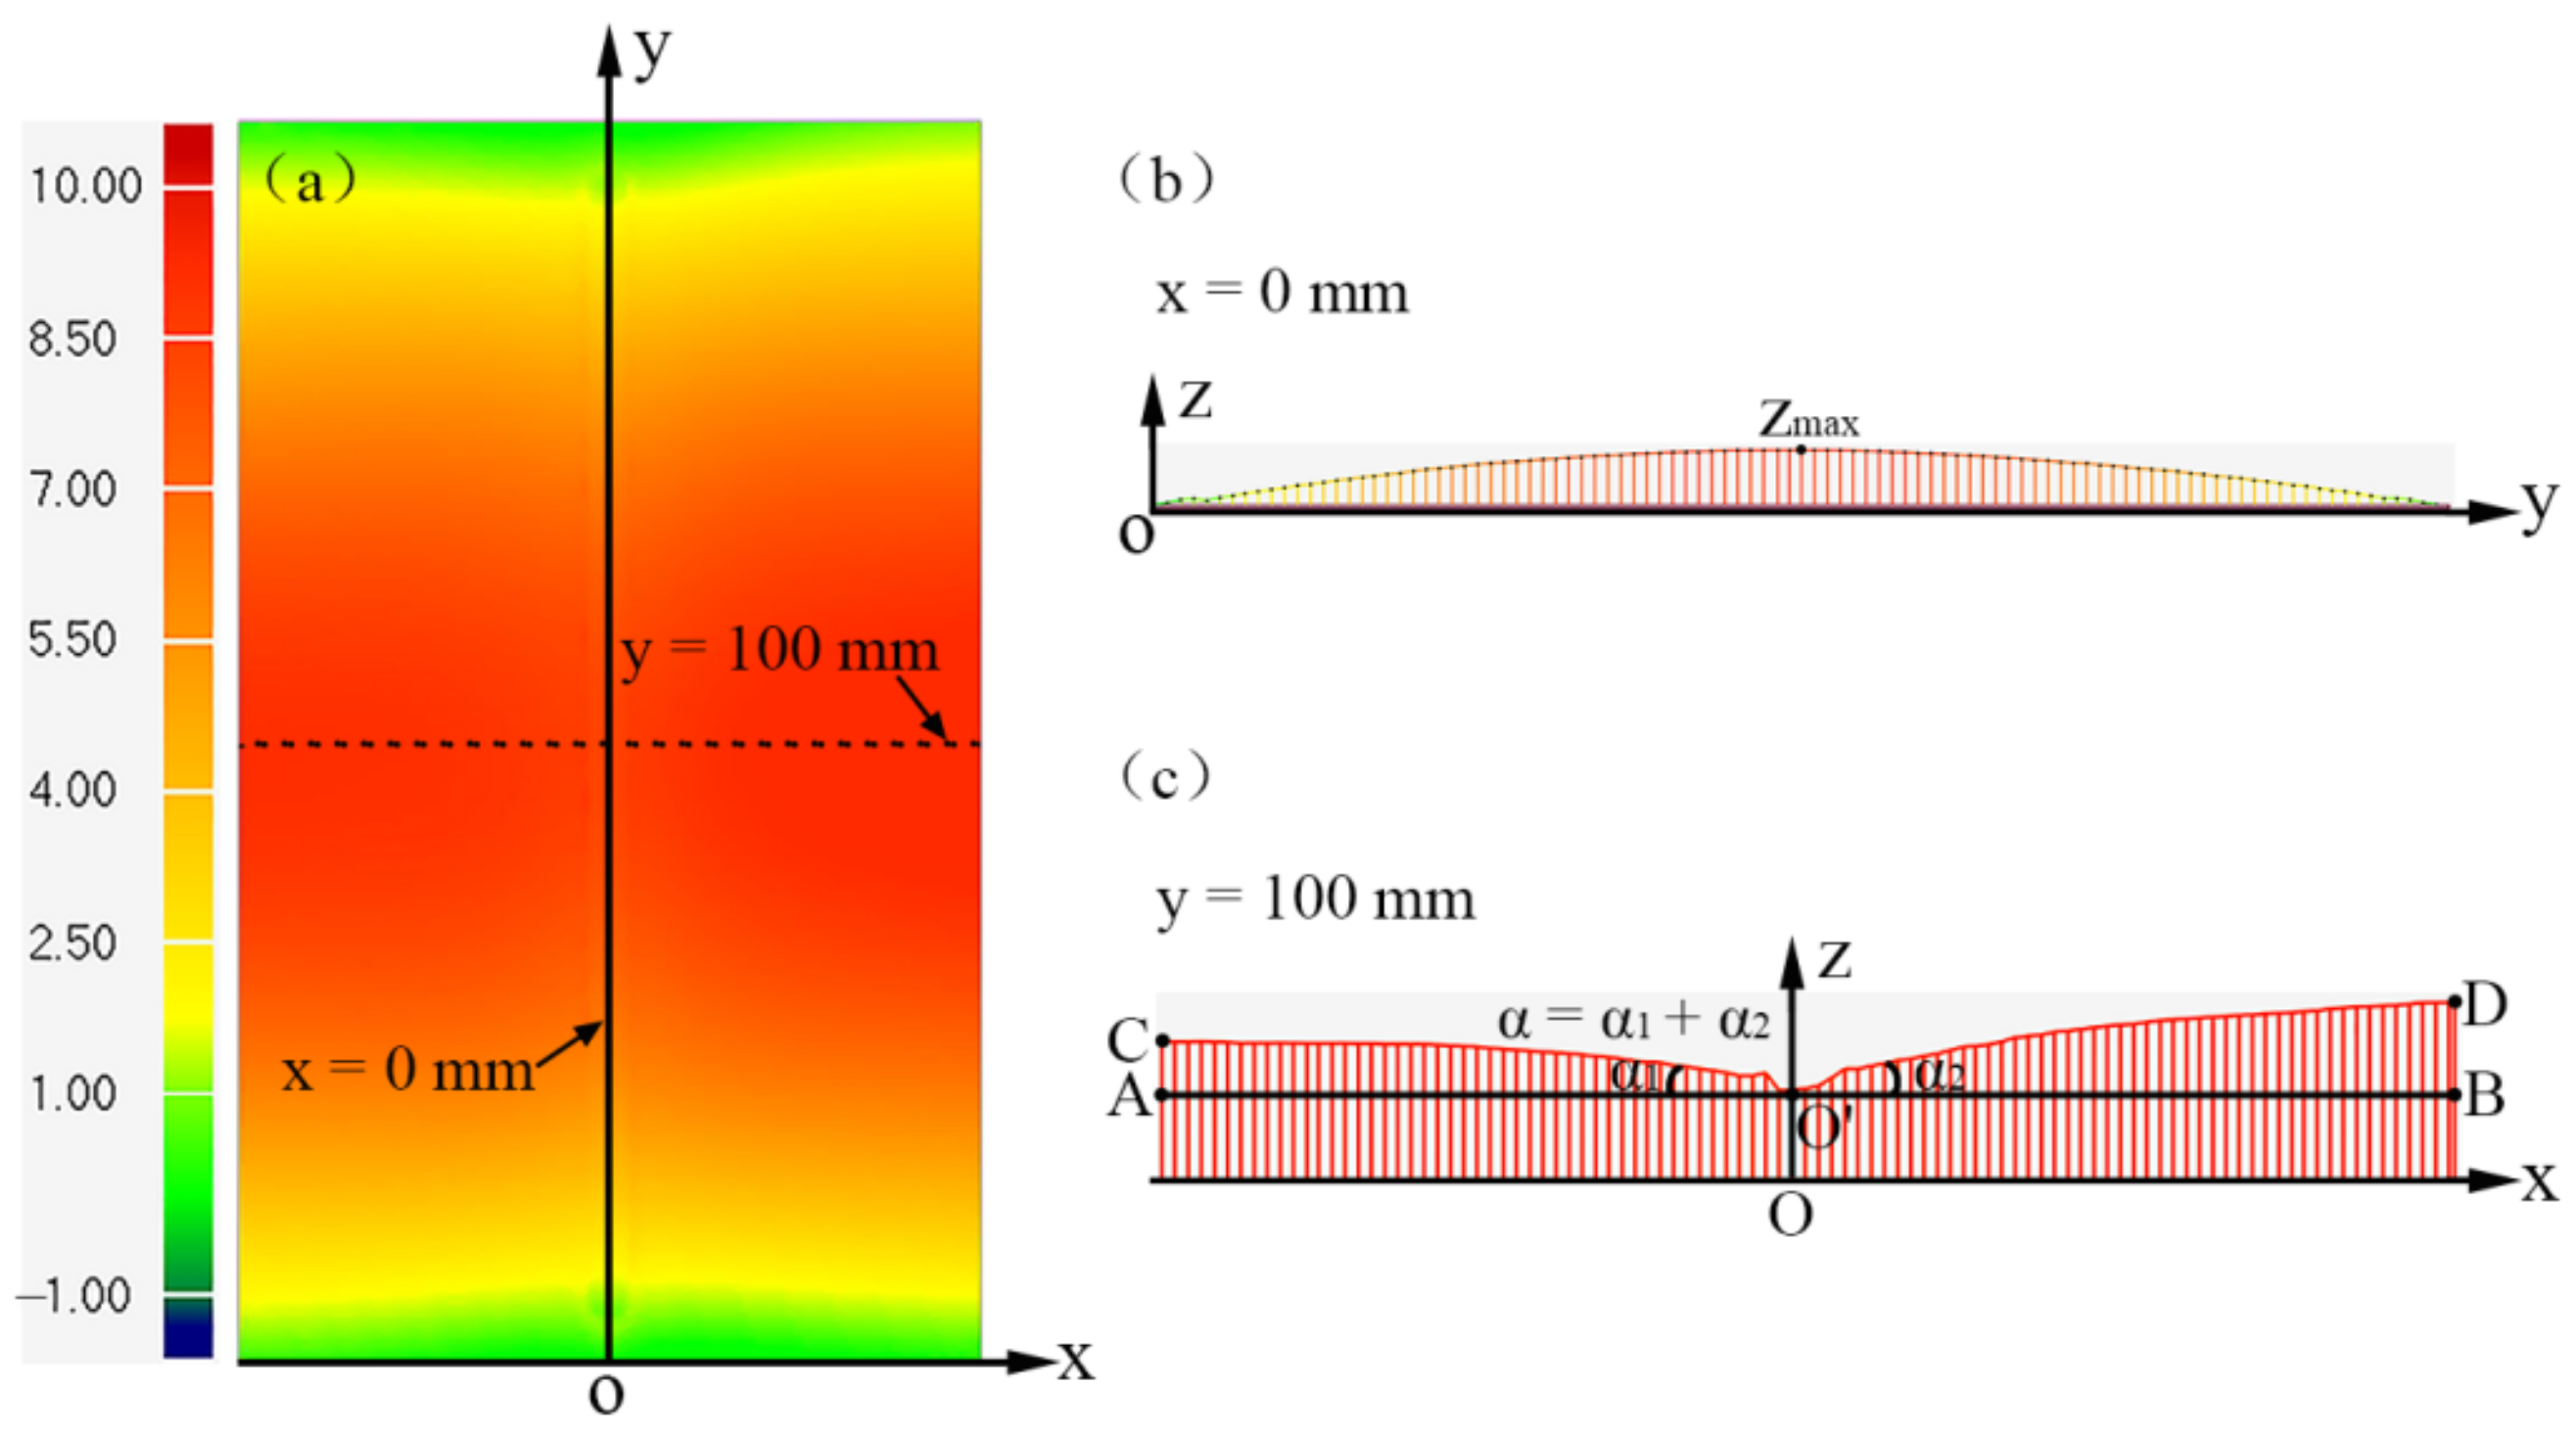
Figure 6.
Surface appearances of joints produced using parameters of (a) 3000-600-P-Fe, (b) 6000-600-P-Fe, (c) 6000-1200-P-Fe, (d) 6000-600-PL-Fe, and (e) 6000-600-P-Cu.
Figure 6.
Surface appearances of joints produced using parameters of (a) 3000-600-P-Fe, (b) 6000-600-P-Fe, (c) 6000-1200-P-Fe, (d) 6000-600-PL-Fe, and (e) 6000-600-P-Cu.
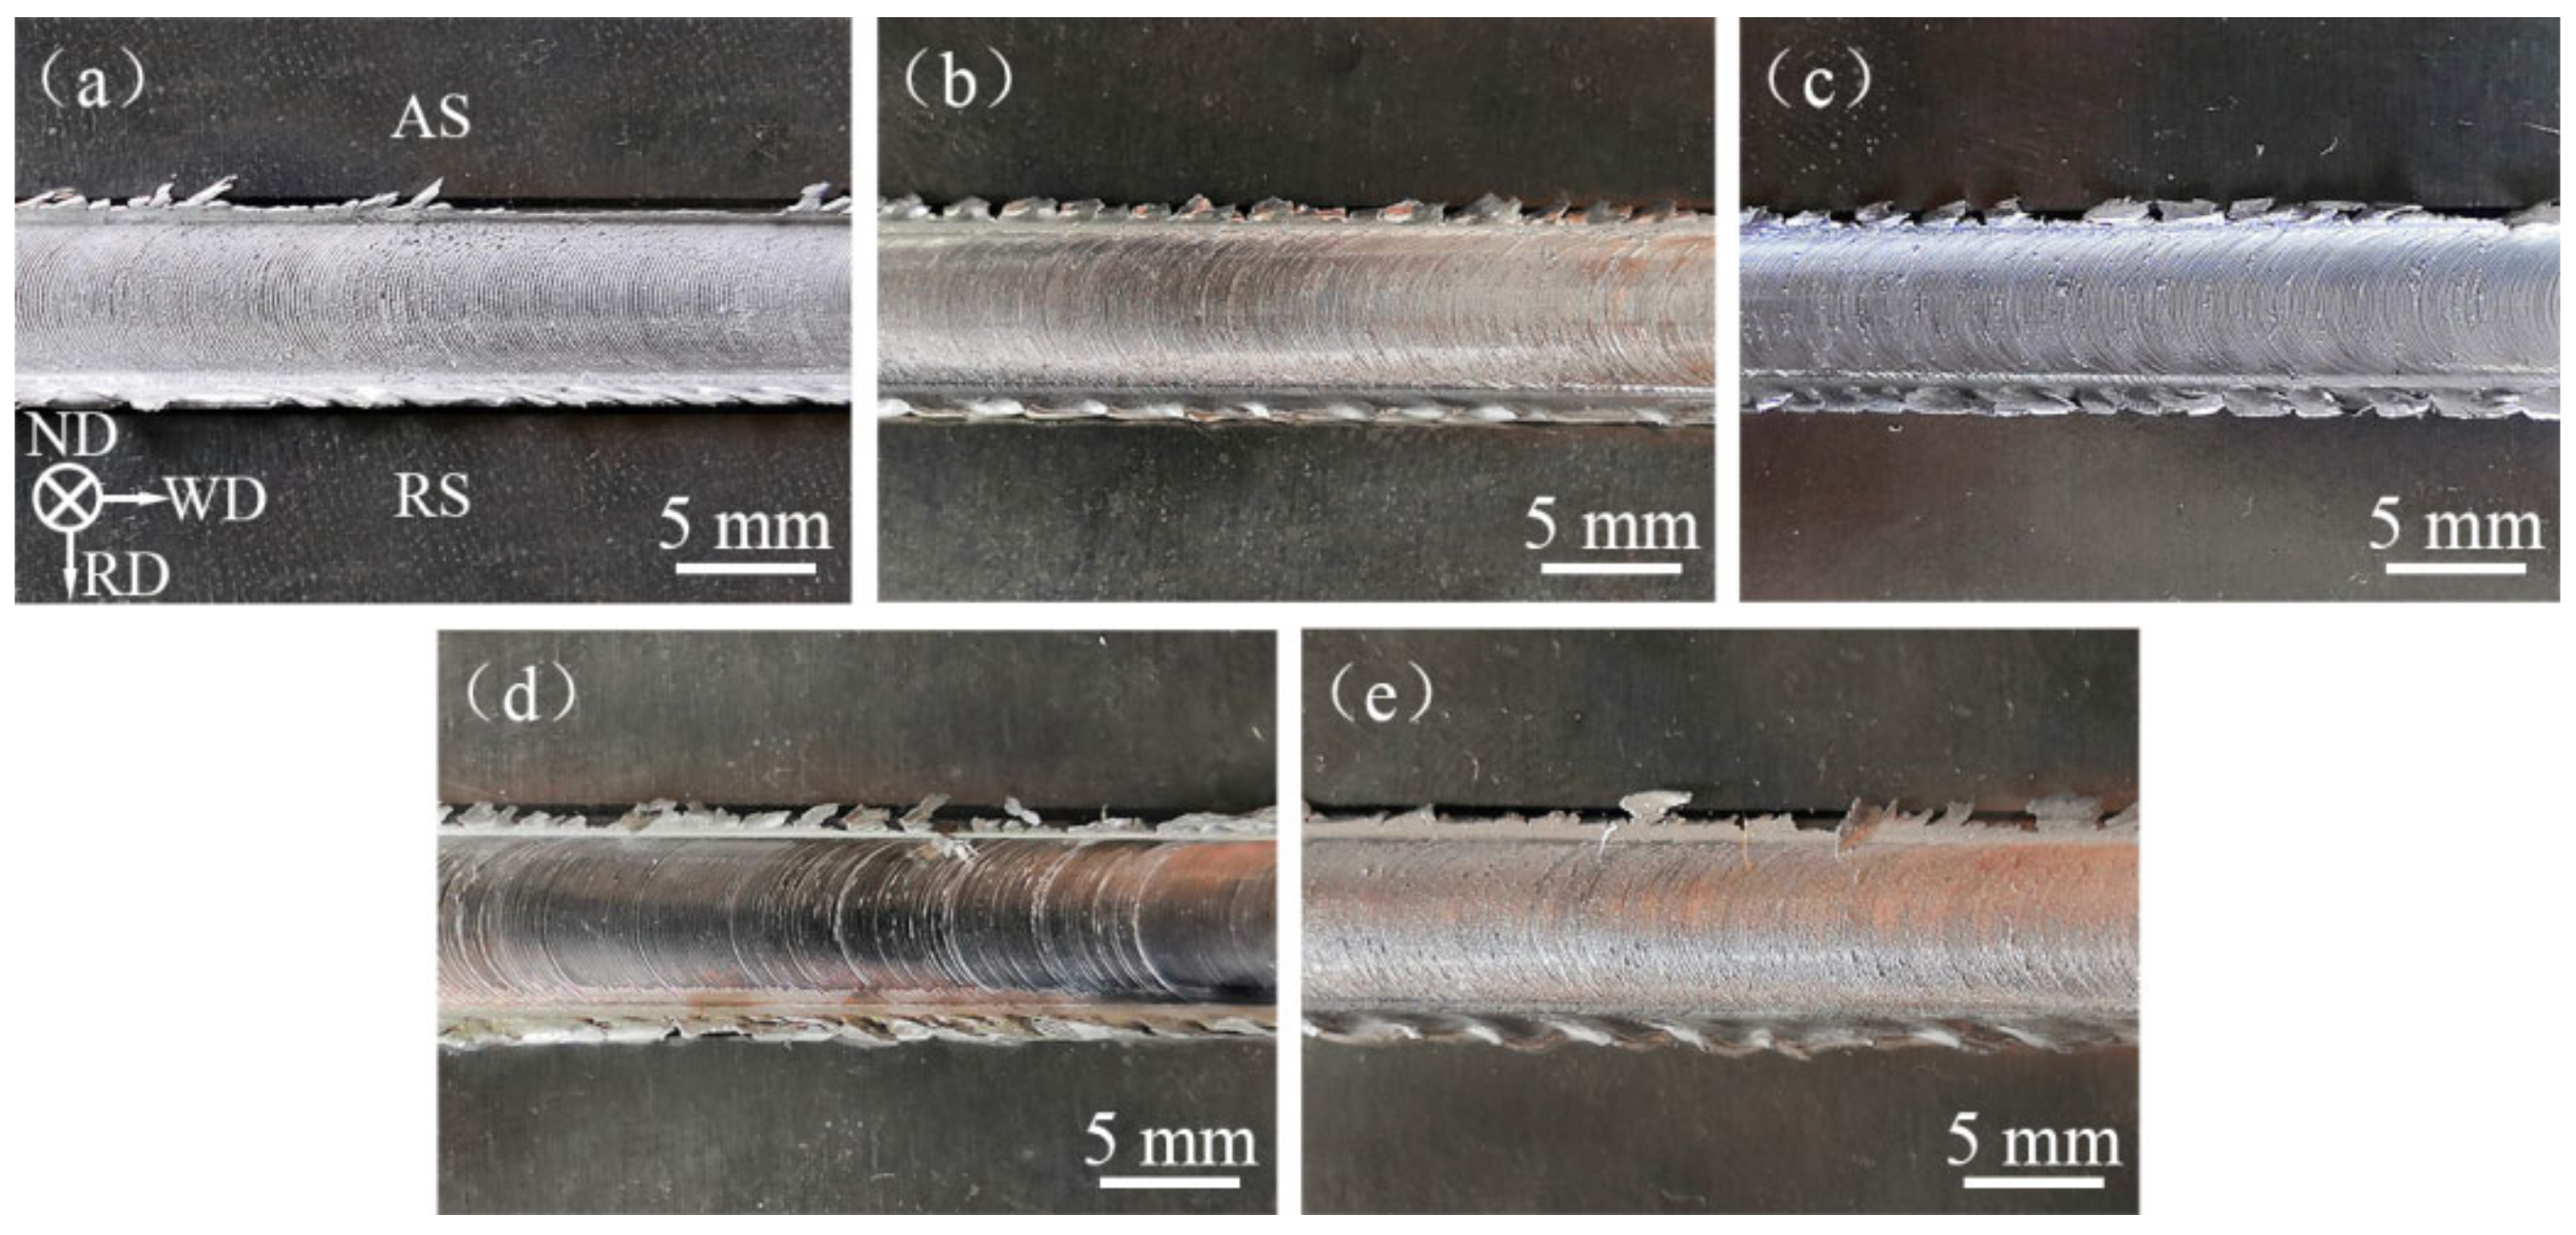
Figure 7.
Transverse cross sections of the joints produced using parameters of (a) 3000-600-P-Fe, (b) 6000-600-P-Fe, (c) 6000-1200-P-Fe, (d) 6000-600-PL-Fe, and (e) 6000-600-P-Cu.
Figure 7.
Transverse cross sections of the joints produced using parameters of (a) 3000-600-P-Fe, (b) 6000-600-P-Fe, (c) 6000-1200-P-Fe, (d) 6000-600-PL-Fe, and (e) 6000-600-P-Cu.
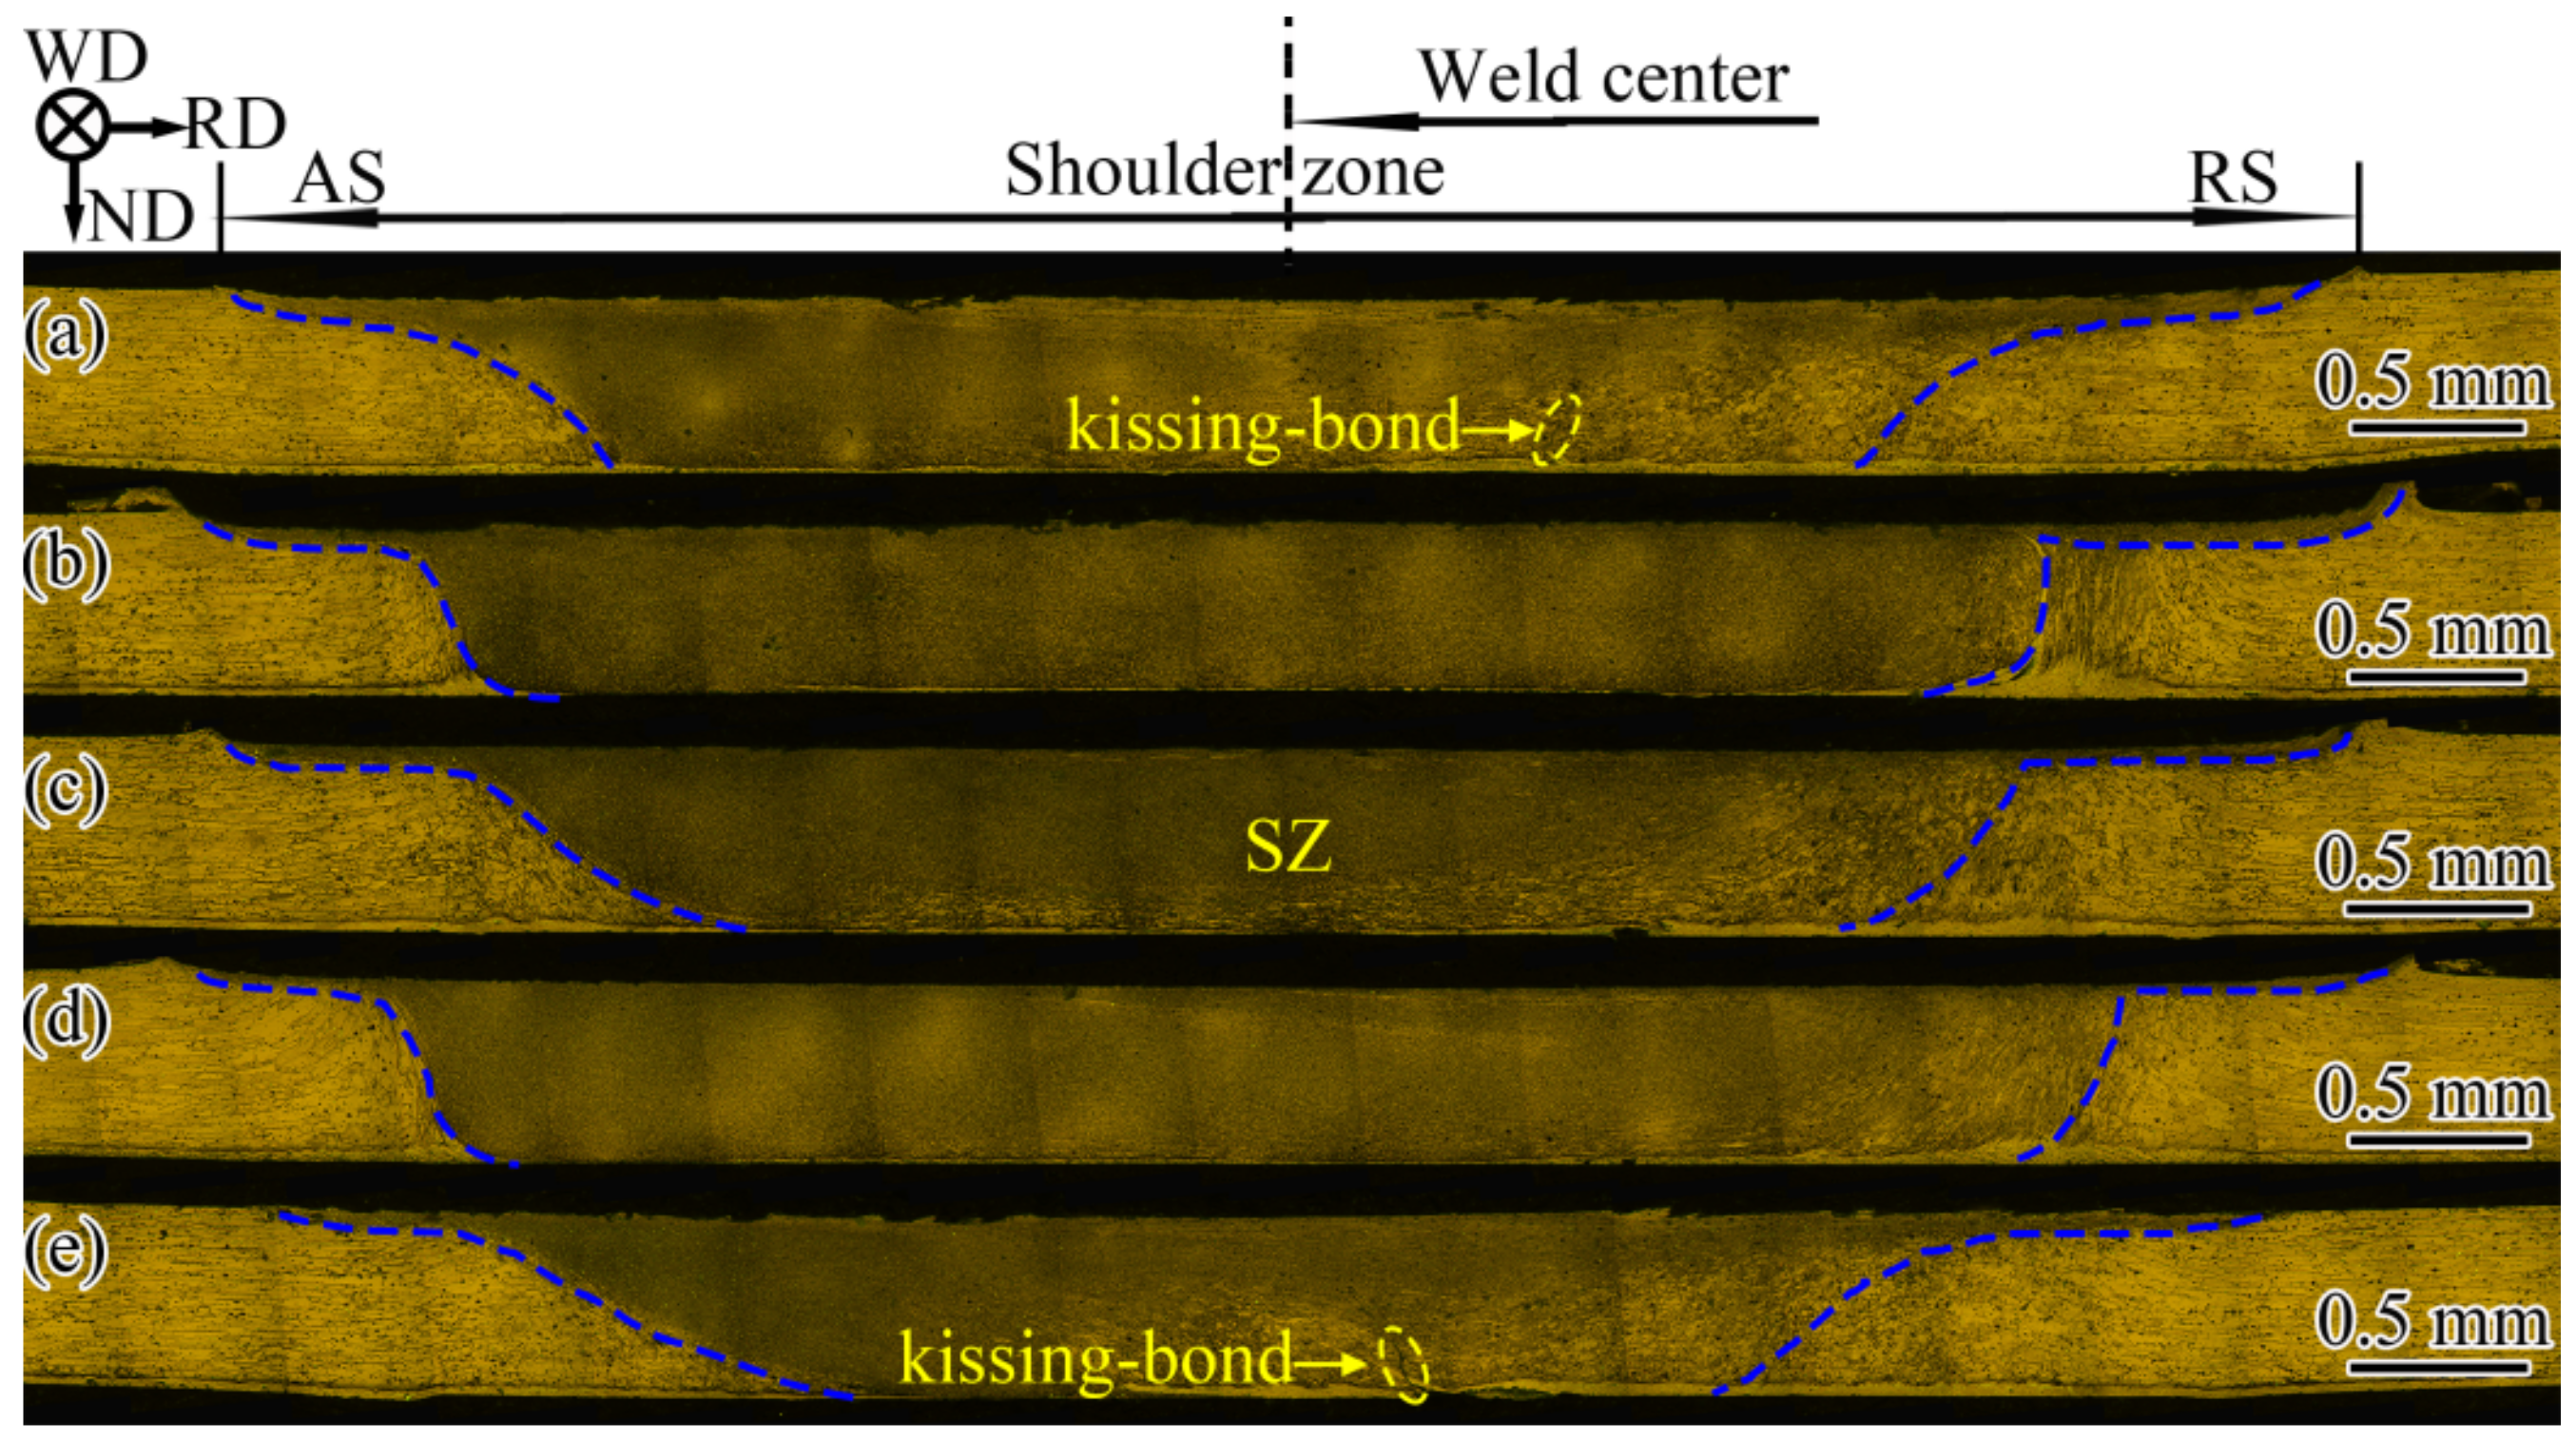
Figure 8.
Welding thermal cycles of the joints produced using parameters of (a) 3000-600-P-Fe, (b) 6000-600-P-Fe, (c) 6000-1200-P-Fe, and (d) 6000-600-PL-Fe.
Figure 8.
Welding thermal cycles of the joints produced using parameters of (a) 3000-600-P-Fe, (b) 6000-600-P-Fe, (c) 6000-1200-P-Fe, and (d) 6000-600-PL-Fe.
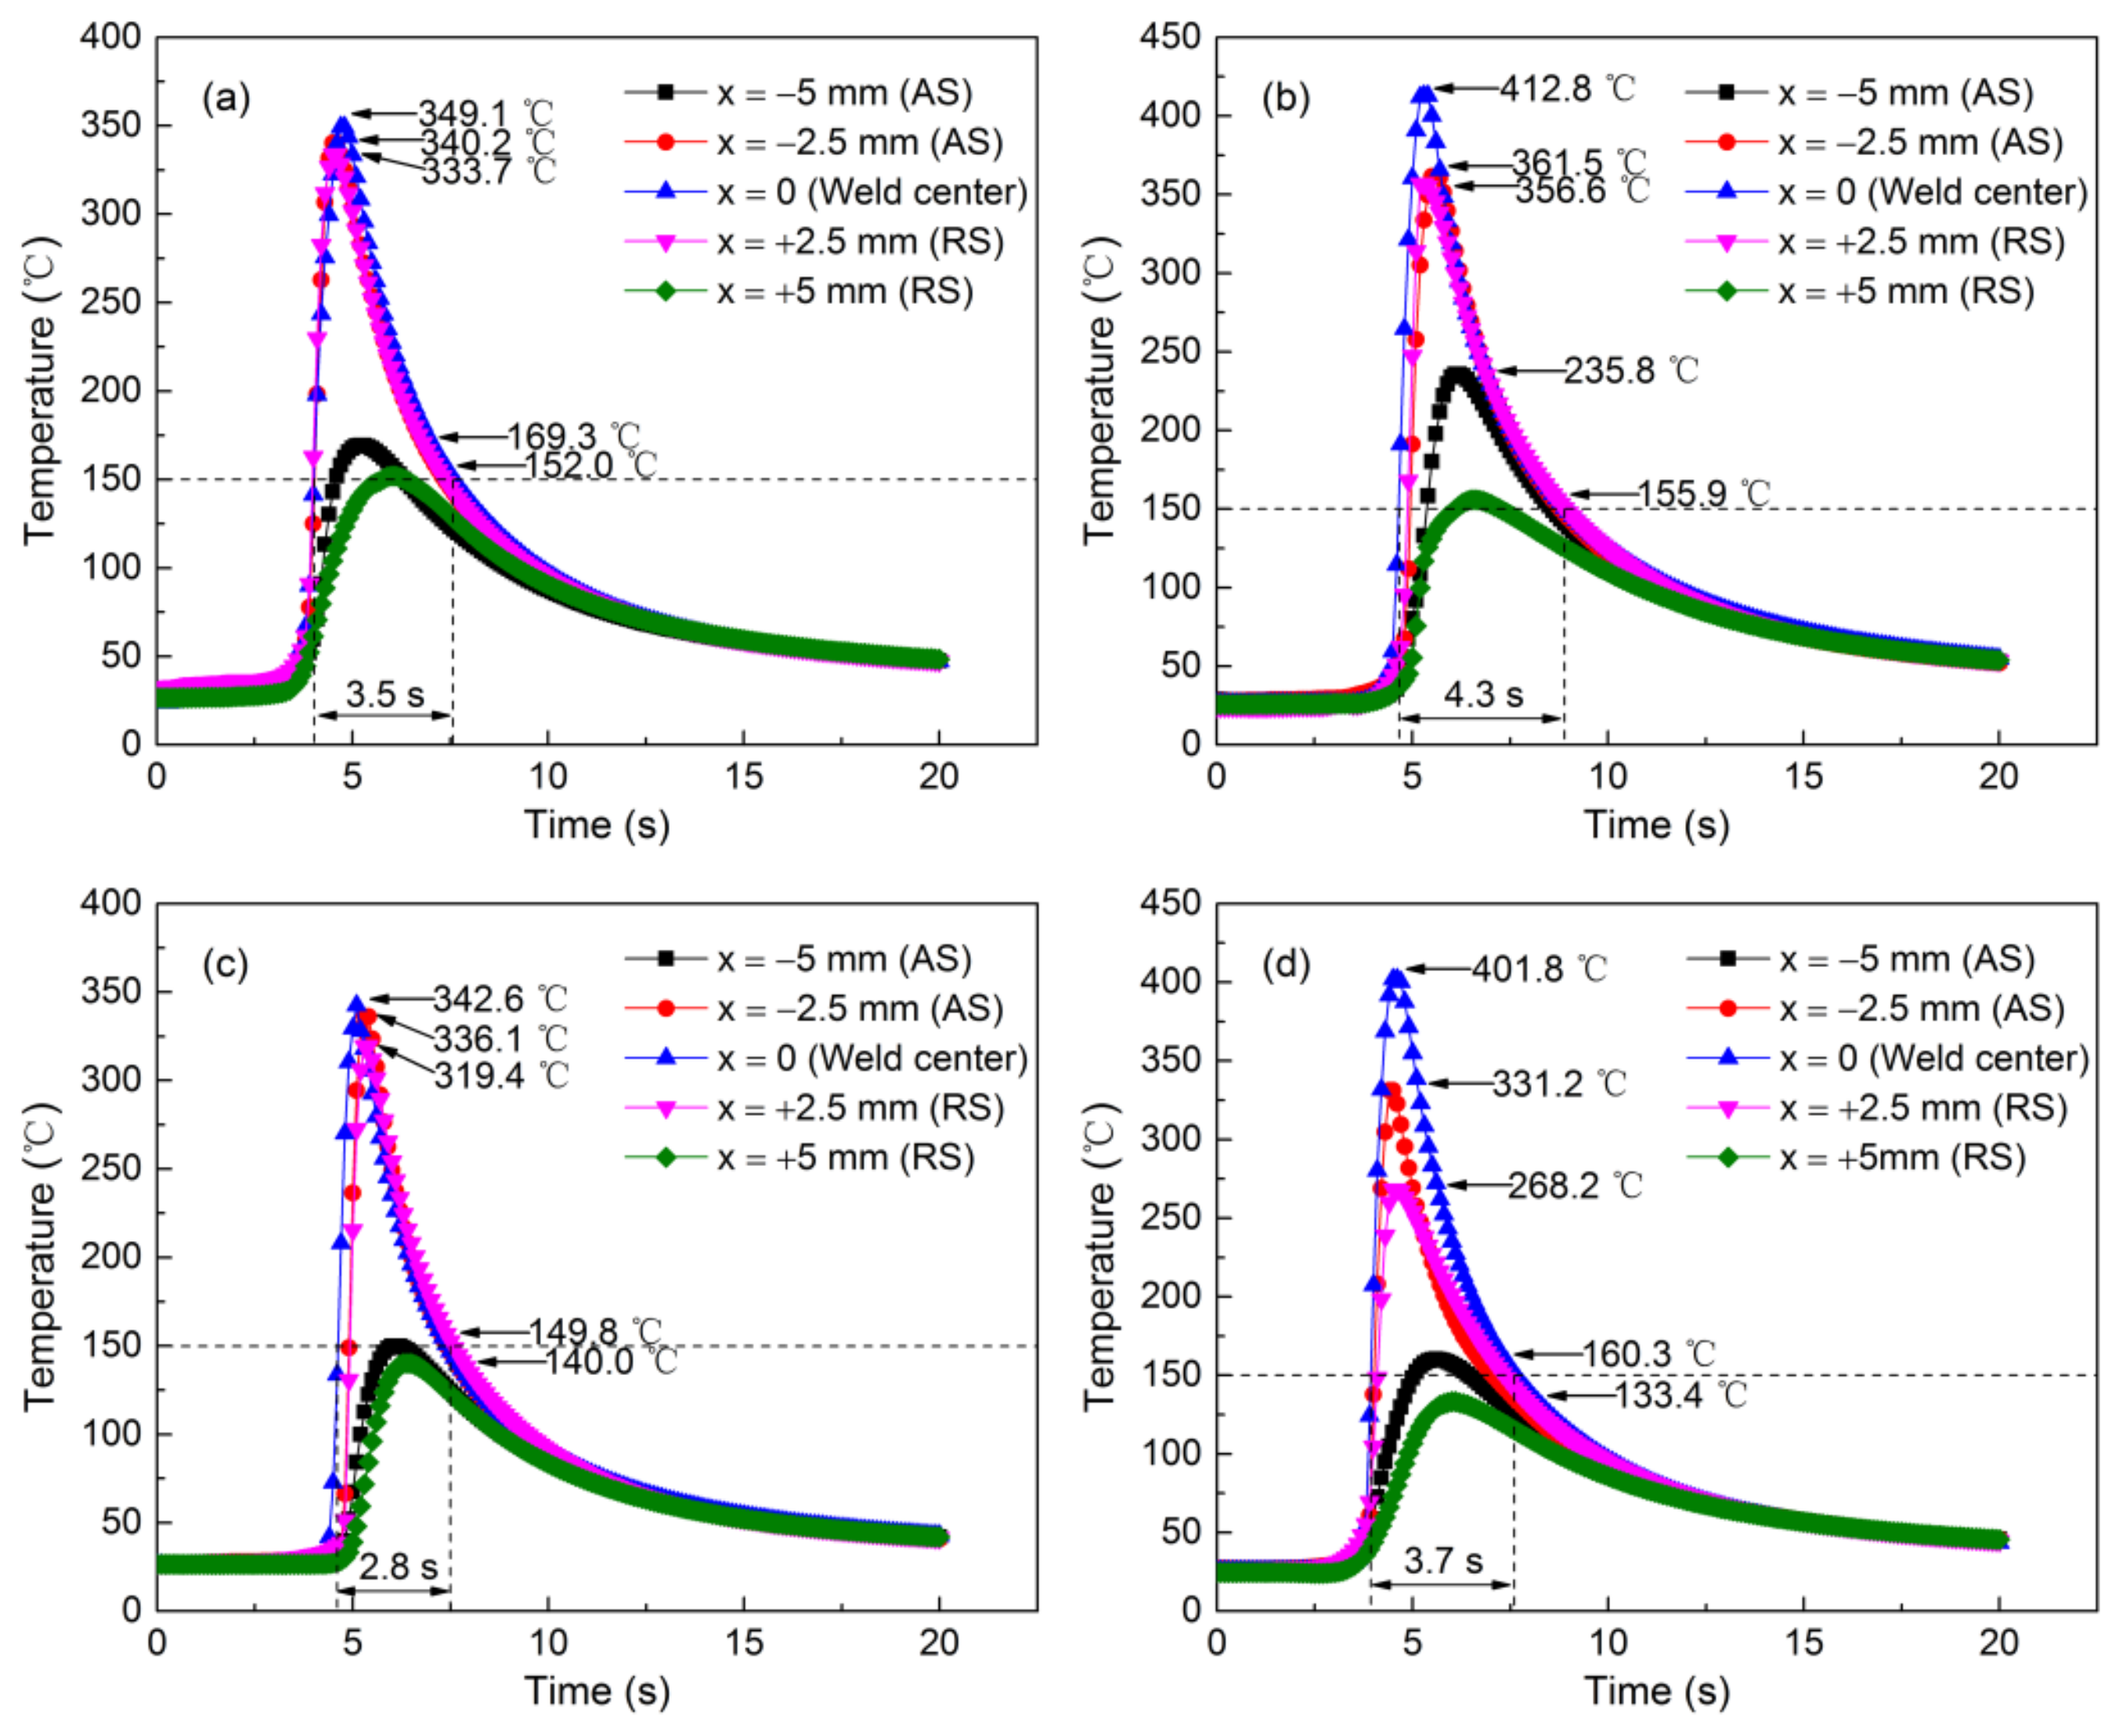
Figure 9.
Deformation comparison for different rotational speeds: (a) in longitudinal direction at position x = 0, (b) in transverse direction at position y = 100 mm, and (c) longitudinal maximum bending deformation and transverse angular deformation.
Figure 9.
Deformation comparison for different rotational speeds: (a) in longitudinal direction at position x = 0, (b) in transverse direction at position y = 100 mm, and (c) longitudinal maximum bending deformation and transverse angular deformation.

Figure 10.
Deformation comparison for different welding speeds: (a) in longitudinal direction at position x = 0, (b) in transverse direction at position y = 100 mm, and (c) longitudinal maximum bending deformation and transverse angular deformation.
Figure 10.
Deformation comparison for different welding speeds: (a) in longitudinal direction at position x = 0, (b) in transverse direction at position y = 100 mm, and (c) longitudinal maximum bending deformation and transverse angular deformation.
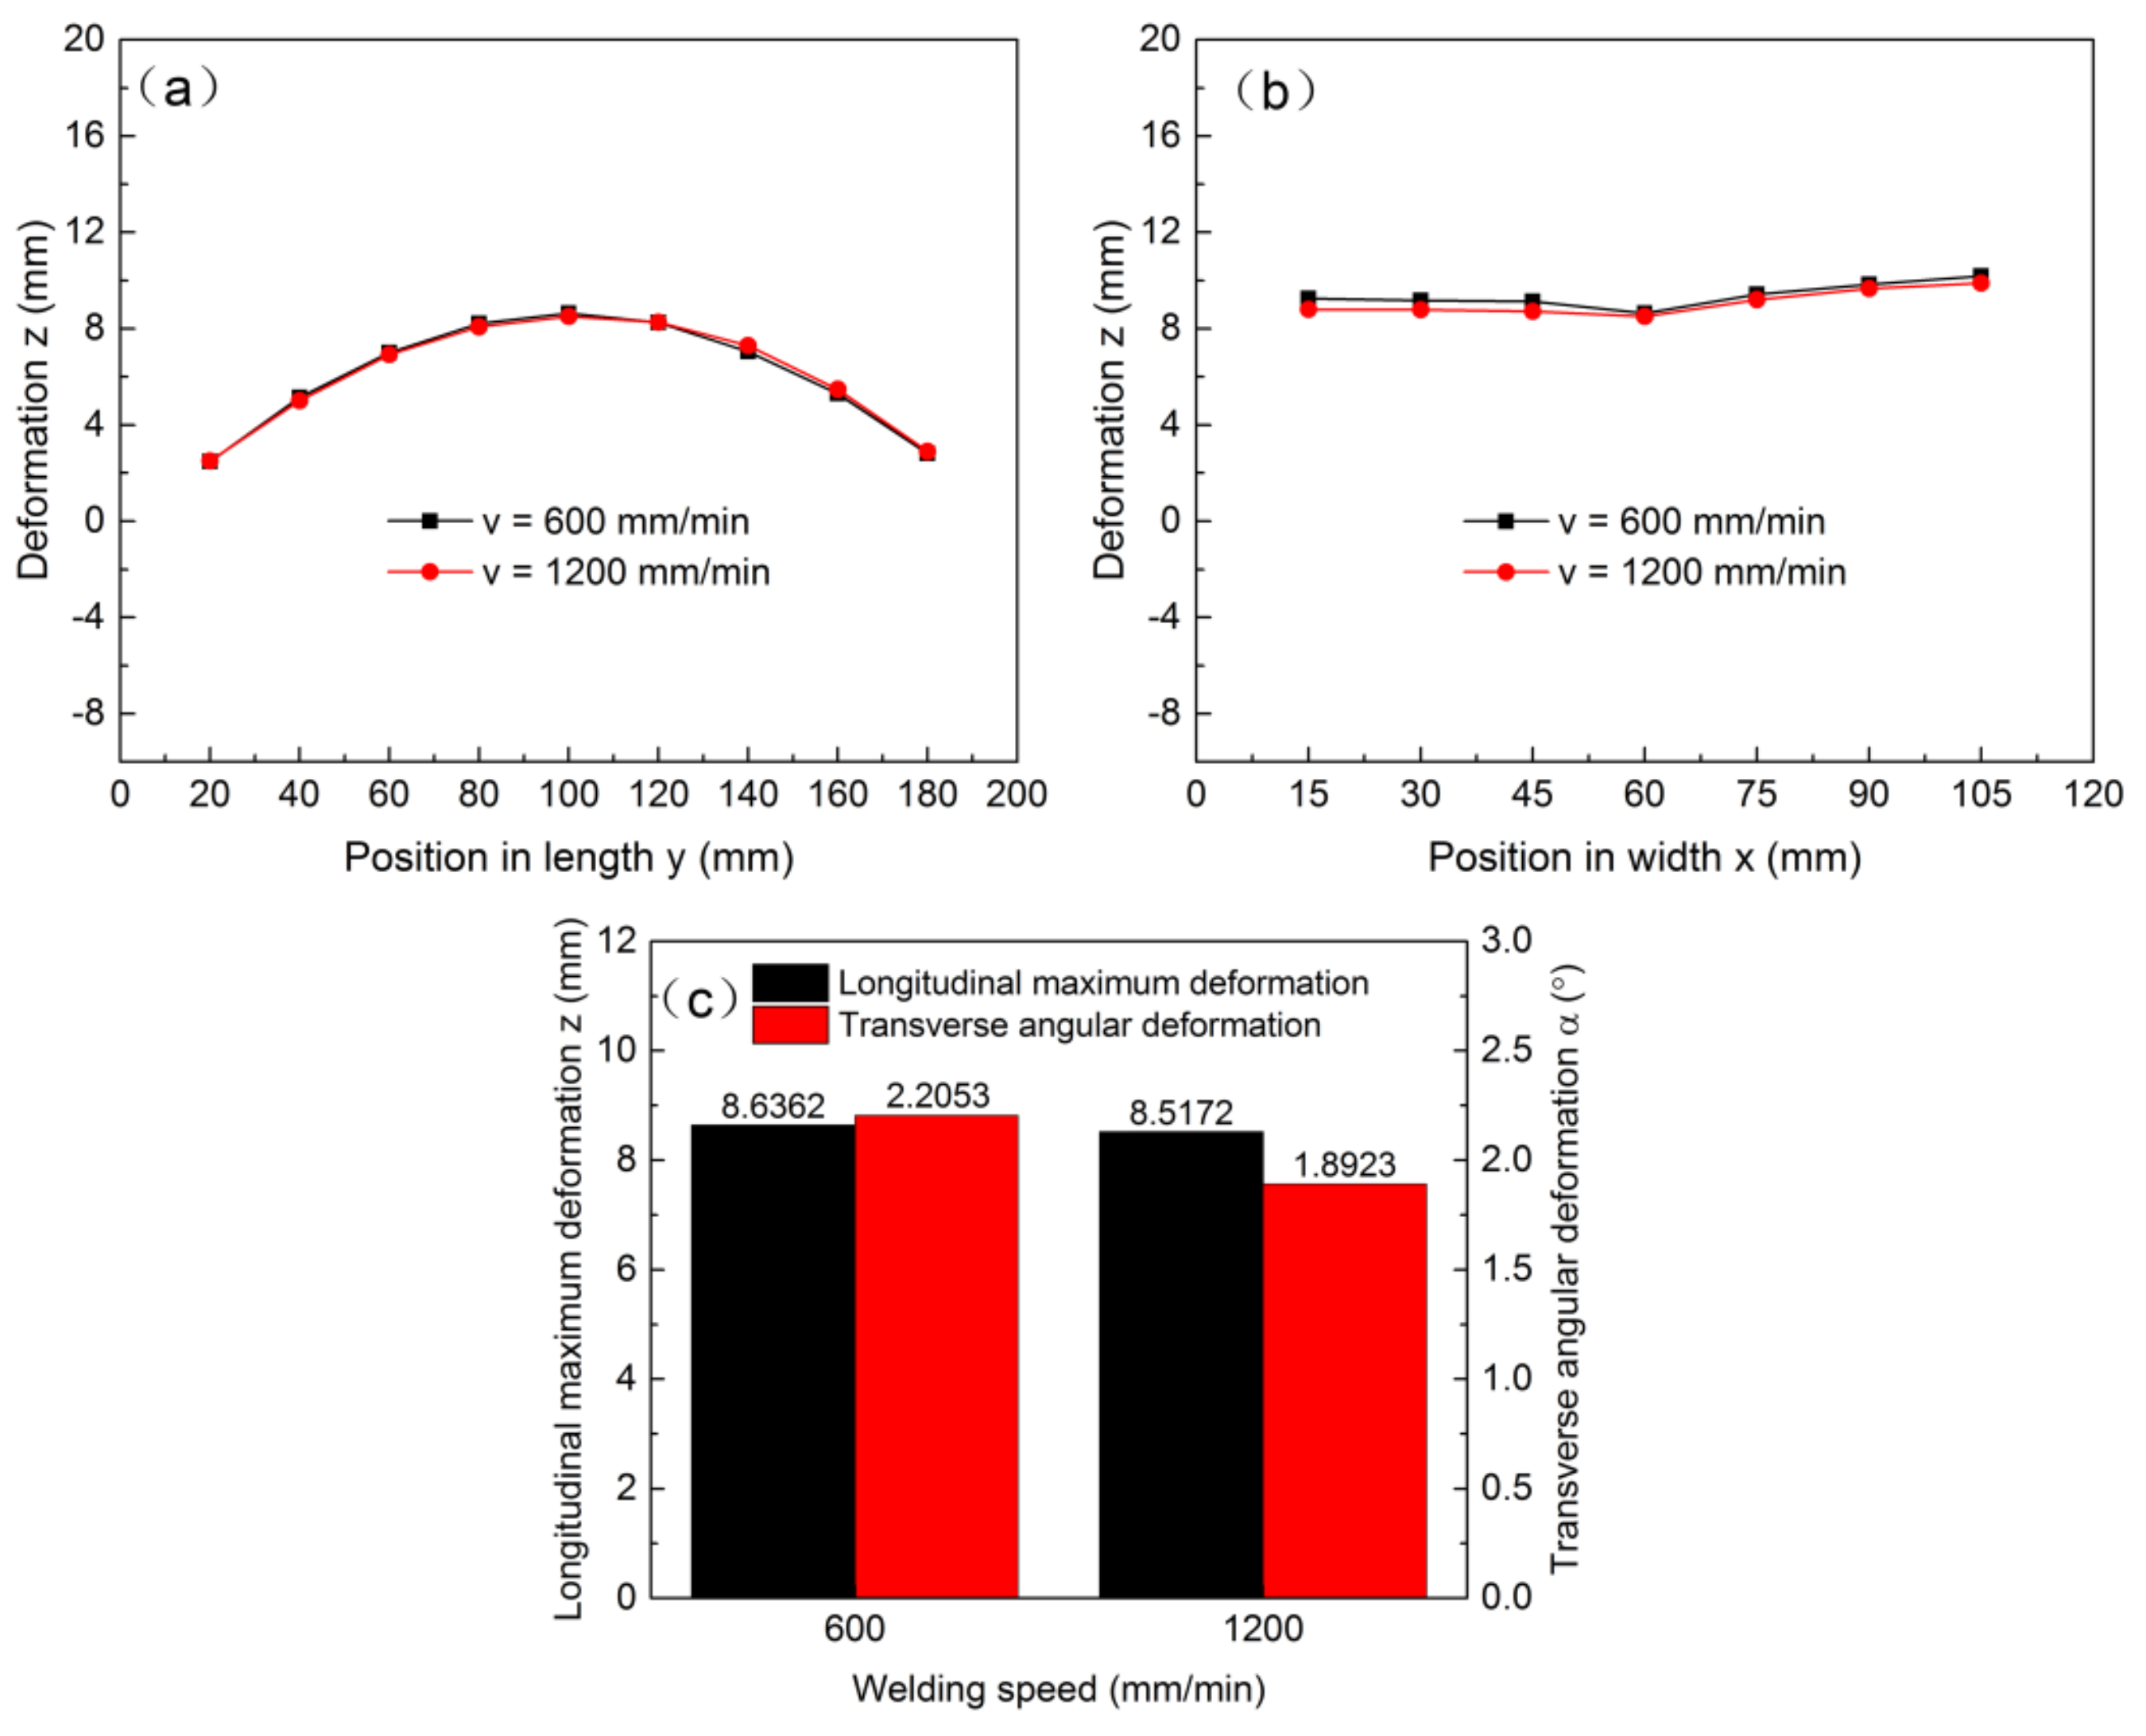
Figure 11.
Deformation comparison for different tools: (a) in longitudinal direction at position x = 0, (b) in transverse direction at position y = 100 mm, and (c) longitudinal maximum bending deformation and transverse angular deformation.
Figure 11.
Deformation comparison for different tools: (a) in longitudinal direction at position x = 0, (b) in transverse direction at position y = 100 mm, and (c) longitudinal maximum bending deformation and transverse angular deformation.
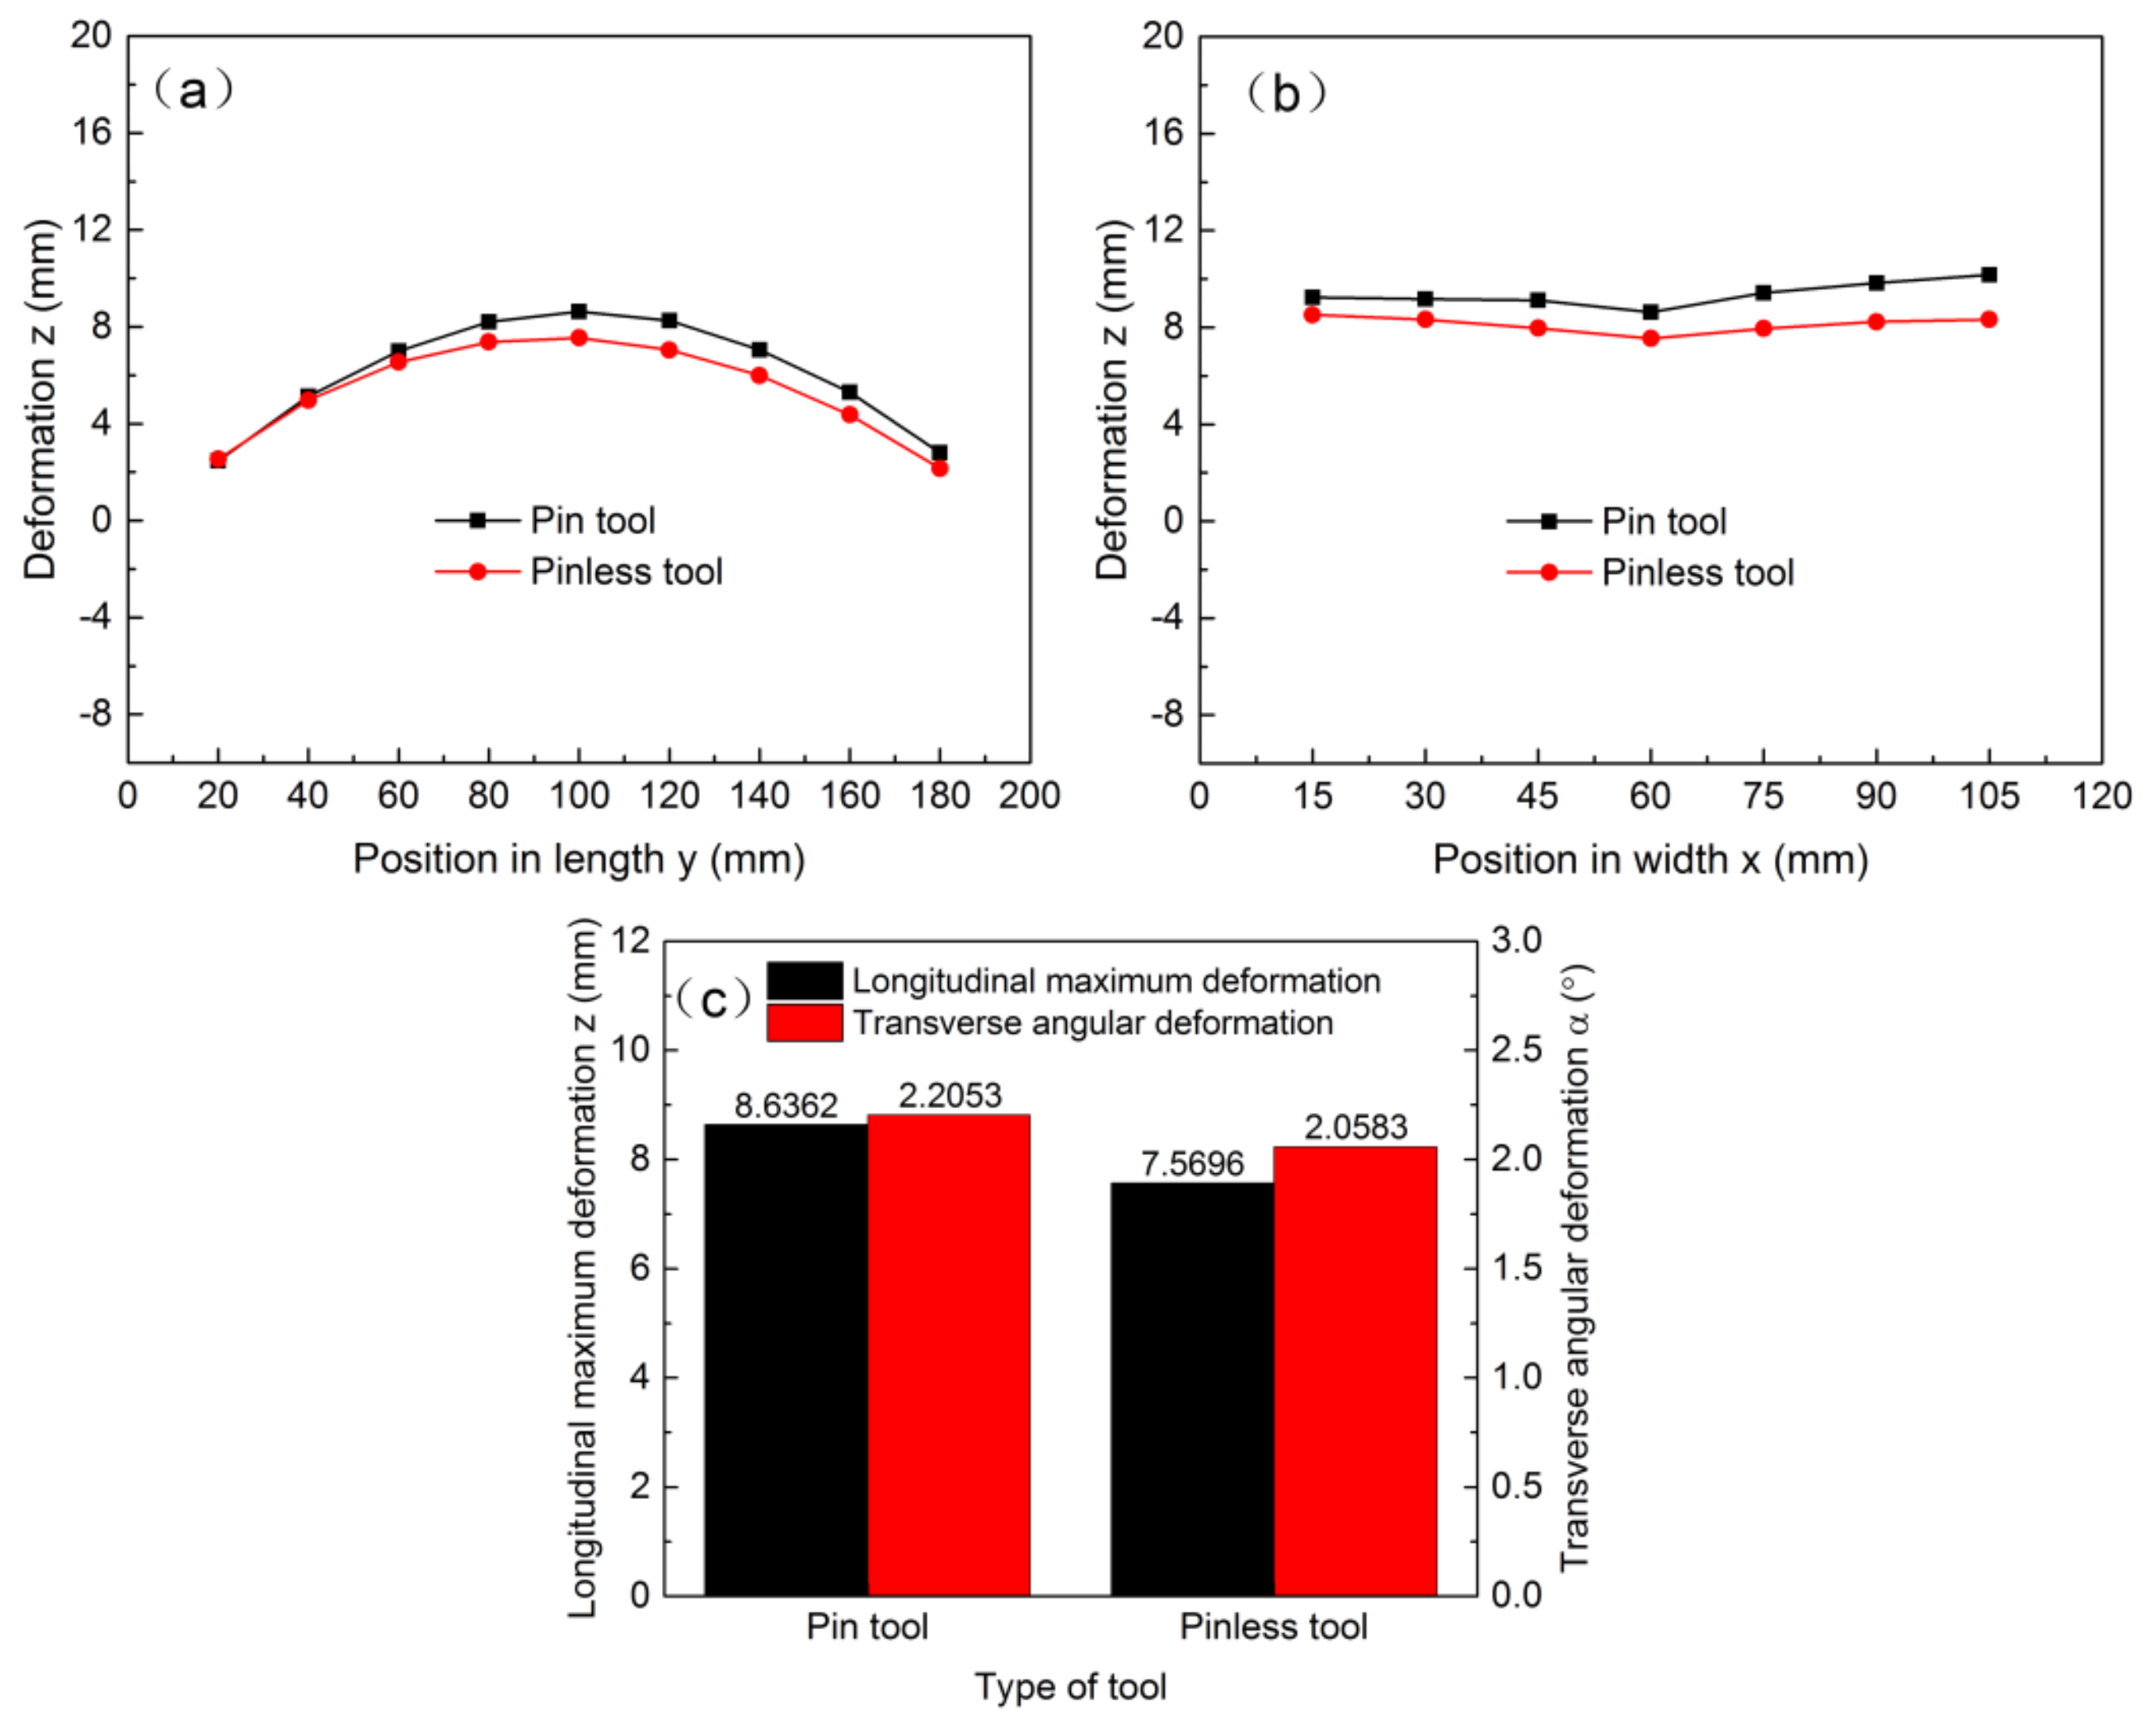
Figure 12.
Deformation comparison for different backing plates: (a) in longitudinal direction at position x = 0, (b) in transverse direction at position y = 100 mm, (c) longitudinal maximum bending deformation and transverse angular deformation, and (d) axial force.
Figure 12.
Deformation comparison for different backing plates: (a) in longitudinal direction at position x = 0, (b) in transverse direction at position y = 100 mm, (c) longitudinal maximum bending deformation and transverse angular deformation, and (d) axial force.

Table 1.
Welding parameters.
| Sample Number | Welding Parameter | Rotational Speed (rpm) | Welding Speed (mm/min) | Tool Geometry | Backing Plate Material |
|---|---|---|---|---|---|
| 1 | 3000-600-P-Fe | 3000 | 600 | Pin tool | Steel |
| 2 | 6000-600-P-Fe | 6000 | 600 | Pin tool | Steel |
| 3 | 6000-1200-P-Fe | 6000 | 1200 | Pin tool | Steel |
| 4 | 6000-600-PL-Fe | 6000 | 600 | Pinless tool | Steel |
| 5 | 6000-600-P-Cu | 6000 | 600 | Pin tool | Copper |
Table 2.
Main parameters of welding thermal cycles at weld center.
| Welding Parameter | Peak Temperature (°C) | Elevated-Temperature Exposure Time (t150) (s) | Heating Rate (°C/s) | Cooling Rate (°C/s) |
|---|---|---|---|---|
| 3000-600-P-Fe | 349.1 | 3.5 | 199.2 | 68.7 |
| 6000-600-P-Fe | 412.8 | 4.3 | 294.1 | 72.8 |
| 6000-1200-P-Fe | 342.6 | 2.8 | 389.1 | 83.4 |
| 6000-600-PL-Fe | 401.8 | 3.7 | 371.1 | 80.8 |
© 2019 by the authors. Licensee MDPI, Basel, Switzerland. This article is an open access article distributed under the terms and conditions of the Creative Commons Attribution (CC BY) license (http://creativecommons.org/licenses/by/4.0/).
Share and Cite
MDPI and ACS Style
Ni, Y.; Mao, Y.; Qin, D.; Xiao, X.; Fu, L. Thermal Cycles and Deformation Characters During High-Speed Micro Friction Stir Welding Process of AA7075-T6 Sheets. Metals 2019, 9, 1236. https://doi.org/10.3390/met9111236
AMA Style
Ni Y, Mao Y, Qin D, Xiao X, Fu L. Thermal Cycles and Deformation Characters During High-Speed Micro Friction Stir Welding Process of AA7075-T6 Sheets. Metals. 2019; 9(11):1236. https://doi.org/10.3390/met9111236
Chicago/Turabian StyleNi, Yu, Yue Mao, Dingqiang Qin, Xuan Xiao, and Li Fu. 2019. "Thermal Cycles and Deformation Characters During High-Speed Micro Friction Stir Welding Process of AA7075-T6 Sheets" Metals 9, no. 11: 1236. https://doi.org/10.3390/met9111236
Note that from the first issue of 2016, this journal uses article numbers instead of page numbers. See further details here.