Substructure Development and Damage Initiation in a Carbide-Free Bainitic Steel upon Tensile Test
by

Mari Carmen Taboada
1,2,†, 
Amaia Iza-Mendia
1,2,
Isabel Gutiérrez
1,2 and
Denis Jorge-Badiola
1,2,* 1
Materials and Manufacturing Division, CEIT, Paseo Manuel Lardizabal 15, 20018 San Sebastian, Basque Country, Spain
2
Mechanical and Materials Engineering Department, Tecnun, Universidad de Navarra, Paseo Manuel Lardizabal 13, 20018 San Sebastian, Basque Country, Spain
*
Author to whom correspondence should be addressed.
†
Now at Egile Mechanics, Pol. Ind. Kurutz-Gain 12-13, 20850 Mendaro, Basque Country, Spain.
Metals 2019, 9(12), 1261; https://doi.org/10.3390/met9121261
Submission received: 22 October 2019
/
Revised: 13 November 2019
/
Accepted: 15 November 2019
/
Published: 26 November 2019
(This article belongs to the Special Issue Advanced Multiphase Steels)
Abstract
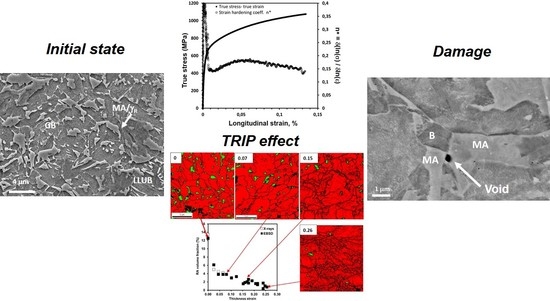
:Carbide-free bainitic (CFB) steels belong to the family of advanced high strength steels (AHSS) that are struggling to become part of the third-generation steels to be marketed for the automotive industry. The combined effects of the bainitic matrix and the retained austenite confers a significant strength with a remarkable ductility to these steels. However, CFB steels usually show much more complex microstructures that also contain MA (Martensite–Austenite) phase and auto-tempered martensite (ATM). These phases may compromise the ductility of CFB steels. The present work analyzes the substructure evolution during tensile tests in the necking zone, and deepens into the void and crack formation mechanisms and their relationship with the local microstructure. The combination of FEG-SEM imaging, EBSD, and X-ray diffraction has been necessary to characterize the substructure development and damage initiation. The bainite matrix has shown great ductility through the generation of high angle grain boundaries and/or large orientation gradients around voids, which are usually found close to the bainite and MA/auto-tempered martensite interfaces or fragmenting the MA phase. Special attention has been paid to the stability of the retained austenite (RA) during the test, which may eventually be transformed into martensite (Transformation Induced Plasticity, or TRIP effect).
1. Introduction
In the ever-increasing interest of the automotive sector to achieve better mechanical performance of the steel and lightweight new components, there is a clear tendency to develop new steel grades. In this line, the use of multiphase steels tries to take advantage of the optimized combination of the mechanical properties of each of the micro-constituents. The effect of the different phases on the mechanical properties in DP (Dual Phase) and TRIP (Transformation Induced Plasticity) steels has been widely reported [1]. DP steels consist of a mixture of a ferritic matrix with martensitic islands. The ferritic matrix imparts ductility, whereas martensite allows the accomplishment of significant strain hardening rates that simultaneously improve the yield strength and the tensile strength. On the other hand, TRIP steels are more complex from the microstructural point of view. The matrix is mainly ferritic, whereas the hard phase is bainite/martensite. The retained austenite (RA), through its characteristic transformation to martensite during strain, is crucial to understanding the enhanced ductility of these TRIP steels [2].
Even though their applications are extensively deployed in many car components, the materials to be used in the near future require, in addition to high or ultrahigh strength, an adequate local cold formability. Customer demands are pointing at adequate flangeability, which is out of reach of existing microstructures in DP and TRIP steels [3]. In response to such needs, nowadays the development of third-generation AHSS (advanced high strength steels) is promoted by the automotive industry [3]. Within this generation, TRIP-aided bainitic ferrite (TBF) steels such as the one studied in this work, as well as quenching and partitioning (Q&P) steels, are presently the best positioned for their exploitation. Both of them possess an attractive mechanical performance at a low cost due to their relatively low alloy content. However, there are still some difficulties in the industrial scale-up process for the Q&P steels [4,5], whereas the TRIP-aided bainitic steels can be produced in the industrial continuous annealing/galvannealing lines. The need for tailored compositions that are suitable for their processing with the current limitations of the annealing/galvannealing lines is a key point for their full industrial implementation [6,7].
In simulations of continuous annealing treatments on TRIP-aided bainitic steels, other secondary phases, in addition to bainite and austenite, have been found due to a non-effective stabilization of the untransformed austenite during overaging in the bainitic transformation region and further cooling to room temperature [7,8]. These secondary phases can be MA (Martensite–Austenite) phase and/or auto-tempered martensite as relatively large islands. The relative amounts, morphologies, and sizes of these phases depend on the steel composition and processing conditions. Regarding retained austenite, it has a beneficial effect on ductility [9], but this effect is a complex function of the intrinsic dislocation-based plasticity of this phase and the TRIP effect, in addition to the stress state of the material [10]. At the same time, the TRIP effect has been proven to be affected by the origin, morphology/size, or composition of the retained austenite [11]. The control of the retained austenite through composition and processing for the improvement in the mechanical properties of those steel families has been subjected to significant research in recent years [3].
The understanding and control of the damage mechanisms have become fundamental to accomplish optimum performance depending on the cold forming process to be applied on the material [12]. In complex DP and TRIP steels, the onset of the void formation has also been investigated. The void initiation is usually related to the MA phase and ferrite interfaces, in addition to the decohesion and fracture of some inclusions [13]. The relative strength of the phases and the morphological aspects are primary factors in the generation of the damage. In that regard, for instance, the coarse ferrite grains and martensitic islands in DP steels are detrimental in the damage generation [14,15], whereas in TRIP steels, the stability of the retained austenite plays a fundamental role in the retardation of the damage [16].
The application of any strategy to decrease the difference in the mechanical contrast of the phases and to obtain a homogeneous microstructure would delay the formation of the voids. Some examples of this are the tempering of the martensite and ferrite hardening through solid solution or grain refinement in DP steel [14,17].
Particularly, in TRIP-aided bainitic steels or Q&P steels, high yield and tensile strength are readily attainable since the matrix phases are either bainite or martensite. Ductility is controlled by the retained austenite. The mechanical contrasts among those phases are lower than in multiphase microstructures that contain ferrite. Thus, a delay in the local damage initiation and, consequently, an improvement in the cold formability are expected.
A survey of the literature on the microstructural evolution and damage in CFB steels readily shows the lack of detailed analyses of these two points. In the present work, a detailed study of the substructural development under tensile conditions of a bainitic matrix steel, both under uniform strain conditions and after necking, is undertaken with the aim of gaining knowledge of the underlying mechanism of plasticity in such steels, mainly focused on retained austenite. Additionally, the role of the secondary phases in the damage formation is also considered.
2. Experimental Section
The present study has been carried out on samples machined out from cold-rolled lab casts of composition 0.22% C, 2.0% Mn, 1.3% Si, 0.03% Al, and 0.005% N. They have been hot-rolled to a 4 mm thickness and, finally, cold-rolled down to 1 mm thickness before machining. The thermal cycle consisted of an annealing treatment at 920 °C for 2 min, cooling at 50 °C·s−1 down to 420 °C and an overaging time of 120 s in the bainitic region. Then, the material was cooled to room temperature at 2 °C·s−1. The selection of this condition was carried out after a detailed analysis of the microstructure results derived from the BASEFORM project [7].
2.1. Tensile Test
The tensile tests were run in an Instrom tensile machine 5982 (Instron, Grove City, PA, USA) on subsize specimens with a gauge length of 3.0 mm and with 2.5 mm width, which were machined to facilitate the tracking of the deformation and the onset of the necking. An extensometer of 3 mm length and 1.5 mm width were used to control the amount of applied strain during the tensile test. The test was stopped at about every 0.05 of longitudinal strain to perform the microstructural analysis on the RD (rolling direction)-TD (transverse direction) plane.
The plastic deformation at each step was determined according to the following methodology:
- The width of the specimen was optically measured after every strain.
- The measurement of the thickness was ruled out since thickness observations are not compatible with, on the one hand, the EBSD preparation and, on the other hand, the tracking of a selected zone (typically by a grid of indentations) during uniform deformation due to limitations inherent to the geometry of the tensile specimen.
- The longitudinal strain, measured through the lengthening with the extensometer, is not readily measurable once the necking phenomenon takes place. The printing of a grid (by a square net of low weight indentations) on the sample surface from the initial material was the other option, but it has been dismissed. Two reasons are behind this decision. The surface roughening is expected with strain, and extra preparation would be necessary for further EBSD analysis. This may remove the grid. The second reason is that the grid itself could be a set of points on which strain can accumulate, leading to biasing results.
- It is possible to correlate the relationship between initial (w0 = 2.5 mm) and current width (w) with the initial (t0 = 1 mm) and current thickness (t) after every test interruption. According to [18], if the strain hardening exponent (n) is known, as well as the thickness and width relation, it is feasible to get this relationship; see Figure 1, obtained from data extracted from [18] after some linear extrapolation. In the present work, w0/t0 = 2.5 and the n ≅ 0.16.
- Thus, with the help of the latter work and using the equation , the thickness strain would be directly determined throughout the test irrespective of the stage: Uniform or necking.
- The output strain will thus be the thickness plastic strain.
In the post-mortem specimen, a grid of micro-indentations separated by 200 μm was printed in the necking region to determine unambiguously the width of the specimen where the EBSD (Electron Backscatter Diffraction) scans were performed.
2.2. Microstructural Characterization
The microstructural characterization was carried out through FEG-SEM (Field Emission Gun SEM) imaging in a JEOL JSM-7000F microscope (JEOL Ltd., Tokyo, Japan), and EBSD scanning with the program Oxford Channel 5 (5.0.9.0, HKL Tech. A/S, Hobro, Denmark). The experimental data have been transformed into a format whereby the OIM 5.0 program can handle them. Over 10 micrographs at ×10000 at the center and at ¼ of the thickness were taken to measure the number of secondary phases in the initial microstructure after etching with Klemm III reactant through the point counting method. No significant changes were observed in through-thickness observations, nor were any band structures that can be originated in this kind of steel, usually due to Mn segregation.
The EBSD study has been split into two parts:
- A detailed analysis of the retained austenite evolution with the strain for the low strain region (below 0.13 longitudinal strain). A fixed region of about 25 × 25 μm2 was selected and scanned to follow its evolution in the first stages of deformation. Four indentations in the gauge length were arranged in a square to track the region of interest. The step size was set at 100 nm.
- The evolution of the microstructure across the necking region. Areas of about 25 × 25 μm2 with a step size of 100 nm were run every 200 μm in the longitudinal direction.
Two crystalline structures were considered in the EBSD work: BCC (body centered cubic-ferrite) and FCC (face centered cubic-austenite). The bainitic ferrite and the auto-tempered martensite (ATM) are indexed as BCC. The distinction between these two micro-constituents relied on the average EBSD pattern quality. In general, the ATM has a lower pattern quality (PQ)—darker in the PQ maps—than bainite—brighter in the PQ maps. Nevertheless, the amount of ATM is indeed low—below 2%. The sample preparation went through a soft grinding and was finally gently polished down to colloidal silica (0.05 μm) to avoid austenite transformation. Special attention was paid to the clean-up procedure to achieve reliable methods. In general, the scans showed a rate of success above 85–90%. As a result of the clean-up procedure, less than 5% of the data were re-indexed.
Regarding X-ray diffraction, the scans were performed in a Philips PW1825 diffractometer (Philips Analytical, Almelo, The Netherlands) with an angular step size of 0.02° and with Cu–Kα radiation to determine the amount of volume fraction of retained austenite after every interruption before necking in the angular range 2θ, 40°–120°. The calculations of the volume fraction of retained austenite were done according to ASTM E975-13 for 4 diffraction peaks: {200} and {220} for austenite and {200} and {211} for ferrite, and the constants for the Cu–Kα radiation were extracted from Jarvinnen’s work [19]. The carbon content of the austenite in the initial state was determined according to equation aγ = 3.572 + 0.033 wt.% C + 0.0012 wt.% Mn-0.00157 wt.% Si [20].
Once the necking occurred, X-ray profiles were also recorded across the necking region at several distances from the center of the necking, using a collimator of 0.3 mm and a slit width of 1 mm.
3. Results and Discussion
This section has been divided into two parts that correspond to the uniform deformation and the post-necking stages during the tensile test. In both sections, the development of the substructure in the bainitic matrix and the mechanical stability of the RA austenite are tackled and discussed with regard to the applied thickness plastic strain.
3.1. Uniform Strain Region
In Figure 2a,b, the microstructure corresponding to the initial state is illustrated. The FEG-SEM micrograph shows a bainitic matrix in which a significant volume fraction of secondary phases is distinguished in light grey color. In this sheet, the banding of secondary phases is not detected at low magnifications. In general, the secondary phases have a blocky type morphology, which is usually related to granular upper bainitic (GB) structures [21]. The amount of lath-like upper bainitic (LLUB) structures is relatively low. The quantitative results achieved from X-ray diffraction as well as the EBSD map, Table 1 and Figure 2c, indicate that a large amount of retained austenite is generated as a result of the thermal cycle applied, leading to almost 14% volume fraction of this phase. The difference in the measurement of the retained austenite between these two techniques can arise from the lack of the EBSD to detect film-like retained austenite and the mis-indexing of the regions close to interfaces between the matrix and the austenitic islands. Other secondary phases are also observed to be associated with the largest islands, specifically auto-tempered martensite (ATM). In general, the size of the retained austenite islands exceeds 0.2 µm. Thus, they have a suitable size to be studied by the EBSD technique. The stress–strain curve is plotted in Figure 3a. The full summary of the initial microstructure and parameters derived from tensile test is gathered in Table 2. In addition to the stress–strain flow curve, the strain hardening rate was also plotted as a function of the longitudinal strain in Figure 3b. The shape is the typical one for steels that undergo a significant TRIP effect in the early stages highlighted by the presence of a local maximum (a maximum around 0.05 longitudinal strain) and a progressive decline of the strain rate afterwards. This is the usual shape of the carbide-free bainitic steels [22], and the appearance of a peak is related to the balance of the decrease in the work hardening of bainite and the increase in the work hardening due to transformation of RA to martensite.
The same region as the one in Figure 2b was analyzed at a higher plastic strain level, Figure 4. EBSD-KAM (Kernel Average Misorientation) and PQ (Pattern Quality) + austenite maps prove that increasing the amount of the plastic strain brings about significant changes in the KAM parameter together with a decline in the amount of RA. In particular, the KAM parameter is widely used to determine the degree of deformation in dislocated microstructures [23]. In this work, a methodology analogous to the one developed by Kamaya in [24] and already applied in [8] has been adopted to measure the local orientation gradients. In the Appendix A section, an explanation of the method to calculate the local orientation gradients is provided. This methodology aims at minimizing the effect of the experimental data acquisition parameters and the EBSD step size on the misorientation measurements with distance [24]. In this work, two maximum values, 5° and 10°, have been set to evaluate the evolution of this parameter with the applied strain. These maxima restrict the misorientation between points, which must not exceed the imposed angular threshold. Expectedly, the orientation gradients increase almost linearly with the plastic strain in the uniform region, as seen in Figure 4e. This kind of linear trend has been reported elsewhere [25] for the low plastic strain region.
The mechanical stability of the retained austenite is a complex function of its morphology, size, surrounding phases, crystal orientation, and composition [26]. Specifically, the stability of retained austenite, when exhibits a block type morphology, has been observed to be low with respect to film-like retained austenite [27]. Here, the blocky type RA is the predominant morphology and the phases that are surrounding the RA grains can be either bainitic ferrite, high-carbon martensite belonging to MA islands or auto-tempered (low-carbon) martensite. The comparison of the maps of same region in Figure 4c,d for two strain levels allows observing that:
- The retained austenite partially bounded by non-indexed regions, which correspond to martensitic phases, seem to exhibit a poor stability with the strain. This is evident in the regions that are indicated with the red arrows. The distinctly different mechanical behavior of the phases in these microstructures has been put forward through nanohardness measurements [8]. The high-carbon martensite and auto-tempered low-carbon martensite display the highest nanohardness, whereas bainite is the softest phase. In addition, the stability is lower for the retained austenite located between two bainitic packets, indicated by the yellow arrows. Thus, in either case, the stress triaxiality is enhanced due to the mechanical contrast arising from the surroundings. This mechanical contrast is a consequence of either the difference in crystal orientation of adjacent bainitic packets against externally applied stresses [28] or to an even more pronounced variation of the mechanical behavior between bainite and (high-carbon) martensitic-type phases.
- The austenitic islands that are surrounded only by bainite within the same bainitic packet (see blue arrows in Figure 4c,d) have a greater capability to accumulate deformation without any apparent transformation to martensite. In contrast to the case above, the bainite that embeds the austenite islands now has almost the same orientation. This greater stability against transformation has also been observed in austenite embedded in large ferrite grains in TRIP steels [29].
The quantification of the volume fraction of retained austenite exhibits a steep drop for low strains within the uniform deformation region. Some previous austenitic grains, as just explained above, are either not indexed anymore or are partially indexed. This lack of indexing is commonly reported to be a consequence of the presence of high-carbon martensite, which shows a very poor or no pattern in conventional EBSD, or it is observed as an area with low pattern quality (PQ) and a high dislocation density [30]. Thus, blackened regions are related to retained austenite that undergoes induced martensitic transformation (TRIP effect). In the present study, the transformation of retained austenite mostly occurs before 0.025 thickness strain is achieved. This agrees with the shape of the strain hardening rate, which reaches a maximum close to 0.025 thickness. This strain corresponds to 0.05 longitudinal strain in Figure 3a. Afterwards, the amount of retained austenite remains almost constant at a value of 4–5%, nearly 30% of the initial RA volume fraction, up to 0.08 thickness strain and 0.13 longitudinal strain. Therefore, the enhancement of the ductility based on the TRIP effect is limited to the very first stages of the deformation and, after 0.05 thickness strain, dislocation plasticity and crystal rotations rule the ductility of the austenite grains, also reported in [30]. The analysis of the behavior of the untransformed austenite grains with strain has been performed through the ratio of the GOS (Grain Orientation Spread) parameter and the grain size (D) for grains of austenite with diameters greater than 300 and 500 nm. The mean values of these two grain populations are about 500 and 800 nm, respectively. The GOS parameter measures the average misorientation of any point belonging to a grain with regard to the mean orientation of the grain. Therefore, this parameter looks at the whole grain, in contrast to the previously analyzed local orientation gradients. This kind of angular misorientation to distance-related parameters has also been proposed in [31]. The GOS/D rises monotonically with an amount of thickness strain up to 0.05 and can reach 3° μm−1 in spite of the small sizes of RA (Figure 5a). Depending on the minimum grain size considered, the mean austenite grain size is close to 500 and 800 nm. In terms of dislocation densities, the density of GNDs amounts to 3.7 × 10¹⁴ m−2 at the end of the uniform strain according to the formulation proposed by Mortensen and Kubin [32]. On the other hand, probably even slightly overestimated, the density is close to 1.4 × 10¹⁴ m−2 at the initial state. The rotation of the crystalline orientation of the austenite grains is readily observed in the point to origin misorientation profiles. In fact, in the RA grains corresponding to the initial state, some misorientation above the noise level is found, typically below 0.5–1°, reaching a value of 1.5° from one boundary to the opposite one. This is due to the crystalline rotations induced in RA during γ (austenite)→αB (bainite) phase transformation.
Looking at the film-like retained austenite, conventional EBSD is not a suitable technique for its characterization, mainly when the sizes do not exceed 100 nm. However, its likely transformation is expected to be delayed at larger strains due its higher carbon content [33] and its higher hydrostatic pressures [34] compared to the large islands of retained austenite.
3.2. Necking Region
The increase in the strain in the uniform region involves a steady rise of the substructure whose main consequence is the development of local orientation gradients, due to the creation of low angle boundaries or local crystalline curvature with the strain, as seen in Figure 6a–c. At low strain, there are several places close to the high angle boundaries in which the strain accumulates, indicated by the black arrows in Figure 6b, and a relatively coarse subgrain structure is about to form. When the applied thickness strain exceeds 0.2, the bainitic matrix clearly develops a subgrain-type structure and even high angle boundaries are developed due to bainite fragmentation, indicated by the white arrows in Figure 6c. This subgrain structure has also been observed in another CFB steel with film-like austenite [35]. The fragmentation of the grains is depicted in Figure 6a,b for different strain levels. This is not only reflected by the increase of the density of high angle boundaries (HAB) per unit area (Figure 6d), but also by the shape of the misorientation distribution, in which the fraction of boundaries between 50 and about 62° are lowered by the strain (Figure 6e) as a result of the grain boundaries’ rotations. The effect of the transformation induced martensitic formation on the mesotexture should have enhanced this region because of the typical K-S (Kurdjumov-Sachs) and N-W (Nishiyama-Wasserman) orientation relationships between parent austenite and product martensite, which are located at 53 and 60° [36]. Nevertheless, that is insufficient to compensate for the generation of new boundaries that mainly contribute to the angles between 15 and 50°. Of course, the frequency for low misorientation angles is promoted in this strain range.
Looking at the in-grain scale, the orientation gradients grow as a result of the applied strain beyond the uniform deformation stage (Figure 6f). Average gradients as high as 12° μm−1 are observed, which corresponds to geometrically dislocation density, ρGND, of about 1.5 × 10¹⁵ m−2. This high amount of geometrically necessary dislocations is in agreement with the dislocation densities reported in [37]. However, the high amount of statistically stored dislocations inside the lath is also responsible for the isotropic hardening at any stage, and the micro-mechanical behavior simulations in this respect have led to values as high as 1016 m−2 [7]. Therefore, a large density of dislocations, which has no contribution in the misorientation development, are not considered in the present analysis.
Looking at the retained austenite, its evolution after the whole test is shown in Figure 7a. The onset of the localized necking is related with the decrease in the amount of retained austenite. The change in the local stress conditions triggers the austenite to martensite transformation and, after 0.2, the retained austenite does not exceed 1%. The effect of the stress conditions on the mechanical stability of retained austenite has been explained and discussed in [16], and the higher degree of triaxiality in the necking region is expected to resume the transformation to martensite of the remaining austenite. The X-ray profiles extracted at various positions of the tensile specimen demonstrate that the amount of retained austenite in the necking region is below 1% (Figure 7b) which corresponds to the limit of the resolution of the X-ray technique [38]. By comparison of this result with the volume fraction determined by EBSD in the localized necking region, it can be concluded that the fraction of film-like RA, more resistant to strain than RA with island morphologies, is almost null in this region. Considering the FEG-SEM pictures in Figure 2a,b, the amount of film-like retained austenite does not represent more than 2% of the initial state and, hence, its effect on the ductility in this specimen turns out to be rather limited.
Regarding the change in GOS/D, a large scatter in the data extracted in the localized necking area is observed (Figure 7b). The minimum number of austenite grains measured in conditions larger than 300 nm was 10, whereas for 500 nm, it was two to five (Figure 7d). These minima are the ones achieved in the most strained conditions (0.24–0.26 thickness strain). The heterogeneity of the local deformation and the orientation of the retained austenite in the analyzed regions are possible causes for such scatter [30]. However, irrespective of the minimum austenite grain size, the average grain curvature parameter (GOS/D) seems to level off at a value of 3.5° μm−1. Compared to the bainitic matrix, the local orientation gradients, estimated like they were for bainite, show a clear stagnation at the large strain regime (Figure 7c). Instead, the bainite is able to accumulate the strain by formation not only of continuous misorientations that accumulate with distance, but also a subgrain structure, as illustrated in Figure 6c. This kind of subgrain structure is usually reported to increase its related misorientation as strain increases [39]. The stagnation value in the austenite is around 5.4 and 6.1 °μm−1 for the 5 and 10° angular thresholds. These values are lower than the ones for bainite at large strains, which exceed 8 and 11° μm−1. The stagnation of these two parameters in RA may arise from the combination of several factors. Larger strains may rotate RA grain to positions in which the transformation to martensite is induced. Another reason could be that, due to their small size (typically below 1 μm), the significance of the grain boundaries is relevant in the absorption–generation of dislocations and in the inhibition of the generation of substructure [40].
The formation of voids in this kind of bainitic matrix steel is limited to the necking region as opposed to that carried out in DP steels as has been widely observed, where voids are already observed in the uniform strain region [13]. Another interesting observation is the low density of void events for the range of thickness strains (0.1–0.3) that requires a very careful observation of the specimen to find the voids in the microstructure. In the present case, the damage is linked to the void formation in the interfaces between secondary phases and the matrix (Figure 8a), fragmentation of the secondary phases (Figure 8b), and the fragmentation or decohesion of inclusions from the matrix (Figure 8c). The latter is relatively negligible for steels with clean compositions as the one studied in this work. After an extensive observation of the necking region, the very first voids have been associated with a thickness strain of about 0.1–0.12. At this stage of the damage formation, the voids are connected to the bainite–MA island interfaces (Figure 8a). As positions closer to the center of the necking are analyzed, not only matrix-MA related voids are detected. Particularly, in the region subjected to a thickness strain higher than 0.2, the other void formation mechanisms are active, as illustrated in Figure 8b. The fragmentation of secondary phases is closely related to medium-large sized MA islands (typically over 1 μm size) with complex shapes, like the one in Figure 8b. The microcracks/voids are often located between two separated regions of the same MA island in a zone where it gets narrower; there is an acute angle, as illustrated by the red arrows in Figure 8b. From the mechanical point of view, the MA phase and bainite can show a significant contrast, as reported elsewhere [8]. The MA island—which consists of pure austenite/martensite or a mixture of both of them—behaves as a hard phase, whereas the surrounding bainite deforms and builds up stresses around the acute angle. The observations in the uniform region section allow the conclusion that a large amount of retained austenite with complex shapes associated with medium-large MA islands already transforms before necking, which would impact the formation of cracks/voids. The retained austenite associated with medium-large MA islands with complex shapes are more prone to transform into pure martensite. Hence, when it transforms into martensite, the latter inherits its high carbon content and is expected to exhibit low plasticity due to its high hardness [41]. This, in turn, would affect the strain partitioning between the matrix and the phase during further strain. The formation of the crack brings about the release of energy. This energy release is absorbed by the bainitic matrix. Bainite shows its great ability to deform plastically before fracture takes place through the generation of high angle boundaries. Specifically, the bainitic matrix is also able to develop high angle boundaries around the voids. These high angle boundaries could prevent their growth and final coalescence, as shown in Figure 8c. The most complex morphologies are usually associated with the prior austenite grain boundaries, as shown in Figure 8e, where the retained austenite grains with the same IPF (Inverse Pole Figure) color belong to the same previous austenite grain. In the map at the bottom of Figure 8e, the misorientation with regard to point A (grains colored in greyscale) is depicted. It is clear that the bainitic transformation produces the rotation of the austenite in the same manner as described in Figure 5b. The presence of retained austenite with low stability against strain related to the prior austenite can be regarded as detrimental in terms of ductility and toughness. The early transformation to martensite of these large retained austenite islands makes them hard and brittle at the same time. The appearance of brittle phases at the (prior) grain boundaries, as with the MA phase, has been reported to impair the ductility in TRIP steels [42] and the energy absorption in the Charpy test in low alloyed [43] and high strength steels [44].
All in all, the morphological features of the MA phase play a relevant role as a second stage in the void formation, just after decohesion of the matrix and the MA phase interfaces. Other aspects, such as the local texture of the bainitic matrix, are of importance in the generation of high stresses that produce the void formation [45]. The role in the damage nucleation of the film-like austenite can be considered negligible. The onset of voids around the film-like structures has not been detected in the first stages of necking, nor in the large strain regime.
Another point of interest is the absence of shear bands in the matrix for the applied maximum strain in this specimen. This substructural feature has been reported in several works about DP and TRIP steels, and it appears to be related to a combination of several factors such as the nature/size/morphology of the involved phases and their spatial arrangements [46,47]. For instance, in DP steels, coarse grains of ferrite with small martensite islands are more prone to developing such shear bands, which in turn favors the formation of new voids [46]. In the present case, the bainitic matrix ensures a very fine microstructure (about 1.8 μm average bainitic packet size) and a lower difference in hardness among the various micro-constituents. Thus, these microstructures are more resistant to the onset of a generalized formation of shear bands, which has often been related to the final fracture.
4. Conclusions
- In the uniform deformation region, the TRIP effect is active for low strains (below 0.05 thickness strain), giving rise to a decrease in the fraction of retained austenite from about 14% to 4%. The transformation almost halts, leading to a stable region in which retained austenite deforms plastically. Finally, in the necking region, the strain-induced martensitic transformation resumes, and less than 1% of austenite is measured for 0.26 thickness strain with conventional EBSD.
- From the morphological point of view, a significant number of large blocky austenite grains is stable in the uniform deformation region. These retained austenite grains exhibit a great ability to develop orientation gradients at the local scale, with lengths of less than 200 nm. Apparently, the RA grains fully surrounded by the bainite with similar crystal orientation present a higher stability than when they are located between bainitic packets with different orientations or adjacent to another harder secondary phase. This has been partially attributed to the local stress triaxiality conditions during tensile tests.
- The onset of the void formation is closely related to the interfaces between bainite and MA phase. The fast drop in RA associated with blocky type morphologies makes the interfaces of transformed RA and the bainitic matrix suitable locations for the onset of the void generation. The fragmentation of blocky MA appears in a later stage of strain as a new mode for void formation. At this point, the ability of the bainitic matrix to create high angle boundaries around voids plays a relevant role in the control of their growth and eventual coalescence.
- The morphology of the MA phase influences its fracture. In order to improve the cold formability of the TRIP-aided bainitic steels, the number of MA islands associated with previous austenite grain boundaries should be eliminated or at least minimized.
Author Contributions
Conceptualization, I.G. and D.J.-B.; methodology, M.C.T. and D.J.-B.; formal analysis, M.C.T. and D.J.-B.; investigation, I.G., A.I.-M., and D.J.-B.; resources, I.G.; writing—original draft preparation, D.J.-B.; writing—review and editing, D.J.-B. and A.I.-M.; funding acquisition, A.I.-M. and I.G.
Funding
This work has been carried out in the framework of the BaseForm and BAICONFORM projects. BaseForm project has received funding from the European Union’s Research Fund for Coal and Steel (RFCS) research program under grant agreement #RFCS-CT-2014-00017, whereas BAICONFORM project has been supported by Spanish Ministry of Competitiveness and Economy under the contract MAT 2016-81031-R.
Acknowledgments
Special thanks are given to Frank Hisker for providing the material for this study and L. Mujika for her help in the performance of the tensile test.
Conflicts of Interest
The authors declare no conflict of interest.
Appendix A
The measurement of the local orientation gradient is explained in this appendix. The different steps for the calculation are the following ones:
- Firstly, the maximum KAM (kernel average misorientation) value is fixed. Typically, this value is set at 5° or 10°.
- Then, the mean KAM value at various distances is measured for the phase of interest at each point. In Figure A1, first and second neighbors are represented. After the calculation of KAM1st (Pij), it is averaged for each strain condition (ε) as detailed KAM1st (ε). Their related distances are also included in the figure (D1st and D2nd).
- Then, a linear regression is obtained from the data (see plot at the bottom of Figure A1) and the slope is the value of the local orientation gradient for each strain condition.
Figure A1.
Explanation of the method applied to calculate the local orientation gradients.

References
- Efthymiadis, P.; Hazra, S.; Clough, A.; Lakshmi, R.; Alamoudi, A.; Dashwood, R.; Shollock, B. Revealing the mechanical and microstructural performance of multiphase steels during tensile, forming and flanging operations. Mat. Sci. Eng. A 2017, 701, 174–186. [Google Scholar] [CrossRef]
- Jimenez-Melero, E.; van Dijk, N.H.; Zhao, L.; Sietsma, J.; Offerman, S.E.; Wright, J.P.; van der Zwaag, S. Characterization of individual retained austenite grains and their stability in low-alloyed TRIP steels. Acta Mater. 2007, 55, 6713–6723. [Google Scholar] [CrossRef]
- Fonstein, N. Advanced High Strength Steels: Physical Metallurgy, Design, Processing and Properties, 1st ed.; Springer International Publishing: Cham, Switzerland, 2015. [Google Scholar]
- Speer, J.G.; De Moor, E.; Clarke, A.J. Critical Assessment 7: Quenching and Partitioning. Mat. Sci. Tech. 2015, 31, 3–9. [Google Scholar] [CrossRef]
- Speer, J.G.; De Moor, E.; Findley, K.O.; Matlock, D.K.; De Cooman, B.C.; Edmonds, D.V. Analysis of microstructure evolution in quenching and partitioning automotive sheet steel. Metall. Mat. Trans. A 2011, 42, 3591–3601. [Google Scholar] [CrossRef]
- Miyata, M.; Fushiwaki, Y.; Suzuki, Y.; Nagano, H.; Nagataki, Y. Effect of Si/Mn Ratio on Galvannealing Behavior of Si-added Steel. ISIJ Int. 2018, 58, 1600–1607. [Google Scholar] [CrossRef]
- Savran, V.; Galan-Lopez, J.; Hisker, F.; Schreiber, S.; Van Bohemen, S.; Kestens, L.A.I.; Shakerifard, B.; Zhu, K.; Taboada, M.C.; Jorge-Badiola, D.; et al. Baseform: Bainite and second-phase engineering for improved formability. Eur. Com. 2019, in press. [Google Scholar]
- Taboada, M.C.; Elizalde, M.R.; Jorge-Badiola, D. Austempering in low-C steels: Microstructure development and nanohardness characterization. J. Mater. Sci. 2019, 54, 5044–5060. [Google Scholar] [CrossRef]
- Sugimoto, K.; Iuda, T.; Sakaguchi, J.; Kashima, T. Retained Austenite Characteristics and Tensile Properties in a TRIP Type Bainitic Sheet Steel. ISIJ Int. 2000, 40, 902–908. [Google Scholar] [CrossRef]
- Jacques, P.J.; Furnémont, Q.; Lani, F.; Pardoen, T.; Delannay, F. Multiscale mechanics of TRIP-assisted multiphase steels: I. Characterization and mechanical testing. Acta Mater. 2007, 55, 3681–3693. [Google Scholar] [CrossRef]
- Chiang, J.; Lawrence, B.; Boyd, J.D.; Pilkey, A.K. Effect of microstructure on retained austenite stability and work hardening of TRIP steels. Mat. Sci. Eng. A 2011, 528, 4516–4521. [Google Scholar] [CrossRef]
- Hisker, F.; Thiessen, R.; Heller, T. Influence of Microstructure on Damage in Advanced High Strength Steels. Mater. Sci. Forum 2012, 706–709, 925–930. [Google Scholar] [CrossRef]
- Avramovic-Cingara, G.; Ososkov, Y.; Jain, M.K.; Wilkinson, D.S. Effect of martensite distribution on damage behavior in DP600 dual phase steels. Mat. Sci. Eng. A 2009, 516, 7–16. [Google Scholar] [CrossRef]
- Calcagnotto, M.; Ponge, D.; Adachi, Y.; Raabe, D. Effect of Grain Refinement on Strength and Ductility in Dual-Phase Steels. In Proceedings of the 2nd International Symposium on Steel Science (ISSS 2009), Kyoto, Japan, 21–24 October 2009. [Google Scholar]
- Tasan, C.C.; Hoefnagels, J.P.M.; Diehl, M.; Yan, D.; Roters, F.; Raabe, D. Strain localization and damage in dual phase steels investigated by coupled in-situ deformation experiments and crystal plasticity simulations. Int. J. Plast. 2014, 63, 198–210. [Google Scholar] [CrossRef]
- Jacques, P.; Furnémont, Q.; Pardoen, T.; Delannay, F. On the role of martensitic transformation on damage and cracking resistance in TRIP-assisted multiphase steels. Acta Mater. 2001, 49, 139–152. [Google Scholar] [CrossRef]
- Cai, M.-h.; Ding, H.; Lee, Y.-k.; Tang, Z.-y.; Zhang, J.-s. Effects of Si on Microstructural Evolution and Mechanical Properties of Hot-rolled Ferrite and Bainite Dual-phase Steels. ISIJ Int. 2011, 51, 476–481. [Google Scholar] [CrossRef]
- Choung, J.M.; Cho, S.R. Study on true stress correction from tensile tests. J. Mech. Sci. Tech. 2008, 22, 1039–1051. [Google Scholar] [CrossRef]
- Jarvinnen, M. Texture effect in X-ray analysis of retained austenite in steels. Texture Microstruct. 1996, 26–27, 93–101. [Google Scholar] [CrossRef]
- Ruhl, R.; Cohen, M. Splat quenching of iron–carbon alloys Trans. Metall. Soc. AIME 1969, 245, 241–251. [Google Scholar]
- Zajac, S.; Schwinn, V.; Tacke, K.-H. Characterisation and quantification of complex bainitic microstructures in high and ultra-high strength linepipe steels. Mat. Sci. Forum 2005, 500–501, 387–394. [Google Scholar] [CrossRef]
- García-Mateo, C.; Caballero, F.G.; Chao, J.; Capdevila, C.; García de Andrés, C. Mechanical stability of retained austenite during plastic deformation of super high strength carbide free bainitic Steel. J. Mat. Sci. 2009, 44, 4617–4624. [Google Scholar] [CrossRef]
- Jiang, J.; Britton, T.B.; Wilkinson, A.J. Evolution of dislocation density distributions in copper during tensile deformation. Acta Mater. 2013, 61, 7227–7239. [Google Scholar] [CrossRef]
- Kamaya, M. Assessment of local deformation using EBSD: Quantification of accuracy of measurement and definition of local gradient. Ultramicroscopy 2011, 111, 1189–1199. [Google Scholar] [CrossRef] [PubMed]
- Kamaya, M.; Wilkinson, A.J.; Titchmarsh, J.M. Quantification of plastic strain of stainless steel and nickel alloy by electron backscatter diffraction. Acta Mater. 2006, 54, 539–548. [Google Scholar] [CrossRef]
- He, B.B.; Huang, M.X. On the Mechanical Stability of Austenite Matrix After Martensite Formation in a Medium Mn Steel. Metal. Mater. Trans. A 2016, 47, 3346–3353. [Google Scholar] [CrossRef]
- García-Mateo, C.; Caballero, F.G. The role of retained austenite on tensile properties of steels with bainitic microstructures. Mater. Trans. 2005, 46, 1839–1846. [Google Scholar] [CrossRef]
- Li, W.S.; Gao, H.Y.; Nakashima, H.; Hata, S.; Tian, W.H. In-situ study of the deformation-induced rotation and transformation of retained austenite in a low-carbon steel treated by the quenching and partitioning process. Mat. Sci. Eng. A 2016, 649, 417–425. [Google Scholar] [CrossRef]
- Tirumalasetty, K.; van Huis, M.A.; Kwakernaak, C.; Sietsma, J.; Sloof, W.G.; Zandbergen, H.W. Deformation-induced austenite grain rotation and transformation in TRIP-assisted steel. Acta Mater. 2012, 60, 1311–1321. [Google Scholar] [CrossRef]
- Zaefferer, S.; Romano, P.; Friedel, F. EBSD as a tool to identify and quantify bainite and ferrite in low-alloyed Al-TRIP steels. J. Micros. 2008, 230, 499–508. [Google Scholar] [CrossRef]
- Allain-Bonasso, N.; Wagner, F.; Berbenni, S.; Field, D.P. A study of the heterogeneity of plastic deformation in IF steel by EBSD. Mat. Sci. Eng. A 2012, 548, 56–63. [Google Scholar] [CrossRef]
- Kubin, L.P.; Mortensen, A. Geometrically necessary dislocations and strain-gradient plasticity: A few critical issues. Scr. Mater. 2003, 48, 119–125. [Google Scholar] [CrossRef]
- Zhou, W.; Hou, T.; Zhang, C.; Zhong, L.; Wu, K. Effect of Carbon Content in Retained Austenite on the Dynamic Tensile Behavior of Nanostructured Bainitic Steel. Metals 2018, 8, 907. [Google Scholar] [CrossRef]
- Nakada, N.; Ishibashi, Y.; Tsuchiyama, T.; Takaki, S. Self-stabilization of untransformed austenite by hydrostatic pressure via martensitic transformation. Acta Mater. 2016, 110, 95–102. [Google Scholar] [CrossRef]
- Hasan, S.M.; Mandal, A.; Signh, S.B.; Chakabarti, D. Work hardening behavior and damage mechanisms in carbide free steel during uni-axial tensile deformation. Mat. Sci. Eng. A 2019, 751, 142–153. [Google Scholar] [CrossRef]
- Díaz-Fuentes, M.; Iza-Mendia, A.; Gutiérrez, I. Analysis of different acicular ferrite microstructures in low-carbon steels by electron backscattered diffraction. Study of their toughness behavior. Met. Mater. Trans. A 2003, 34, 2505–2516. [Google Scholar] [CrossRef]
- Norström, L.A. On the yield strength of quenched low-alloy lath martensite. Scand. J. Metall. 1976, 5, 159–165. [Google Scholar]
- Magner, S.H.; de Angleis, R.J.; Weins, W.N.; Makinson, J.D. A historical review of retained austenite and its measurement by X-Ray diffraction. Adv. X-Ray Anal. 2002, 45, 92–97. [Google Scholar]
- Moussa, C.; Bernacki, M.; Besnard, R.; Bozzolo, N. Statistical analysis of dislocations and dislocation boundaries from EBSD data. Ultramicroscopy 2017, 179, 63–72. [Google Scholar] [CrossRef] [Green Version]
- Scheriau, S.; Pippan, R. Influence of grain size on orientation changes during plastic deformation. Mat. Sci. Eng. A 2008, 493, 48–52. [Google Scholar] [CrossRef]
- Allain, S.Y.P.; Bouaziz, O.; Pushkareva, I.; Scott, C.P. Towards the microstructure design of DP steels: A generic size-sensitive mean-field mechanical model. Mat. Sci. Eng. A 2015, 637, 222–234. [Google Scholar] [CrossRef]
- Celotto, S.; Ghadbeigi, H.; Pinna, C.; Shollock, B.A.; Efthymiadis, P. Deformation-Induced Microstructural Banding in TRIP Steels. Met. Mat. Trans. A 2018, 49, 2893–2906. [Google Scholar] [CrossRef] [Green Version]
- Straumal, B.B.; Kucheev, Y.O.; Efron, L.I.; Petelin, A.L.; Dutta Majumdar, J.; Manna, I. Complete and Incomplete Wetting of Ferrite Grain Boundaries by Austenite in the Low-Alloyed Ferritic Steel. J. Mater. Eng. Performance. 2012, 21, 667–670. [Google Scholar] [CrossRef]
- Li, X.; Ma, X.; Subramanian, S.V.; Shang, C.; Misra, R.D.K. Influence of prior austenite grain size on martensite–austenite constituent and toughness in the heat affected zone of 700 MPa high strength linepipe steel. Mat. Sci. Eng. A 2014, 616, 141–147. [Google Scholar] [CrossRef]
- Shakerifard, B.; Galan Lopez, J.; Hisker, F.; Kestens, L.A.I. Crystallographically resolved damage initiation in advanced high strength steel. IOP Conf. Ser. Mater. Sci. Eng. 2018, 375, 1–8. [Google Scholar] [CrossRef]
- Chen, Z.; Youshi, H.; Guochen, L. Characteristics of shear banding in dual phase steel. Mat. Sci. Tech. 1993, 9, 1037–1043. [Google Scholar] [CrossRef]
- Heibel, S.; Dettinger, T.; Nester, W.; Clausmeyer, T.; Erman Tekkaya, A. Damage Mechanisms and Mechanical Properties of High-Strength Multiphase Steels. Materialia 2018, 11, 761. [Google Scholar] [CrossRef] [PubMed] [Green Version]
Figure 1.
Relationship between the ratio of thickness and width thinning for various width/thickness (w0/t0) relationships and strain hardening exponent (n) values. Reprinted by permission from Springer Nature Customer Service Centre GmbH: Springer, Ref. [18], © The Korean Society of Mechanical Engineers and Springer-Verlag GmbH 2008. Polynomial applied for the extrapolations that convert the change in the width to the change in the thickness are also included.
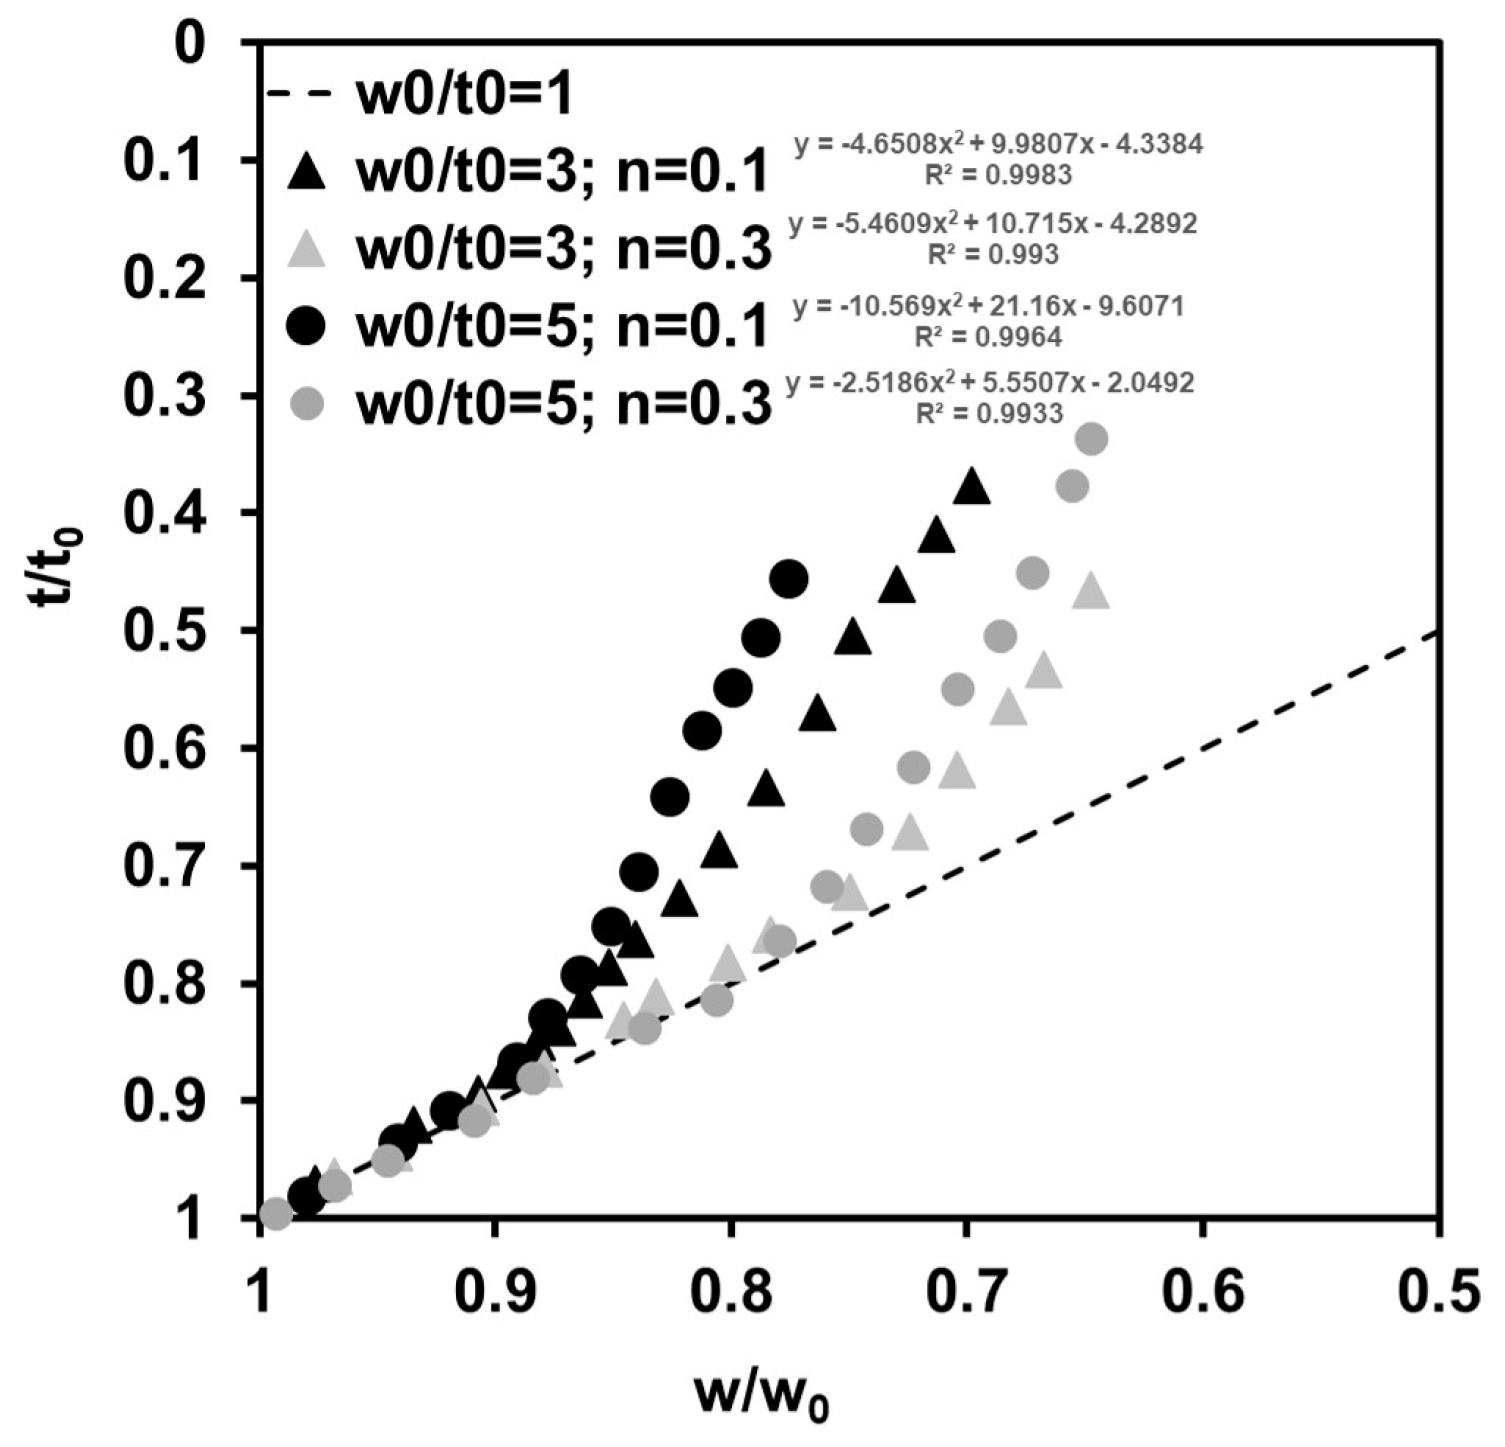
Figure 2.
(a) and (b) FEG-SEM micrographs and (c) EBSD pattern quality map showing the complexity of the microstructure (austenite in green; bainite in greyscale). (d) Distribution of the retained austenite grain sizes in the initial state.
Figure 2.
(a) and (b) FEG-SEM micrographs and (c) EBSD pattern quality map showing the complexity of the microstructure (austenite in green; bainite in greyscale). (d) Distribution of the retained austenite grain sizes in the initial state.
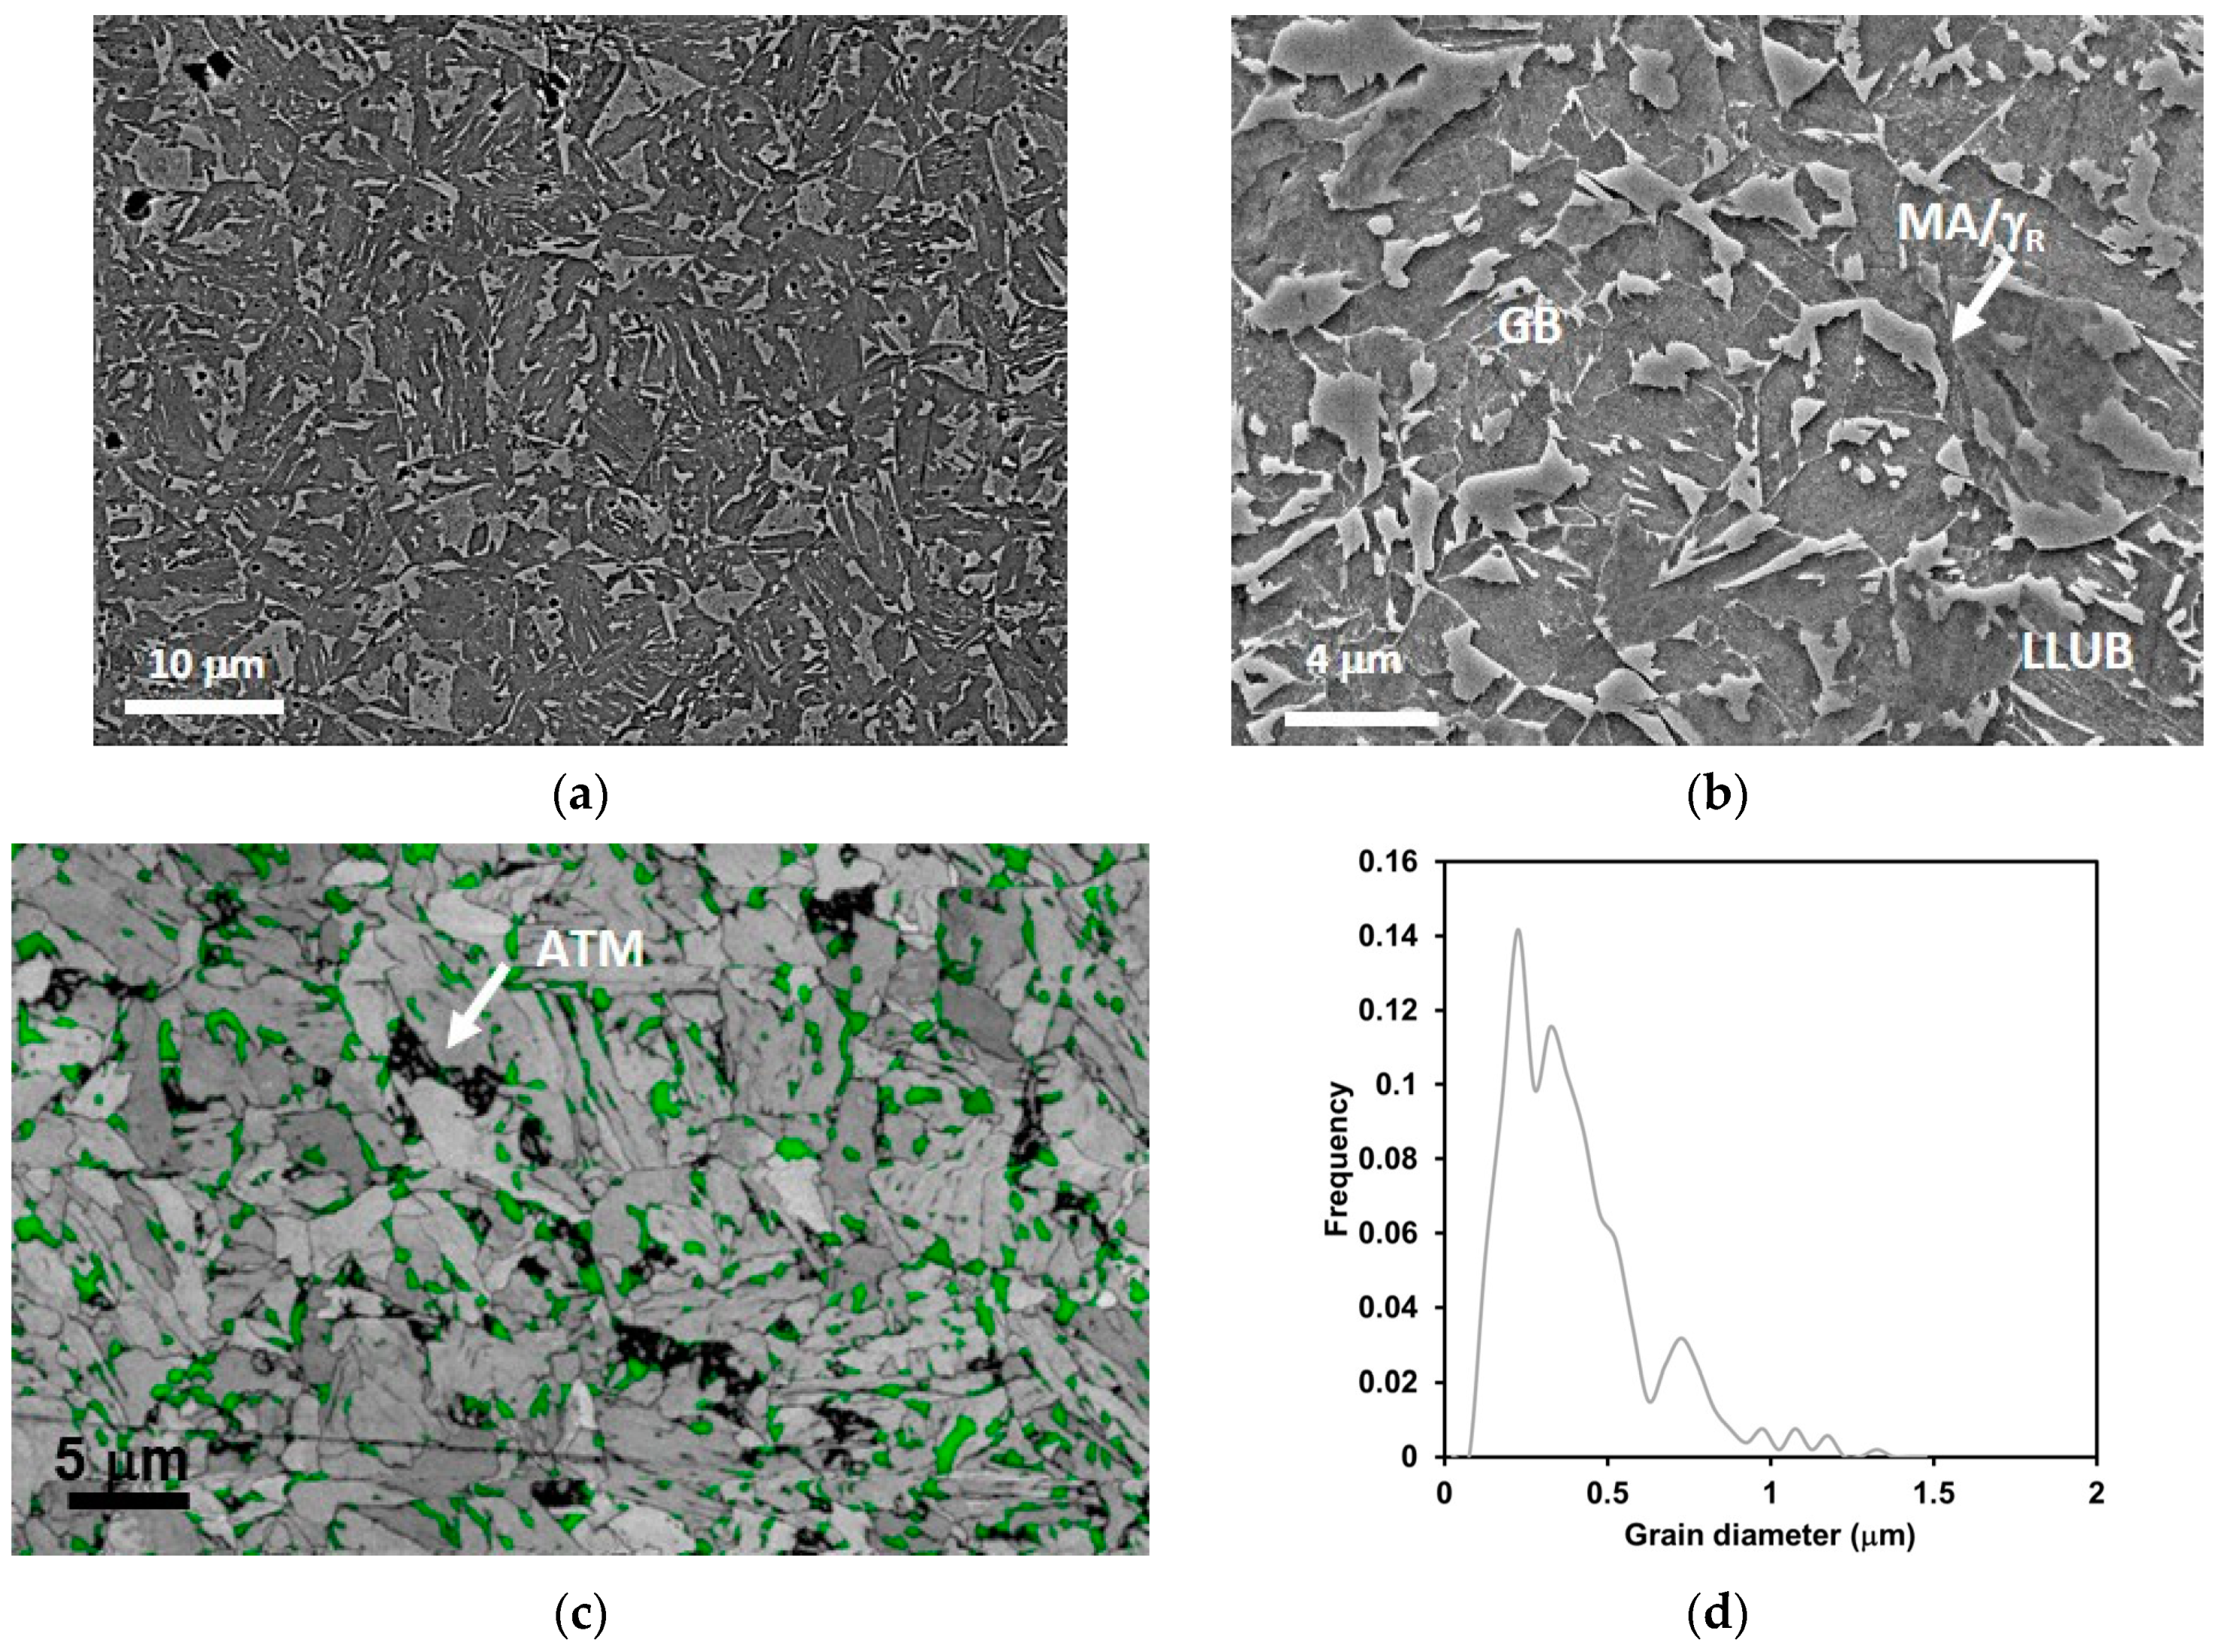
Figure 3.
(a) Stress–strain curve for the studied material; (b) strain hardening rate vs. strain.

Figure 4.
EBSD-KAM (Kernel Average Misorientation) map and pattern quality+austenite (green colored grains) maps with overlaid white grain boundaries (>15°) for two strain conditions (a) and (c) initial state, and (b) and (d) after thickness strain of 0.07. (e) Local orientation gradients in the bainite matrix (based on the maximum kernel values of 5° and 10°, respectively) and (f) RA volume fraction evolution with the strain.

Figure 5.
(a) Evolution of the mean GOS (Grain Orientation Spread) parameter normalized with the retained austenite grain size as a function of the thickness strain and (b) point-to-point and point-to-origin misorientations inside two austenite grains belonging to initial state and after 0.07 thickness strain respectively.
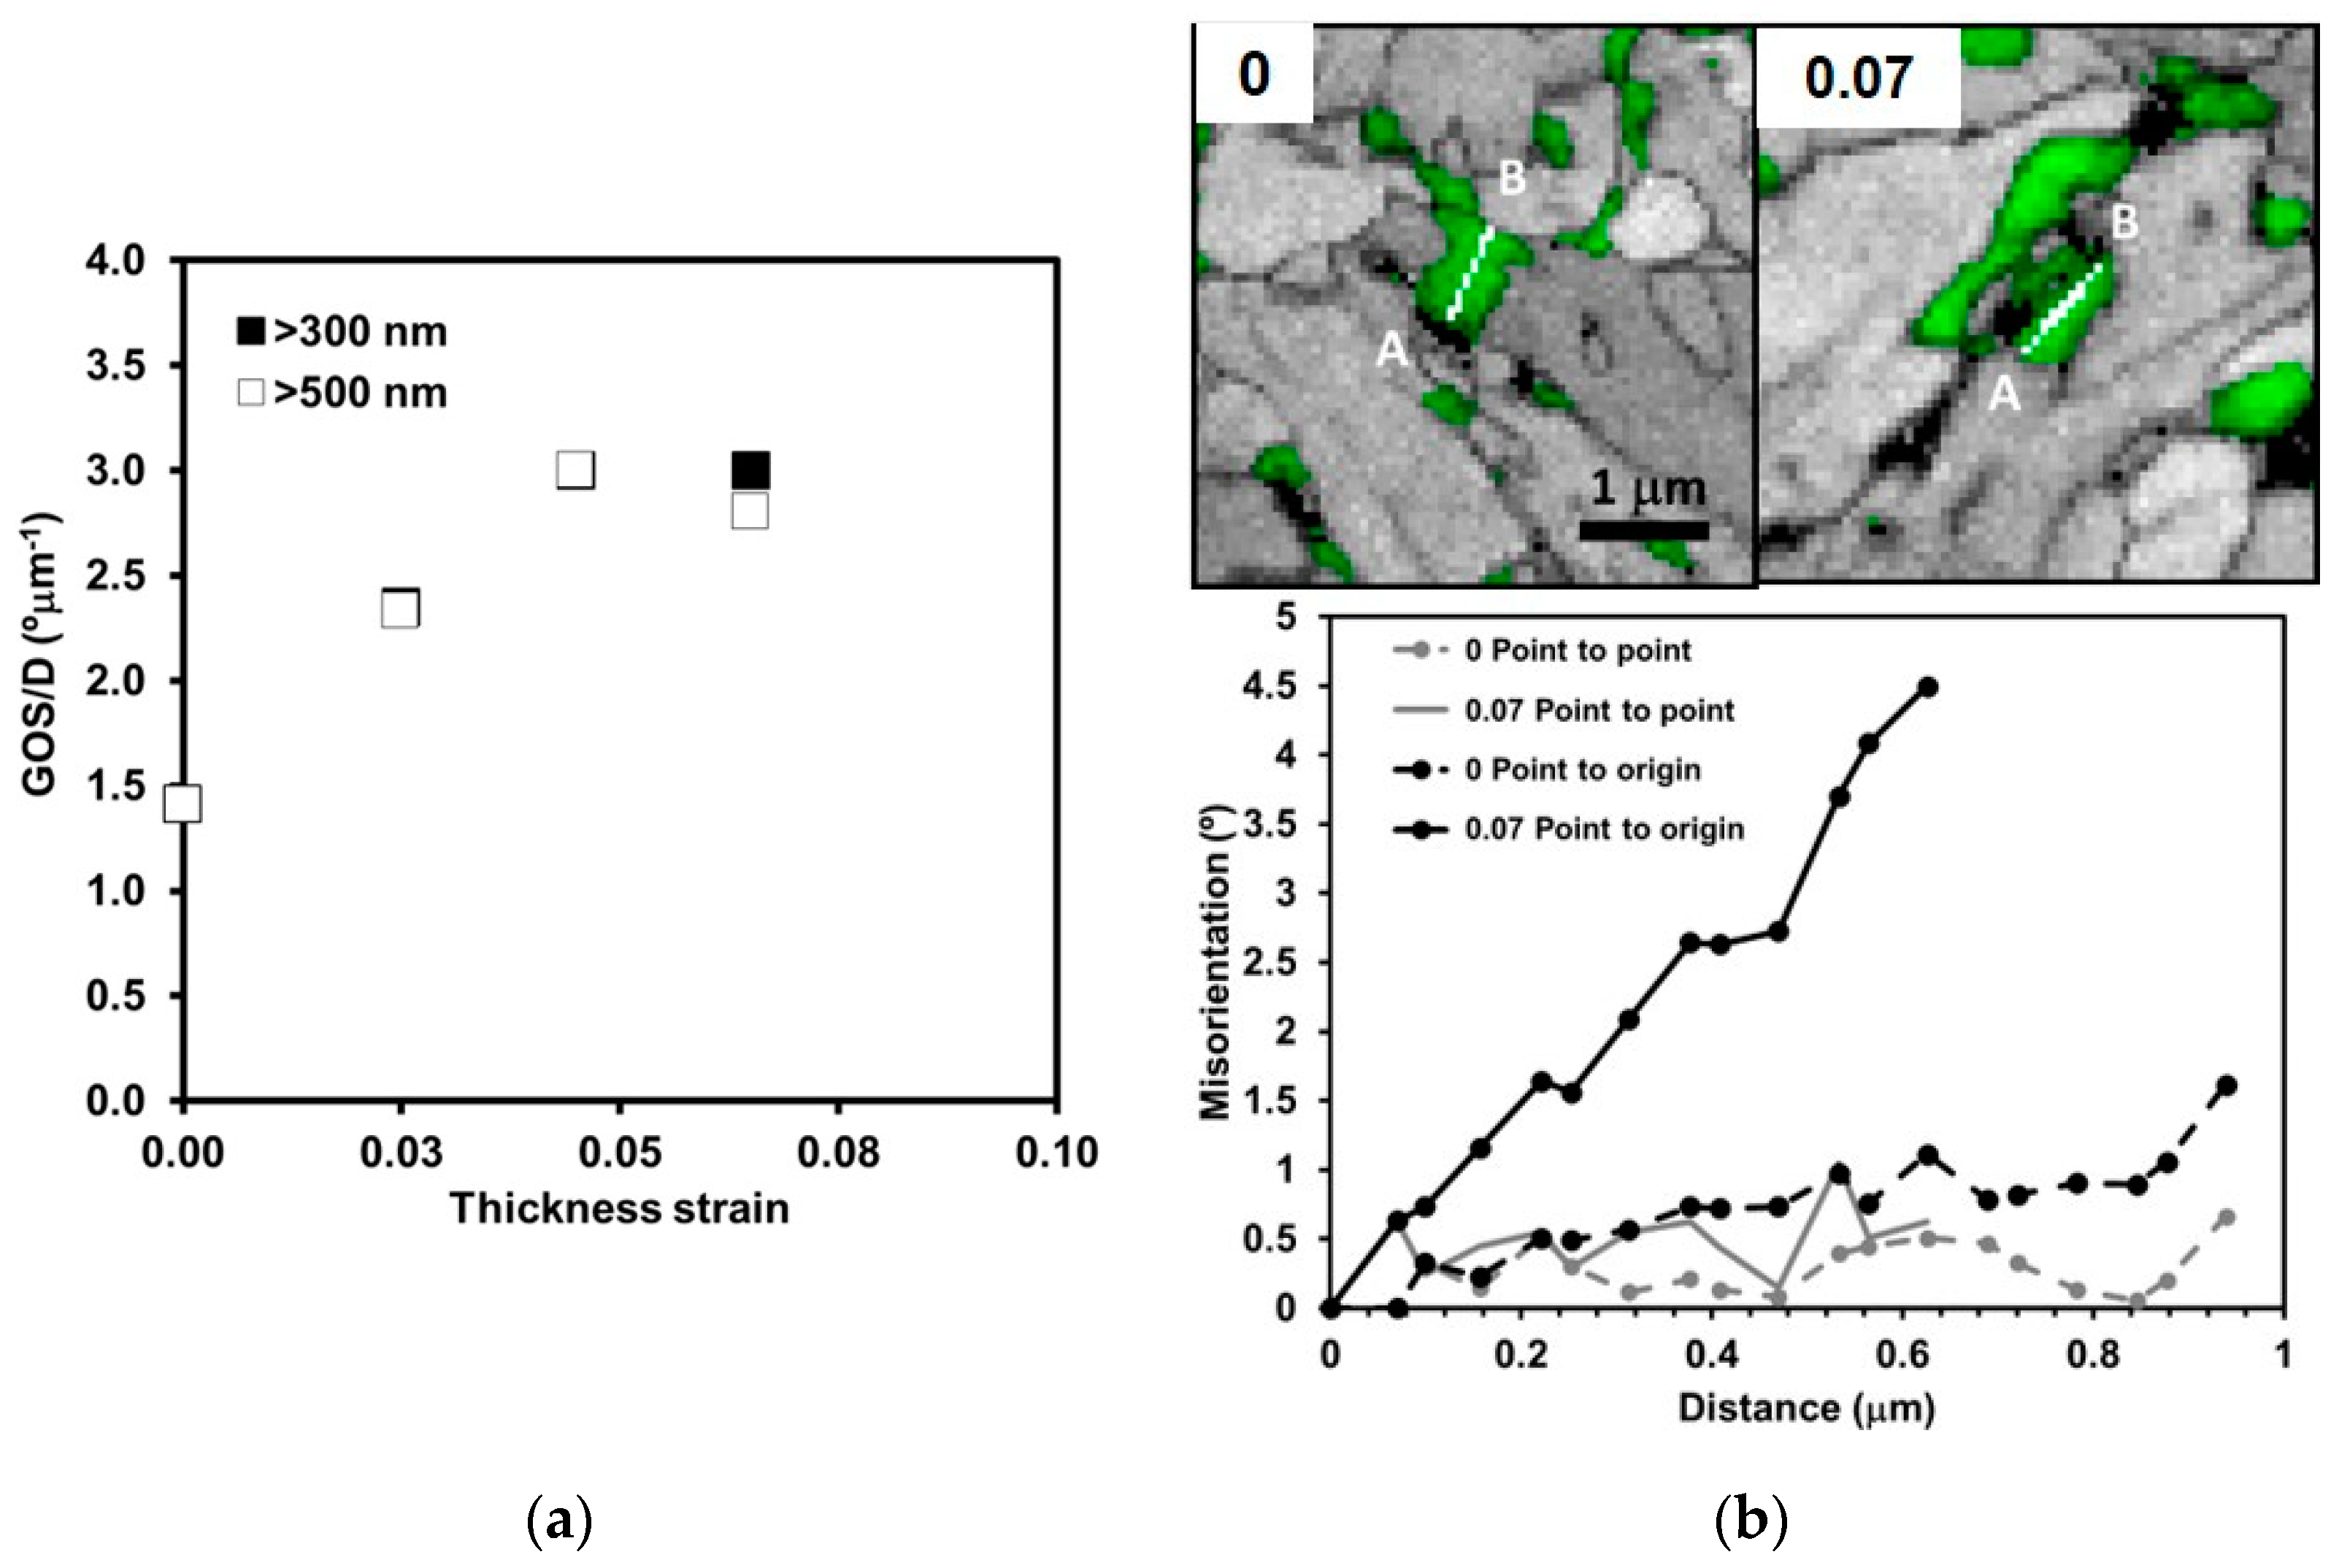
Figure 6.
IPF (Inverse Pole Figure) maps (with respect the rolling direction) with different amounts of thickness strain. (a) Initial state, (b) 0.07 and (c) 0.26 (thick black lines >15°, thin black lines >2°). Evolution of (d) the density of high angle boundaries (HAB) as the ratio of the length of HAB per unit area, (e) misorientation distribution, and (f) local orientation gradients (for 5 and 10° angular thresholds) with the strain in the necking region (measured for distances of 200 nm).
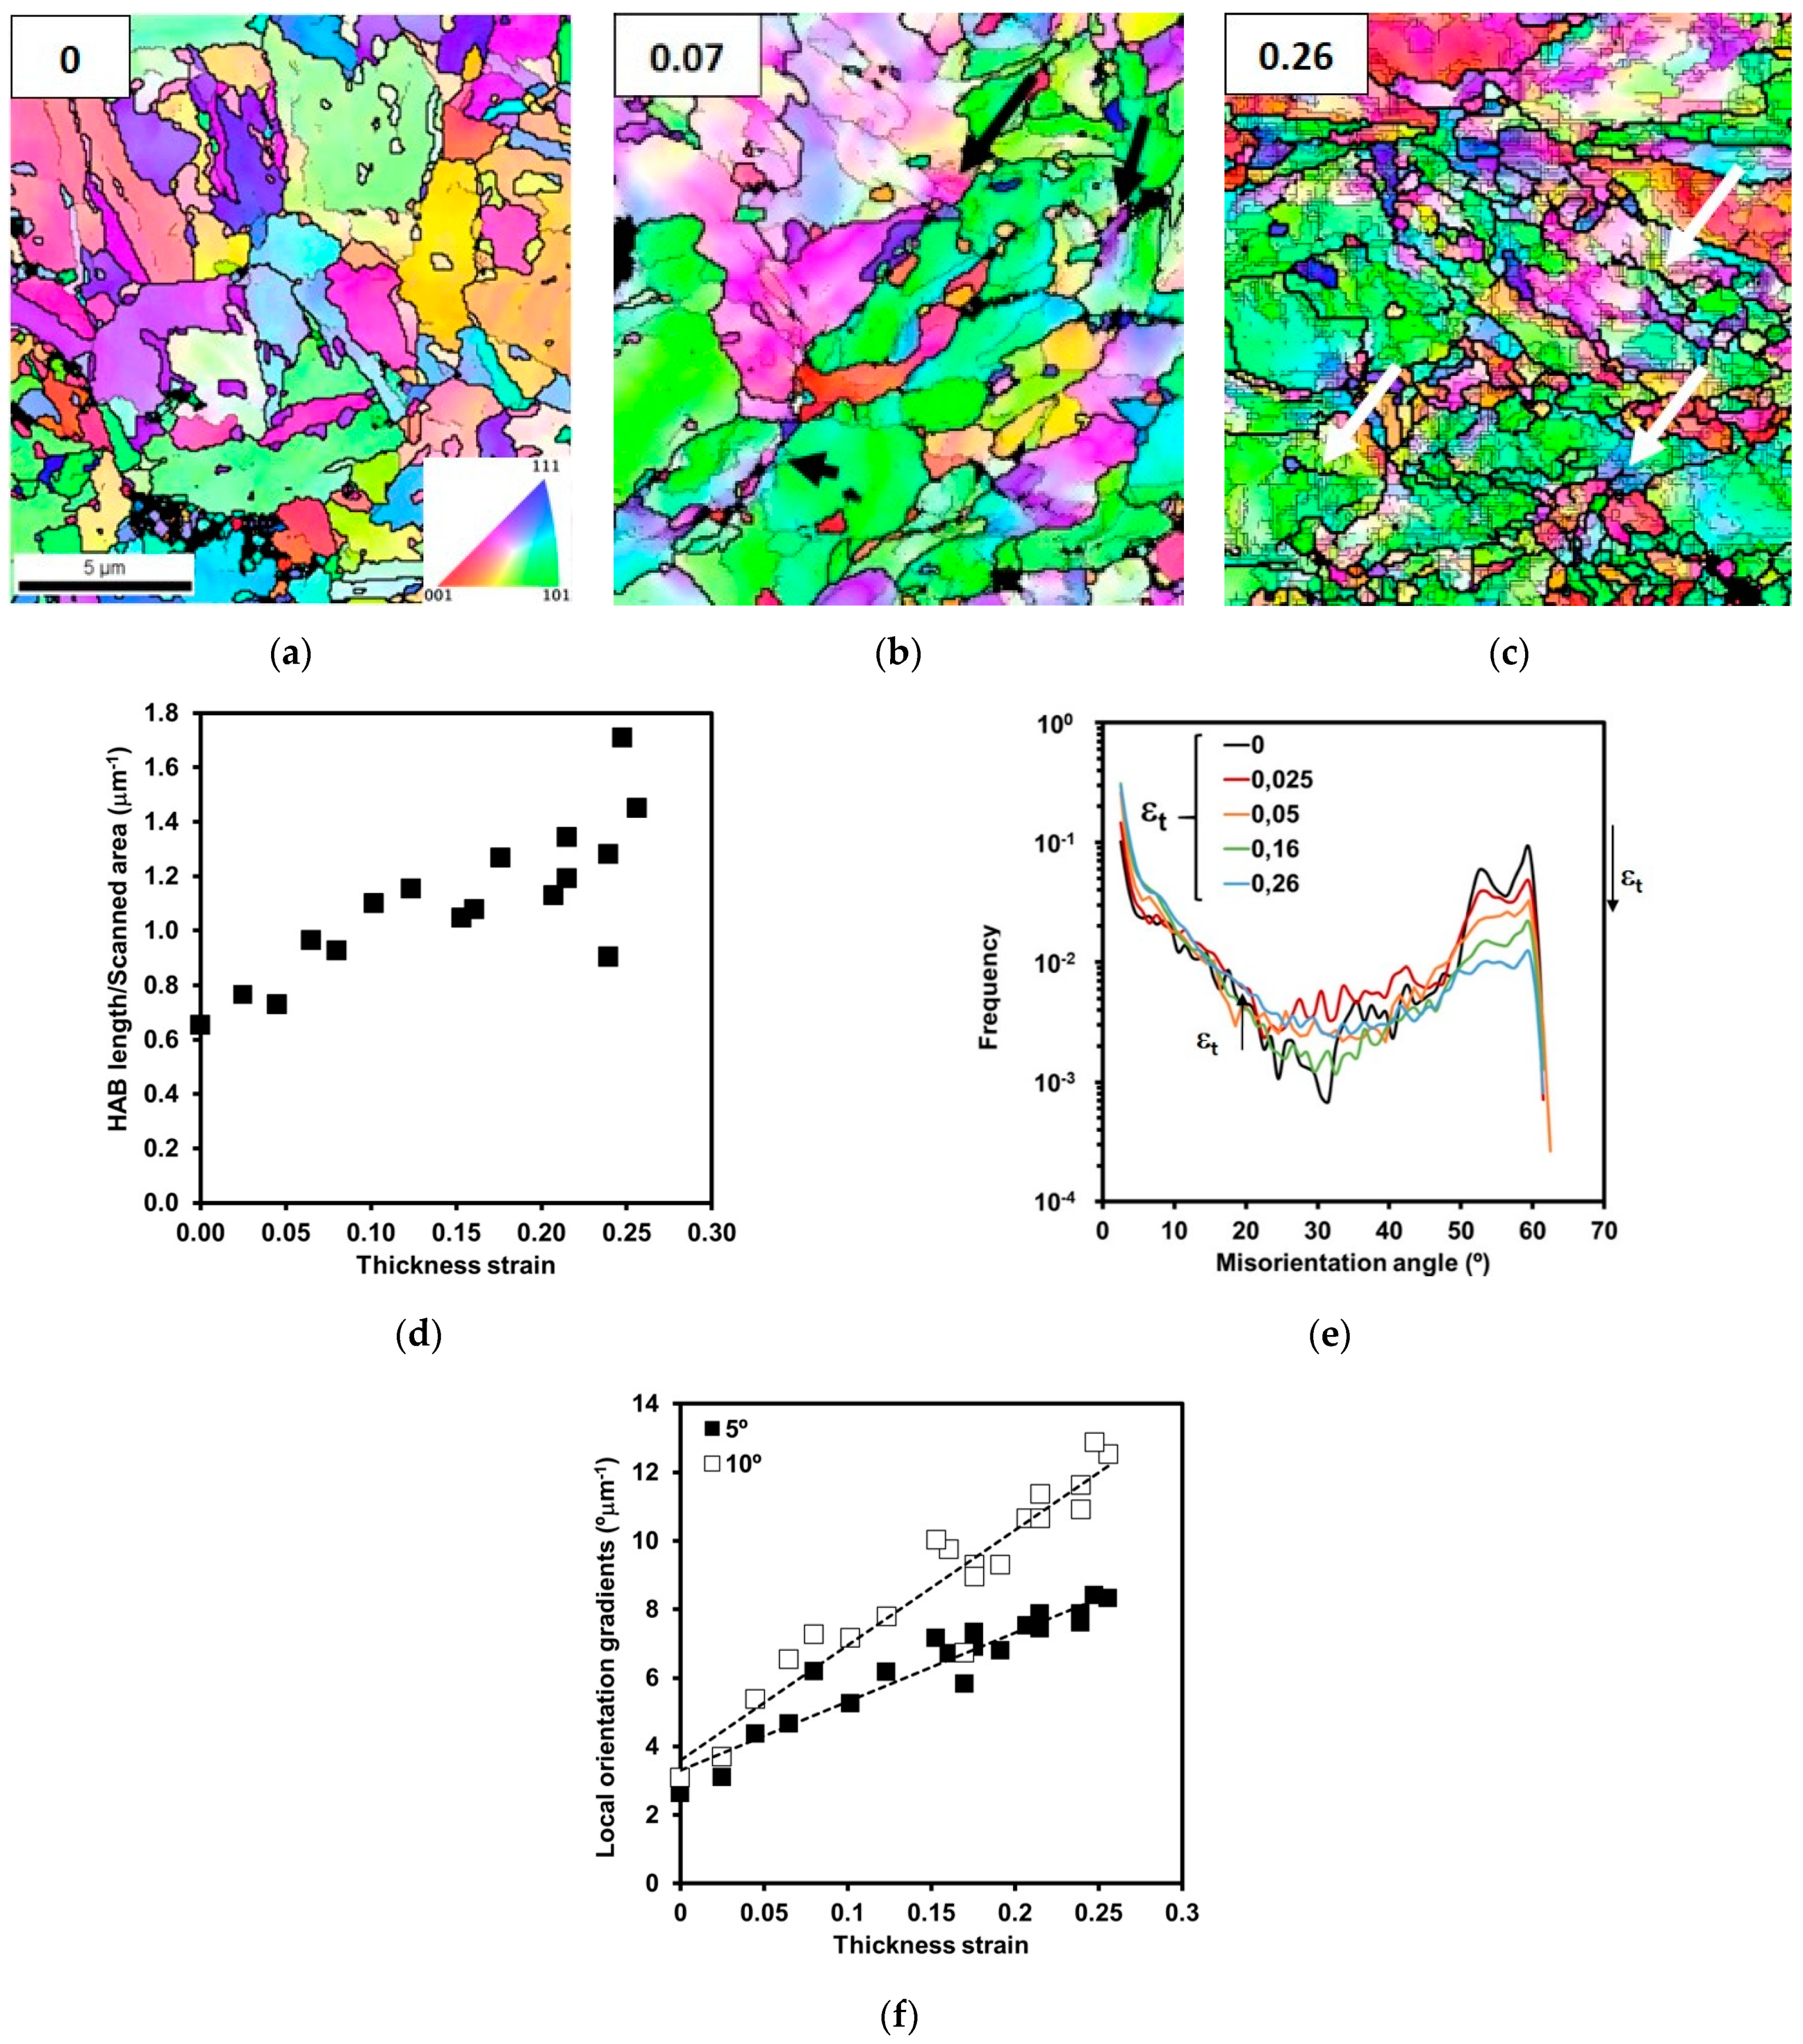
Figure 7.
(a) Evolution of the RA volume fraction (green phase: austenite; red phase: bainite). (b) Evaluation of the RA volume fraction by X-ray in the tensile specimen around the necking region. In-grain orientation gradients as a function of the thickness strain (c) global and (d) local. (e) Number of RA grains used to obtain the data in (c) and (d).

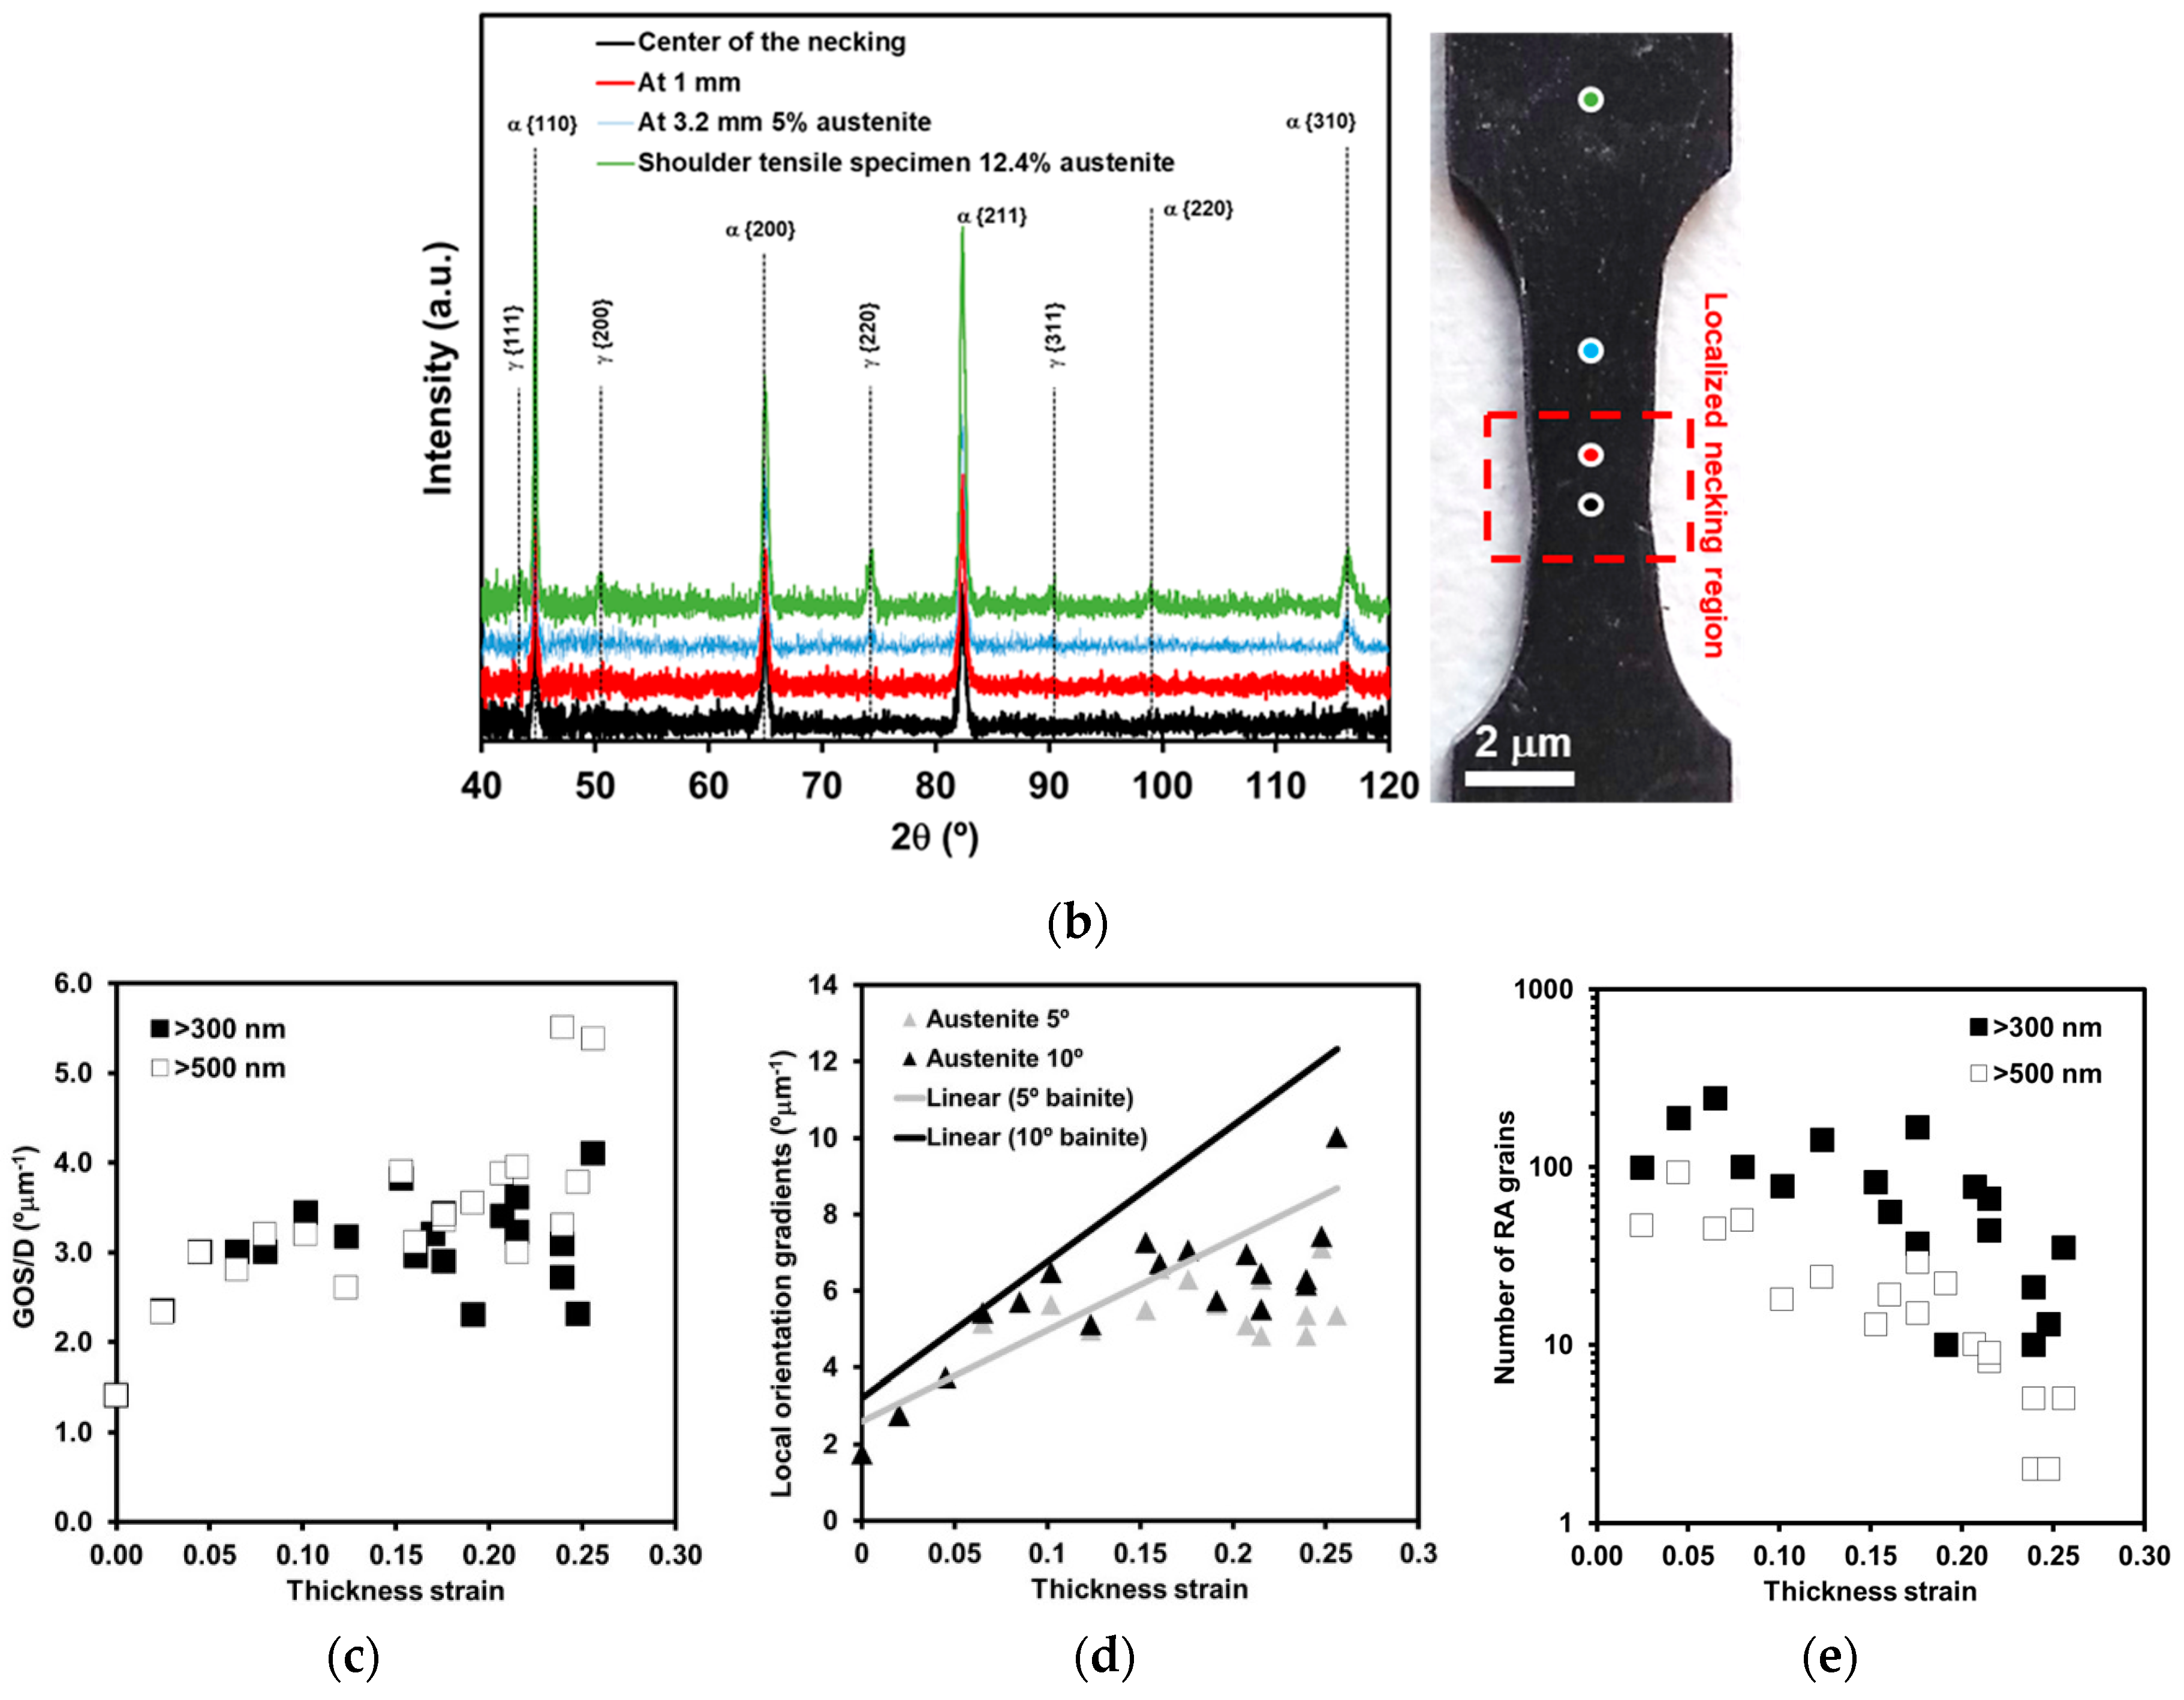
Figure 8.
Back-scattered electron (BSE) micrographs showing the voids/damage at different locations in the necking region: (a) Bainite/secondary phase interface, (b) secondary phase islands fractured, and (c) inclusion/bainitic matrix. White arrows indicate the positions of the voids/cracks. EBSD-IPF map (with respect to the rolling direction) overlaid with boundary lines—thick (>15°) and thin (>2°) lines—close to a fractured secondary phase (d) in which white arrows point at the newly created high angle boundaries and (e) several EBSD maps that show the location of the irregularly shaped medium-sized retained austenite. Top: Phase map (austenite: green; bainite: red); middle: IPF map with regard to the rolling direction; bottom: IPF map+misorientation with regard to point A of retained austenite in the lower part of the scan.


Table 1.
Information about secondary phases: F2ry: Volume fraction of secondary phases; RA: Volume fraction of retained austenite; % C: Amount of carbon content in RA.
Table 1.
Information about secondary phases: F2ry: Volume fraction of secondary phases; RA: Volume fraction of retained austenite; % C: Amount of carbon content in RA.
| F2ry (%) by FEG-SEM Imaging | RA (%) by X-Ray | %C in RA by X-Ray |
|---|---|---|
| 18.0 ± 1.5 | 13.4 ± 0.8 | 1.1 ± 0.1 |
Table 2.
Mechanical properties of the material.
| Hardness (HV1) | R0.2% (MPa) | TS Tensile Strength (MPa) | Elongation at Fracture E25 (%) |
|---|---|---|---|
| 348 ± 6 | 659 | 962 | 16.9 |
© 2019 by the authors. Licensee MDPI, Basel, Switzerland. This article is an open access article distributed under the terms and conditions of the Creative Commons Attribution (CC BY) license (http://creativecommons.org/licenses/by/4.0/).
Share and Cite
MDPI and ACS Style
Taboada, M.C.; Iza-Mendia, A.; Gutiérrez, I.; Jorge-Badiola, D. Substructure Development and Damage Initiation in a Carbide-Free Bainitic Steel upon Tensile Test. Metals 2019, 9, 1261. https://doi.org/10.3390/met9121261
AMA Style
Taboada MC, Iza-Mendia A, Gutiérrez I, Jorge-Badiola D. Substructure Development and Damage Initiation in a Carbide-Free Bainitic Steel upon Tensile Test. Metals. 2019; 9(12):1261. https://doi.org/10.3390/met9121261
Chicago/Turabian StyleTaboada, Mari Carmen, Amaia Iza-Mendia, Isabel Gutiérrez, and Denis Jorge-Badiola. 2019. "Substructure Development and Damage Initiation in a Carbide-Free Bainitic Steel upon Tensile Test" Metals 9, no. 12: 1261. https://doi.org/10.3390/met9121261
Note that from the first issue of 2016, this journal uses article numbers instead of page numbers. See further details here.