Characterization of Hot Deformation Behavior and Processing Maps of Mg-3Sn-2Al-1Zn-5Li Magnesium Alloy


1
School of Materials Science and Engineering, Nanjing University of Science and Technology, Nanjing 210094, China
2
School of Material Science and Engineering, Jiangsu University of Science and Technology, Zhenjiang 212003, China
*
Authors to whom correspondence should be addressed.
Metals 2019, 9(12), 1262; https://doi.org/10.3390/met9121262
Submission received: 13 November 2019
/
Revised: 19 November 2019
/
Accepted: 21 November 2019
/
Published: 26 November 2019
Abstract
:The dynamic microstructure evolution of Mg-3Sn-2Al-1Zn-5Li magnesium alloy during hot deformation is studied by hot compression tests over the temperature range of 200–350 °C under the strain rate of 0.001–1 s−1, whereafter constitutive equations and processing maps are developed and constructed. In most of cases, the material shows typical dynamic recrystallization (DRX) features, with a signal peak value followed by a gradual decrease. The value of Q (deformation activation energy) is 138.89414 kJ/mol, and the instability domains occur at high strain rate but the stability domains are opposite, and the optimum hot working parameter for the studied alloy is determined to be 350 °C/0.001 s−1 according to the processing maps. Within 200–350 °C, the operating mechanism of dynamic recrystallization (DRX) of Mg-3Sn-2Al-1Zn-5Li alloy during hot deformation is mainly affected by strain rate. Dynamic recrystallization (DRX) structures are observed from the samples at 300 °C/0.001 s−1 and 350 °C/0.001 s−1, which consist of continuous DRX (CDRX) and discontinuous DRX (DDRX). However, dynamic recovery (DRV) still dominates the softening mechanism. At the grain boundaries, mass dislocation pile-ups and dislocation tangle provide sites for potential nucleation. Meanwhile, flow localization bands are observed from the samples at 200 °C/1 s−1 and 250 °C/0.1 s−1 as the main instability mechanism.
1. Introduction
Magnesium alloy, the lightest structural metallic material, has wide application potential in diverse fields such as telecommunication, automobiles, medical machinery, aviation and aerospace, and rail transit [1,2,3], for its high specific strength and specific stiffness, good damping capacity, and recyclability as an ideal light-weight and recyclable material. Research on magnesium alloy has attracted worldwide attention [4,5,6,7]. Because of the limited capability of plastic deformation due to its hexagonal-close-packed crystal structure, Mg alloy products are mainly made through die casting. However, the defects of casting products, such as porosity and shrinkage, mean that they cannot meet the requirements of high-performance structural materials, greatly limiting their application [8,9,10]. Thus, Mg alloy products are increasingly being made using various plastic deformation methods to lessen these limitations [11], contributing to their having better mechanical properties than casting products. Especially during hot deformation, the dynamic recrystallization of magnesium alloy resulting in grain refinement improves the strength and toughness of materials and eliminates various defects, thus greatly enhancing the comprehensive mechanical properties of the alloy [12,13,14,15]. Constitutive equations and heat processing maps for accurately describing the flow characteristics of materials can be constructed through the Arrhenius model, and the accuracy of processing maps can be judged according to microstructure evolution. Processing maps have been verified to be simple and reliable in engineering applications, attracting enormous interest. Cheng et al. [16] researched the hot deformation behavior of Mg-8Sn-2Zn-2Al magnesium alloys at different strain rates and temperatures, and the optimum hot working parameters were determined to be 350 °C/0.01 s−1 and 350 °C/10 s−1. The instability domains occur at 200–250 °C/10 s−1, and the main flow instability mechanisms are twinning and flow localization bands. Feng et al. [17] investigated the hot deformation behavior of as-homogenized Mg-8Li-3Al-2Zn-0.2Zr alloy by compression test at 200–350 °C/0.001–1 s−1. The processing map at the strain of 0.7 exhibits a region of discontinuous DRX occurring at 300–350 °C with a strain rate of 0.001–0.01 s−1 and at 250 °C with a stain rate of 0.001 s−1, which are the optimum parameters of hot working for optimizing the workability and microstructure of the Mg-8Li-3Al-2Zn-0.2Zr alloy. Jiang et al. [18] studied the effects of Sn on the microstructure evolution of AZ80 magnesium alloy during hot compression. The results indicate that the addition of Sn promotes dynamic recrystallization and decreases flow stress during hot compression. Zou et al. [19] studied the effects of Sn on dynamic recrystallization (DRX) of Mg-5Zn-1Mn alloy during high strain rate deformation using hot compression testing. Sn can adjust the nucleation rate and the nucleus growth rate of DRX by regulating the inclination for twinning, adjusting stacking fault energy (SFE) and changing the amount of precipitates. Solute Sn atoms not only promote DRX nucleation by increasing twin density but also stimulate the DRX nucleus growth by reducing SFE. Bajargan et al. [20] focused on the influences of Li on the plastic deformation behavior of AZ31. It was found that the higher the content of Li, the lower the Q value of activation energy. Li also inhibits twinning and DRX, but promotes the cross slip, softening the magnesium alloy. However, there are few reports about the thermal deformation behavior of Mg-3Sn-2Al-1Zn-5Li alloy with Sn and Li added together.
In this paper, hot compression tests on Mg-3Sn-2Al-1Zn-5Li alloy are carried out to systematically study the flow behavior of the magnesium alloy at high temperature. The constitutive equations and hot processing maps of AZ series magnesium alloy containing Sn and Li are constructed. The reasonable hot processing art of Mg-3Sn-2Al-1Zn-5Li alloy is explored by analyzing the internal microscopic deformation mechanism and the microstructure evolution during the deformation process.
2. Experimental Procedure
Mg-3Sn-2Al-1Zn-5Li (wt.%) alloy ingot was prepared from high purity Mg (99.9 wt.%), Sn (99.93 wt.%), Al (99.999 wt.%), Zn (99.995 wt.%), and the Mg-13Li master alloy, which were melted in an electric furnace under a covering flux in a protective atmosphere (0.5 vol.% SF6 + 99.5 vol.% CO2). The melt was held at 720 °C for 20 min and mechanically stirred for 2 min to ensure a homogeneous composition. Pouring was accomplished into a steel die preheated up to 150 °C. Then, the homogenization treatment was performed at 400 °C for 24 h. Cylindrical compression specimens with a diameter of 10 mm and a height of 15 mm were machined using an electro discharge-cutting machine. Hot compression experiments were performed on a Gleeble-3500 thermo-mechanical simulator (Dynamic Systems Inc, New York, USA). The dynamic microstructure evolution of the Mg-3Sn-2Al-1Zn-5Li magnesium alloy during hot deformation was studied by hot compression tests. The deformation temperature range was 200–350 °C and the strain rate was 0.001–1 s−1 respectively. Prior to being compressed, the specimens were conductively heated to the designed temperature at a heat rate of 5 °C/s, followed by a holding time of 5 min. The specimens were then water quenched immediately after compression to preserve the deformed microstructure. All samples were compressed to a true strain of 0.8. The microstructure observations were carried out on the longitudinal sections after etching in a solution containing 100 mL ethanol, 3 g picric acid, 20 mL acetic acid, and 25 mL water. The microstructure was observed using an AxioImager A2m optical microscope (ZEISS Inc, Oberkochen, Germany), a MALA3 Triglav scanning electron microscope (TESCAN Inc, Brno, Czech), and a 2100 F transmission electron microscope (JEOL Inc, Tokyo, Japan). Additionally, the electron backscatter diffraction (EBSD) micro orientation analysis was conducted using an Oxford Instruments-NordlysNano EBSD dectetor (Oxford Instruments Inc, Abingdon, UK) equipped on the SEM operating at 20 kV. The samples prepared for EBSD analysis were additionally performed by ion etching in a Leica RES101 ion etching apparatus (Bal-Tec Inc, Wetzlar, Germany) after mechanical polishing. The orientation imaging microscopy software was provided by HKL Channel 5.11.20405.0, Oxford Instruments NanoAnalysis, Abingdon, UK.
3. Results and Discussion
3.1. The Initial Microstructure of the Homogenized Mg-3Sn-2Al-1Zn-5Li Alloy
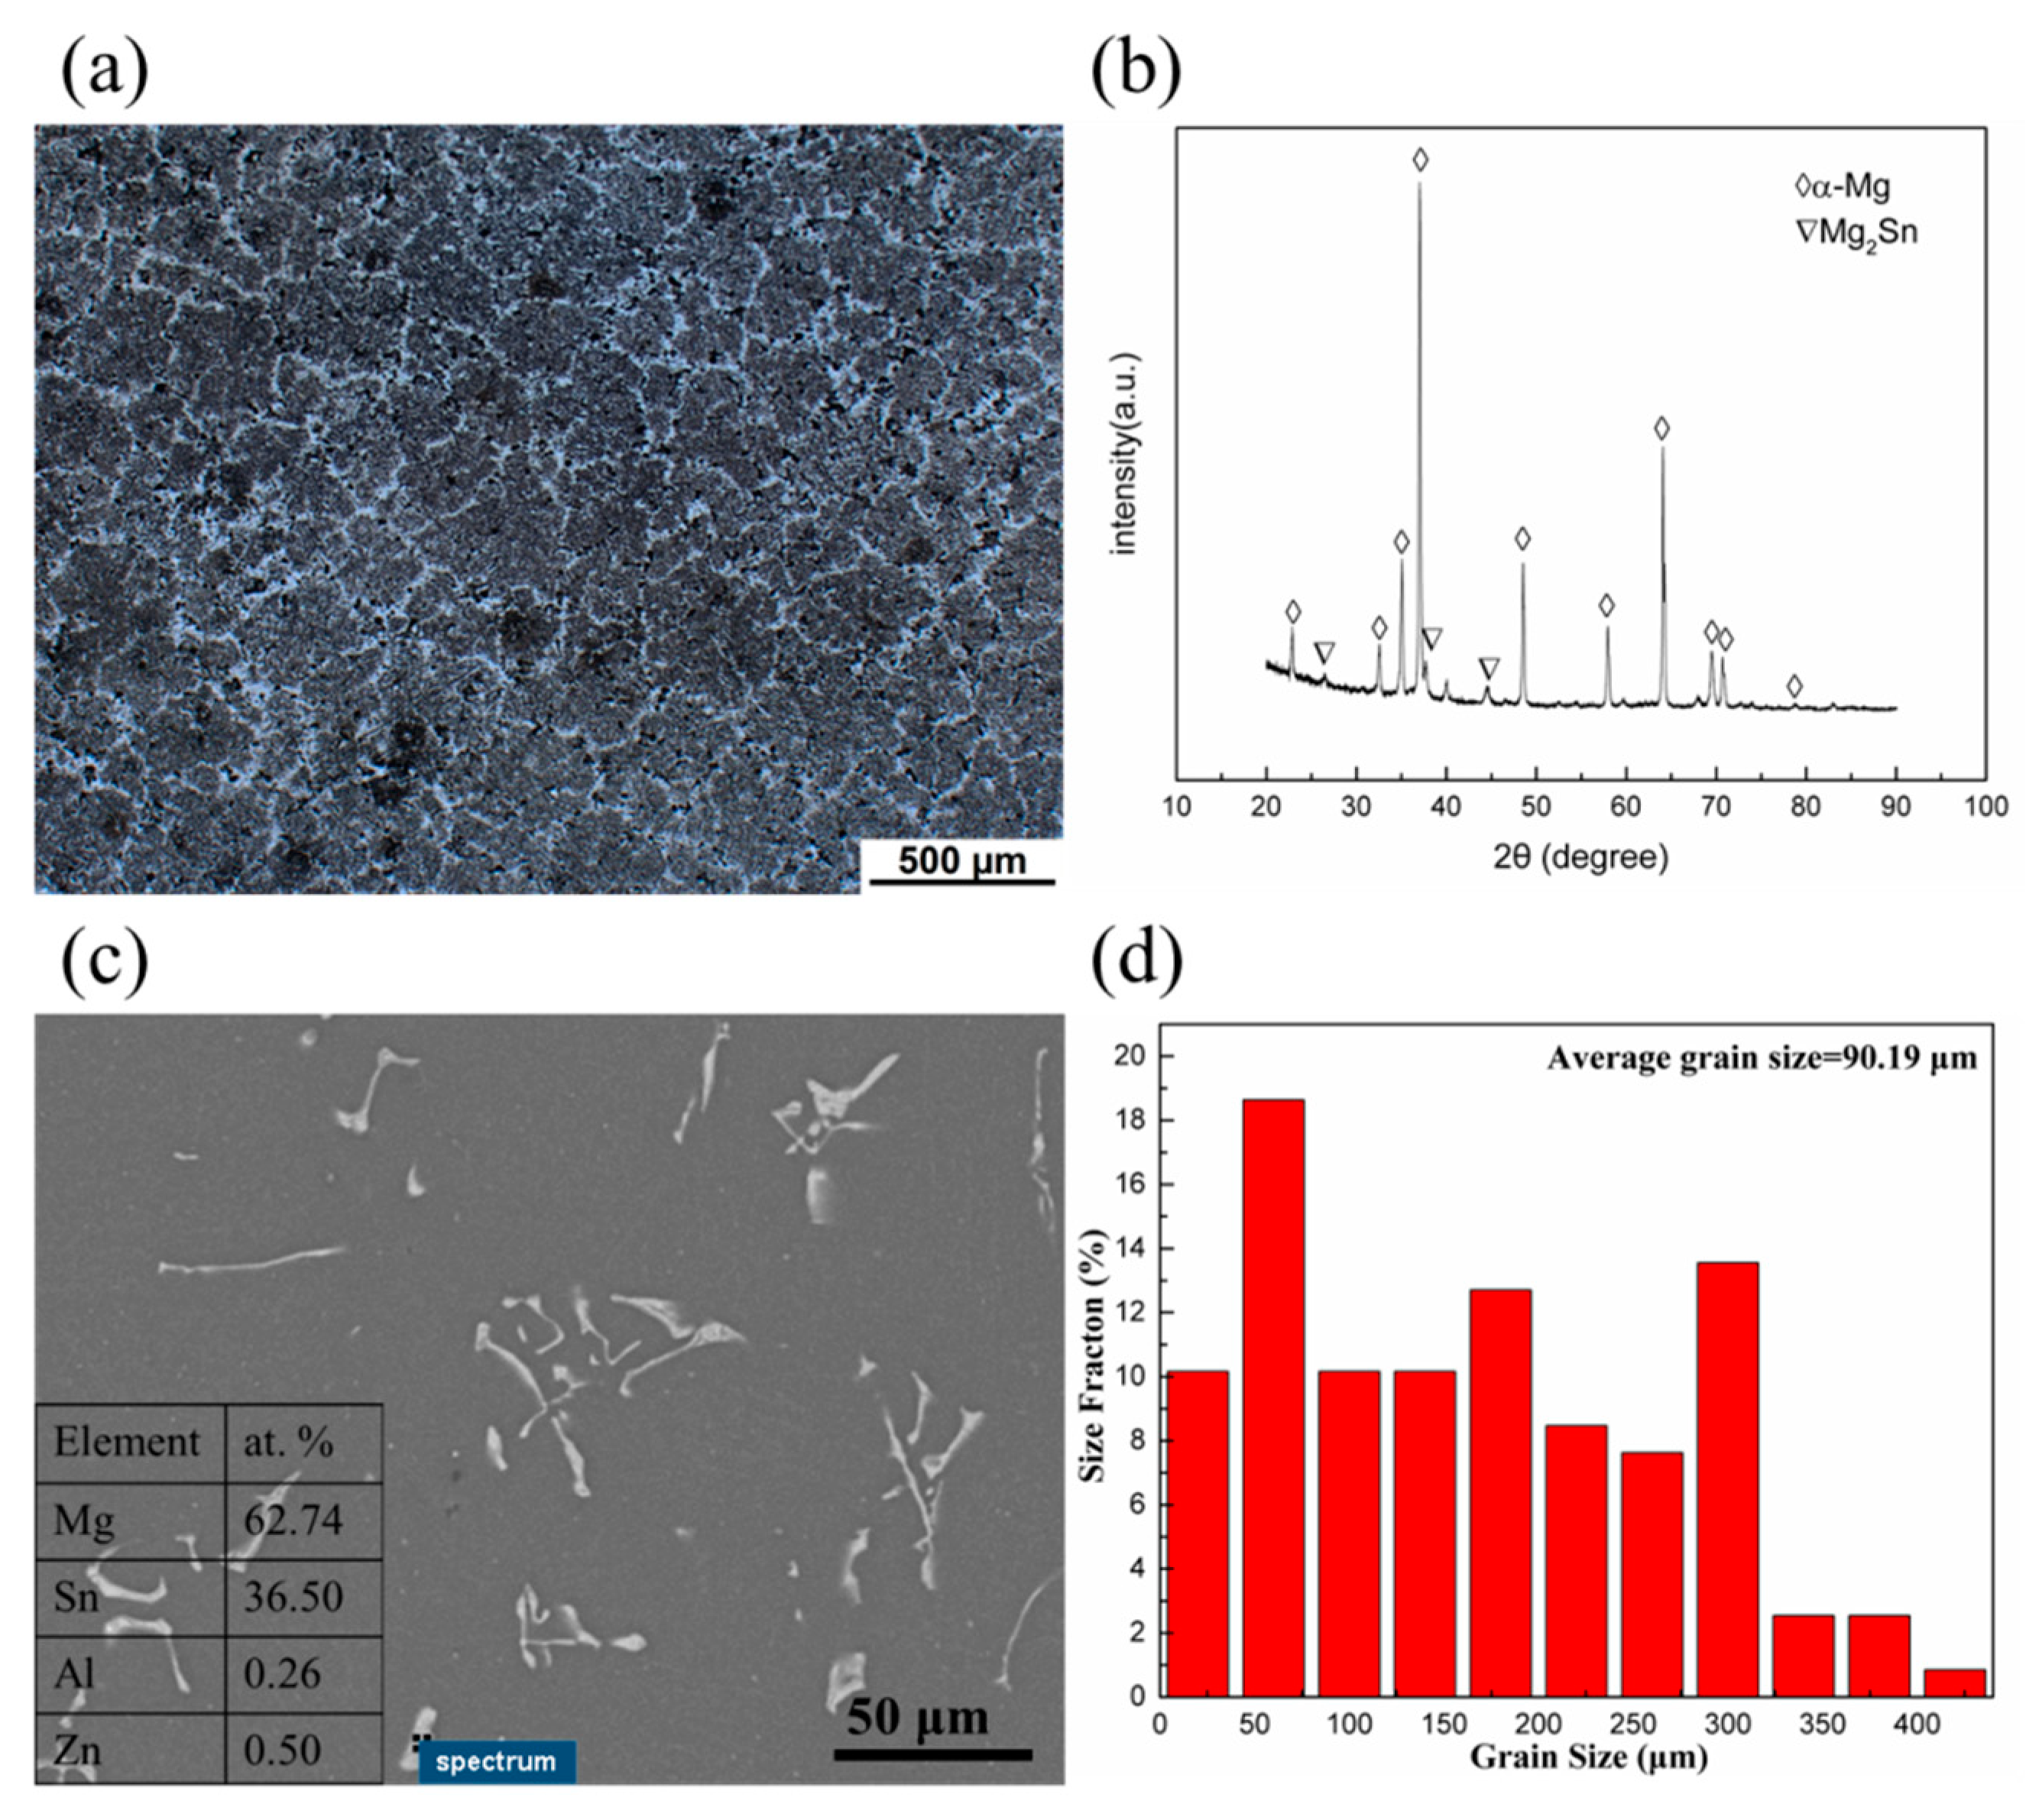
Figure 1 shows the initial microstructure of the as-homogenized Mg-3Sn-2Al-1Zn-5Li alloy. From the OM images, the grains are equiaxed, and the alloy is mainly composed of α-Mg phases according to the XRD results; it can also be observed that some weak peaks represented Mg2Sn phases. Based on the SEM and EDS results, the undissolved spherical and/or cubic Mg2Sn phases distribute homogeneously into the α-Mg matrix. Additionally, the average grain size was determined as 90.19 μm.
3.2. Hot Compression Flow Behavior
The true stress-strain curves of Mg-3Sn-2Al-1Zn-5Li alloy at different conditions are shown in Figure 2, sharing similar shapes at the same stain rate. It is observed that when the strain rate is fixed, flow stress of each curve increases sharply at the very beginning where the strain value is small. Then, the stress increasing rate slows down until the stress peak is reached, with a slow descent until it smoothes out again. Most curves show obvious single peak phenomenon. In the initial stage of deformation, the dislocation multiplication speed is very high, correspondingly resulting in a fast increase of dislocation density. Numerous interactions inhibit the dislocation motion. Therefore, the stress rises sharply at very low strain in this stage and the work hardening process is predominant [21]. When the strain increases to a certain degree, the deformation storage energy increases, accompanied by dynamic softening, but work hardening is still the main deformation mechanism. The slope of the true stress-strain curve decreases, and the curve tends to be flat [22]. As the stress rises to the peak value with strain increasing to a critical value, work hardening is completely offset by softening [23]. With the further increase of true strain, dynamic softening rate increases and exceeds the rate work hardening rate. Mainly featured by continuous dynamic softening, the flow stress decreases after peak stress smoothly until it becomes steady. During the steady stage, the dynamic recrystallization and work hardening achieve a new balance so that the flow stress no longer changes with the increase of the strain, and steady flow of material forms [24].
As seen, under the same strain rate, the flow stress decreases significantly with the increase of temperature, implying that the magnesium alloy is sensitive to temperature. Similarly, under the same strain rate, the peak stress value decreases with the increase of temperature. This is because as the temperature increases, the interatomic force weakens, and the dislocation movement is enhanced by thermal activation role, better enabling the slip system, thus reducing the work-hardening effect. With the increase of deformation temperature, the critical shear stress of the slip system decreases, while the driving force for dislocation cross-slip and climb, atom diffusion, and the formation and combination of sub-grain increases, easing the dynamic recovery and dynamic recrystallization and bringing the peak stress down. The peak stress increases with the strain rate under the same temperature, which is also related to the movement of dislocation. Due to the high strain rate, insufficient dynamic recovery and recrystallization of the alloy lead to the inadequate dislocation slip and diffusion, etc. In other words, before the nucleation and growth of recrystallized grains, the deformation continues. The effect of work hardening is more pronounced, as shown by the increase in peak stress on the curve [25]. Furthermore, some special peaks are founded in Figure 2b. From the following trend of the curve, the trend of four figures’ stress-strain curves is consistent, as illustrated in Figure 2b. In the study of Pan [26], Zhou [27], and Chen [28], the special peak of stress also appeared. Chen attributed the sudden change of stress to the change of slip mechanism through microstructure observation. In the case of concave curves, the deformation mechanism is twinning dominated, while the deformation mechanism is slip dominated in the case of convex curves. It should be noted that the twinning-slip dominated transition temperature is strain rate-dependent.
3.3. Constitutive Equation
The relationship among strain rate (), flow stress (), and deformation temperature (T) can be expressed in three different forms as below, according to the stress level as shown in the parentheses [29,30]
in which Z is the Zener-Hollomon parameter; Q is the deformation activation energy; R is the ideal gas constant; T is the thermodynamic temperature; A1, A2, n1, β, and A are temperature-independent constants; α is the stress level parameter; and n is the stress index. Take the logarithms of both sides of Equations (1) and (2), respectively
when the deformation temperature T is constant, n1 and β can be calculated by the following formulas:
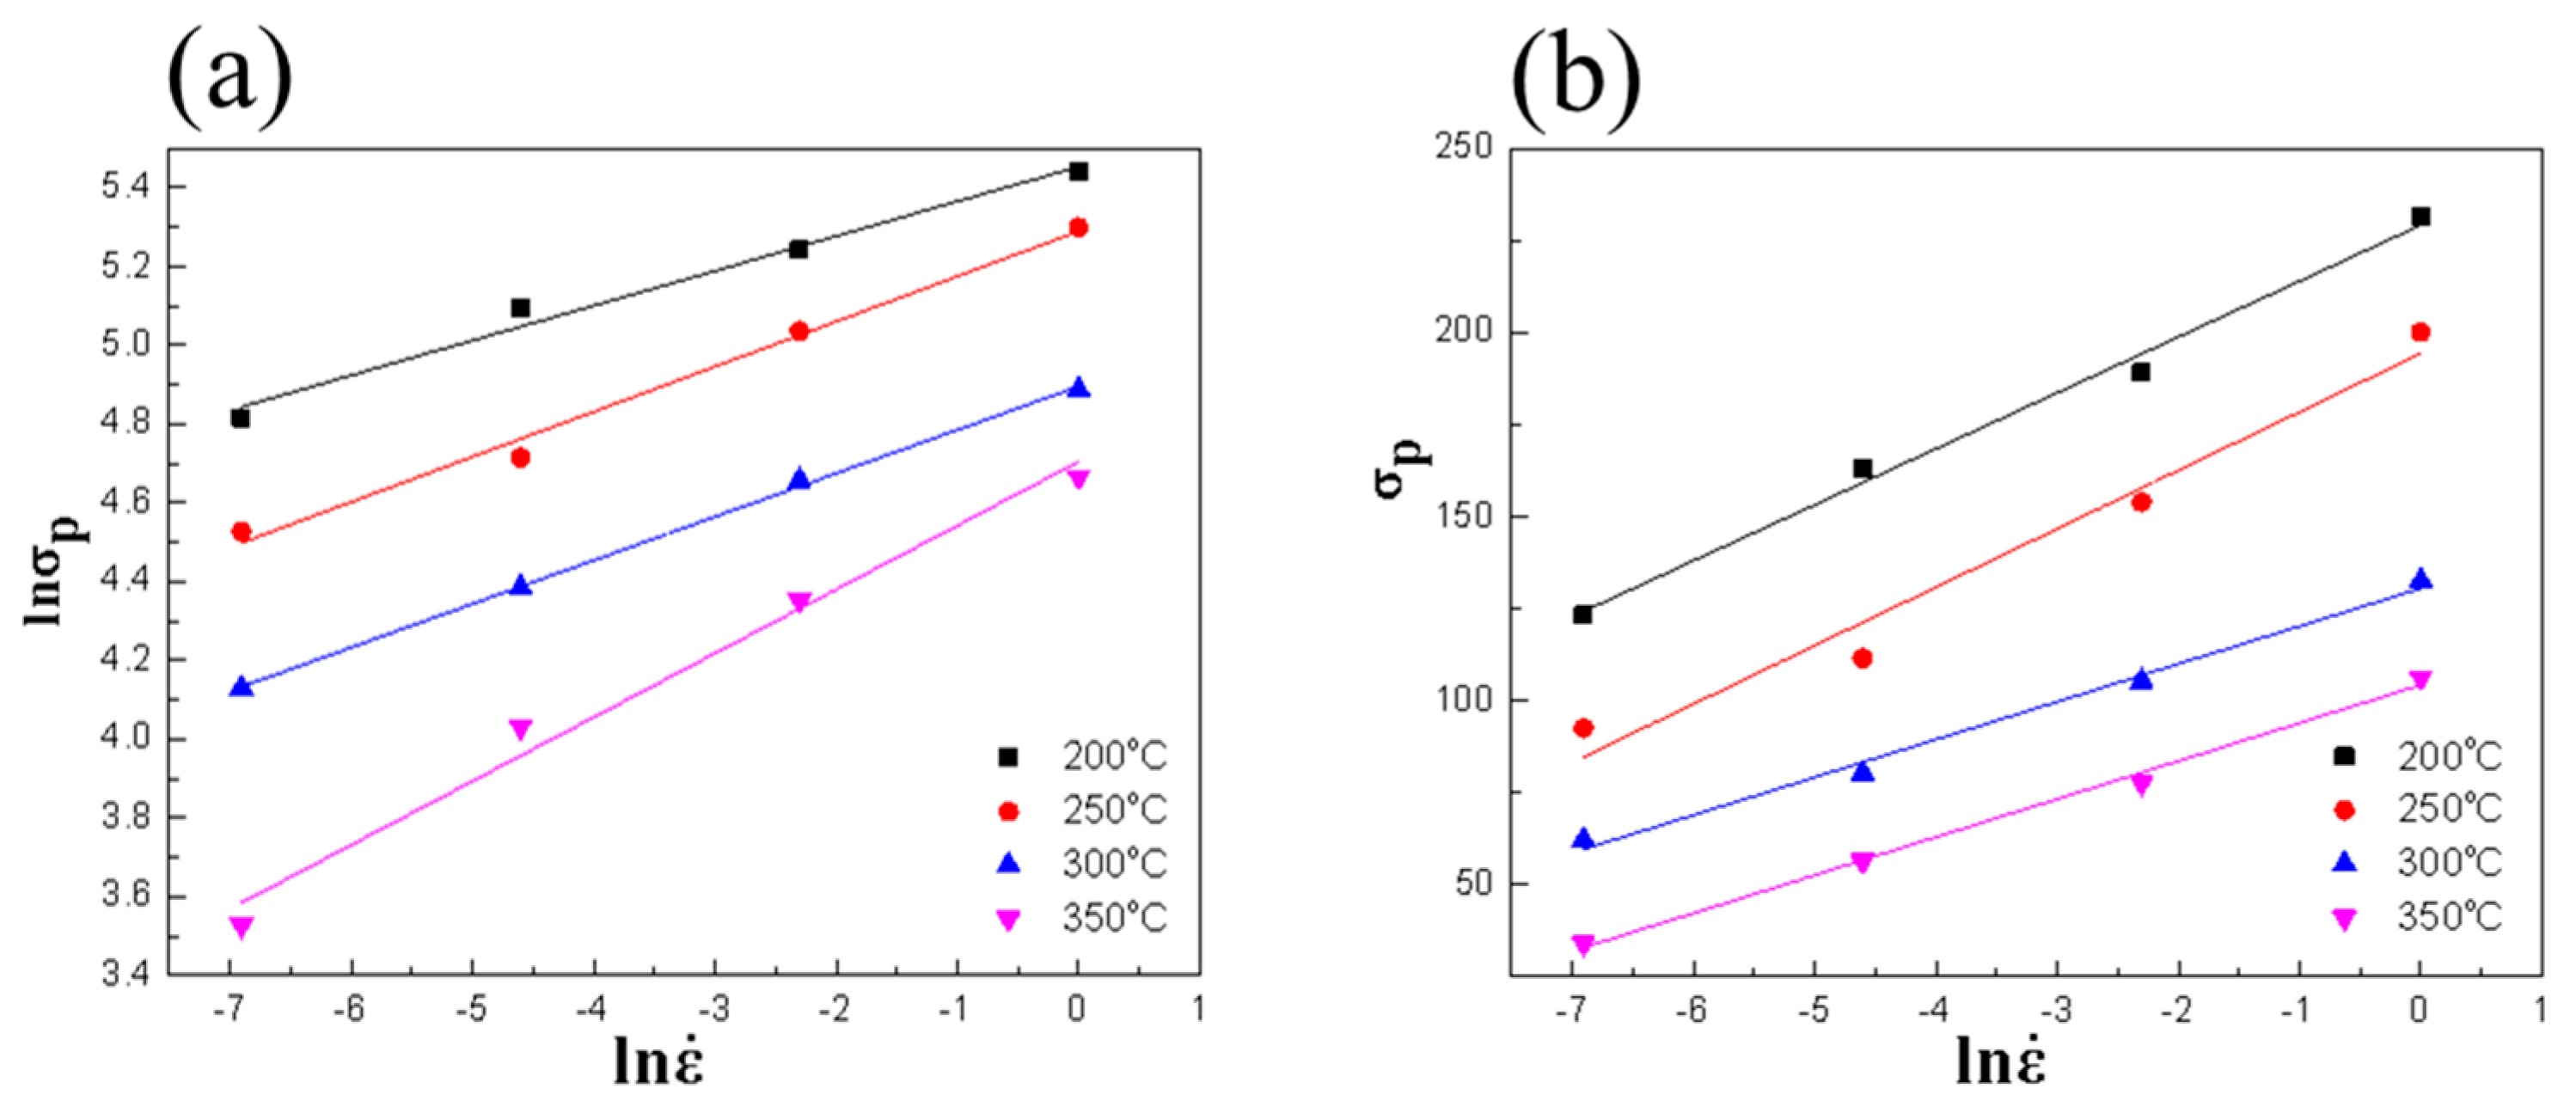
Take the peak stress σp under different deformation conditions, using the least-square to perform the linear regression, the mean value of n1 and β can be determined as 8.81915 and 0.08079 MPa−1 from the slops of (Figure 3a) and (Figure 3b); therefore, α = β/n1 = 0.00916 MPa−1.
By taking natural logarithm on both sides of Equation (3), the equations can be written as follows:
when the deformation temperature T is constant, n can be calculated from the following formula:
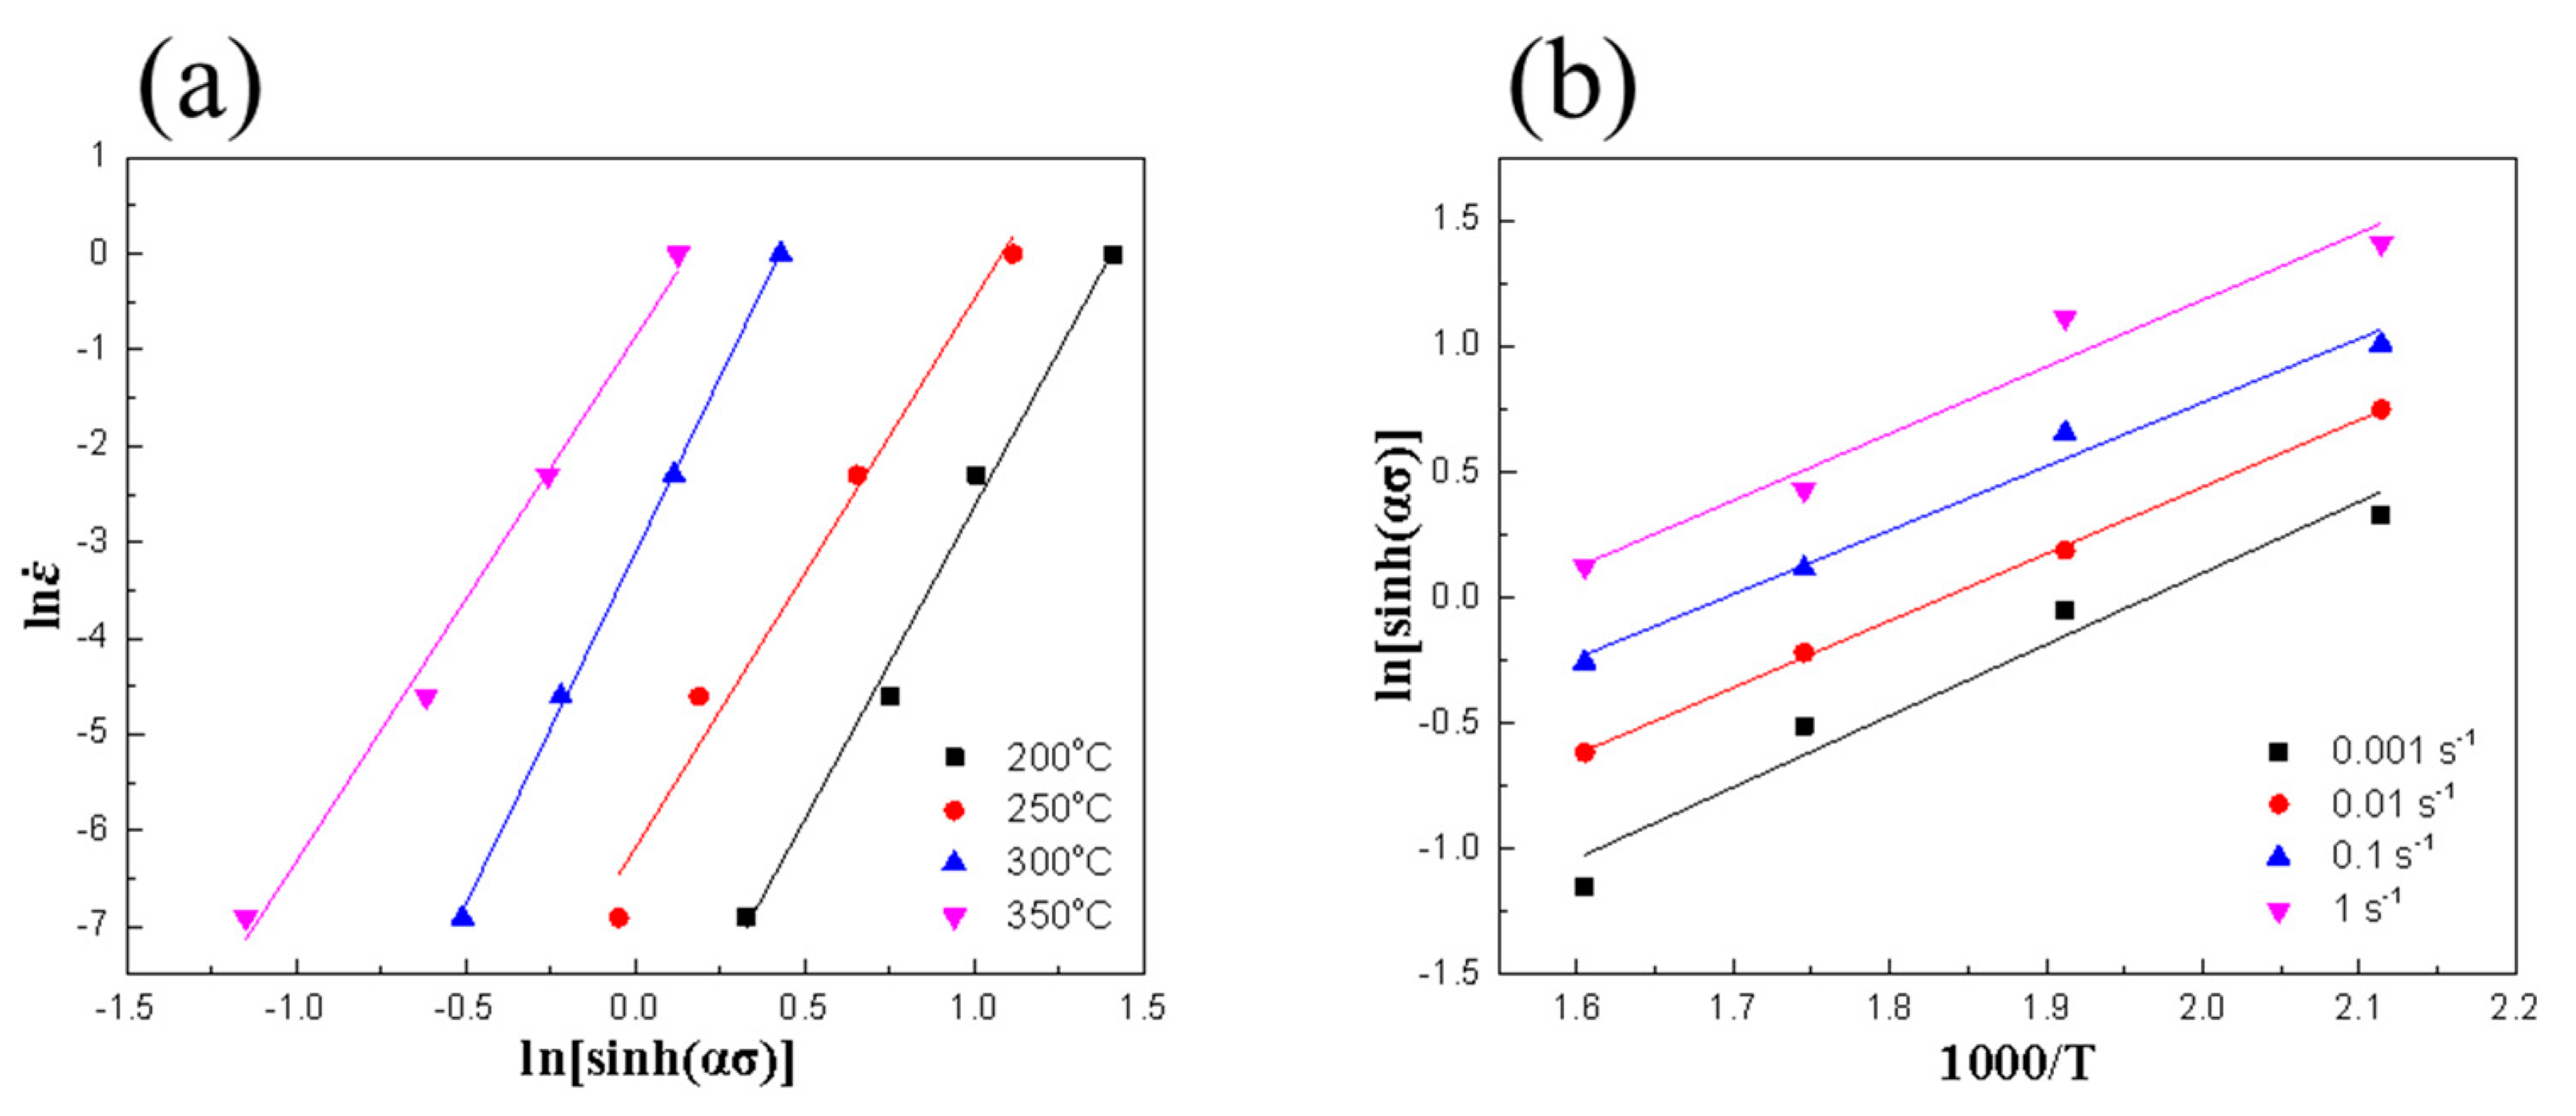
By substituting the α, peak stress σp under different deformation conditions, and into Equation (9), and using the least-square to perform the linear regression, the stress exponent n is determined as 6.24648 from the slopes of (Figure 4a).
Available via Equation (8)
In the same way, when the strain rate is fixed, the mean value of s can be determined from the slops of (Figure 3b); therefore, s = 2.67448.
Based on Equation (10), the value of Q (deformation activation energy of Mg-3Sn-2Al-1Zn-5Li alloy) can be calculated, and it is 138.89414 kJ/mol.
By taking natural logarithm on both sides of Equation (3), the equations can be written as follows:
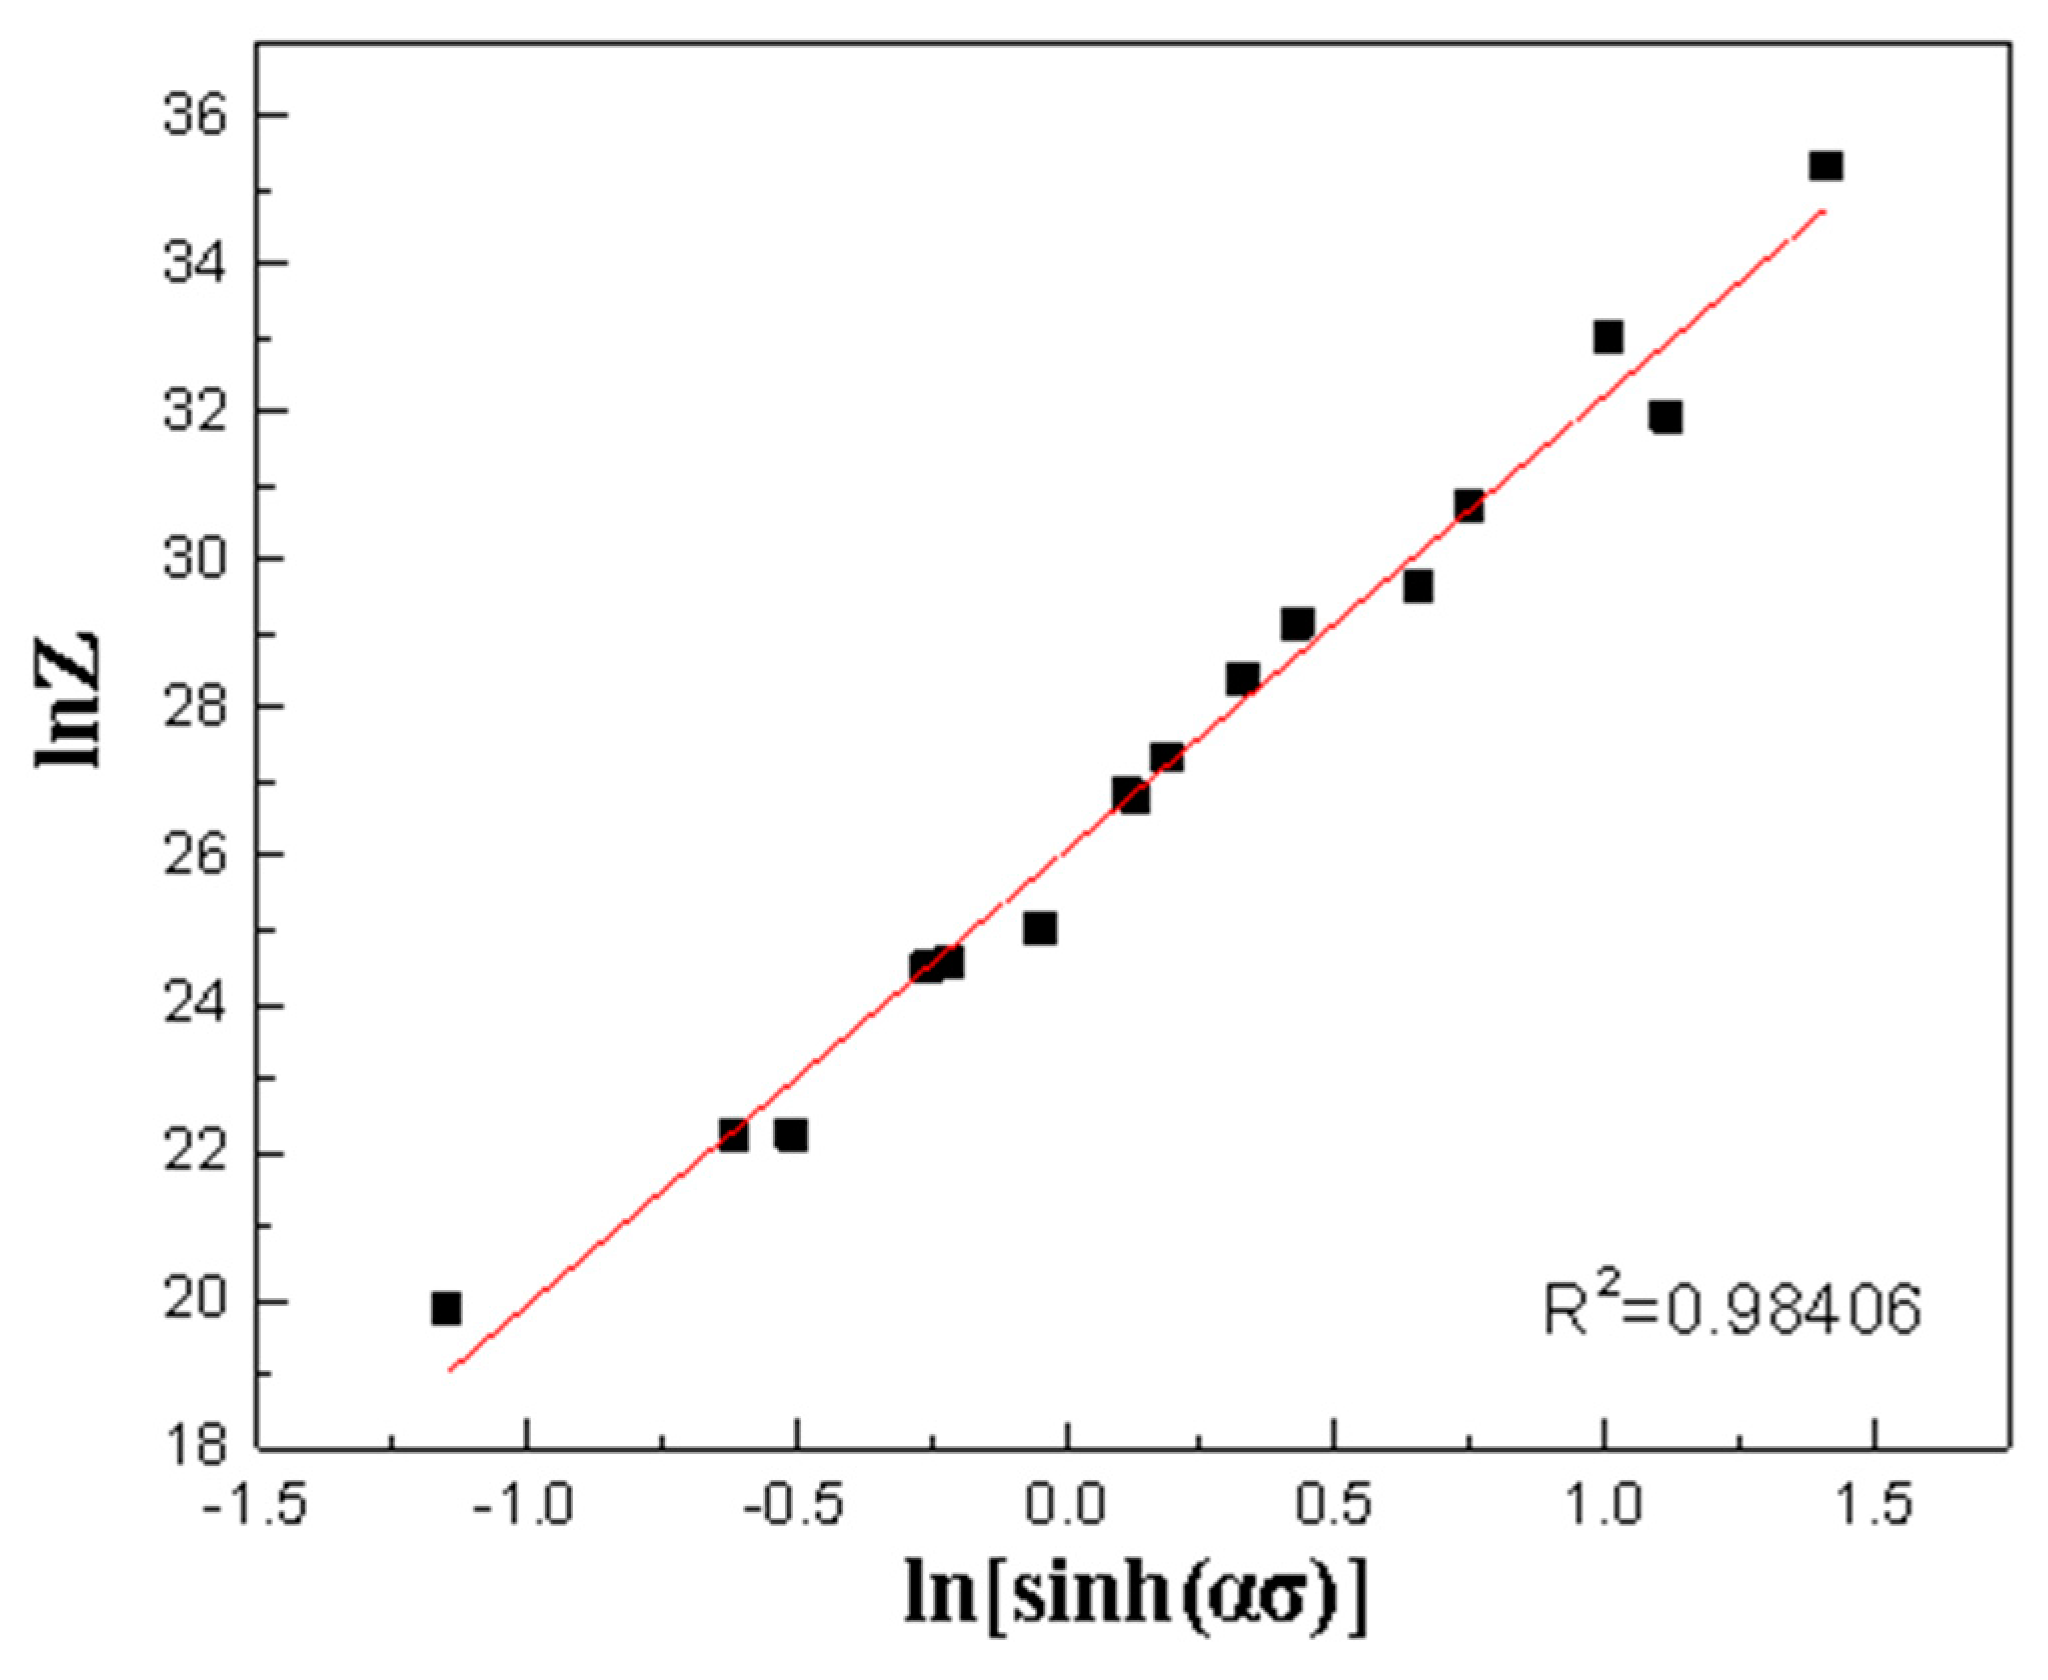
Substituting the values that have been computed into Equation (11) then drawing corresponding curve, as shown in Figure 5, the slope n is 6.13833 and the intercept lnA is 26.0789. The material constant A = 2.11817 × 10¹¹, the linear regression correlation coefficient R2 = 0.98406, and the fitting accuracy of the equation is high.
Finally, substituting the values of α, A, n, and Q into Equation (3), the constitutive equation of Mg-3Sn-2Al-1Zn-5Li alloy can be written as
The value of Q is lower than that of AZ series magnesium alloys only with Sn addition but higher than that of those only with Li addition, indicating that Li and Sn have comprehensive impact on the alloys. Although Li will inhibit DRX, it can promote cross slip and soften magnesium alloy [20,31]. Tin mainly promotes the nucleation and growth of DRX and reduces the flow stress by increasing the nucleation probability and reducing the stacking fault energy [18,19]. In addition, the deformation mechanism can be determined according to the stress index n. When n is greater than 6, the deformation is mainly controlled by the cross slip of the screw dislocation. Since n of Mg-3Sn-2Al-1Zn-5Li magnesium alloy is 6.25, cross slip is its deformation mechanism [23,32].
3.4. Processing Maps
The efficiency of power dissipation η and the instability parameter ξ can be calculated as below, based on flow stress values under different deformation conditions at the true strain of 0.6 and 0.8 (stability domain):
where is the strain rate sensitivity. The processing map can be plotted by overlapping the power dissipation map and the instability map, which are generally viewed as the contour maps of η and ξ, respectively [33], under the related parameters of strain rate and deformation temperature, as shown in Figure 6.
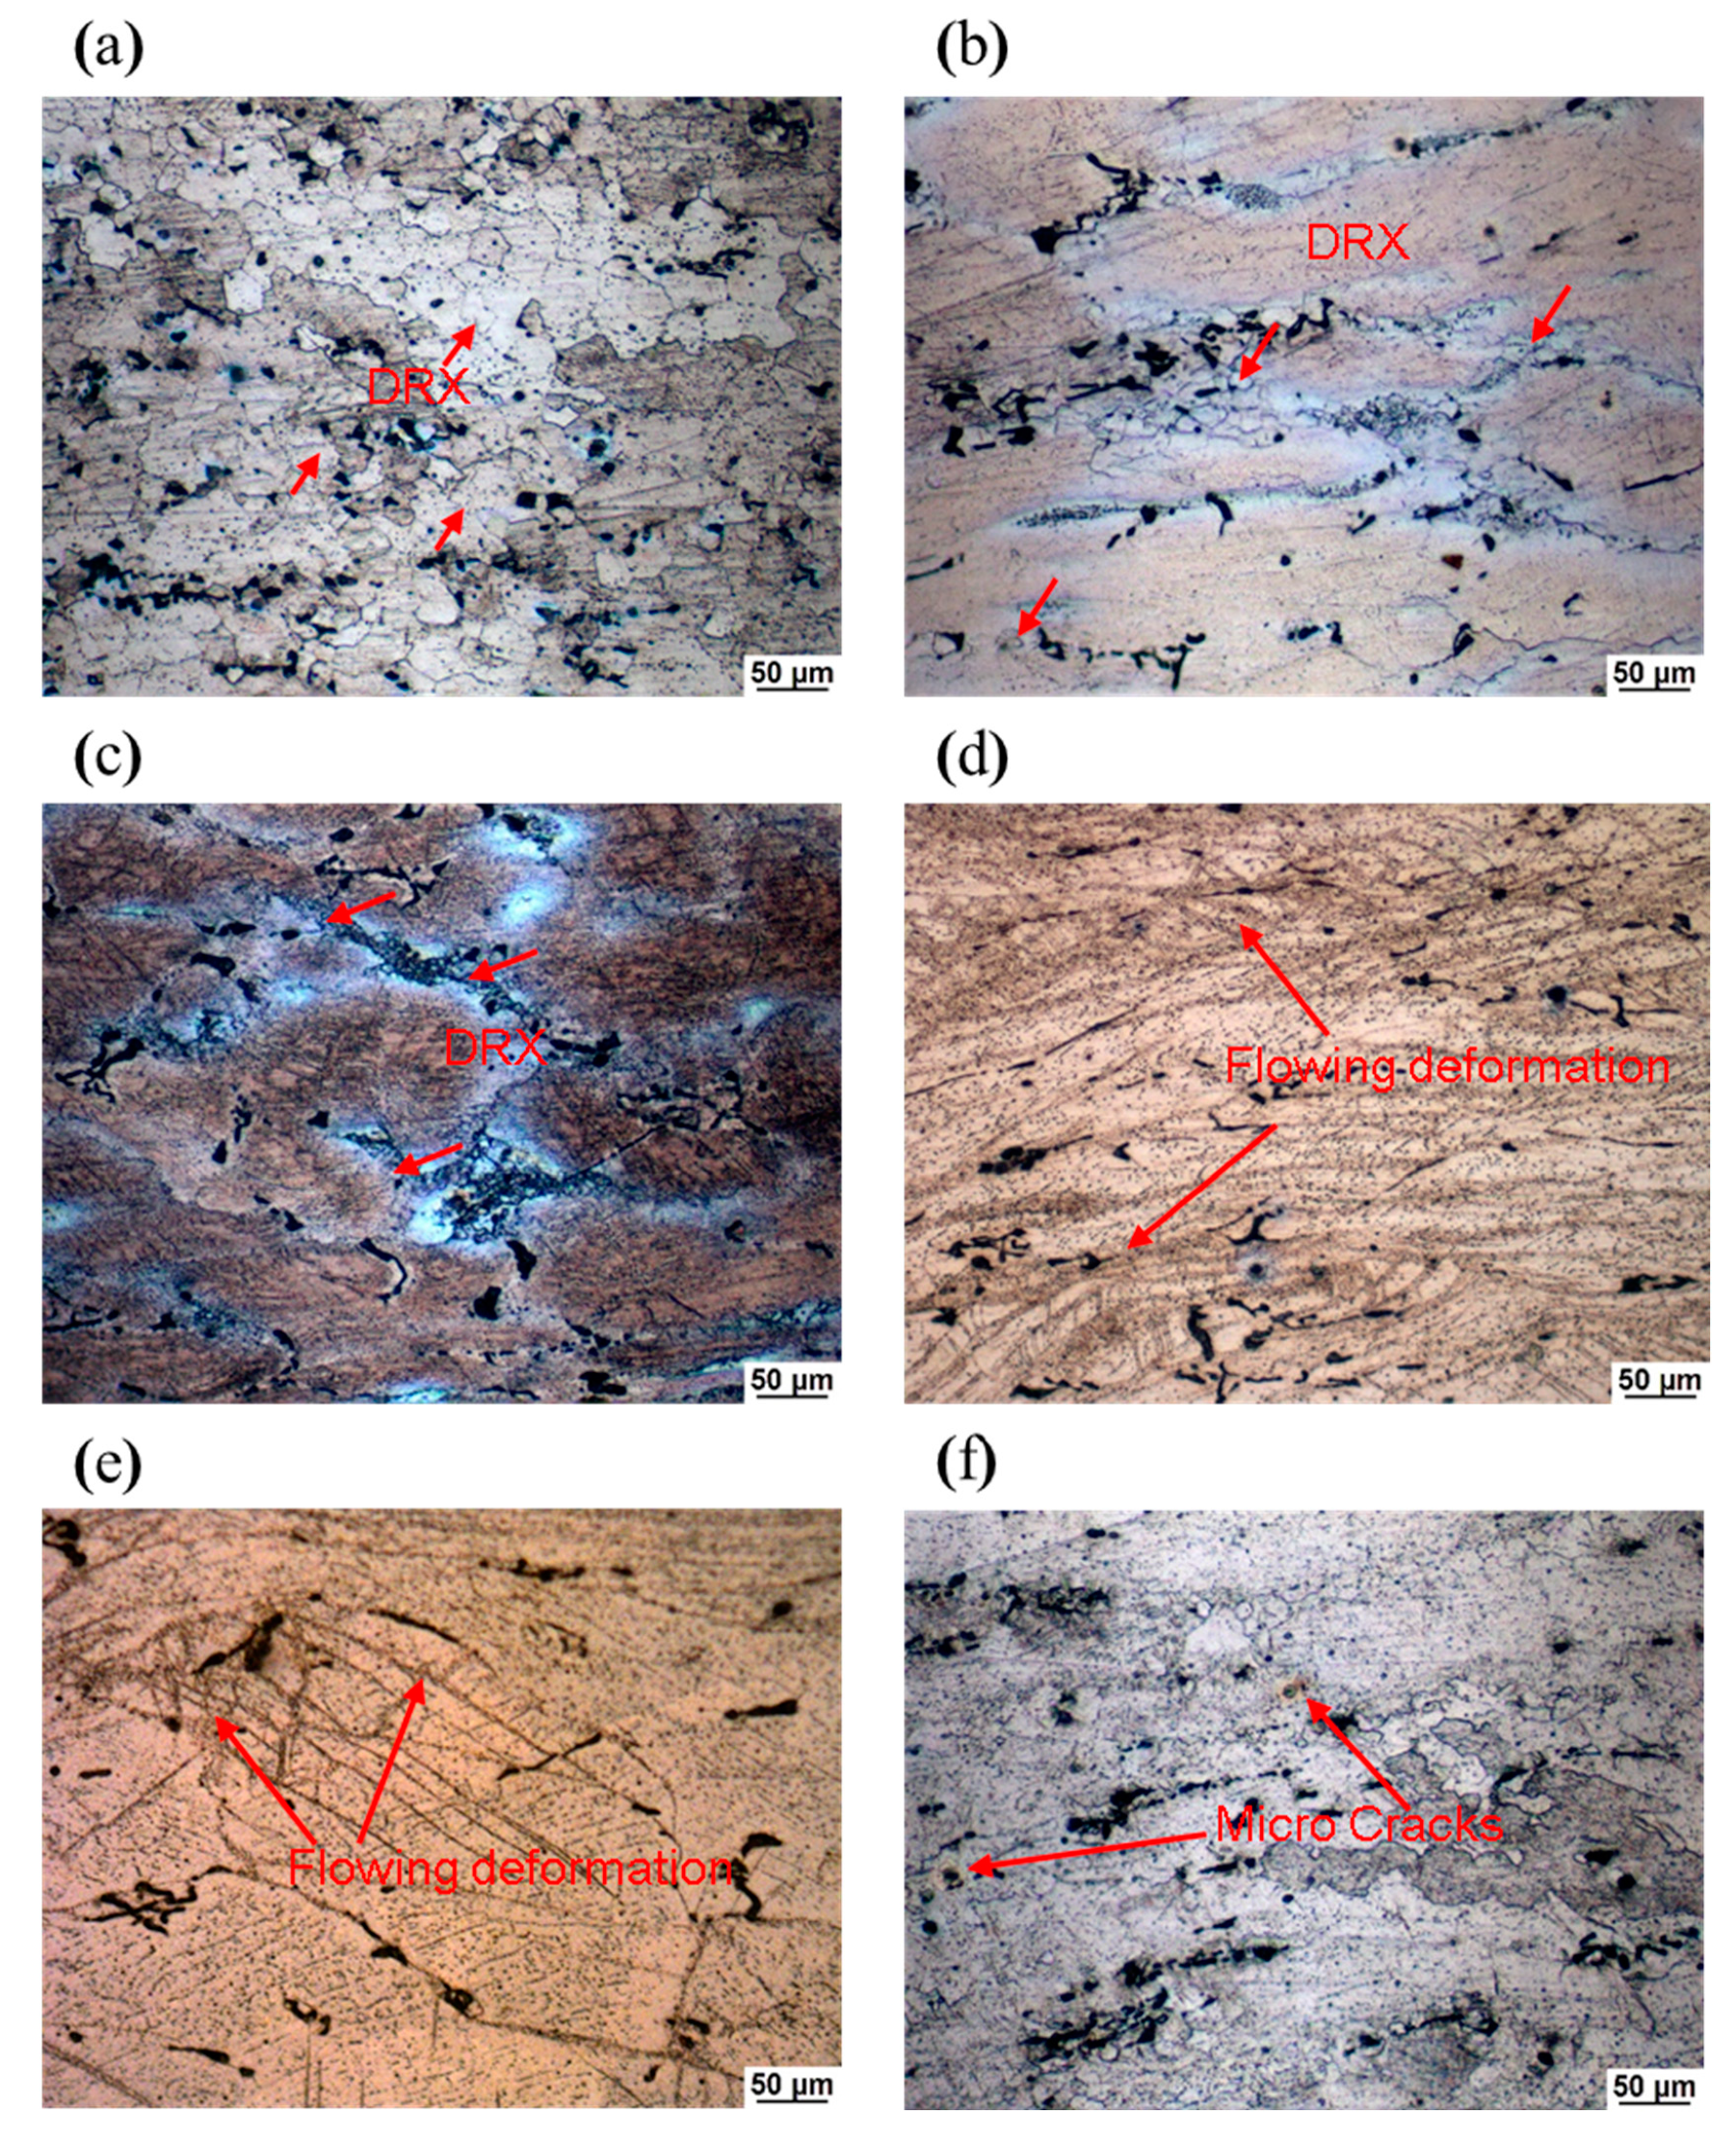
The instability domains are represented by the shaded areas in Figure 6, and contour curves represent the energy consumption efficiency η. For magnesium alloys with low stacking fault energy, dynamic recovery (DRV) occurs when η < 30%, while dynamic recrystallization (DXR, η > 30%) can promote the thermal processing performance by its softening and thus stabilization functions on flow [34]. The processing map shows that within 200–350 °C/0.001–1 s−1 region, there is a high-efficiency zone under the relatively high-temperature and low-strain rate in the range of 300–350 °C/0.001–0.005 s−1. The maximum η appears in 300–350 °C at the strain rate of about 0.001 s−1. This is because the high deformation temperature in this area accelerates atomic diffusion, so that DRV and DRX occur more easily, increasing the driving force to flow softening [35]. Additionally, the low strain rate provides small grains generated by DRX with more time to grow up, leading to better processing effect. Figure 7a,b show the microstructure morphology after compression at 300 °C/0.001 s−1 and 350 °C/0.001 s−1, respectively. Many DRX grains observed in Figure 7a, as well as the obvious DRX grain growth observed in Figure 7b, indicate 300–350 °C/0.001–0.005 s−1 is suitable for thermal processing. There are some areas at low η but without instability, and they are considered as the accurate processing range. As shown in Figure 7c, the original structure has been compressed to a slender shape. After deformation, the grain boundary shows a typical necklace-like dynamic recrystallization structure. With the increase of temperature, the grain size in the necklace tissue increases, which is the result of the grain growth caused by the increase of temperature. However, the necklace-like structure is still visible, which proves that recrystallization is not sufficient. The existence of necklace-like structure will lead to the difference in mechanical properties at grain boundary, increasing the potential occurrence of local shear bands [36].
Two instability domains can be seen in either processing map in Figure 6, the first of which occurs at 200–280 °C/0.05–1 s−1. In this region, the deformation temperature is relatively low, the strain rate is relatively high, and the maximum energy consumption efficiency η is about 16%, indicating that the energy is mainly used for plastic deformation other than microstructure evolution. Due to the low deformation temperature and high strain rate, DRX is insufficient, occurring first at the high-energy grain boundary and then when generating fine grains. The strain rate is too high to allow these fine grains to grow up, thus extending to the original grains without dynamic recrystallization to form a fine grain zone. Figure 7d,e are the microstructures of the hot-compressed alloy at 200 °C/1 s−1 and 250 °C/0.1 s−1. Many deformation bands are observed that are the recrystallized structure formed by the initial fine grains generated from DRX. Under the high strain rate, the ungrowable fine grains remain in the original state. Fine grains are easily deformed due to their perfect mechanical properties, while the original coarse grains show poor plastic deformability.
Therefore, shear bands are easy to form at the interface of coarse and fine grains. Due to different critical shear stresses required by coarse and fine grains, it is difficult for coordinate deformation to occur between the two kinds of grains, leading to the flow instability near the deformation zone [37]. The second instability domain occurs at 325–350 °C/0.09–1 s−1, with both high temperature and high strain rate. High temperature is favorable for dynamic recrystallization, but high strain rate will inhibit grain growth. The co-existence of extremely fine grains and original coarse grains will cause instability. Many micro cracks can be seen in the microstructure of the hot-compressed alloy at 350 °C and 0.1 s−1, as shown in Figure 7f. At high strain rate, heat is difficult to disperse during deformation, and the energy of deformation is mainly concentrated in the grain boundary area. Therefore, adiabatic shear effect occurs easily, causing flow instability of the alloy in the aforementioned area. Meanwhile, plastic deformation work will be converted to heat under high temperature and high strain rate. The insufficient recrystallization region is mainly located at the grain boundary, to excessively soften the local grain boundary, significantly reducing boundary strength. Grain boundary cracking due to high dislocation density and stress concentration will also cause local flow instability. These two instability domains should be avoided in hot processing [38].
From Figure 7, it can be seen that under the low temperature and high strain rate (Figure 7d), the sample shows obvious instability, which is caused by the occurrence of flowing deformation; when the deformation temperature is raised and the strain rate is lowered (Figure 7e), the instability is improved. When the deformation temperature is further increased (Figure 7f), although some recrystallized grains can be seen, instability is still caused because the occurrence of microcracks due to the faster strain rate. After further reducing the strain rate (Figure 7c), a distinct necklace-like structure composed of fine recrystallized grains can be seen; however, it is clear that there are some larger recrystallized grains at high temperatures and low strain rate (Figure 7a,b). Therefore, with the increase of deformation temperature and the decrease of strain rate, the instability improves gradually; meanwhile, the processing performance improves gradually, too.
3.5. Microstructure Analysis
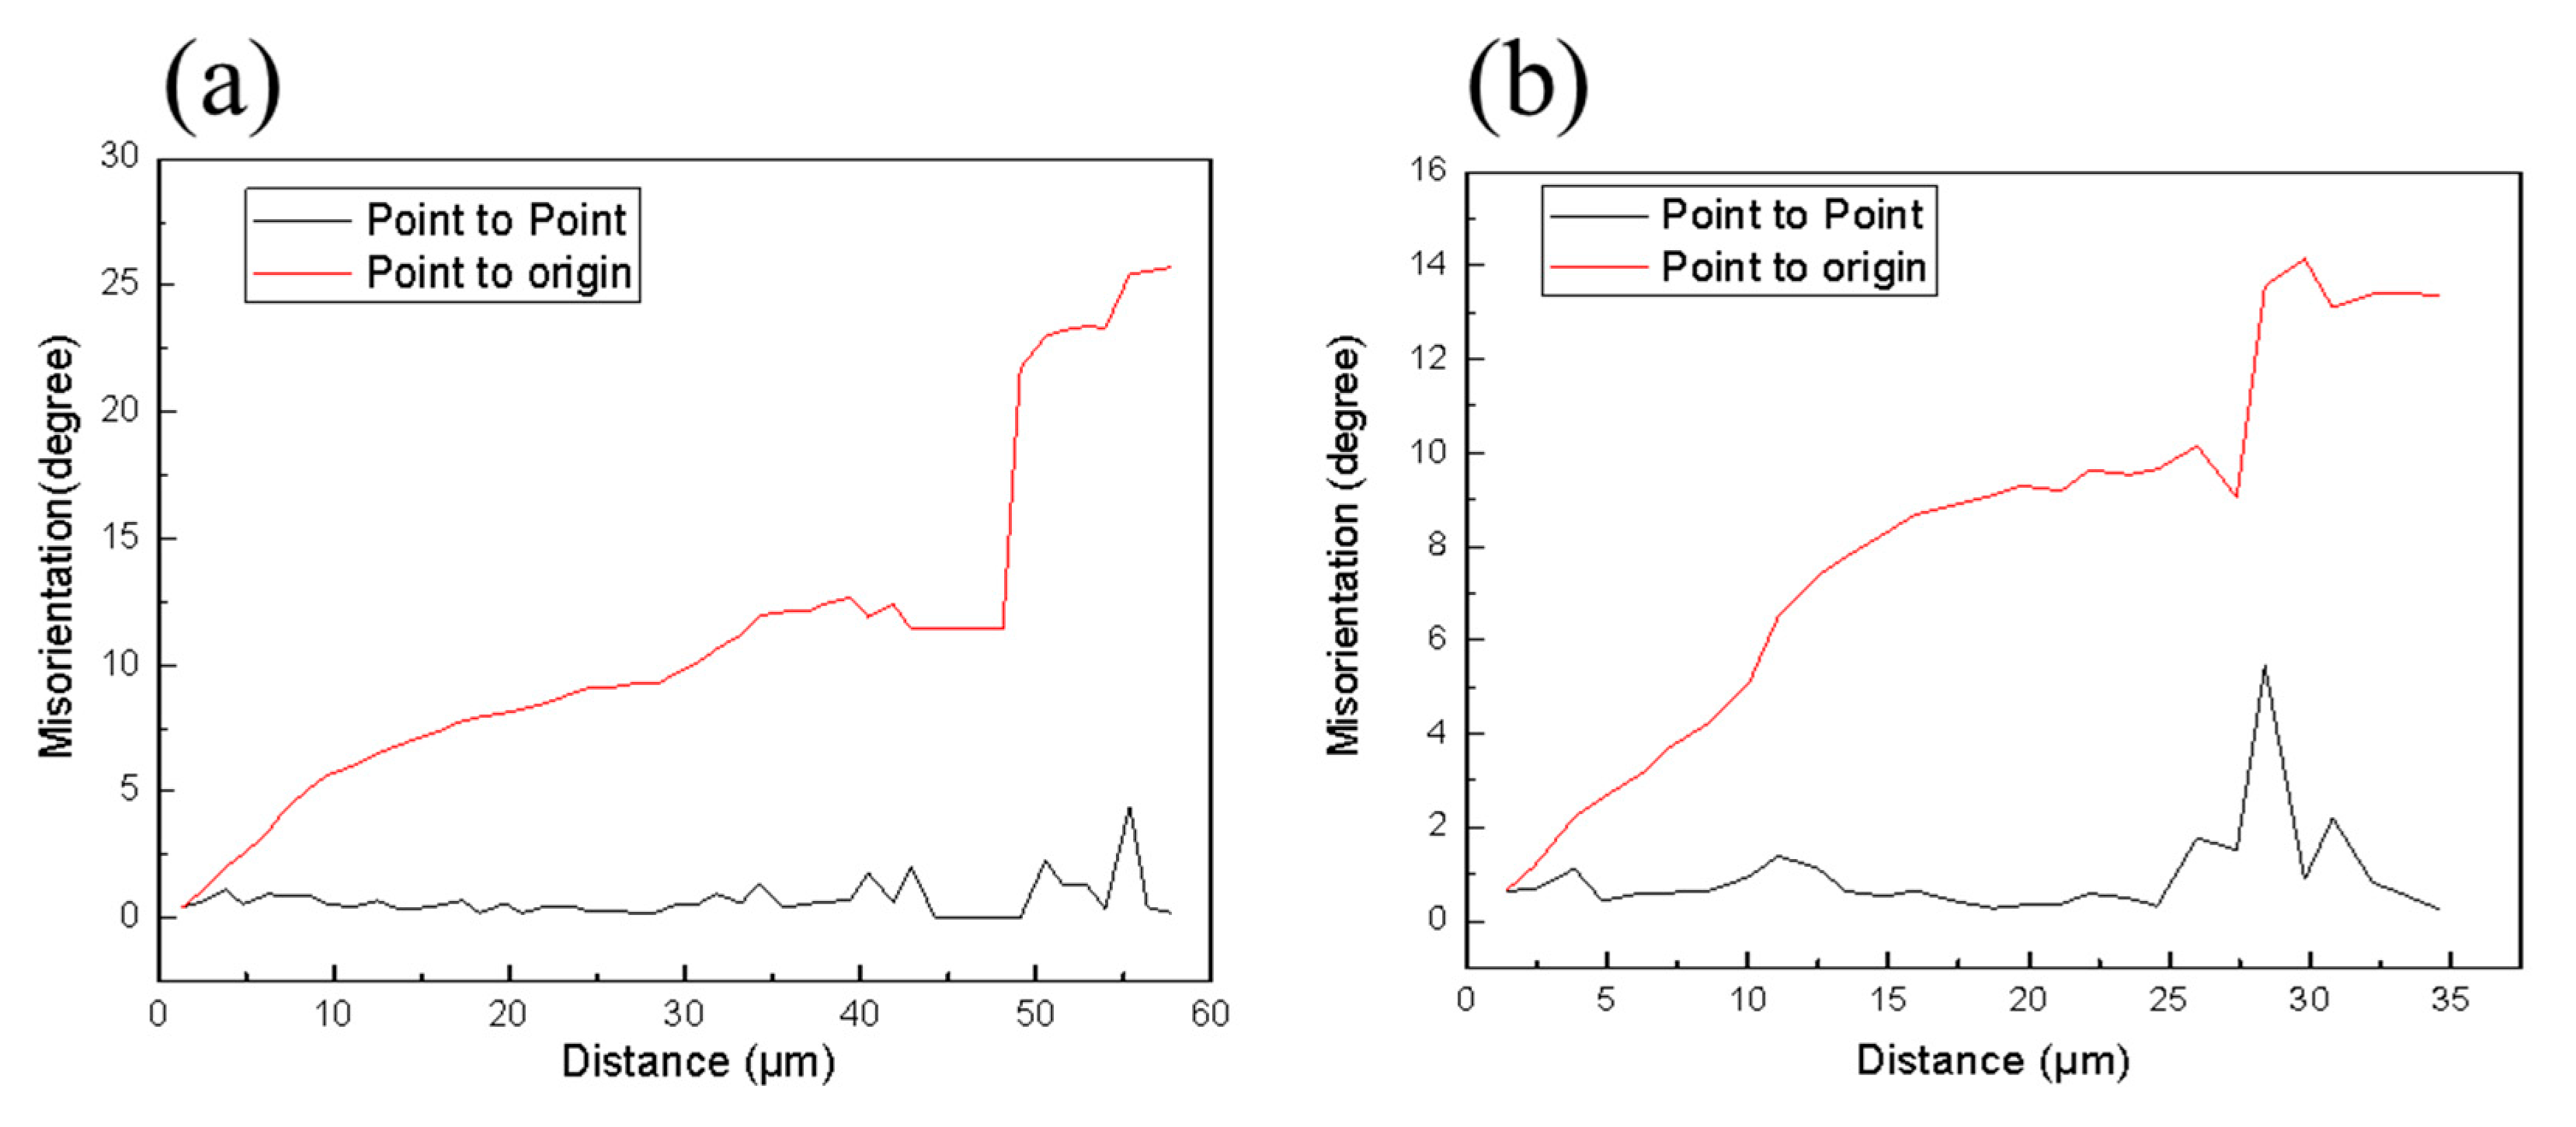
To better understand the texture evolution of Mg-3Sn-2Al-1Zn-5Li alloy in the stability domain, EBSD analysis was applied on 200 °C/0.001 s−1 compressed samples and 350 °C/0.001 s−1 compressed samples. Figure 8 shows the grain boundary diagram of Mg-3Sn-2Al-1Zn-5Li alloy under two deformation conditions. With the increase of temperature, the recrystallized grains have enough time to grow up at low strain rate, leading to the coarse grains at 350 °C. In addition, the thermal compression deformation contributes to the generation and increase of dislocation and twins within the grain, where there are many low-angle grain boundaries. Some substructures formed by low-angle grain boundaries can be seen in the pre-existing grains, as shown in Figure 8a. In addition, a number of necklace-like structures are also observed, which are reported to be facilitated by continuous dynamic recrystallization (CDRX) [39,40,41]. Figure 9 indicates the location misorientation (black lines) and cumulative misorientation (red line) along the AB and CD lines, respectively.
From Figure 9a, it can be found that the values of local misorientation along grain boundaries and in the grain interior are not beyond 5 degrees, while the cumulative misorientations are high, indicating a large increase in misorientation and the fact that adequate misorientations can promote subgrain rotation to form HAGBs. This indicates that CDRX mechanism exists at 200 °C/0.001 s−1. Research has shown that DRX is a thermal activation process, and the higher the temperature is, the more likely the occurrence of dislocation cross-slip, dislocation climbing, and grain boundary migration [42,43]. In Figure 8c, some sawtooth-like grain boundaries can be observed, providing potential sites for the nucleation of DRX and also causing grain boundary migration, which are the typical feature of discontinuous dynamic recrystallization (DDRX) [44]. From Figure 9b, the cumulative misorientations exceed 15°; the CDRX feature shown in Figure 8a also appears in Figure 8c, indicating that the compressed samples at 350 °C/0.001 s−1 are dominated by both CDRX and DDRX mechanisms. In Figure 8b,d, there are also a certain proportion of substructures, which are generated in the process of recovery. Additionallly, the proportion of substructures is higher than the proportion of recrystallization structures, indicating that the dynamic recovery of the alloy has a significant impact on softening. Askariani and Pishbin [45] studied the thermal deformation behavior of Mg-4Li-Al alloy and found that the addition of Li increased the stacking fault energy of magnesium alloy, and the CDRX based on DRV was the dominant restoration process. Li leads to the activation of the non-basal slip system, and the extended dislocation is easy to concentrate, promoting the cross slip of screw dislocation [46], which is why DRV plays an obvious role in this alloy.
Figure 10 shows inverse pole figure (IPF) maps of different textures, with different colors representing different orientations. The similar colors of different grains indicate small differences in orientation, and the compressed alloy is not fully recrystallized when deformed grains remain. However, the deformed grains become more homogeneous with the increase of temperature resulting from DRV reinforcement. The original grains are uniformly distributed in equiaxed shapes without preferred orientations, as shown in Figure 10a. It is obvious that the grains of the original texture have been elongated after compression at 200 °C and 0.001 s−1 (Figure 10b). Additionally, the deformed microstructure shows a preferential orientation with many fine grains around the elongated grains. These fine grains are the products of DRX. DRX grain orientation is random, while some lattice planes of deformed grains are parallel to the compression direction and some {-12-10} lattice planes are parallel to the compression direction. When the temperature rises to 350 °C, the {-12-10} lattice planes of most deformed grains are parallel to the compression direction (Figure 10c), while the recrystallized grains still maintain random orientation. During hot compression, grain orientation tends to be consistent, which is not conducive to further dislocation slip. However, random oriented dynamic recrystallized grains can coordinate deformation, contributing to the thermal processing [35].
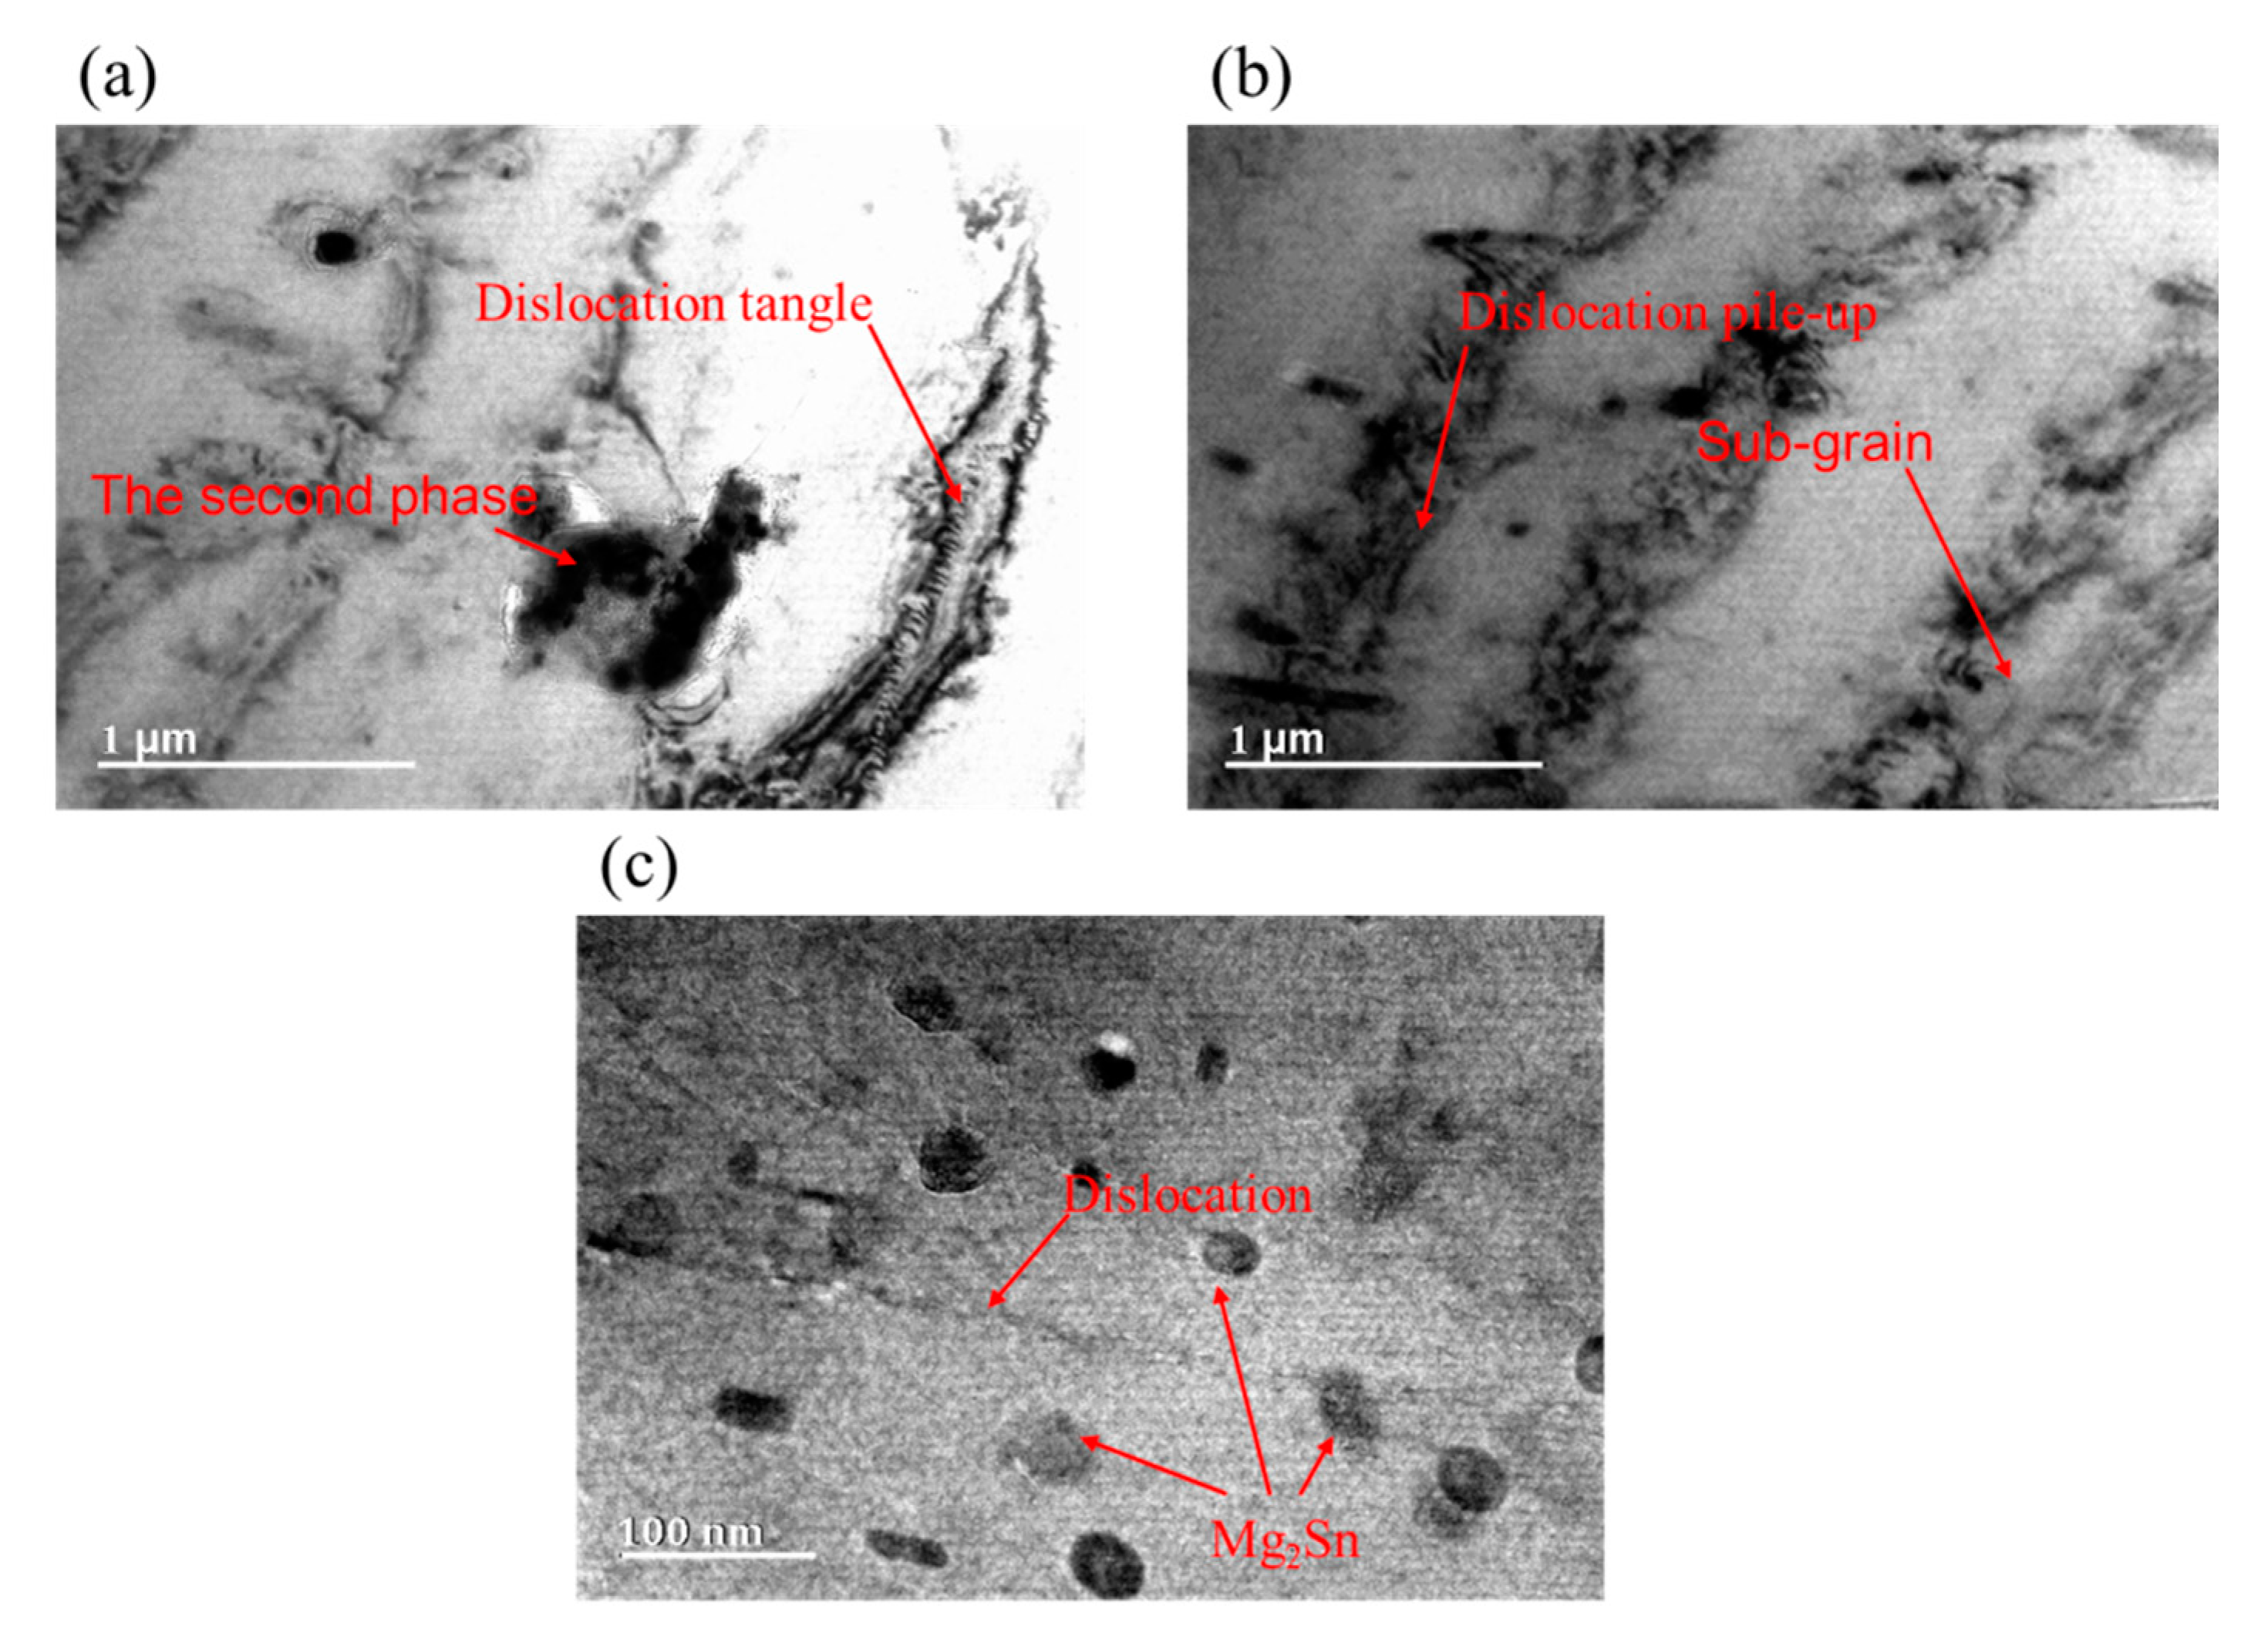
In order to reveal the nucleation mechanism of Mg-3Sn-2Al-1Zn-5Li alloy under high-efficiency zone thermal compression, TEM analysis was applied to hot-compressed samples at 350 °C/0.001 s−1, as shown in Figure 11.
The black band between grains shown in Figure 11 is composed of dislocation stacking pile-ups, sub-grains, and the second phase. Because of DRV, the dislocation merging and dissociation are accomplished through cross slipping, slipping, and so on. However, with the increase of strain, dislocations annihilate and recombine. Additionally, Li activates the non-basal slip system, softening the magnesium alloy and making the extended dislocation easy to concentrate. Thus, the cross slip of the screw dislocation occurs easily and dislocations easily accumulate at the grain boundaries [44]. With the increase of dislocation, sub-grains with high-angle grain boundaries gradually develop (Figure 11b). Theoretically, the sub-grains inside the grain and at the grain boundary will absorb the dislocation inside the deformed grains, and sub-grain rotation causes a large number of high-angle grain boundaries at the grain boundary to form CDRX grains [47]. It shows that the DRX mechanism is the dislocation absorption and gradual rotation of the subgrains, which is consistent with EBSD analysis. Meanwhile, Figure 11c illustrates the interaction of the dislocation and the dynamic precipitation-Mg2Sn particles, which causes the serration behaviors in the true strain-stress curves.
4. Conclusions
- (1)
- The stress-strain curves of the hot-compressed Mg-3Sn-2Al-1Zn-5Li alloy under thermal compression are featured by dynamic softening. As the strain increases, the work hardening effect is more significant. Then, the stress decreases slowly and tends to be flat after the peak value due to the dynamic recovery and dynamic recrystallization. Under the same strain rate, the true stress decreases with the increase of temperature. While under the same temperature, the peak stress of the alloy decreases with the decrease of strain rate.
- (2)
- The constitutive equation of the hot compression of Mg-3Sn-2Al-1Zn-5Li alloy has been established. The activation energy Q is 138.89414 kJ/mol as a result of the composite effect of Li and Sn, according to previous research. The stress index n is 6.25, indicating that the deformation mechanism of the alloy is the cross slip of dislocation. The constitutive equation is
- (3)
- The stability domains of the alloy occur mainly in the low strain rate zone, and the high-efficiency zone appears at 300–350 °C/0.001–0.006 s−1. Combined with EBSD maps, both CDRX and DDRX dominate at 350 °C/0.001 s−1 but the softening effect of DRV is more obvious. Instead, the instability domains mainly occur at higher strain rate, which is due to the potential of the formation of adiabatic shear zone under this condition so as to result in flow instability.
- (4)
- At 350 °C/0.001 s−1 of the high-efficiency zone, a large number of dislocation pile-ups lie at the grain boundaries and sub-grains are found in the dislocation enrichment area. This shows that using the CDRX mechanism leads to the dislocation absorption and gradual rotation of the subgrains.
Author Contributions
Y.G. and S.Y. conceived and designed the experiments; Y.X. and C.L. processed the software; Y.G. and C.L. conducted data analysis; Y.G. and Y.X. analyzed the formula; Y.G. wrote the paper; Y.G. and S.Y. edited the paper; S.Y. gave funding support for the paper.
Funding
This research received no external funding.
Conflicts of Interest
The authors declare no conflict of interest.
References
- Amano, H.; Hanada, K.; Hinoki, A.; Tainaka, T.; Shirota, C.; Sumida, W.; Yokota, K.; Murase, N.; Oshima, K.; Chiba, K.; et al. Biodegradable Surgical Staple Composed of Magnesium Alloy. Sci. Rep. 2019, 9, 1–8. [Google Scholar] [CrossRef] [PubMed]
- Carangelo, A.; Acquesta, A.; Monetta, T. In-vitro corrosion of AZ31 magnesium alloys by using a polydopamine coating. Bioact. Mater. 2019, 4, 71–78. [Google Scholar] [CrossRef] [PubMed]
- Cheng, Y.-L.; Qin, T.-W.; Wang, H.-M.; Zhang, Z. Comparison of corrosion behaviors of AZ31, AZ91, AM60 and ZK60 magnesium alloys. Trans. Nonferrous Met. Soc. China 2009, 19, 517–524. [Google Scholar] [CrossRef]
- Asgari, H.; Szpunar, J.A.; Odeshi, A.G. Texture evolution and dynamic mechanical behavior of cast AZ magnesium alloys under high strain rate compressive loading. Mater. Des. 2014, 61, 26–34. [Google Scholar] [CrossRef]
- Li, Q.Z. Mechanical properties and microscopic deformation mechanism of polycrystalline magnesium under high-strain-rate compressive loadings. Mater. Sci. Eng. A 2012, 540, 130–134. [Google Scholar] [CrossRef]
- Xia, X.S.; Chen, Q.; Li, J.P.; Shu, D.Y.; Hu, C.K.; Huang, S.H.; Zhao, Z.D. Characterization of hot deformation behavior of as-extruded Mg-Gd-Y-Zn-Zr alloy. J. Alloy Compd. 2014, 610, 203–211. [Google Scholar] [CrossRef]
- Yang, M.B.; Li, H.L.; Duan, C.Y.; Zhang, J. Effects of minor Ti addition on as-cast microstructure and mechanical properties of Mg-3Sn-2Sr (wt.%) magnesium alloy. J. Alloy Compd. 2013, 579, 92–99. [Google Scholar] [CrossRef]
- Mirzadeh, H. Constitutive analysis of Mg–Al–Zn magnesium alloys during hot deformation. Mech. Mater. 2014, 77, 80–85. [Google Scholar] [CrossRef]
- Chen, X.; Liao, Q.; Niu, Y.; Jia, Y.; Le, Q.; Ning, S.; Hu, C.; Hu, K.; Yu, F. Comparison study of hot deformation behavior and processing map of AZ80 magnesium alloy casted with and without ultrasonic vibration. J. Alloy Compd. 2019, 803, 585–596. [Google Scholar] [CrossRef]
- Jiang, M.G.; Yan, H.; Gao, L.; Chen, R.S. Microstructural evolution of Mg-7Al-2Sn Mg alloy during multi-directional impact forging. J. Magnes. Alloys 2015, 3, 180–187. [Google Scholar] [CrossRef]
- Zhu, S.Q.; Yan, H.G.; Chen, J.H.; Wu, Y.Z.; Du, Y.G.; Liao, X.Z. Fabrication of Mg-Al-Zn-Mn alloy sheets with homogeneous fine-grained structures using high strain-rate rolling in a wide temperature range. Mater. Sci. Eng. A 2013, 559, 765–772. [Google Scholar] [CrossRef]
- Tsao, L.C.; Chen, C.H.; Wu, R.W.; Chang, S.Y.; Chen, R.S. Plastic flow behavior, microstructure, and corrosion behavior of AZ61 Mg alloy during hot compression deformation. J. Manuf. Process. 2015, 18, 167–174. [Google Scholar] [CrossRef]
- Estrin, Y.; Vinogradov, A. Extreme grain refinement by severe plastic deformation: A wealth of challenging science. Acta Mater. 2013, 61, 782–817. [Google Scholar] [CrossRef]
- Qiu, W.; Liu, Z.; Yu, R.; Chen, J.; Ren, Y.; He, J.; Li, W.; Li, C. Utilization of VN particles for grain refinement and mechanical properties of AZ31 magnesium alloy. J. Alloy Compd. 2019, 781, 1150–1158. [Google Scholar] [CrossRef]
- Liu, X.; Yin, S.-Q.; Zhang, Z.-Q.; Le, Q.-C.; Xue, J.-L. Effect of limestone ores on grain refinement of as-cast commercial AZ31 magnesium alloys. Trans. Nonferrous Met. Soc. China 2018, 28, 1103–1113. [Google Scholar] [CrossRef]
- Hao, M.; Cheng, W.; Wang, L.; Mostaed, E.; Bian, L.; Wang, H.; Niu, X. Texture evolution in Mg-8Sn-1Zn-1Al alloy during hot compression via competition between twinning and dynamic precipitation. Mater. Sci. Eng. A 2019, 748, 418–427. [Google Scholar] [CrossRef]
- Sun, Y.; Wang, R.; Ren, J.; Peng, C.; Feng, Y. Hot deformation behavior of Mg-8Li-3Al-2Zn-0.2Zr alloy based on constitutive analysis, dynamic recrystallization kinetics, and processing map. Mech. Mater. 2019, 131, 158–168. [Google Scholar] [CrossRef]
- Jiang, L.; Huang, W.; Zhang, D.; Guo, F.; Xue, H.; Xu, J.; Pan, F. Effect of Sn on the microstructure evolution of AZ80 magnesium alloy during hot compression. J. Alloy Compd. 2017, 727, 205–214. [Google Scholar] [CrossRef]
- Zou, J.; Chen, J.; Yan, H.; Xia, W.; Su, B.; Lei, Y.; Wu, Q. Effects of Sn addition on dynamic recrystallization of Mg-5Zn-1Mn alloy during high strain rate deformation. Mater. Sci. Eng. A 2018, 735, 49–60. [Google Scholar] [CrossRef]
- Bajargan, G.; Singh, G.; Ramamurty, U. Effect of Li addition on the plastic deformation behaviour of AZ31 magnesium alloy. Mater. Sci. Eng. A 2016, 662, 492–505. [Google Scholar] [CrossRef]
- Liu, G.; Xie, W.; Hadadzadeh, A.; Wei, G.; Ma, Z.; Liu, J.; Yang, Y.; Xie, W.; Peng, X.; Wells, M. Hot deformation behavior and processing map of a superlight dual-phase Mg–Li alloy. J. Alloy Compd. 2018, 766, 460–469. [Google Scholar] [CrossRef]
- Sakai, T.; Jonas, J.J. Overview no. 35 Dynamic recrystallization: Mechanical and microstructural considerations. Acta Metall. 1984, 32, 189–209. [Google Scholar] [CrossRef]
- Sarebanzadeh, M.; Mahmudi, R.; Roumina, R. Constitutive analysis and processing map of an extruded Mg–3Gd–1Zn alloy under hot shear deformation. Mater. Sci. Eng. A 2015, 637, 155–161. [Google Scholar] [CrossRef]
- Wei, G.; Peng, X.; Hadadzadeh, A.; Mahmoodkhani, Y.; Xie, W.; Yang, Y.; Wells, M.A. Constitutive modeling of Mg–9Li–3Al–2Sr–2Y at elevated temperatures. Mech. Mater. 2015, 89, 241–253. [Google Scholar] [CrossRef]
- Myshlyaev, M.M.; McQueen, H.J.; Mwembela, A.; Konopleva, E. Twinning, dynamic recovery and recrystallization in hot worked Mg–Al–Zn alloy. Mater. Sci. Eng. A 2002, 337, 121–133. [Google Scholar] [CrossRef]
- Wang, L.; Huang, G.; Fan, Y.; Lu, Z.; Pan, F. Hot deformation kinetics of magnesium alloy AZ31. J. Wuhan Univ. Technol.-Mater. Sci. Ed. 2006, 21, 15–17. [Google Scholar]
- Zhou, Y.; Chen, Z.; Ji, J.; Sun, Z. Optimization of Hot Deformation Parameters and Constitutive Analysis for As-Cast Mg-5Li-3Zn-0.3Y Alloy Using Processing Maps. J. Mater. Eng. Perform. 2018, 27, 4606–4615. [Google Scholar] [CrossRef]
- Cheng, W.-L.; Que, Z.-P.; Zhang, J.-S.; Xu, C.-X.; Liang, W.; You, B.S.; Park, S.S. Compressive deformation behavior of an indirect-extruded Mg-8Sn-1Al-1Zn alloy. Int. J. Miner. Metall. Mater. 2013, 20, 49–56. [Google Scholar] [CrossRef]
- Prasad, Y.V.R.K.; Rao, K.P.; Hort, N.; Kainer, K.U. Optimum parameters and rate-controlling mechanisms for hot working of extruded Mg–3Sn–1Ca alloy. Mater. Sci. Eng. A 2009, 502, 25–31. [Google Scholar] [CrossRef]
- Shalbafi, M.; Roumina, R.; Mahmudi, R. Hot deformation of the extruded Mg–10Li–1Zn alloy: Constitutive analysis and processing maps. J. Alloy Compd. 2017, 696, 1269–1277. [Google Scholar] [CrossRef]
- Mahmudi, R.; Shalbafi, M.; Karami, M.; Geranmayeh, A.R. Effect of Li content on the indentation creep characteristics of cast Mg–Li–Zn alloys. Mater. Des. 2015, 75, 184–190. [Google Scholar] [CrossRef]
- Cheng, W.; Bai, Y.; Ma, S.; Wang, L.; Wang, H.; Yu, H. Hot deformation behavior and workability characteristic of a fine-grained Mg‒8Sn‒2Zn‒2Al alloy with processing map. J. Mater. Sci. Technol. 2019, 35, 1198–1209. [Google Scholar] [CrossRef]
- Prasad, Y.V.R.K.; Seshacharyulu, T. Modelling of hot deformation for microstructural control. Int. Mater. Rev. 1998, 43, 243–258. [Google Scholar] [CrossRef]
- Srinivasan, N.; Prasad, Y.V.R.K.; Rama Rao, P. Hot deformation behaviour of Mg–3Al alloy—A study using processing map. Mater. Sci. Eng. A 2008, 476, 146–156. [Google Scholar] [CrossRef]
- Zhou, Y.; Chen, Z.; Ji, J.; Sun, Z. Effects of second phases on deformation behavior and dynamic recrystallization of as-cast Mg-4.3Li-4.1Zn-1.4Y alloy during hot compression. J. Alloy Compd. 2019, 770, 540–548. [Google Scholar] [CrossRef]
- Zhu, S.-Z.; Luo, T.-J.; Zhang, T.-A.; Yang, Y.-S. Hot deformation behavior and processing maps of as-cast Mg–8Zn–1Al–0.5Cu–0.5Mn alloy. Trans. Nonferrous Met. Soc. China 2015, 25, 3232–3239. [Google Scholar] [CrossRef]
- Ding, X.; Zhao, F.; Shuang, Y.; Ma, L.; Chu, Z.; Zhao, C. Characterization of hot deformation behavior of as-extruded AZ31 alloy through kinetic analysis and processing maps. J. Mater. Process. Technol. 2020, 276, 116325. [Google Scholar] [CrossRef]
- Jingfeng, W.; Feizhou, X.; Shijie, L.; Song, H.; Fusheng, P. Hot Deformation Behavior and Processing Maps of As-Homogenized Mg-Gd-Y-Zn-Mn Alloy. Rare Metal Mat. Eng. 2018, 47, 1700–1707. [Google Scholar] [CrossRef]
- Zhang, H.; Zhang, K.; Jiang, S.; Zhou, H.; Zhao, C.; Yang, X. Dynamic recrystallization behavior of a γ′-hardened nickel-based superalloy during hot deformation. J. Alloy Compd. 2015, 623, 374–385. [Google Scholar] [CrossRef]
- Zang, Q.; Yu, H.; Lee, Y.-S.; Kim, M.-S.; Kim, H.-W. Hot deformation behavior and microstructure evolution of annealed Al-7.9Zn-2.7Mg-2.0Cu (wt%) alloy. J. Alloy Compd. 2018, 763, 25–33. [Google Scholar] [CrossRef]
- Xie, B.; Yu, H.; Sheng, T.; Xiong, Y.; Ning, Y.; Fu, M.W. DDRX and CDRX of an as-cast nickel-based superalloy during hot compression at γ′ sub-/super-solvus temperatures. J. Alloy Compd. 2019, 803, 16–29. [Google Scholar] [CrossRef]
- Wu, H.-Y.; Wu, C.-T.; Yang, J.-C.; Lin, M.-J. Hot workability analysis of AZ61 Mg alloys with processing maps. Mater. Sci. Eng. A 2014, 607, 261–268. [Google Scholar] [CrossRef]
- Fatemi-Varzaneh, S.M.; Zarei-Hanzaki, A.; Beladi, H. Dynamic recrystallization in AZ31 magnesium allo. Mater. Sci. Eng. A 2007, 456, 52–57. [Google Scholar] [CrossRef]
- Jia, J.; Yang, Y.; Xu, Y.; Xu, B.; Luo, J.; Zhang, K. Microstructure evolution and dynamic recrystallization behavior of a powder metallurgy Ti-22Al-25Nb alloy during hot compression. Mater. Charact. 2017, 123, 198–206. [Google Scholar] [CrossRef]
- Askariani, S.A.; Hasan Pishbin, S.M. Hot deformation behavior of Mg-4Li-1Al alloy via hot compression tests. J. Alloy Compd. 2016, 688, 1058–1065. [Google Scholar] [CrossRef]
- Zhang, J.; Dou, Y.; Liu, G.; Guo, Z. First-principles study of stacking fault energies in Mg-based binary alloys. Comput. Mater. Sci. 2013, 79, 564–569. [Google Scholar] [CrossRef]
- Chaudry, U.M.; Kim, T.H.; Kim, Y.S.; Hamad, K.; Ko, Y.G.; Kim, J.-G. Dynamic recrystallization behavior of AZ31-0.5Ca magnesium alloy during warm rollin. Mater. Sci. Eng. A 2019, 762, 138085. [Google Scholar] [CrossRef]
Figure 1.
The microstructure of the as-homogenized Mg-3Sn-2Al-1Zn-5Li alloy. (a) OM image, (b) XRD pattern, (c) SEM micrograph and EDS result, and (d) grain size distribution.
Figure 1.
The microstructure of the as-homogenized Mg-3Sn-2Al-1Zn-5Li alloy. (a) OM image, (b) XRD pattern, (c) SEM micrograph and EDS result, and (d) grain size distribution.

Figure 2.
True stress-strain curves at different deformation temperatures and different strain rates: (a) 0.001 s−1; (b) 0.01 s−1; (c) 0.1 s−1; and (d) 1 s−1.
Figure 2.
True stress-strain curves at different deformation temperatures and different strain rates: (a) 0.001 s−1; (b) 0.01 s−1; (c) 0.1 s−1; and (d) 1 s−1.
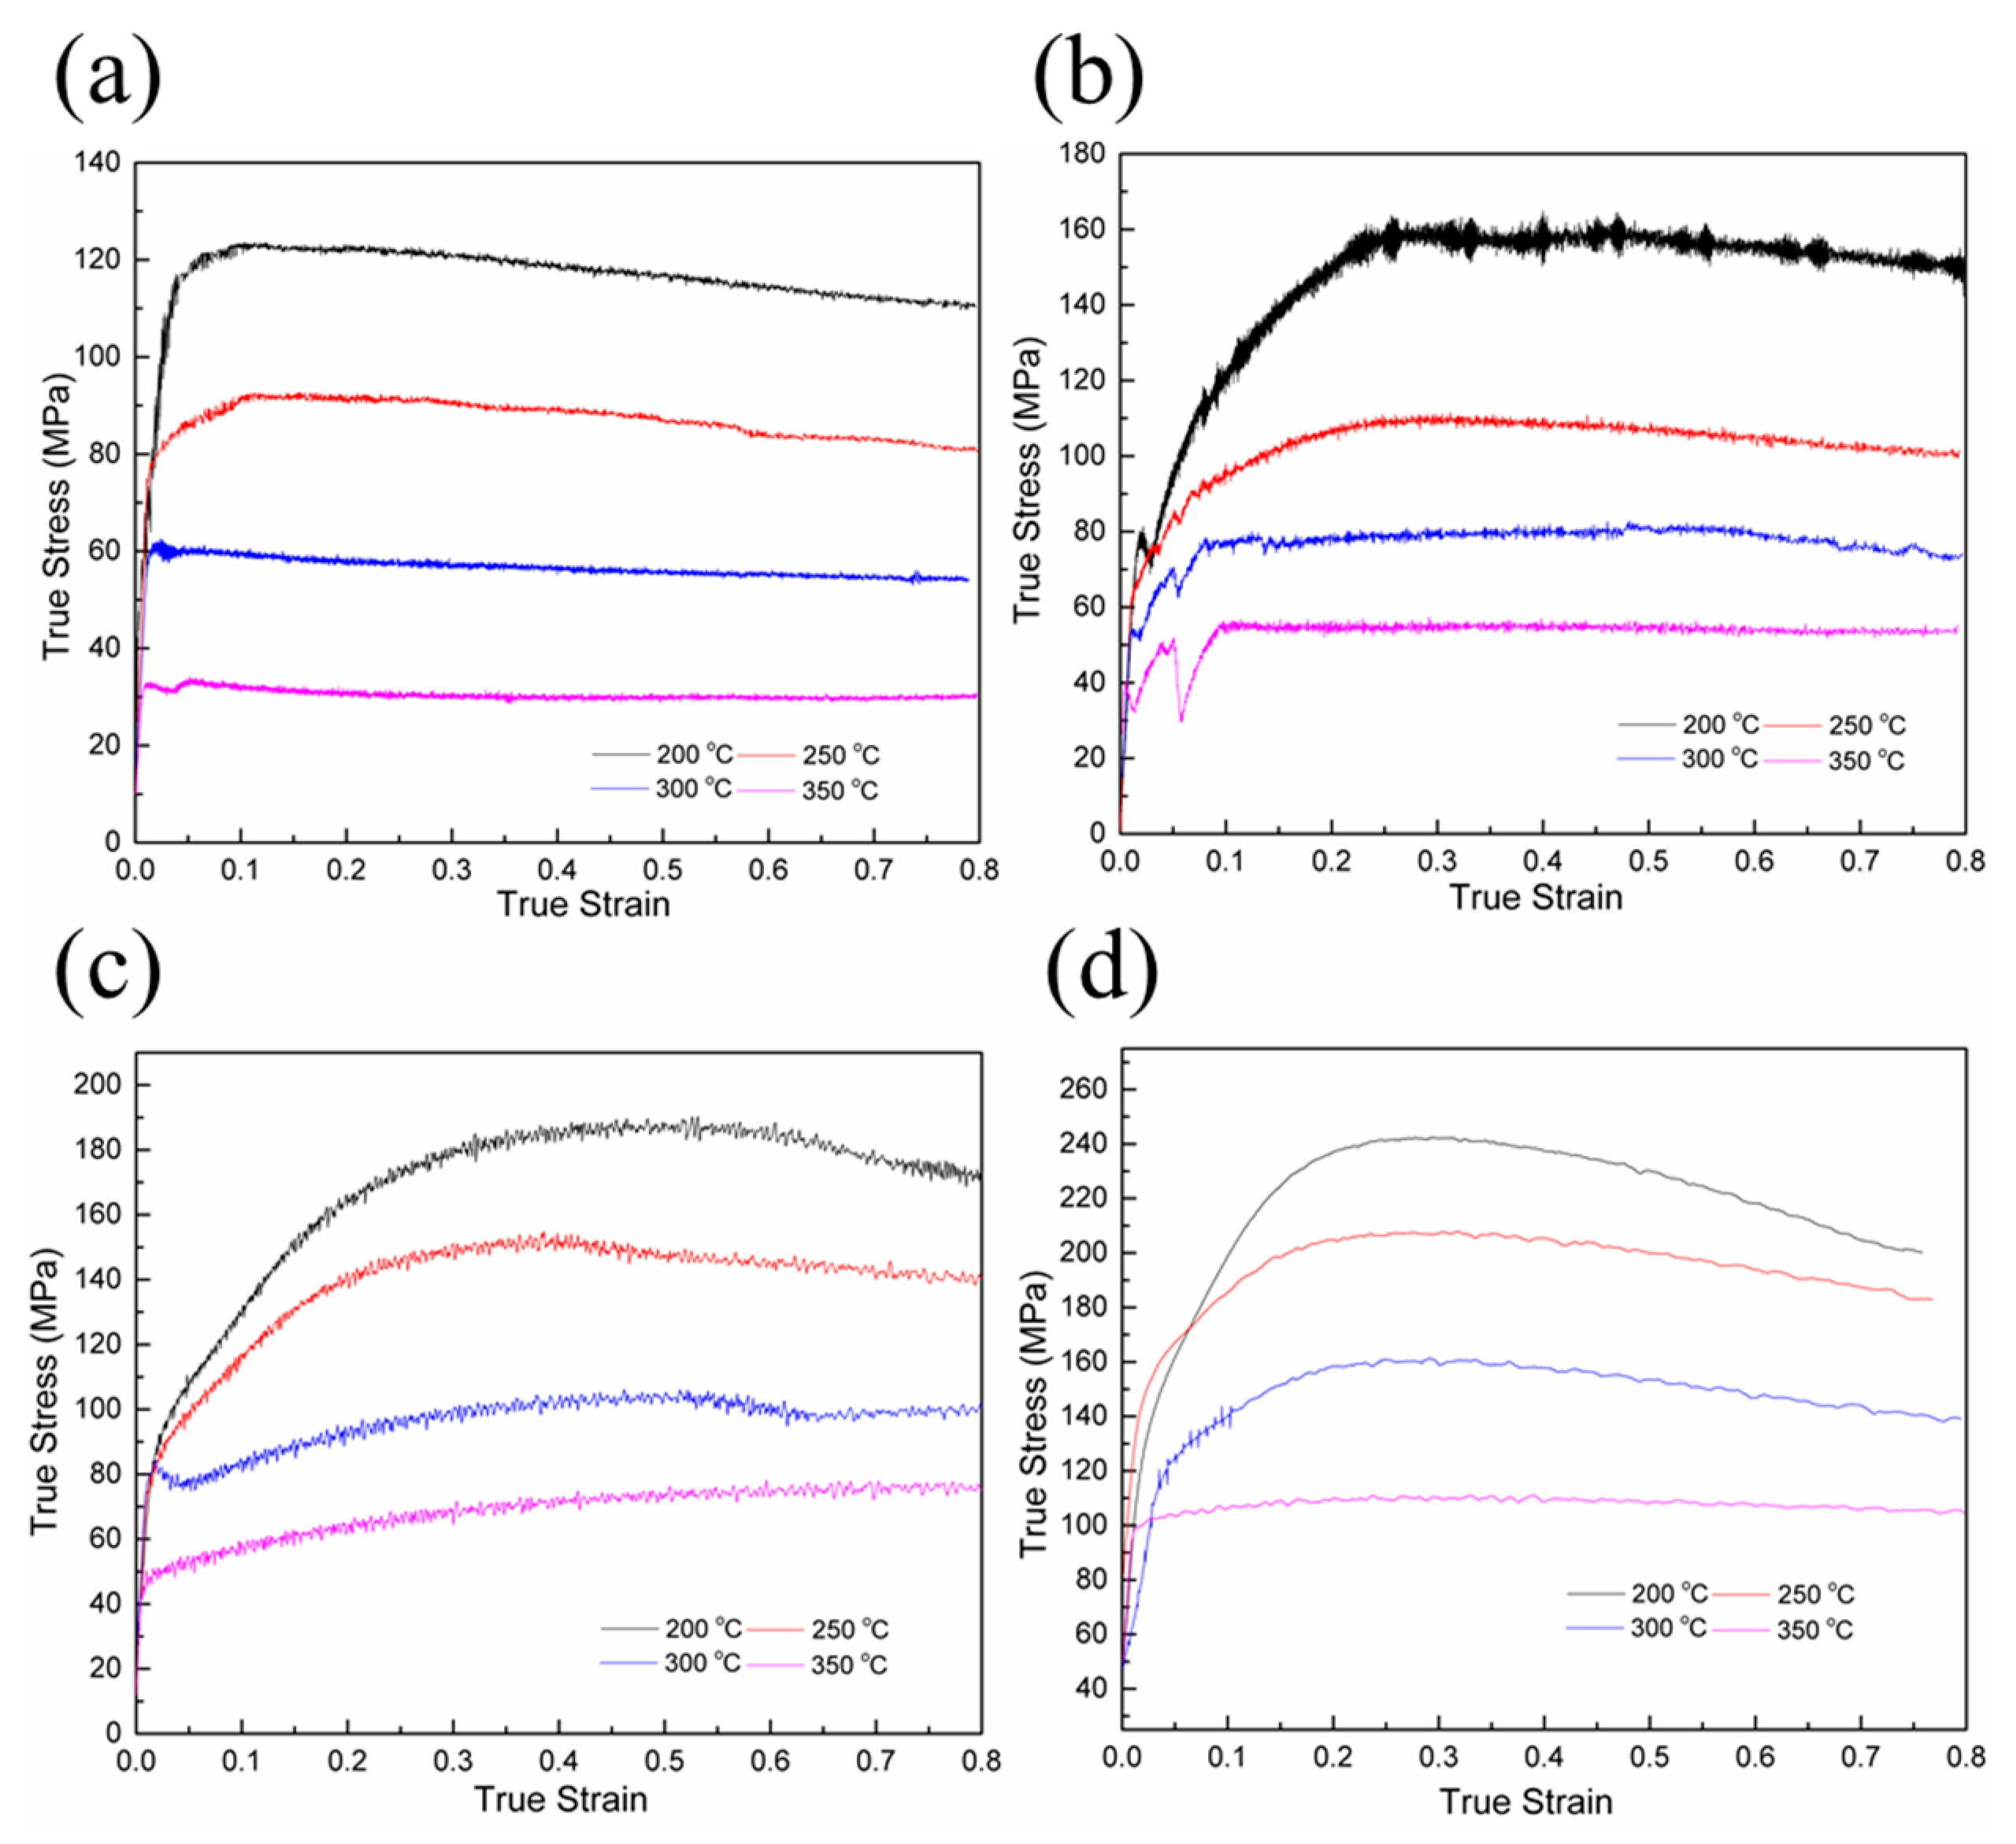
Figure 3.
Relationship between peak stress and strain rate: (a) and (b) .

Figure 4.
Relationship between peak stress and strain rate and deformation temperature: (a) and (b) .
Figure 4.
Relationship between peak stress and strain rate and deformation temperature: (a) and (b) .

Figure 5.
relationship.

Figure 6.
Processing map of Mg-3Sn-2Al-1Zn-5Li alloy at the strain of (a) 0.6 and (b) 0.8.

Figure 7.
Microstructures of alloy at different deformation temperatures and strain rates: (a) 300 °C/0.001 s−1, (b) 350 °C/0.001 s−1, (c) 300 °C/0.1 s−1, (d) 200 °C/1 s−1, (e) 250 °C/0.1 s−1, and (f) 350 °C/0.1 s−1.
Figure 7.
Microstructures of alloy at different deformation temperatures and strain rates: (a) 300 °C/0.001 s−1, (b) 350 °C/0.001 s−1, (c) 300 °C/0.1 s−1, (d) 200 °C/1 s−1, (e) 250 °C/0.1 s−1, and (f) 350 °C/0.1 s−1.

Figure 8.
Grain boundary diagrams of Mg-3Sn-2Al-1Zn-5Li alloy and microstructure proportion of three kinds of microstructures: (a,b) 200 °C/0.001 s−1 and (c,d) 350 °C/0.001 s−1 (black lines for high-angle grain boundaries and green lines for low-angle grain boundaries).
Figure 8.
Grain boundary diagrams of Mg-3Sn-2Al-1Zn-5Li alloy and microstructure proportion of three kinds of microstructures: (a,b) 200 °C/0.001 s−1 and (c,d) 350 °C/0.001 s−1 (black lines for high-angle grain boundaries and green lines for low-angle grain boundaries).
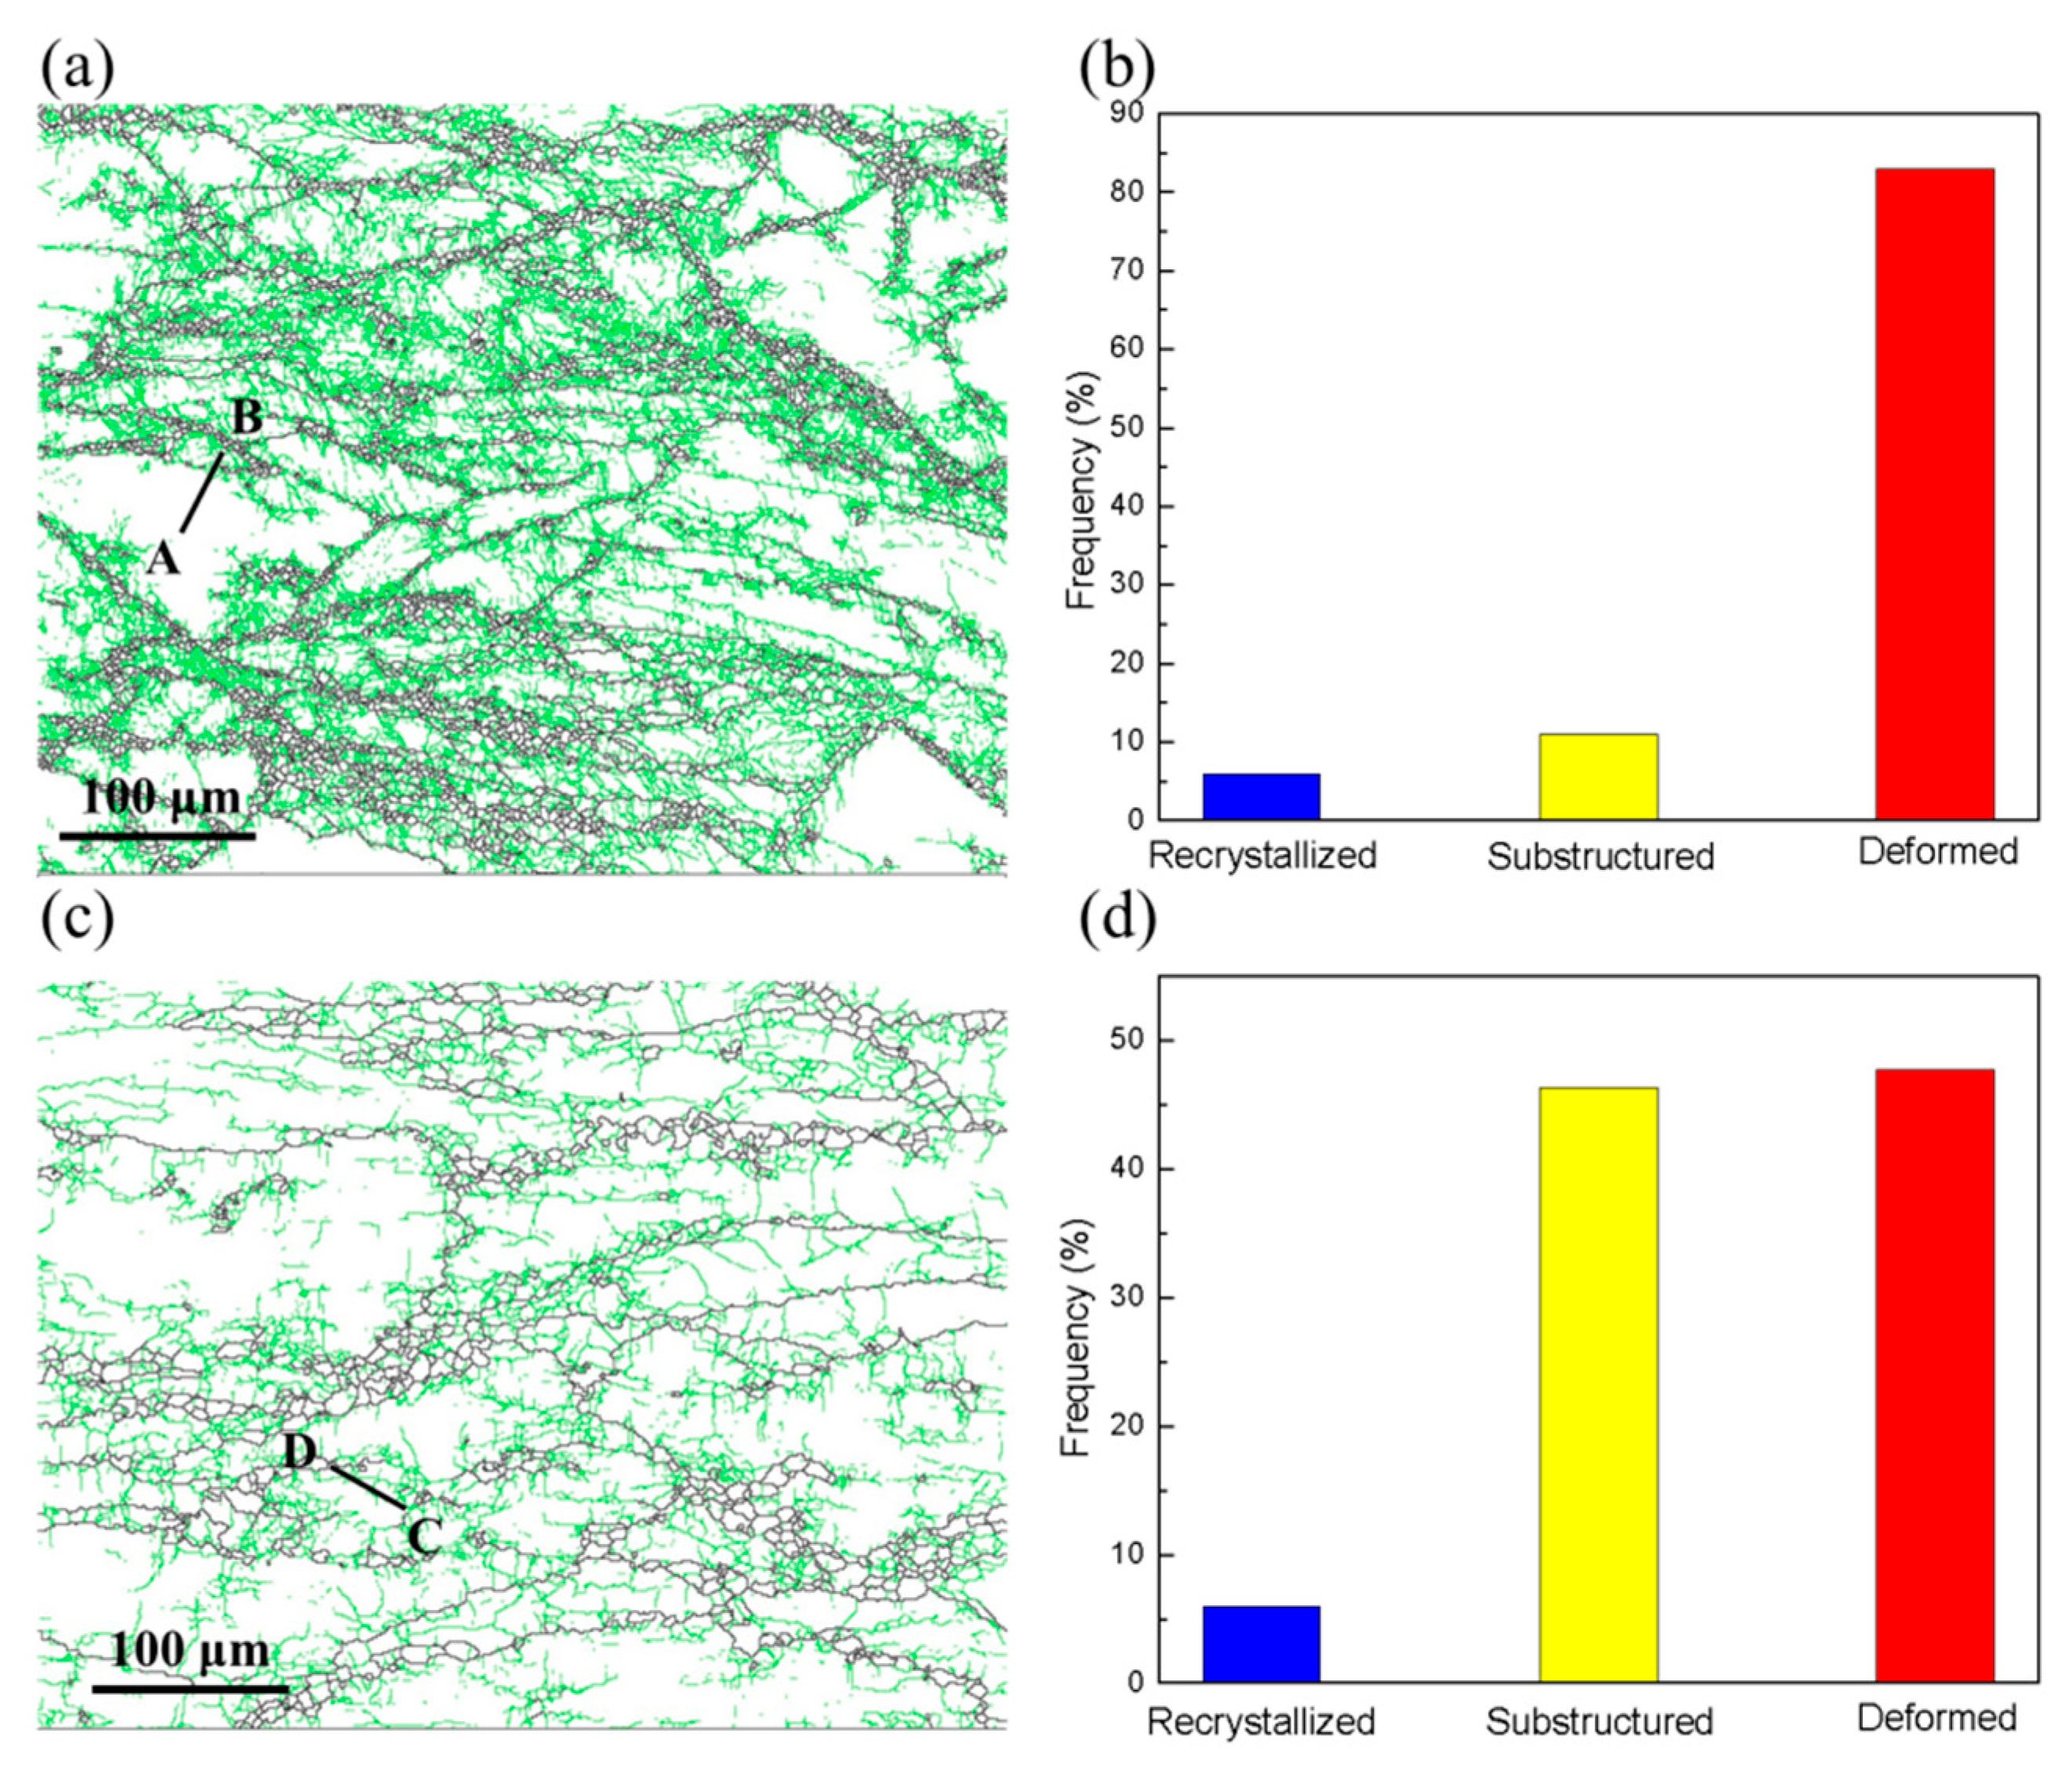
Figure 9.
Misorientations measured along the lines of (a) AB and (b) CD marked in Figure 8.
Figure 9.
Misorientations measured along the lines of (a) AB and (b) CD marked in Figure 8.

Figure 10.
Mg-3Sn-2Al-1Zn-5Li alloy inverse pole figure (IPF) maps of (a) initial organization and organization deformed at (b) 200 °C/0.001 s−1 and (c) 350 °C/0.001 s−1.
Figure 10.
Mg-3Sn-2Al-1Zn-5Li alloy inverse pole figure (IPF) maps of (a) initial organization and organization deformed at (b) 200 °C/0.001 s−1 and (c) 350 °C/0.001 s−1.

Figure 11.
Transmission Eletron Microscope (TEM) images of the sample at 350 °C/0.001 s−1: (a) dislocation tangle; (b) dislocation pile-up and subgrain; (c) the interaction effect between dislocation and Mg2Sn particles.
Figure 11.
Transmission Eletron Microscope (TEM) images of the sample at 350 °C/0.001 s−1: (a) dislocation tangle; (b) dislocation pile-up and subgrain; (c) the interaction effect between dislocation and Mg2Sn particles.
© 2019 by the authors. Licensee MDPI, Basel, Switzerland. This article is an open access article distributed under the terms and conditions of the Creative Commons Attribution (CC BY) license (http://creativecommons.org/licenses/by/4.0/).
Share and Cite
MDPI and ACS Style
Guo, Y.; Xuanyuan, Y.; Lia, C.; Yang, S. Characterization of Hot Deformation Behavior and Processing Maps of Mg-3Sn-2Al-1Zn-5Li Magnesium Alloy. Metals 2019, 9, 1262. https://doi.org/10.3390/met9121262
AMA Style
Guo Y, Xuanyuan Y, Lia C, Yang S. Characterization of Hot Deformation Behavior and Processing Maps of Mg-3Sn-2Al-1Zn-5Li Magnesium Alloy. Metals. 2019; 9(12):1262. https://doi.org/10.3390/met9121262
Chicago/Turabian StyleGuo, Yuhang, Yaodong Xuanyuan, Chunnan Lia, and Sen Yang. 2019. "Characterization of Hot Deformation Behavior and Processing Maps of Mg-3Sn-2Al-1Zn-5Li Magnesium Alloy" Metals 9, no. 12: 1262. https://doi.org/10.3390/met9121262
Note that from the first issue of 2016, this journal uses article numbers instead of page numbers. See further details here.