Article

Investigation of NbC/TiC Heterogeneous Nucleation Interface by First-Principles and Experimental Methods

1
School of Materials Science and Engineering, Hanshan Normal University, Chaozhou 521041, China
2
Key Laboratory for Ferrous Metallurgy and Resources Utilization of Ministry of Education, Wuhan University of Science and Technology, Wuhan 430081, China
*
Author to whom correspondence should be addressed.
Metals 2019, 9(12), 1265; https://doi.org/10.3390/met9121265
Submission received: 13 October 2019 / Revised: 13 November 2019 / Accepted: 19 November 2019 / Published: 27 November 2019

Abstract

:
The mechanism of the heterogeneous nucleation of NbC on TiC precipitates was investigated systematically in this paper. The interfacial properties of NbC (100)/TiC (100), NbC (110)/TiC (110), and NbC (111)/TiC (111) interfaces were studied by first-principles calculations. The results showed that the NbC (111)/TiC (111) interface with the Nb–C bond is the most stable one, and the stability of interfaces with the C–Ti, Nb–Ti, and C–C bonds decreases in turn. The interface of the Nb/C-terminated and Third Layer (TL) stacking sequence (NCTL) has the largest adhesion work (10.15 J/m2) and the smallest equilibrium interface spacing (1.290 Å). In the range of low niobium (Nb) chemical potential and high carbon (C) chemical potential, the nucleation of NbC on TiC precipitates takes precedence over the epitaxy growth in the coherent relationship of [ 1 1 ¯ 0 ] ( 111 ) NbC / / [ 1 1 ¯ 0 ] ( 111 ) TiC , while the nucleation of NbC on TiC precipitates is prior to the epitaxy growth in the coherent relationship of [ 001 ] ( 100 ) NbC / / [ 001 ] ( 100 ) TiC in the range of high niobium (Nb) chemical potential and low carbon (C) chemical potential. Besides, the characteristics of heterogeneous nucleation precipitates in Nb–Ti microalloyed steels were analyzed by transmission electron microscopy (TEM). The orientation relationship between the (Ti, Nb) C and (Nb, Ti) C precipitates follows [ 1 1 ¯ 0 ] ( 111 ) ( Nb ,   TiC ) / / [ 1 1 ¯ 0 ] ( 111 ) ( Ti ,   Nb ) C , which is consistent with the calculated result.

Graphical Abstract

1. Introduction

Precipitation strengthening, microstructural control, and grain refinement are usually used to obtain high-strength low-alloy steels (HSLASs) with excellent strength and toughness [1,2]. Microalloying elements (such as Ti and Nb) in steel can form carbides, nitrides, and carbonitrides with interstitial atoms C and N. The second-phase particles precipitated from austenite are beneficial to grain refinement, while the particles precipitated from ferrite can improve dispersion strengthening [3,4]. For example, adding Ti to Nb-microalloyed steel can obviously improve the toughness of the welding heat-affected zone. The reason is that Ti-rich carbonitrides formed at high temperatures can inhibit the growth of austenite grains, and the Nb (C, N) formed at low temperatures will suppress the recovery recrystallization process, which is beneficial to refine the austenite and ferrite. In addition, the fine precipitates can achieve a certain degree of dispersion strengthening [5].
The investigation of the structure and precipitation of composite carbides plays an important role in the design of composite microalloyed steels. Many scholars have devoted themselves to the research of the morphology, size, and structure of (Ti, Nb) C or (Ti, Nb) (C, N) in steel through experimental methods. Significant evidence shows that the precipitated phase has a complex structure [6,7]. Escobar et al. [6] found that (Ti, Nb) C contains obvious Ti and Nb concentration gradients. Chen et al. [8] found that there were about 70 nm thick Nb-rich precipitates around the square Ti-rich precipitates by energy-dispersive X-ray (EDX) analysis. In addition, Craven et al. [9] reported that the precipitated Ti-containing particles in Nb–Ti microalloyed steel could be the core from the heterogeneous nucleation of Nb-rich carbides and formed a large number of (Ti, Nb) (C, N) composite precipitates less than 10 nm. However, different views have been also held on the role of precipitates (Ti, Nb) (C, N) in steel. Wang and Li [10,11] suggested that when carbides precipitate in the form of (Ti, Nb) C, the precipitation will consume Nb at high temperatures. The reduction in Nb can be used for grain refinement or precipitation strengthening at low temperatures, which will further decrease the strength and toughness of steel. Chen and Ma [12,13] believe that the precipitated (Nb, Ti) C or (Ti, Nb) (C, N) composite carbides after adding Ti to Nb-microalloyed steel can not only refine the grain size, but also improve the yield strength and toughness of the steel. Therefore, the interaction between Ti, Nb, and the interstitial atom C in steel is quite complicated; the structure and precipitation mechanism of (Nb, Ti) C precipitates need to be further studied. However, it is difficult to obtain microscopic information of (Nb, Ti) C heterogeneous nucleation between NbC and TiC precipitates by previous experimental methods.
One available and effective method of studying an interface is first-principles calculation based on density functional theory (DFT), which has been extensively employed to investigate the micro-characterization of surfaces and interfaces at the atomic scale [14,15]. For example, a previous report revealed the atomic-scale characteristics of the YAlO3/NbC interface by DFT calculation and proved the occurrence of NbC growth encircling YAlO3 by their experimental method [16]. Additionally, the first-principles calculation was used to investigate the electronic and atomic properties of the Al/NbB2 interface, and the heterogeneous nucleation mechanism of α-Al grains on NbB2 particles was determined [17]. Similarly, the DFT method has also been employed to study the properties of TiB2/TiC [18], TiC/Fe3Cr4C3 [19], LaAlO3/γ-Fe [20], and TiC/α-Fe [21] heterogeneous nucleation interfaces, and the electronic structure and bonding characteristics of those interfaces were uncovered. Therefore, the heterogeneous nucleation behaviors of NbC on pre-existing TiC particles in steel can also be revealed by the density functional theory method.
According to Bramfitt’s mismatch nucleation theory [22], the lattice mismatch of the NbC/TiC interface on (100), (110), and (111) habitual surfaces is less than 6.0%. Thus, NbC in steel can effectively nucleate on the pre-precipitated TiC particles. Therefore, the stable, structural, and electronic properties of NbC/TiC interfaces with the three coherent relationships were calculated by the DFT method in this paper. Besides, the heterogeneous nucleation precipitates in Nb–Ti microalloyed steel were found by the isothermal precipitation method, and the nucleation morphology and characteristics of the composite precipitates were characterized by TEM. Based on the calculation and experimental results, the heterogeneous nucleation mechanism of NbC on TiC precipitates was revealed.

2. Calculation Method and Experimental Details

2.1. Calculation Methods and Details

In this work, the Cambridge Serial Total Energy Package (CASTEP) code in Materials Studio 7.0 (BIOVIA, San Diego, CA, USA), which is based on DFT and the plane-wave pseudopotential method, was used to perform all the calculations [23,24], and the lattice parameters of NbC and TiC measured by experiments were used as initial values. First, the (100), (110), and (111) surfaces of different terminations were cut from bulk NbC and TiC. Then, the interface models of different terminations were built using these surfaces, and a vacuum layer with a thickness of 15 Å was added in the vertical direction of the surface and interface models to eliminate the interaction between the upper and lower surfaces. Then, the structures and properties of these models were fully relaxed and calculated.
The Kohn–Sham equation was solved by the self-consistent field (SCF) method. The interaction between the nucleus and electron was described by the ultrasoft pseudopotential [25]. The valence electrons of each atom were Nb 4d35s2, Ti 3d24s2, and C 2s22p2, respectively. Moreover, the exchange-correlation function of electrons was described by the GGA-PBE functional [26]. All calculations in this paper have been carried out in reciprocal space. The first Brillouin integral was based on the special K-point method formed by the Monkhorst–Pack scheme [27]. For bulk NbC and TiC, the mesh of the k-point was 8 × 8 × 8. For all surface and interface models, the mesh of the k-point was 10 × 10 × 1. After a series of convergence tests, the plane-wave cutoff energy was determined to be 400 eV. The convergence conditions are as follows: The difference between the last two cyclic energies is less than 1 × 10⁻⁵ eV/atom, the force acting on each atom is not more than 0.03 eV/Å, and the internal stress is not more than 0.03 GPa.

2.2. Experimental Methods

Nb–Ti microalloyed steel was chosen as the research object in the experiment. Its composition is Fe-0.16C-0.2Si-1.53Mn-0.083Nb-0.049Ti (wt. %). During the experiment, the steel was heated to 1250 °C for 10 min to ensure all the carbonitrides in the steel were fully dissolved, and then cooled down to 1000 °C at the rate of 20 °C/s and kept for 30 min, and finally quenched by water. In order to increase the probability of heterogeneous nucleation precipitates, no thermal deformation was carried out. The main purpose of this method was to avoid the precipitation of particles on high-density dislocations after deformation. After the experiment, the morphology of the precipitated phase was observed by TecnaiFF20 field emission high-resolution transmission electron microscopy (JEM-ARM300F, JEOL, Tokyo, Japan), and the composition of precipitated phase particles was determined by the accompanying energy-dispersive spectrometer.

3. Results and Discussion

3.1. Surface Properties of NbC and TiC

Before investigating the properties of the NbC/TiC interface, it is necessary to determine the appropriate atomic layers of NbC and TiC slab models, which can guarantee that the atoms in the depth of the surface exhibit bulk atomic characteristics. For the non-polar surface, it can be judged by analyzing the variation trend of surface energy with the number of atomic layers. In addition, the free surface atoms at both ends of the surface need to be the same to weaken the dipole effect. For the (100) and (110) surfaces of NbC and TiC, their surface energies can be obtained by the following equation [28,29,30]:
γ s     [ E slab ( n )     n E bulk ] / ( 2 A ) ,
where E slab ( n ) denotes the total energy of the surface structure and n is the number of atoms (or molecular formulas) in the supercell. E bulk represents the total energy of the molecular formula in the bulk material, which is the value of the total energy of cubic TiC (or NbC) divided by the molecular formula, and A denotes the corresponding surface area. Table 1 shows the variation tendency of the calculated surface energies of NbC (100), NbC (110), TiC (100), and TiC (110) with atomic layers. The surface energy tends to converge with increasing atomic layers, and it tends to be constant when the number of atomic layers is larger than nine. As shown in Table 1, the surface energies of NbC (100) and NbC (110) are 1.48 and 2.97 J/m2, respectively, while those of TiC (100) and TiC (110) are 1.76 and 3.51 J/m2, respectively. Obviously, the surface energies of NbC (100) and NbC (110) are less than those of TiC (100) and TiC (110), respectively, which means the NbC (100) and NbC (110) have better stability. Moreover, the stability of the (100) surface is better than that of the (110) surface for both NbC and TiC.
For the polar NbC (111) and TiC (111), each of their surfaces has two different terminations, namely, a Nb- or C-terminated NbC (111) surface and Ti- or C-terminated TiC (111) surface. Consequently, the surface energies of NbC (111) and TiC (111) are related to the chemical potential of each atom in their bulk phase. Previous calculations [14,15] show that the atoms in the depth of the slab present bulk characteristics when the atomic-layer number of NbC (111) and TiC (111) surface structures reaches 13. Therefore, NbC (111) and TiC (111) with thicknesses larger than thirteen atomic layers were chosen to construct the interfaces in the following calculations.
The surface energies of NbC and TiC were calculated using the method of Shi et al. [16,31], and the results are shown in Figure 1a,b respectively. It is found that the surface energies of Nb-terminated and C-terminated NbC (111) are 1.75–2.88 and 5.70–6.83 J/m2, respectively. Therefore, the surface structure of Nb-termination is more stable than that of C-termination. For TiC (111), the surface energy of C-termination decreases with the increase in Ti chemical potential, while that of Ti-termination increases (Figure 1b). The γs of C-terminated and Ti-terminated TiC (111) are 7.90–9.66 and 1.72–3.47 J/m2, respectively. As a consequence, the Ti-terminated TiC (111) surface is more stable in the range of −1.78 ≤ Δ μ Ti   ≤ 0.

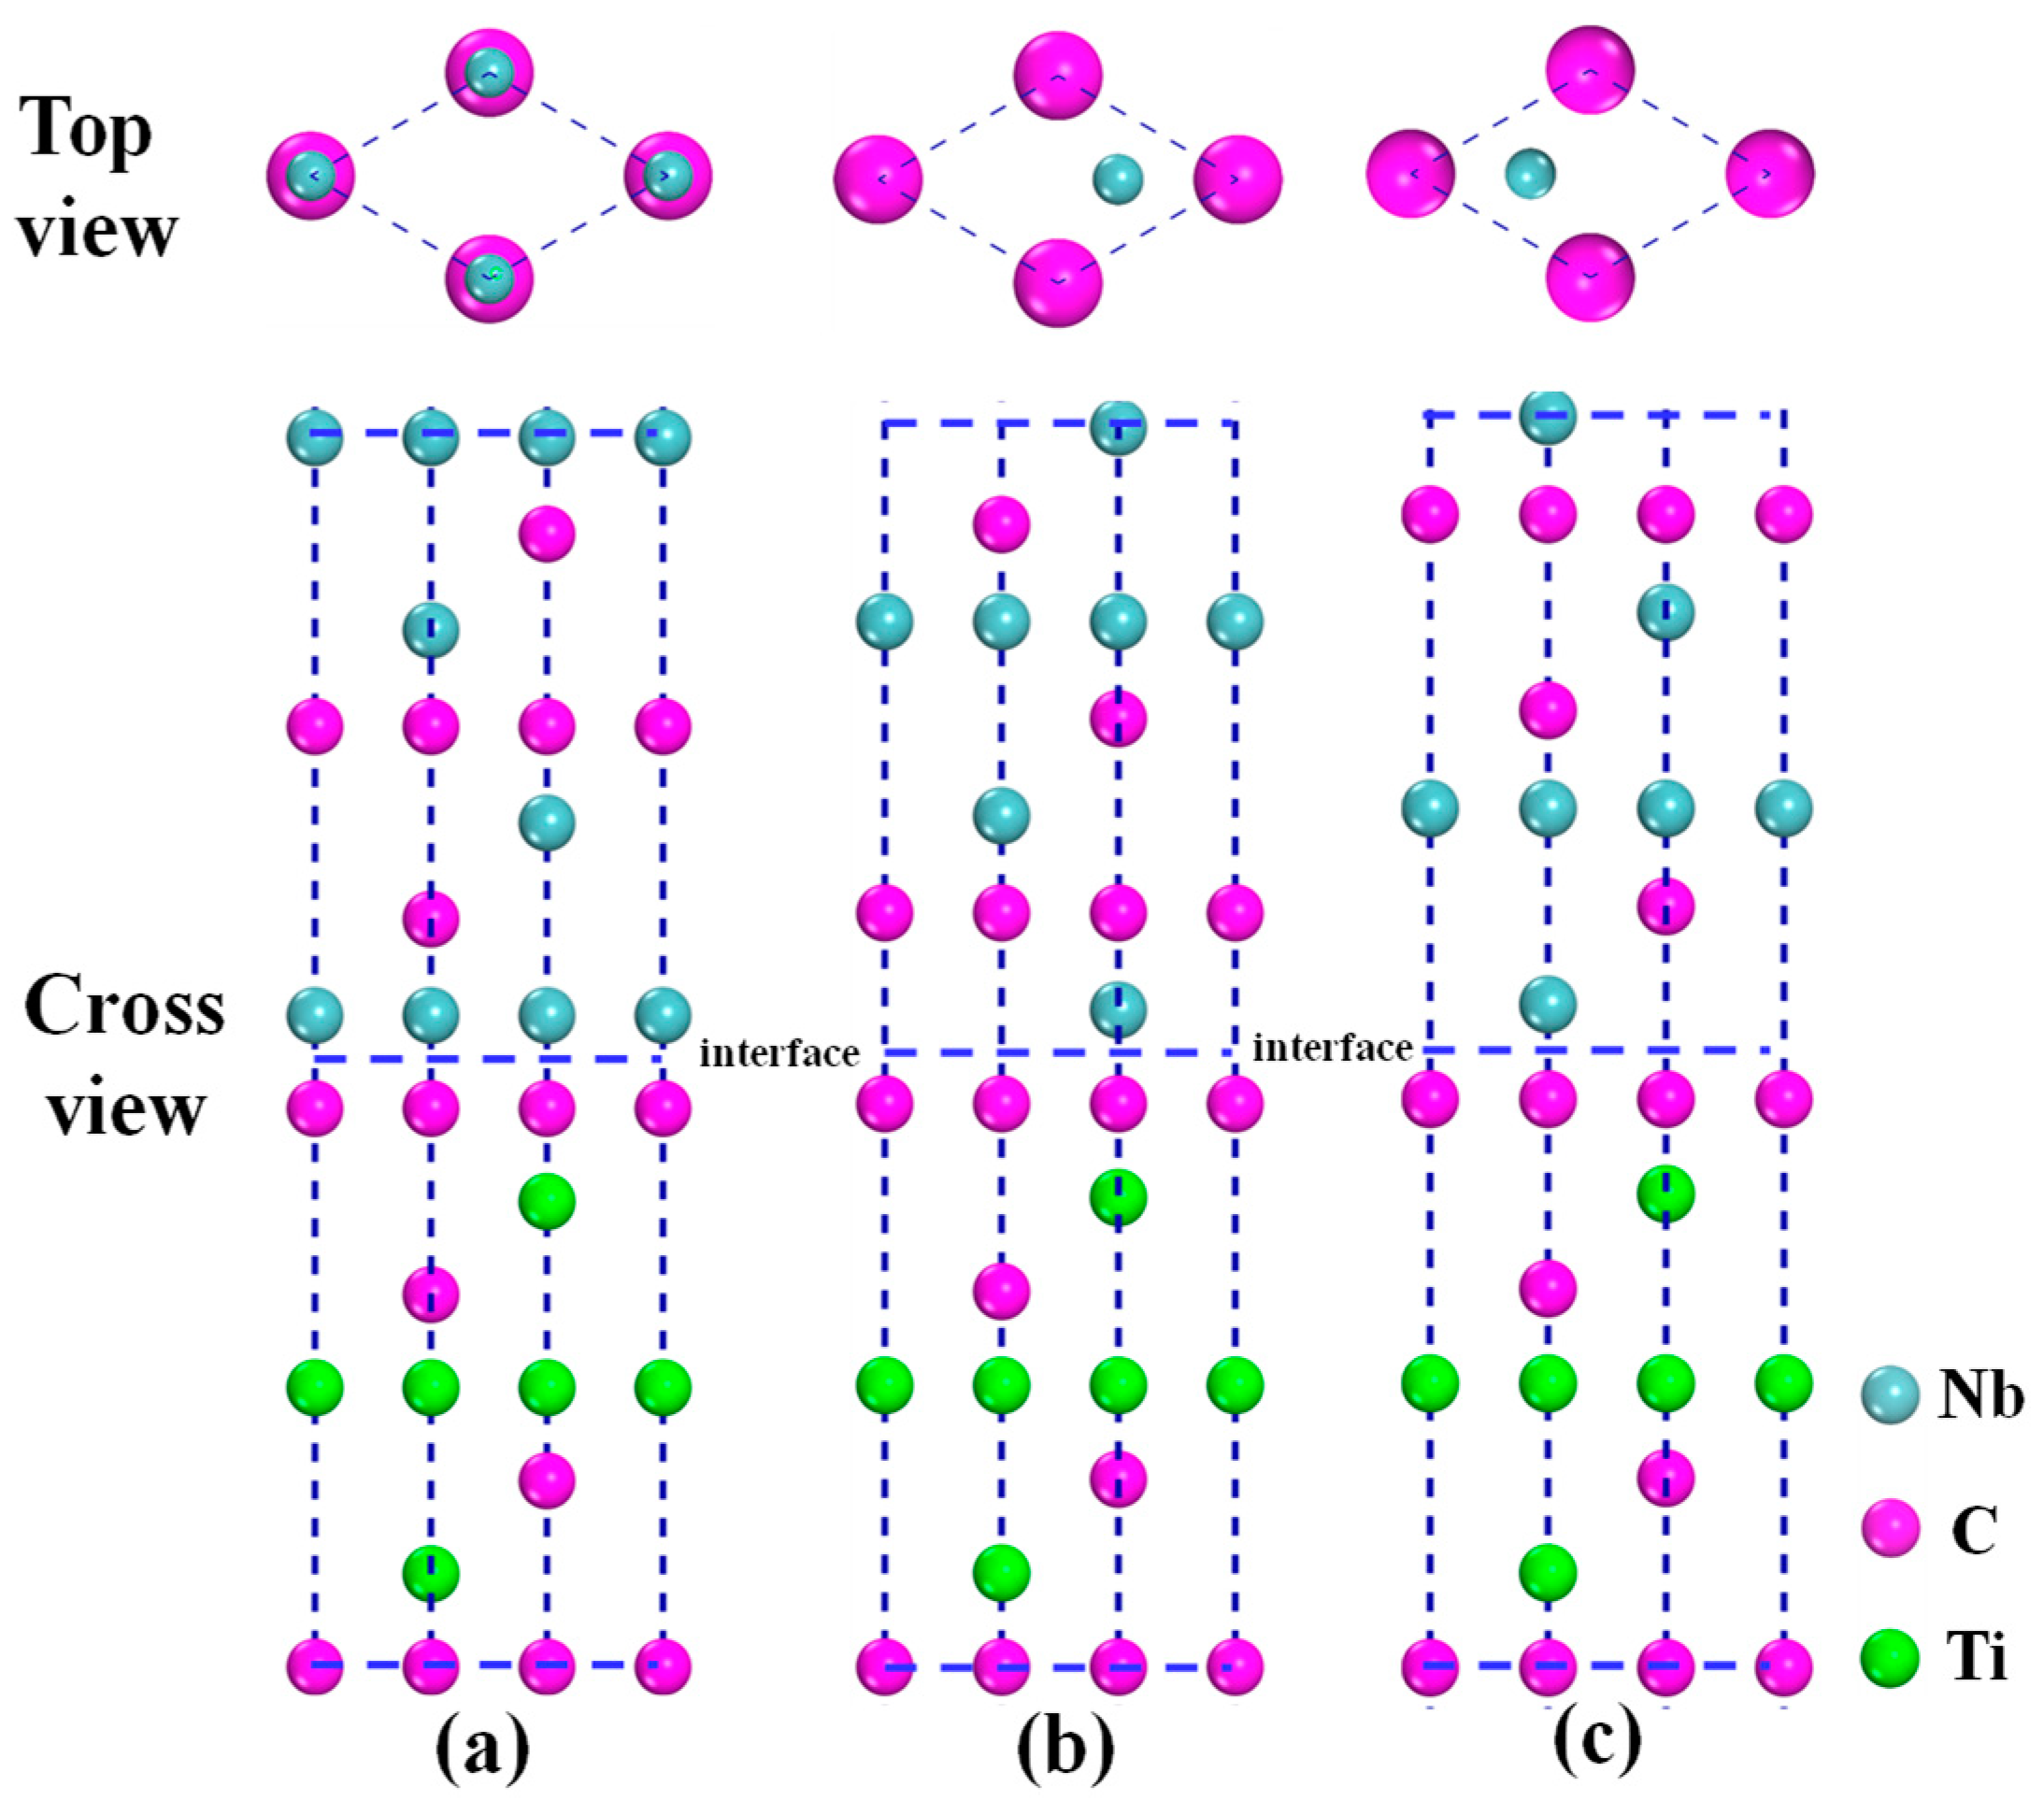
3.2. Models of NbC/TiC Interfaces

The surface model of the nine-atomic-layer thickness was used to establish NbC (100)/TiC (100) and NbC (110)/TiC (110) interfaces. As shown in Figure 2, nine layers of NbC (100) [or NbC (110)] are stacked on nine layers of TiC (100) [or TiC (110)] substrates and a 15 Å vacuum is inserted between the top and bottom surfaces to eliminate the interaction between the two free surfaces. Considering the symmetry of the crystal structure, each interface has two different structure models, which are defined as (100) interface-I and (100) interface-II, and (110) interface-I and (110) interface-II, respectively.
For NbC (111)/TiC (111) interfaces, 12 independent structure models were established after considering two factors of different termination atoms and stacking sequences. As NbC (111) has two varying terminations, namely, Nb- or C-termination, TiC (111) has Ti- or C-termination. There are three stacking sequences on the surfaces of two different termination atoms, i.e., on top (OT), second layer (SL) and third layer (TL). For example, the three stacking interfaces formed by Nb-terminated NbC (111) and C-terminated TiC (111) are shown in Figure 3. The OT indicates that the interfacial Nb atom of the NbC side is on top of the first-layer atoms of the TiC slab. The SL indicates that the interfacial Nb atom of the NbC side is on top of the second-layer atoms of the TiC slab. The TL indicates that the interfacial Nb atom of the NbC side is on top of the third-layer atoms of the TiC slab. In the next calculations, all the NbC (111)/TiC (111) interfaces are constructed by 13-layer NbC (111) and 13-layer TiC (111) slabs, and the 15 Å vacuum layers are inserted into the upper and lower free surfaces.

3.3. Interface Properties of NbC and TiC

3.3.1. Work of Adhesion

The stability and bonding strength of the interface can be judged by the work of adhesion ( W ad ), which can be defined as the reversible work per unit area required to separate the interface composed of two condensed phases into two free surfaces. The W ad of the NbC/TiC interface can be calculated by the following formula [20,32,33]:
W ad   =   ( E NbC   slab +   E TiC slab     E NbC / TiC total ) / A ,
where E NbC / TiC total and A are the total energy and interface area of the NbC/TiC interface, respectively, and E NbC slab and E TiC slab are the total energies of the free NbC and TiC slab models with the same atomic layer thickness at the interface, respectively. It must be pointed out that an interface with a positive (negative) work of adhesion indicates that the interface is stable (metastable).
Table 2 shows the interfacial equilibrium distance (d0) and work of adhesion (Wad) of NbC (100)/TiC (100) and NbC (110)/TiC (110) interfaces. By comparison, we can find that the Wad of the four interfaces follows the following order: (110) interface-II > (100) interface-II > (110) interface-I > (100) interface-I, while d0 shows the opposite trend. The stability of interface-II is better than that of interface-I in both (100) and (110) interfaces. Therefore, when NbC nucleates on the surface of TiC particles, it preferentially grows in the form of “interface-II” rather than “interface-I.” In addition, the adhesive energies of (100) interface-I and (110) interface-I interfaces are negative, which are −0.96 and 0.17 J/m2, respectively, that is to say, they are metastable interfaces.
Table 3 shows the work of adhesion of NbC (111)/TiC (111) interfaces with different terminations and stacking sequences. It can be seen that the Wad of the Nb/C termination interface is larger than that of the C/Ti termination interface, while those of the Nb/Ti and C/C termination interfaces are smaller or even negative. For the Nb-termination interface, the Wad of the Nb/C termination interface is larger than that of the Nb/Ti termination interface. The reason is that the bonding strength of the Nb/Ti termination interfaces will be weakened when the first-layer Nb of the NbC side is combined with the first-layer Ti of the TiC side, which will destroy the continuity of the face-centered cubic (FCC) structure. For the most interfaces, the interface of the TL stacking sequence has the largest Wad, which is larger than that of the OT and SL stacking sequence interfaces, indicating that the interface of the TL stacking sequence structure has the best stability. Furthermore, among the 12 different NbC (111)/TiC (111) interfaces, the Nb/C-terminated and TL stacking sequence interface (NCTL) of the Nb/C termination has the largest Wad (10.15 J/m2) and the smallest equilibrium interface spacing d0 (1.290 Å), and the Wad is much larger than those of the (110) interface-II and (100) interface-II interfaces. Therefore, the NCTL interface has the best stability.

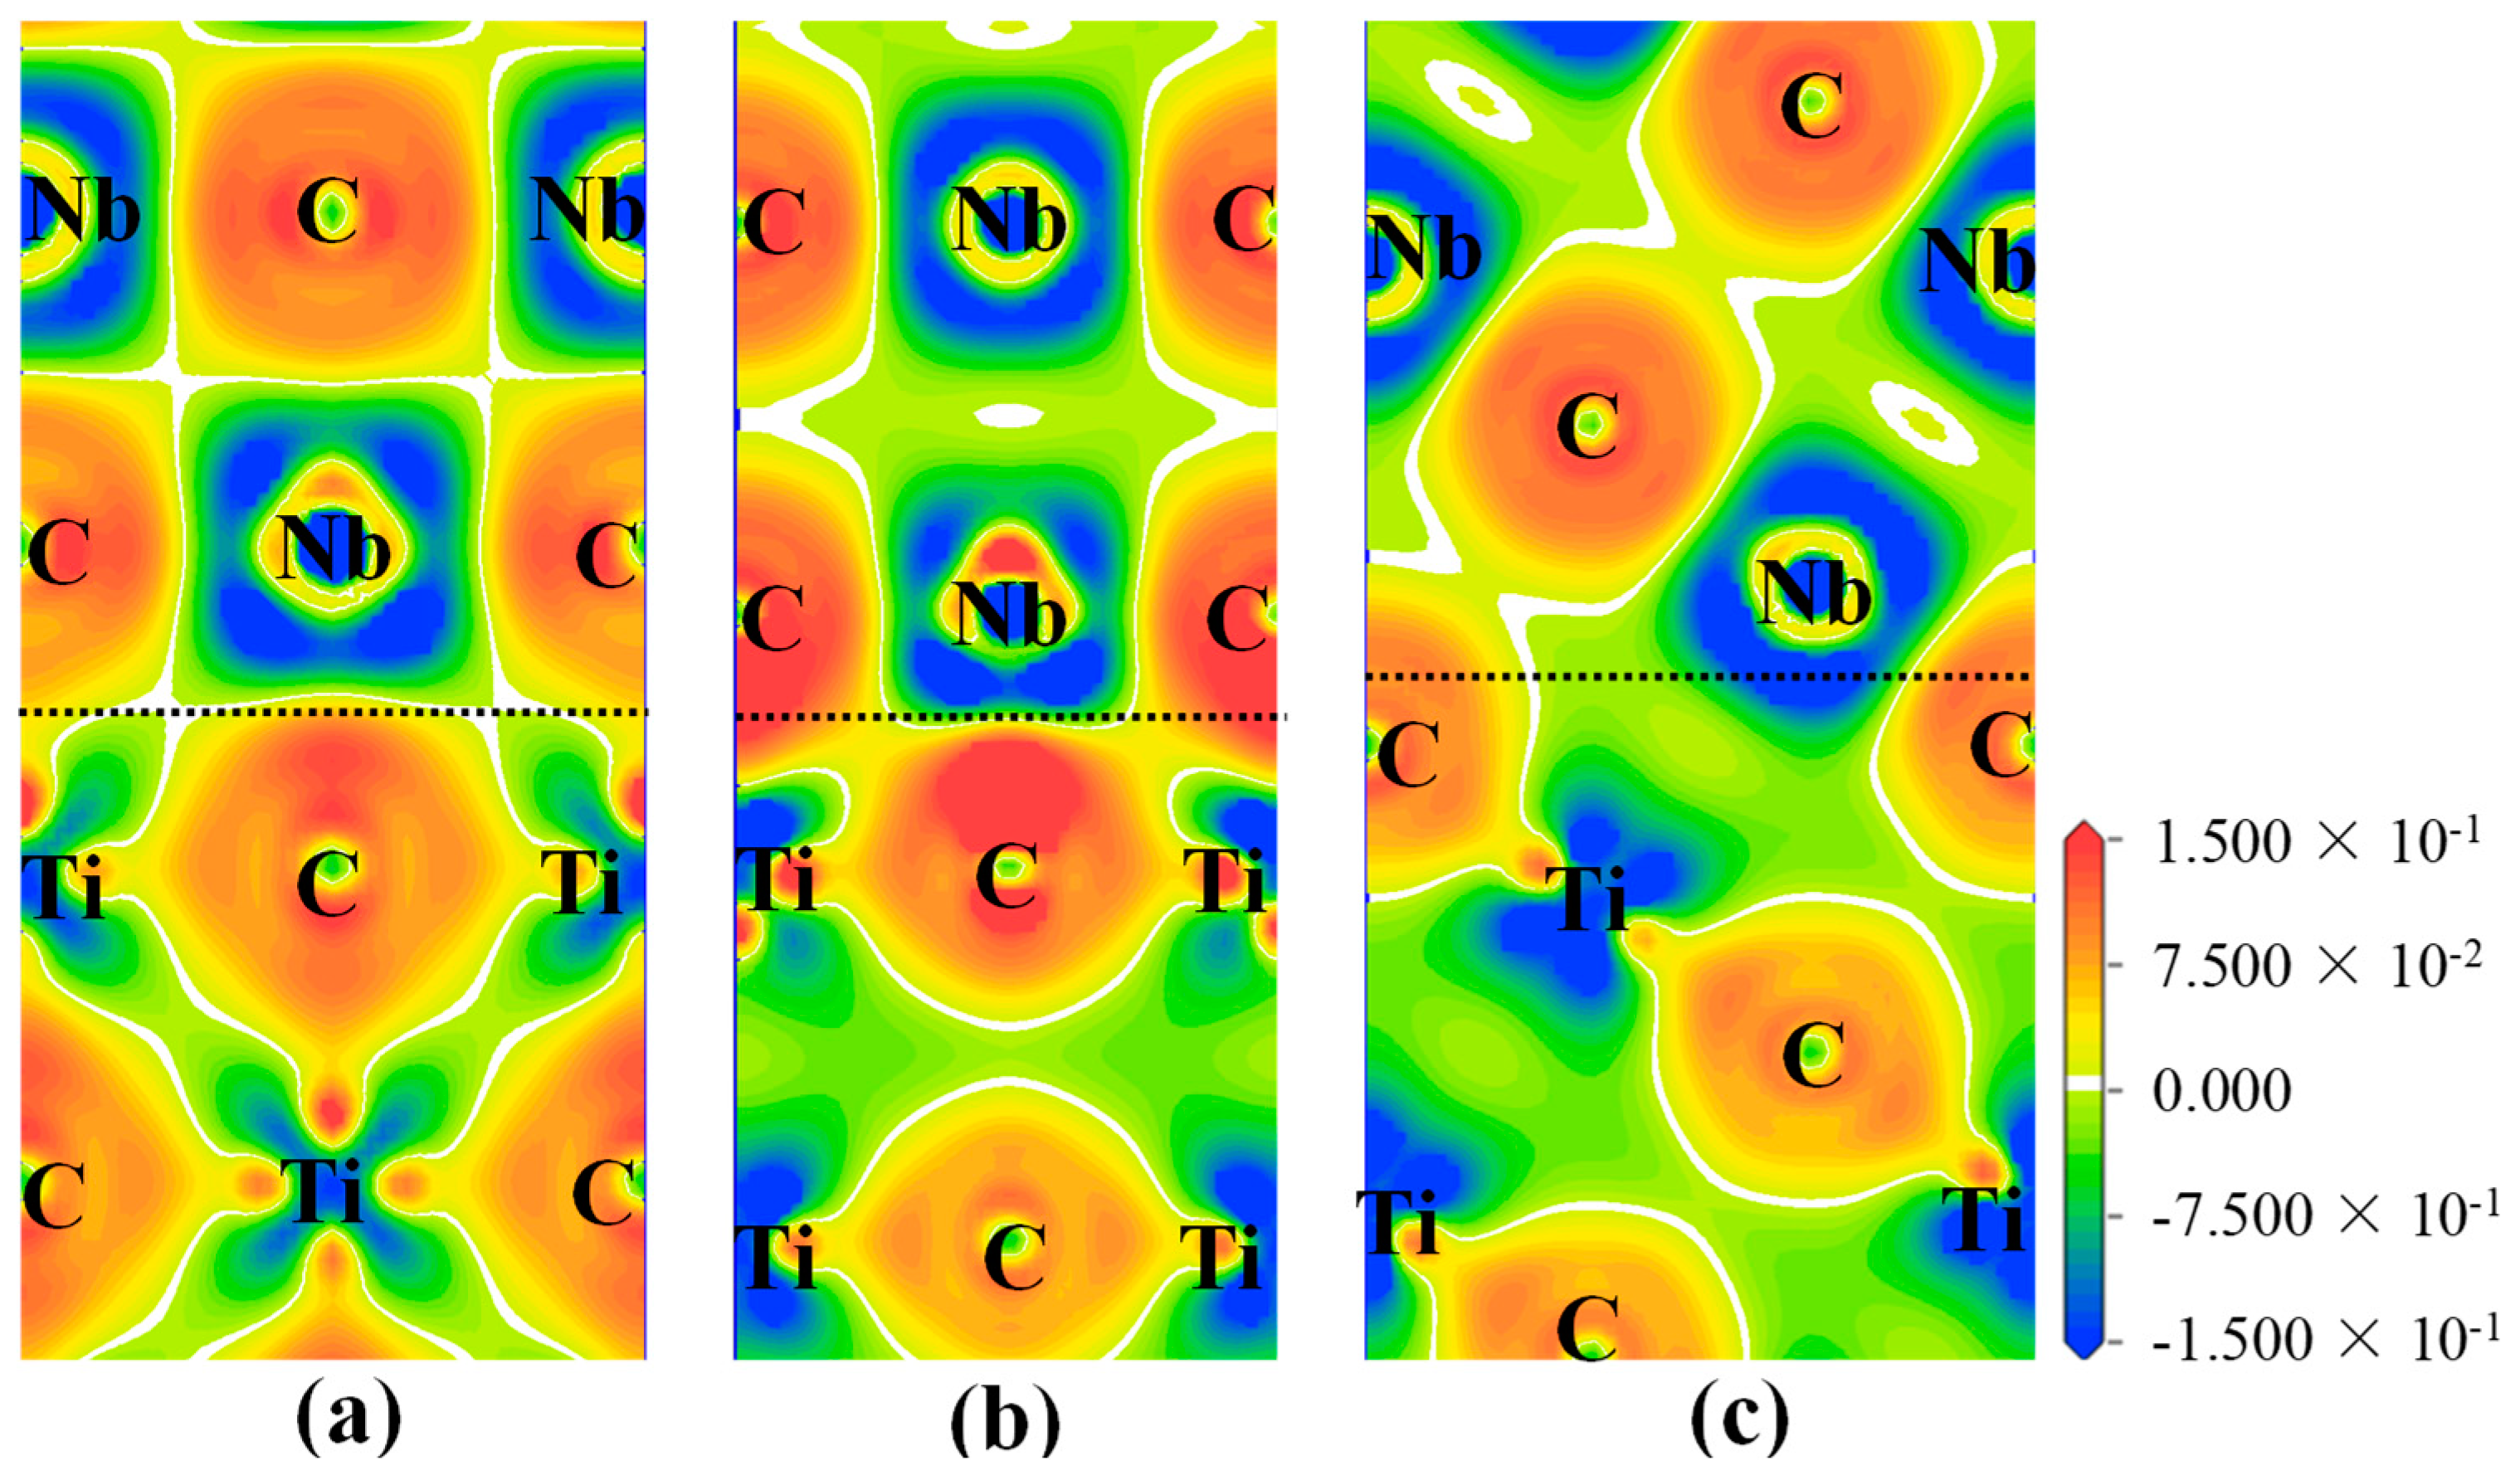
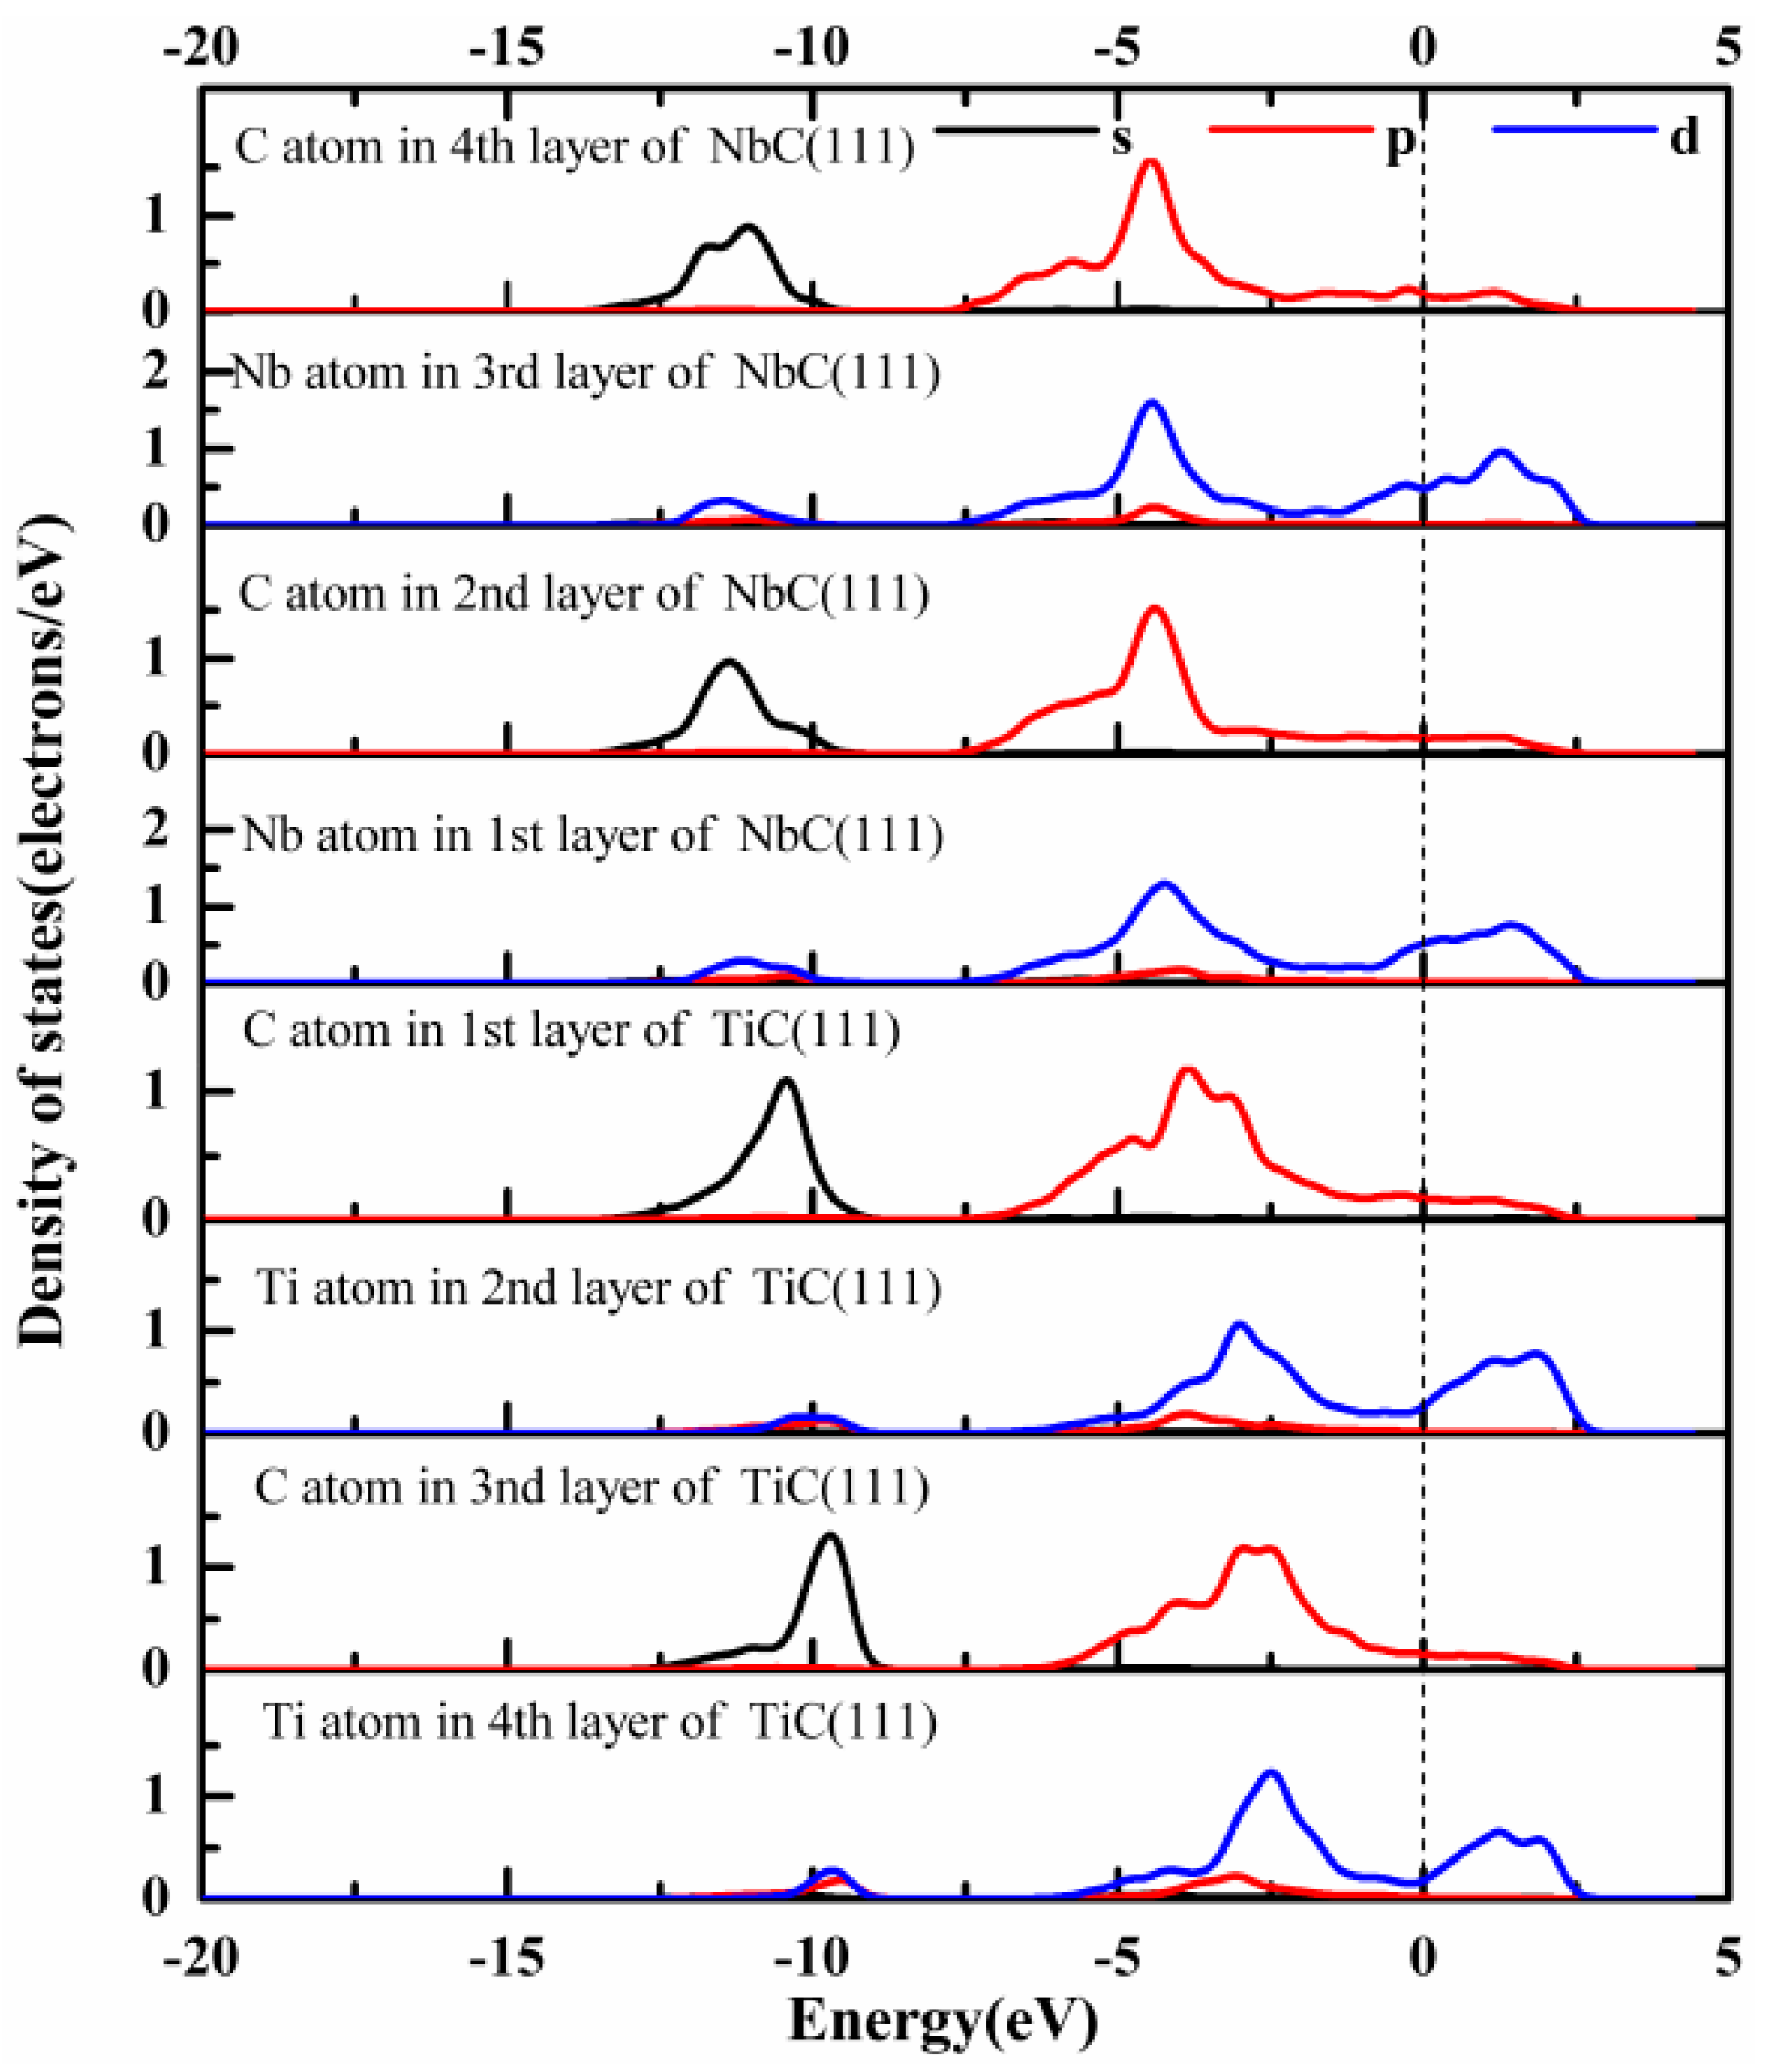
3.3.2. Electronic Structure and Bond Characteristics

The stability of the interface depends on its electronic structure and bonding characteristics. Therefore, the charge density distribution, charge density difference, and partial density of states (PDOSs) of the most stable (100), (110), and (111) interfaces, i.e., (100) interface-II, (110) interface-II, and NCTL interfaces, are calculated and analyzed in this section. The charge density difference ( Δ ρ ) can be obtained by the following equation [34,35]:
Δ ρ   =   ρ Total     ρ NbC slab     ρ TiC slab ,
where ρ Total is the total charge density of the NbC/TiC interface, and ρ NbC slab and ρ TiC slab are the charge densities of the free NbC and TiC surfaces, respectively.
Figure 4 shows the electron density distribution along the (110) plane of the above three interface models after relaxation. Chemical bonds are formed between the Nb, C, and Ti atoms at the interface for the three models, but their interactions are different. For (100) interface-II (Figure 4a), Nb (C) and C (Ti) atoms at the interface share a small amount of charge, which leads to the formation of weak Nb–C and Ti–C covalent bonds, and the interface has the minimum adhesive work and maximum interface distance d0. For the (110) interface-II, as shown in Figure 4b, more charges are accumulated at the interface, resulting in the formation of relatively strong covalent bonds. Therefore, the interface has a larger Wad (4.47 J/m2) and smaller d0 (2.086 Å). For the NCTL interface (Figure 4c), a large number of charges are accumulated around the interfacial Nb and C atoms, and the interfacial Nb atoms share a part of the charge with the second-layer Ti atoms of the TiC side. Meanwhile, the interfacial C atoms and the second-layer C atom of the NbC side also share part of the charge. It can be inferred that there are strong Nb–C covalent bonds, Nb–Ti metal bonds, and relatively weak C–C covalent bonds at the NCTL interface. This also explains why the NCTL interface has the largest adhesion work and the best stability.
Figure 5 shows the charge density difference along the (110) plane of the three interfaces after full relaxation. It is found that the charge distribution near the interface is localized. From Figure 5a, the partial electrons of Nb and Ti atoms at the interface are transferred to C atoms on the other side of the interface, which proves that there are ionic bonds at the interface. For the (110) interface-II interface (Figure 5b), obvious charge aggregation can be observed near Nb, Ti, and C at the interface, which indicates that there are strong covalent bonds at the interface. These results are in good agreement with the analysis of Figure 4b. For the NCTL interface, as shown in Figure 5c, the interfacial Nb atom moves toward the interface direction after relaxation, and part of the charge of the Nb atoms is transferred to the C atoms of the TiC side, which results in the formation of strong Nb–C covalent bonds and the smallest interfacial distance d0.
In order to further study the bonding characteristics of the NbC/TiC interface, the PDOSs of those interfaces were calculated. The cutoff energy and k-point were set as 500 eV and 20 × 20 × 1, respectively, which can ensure the accuracy of the PDOS calculation. As the NCTL interface has the strongest adhesion strength and the best stability, the PDOS of the interface (Figure 6) is only analyzed and discussed in this section.
As shown in Figure 6, compared to the third-layer Nb of the NbC (111) side, the electronic state of Nb at the interface moves toward the Fermi level, the height of the PDOS becomes lower, and new peaks appear near −10 eV. Meanwhile, the PDOS of interfacial C atoms is different from that of the inner-layer C atoms. In comparison to the third-layer C of the TiC (111) side, the PDOS of the first-layer C moves toward the negative level, and its peak value of PDOS becomes larger. Therefore, we can infer that most charges of the interfacial Nb atoms are transferred to the C atoms at the interface. As a result, a strong Nb–C covalent bond is formed. This interaction is mainly contributed by the hybridization between Nb-d and C-sp orbitals, which is consistent with the above charge density analysis. In addition, orbital hybridization between the interfacial Nb-d and Ti-d in the second layer of the TiC (111) side is observed in the range from −12.5 to 5.0 eV, especially around 2.1 eV, which results in the formation of Nb–Ti metallic bonds. Therefore, the coexistence of covalent bonding and metallic bonding in the NCTL interface makes it exhibit excellent stability.

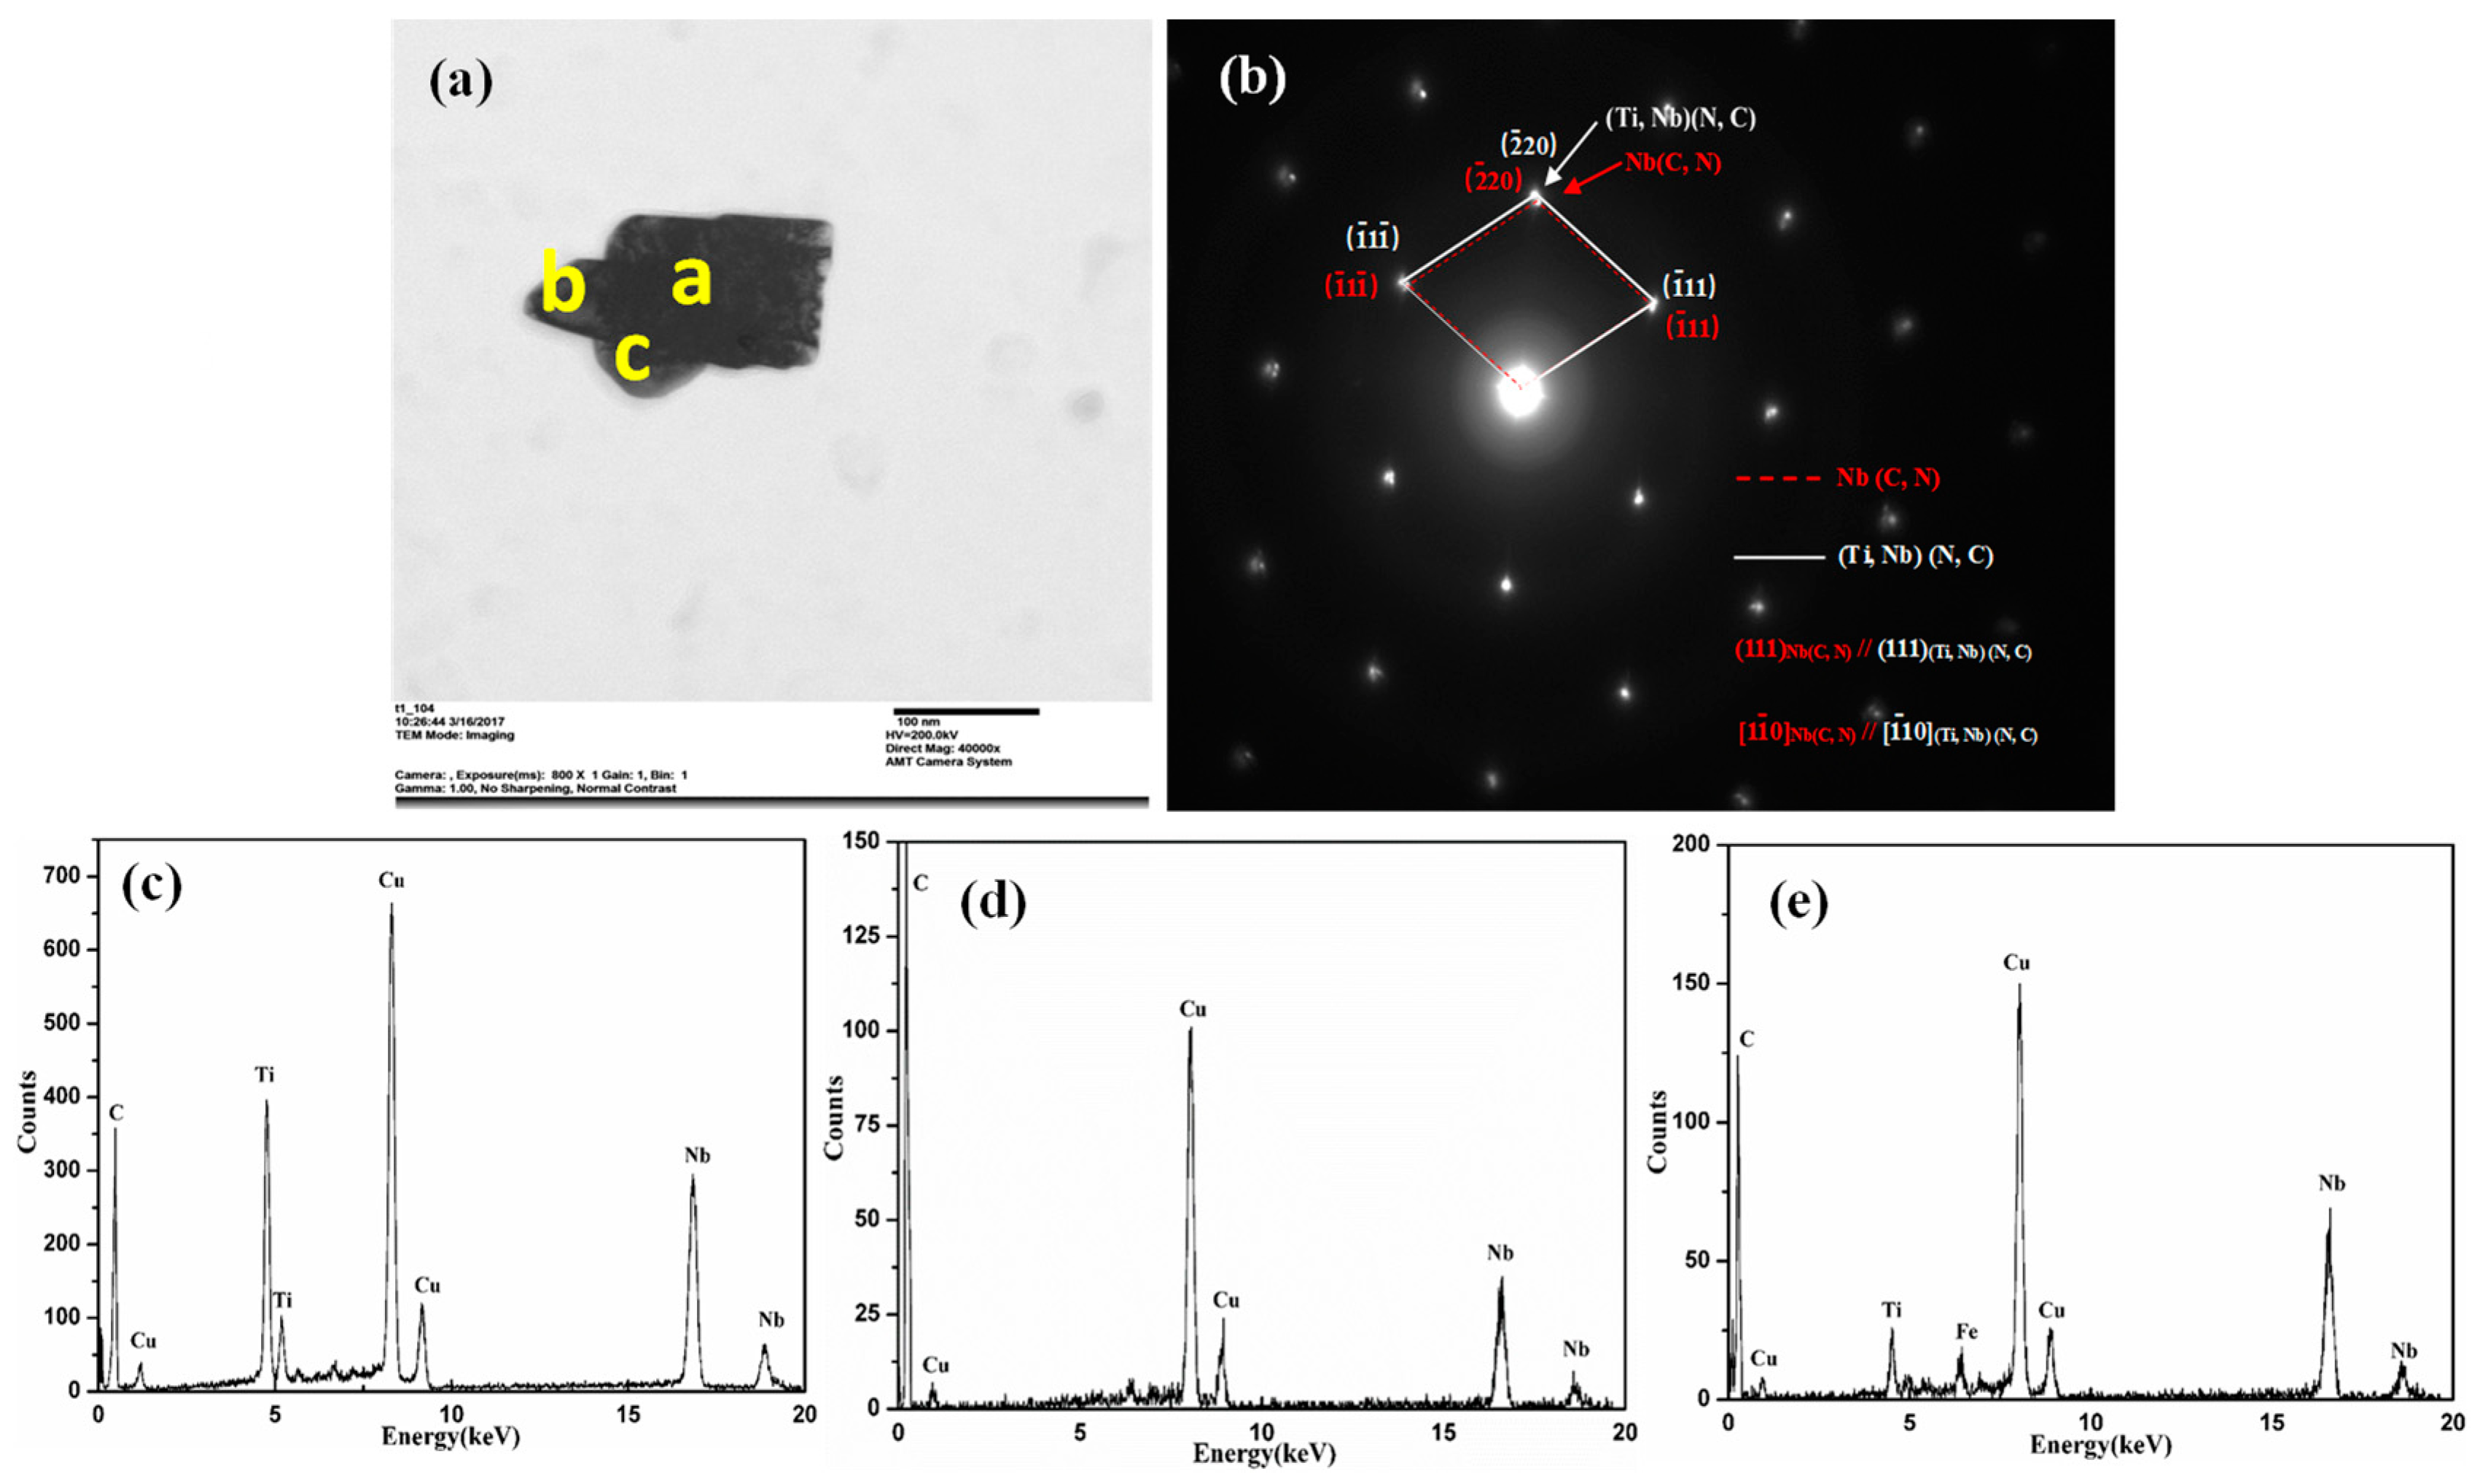
3.3.3. TEM Observation

A typical heterogeneous nucleation precipitate in Nb–Ti microalloyed steel is shown in Figure 7, and the corresponding compositions are listed in Table 4. It can be seen that the precipitate phase may consist of two phases. The core part of the precipitate is elliptical and the epitaxy growth part is triangular, as shown in Figure 7a. Two sets of adjacent diffraction spots (Figure 7e) can be clearly observed from the electron diffraction pattern, which suggests that there are at least two phases in the composite precipitate. From Figure 7b–d and Table 4, we can see that the core part is the Ti-rich (Ti, Nb) C phase, and the composition in the b position is mainly Nb, which can be basically judged as NbC. Meanwhile, the content of Nb in the c position is obviously higher than that of Ti, indicating that another epitaxy part of the precipitate is the Nb-rich (Nb, Ti) C phase. The calculated lattice constants of the Nb-rich and Ti-rich phases are 4.468 and 4.324 Å, respectively, which are very close to the lattice constants of NbC (4.466 Å) and TiC (4.329 Å) measured by predecessors [36,37]. Therefore, it can be judged that the core of the heterogeneous nucleation precipitate is mainly TiC, while the epitaxy phase is mainly NbC.

3.4. Analysis of Heterogeneous Nucleation

The interfacial energy (γint) can be used to qualitatively evaluate the stability of an interface. It should be pointed out that the interface becomes unstable with increasing interfacial energy. The γint of the NbC/TiC interface can be obtained by the following formula [38]:
γ int   =   σ NbC   +   σ TiC     W ad ,
where σ NbC and σ TiC are the surface energies of NbC and TiC slabs, respectively, and W ad is the work of adhesion of the NbC/TiC interface.
Figure 8 shows the interfacial energies of the relatively stable (100) interface-II, (110) interface-II, and NCTL interfaces with respect to the chemical potential of Nb and C. The γint of the (100) interface-II and (110) interface-II interfaces are independent to the chemical potential of Nb and C, and their γint are 0.78 and 2.01 J/m2, respectively. However, the γint of the NCTL interface is closely related to the chemical potential of the nearest Nb and C because NbC (111) and TiC (111) are both polar surfaces. As shown in Figure 8, with the increase in the chemical potential of Nb ( μ Nb slab - μ Nb bulk ), the surface energy of the interface increases gradually, whose maximum value reaches 1.25 J/m2. By comparison, in the range of low Nb chemical potential and high C chemical potential, the three interfacial energies follow the order: (110) interface-II > (100) interface-II > NCTL. At this time, the nucleation of NbC on the TiC surface takes precedence over [ 1 1 ¯ 0 ( 111 ) NbC / / [ 1 1 ¯ 0 ] ( 111 ) TiC . However, in the range of high Nb chemical potential and low C chemical potential, the γint of the three interfaces follows the order: (110) interface-II > NCTL > (100) interface-II. At this time, the heterogeneous nucleation of NbC on TiC precipitates takes precedence over [ 001 ] ( 100 ) NbC / / [ 001 ] ( 100 ) TiC . From Figure 7e, it is found that the orientation relationship between the (Ti, Nb)C particles precipitates first at high temperature, and the heterogeneous nucleation phase (Nb, Ti)C precipitated at low temperature follows:   ( 111 ) ( Nb ,   Ti ) C / / ( 111 ) ( Ti ,   Nb ) C , [ 1 1 ¯ 0 ( Nb ,   Ti ) C / / [ 1 1 ¯ 0 ] ( Ti ,   Nb ) C . In addition, Jung et al. [19] observed that the (Nb, Ti) (C, N) particle precipitates at the edge of the cubic (Ti, Nb) (N, C) by thermal compression experiments, and (Ti, Nb)(N, C) and (Nb, Ti)(C, N) precipitations exhibit a cube–cube orientation relationship: ( 100 ) ( Nb ,   Ti ) ( C ,   N ) / / ( 100 ) ( Ti ,   Nb ) ( N ,   C ) , [ 001 ] ( Nb ,   Ti ) ( C ,   N ) / / ( 001 ) ( Ti ,   Nb ) ( N ,   C ) . Therefore, these experimental observations match well with the results of DFT calculations.

4. Conclusions

In order to reveal the heterogeneous nucleation mechanism of NbC on the pre-existing TiC particles, the adhesive energy, interfacial energy, electronic structure, and bond characteristics of the NbC/TiC interfaces were studied by the DFT method. Considering different atomic terminations and stacking sequences, 16 kinds of NbC/TiC interface models were constructed and analyzed, and the morphology, characteristics, and orientation relationship of heterogeneous nucleation precipitates were observed by transmission electron microscopy (TEM). The main conclusions are as follows:
(1)
For the NbC and TiC crystals, the surface energy of the (100) plane is lower than that of the (110) plane, that is, the stability of the (100) surface is better than that of the (110) surface. However, the surface energy of the (111) plane is dependent on the chemical potential of Ti, Nb, or C.
(2)
As for the NbC (100)/TiC (100) and NbC (110)/TiC (110) interfaces, interface-II is more stable than interface-I. For the NbC (111)/TiC (111) interface, the interface with the Nb–C bond is the most stable, and the stability of interfaces with the C–Ti bond, Nb–Ti bond, and C–C bond decreases in turn. The NCTL interface has the largest work of adhesion (10.15 J/m2) and the smallest equilibrium interface spacing (1.290 Å).
(3)
The strength and stability of (100), (110), and (111) interfaces are mainly attributed to the orbital hybridization of interfacial atoms in the range of −7.5–2.5 eV. The most stable (100) and (110) interfaces are mainly composed of covalent bonds, while the most stable (111) interface (NCTL interface) is mainly composed of covalent bonds and metallic bonds.
(4)
For the NbC/TiC interface, in the range of low Nb chemical potential and high C chemical potential, NbC nucleation on the surface of TiC precipitates preferentially occurs with the coherent relationship: [ 1 1 ¯ 0 ] ( 111 ) NbC / / [ 1 1 ¯ 0 ] ( 111 ) TiC , which is in good agreement with our experimental results from TEM observation. However, in the range of high Nb chemical potential and low C chemical potential, NbC nucleation on the surface of TiC precipitates preferentially occurs with the coherent relationship: [ 001 ] ( 100 ) NbC / / [ 001 ] ( 100 ) TiC .

Author Contributions

Conceptualization and methodology, J.-Y.L.; software, investigation and resources, J.D.; data curation, D.H.; writing—original draft preparation, J.D.; writing—review and editing, J.D.; visualization and supervision, D.H.; project administration, R.H.

Funding

This study is supported by the National Natural Science Foundation of China (Grant No. 51704333 and 21701066), the Natural Science Foundation of Guangdong Province (Grant No. 2019A1515011359 and 2018B090921002) and the Natural Science Foundation of Chaozhou City (Grant No. 2018SS24 and 2019ZC11).

Acknowledgments

We would like to thank Dejian Hou for his assistance in performing the TEM experiments.

Conflicts of Interest

The authors declare no conflict of interest.

References

  1. Wang, Z.Q.; Chen, H.; Yang, Z.G.; Jiang, F.C. Decelerated coarsening of (Ti, Mo)C particles with a core-shell structure in austenite of a Ti-Mo-bearing steel. Metall. Mater. Trans. 2018, A49, 1455–1459. [Google Scholar] [CrossRef]
  2. Yao, M.J.; Welsch, E.; Ponge, D.; Haghighat, S.M.H. Strengthening and strain hardening mechanisms in a precipitation-hardened high-Mn lightweight steel. Acta Mater. 2017, 140, 258–273. [Google Scholar] [CrossRef]
  3. Wang, Z.Q.; Zhang, H.; Guo, C.H.; Liu, W.B. Effect of molybdenum addition on the precipitation of carbides in the austenite matrix of titanium micro-alloyed steels. J. Mater. Sci. 2016, 51, 4996–5007. [Google Scholar] [CrossRef]
  4. Jang, J.H.; Lee, C.H.; Han, H.N.; Bhadeshia, H.K.D.H. Modelling coarsening behaviour of TiC precipitates in high strength, low alloy steels. Mater. Sci. Technol. 2013, 29, 1074–1079. [Google Scholar] [CrossRef]
  5. Ming, L.; Wang, Q.F.; Wang, H.B.; Zhang, Y.; Guo, C.A. A remarkable role of niobium precipitation in refining microstructure and improving toughness of a QT-treated 20CrMo47NbV steel with ultrahigh strength. Mater. Sci. Eng. 2014, A613, 240–249. [Google Scholar] [CrossRef]
  6. Pérez Escobar, D.; Batista Castro, C.S.; Cavichioli Borba, E.; Oliveira, A.P. Correlation of the solidification path with As-cast microstructure and precipitation of Ti,Nb(C,N) on a high-temperature processed steel. Metall. Mater. Trans. 2018, A49, 3358–3372. [Google Scholar] [CrossRef]
  7. Subramanian, S.V.; Xiaoping, M.; Rehman, K.; Zurob, H. On control of grain coarsening of austenite by nano-scale precipitate engineering of TiN-NbC composite in Ti-Nb microalloyed steel. In Proceedings of the 6th International Conference on Recrystallization and Grain Growth (ReX&GG 2016); Holm, E.A., Farjami, S., Manohar, P., Rohrer, G.S., Eds.; Springer International Publishing: Cham, Switzerland, 2016; pp. 119–124. [Google Scholar]
  8. Chen, Z.; Loretto, M.H.; Cochrane, R.C. Nature of large precipitates in titanium-containing HSLA steels. Mater. Sci. Technol. 1987, 3, 836–844. [Google Scholar] [CrossRef]
  9. Craven, A.J.; He, K.; Garvie, L.A.J.; Baker, T.N. Complex heterogeneous precipitation in titanium-niobium microalloyed Al-killed HSLA steels-I. (Ti,Nb)(C, N) particles. Acta Mater. 2000, 48, 3857–3868. [Google Scholar] [CrossRef]
  10. Li, Y.; Wilson, J.A.; Crowther, D.N.; Mitchell, P.S. The effects of vanadium, niobium, titanium and zirconium on the microstructure and mechanical properties of thin slab cast steels. ISIJ Int. 2004, 44, 1093–1102. [Google Scholar] [CrossRef]
  11. Wang, R.Z.; Garcia, C.I.; Hua, M.; Cho, K. Microstructure and precipitation behavior of Nb, Ti complex microalloyed steel produced by compact strip processing. ISIJ Int. 2006, 46, 1345–1353. [Google Scholar] [CrossRef]
  12. Chen, Y.; Tang, G.Y.; Tian, H.Y.; Li, F.P. Microstructures and mechanical properties of Nb-Ti bearing hot-rolled TRIP steels. J. Mater. Sci. Technol. 2006, 22, 759–762. [Google Scholar]
  13. Ma, X.P.; Miao, C.L.; Langelier, B.; Subramanian, S. Suppression of strain-induced precipitation of NbC by epitaxial growth of NbC on pre-existing TiN in Nb-Ti microalloyed steel. Mater. Des. 2017, 132, 244–249. [Google Scholar] [CrossRef]
  14. Yang, J.; Huang, J.H.; Fan, D.Y.; Chen, S.H. First-principles investigation on the electronic property and bonding configuration of NbC (111)/NbN (111) interface. J. Alloy. Compd. 2016, 689, 874–884. [Google Scholar] [CrossRef]
  15. Fan, X.W.; Chen, B.; Zhang, M.M.; Li, D. First-principles calculations on bonding characteristic and electronic property of TiC (111)/TiN (111) interface. Mater. Des. 2016, 112, 282–289. [Google Scholar] [CrossRef]
  16. Shi, Z.J.; Liu, S.; Zhou, Y.F.; Xing, X.L. Structure and properties of YAlO3/NbC heterogeneous nucleation interface: First principles calculation and experimental research. J. Alloy. Compd. 2019, 773, 264–276. [Google Scholar] [CrossRef]
  17. Zhuo, Z.M.; Mao, H.K.; Xu, H.; Fu, Y.Z. Density functional theory study of Al/NbB2 heterogeneous nucleation interface. Appl. Surf. Sci. 2018, 456, 37–42. [Google Scholar] [CrossRef]
  18. Xiong, H.H.; Zhang, H.N.; Dong, J.H. Adhesion strength and stability of TiB2/TiC interface in composite coatings by first principles calculation. Comp. Mater. Sci. 2017, 127, 244–250. [Google Scholar] [CrossRef]
  19. Liu, S.; Zhou, Y.F.; Xing, X.L.; Wang, J.B. Refining effect of TiC on primary M7C3 in hypereutectic FeCrC harden-surface welding coating: Experimental research and first-principles calculation. J. Alloy. Compd. 2017, 691, 239–249. [Google Scholar] [CrossRef]
  20. Yang, J.; Huang, J.H.; Fan, D.Y.; Chen, S.H. Comparative investigation on RE(La,Ce)AlO3(100)/γ-Fe(100) interfaces: A first-principles calculation. Appl. Surf. Sci. 2016, 384, 207–216. [Google Scholar] [CrossRef]
  21. Xiong, H.H.; Zhang, H.H.; Zhang, H.N.; Zhou, Y. Effects of alloying elements X (X = Zr, V, Cr, Mn, Mo, W, Nb, Y) on ferrite/TiC heterogeneous nucleation interface: First-principles study. J. Iron Steel Res. Int. 2017, 24, 328–334. [Google Scholar] [CrossRef]
  22. Bramfitt, B.L. The effect of carbide and nitride additions on the heterogeneous nucleation behavior of liquid iron. Metall. Trans. 1970, 1, 1987–1995. [Google Scholar] [CrossRef]
  23. Clark, S.J.; Segall, M.D.; Pickard, C.J.; Hasnip, P.J. First principles methods using CASTEP. Z. Krist.-Cryst. Mater. 2005, 220, 567–570. [Google Scholar] [CrossRef]
  24. Segall, M.D.; Lindan, P.J.D.; Probert, M.J.; Pickard, C.J. First-principles simulation: Ideas, illustrations and the CASTEP code. J. Phys. Condens. Matter 2002, 14, 2717. [Google Scholar] [CrossRef]
  25. Vanderbilt, D. Soft self-consistent pseudopotentials in a generalized eigenvalue formalism. Phys. Rev. 1990, B41, 7892–7895. [Google Scholar] [CrossRef]
  26. White, J.A.; Bird, D.M. Implementation of gradient-corrected exchange-correlation potentials in Car-Parrinello total-energy calculations. Phys. Rev. 1994, B50, 4954–4957. [Google Scholar] [CrossRef]
  27. Monkhorst, H.J.; Pack, J.D. Special points for Brillouin-zone integrations. Phys. Rev. 1976, B13, 5188–5192. [Google Scholar] [CrossRef]
  28. Liu, P.; Han, X.L.; Sun, D.L.; Chen, Z.H. Adhesion, stability and electronic properties of Ti2AlN (0001)/TiAl (111) coherent interface from first-principles calculation. Intermetallics 2018, 96, 49–57. [Google Scholar] [CrossRef]
  29. Park, J.S.; Kim, D.H.; Park, J.H. TEM characterization of a TiN-MgAl2O4 epitaxial interface. J. Alloy. Compd. 2017, 695, 476–481. [Google Scholar] [CrossRef]
  30. Lv, Z.; Xiao, S.; Xiao, Z.; Qian, L. Structural properties and bonding characteristic of interfaces between VN and VC from density functional calculations. J. Alloy. Compd. 2017, 718, 139–149. [Google Scholar] [CrossRef]
  31. Xiong, H.H.; Liu, Z.; Zhang, H.H.; Du, Z. First principles calculation of interfacial stability, energy and electronic properties of SiC/ZrB2 interface. J. Phys. Chem. Solids 2017, 107, 162–169. [Google Scholar] [CrossRef]
  32. Zhao, X.B.; Zhuo, Y.G.; Liu, S.; Zhou, Y.F. Investigation on WC/TiC interface relationship in wear-resistant coating by first-principle. Surf. Coat. Technol. 2016, 305, 200–207. [Google Scholar] [CrossRef]
  33. Zhao, X.B.; Yuan, X.M.; Liu, S.; Zhao, C.C. Investigation on WC/LaAlO3 heterogeneous nucleation interface by first-principles. J. Alloy. Compd. 2017, 695, 1753–1762. [Google Scholar] [CrossRef]
  34. Ma, L.; Lu, Y.; Li, S.Y.; Zuo, W. First-principles investigation of Sn9Zn (0001)/α-Al2O3 (0001) interfacial adhesion. Appl. Surf. Sci. 2018, 435, 863–869. [Google Scholar] [CrossRef]
  35. Liu, Y.Z.; Xing, J.D.; Li, Y.F.; Sun, L. A first principles study of adhesion and electronic structure at Fe (110)/graphite (0001) interface. Appl. Surf. Sci. 2017, 405, 497–502. [Google Scholar] [CrossRef]
  36. Ono, K.; Moriyama, J. The phase relationships in the Nb-Ti-C system. J. Less Com. Met. 1981, 79, 255–260. [Google Scholar] [CrossRef]
  37. Dunand, A.; Flack, H.D.; Yvon, K. Bonding study of TiC and TiN. I. high-precision x-ray-diffraction determination of the valence-electron density distribution, Debye-Waller temperature factors, and atomic static displacements in TiC0.94 and TiN0.99. Phys. Rev. 1985, B31, 2299–2315. [Google Scholar] [CrossRef]
  38. Christensen, M.; Dudiy, S.; Wahnström, G. First-principles simulations of metal-ceramic interface adhesion: Co/WC versus Co/TiC. Phys. Rev. 2002, B65, 405–408. [Google Scholar] [CrossRef]
Figure 1. (a) Surface energies of NbC (111) as a function of Nb chemical potential and (b) surface energies of TiC (111) as a function of Ti chemical potential.
Metals 09 01265 g001
Figure 2. Structural diagram of NbC (100)/TiC (100) interface and NbC (110)/TiC (110) interface. (a) (100) interface-I, (b) (100) interface-II, (c) (110) interface-I, and (d) (110) interface-II. The upper part shows the top view and the lower part shows the side view, where the dashed line represents the interface.
Metals 09 01265 g002
Figure 3. Schematic plots of NbC (111)/TiC (111) interfaces with (a) OT, (b) SL, and (c) TL stacking sequences. The upper part shows the top view and the lower part shows the side view. The interfaces of Nb-terminated NbC and C-terminated TiC are shown only. Part of the top and bottom of the interfaces is not shown.
Metals 09 01265 g003
Figure 4. Plots of charge density taken along (110) plane: (a) (100) interface-II, (b) (110) interface-II, and (c) Nb/C-terminated and TL stacking sequence (NCTL) interface, where the dashed line refers to the interface.
Metals 09 01265 g004
Figure 5. Plots of charge density difference taken along (110) plane: (a) (100) interface-II, (b) (110) interface-II, and (c) NCTL interface, where the dashed line refers to the interface.
Metals 09 01265 g005
Figure 6. Partial density of states (PDOS) for the relaxed NCTL interface. The dashed line refers to the Fermi energy.
Metals 09 01265 g006
Figure 7. Typical heterogeneous nucleation precipitated phase in Nb–Ti microallyed steel. (a) Bright field image; (b) the corresponding fast Fourier transformed diffraction of particle in (a); (ce) EDS of a, b, and c points in (a).
Metals 09 01265 g007
Figure 8. Interfacial energies of (100) interface-II, (110) interface-II, and NCTL as a function of niobium and carbon chemical potential.
Metals 09 01265 g008
Table 1. Convergence of the surface energy (γs, J/m2) of NbC (100), NbC (110), TiC (100), and TiC (110) with respect to the number of atomic layers.
Layer NumberNbC (100)NbC (110)TiC (100)TiC (110)
31.603.131.793.58
51.553.061.773.53
71.562.981.773.51
91.482.971.763.51
111.482.971.753.52
131.472.971.763.51
Table 2. Calculated equilibrium interfacial separation d0 and work of adhesion Wad of NbC (100)/TiC (100) and NbC (110)/TiC (110) interfaces.
Modelsd0 (Å)Wad (J/m2)
(100) interface-I4.155−0.96
(100) interface-II2.2212.46
(110) interface-I2.626−0.17
(110) interface-II2.0854.47
Table 3. Adhesion energy after relaxation, Wad (J/m2), for the interface between the Nb-terminated structure of NbC (111) and C- or Ti-terminated structure of TiC (111) and between the C-terminated structure of NbC (111) and C- or Ti-terminated structure of TiC (111).
TerminationStacking Sequence
NbCTiCOTSLTL
NbC5.558.6210.15
NbTi2.012.103.48
CC3.21−0.32−0.68
CTi4.766.188.38
Table 4. Main components of the heterogeneous nucleation precipitation phase.
PhaseWeight RatioAtomic Ratio
NbTiTi/NbNbTiTi/Nb
a76.823.20.302163.0536.950.5861
b99.790.210.002199.60.40.004
c93.226.780.072787.6312.370.1412

