Quantitative Analysis of Microstructure Evolution in Hot-Rolled Multiphase Steel Subjected to Interrupted Tensile Test


1
Department of Engineering Materials and Biomaterials, Faculty of Mechanical Engineering, Silesian University of Technology, 18A Konarskiego Street, 44-100 Gliwice, Poland
2
Łukasiewicz Research Network-Institute for Ferrous Metallurgy, 12-14 K. Miarki Street, 44-100 Gliwice, Poland
*
Author to whom correspondence should be addressed.
Metals 2019, 9(12), 1304; https://doi.org/10.3390/met9121304
Submission received: 4 November 2019
/
Revised: 28 November 2019
/
Accepted: 30 November 2019
/
Published: 3 December 2019
(This article belongs to the Special Issue Performance of Mechanical Properties of Ultrahigh-Strength Ferrous Steels Related to Strain-Induced Transformation)
Abstract
:A quantitative analysis of the microstructure evolution in thermomechanically processed Si-Al multiphase steel with Nb and Ti microadditions was performed in the study. The tendency of strain-induced martensitic transformation of retained austenite was analyzed during a tensile test interrupted at incremental strain levels. Optical micrographs and electron backscatter diffraction (EBSD) maps were obtained at each deformation step. The quantitative analysis of the martensitic transformation progress as a function of strain was performed. The results showed that the stability of retained austenite is mostly related to its grain size and morphology. Large, blocky-type grains of retained austenite located in a ferritic matrix easily transformed into martensite during an initial step of straining. The highest mechanical stability showed small austenitic grains and thin layers located in bainitic islands. It was found that the extent of martensitic transformation decreased as the deformation level increased.
1. Introduction
A microstructure of transformation-induced plasticity (TRIP)-assisted steels typically contain ferrite, bainite, retained austenite, and sometimes a small fraction of martensite. Retained austenite is a key microstructural constituent due to its strain-induced transformation to martensite. This enables obtaining beneficial combinations of strength and ductility. Steels sheets in the automotive industry are subjected to multi-step forming operations, in which some fraction of retained austenite is transformed into the martensite. Thus, the total amount of retained austenite available for the transformation reduces as deformation level increases [1,2]. Therefore, it is important to characterize the microstructure evolution of TRIP steels during incremental deformation. This enables predicting optimal mechanical properties of final products and monitoring the amount of available retained austenite in crash events. The experimental analysis of microstructural changes during straining was reported mostly for cold-rolled TRIP steels [1,3,4]. Several models describing the kinetics of strain-induced transformation of retained austenite in TRIP steels have been also developed [5]. Haidemenopoulos et al. [6] fitted a mathematical model to available experimental data regarding the evolution of martensite as a function of strain for several TRIP steels. The progressive TRIP effect in hot-rolled sheet steels was investigated rarely [7,8].
Generally, an intensity of the TRIP effect depends strongly on the amount and stability of retained austenite (RA). These steels contain usually 10–15% of γ phase. A chemical composition, an austenite grain size, a type of surrounding phases, and a stress state are the most important factors affecting the stability of retained austenite and the progress of strain-induced transformation. It is well known that carbon content strongly influences the stability of retained austenite. Park et al. [9] observed the correlation between the austenite morphology and carbon content in this phase. They found that the blocky-type RA had lower carbon contents than a film-type RA. Therefore, the blocky RA easily transformed into martensite due to its lower mechanical stability than the film-type RA.
TRIP steels with a ferritic matrix usually contain: ~0.2% C, ~1.5% Mn, and ~1.5% Si or 1.5% Al. Manganese stabilizes the austenitic phase and increases the carbon solubility in ferrite [10]. Sugimoto et al. [11] reported that the addition of 2 wt.% Mn resulted in obtaining a higher fraction of retained austenite. However, the carbon content in this phase became lower. Silicon addition inhibits the carbide precipitation during the bainitic transformation and also strongly increases solid solution strengthening. Silicon can be partially replaced by aluminum due to problems during galvanization, hot-rolling, and welding. However, TRIP steels with Al additions show lower mechanical properties and higher Ms temperatures [12,13,14]. In order to improve the mechanical properties of such Al-alloyed steels, microadditions of Nb and Ti can be added [8,15,16,17]. Mo can be also sometimes added to increase strength due to its strong solid solution strengthening effect [18]. Nb and Ti microadditions improve mechanical properties of high-strength low-alloyed (HSLA) steels by precipitation strengthening and grain refinement [8,19,20,21,22]. Hausmann et al. [19] reported that the addition of 0.025–0.090 wt.% Nb reduced the cementite precipitation, while the amount of retained austenite increased. Similar results were obtained by Pereloma et al. [20] in 0.2C-1.5Mn-1.5Si-0.039Nb steel.
In the literature, there are several reports concerning the effects of Nb and Ti microadditions on microstructural changes of TRIP steels during straining [1,3,4]. However, most experiments were conducted only under rupture conditions. A limited number of papers addressed the microstructure evolution of thermomechanically processed TRIP steels during interrupted straining. Therefore, the goal of the current work is to characterize microstructural changes of the hot-rolled Si-Al multiphase steel with Nb and Ti microadditions during the interrupted tensile test.
2. Material and Methods
2.1. Material
Investigations concern the Si-Al-Nb-Ti type steel showing a TRIP effect. The detailed chemical composition is listed in Table 1. Silicon was partially replaced by aluminum to improve the manufacturability of the steel sheets. To improve strength, the microadditions of Nb and Ti were added [8,19,20,21,22]. The weldability of automotive steel sheets is also a very important issue. Results of studies concerning the weldability of steels with Nb and Ti microadditions showed [23,24] that the fast thermal cycles during welding led to partial dissolution of strengthening phases containing Nb and Ti. As a result of high cooling rate they can precipitate in an uncontrolled way in a heat-affected zone and in the joint. Results of our previous study [25] performed on the 0.24C-1.55Mn-0.87Si-0.4Al-Nb-Ti type steel showed that it is weldable.
The investigated steel was prepared by vacuum induction melting. The laboratory ingots were hot-forged to a thickness of 22 mm. Then, they were hot-rolled to a thickness of 4.5 mm in a temperature range 1200–900 °C. Figure 1 shows the applied thermomechanical rolling conditions. It consisted of 3 passes at deformation temperatures: 1050, 950, and 850 °C. The final sheet thickness was ca. 2 mm. After the final deformation, the flat specimens were air cooled to 700 °C and then more slowly to the temperature of 600 °C within 60 s using a furnace cooling. Then, cooling of the sheets at a rate of about 50 °C/s to the isothermal holding temperature (450 °C) at the bainitic transformation range was applied. The sheet samples were held at 450 °C for 600 s to stabilize retained austenite and finally cooled at a rate of 0.5 °C/s to room temperature.
2.2. Description of Experimental Methods
For the detailed investigation of the strain-induced austenite-martensite transformation, interrupted tensile tests were carried out at different strain levels. Samples for the tensile test were cut along the rolling direction from the 2 mm thick sheet. Unidirectional tensile tests were performed to defined strain values of 5%, 10%, 15%, and the final rupture (25%) at a strain rate of 0.008 s−1 using a standard tensile test machine Zwick Z/100 (Zwick Roell, Ulm, Germany).
The specimens for optical observations were taken near a fracture area of the deformed specimens according to the tensile direction. The specimens at the initial state (non-deformed) and after the tensile tests were mechanically ground with SiC paper up to 1500 grid and polished using a diamond paste. Then, samples at the initial state were etched in 5% nital and 10% sodium metabisulfite, whereas the deformed samples were etched using the La Pera reagent to observe microstructural details. This type of etching allows obtaining the microstructure in which each phase was characterized by a different color. The 5% nital reagent allows ferrite grains to be revealed, whereas using 10% sodium metabisulfite caused individual microstructural components to be represented by different colors: retained austenite (white), ferrite (gray), bainite (black) and martensite (brown). La Pera reagent allows for color-coded identification of deformed microstructures: ferrite (yellow), retained austenite (light brown), martensite (dark brown). The optical observations were performed using a Zeiss Axio Observer Z1m optical microscope (Carl Zeiss AG, Jena, Germany).
For identifying the amount of individual phases observed in the microstructure, the Image-Pro Plus (version 6.0) software (Media Cybernetics Inc., Rockville, MD, USA) was used. It allows for stereological parameters of individual microstructural constituents to be determined. Based on the optical micrographs, changes in an amount of retained austenite for the specimens deformed at the different strain levels were estimated. Microstructural analysis was performed based on differences in colors of individual phases. For the analysis, optical micrographs were converted to binary maps. A total of 10 digital analyses were performed for each state.
For more detailed investigation of the transformation behavior of retained austenite under applied strain, the tensile specimens were analyzed using an electron backscatter diffraction (EBSD) method. The amount of γ phase was determined based on the average values of 3 measurements. Specimens were prepared using standard metallographic procedures. Then they were electropolished for 40 s, at an operating voltage of 58 V using a TenuPol-5 device (Struers, Ballerup, Denmark) and A8 electrolyte by Struers, (Struers, Ballerup, Denmark) to remove the damage of the surface caused by the grinding and mechanical polishing. The EBSD analyses were conducted at an acceleration voltage of 20 kV and a sample tilt angle of 70° towards normal to an electrooptic beam. EBSD phase maps were recorded using a high resolution scanning electron microscope FEI Inspect F SEM (FEI, Hillsboro, OR, USA) and evaluated by the TSL® OIM software (EDAX OIM Analysis™, NJ, USA). The grain size data were obtained using a grain tolerance angle of 5° and the minimum grain size was chosen to be 2 pixels. All data points with a confidence index (CI) lower than 0.05 were excluded from the analysis.
3. Results
3.1. Initial Microstructure
A microstructure of the investigated steel in the initial state (after hot rolling) is shown in Figure 2. The steel is characterized by a fine-grained multiphase microstructure consisting of ferrite, bainite, and retained austenite. A size of ferritic grains is quite various. Both large and small grains can be observed in the microstructure (Figure 2a). Retained austenite occurs in a form of blocky grains located in a ferritic matrix or as thin layers and small regular grains located inside the bainitic islands.
Digital processing of the optical micrograph allowed us to distinguish the fine-grained and layer-type retained austenite (Figure 2b). A grain area of RA was various, in a range from 0.2 to 42 μm2. Austenitic grains were elongated according to rolling direction (Figure 2c). In Figure 2d individual phases are represented by a different color: ferrite—gray, retained austenite—white, bainite—blue, grain boundaries—black. Figure 3 shows the statistical parameters of retained austenite obtained by the digital processing of optical micrographs. The relatively large quantity of small RA grains can be observed (Figure 3a). Their fraction for a given grain size was estimated to ca. 1–1.5%. However, the largest surface fraction was represented by large grains of RA (Figure 3b). The grains larger than 10 μm2 constitute 30% of the total amount of γ phase (5% of the surface share). The total amount of retained austenite was estimated as 14.6%.
3.2. Interrupted Tensile Test
3.2.1. Sample Deformed to 5% Strain
A specimen deformed to 5% strain during the static tensile test shows the microstructure slightly elongated along to a tensile direction (Figure 4a,b). The largest blocky-type austenitic grains were transformed into martensite (Figure 4c). One can see that some fraction of large austenitic grains transformed only partially—the grain boundaries remained untransformed whereas middle areas of the grains transformed into the martensite (Figure 4d). It can be seen that the amount of small RA grains became higher. It is related to the fact that the newly-formed martensite partially divided the austenitic areas (Figure 4c). As a result of the applied tensile stress, about 3% of martensite, characterized by various sizes, was formed in the microstructure (Figure 4c).
Figure 5 shows the statistical parameters of the retained austenite and martensite obtained by the digital processing of optical micrographs of the specimen deformed to 5% strain. For the quantitative analysis of the RA islands which remain stable after deformation, it was assumed that if the martensitic transformation took place (even only partially) in an austenite grain, such a grain was identified as transformed. The amount of retained austenite in deformed specimens was compared to the microstructure at the initial state (100%) in order to assess an amount of austenite transformed into martensite during straining.
The quantity and surface fraction of the smallest austenitic grains became higher when compared to the specimen at the initial state (Figure 5). However, the surface fraction of the largest RA grains remained significantly higher (Figure 5b). An amount of retained austenite observed in the microstructure of the specimen deformed to 5% strain was estimated to be 11.7%. This means that 2.8% of the total amount of γ phase transformed into martensite (Figure 5b). Figure 6 shows that 70% of the fraction of austenitic grains larger than 10 μm2 transformed into the strain-induced martensite. Smaller grains of RA showed the lower tendency to strain-induced transformation. Austenitic grains smaller than 3 μm2 remained almost stable (Figure 6).
3.2.2. Sample Deformed to 10% Strain
A sample deformed to 10% strain is characterized by grains elongated according to a tensile direction (Figure 7). The amount of RA grains larger than 4 μm2 significantly decreased (Figure 8). Almost all austenitic grains larger than 7 μm2 transformed into martensite. The central areas of the large austenite grains transformed into martensite, while the regions located near the grain boundaries remained stable (Figure 7d). As a result of microstructure fragmentation, a quantity of small grains of γ phase increased (Figure 8a). A large amount of small grains (<1 μm2) and layers of retained austenite located at bainitic islands remained unchanged. The quantity of small martensitic areas was high. However, the greatest surface area showed the largest martensitic islands (Figure 7c).
Figure 8 shows the statistical parameters of retained austenite and martensite obtained by digital processing of 10% strain optical micrographs. Austenitic grains in a size range of 1–7 μm2 were transformed at different proportions (Figure 8). Statistical calculations showed that small austenitic grains were dominant in the microstructure of 10% strain specimen. Both the quantity and surface share of small RA grains (Figure 8a) were greater than for the large grains (Figure 8b). In case of the specimen at the initial state, the highest surface share showed austenitic grains larger than 10 μm2 (Figure 3b). The amount of retained austenite detected for the specimen deformed to 10% strain was estimated to about 8%. It means that ~6.6% of the total RA amount transformed into the martensite.
Figure 9 shows that austenitic grains smaller than 1 μm2 remained mechanically stable. Only 15% of the smallest grains transformed into martensite. It is worth to note that the largest grains, which only partially transformed into martensite, were also counted as the transformed grains (Figure 7d). It resulted in a quite inflated amount of calculated γ phase (Figure 9).
3.2.3. Sample Deformed to 15% Strain and to the Rupture
Microstructural components of the 15% strained sample were elongated according to a tensile stress direction (Figure 10a). All blocky grains of retained austenite located in a ferritic matrix underwent the martensitic transformation. Large austenitic grains located at the bainitic islands almost completely transformed into the martensite. Thin RA layers only partially changed into martensite (Figure 10a). Amount of small austenitic grains became higher due to the fragmentation of large austenite grains by the newly-formed martensite. Amount of retained austenite was estimated to about 6%. It means that more than a half fraction of retained austenite transformed into the martensite during straining (Figure 3b). A surface share of martensite was ca. 10%. In the deformation range from 10% to 15%, about 2% of retained austenite transformed into the martensite, which corresponds to ca. 14% of the total share of the γ phase.
Figure 10b shows the sample deformed to 25% strain (to rupture). The microstructure was strongly deformed along a tensile load. Several small, thin layers located at bainitic islands remained stable. Only the smallest grains and some grain boundaries of RA did not transform into martensite (Figure 10b). The largest martensitic areas were formed from the largest grains of γ phase. The amount of retained austenite remained in the microstructure of the sample deformed to rupture is ca. 2.5%. The martensitic fraction was estimated to ~11.6%. In the deformation range from 15% to 25%, about 3.5% of the retained austenite transformed into strain-induced martensite, which corresponds to about 25% of the total share of γ phase.
3.3. Electron Backscatter Diffraction (EBSD) Results
The microstructure of the investigated steel was also examined by using an EBSD method. The amount of RA at the initial state was 13.8% [15]. Figure 11a–c provides the selected EBSD maps of the steel deformed to 5% strain. Figure 11a shows the IQ (image quality) map. Ferrite is represented by the brightest regions characterized by the best diffraction quality. The retained austenite, bainite, and grain boundaries are represented by different grey levels. Martensite occurred as the darkest areas characterized by lowest values of the IQ parameter. The fraction of low-angle boundaries (misorientation < 15°) marked as red and green lines was estimated to be 25% (Figure 11b). High-angle boundaries marked as blue and orange lines (misorientation > 15°) were dominant. The strain-induced martensitic transformation occurred inside the largest austenite grains located near ferrite grains (Figure 11c). The central areas of the large austenite grains transformed into martensite, whereas the regions located near the grain boundaries remained stable. Retained austenite in form of small grains and thin layers located at bainitic islands remained unchanged (Figure 11c). The average amount of RA was estimated to about 10.1%.
Figure 12a shows the IQ map of steel deformed to 10% strain. The amount of regions represented by the lowest IQ parameter is slightly higher when compared to the specimen deformed to 5% strain (Figure 11a). It is related to the increase in the amount of martensite, which was characterized by the lowest value of the IQ parameter. The fraction of low-angle boundaries was estimated to be about 50% (Figure 12b). The amount of high-angle boundaries was lower when compared to the specimen deformed to 5% strain (Figure 11b). Dislocations generated during plastic deformation were reflected as an increase in the number of low-angle boundaries. On the other hand, the newly-formed martensite-austenite boundaries, as a result of strain-induced transformation, generated new high-angle boundaries. Therefore, the final distribution between low-angle and high-angle boundaries was a synergistic result of these two effects. The highest stability showed austenitic grains located at bainitic islands. However, some fraction of RA at these areas transformed into martensite (Figure 12c). Further fragmentation of larger RA grains was also observed. The amount of γ phase remained stable was estimated to about 7.7%. Figure 13a shows the IQ map of steel deformed to 25% strain (a rupture of the sample). An increase in the amount of areas characterized by the lowest IQ value was observed when compared to the samples deformed to 5% and 10% strain. The amount of low and high-angle boundaries was similar (Figure 13b). Austenite grains are strongly fragmented. They were located mainly at bainitic areas (Figure 13c). The amount of RA was estimated to 3.7%.
4. Discussion
A volume fraction and stability of retained austenite are essential factors in designing TRIP steels. Numerous reports concern the stability of retained austenite in TRIP-assisted multiphase steels [3,4,6,26,27]. Nowadays, researchers are focused on C-Mn-Si-Al TRIP steels with microadditions such as Nb, Ti, and Mo [4,8,17,18,19,20,21,28]. It is related to the fact, that these microadditions improve the properties by enhancing the strength and grain refinement [8,9,10,11,12,13,14,15,16,17,18,19,21]. It is well known that the amount of retained austenite was decreasing as a result of plastic deformation [1,2,3,4,5,6,7,8,9]. However, the kinetics of TRIP effect is a complex issue and it depends on several factors (i.e., chemical composition, morphology, and grain size of RA). It is especially important to monitor the microstructure evolution during straining due to the detailed characterization of the tendency of individual RA grains to martensitic transformation [29]. However, most scientific reports concern the comparison of microstructural features of a specimen at an initial state (non-deformed) and deformed to rupture [7]. Moreover, the effects of grain size and morphology on the stability of retained austenite in hot-rolled TRIP grades were analyzed rarely. Therefore, this problem was discussed in the present study. A quantitative microstructural analysis of samples deformed gradually in interrupted tensile tests, assessed by using both digital image analysis and EBSD methods, allowed the tendency of RA for martensitic transformation, depending on grain type and its size, to be monitored.
An amount of retained austenite decreased as the strain level increased (Figure 14). The highest relative fraction of γ phase transformed at the lowest strain level (5%). In this case, about 90% of austenitic grains larger than 10 μm2 transformed into martensite. As the deformation level increases, smaller grains of austenite further transformed. For the deformation level 10% the austenitic grains bigger than 8 μm2 transformed into martensite. It is related to the fact that large blocky-type grains of retained austenite were characterized by relatively low mechanical stability due to a lower carbon content. Moreover, blocky-type austenite possesses some fraction of microstructural defects, like dislocations and stacking faults which constitute the martensite nucleation zones [30]. Some reports [31,32,33] showed that film-type of retained austenite located at the bainitic islands is more beneficial due to the higher strength and steel toughness. However, Xu et al. [34] reported that the most favorable, gradual progress of martensitic transformation occurred for the microstructure consisting of both blocky and film types of retained austenite. A neighborhood of soft ferrite also favors the easier transformation into martensite [35]. Carbon content strongly affects the austenite stabilization (decreases the Ms temperature). Retained austenite characterized by low carbon content can easily be transformed into martensite during plastic deformation. High carbon content in the austenite caused its excessive stabilization, which also resulted in ductility reduction [36]. Pereloma et al. [37] reported that the most favorable, gradual TRIP effect occurs when retained austenite contains 1.1–1.6% C. The detailed information concerning the X-ray diffraction analysis of investigated steel, including the estimation of carbon content in the retained austenite, can be found in our earlier work [38]. The determined carbon content was 1.28 wt.%, giving the opportunity for the gradual transformation. Increasing the strain level to 15% resulted in the complete transformation of austenitic grains larger than 6 μm2. In the case of the specimen deformed to 25% strain (to rupture), austenitic grains larger than 2 μm2 transformed into martensite (Figure 13). Only thin films and small grains of RA located at the bainitic islands remained stable. As the grain size of RA decreased, its mechanical stability increased. The new-formed grain boundaries acted as obstacles to new potential martensitic laths, resulting in inhibiting a further transformation [39].
An amount of retained austenite estimated by using digital processing of optical micrographs and EBDS were similar (Table 2). However, the amount of RA estimated by using EBSD method was slightly lower when compared to the image analysis. It is related to the fact that the image analysis contained some uncertainty of measurement. Digital processing of optical micrographs was characterized by lower resolution than EBSD method. Both applied methods confirmed that the large grains of RA were more prone to martensitic transformation than small grains and thin layers of this phase. Moreover, it was clearly seen, that γ phase located near grain boundaries remained stable due to a higher carbon content. Similar results were obtained by Park et al. [9] in 0.2C-2Mn-1Si steel. Additionally, they also observed that the amount of RA decreased after applying 15% strain; after that, the intensity of the strain-induced martensitic transformation reduced. Figure 15 shows that the surface share of austenitic grains larger than 10 μm2 decreased as the deformation level increased. The mount of grains in the size range from 3 to 10 μm2 was decreasing slowly. The amount of the smallest austenitic grains (<1 μm2) was increasing, and the deformation level increased. It is related to the fragmentation of large austenite grains by newly-formed martensite (Figure 15).
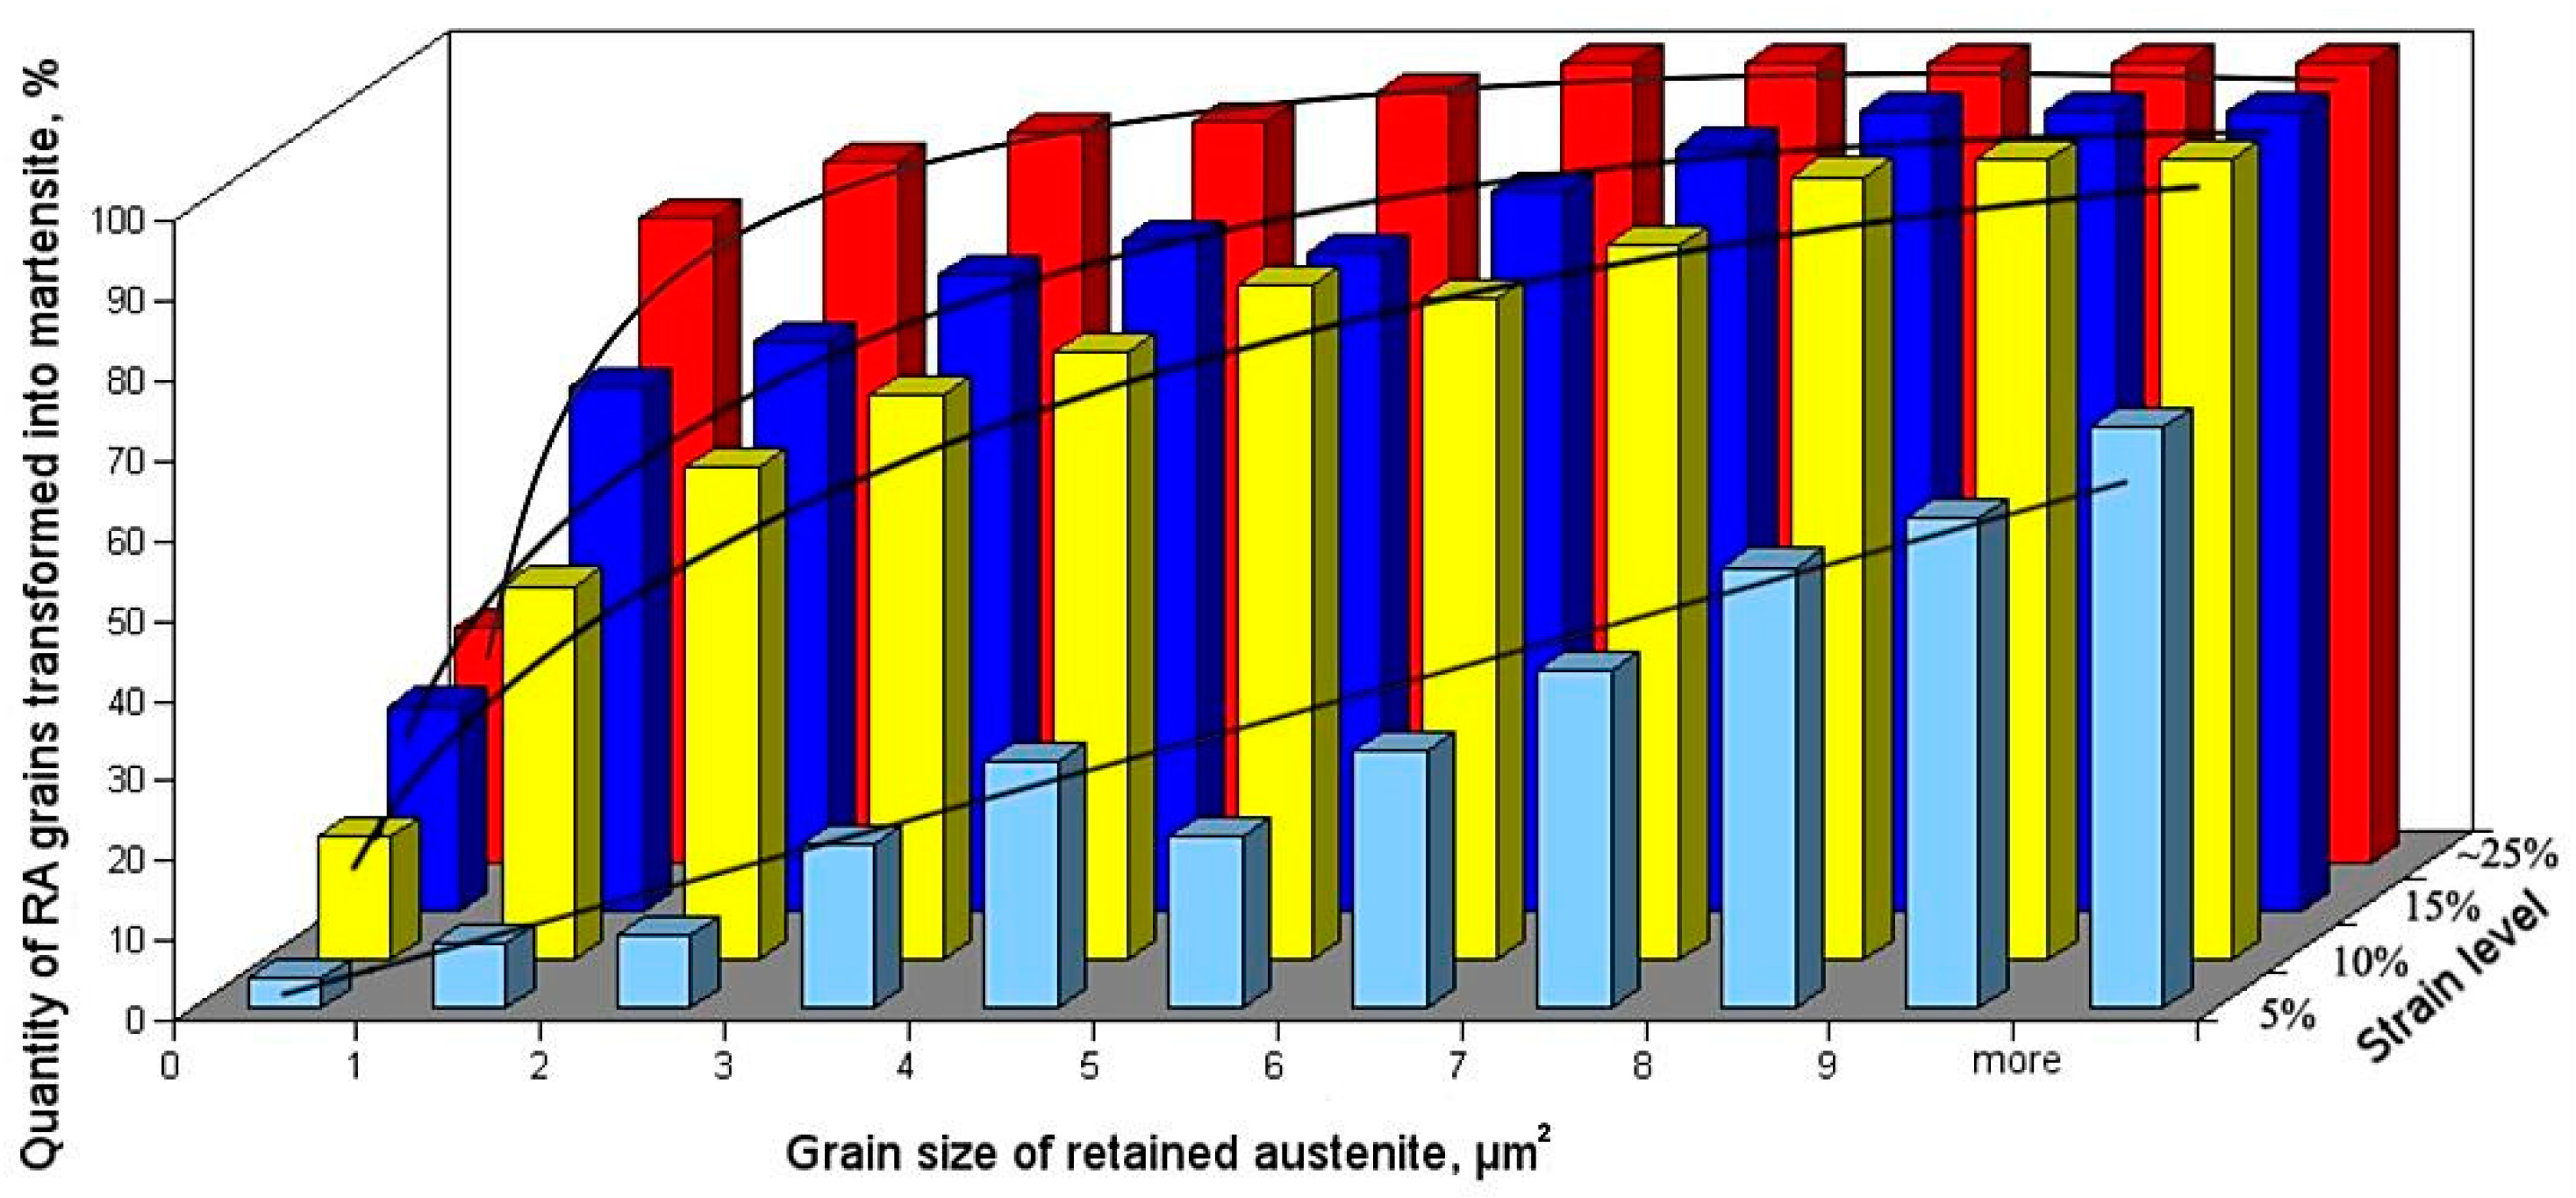
A correlation between grain size of retained austenite and its tendency for martensitic transformation as a function of strain level is shown in Figure 16. For the deformation level 5%, mostly large austenitic grains transformed into martensite. The tendency can be approximated by a linear function. For the higher deformation levels, the tendency was approximated by a parabolic function (Figure 16). As the deformation level increased, the intensity of martensitic transformation decreased, which was related to the lower amount of large austenite grains. A total of 30% of the smallest austenitic grains and layers transformed into martensite (Figure 16). These areas were characterized by the highest mechanical stability.
5. Conclusions
The present study addressed the quantitative analysis of the microstructure evolution in thermomechanically-processed Nb-Ti-microalloyed Si-Al multiphase steel subjected to interrupted tensile tests. The main findings of the paper can be summarized as follows:
- Martensitic transformation began in the central area of large blocky-type austenitic grains located in the ferritic matrix. As the deformation level increased the intensity of martensitic transformation decreased due to the lower amount of large austenite grains.
- A size of austenite grains which transformed into martensite decreased when deformation level was increasing.
- An amount of small austenitic grains increased along with the deformation level due to the fragmentation of large austenitic grains by newly-formed martensite. The corresponding fractions of low-angle and high-angle boundaries were a synergistic effect of the dislocation increase due to straining and new boundaries formed by strain-induced martensite formation.
- Austenitic grains smaller than 1 μm2 and thin layers showed the highest mechanical stability. It was due to their high mechanical stability related to the relatively high carbon content.
- An amount of retained austenite detected in the specimen at the initial state was ca. 14%. Specimens deformed up to rupture possessed ca. 2.5% of RA (i.e., ~17% of untransformed retained austenite).
Author Contributions
Conceptualization, A.G.; data curation, A.G. and A.K.; formal analysis, A.G.; funding acquisition, A.G.; investigation, A.K. and K.R.; methodology, A.G., A.K. and K.R.; project administration, A.G.; validation, A.S.; visualization, A.S.; writing—original draft, A.K.; writing—review and editing, K.R. and A.S.
Funding
The financial support of the National Science Center, Poland, is gratefully acknowledged, grant no. 2017/27/B/ST8/02864.
Conflicts of Interest
The authors declare no conflict of interest.
References
- Streicher-Clarke, A.M.; Speer, J.G.; Matlock, D.K.; De Cooman, B.C.; Williamson, D.L. Analysis of lattice parameter changes following deformation of a 0.19C-1.63Si-1.59Mn Transformation-Induced Plasticity sheet steel. Metall. Mater. Trans. A 2005, 36, 907–918. [Google Scholar] [CrossRef]
- Suliga, M.; Muskalski, Z.; Wiewiorowska, S. The influence of drawing speed on fatigue strength TRIP steel wires. Arch. Civ. Mech. Eng. 2009, 9, 97–107. [Google Scholar] [CrossRef]
- Kobayashi, J.; Tonegawa, H.; Sugimoto, K. Cold formability of 22SiMnCrB TRIP-aided martensitic sheet steel. Proc. Eng. 2014, 81, 1336–1341. [Google Scholar] [CrossRef] [Green Version]
- Krizan, D.; De Cooman, B.C. Analysis of the strain-induced martensitic transformation of retained austenite in cold rolled micro-alloyed TRIP steel. Steel Res. Int. 2008, 79, 513–522. [Google Scholar] [CrossRef]
- Samek, L.; De Moor, E.; Penning, J.; De Cooman, B.C. Influence of alloying elements on the kinetics of strain-induced martensitic nucleation in low-alloy, multiphase high-strength steels. Metall. Mater. Trans. A 2006, 37, 109–124. [Google Scholar] [CrossRef]
- Haidemenopoulos, G.N.; Aravas, N.; Bellas, I. Kinetics of strain-induced transformation of dispersed austenite in low-alloy TRIP steels. Mater. Sci. Eng. A 2014, 615, 416–423. [Google Scholar] [CrossRef]
- Kaar, S.; Krizan, D.; Schwabe, J.; Hofmann, H.; Hebesberger, T.; Commenda, C.; Samek, L. Influence of the Al and Mn content on the structure-property relationship in density reduced TRIP-assisted sheet steels. Mater. Sci. Eng. A 2018, 735, 475–486. [Google Scholar] [CrossRef]
- Kucerova, L.; Bystriansky, M. Comparison of thermo-mechanical treatment of C-Mn-Si-Nb and C-Mn-Si-Al-Nb TRIP steels. Proc. Eng. 2017, 207, 1856–1861. [Google Scholar] [CrossRef]
- Park, H.S.; Han, J.C.; Lim, N.S.; Seol, J.B.; Park, C.G. Nano-scale observation on the transformation behavior and mechanical stability of individual retained austenite in CMnSiAl TRIP steels. Mater. Sci. Eng. A 2015, 627, 262–269. [Google Scholar] [CrossRef]
- Jabłońska, M.B.; Śmiglewicz, A.; Niewielski, G. The effect of strain rate on the mechanical properties and microstructure of the high-Mn steel after dynamic deformation tests. Arch. Metall. Mater. 2015, 60, 577–580. [Google Scholar] [CrossRef] [Green Version]
- Sugimoto, K.; Usui, N.; Kobayashi, M.; Hashimoto, S. Effects of volume fraction and stability of retained austenite on ductility of TRIP-aided dual-phase steels. ISIJ Int. 1992, 32, 1311–1318. [Google Scholar] [CrossRef]
- De Cooman, B.C. Structure—Properties relationship in TRIP steels containing carbide-free bainite. Solid State Mater. Sci. 2004, 8, 285–303. [Google Scholar] [CrossRef]
- Jacques, P.J.; Girault, E.; Catlin, T.; Geerlofs, N.; Kop, T.; Van der Zwaag, S.; Delannay, F. Bainite transformation of low carbon Mn-Si TRIP-assisted multiphase steels: Influence of silicon content on cementite precipitation and austenite retention. Mater. Sci. Eng. A 1999, 273, 475–479. [Google Scholar] [CrossRef]
- Girault, E.; Mertens, A.; Jacques, P.; Hubaert, Y.; Verlinden, B.; Van Humbeeck, J. Comparison of the effect of silicon and aluminium on the tensile behavior of multiphase TRIP-assisted steels. Scr. Mater. 2001, 44, 885–892. [Google Scholar] [CrossRef]
- Grajcar, A.; Radwanski, K. Microstructural comparison of the thermomechanically treated and cold deformed Nb-microalloyed TRIP steel. Mater. Tehnol. 2014, 48, 679–683. [Google Scholar]
- Javaheria, V.; Khodaie, N.; Kaijalainen, A.; Porter, D. Effect of niobium and phase transformation temperature on the microstructure and texture of a novel 0.40% C thermomechanically processed steel. Mater. Charact. 2018, 124, 295–308. [Google Scholar] [CrossRef]
- Opiela, M.; Grajcar, A. Hot deformation behavior and softening kinetics of Ti-V-B microalloyed steels. Arch. Civ. Mech. Eng. 2012, 12, 327–333. [Google Scholar] [CrossRef]
- Wang, C.; Ding, H.; Tang, Z.Y.; Zhang, J. Effect of isothermal bainitic processing on microstructures and mechanical properties of novel Mo and Nb microalloyed TRIP steel. Ironmak. Steelmak. 2015, 42, 9–16. [Google Scholar] [CrossRef]
- Hausmann, K.; Krizan, D.; Spiradek-Hahn, K.; Pichler, A.; Werner, E. The influence of Nb on transformation behavior and mechanical properties of TRIP-assisted bainitic–ferritic sheet steels. Mater. Sci. Eng. A 2013, 588, 142–150. [Google Scholar] [CrossRef]
- Pereloma, E.V.; Timokhina, I.B.; Hodgson, P.D. Transformation behaviour in thermomechanically processed C-Mn-Si TRIP steels with and without Nb. Mater. Sci. Eng. A 1999, 273–275, 448–452. [Google Scholar] [CrossRef]
- Kammouni, A.; Saikaly, W.; Dumont, M.; Marteaud, C.; Banod, X.; Charai, A. Effect of the bainitic transformation temperature on retained austenite fraction and stability in Ti microalloyed TRIP steels. Mater. Sci. Eng. A 2009, 518, 89–96. [Google Scholar] [CrossRef]
- Sozańska-Jędrasik, L.; Mazurkiewicz, J.; Borek, W.; Matus, K. Carbides analysis of the high strength and low density Fe-Mn-Al-Si steels. Arch. Metall. Mater. 2018, 63, 265–276. [Google Scholar]
- Gorka, J.; Opiela, M. Structure and properties of high-strength low-alloy steel melted by the laser beam. Mater. Perform. Charact. 2019, 8, 1–10. [Google Scholar] [CrossRef]
- Gorka, J.; Janicki, D.; Fidali, M.; Jamrozik, W. Thermographic assessment of the HAZ properties and structure of thermomechanically treated steel. Int. J. Thermophys. 2017, 38, 183. [Google Scholar] [CrossRef] [Green Version]
- Grajcar, A.; Grzegorczyk, B.; Różański, M.; Stano, S. Microstructural aspects of bifocal laser welding of TRIP steels. Arch. Metall. Mater. 2017, 62, 611–618. [Google Scholar] [CrossRef] [Green Version]
- Tang, T.Y.; Huang, J.N.; Ding, H.; Cai, Z.H.; Misra, R.D.K. Austenite stability and mechanical properties of a low-alloyed ECAPed TRIP-aided steel. Mater. Sci. Eng. A 2018, 724, 95–102. [Google Scholar] [CrossRef]
- Wang, X.D.; Huang, B.X.; Rong, Y.H.; Wang, L. Microstructures and stability of retained austenite in TRIP steels. Mater. Sci. Eng. A 2006, 438–440, 300–305. [Google Scholar] [CrossRef]
- Tang, Z.; Ding, H.; Ding, H.; Cal, M.; Du, L. Effect of prestrain on microstructures and properties of Si-AI-Mn TRIP steel sheet with niobium. J. Iron Steel Res. Int. 2010, 17, 59–65. [Google Scholar] [CrossRef]
- Zhang, S.; Findley, K.O. Quantitative assessment of the effects of microstructure on the stability of retained austenite in TRIP steels. Acta Mater. 2013, 61, 1895–1903. [Google Scholar] [CrossRef]
- Das, A.; Ghosh, M.; Tarafder, S.; Sivaprasad, S.; Chakrabarti, D. Micromechanisms of deformation in dual phase steels at high strain rates. Mater. Sci. Eng. A 2017, 680, 249–258. [Google Scholar] [CrossRef]
- Gao, G.; Zhang, B.; Cheng, C.; Zhao, P.; Zhang, H.; Bai, B. Very high cycle fatigue behaviors of bainite/martensite multiphase steel treated by quenching-partitioning-tempering process. Int. J. Fatigue 2016, 92, 203–210. [Google Scholar] [CrossRef]
- Shen, Y.F.; Qiu, L.N.; Sun, X.; Zuo, L.; Liaw, P.K.; Raabe, D. Effects of retained austenite volume fraction, morphology, and carbon content on strength and ductility of nanostructured TRIP-assisted steels. Mater. Sci. Eng. A 2015, 636, 551–564. [Google Scholar] [CrossRef] [Green Version]
- Zhou, Q.; Qian, L.; Tan, J.; Meng, J.; Zhang, F. Inconsistent effects of mechanical stability of retained austenite on ductility and toughness of transformation-induced plasticity steels. Mater. Sci. Eng. A 2013, 578, 370–376. [Google Scholar] [CrossRef]
- Xu, Y.; Hu, Z.; Zou, Y.; Tan, X.; Han, D.; Chen, S.; Ma, D.; Misra, R.D.K. Effect of two-step intercritical annealing on microstructure and mechanical properties of hot-rolled medium manganese TRIP steel containing δ-ferrite. Mater. Sci. Eng. A 2017, 688, 40–55. [Google Scholar] [CrossRef]
- Sugimoto, K.; Misu, M.; Kobayashi, M.; Shirasawa, H. Effects of second phase morphology on retained austenite morphology and tensile properties in a TRIP-aided dual phase steel sheet. ISIJ Int. 1993, 33, 775–782. [Google Scholar] [CrossRef] [Green Version]
- Timokhina, I.; Hodgson, P.; Pereloma, E.V. Effect of microstructure on the stability of retained austenite in transformation-induced-plasticity steels. Metall. Mater. Trans. A 2004, 35, 2331–2341. [Google Scholar] [CrossRef] [Green Version]
- Pereloma, E.V.; Gazder, A.A.; Timokhina, I.B. Retained austenite: Transformation-Induced Plasticity. In Encyclopedia of Iron, Steel, and Their Alloys; Taylor and Francis: New York, NY, USA, 2016; pp. 3088–3103. [Google Scholar] [CrossRef] [Green Version]
- Grajcar, A.; Krztoń, H. Effect of isothermal bainitic transformation temperature on retained austenite fraction in C-Mn-Si-Al-Nb-Ti TRIP-type steel. J. Achiev. Mater. Manuf. Eng. 2009, 35, 169–176. [Google Scholar]
- Jimenez-Melero, E.; Van Dijk, N.; Zhao, L.; Sietsma, J.; Offerman, S. Characterization of individual retained austenite grains and their stability in low-alloyed TRIP steels. Scr. Mater. 2007, 55, 6713–6723. [Google Scholar] [CrossRef]
Figure 1.
Parameters of thermomechanical processing of investigated steel.
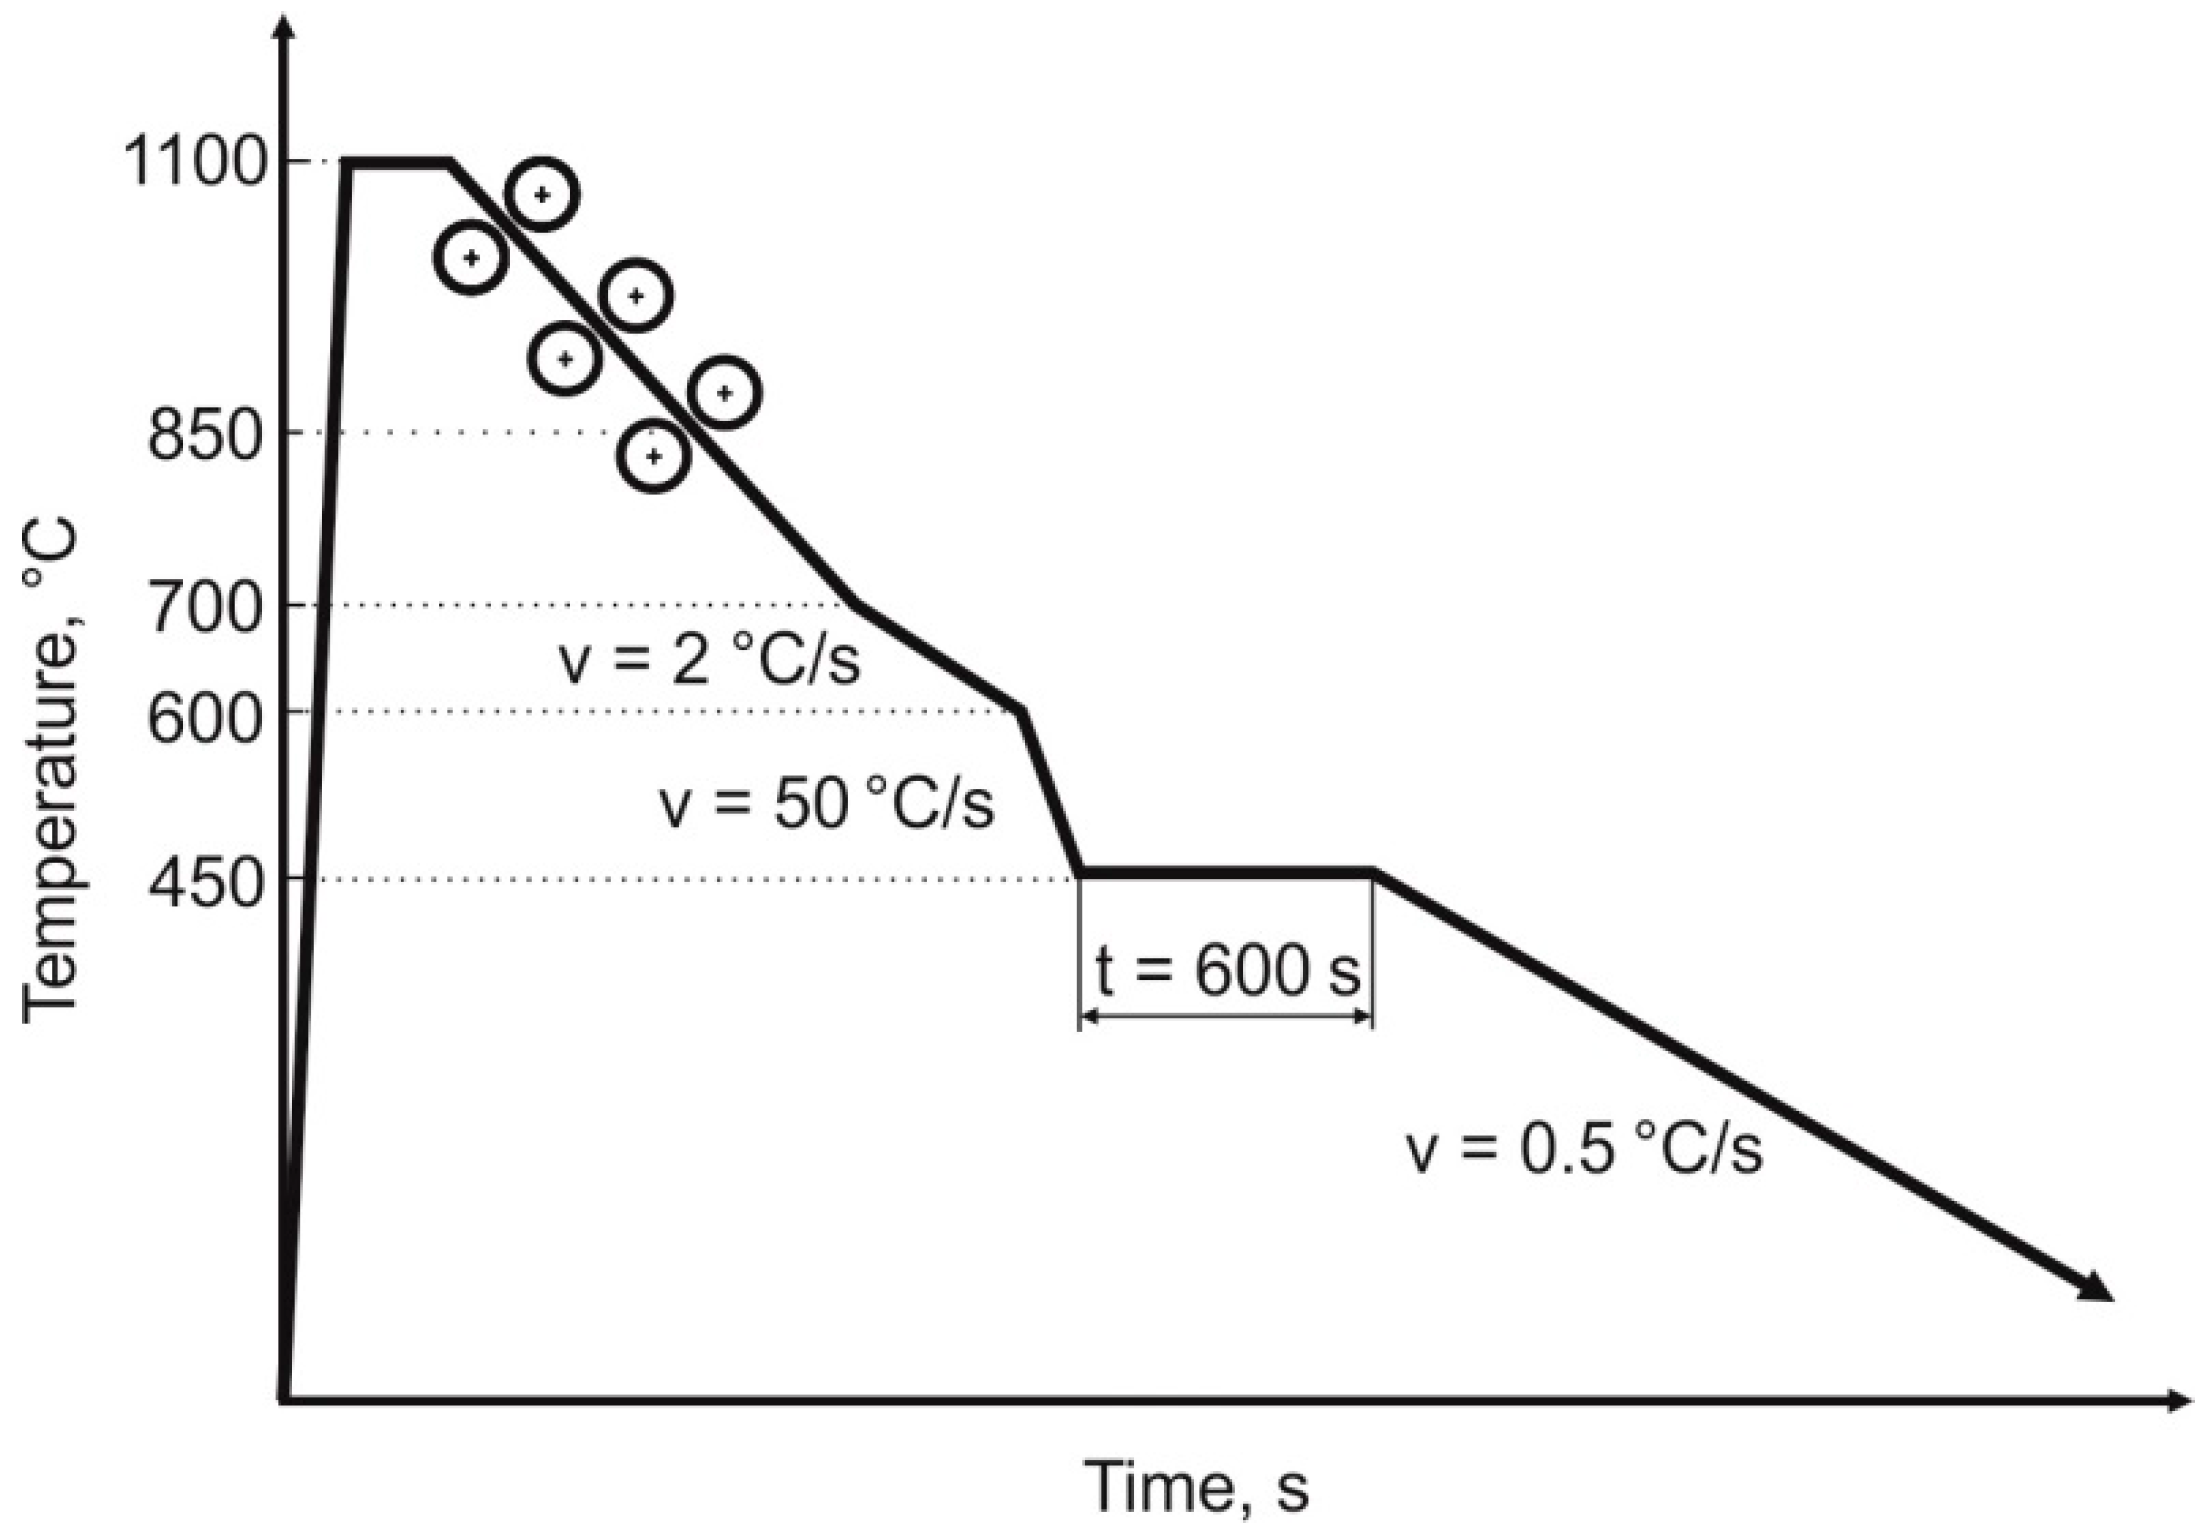
Figure 2.
Initial microstructure of the steel: (a) Optical micrograph, (b) digitally processed optical micrograph, (c) binary map of retained austenite, (d) combined map: ferrite—gray, retained austenite—white, bainite—blue, grain boundaries—black.
Figure 2.
Initial microstructure of the steel: (a) Optical micrograph, (b) digitally processed optical micrograph, (c) binary map of retained austenite, (d) combined map: ferrite—gray, retained austenite—white, bainite—blue, grain boundaries—black.

Figure 3.
Statistical evaluation of RA parameters: (a) average quantity of RA grains per 100 μm2, (b) average surface fraction of RA.
Figure 3.
Statistical evaluation of RA parameters: (a) average quantity of RA grains per 100 μm2, (b) average surface fraction of RA.
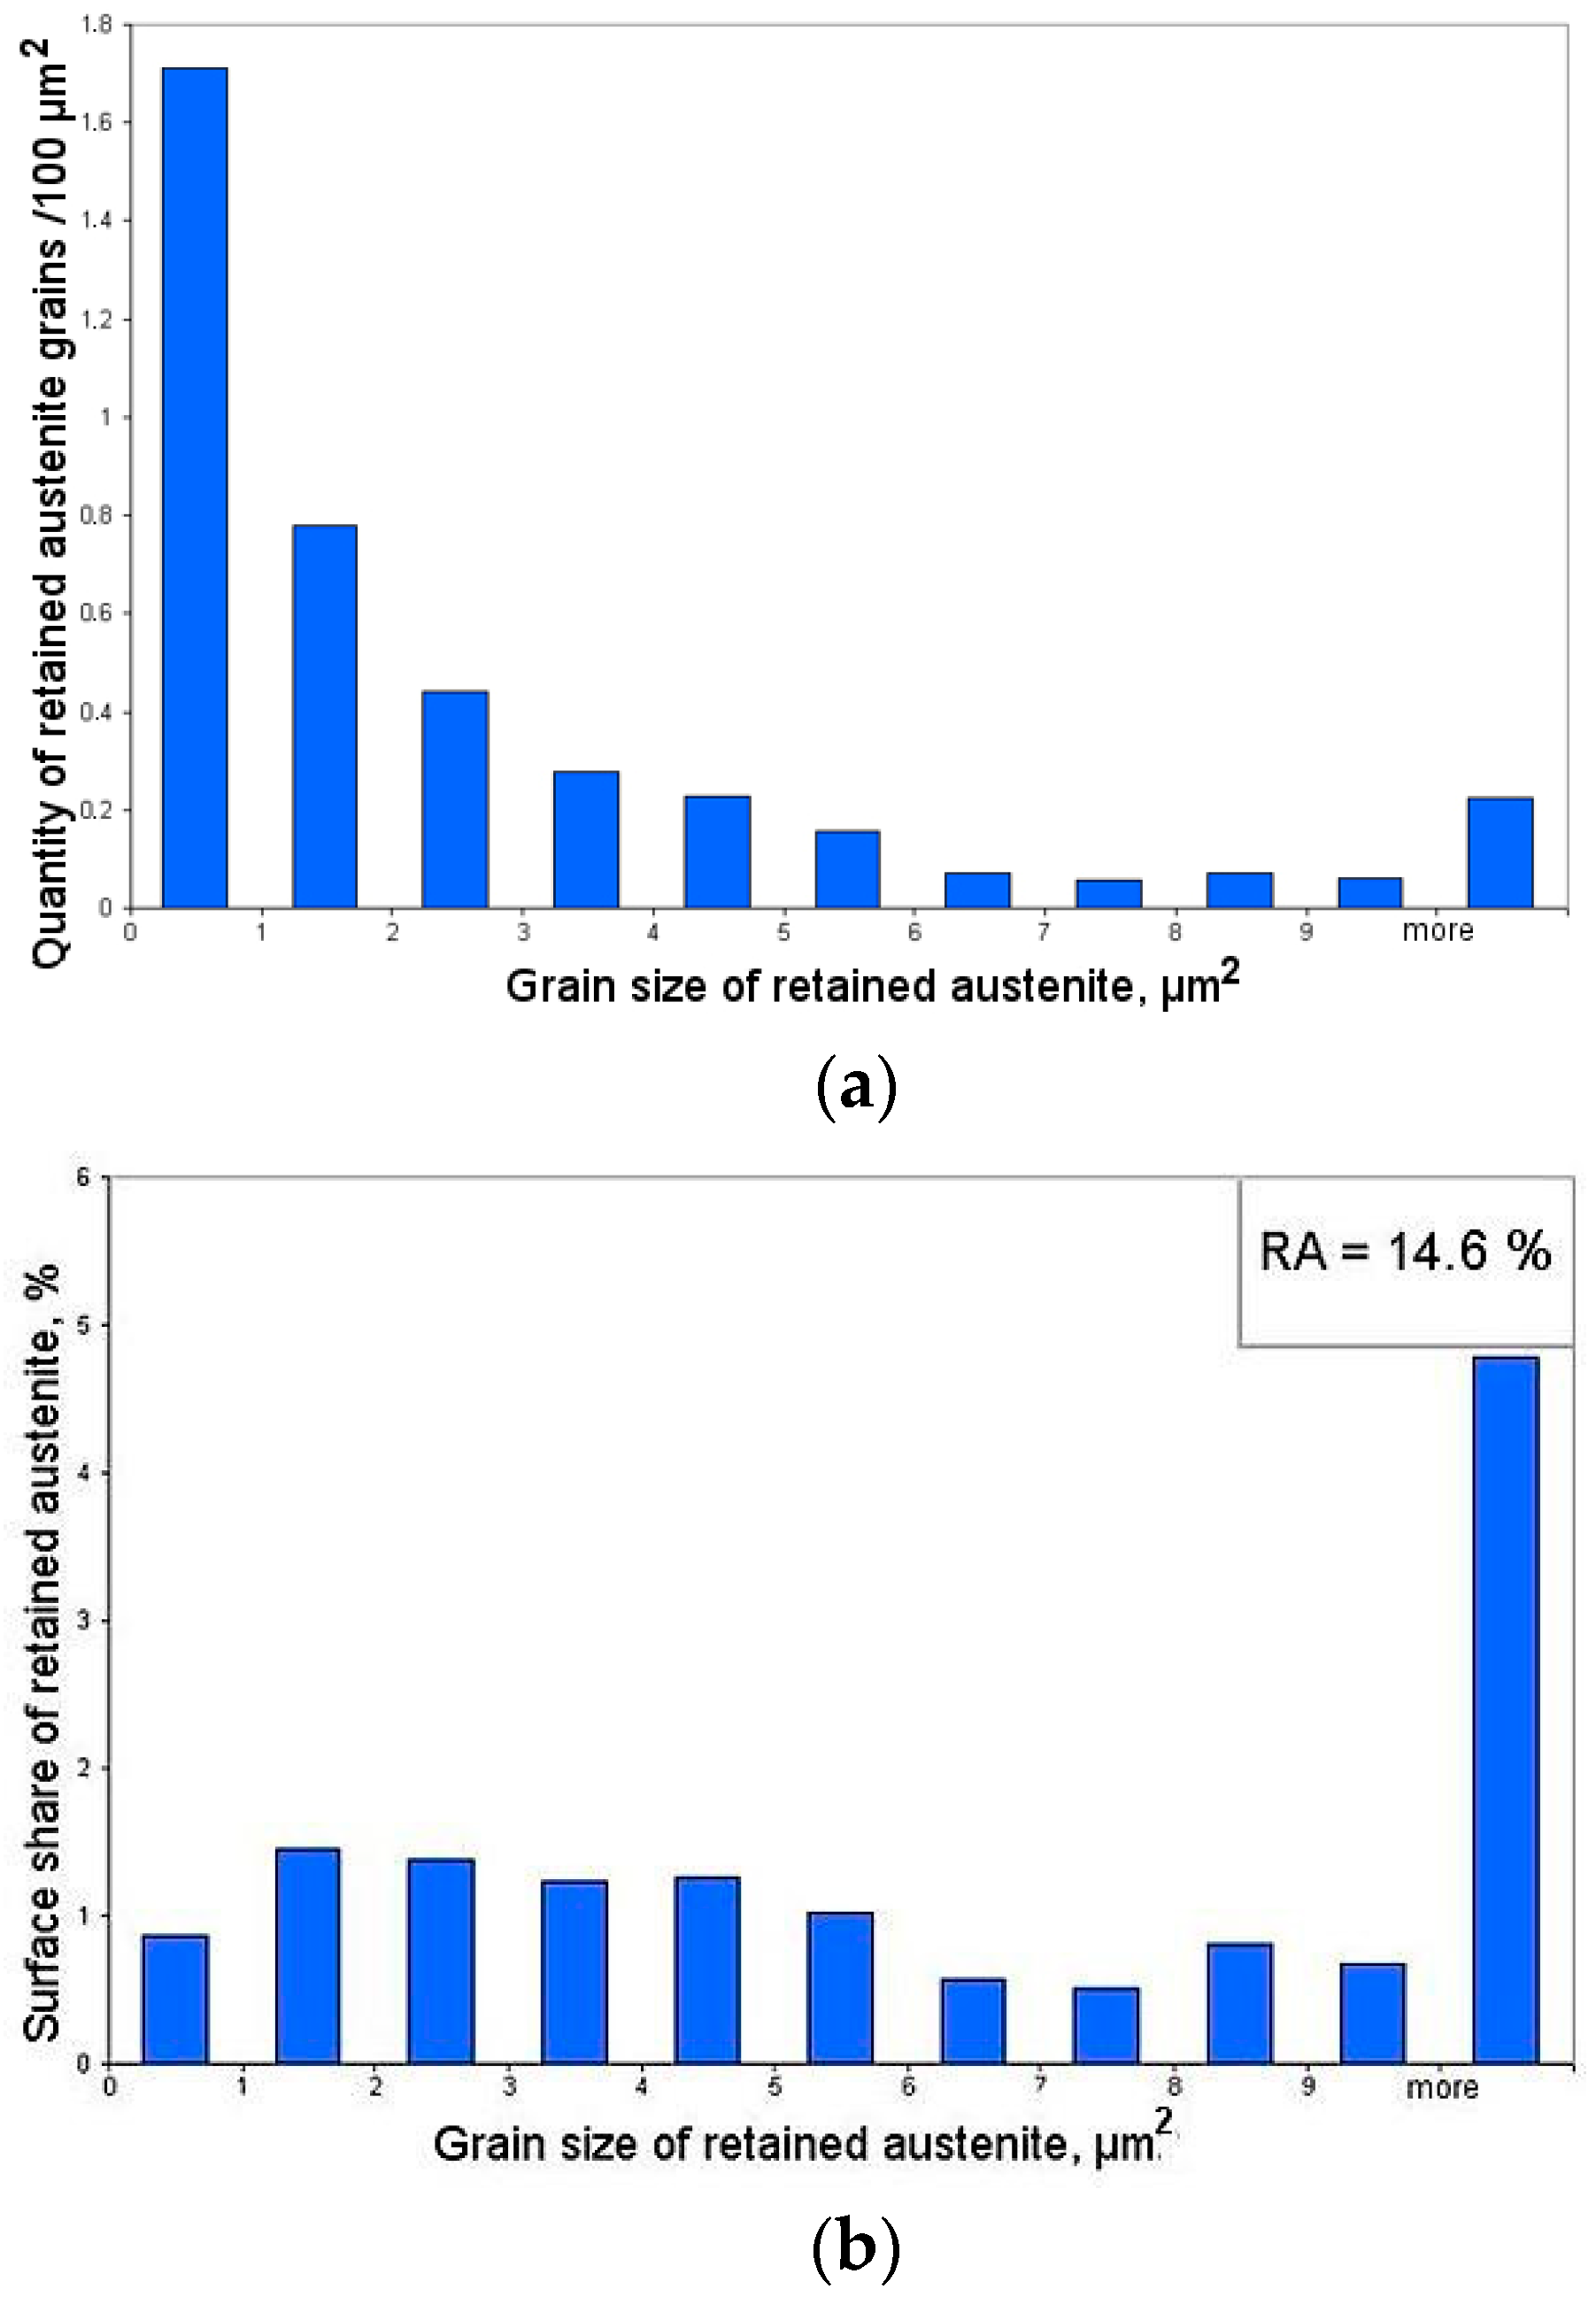
Figure 4.
Microstructure of the steel deformed to 5% strain: (a) optical micrograph, (b) binary map of retained austenite, (c) binary map of martensite, (d) binary map of retained austenite (white) and martensite (blue).
Figure 4.
Microstructure of the steel deformed to 5% strain: (a) optical micrograph, (b) binary map of retained austenite, (c) binary map of martensite, (d) binary map of retained austenite (white) and martensite (blue).
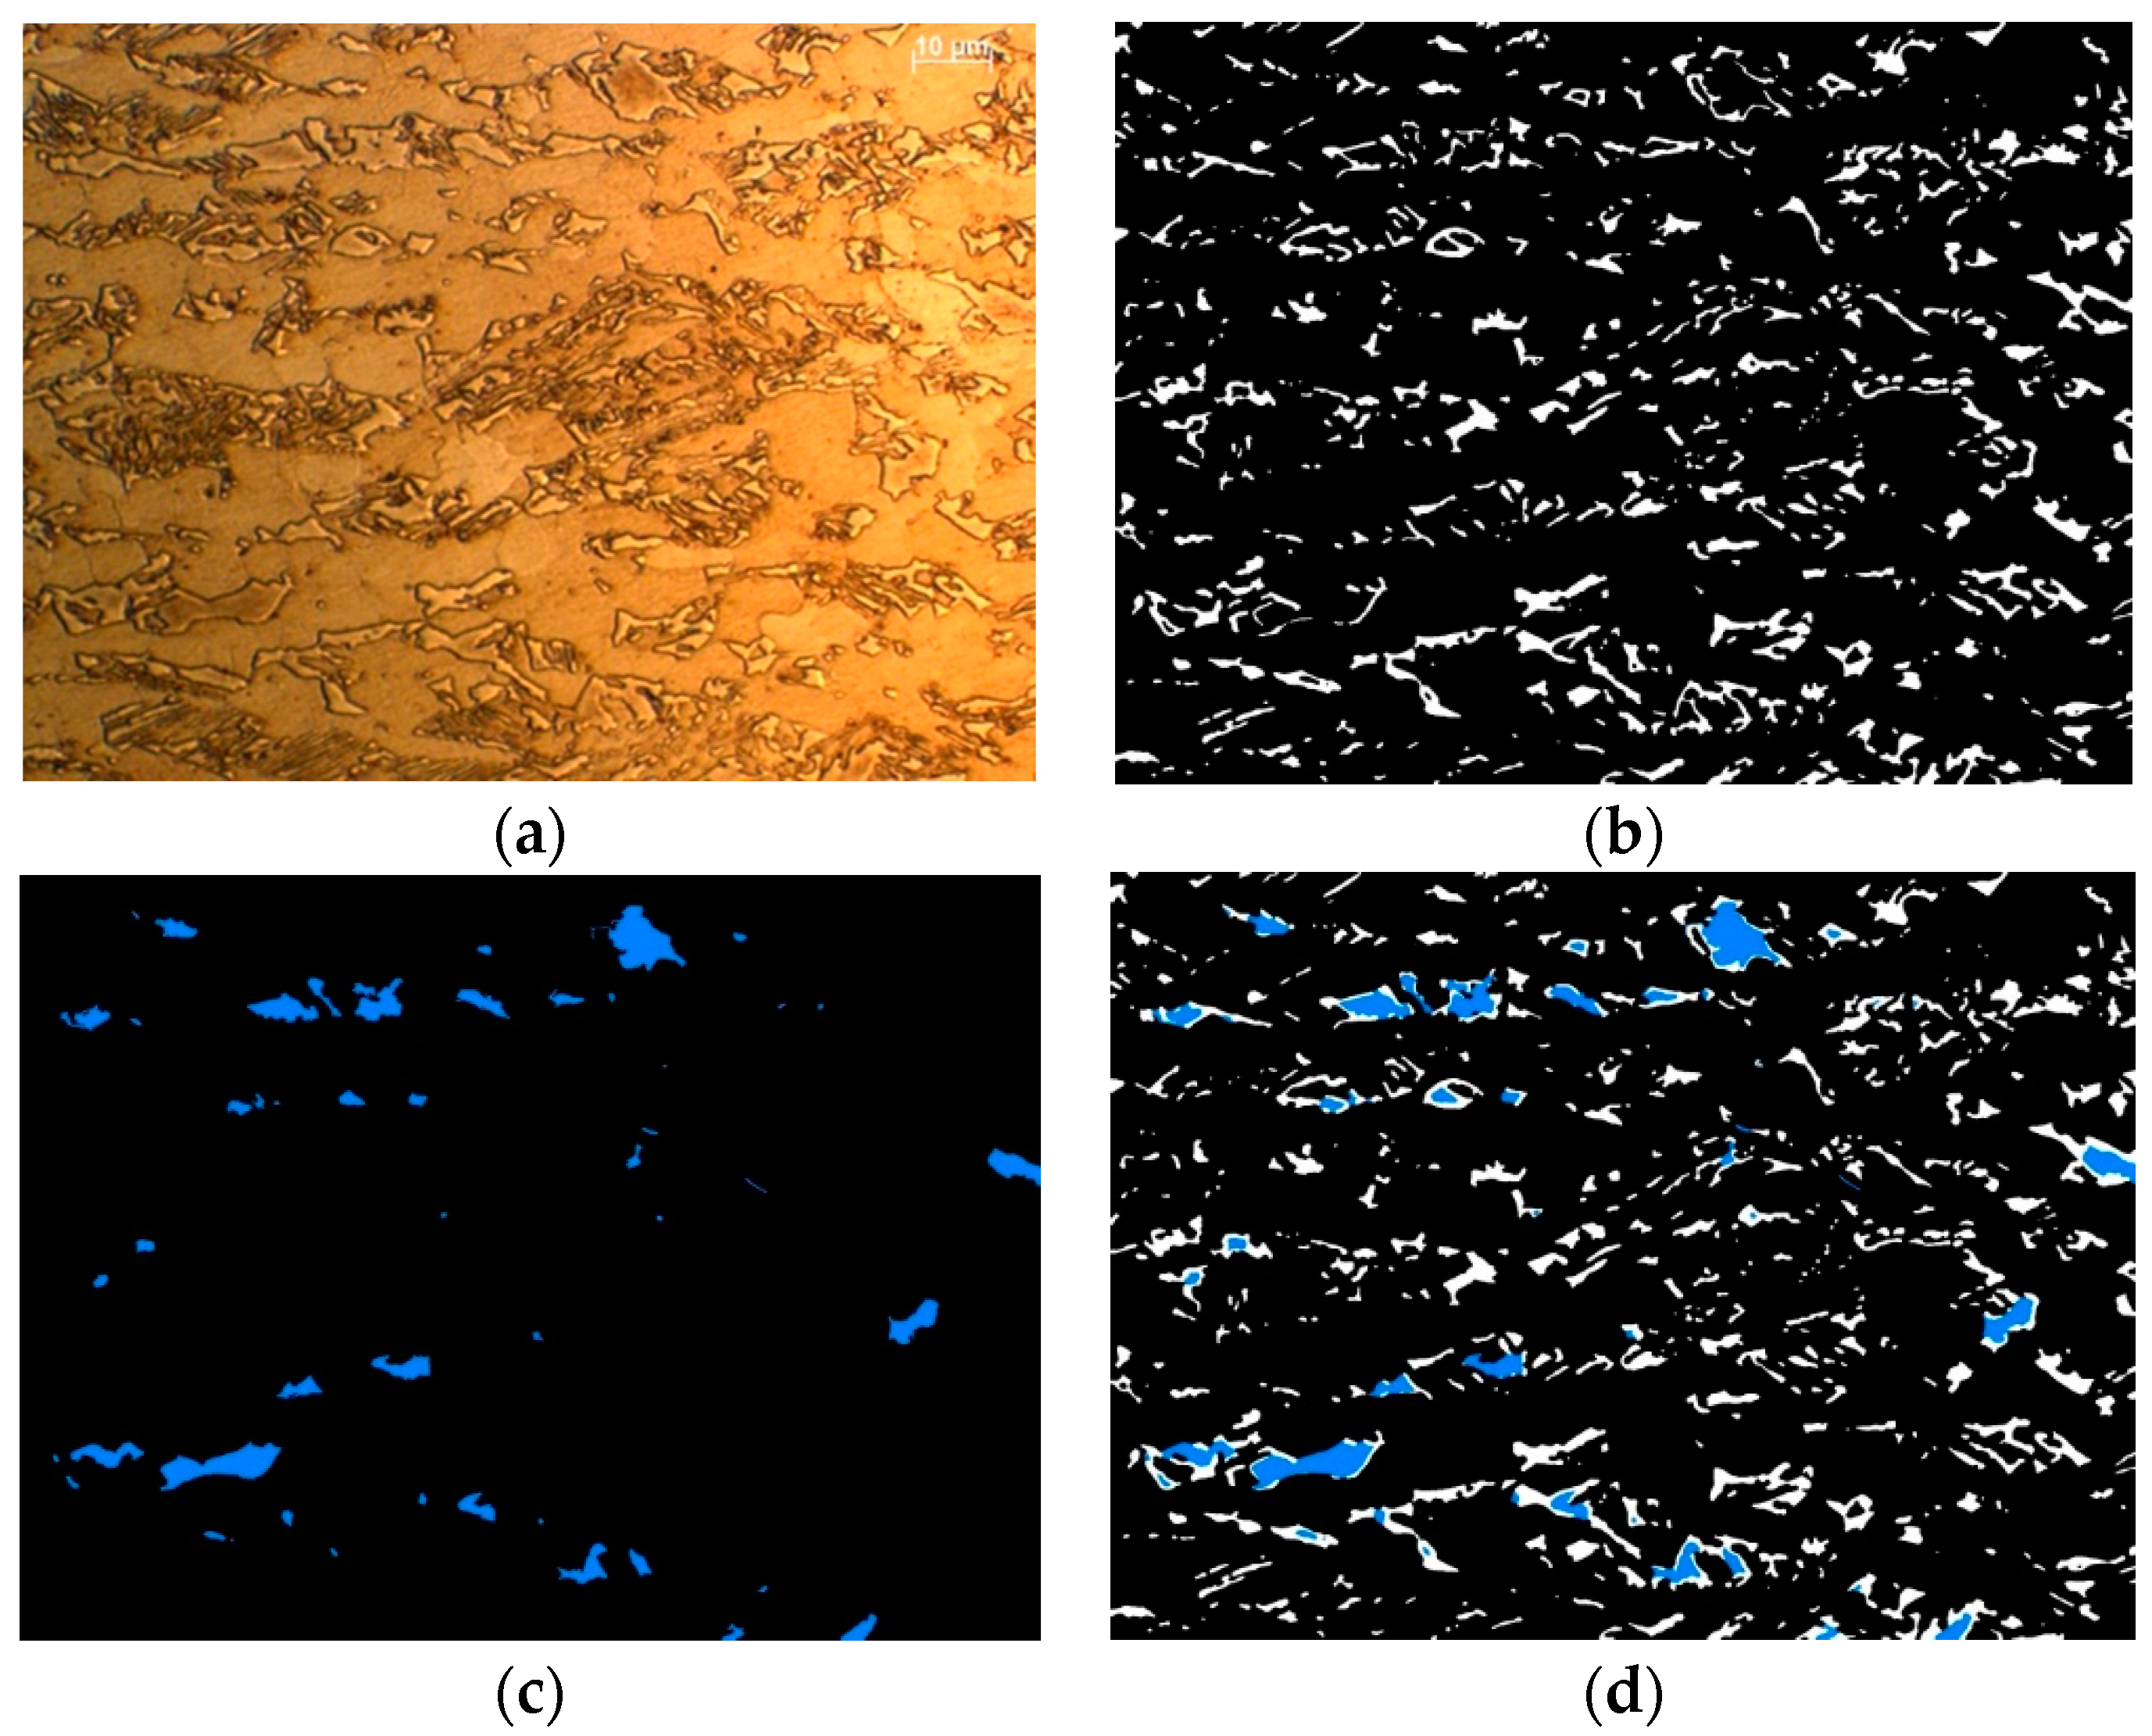
Figure 5.
Statistical evaluation of RA parameters at 5% strain: (a) average quantity of RA grains per 100 μm2, (b) average surface fraction of RA.
Figure 5.
Statistical evaluation of RA parameters at 5% strain: (a) average quantity of RA grains per 100 μm2, (b) average surface fraction of RA.

Figure 6.
Quantity of retained austenite grains transformed into martensite for the specimen deformed to 5% strain.
Figure 6.
Quantity of retained austenite grains transformed into martensite for the specimen deformed to 5% strain.
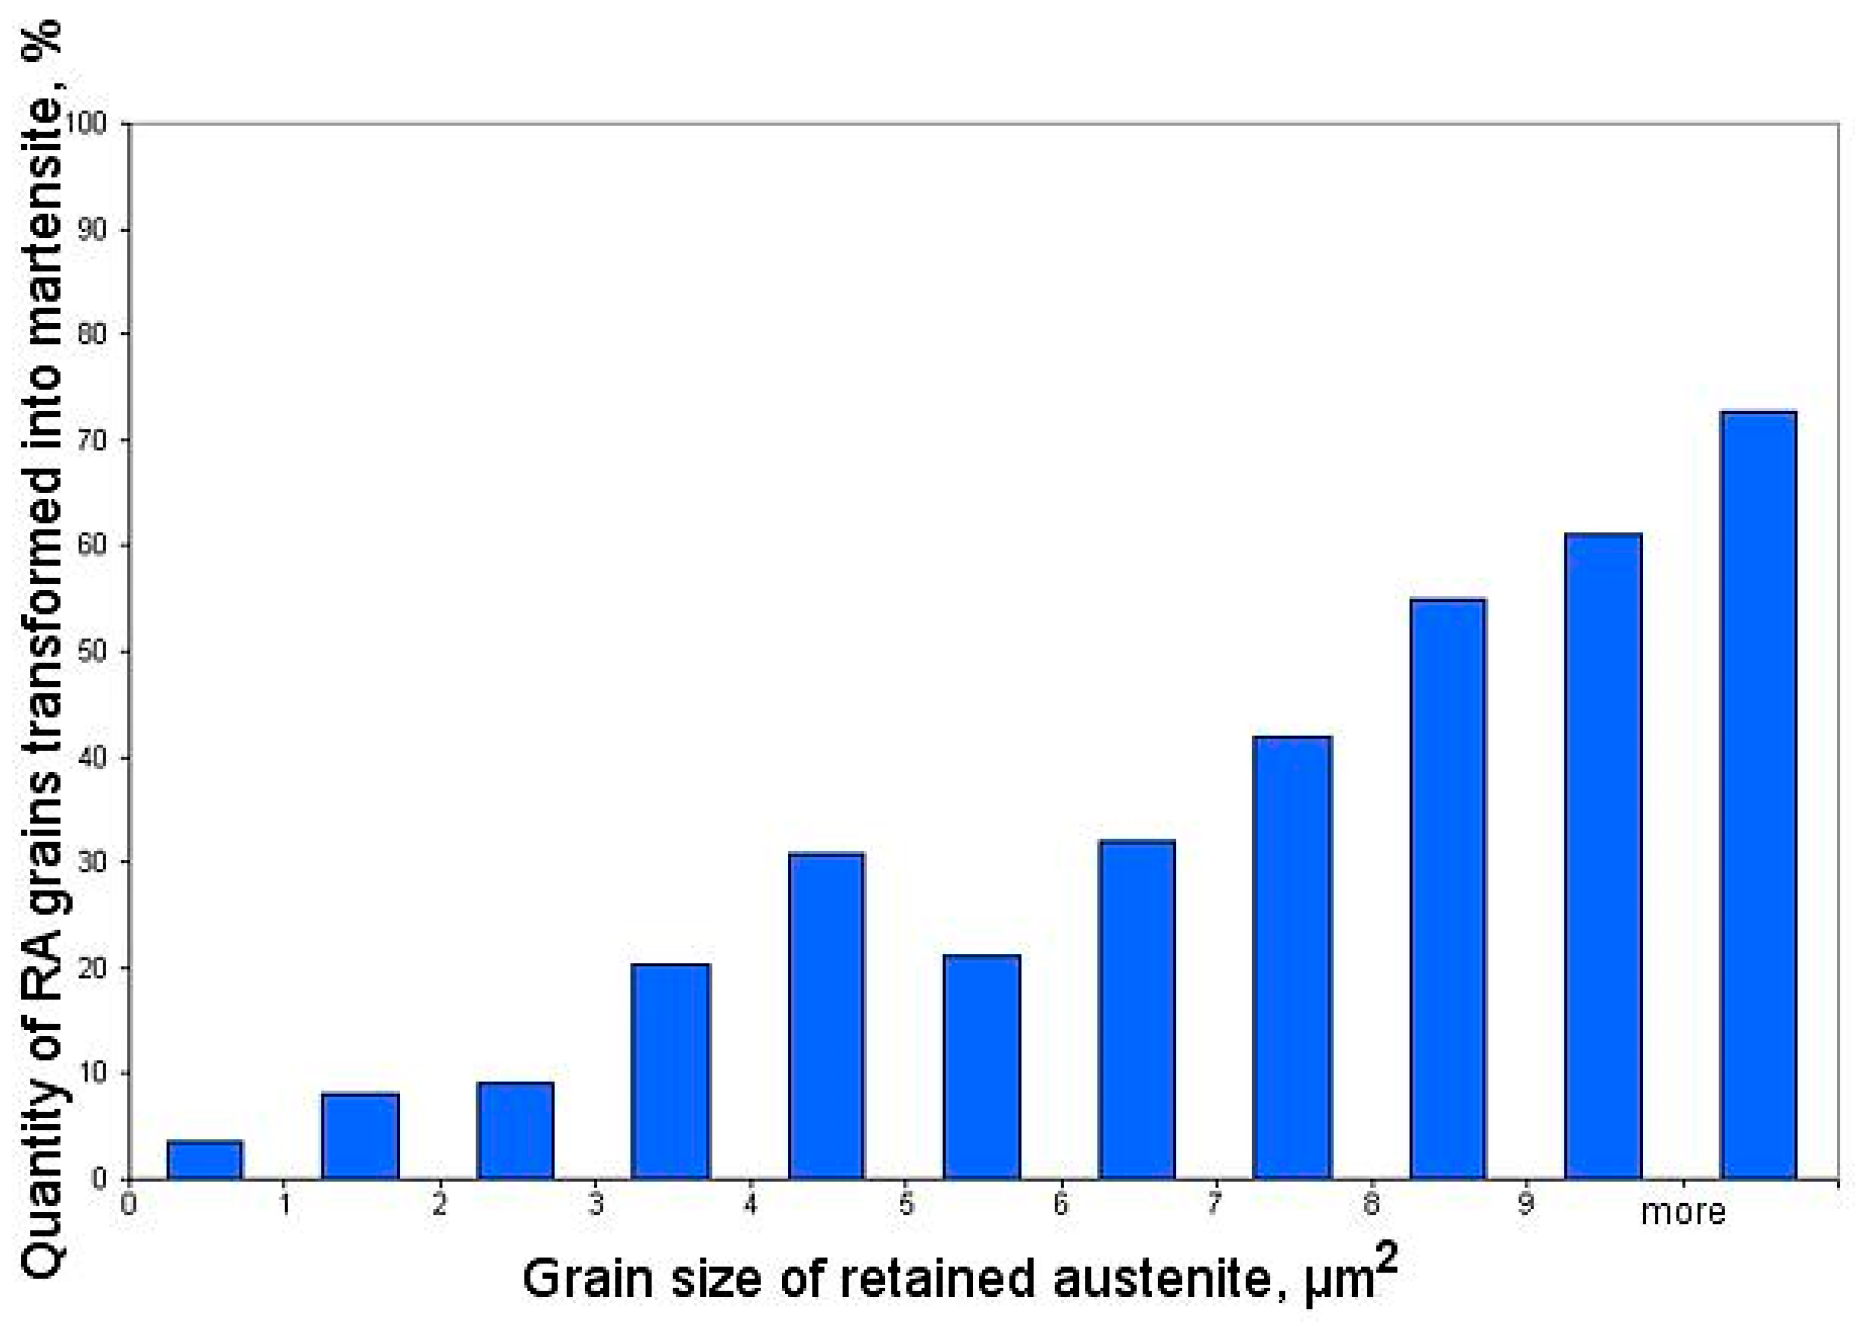
Figure 7.
Microstructure of investigated steel deformed to 10% strain: (a) optical micrograph, (b) binary map of retained austenite, (c) binary map of martensite, (d) binary map of retained austenite (white) and martensite (blue).
Figure 7.
Microstructure of investigated steel deformed to 10% strain: (a) optical micrograph, (b) binary map of retained austenite, (c) binary map of martensite, (d) binary map of retained austenite (white) and martensite (blue).

Figure 8.
Statistical evaluation of RA parameters at 10% strain: (a) average quantity of RA grains per 100 μm2, (b) average surface share of RA.
Figure 8.
Statistical evaluation of RA parameters at 10% strain: (a) average quantity of RA grains per 100 μm2, (b) average surface share of RA.
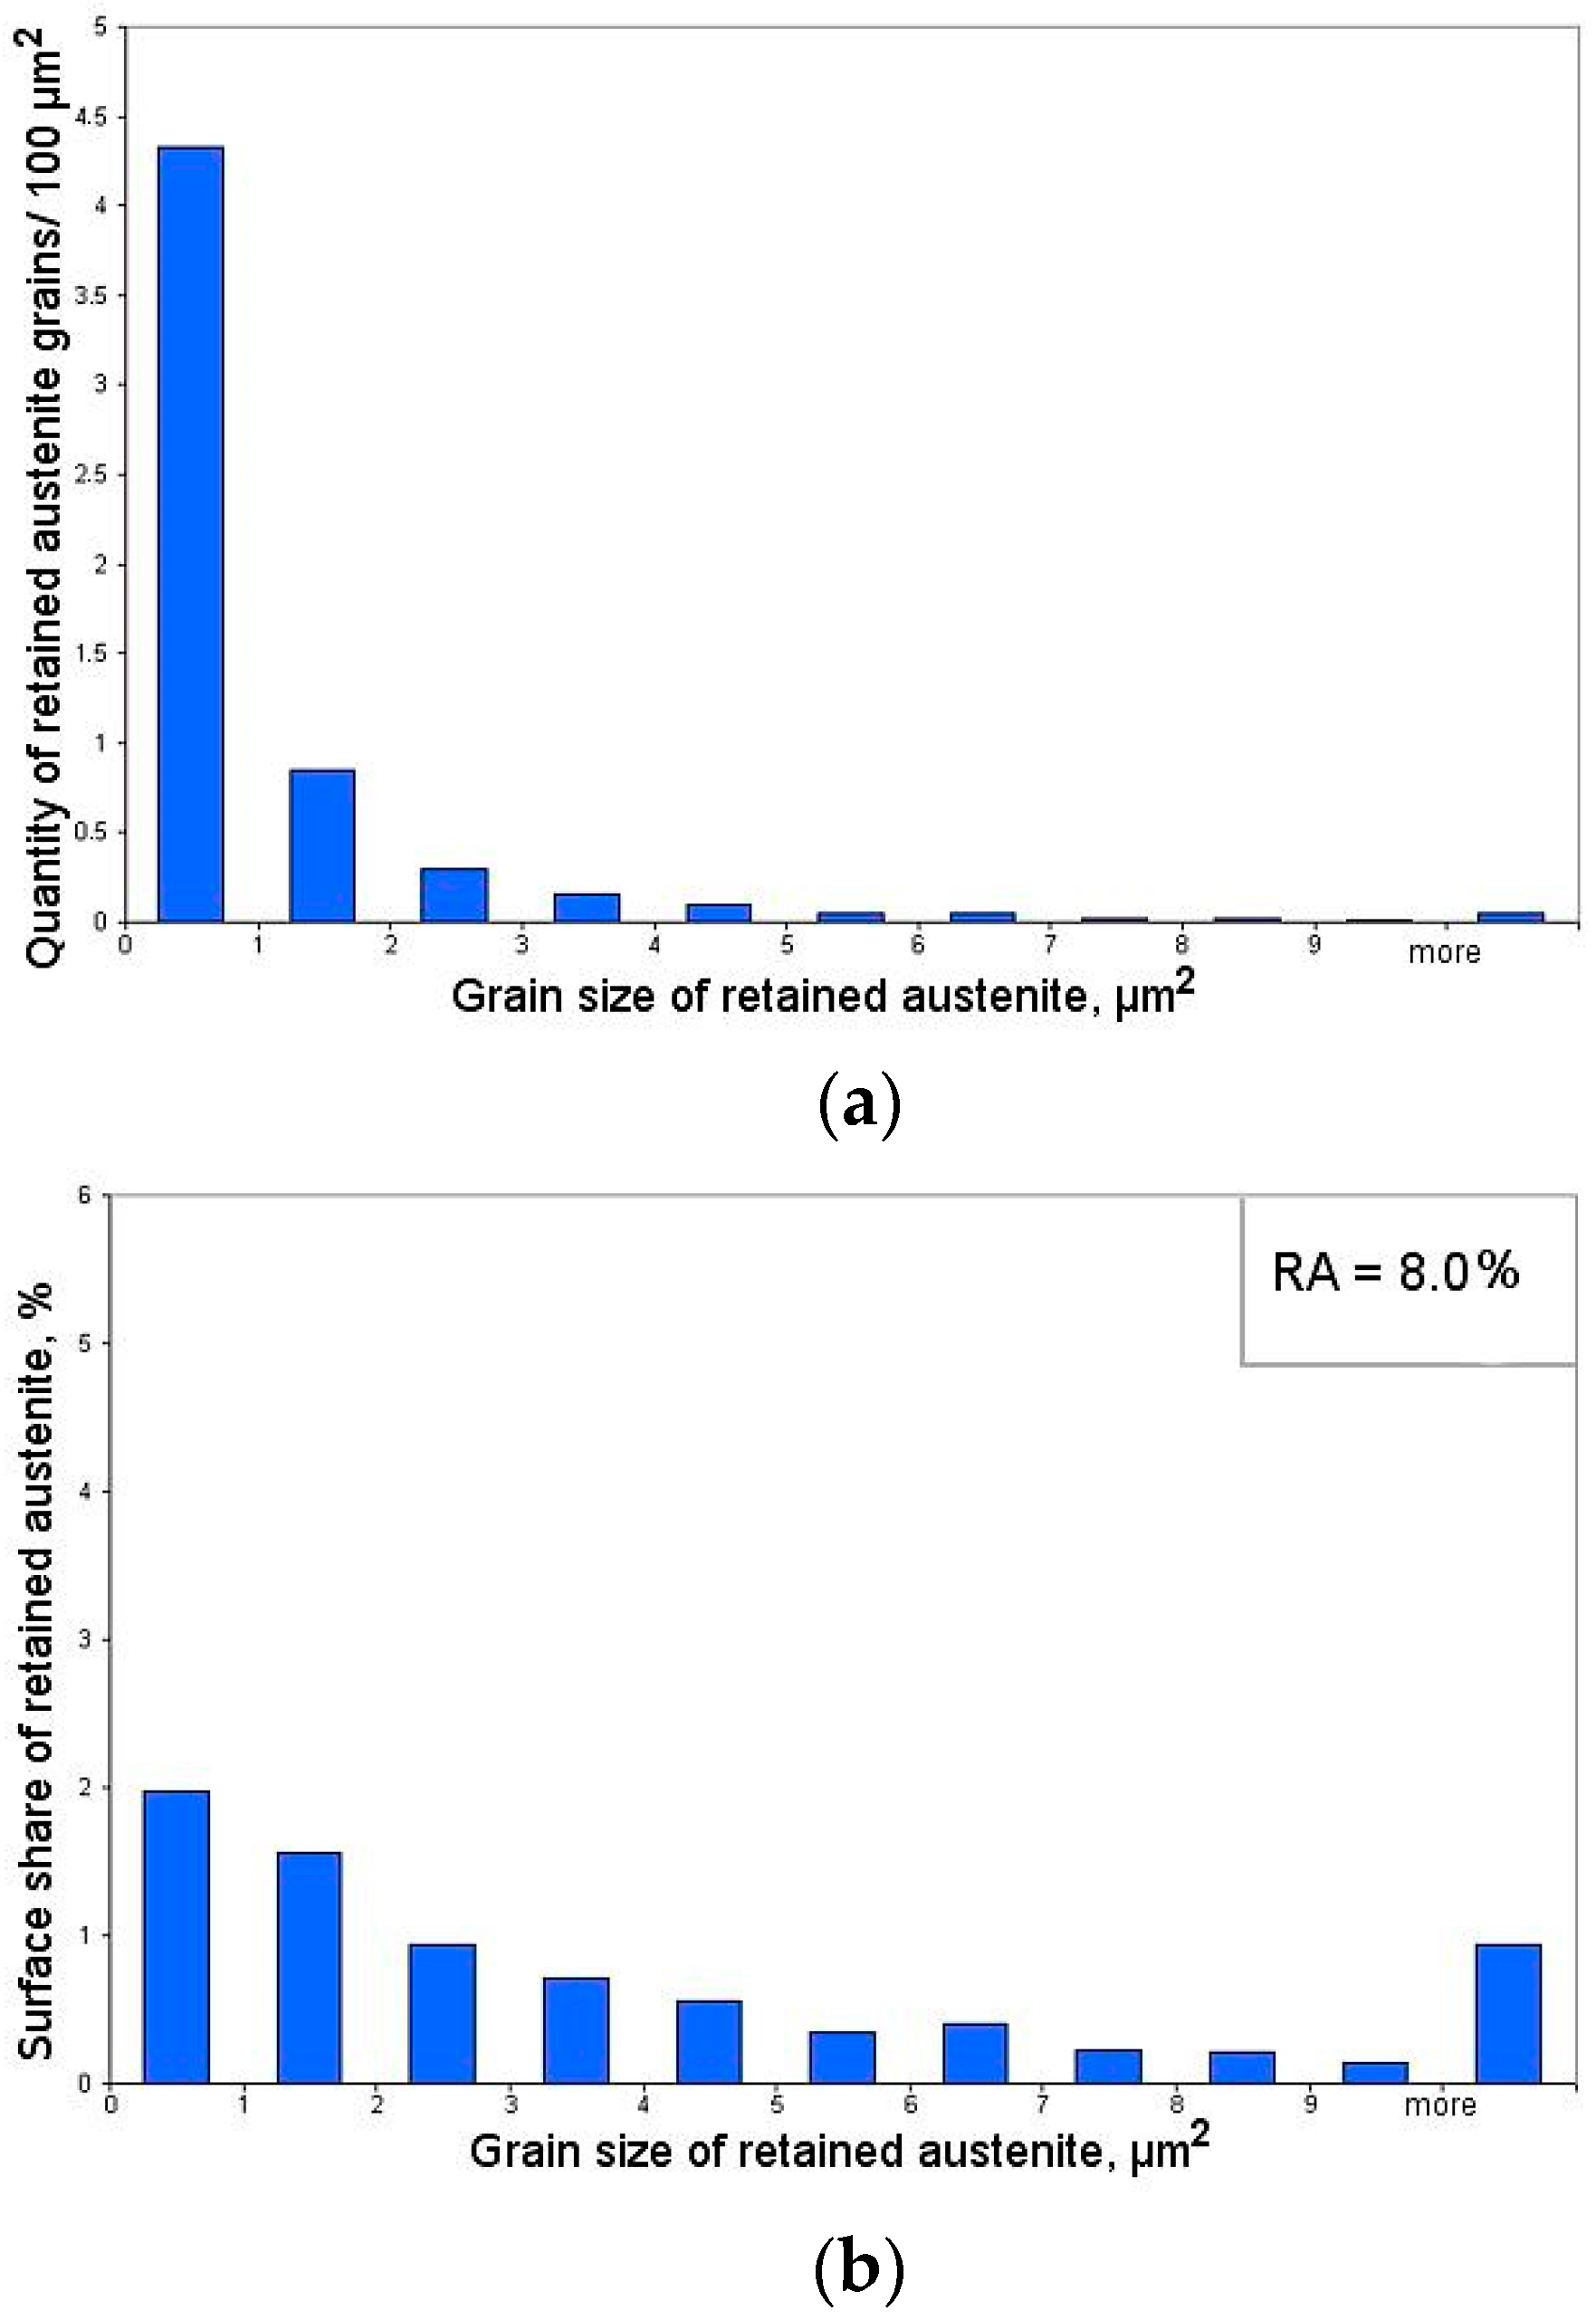
Figure 9.
Quantity of retained austenite grains transformed into martensite for the specimen deformed to 10% strain.
Figure 9.
Quantity of retained austenite grains transformed into martensite for the specimen deformed to 10% strain.
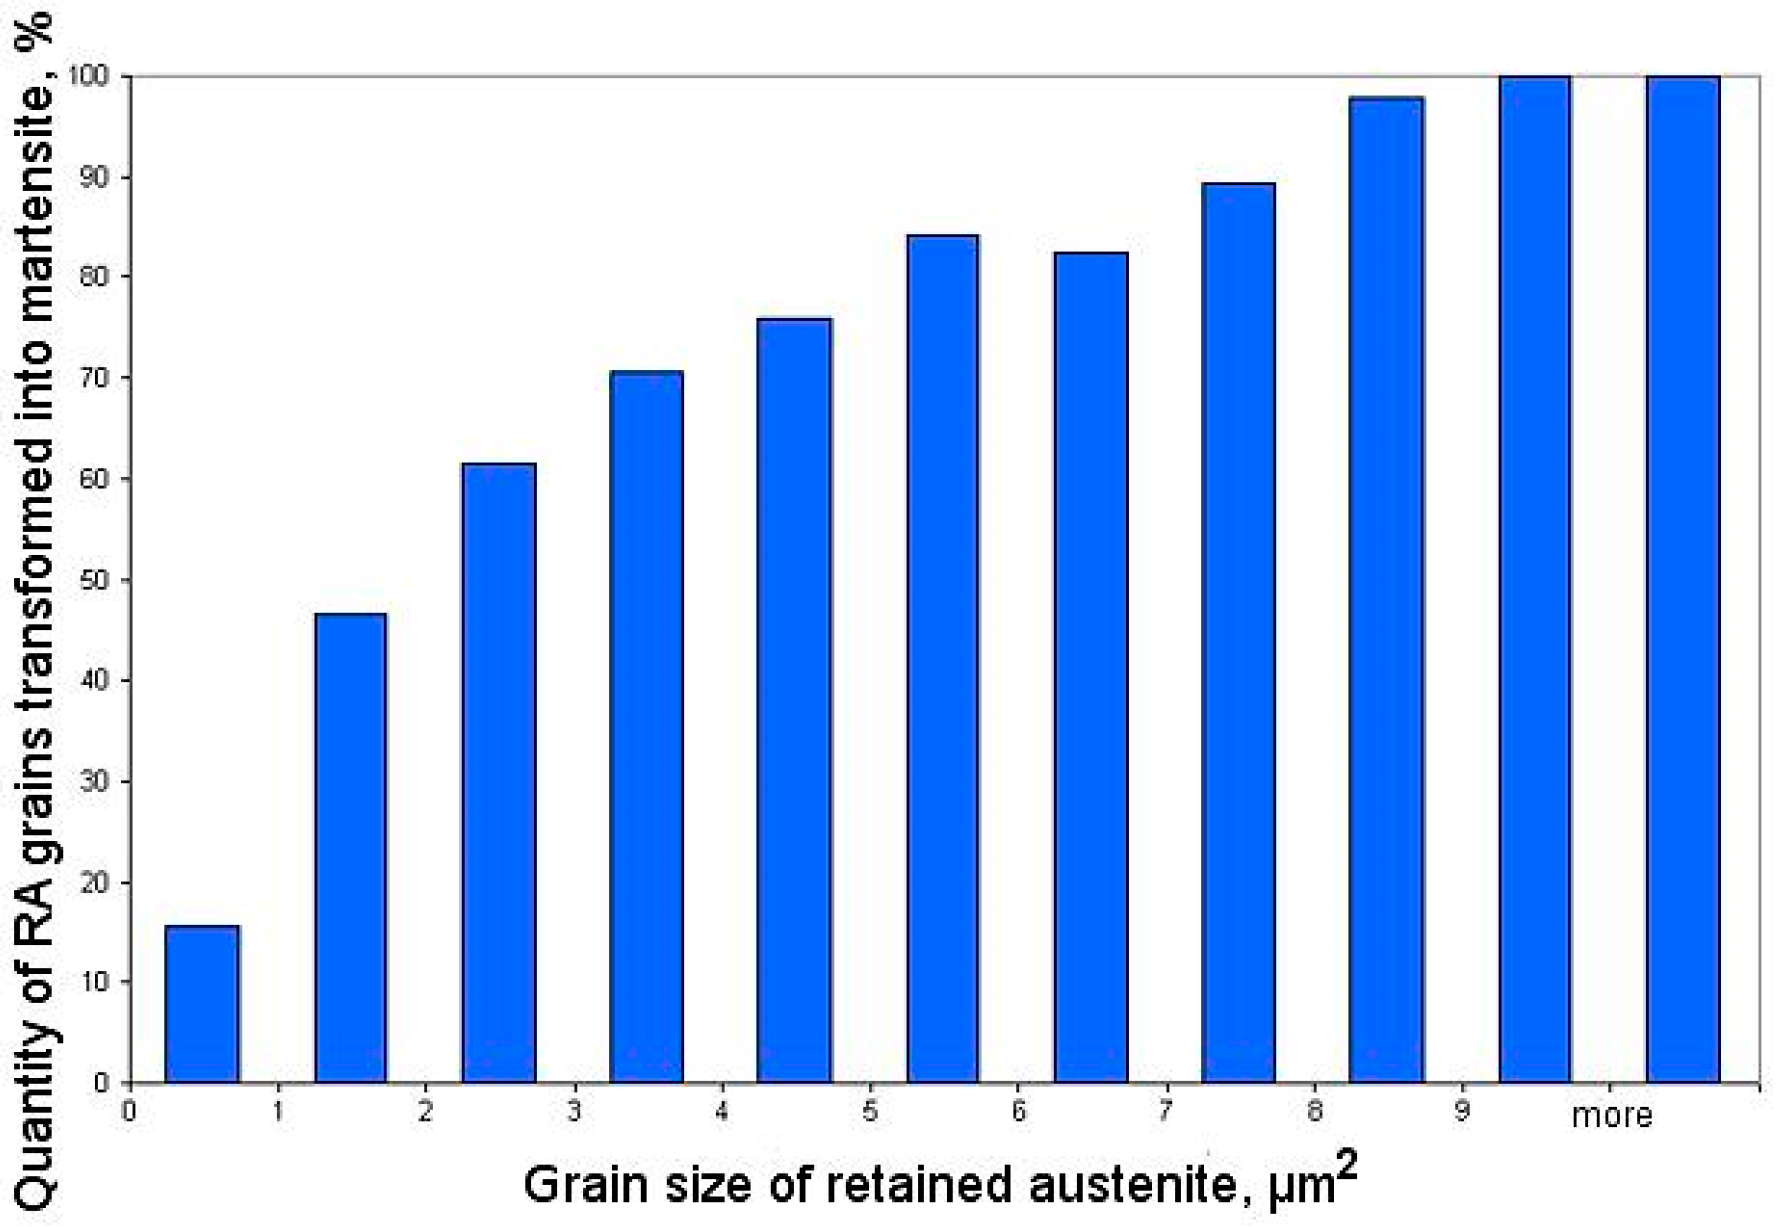
Figure 10.
Binary map of retained austenite (white) and martensite (blue) for the specimens deformed to: (a) 15% strain, (b) 25% strain (a rupture of the sample).
Figure 10.
Binary map of retained austenite (white) and martensite (blue) for the specimens deformed to: (a) 15% strain, (b) 25% strain (a rupture of the sample).
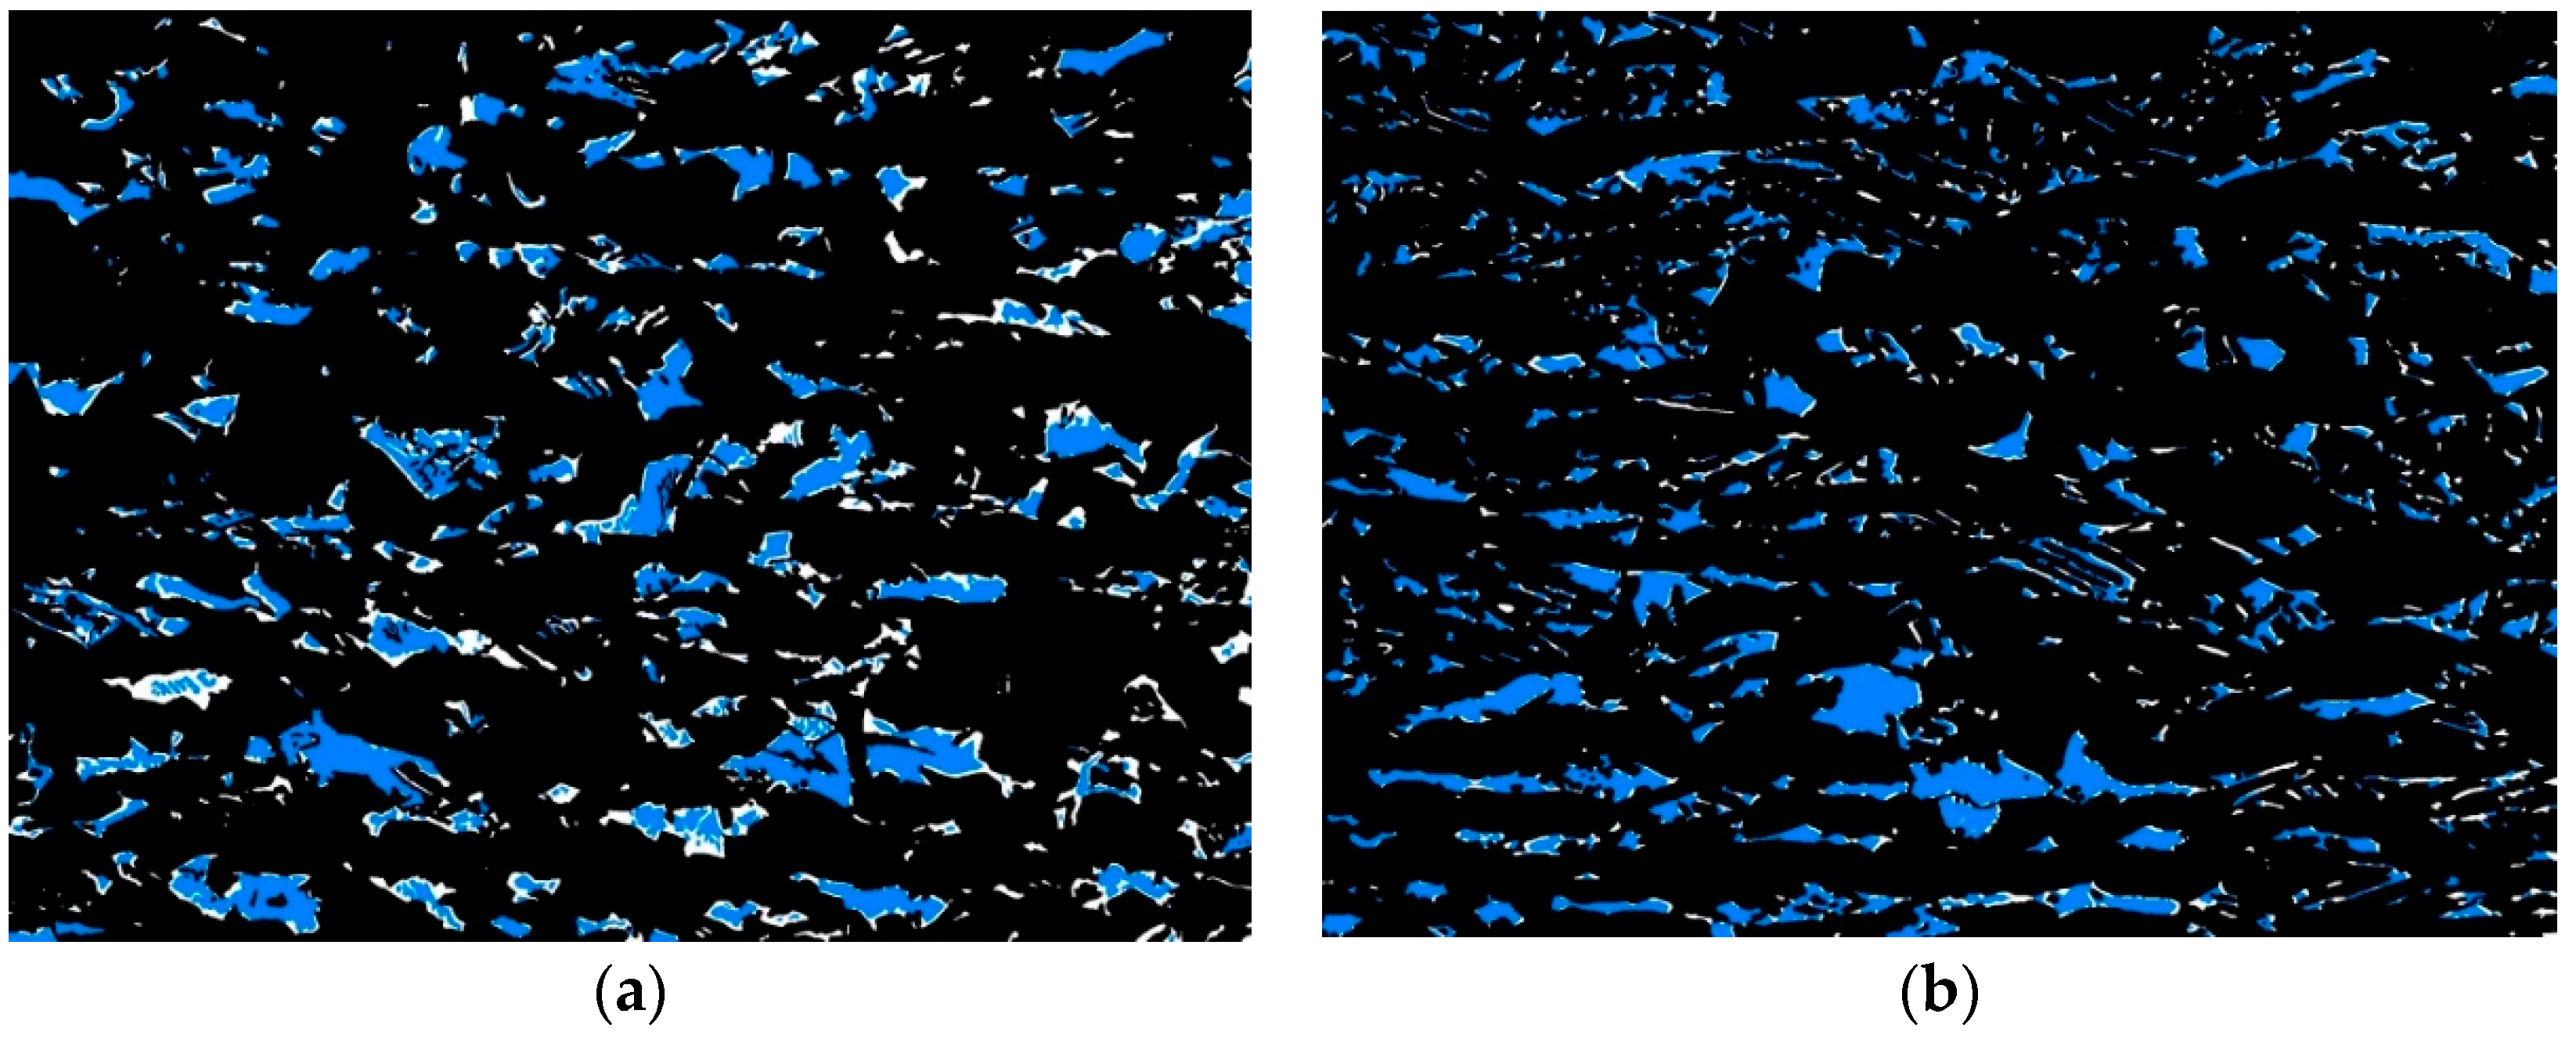
Figure 11.
EBSD analysis of steel deformed to 5% strain: (a) image quality (IQ) map, (b) image quality (IQ) map displaying the boundary character, (c) phase distribution map—retained austenite as green.
Figure 11.
EBSD analysis of steel deformed to 5% strain: (a) image quality (IQ) map, (b) image quality (IQ) map displaying the boundary character, (c) phase distribution map—retained austenite as green.

Figure 12.
EBSD analysis of steel deformed to 10% strain: (a) image quality (IQ) map, (b) image quality (IQ) map displaying the boundary character, (c) phase distribution map—retained austenite as green.
Figure 12.
EBSD analysis of steel deformed to 10% strain: (a) image quality (IQ) map, (b) image quality (IQ) map displaying the boundary character, (c) phase distribution map—retained austenite as green.

Figure 13.
EBSD analysis of steel deformed to 25% strain (a rupture of the sample): (a) image quality (IQ) map, (b) image quality (IQ) map displaying the boundary character, (c) phase distribution map—retained austenite as green.
Figure 13.
EBSD analysis of steel deformed to 25% strain (a rupture of the sample): (a) image quality (IQ) map, (b) image quality (IQ) map displaying the boundary character, (c) phase distribution map—retained austenite as green.
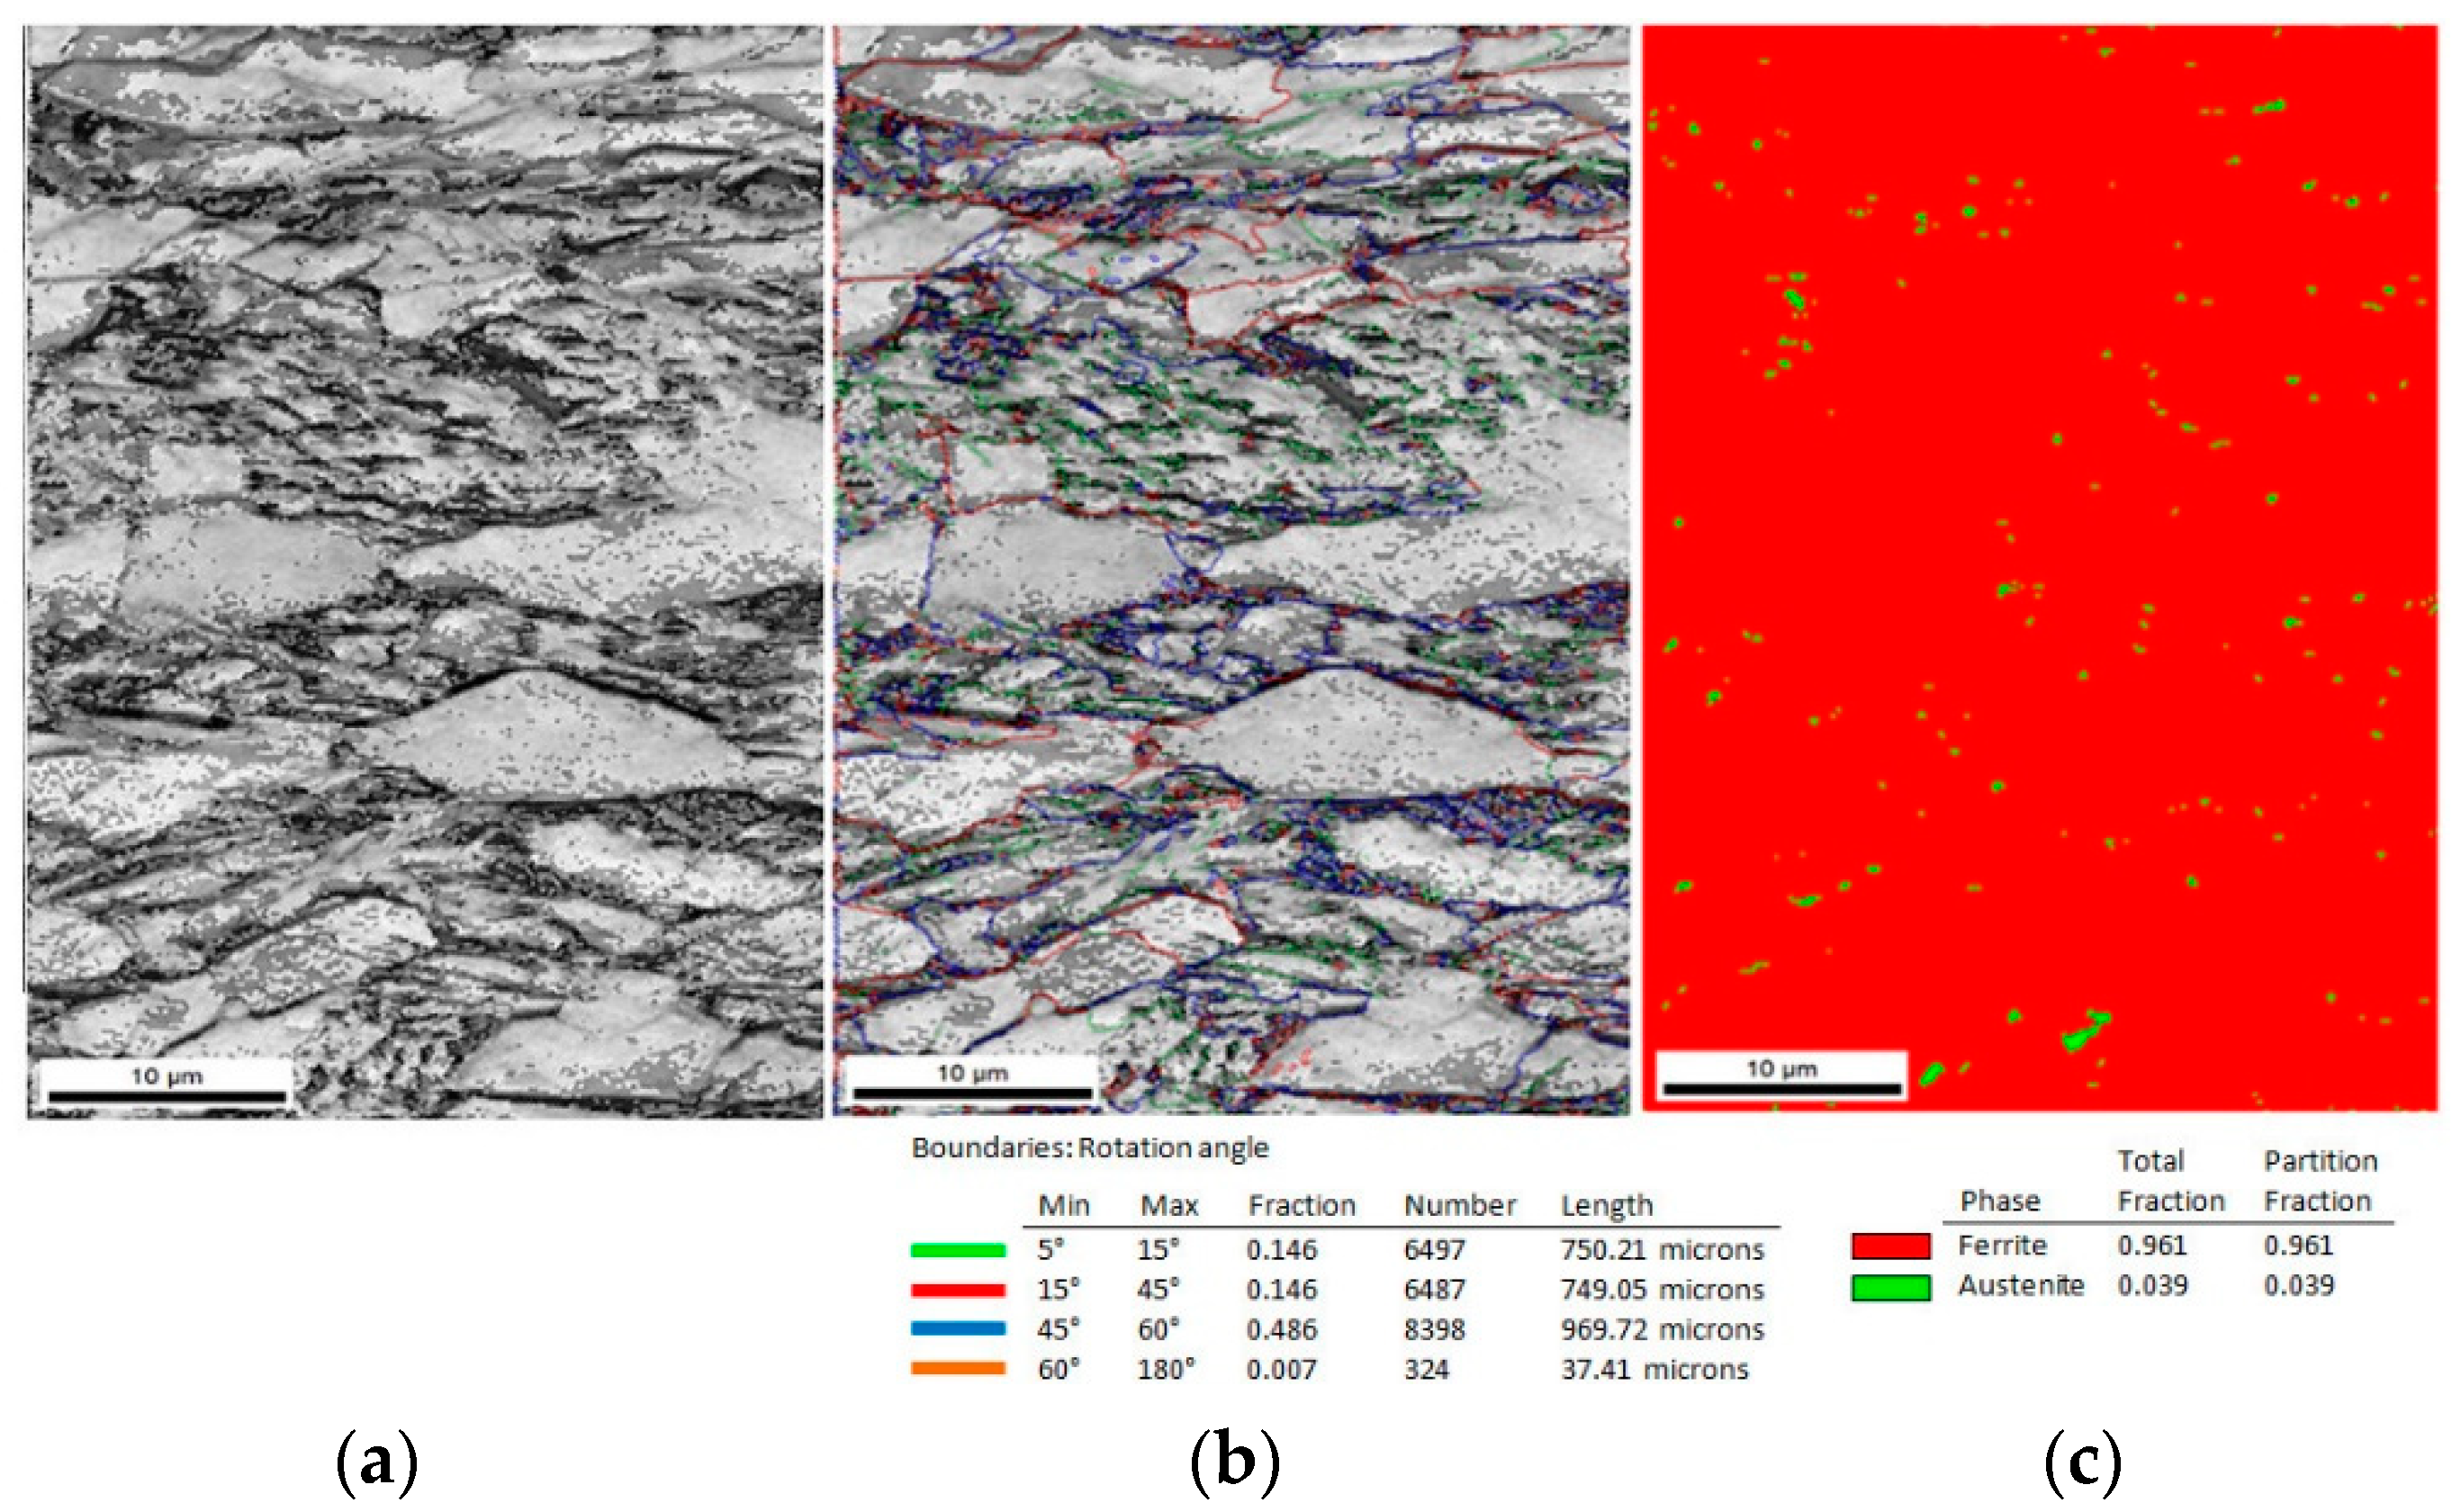
Figure 14.
Change in the amount of retained austenite for defined grain size as a function of strain level.
Figure 14.
Change in the amount of retained austenite for defined grain size as a function of strain level.
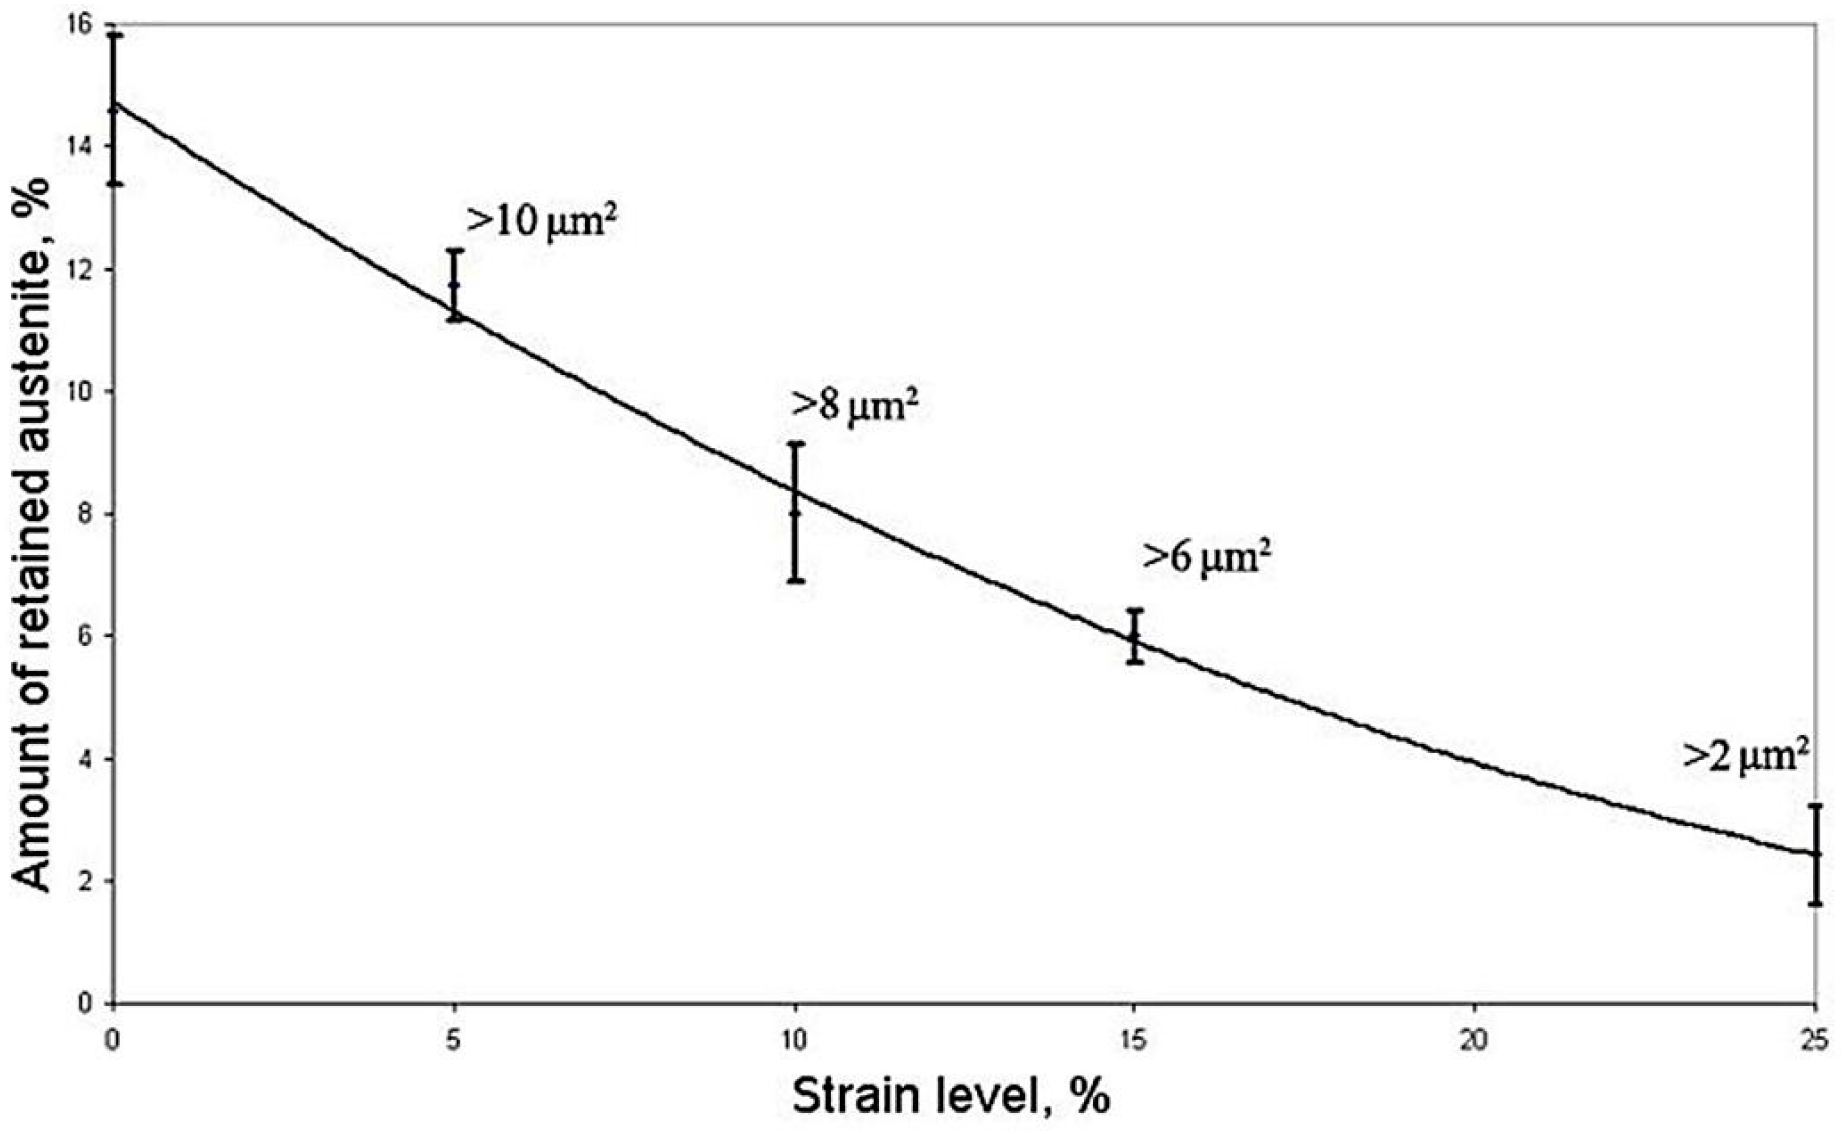
Figure 15.
Distribution of grain size and the surface share of retained austenite as a function of strain level.
Figure 15.
Distribution of grain size and the surface share of retained austenite as a function of strain level.

Figure 16.
Correlation between grain size of retained austenite and its tendency to martensitic transformation as a function of strain level.
Figure 16.
Correlation between grain size of retained austenite and its tendency to martensitic transformation as a function of strain level.

Table 1.
Chemical composition of the investigated steel, wt.%.
| C | Mn | Si | Al | Nb | Ti | P | S | N | O |
|---|---|---|---|---|---|---|---|---|---|
| 0.24 | 1.55 | 0.87 | 0.40 | 0.034 | 0.023 | 0.010 | 0.004 | 0.0028 | 0.0006 |
Table 2.
Change in the amount of retained austenite as a function of strain level estimated by using image analysis and EBSD method.
Table 2.
Change in the amount of retained austenite as a function of strain level estimated by using image analysis and EBSD method.
| Strain Level, % | Amount of RA (Image Analysis),% | Standard Deviation, % | Amount of RA (EBSD Method), % |
|---|---|---|---|
| 0 | 14.6 | 1.3 | 13.8 |
| 5 | 11.7 | 1.2 | 10.9 |
| 10 | 8.0 | 1.2 | 7.9 |
| 15 | 6.0 | 1.0 | 5.8 |
| 25 | 2.4 | 0.8 | 3.9 |
© 2019 by the authors. Licensee MDPI, Basel, Switzerland. This article is an open access article distributed under the terms and conditions of the Creative Commons Attribution (CC BY) license (http://creativecommons.org/licenses/by/4.0/).
Share and Cite
MDPI and ACS Style
Grajcar, A.; Kozłowska, A.; Radwański, K.; Skowronek, A. Quantitative Analysis of Microstructure Evolution in Hot-Rolled Multiphase Steel Subjected to Interrupted Tensile Test. Metals 2019, 9, 1304. https://doi.org/10.3390/met9121304
AMA Style
Grajcar A, Kozłowska A, Radwański K, Skowronek A. Quantitative Analysis of Microstructure Evolution in Hot-Rolled Multiphase Steel Subjected to Interrupted Tensile Test. Metals. 2019; 9(12):1304. https://doi.org/10.3390/met9121304
Chicago/Turabian StyleGrajcar, Adam, Aleksandra Kozłowska, Krzysztof Radwański, and Adam Skowronek. 2019. "Quantitative Analysis of Microstructure Evolution in Hot-Rolled Multiphase Steel Subjected to Interrupted Tensile Test" Metals 9, no. 12: 1304. https://doi.org/10.3390/met9121304
Note that from the first issue of 2016, this journal uses article numbers instead of page numbers. See further details here.