Blast-Induced Compression of a Thin-Walled Aluminum Honeycomb Structure—Experiment and Modeling

1
French-German Research Institute of Saint-Louis (ISL), Saint-Louis 68301, France
2
LEM3 Laboratory, Lorraine University, Metz 57070, France
3
Institute of Fundamental Technological Research Polish Academy of Sciences, Warsaw 02-106, Poland
*
Author to whom correspondence should be addressed.
Metals 2019, 9(12), 1350; https://doi.org/10.3390/met9121350
Submission received: 25 October 2019
/
Revised: 9 December 2019
/
Accepted: 12 December 2019
/
Published: 15 December 2019
(This article belongs to the Special Issue Metallic Materials under Dynamic Loading)
Abstract
:The presented discussion concerns the behavior of a thin-walled hexagonal aluminum honeycomb structure subjected to blast loading. The shock wave affecting the structure is generated by detonation of the C4 charge in an explosive-driven shock tube (EDST). The EDST set-up is an instrumented device that makes it possible to study blast effects in more stable and repeatable conditions than those obtained in a free-air detonation. The formation of folds characteristic of a honeycomb deformation in the axial compression distributes the initial loading over a time period, which is considered as an efficient method of energy dissipation. The test configuration is modeled in the Ls-Dyna explicit code, which enables analysis of the mechanisms of energy absorption that accompanies structural deformation under a blast loading. The conclusions reached in the performed experimental and numerical investigation can be applied to the modeling and optimization of cellular structures used to mitigate blast loadings.
1. Introduction
Understanding the performance of structures and materials under a blast loading is crucial to improving the efficiency of protective shields and, therefore, to increasing the survivability of personnel and equipment endangered by explosions. When a high-energy charge explodes, a large amount of energy is generated in a small, localized volume. A distinctive shock front spreads through media with a velocity higher than the local sound speed, causing changes in the pressure, temperature, density and particle velocities, thus creating an effect known as a blast wave [1]. Mechanisms of pressure wave propagation are complex, consisting of several physical phenomena such as a burning effect, heat transfer and air compression, which makes blast testing a challenging experimental technique [2]. Depending on the charge, its mass, its shape and its distance from the structure, different solicitations may be expected. These solicitations, along with the structure’s mechanical and geometrical properties, define the damaged caused by the explosion. The influence of an explosion on a structure may be analyzed experimentally by a few test techniques, such as a detonation in “free air” [3,4], or by means of shock tubes [5,6]. Free-air explosion tests are considered difficult in instrumentation and have limited repeatability, but they allow to study effects of interactions in real configurations of explosives and structures. On the contrary, traditional shock tubes are used mainly for academic purposes and generate shock waves in a more simple and safe way. Shock waves inside a compressed-gas-driven shock tube may be generated by a buildup of high pressures, which causes diaphragms to burst and a shock wave to propagate down the shock tube [6]. Since a shock wave is not representative of a blast wave, in order to enlarge the range of applications, shock tubes have been modified so that they could generate a blast wave instead of a shock wave. Recent examples of the application of classical shock tubes for this type of investigation can be found in papers [7,8,9], which provide experimental data and results of numerical modeling confirming the correct flow and pressure profiles. One of the main difficulties related to gas-driven shock tubes is the proper design and modeling of the fracture of diaphragms opening the flow. In explosive-driven shock tubes [10], a blast wave is obtained by an explosion of a charge located in front of the tube. The wave propagates inside the tube, creating a localized planar pressure front. Compared to a free-air detonation, the EDST is a test set-up used to generate and measure the effects of blast waves on a small scale/area. This technique, however, has a better replicability, enabling more accurate measurements of the pressure and impulse.
Various structural components have been already tested and analyzed by means of the EDST technique. The results of a series of tests carried out by means of an EDST are discussed in [10], where the test conditions are analyzed with regard to pressure, load impulse, wave planarity and repeatability of loadings. In this case, the EDST is used to generate a blast loading on fully clamped square aluminum plates. Reference [11] focuses on the mitigation of blast effects by a sacrificial cladding with polyurethane (PU) as a crushable core. Influences of the front plate mass and the material and geometrical properties of the PU core on the absorption of a given shock are investigated and modeled. In [12], a planar shock is generated by detonation of high-explosives, from 20 to 70 g TNT eq. generating 30 to 130 bar overpressure at the end of the tube. In these instrumented tests, the load and deformation of crushable cores are recorded providing the measured loading profiles. The analysis is a helpful guideline for the development of defense systems.
A thin-walled hexagonal aluminum honeycomb structure is considered as an excellent blast energy absorber, whose behavior could be tested by means of the EDST set-up. These metallic honeycombs are efficient in protective applications because the mechanism of their deformation is used to dissipate the energy of a load. They have been designed to buckle and fold in a controlled manner under an axial compressive load, which decreases and distributes the initial load over a longer time span. Honeycombs are characterized by an exceptionally good weight-to-energy ratio of absorption capacity, are very cost-effective and simple to manufacture [13]. However, traditional honeycombs provide optimal performance only when axially compressed. Moreover, a strained structure must be replaced after a single use as their folding and buckling are irreversible. Nevertheless, thanks to their properties, aluminum honeycombs are often used in various industrial sectors, ensuring reliable performance under dynamic loadings. As early as in the 1960s, experimental programs were launched evaluating and optimizing metal honeycomb elements as axial energy absorbers [14,15,16]. In the 1980s, analytical descriptions of the folding mechanism accounting for the plastic hinge theory were proposed. Alexander [17] studied the axisymmetric axial buckling collapse mechanism and derived an equation describing the mean axial load of a thin-walled cylindrical tube, which became one of the first analytical approaches to model the performance of honeycombs. In [18,19], a model describing mechanisms of folds creation related the crushing force and length of local folding waves to the wall thickness and cell diameter. Nowadays, numerical models provide insight into behavior and failure mechanisms of honeycombs without requiring an application of analytical models. In [20], responses of honeycomb structures under a dynamic indentation and compression load are studied by means of a finite-element method (FEM). It is observed that the plateau stress increases as the ratio of the thickness to the cell length gets higher. References [21,22] focus on numerical models that visualize lobe creation mechanisms. In [23], thin-walled metallic tubes are applied to enhance the mechanical properties of aluminum honeycomb, and then to form a novel tube-reinforced honeycomb structure. Whereas in [24], bio-inspired horseshoe-patterned aluminum honeycomb structures compressed in the “out-of-plane” direction were investigated. In [25], it is shown experimentally and numerically that complex chiral honeycombs possess negative Poisson’s ratios, which together with their other features makes them suitable for modern applications requiring a flexible design.
Obviously, metallic honeycombs belong to a much wider group of cellular materials. Those geometrically more complex, advanced and lightweight structures like open or closed cell foams [26,27] or 3D woven materials [27] are successfully investigated and applied as efficient impact absorbing and blast mitigating protective systems.
The aim of the presented study is an analysis is of the behavior of conventional thin-walled aluminum honeycombs with a hexagonal network under compression induced by detonation. To better understand the mechanism of fold creation that causes the loading energy dissipation, the structures are tested by means of the explosive-driven shock tube (EDST) and their responses to the imposed loadings are modeled numerically. The material model for the simulation is validated based on the quasi-static compression tests of the structures. The parametric study proves the reliability of the numerical configuration and the obtained numerical results can be used to accurately analyze the deformation patterns of the structure under a given load. The presented results can be used in further research performed within the discussed blast-testing set-up and subsequently in replicating more complex honeycomb-based structures.
2. Experimental Investigation
The hereby discussed thin-walled aluminum honeycomb is made of a 3000 series aluminum alloy. This alloy group, particularly suitable for sandwich panel assemblies, is easily machined and formed having a low-cost production. The structure’s compressive stabilize strength may vary between 0.85 and 7.7 MPa depending on the wall thickness, cell size and structure density [28]. The tested honeycomb is manufactured by bonding together thin, corrosion-resistant sheets of aluminum foil, which are then expanded to form a cellular hexagonal configuration. According to the producer, the structures have the generalized cell size described by a diameter of 12 mm and the thickness of a single wall of 70 μm, which results in a density close to 40 kg/m3 [28]. The structures subjected to the tests had a height of 50 mm and consisted of 7, 19 and approximately 53 cells (Figure 1a).
2.1. The Generalized Response of Compressed Cellular Metallic Structures
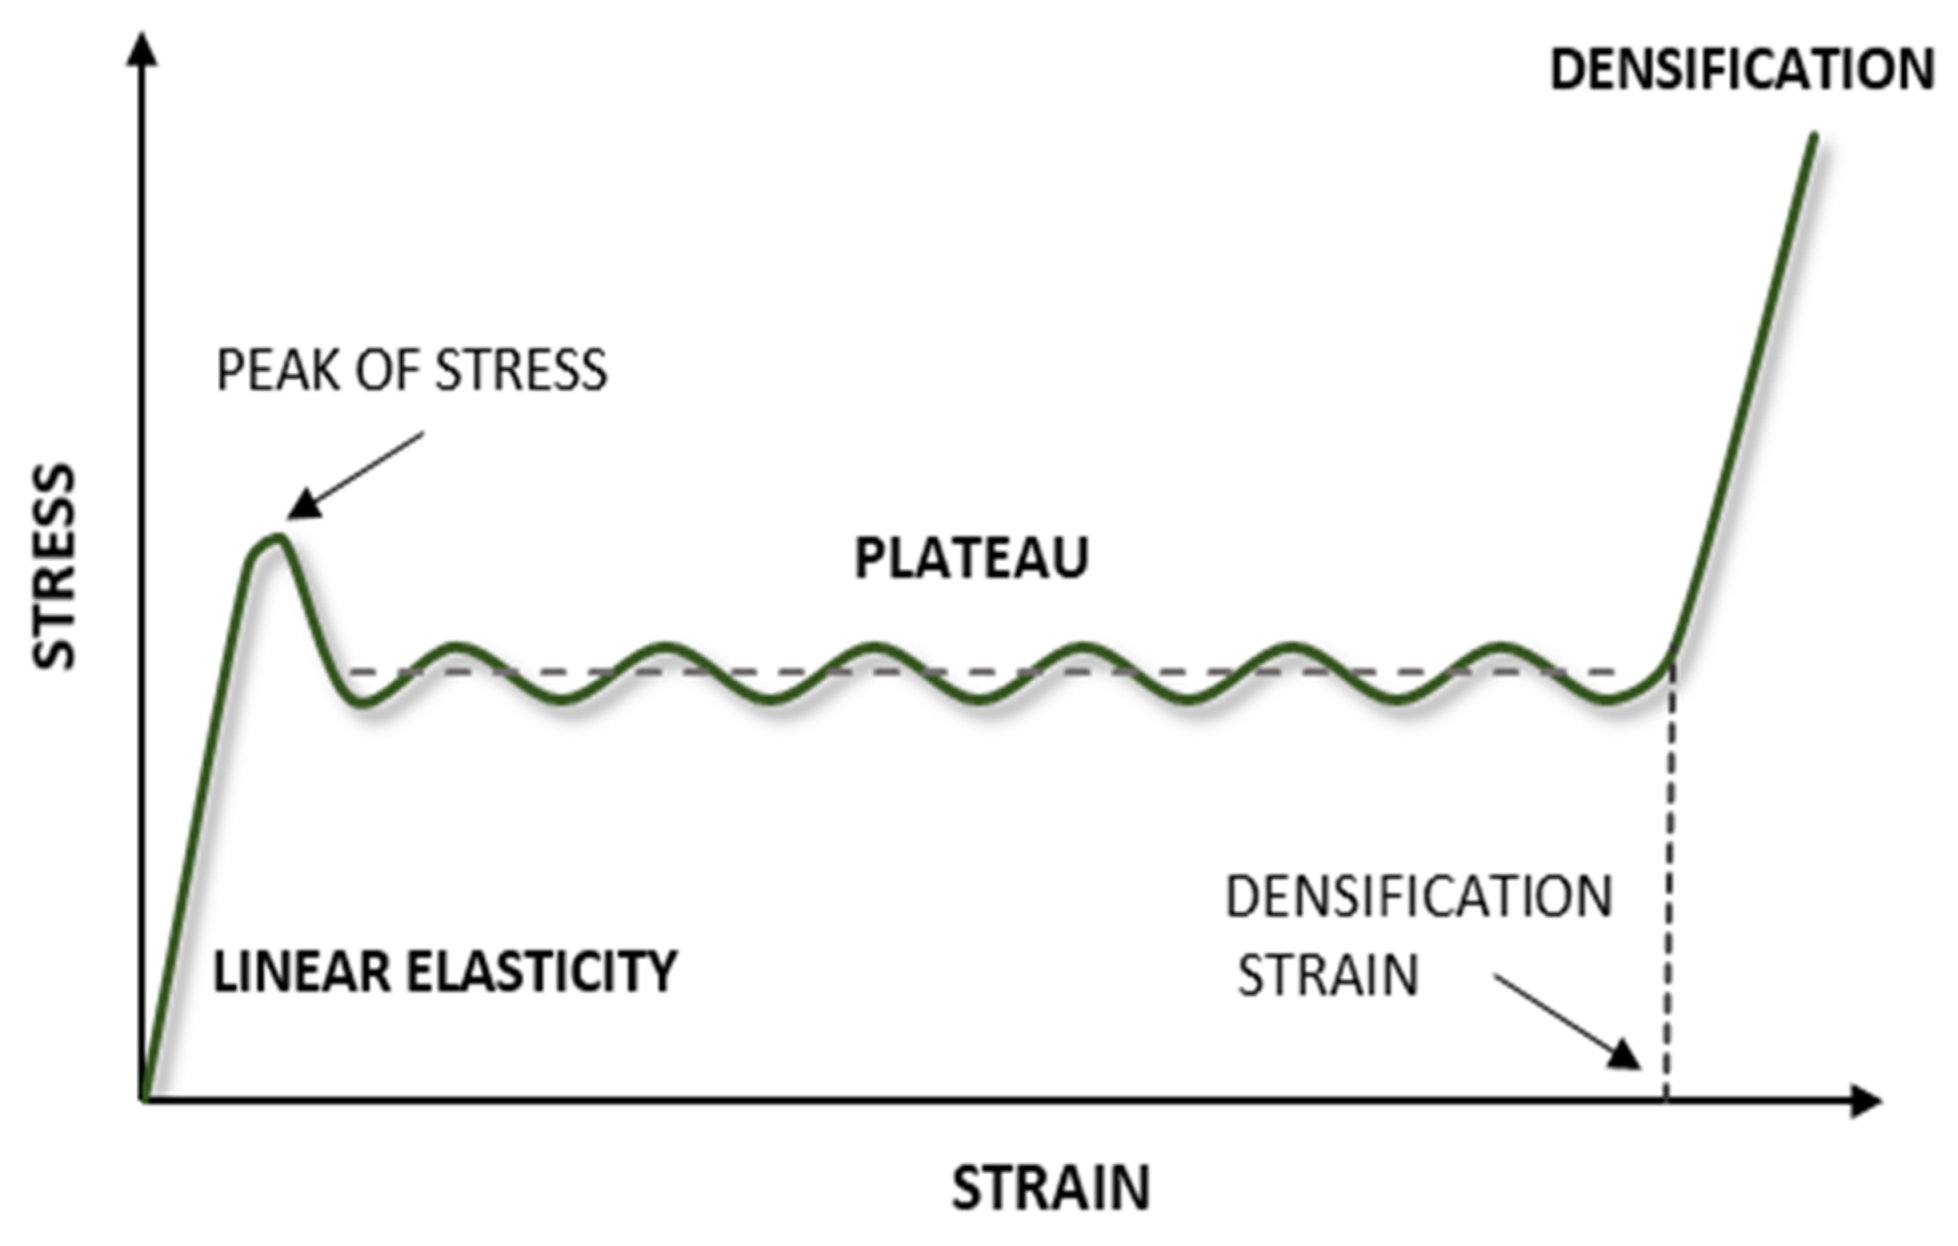
A schematic, generalized representation of the response of a metallic cellular structure to compression is presented in Figure 2. The curve may vary depending on a structure type, rate of deformation and external conditions, but if the structure is fully compressed, the three main parts are usually recognizable. After the linear elastic range of the structure deformation, the registered peak stress represents the plastic collapse stress, i.e., the maximum load that the structure can bear. The next phase is known as the plateau region and occurs in the structure until its densification. The plateau regime may be approximated by the constant mean stress, which represents the generalized load transmitted to the structure, and which is protected. In the case of honeycombs, during the plateau regime, numerous plastic folds are formed along with the structure height, which is the main mechanism of energy dissipation. Structures absorb large amounts of energy at the plateau stress level due to an underlying structure which is not exposed to additional compressive stress till the moment when the imparted energy is large enough to cause the structure densification. The length of the plateau determines the moment in which the structure attains the densification phase when further large plastic deformation is no longer possible.
2.2. Description of the Test Set-up-Explosive-Driven Shock Tube
The tested honeycombs were subjected to blast loads generated in an explosive-driven shock tube (EDST). The shock tube had an internal square cross-section of A0 = 80 × 80 mm2 and a length of 1750 mm, as presented schematically in Figure 3. A small amount (15–50 g) of the C4 explosive charge was detonated 50 mm in front of the tube. C4 is an explosive material based on a nitramide RDX, which is considered as more energetic than trinitrotoluene (TNT) [29]. C4 is stable and insensitive to most physical shocks; it cannot be detonated by a gunshot or by dropping it onto a hard surface, which reduces the risk of an accidental detonation. When detonated, C4 decomposes rapidly to release nitrogen, water and carbon oxides, as well as other gases with high temperature and pressure, which propagate as a planar shock wave inside the tube.
The load applied to the tested sample is directly related to the gas pressure at the end of the tube. Figure 3b presents the time evolution of the pressure generated by the detonation of charges with three different masses. The pressure profiles were measured directly using a Kulite HKS-375 (KULITE Semiconductor Products Inc., Leonia, NJ, USA) pressure transducer in the configuration, in which the shock tube is placed directly in contact with the backplate. As presented in Figure 3b, results of loads may deviate less than 7%. The origins of the discrepancies are the molding of the C4 sphere and the influence of the detonator when put inside the small charge.
During the blast test, the sample is mounted using an adhesive between two steel plates, as presented in Figure 3c,d. The blast wave interacts directly with the front plate; hence the sample is not directly affected by the blast wave. The plate is accelerated by the blast wave and its movement converts the blast energy into the kinetic energy. The plate compresses the tested sample and during the deformation process, the load transmitted to the rear plate is measured by a force transducer mounted between the rear steel plate and the rigid, concrete wall of the bunker (Figure 3d). The transducer is a PCB 206C (PCB Group Inc., Depew, NY, USA) quartz force ring sensor with a sensitivity of 13.5 mV/kN and a frequency range of 0.3 mHz–40 kHz. Both plates are made with medium carbon, low alloy 4340 steel (36CrNiMo4/1.6511), known also as the S235 steel. The thickness of the front plate can be changed in order to adjust both the strain rate and the energy transmitted to the tested material. The compression process is recorded using a Phantom (Vision Research Inc., Wayne, NJ, USA) high-speed camera positioned at 0.5 m from the sample and equipped with f85/1.4 lens, providing exposure time lower than 8 μs, which guarantees sufficient luminosity during the recording. A frame rate of 31 kfps with the total recording time of 2 s ensures an adequate time discretization to measure the displacement of the front plate by means of image analysis.
During the tests, the 50 mm-high honeycomb was placed between two 100 × 100 mm2 steel plates, as shown in Figure 3c. The front surface of the sample was in contact with the 8 mm thick plate with a mass of 655 g, whereas its rear surface contacts the 11 mm-thick plate under which the load sensor was located.
Assuming there are no fluid–structure interaction effects, the front plate velocity, Equation (1), can be estimated using the momentum conservation law dependent on the plate mass and the load impulse obtained during the experiment without a sample, as shown in Figure 3a.
where is the reflected impulse expressed by Equation (2), is the area of the shock tube internal cross-section, is the plate mass and ptrans(t) is the gas pressure
In the test in which 50 g C4 is exploded and no absorptive structure is inserted to the configuration, the velocity of the plate is calculated as 38 m/s, according to Equation (1). On this basis, the obtained energy equal to 473 J is determined.
The value of impulse transmitted by the blast wave to a free plate can be more accurately estimated by using Taylor’s acoustic analysis of fluid structure interaction [30,31] (which can be also extended to nonlinear regime [31]), describing the reduction of the transmitted impulse due to the plate movement induced by the blast. This effect is more dominant for lighter structures [32], which are accelerated faster. The solution of this problem is characterized by a non-dimensional coefficient being the ratio of timescales of duration of the incident blast wave and the characteristic time of the fluid–structure interaction. In the analyzed case, for the front plate not backed by the sample, this coefficient is of order of 0.01, which represents the heavy plate regime and the solution corresponds to the case of the reflection of a linear wave on a rigid boundary [31].
In reality, even lower velocity of the front plate is recorded due to the reaction of the honeycomb core reacting against the induced displacement. The real velocity of the front plate, needed to compute the strain rate, cannot be determined before the test if the material parameters are unknown. Because of the character of the experimental technique, the strain rate may be only estimated, and it is assumed that it may vary between 570 and 760 s−1 for the performed detonations. The strain-rate is also not constant, except during the plastic phase of the sample
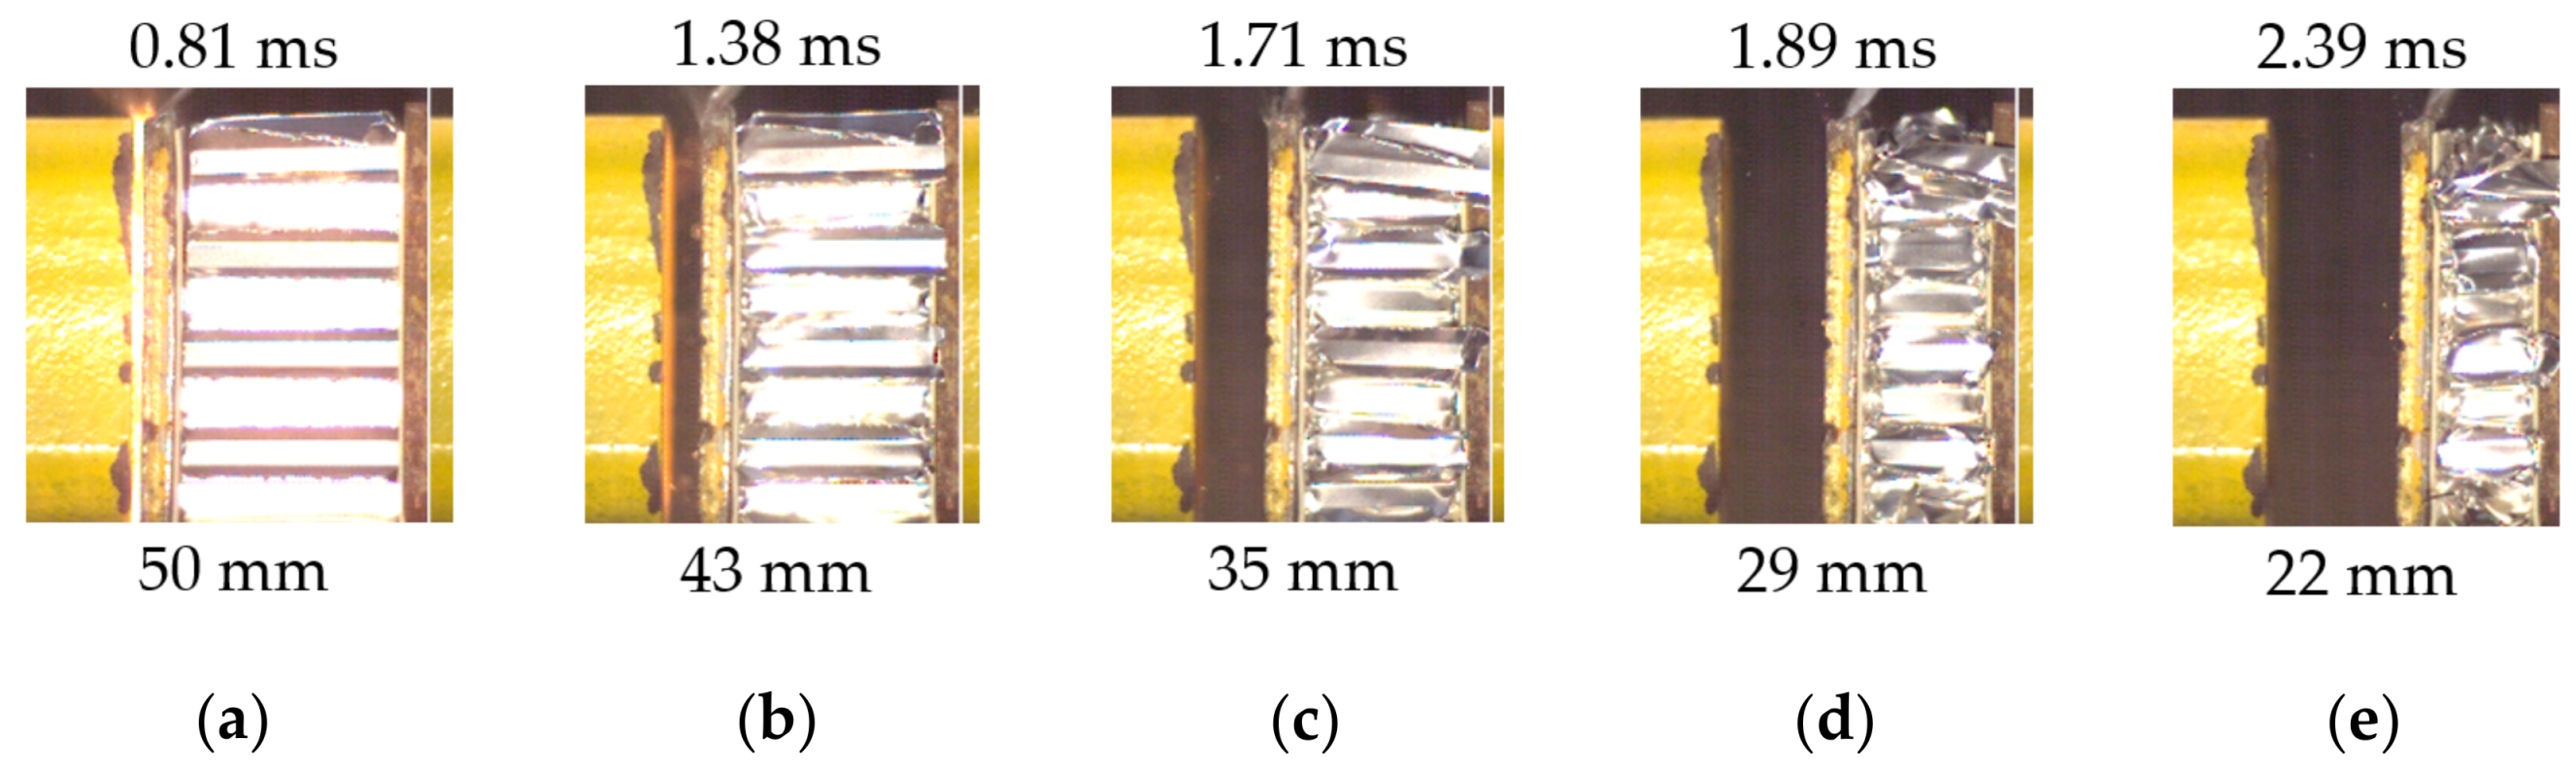
Figure 4 presents the frames depicting subsequent phases of the honeycomb deformation. The visible shock wave in Figure 4a, occurring after detonation of 50 g C4, causes the movement of the front plate. In the presenting example, the progressive folds formation begins from the rear plate side (Figure 4b). After 30% of strain, the folds are created from the front plate side (Figure 4c) followed by folding on both sides until densification (Figure 4d–e). The mechanism of creating folds is considered random and is characterized by a number of schematics. The fully compressed sample is shown in Figure 1b.
The measured time-force and time-displacement evolutions are used to calculate the equivalent stress and strain for the tested material, Equations (3) and (4), which are the key parameters for the comparison of different structures. Based on the curve, the characteristics of the structure response to the blast may be determined, i.e., peak force/stress, plateau stress and densification strain [33].
where is the total force transmitted to the backplate, Aref is the reference cross-section area of the sample, x(t) is the displacement of the front plate, and L0 is the initial height of the sample.
Choosing the reference cross-section area, Aref requires a more detailed discussion. In general, Aref can be chosen either as the exact area covered by cells or as an area of a rectangle circumscribed on it. Aref should not be confused with the exact cross-section area of the honeycomb walls that is in direct contact with the base plates and transfers the real stresses [18,19]. The honeycombs used in experiments slightly differ from sample to sample and also contain single “orphan” walls at their edges resulting from partitioning of the full cells while cutting. Therefore, in order to obtain consistency in comparison of results, to determine values of the experimental stresses, the Aref is taken based on averaged measurements of real samples (36 mm × 42 mm, 50 mm × 50 mm and 100 mm × 100 mm for the 7, 19 and 53 cells, respectively).
Figure 5 presents the results obtained in the EDST experiment when the discussed honeycomb structure absorbs the blast energy in the detonation of 15 g, 30 g and 50 g of the C4 charge. The plate displacement and the force transmitted through the structure are registered by the load sensor and the image analysis. These results are compared with the initial load obtained in the experiment without the absorbing structure.
2.3. Quasi-Static Compression of the Honeycomb Structures
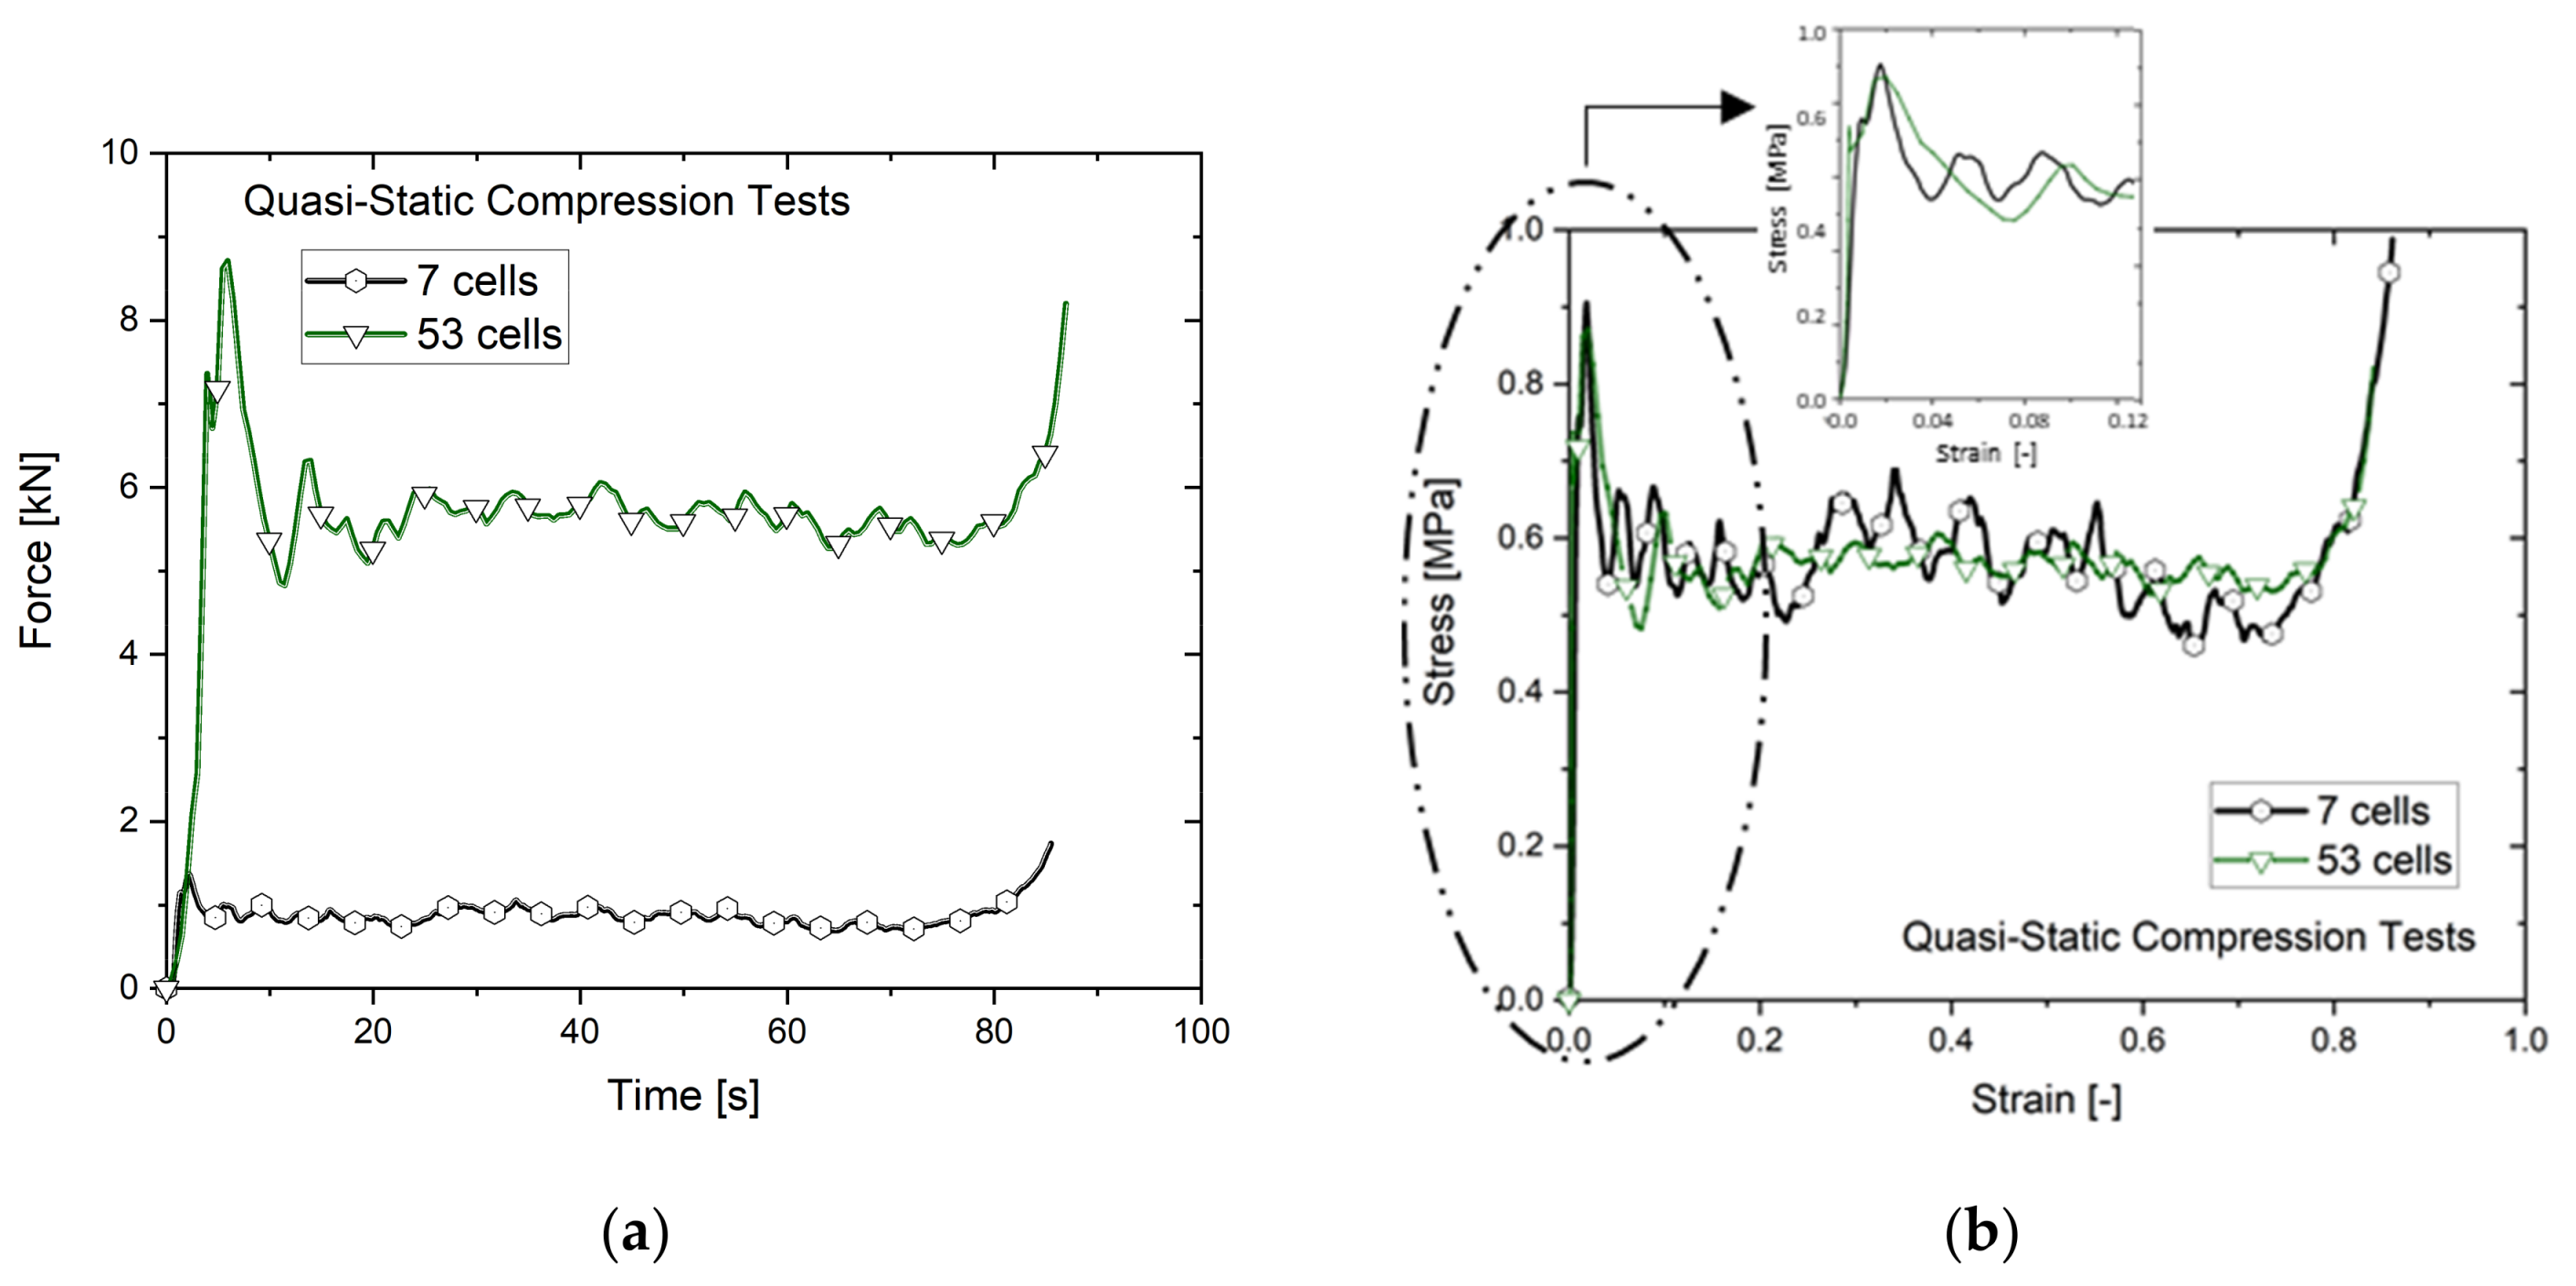
Compression tests in quasi-static conditions are performed to complete the overview of the behavior of the tested honeycombs under the axial loading. The 50 mm-height honeycomb structures with 7 and 53 cells are compressed by means of a universal testing machine Instron 5985 (Instron ITW, Norwood, MA, USA) with a constant strain rate of 0.01 s−1. The measured force–time curves and the resulted engineering stress–strain dependencies are given in Figure 6. It is observed that despite the difference in the registered forces, two structures with different numbers of cells are characterized by similar values of the peak stresses (about 0.9 MPa) and mean stresses (about 0.56 MPa), as seen in Figure 6b.
The characteristics of forces and stresses resulted from the quasi-static tests and the blast tests with charges of different masses are collected in Table 1. This summary allows observing changes in the structure responses depending on their sizes and the acting loads.
The comparison between the stress–strain curves resulted from the blast-induced compression and the quasi-static one is given in Figure 7. The stress–strain curves are calculated according to Equations (3) and (4). The structure responses resemble the idealized compression curve given in Figure 1. The characteristic phases of deformation are noticeable; however, not as distinctly as in the idealized case.
It may be noted that the peak stresses calculated in the dynamic compression are higher than those obtained in the quasi-static tests. For example, the 7-cell structures reached the peak stress of 0.91 MPa in the quasi-static test, which increased to 1.1 MPa in the compression imposed by the detonation of 15 g C4, and then to 1.21 MPa when a higher mass of 30 g of C4 explodes. This effect can be attributed to the strain rate hardening of the aluminum alloy and/or to dynamic compression of the air trapped inside the cells of the structure. The peak and mean stresses for the curves describing the responses of the honeycombs with 7 and 53 cells remain on a similar level. Fluctuations, visible in the curve presenting the behavior of the dynamically compressed honeycombs in Figure 7, are much more distinct than those occurring in the quasi-static compression. These spurious oscillations are added to the oscillations originating from the folding of the structures.
3. Validation of the Numerical Simulation
Generally, the finite element method (FEM) simulations are based on either the Eulerian formulation, in which the computational grid is fixed [34], or on the Lagrangian formulation, in which the computational grid is moving with the material [35,36]. Typically, blast-related problems are modeled by the full Eulerian approach for a volume of air and explosive or by the Arbitrary Lagrangian–Eulerian (ALE) formulation—an intermediate formulation between the two main types—with the capacity of being fully Eulerian or Lagrangian in certain zones of the computational domain, e.g., [37,38]. As it is described in the previous section, in the EDST blast test the honeycomb structure is not directly affected by the blast wave—its deformation results from the movement of the front plate accelerated by a blast wave of a known pressure profile, as shown in Figure 3b and Figure 5a. Therefore, the numerical analysis of mechanisms of blast energy dissipation may be modeled using the Lagrangian approach. The finite element code Ls-Dyna ver. R.9.0.1 is applied to simulate the deformation of the honeycomb observed in the performed blast experiment using the explicit time integration. The main application of Ls-Dyna is to model crash and dynamic events, so typical calculations are performed by means of the explicit solver, in particular, the central-difference technique. The quasi-static compression of the honeycomb is also modeled in Ls-Dyna but in the implicit formulation, also available in the software.
3.1. Numerical Configuration
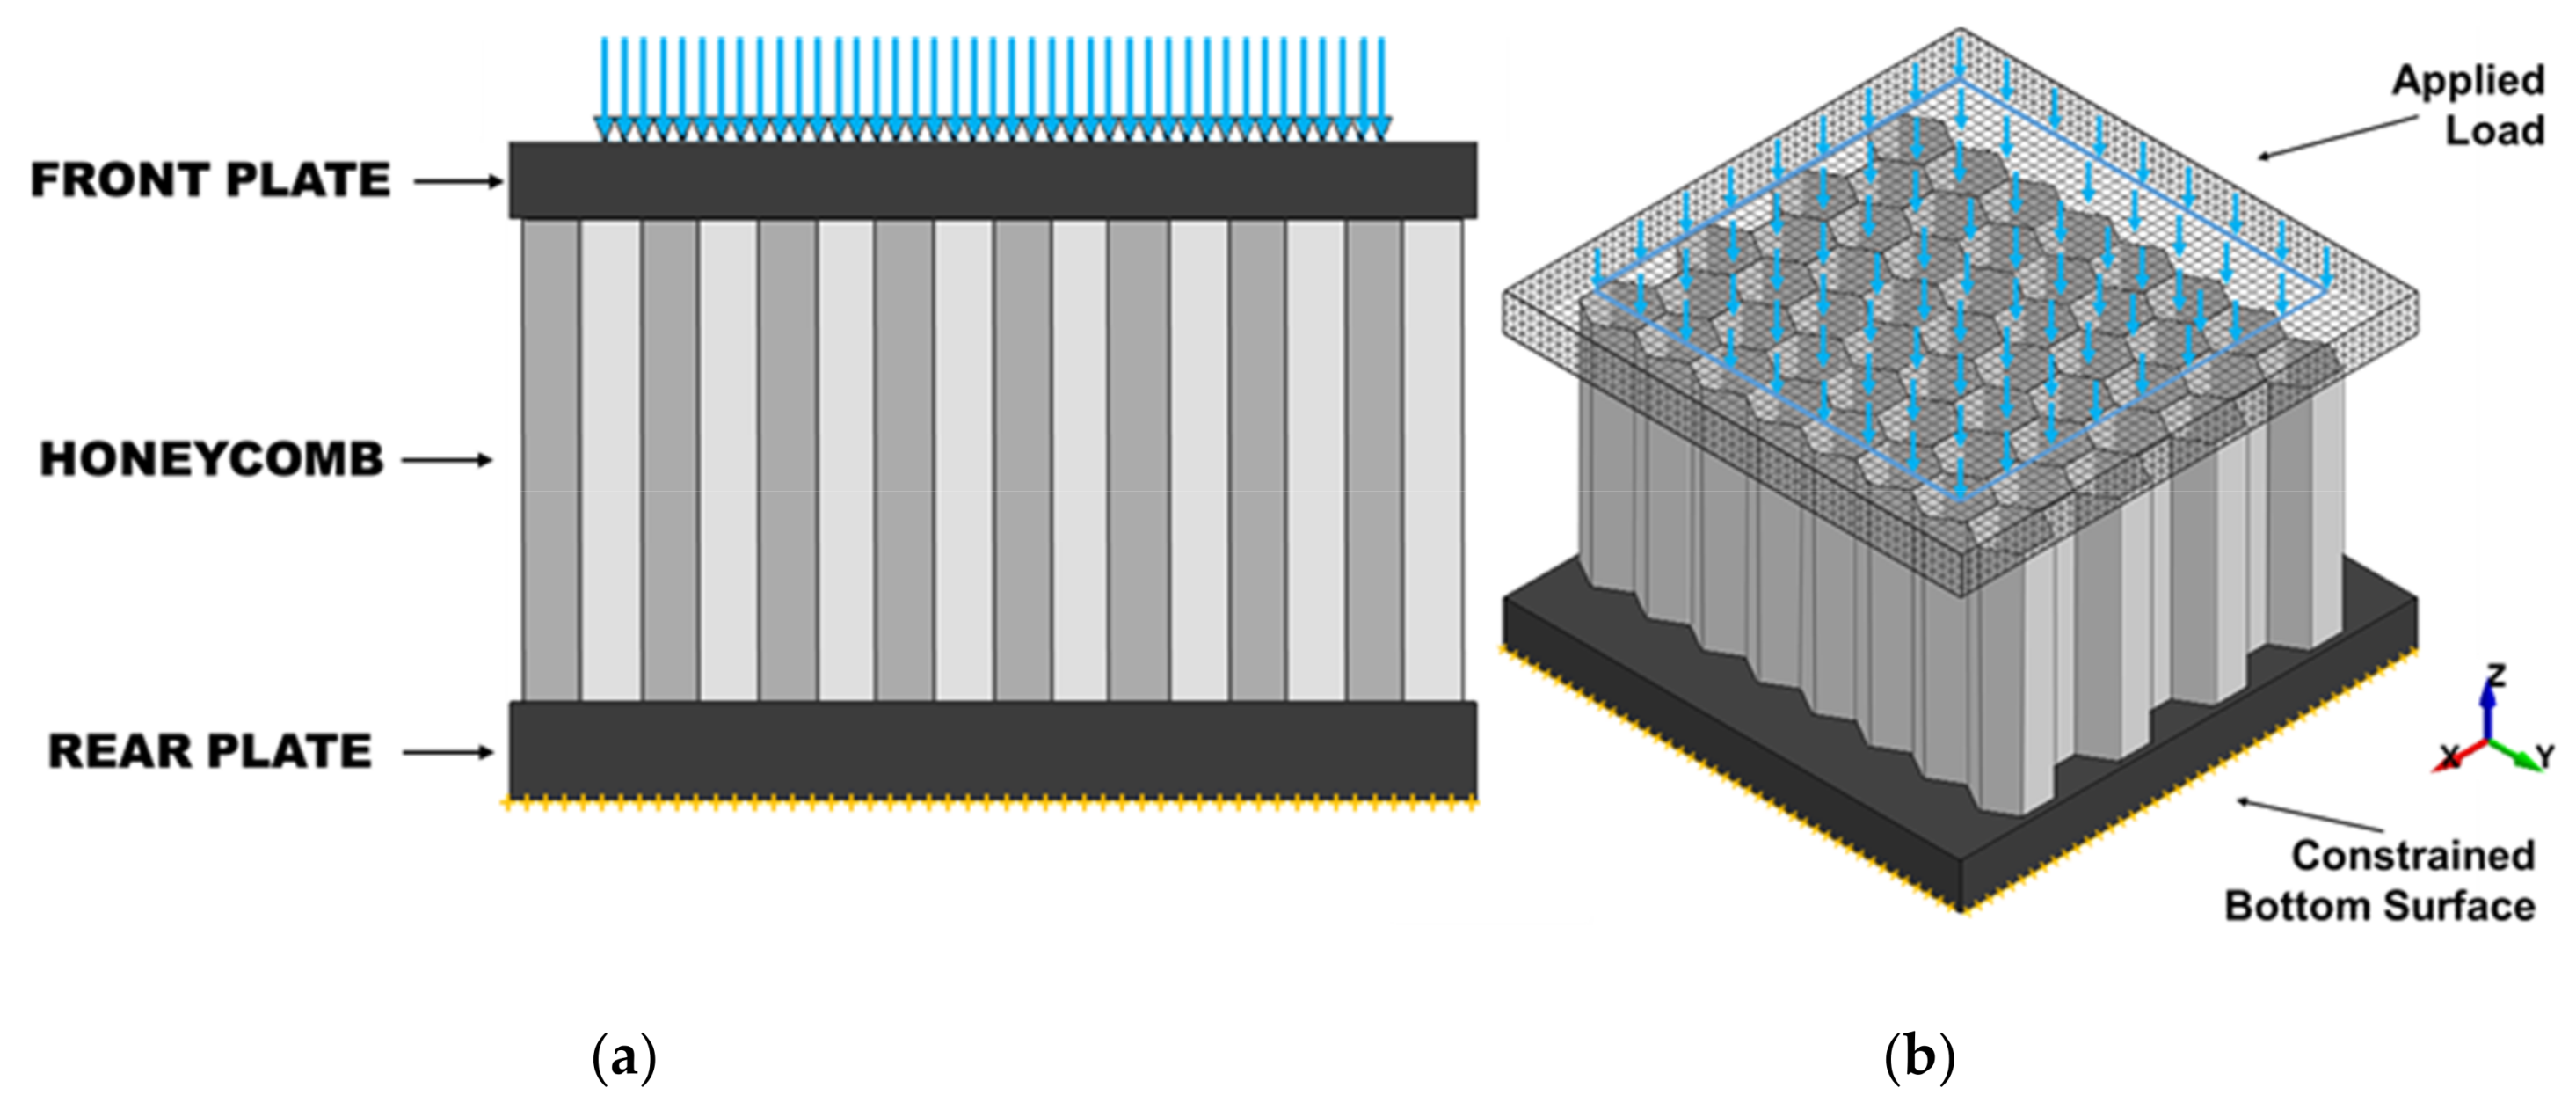
The numerical configuration repeats the experimental one and consists of the 50 mm-high honeycomb structure and the 8 mm-thick front and 11 mm-thick bottom plates, as shown in Figure 8. The pressure profile presented in Figure 3b measured in the test without the absorbing structure is taken as the initial load distributed to nodes of the upper surface of the front plate on the area equal to the inner tube cross-section, i.e., 80 × 80 mm2. To calculate values of the load transferred through the honeycomb in a way similar to the experimental measurement, the force resulted from the reaction between the bottom plate and the honeycomb is read. The generalized stress is calculated by dividing the determined force by the area that the structure covers (Equation (3)). To obtain the strain, the front plate displacement is divided by the height of the honeycomb. The nodes of the bottom surface of the rear steel plate are fully constrained, which blocks the sandwich movement. The contact between the honeycomb structure and the plates is defined by the function *AUTOMATIC_SURFACE_TO_SURFACE and the honeycomb nodes are considered in this configuration as “slaves”. It is not possible to determine the coefficients of friction experimentally, but numerically it has been verified that the frictionless condition does not provide proper results (see Section 3.3) and the static and dynamic friction parameters must be assumed between the plates and the honeycomb.
The front and rear plates are cuboids with dimensions 100 × 100 × 8 mm3 and 100 × 100 × 11 mm3. To reduce the number of elements and to optimize the calculation time, both plates are meshed coarsely by default solid cuboid elements 2 × 2 × 2 mm3, thus each plate has about 10,000 elements. The crushable honeycomb core is created as the shell part, in which elements are formulated using the Belytscho–Tsay model. Applied shell elements have five Gauss integration points through the thickness and an hourglass viscosity to damp out the zero-energy modes. The tested honeycombs are manufactured by the extrusion of connected aluminum foils, therefore a part of the walls is double. This is reproduced by assigning to appropriate walls thickness of 0.15 mm in the *SECTION field, while the other walls have a thickness of 0.07 mm, as reported in the product datasheet [28].
To describe in the simulation the behavior of the AA3003 aluminum alloy, the popular phenomenological flow model proposed by Johnson and Cook is used [39]. Originally, in the Johnson–Cook flow model, it is multiplicatively decomposed into three terms which represent the dependence of the material response on strain, strain rate hardening and thermal softening. However, among a few other formulations of the Johnson–Cook model available in the Ls-Dyna code, its simplified function, which does not account for temperature effects neither for fracture modeling—*MAT_Simplified_Johnson_Cook 098, Equation (5)—results in time-efficient calculations [40]. The *Mat_098 is chosen because it is assumed that the thin-walled aluminum honeycombs deform only plastically without damages and it has not been reported that the folding process may be affected greatly by temperature.
where A, B, and C are material parameters, is the effective plastic strain, and is the normalized effective strain rate.
To the best knowledge of the authors, the exact material and mechanical properties of thin AA3003 aluminum foils are not available in the literature. Depending on the manufacturing method, sheets from which honeycombs are made are characterized by material properties within a wide range [41,42,43,44,45]. Therefore, a reverse engineering method is used, which enabled an estimation of the parameters for the Johnston–Cook model, Equation (5), based on the results of the quasi-static compression test of the honeycomb structures presented in Figure 6.
3.2. Material Model Validation
The core-competency of Ls-Dyna is the highly nonlinear transient dynamic FE analysis which uses explicit time integration, so the program is applied mainly to model dynamic loadings. However, it also may be used to perform implicit, quasi-static calculations. To enable the implicit analysis, several options in the *CONTROL card must then be activated. The automatic time-step control and the optimum equilibrium iteration are added in the option *CONTROL_IMPLICIT_AUTO. To solve a linear implicit problem, the Newmark type of analysis with the time integration constant values of 0.5 and 0.25 is defined [46]. To find the equilibrium points of the task at each time step the *CONTROL_IMPLICIT_SOLUTION function must be also active. The time step of 0.1s is set for the implicit analysis in the *CONTROL_IMPLICIT_GENERAL card. Knowing the constant velocity of 0.48 mm/s in the loading direction, the *PRESCRIBED MOTION function is then chosen with the option *VELOCITY (RIGID BODIES AND NODES). A constant velocity of the front plate is kept; however, each displacement beyond the Z-direction has to be constrained. In the given configuration, the front and rear plates are considered as RIGID bodies.
Experimental results of the quasi-static compression test may be used to obtain the optimal fit of the model parameters in a sequence of simulations. Simulations of the quasi-static compression of the 7-cell structure have been performed to validate the Johnson–Cook plasticity model for the aluminum AA3003 (Equation (5)). The starting input parameters are assumed based on the material data presented in [47], which were used in the simulations discussed in [48].
3.3. Numerical Study
To ensure consistency in the numerical calculation, the influence of the structure geometry, mesh size and friction coefficients are verified, as it was already presented in [48] that they may strongly affect the results. The hereby-provided short discussion is complementary to a more detailed analysis of several other factors influencing numerical results given in [48].
3.3.1. Structure Geometry
In the first approach, the honeycomb geometry is prepared basing on the network with the ideally dimensioned cells, here called “regular hexagon”, whose edge length is equal to 7 mm, as seen in Figure 9b. However, the real structure differs significantly from the assumed idealized one. In reality, the unit cell has two short and four long edges and a range of interior angles varies between 80° and 145°, as seen in Figure 9a. Differences in geometry lead to propose another cell pattern called “hexagon” (Figure 9c), in which a cell has 6 mm and 8.5 mm long edges and the angle between the two longer edges is 90°. The thickness of the ligaments remains as given in the product datasheet [28], i.e., 0.07 mm for single walls and 0.15 mm for double walls.
The comparison of the obtained numerical results with the experimental values gives a 13% error of the mean force calculated for the idealized structure based on the “regular hexagon”, whereas a simulation of the structure with the geometry closer to the real one results in an error reduction to 4%. The peak of the forces has a similar value in both simulations and 34% overestimates the experimental value (Figure 10). The obtained minimization of the error between the numerical and experimental results allows considering the obtained set of the model parameters as adequate. The final values of the material parameters used to model the aluminum are presented in Table 2. These parameters are applied in the further numerical analysis of the honeycomb behavior.
3.3.2. Mesh Consistency Study
The important factor affecting numerical results is the size of mesh elements. The mesh study concerns the 7-cell structure compressed with the quasi-static strain rate. Basing on the simulations, it is observed that the coarse mesh with 0.8 × 0.8 mm2 can cause a difference up to 15% comparing to the result for the 7-cell structure meshed by 0.2 × 0.2 mm2 (Figure 11a). Calculations with the same solver and at the same settings show that when the mesh element is increased to 0.4 × 0.4 mm2, the same results accuracy is obtained but the task termination is reached three times faster than for the mesh with the half smaller element size.
3.3.3. Friction Influence
During the EDST experiment, the honeycomb is assembled with the plates by means of an adhesive tape to prevent it from falling down on the ground (Figure 3d). Characteristics of friction during the uniaxial quasi-static and dynamic compression tests are difficult to estimate experimentally [50]. The values of the friction coefficients depend on many parameters, like involved materials and the quality of the surface being in contact. On the contrary to the experimental test, it is possible to verify numerically if different values of the friction coefficients affect the results. Table 3 contains the subsequent numerically assumed values of the friction coefficients between the honeycomb and the plates. The dimensionless friction coefficient is a material- and system-dependent empirical property which for various material pairs may have values varied between zero (frictionless conditions, idealized surfaces, Teflon on Teflon) to one (or a bit more, e.g., for very rough surfaces, rubber on concrete, mild steel on lead) [51]. In the case of the aluminum–steel contact, it is assumed that friction varies usually between 0.4 and 0.6 [51]. Because it is already known that the friction coefficient may be used as a fitting parameter in numerical simulations, its influence on the obtained results must have been checked. Therefore, in the calculations there are taken values varying between 0 and 0.7. The correct value is difficult to evaluate because of a complexity of the experimental configuration. Only the area with thin-walls in the honeycomb structure is in contact with the steel plate; moreover, the other side is glued to the supporting plate. A similar parametric study on the influence of friction coefficients in a range <0, 2> in a steel–steel pair is presented in [52].
The resulted dependences of the force in time are shown in Figure 11b. When the frictionless conditions are applied, the structure slides on the plate surfaces and undergoes strong, non-local buckling whose effects are visible in the force evolution. When the non-zero friction coefficients are chosen, better modeling of the structure deformation is obtained. The calculations with various sets of the friction coefficient give similar results but its exact values have a minor influence on the results.
The above-presented verification of numerical conditions proves that the computation model results in the reliable modeling of the structure behavior. On the basis of the model validated by the quasi-static compression test simulation, the modeling of dynamic deformation is prepared. The subsequent section presents its results followed by an analysis and discussion.
4. Numerical Results
Experimentally obtained pressure loads resulted from the detonations of 15 g, 30 g and 50 g of the C4 charge, given in Figure 3b, and are considered as the initial loading in the numerical model of the blast test configuration. This is possible because in the discussed configuration, no fluid–structure interaction effects occur and the response time of the plate is larger than the blast wave duration. The registered responses of the honeycomb structures to the blast-resulted compression, c.f. Figure 5b, are then compared with those obtained numerically.
Figure 12a presents the comparison between the experimentally measured and numerically modeled response of the 53-cell structure to the shock caused by the detonation of 50 g of C4. In the experimental campaign, the detonation of the charge of 50 g generates the strongest load impulse, which leads to the full compression and densification of the 53-cell structure. The registered signal may have been affected by particular dynamics of the set-up, related to the rigidity of the test configuration. These strong fluctuations are not visible in other experimentally obtained curves and the artificiality of this effect is proven by the observation that the calculated values of the peak and mean stresses are close to those obtained in the experiment, i.e., 1.36 MPa vs. 1.37 MPa (σpeak) and 0.82 MPa vs. 0.71 MPa (σmean). In the case of the 7-cell honeycomb presented in Figure 12b, the curves have similar tendencies and the amplitudes of stress fluctuations do not differ much. The values of the peak and mean stresses are as follows: 1.1 MPa vs. 1.44 MPa (σpeak) and 0.64 MPa vs. 0.61 MPa (σmean), which confirms an acceptable accuracy of the simulation.
The values characterizing structure responses collected for the 7-, 19- and 53-cell honeycombs are presented in Table 4, where the experimental and corresponding numerical results are summarized. Another comparison is presented by the bar graphs in Figure 13. On average, in the simulation the mean stresses are correctly foreseen (Figure 13a,c,e) but the peak stresses are overestimated (see Figure 13b,d,f). The results of the mean stresses show similar values for the same amount of charge used, regardless of the number of cells. The greatest discrepancy is occurring for peak values, both in simulations and experiments; however, they still remain within the acceptable error limits. It must be emphasized that the numerical model does not account for all features that the real honeycomb structure may have, i.e., imperfections in the material or in ligament joints or irregular cells, which can be the argument explaining the discrepancies between the numerical and experimental results. On the other hand, in the EDST blast test the material response is not directly measured—the data are obtained by the image analysis and from the load sensor fixed on the bunker wall. Therefore, the experimental readings may be affected by the limitations of the measurement techniques, which could be a reason for the difference not observed in the simulations.
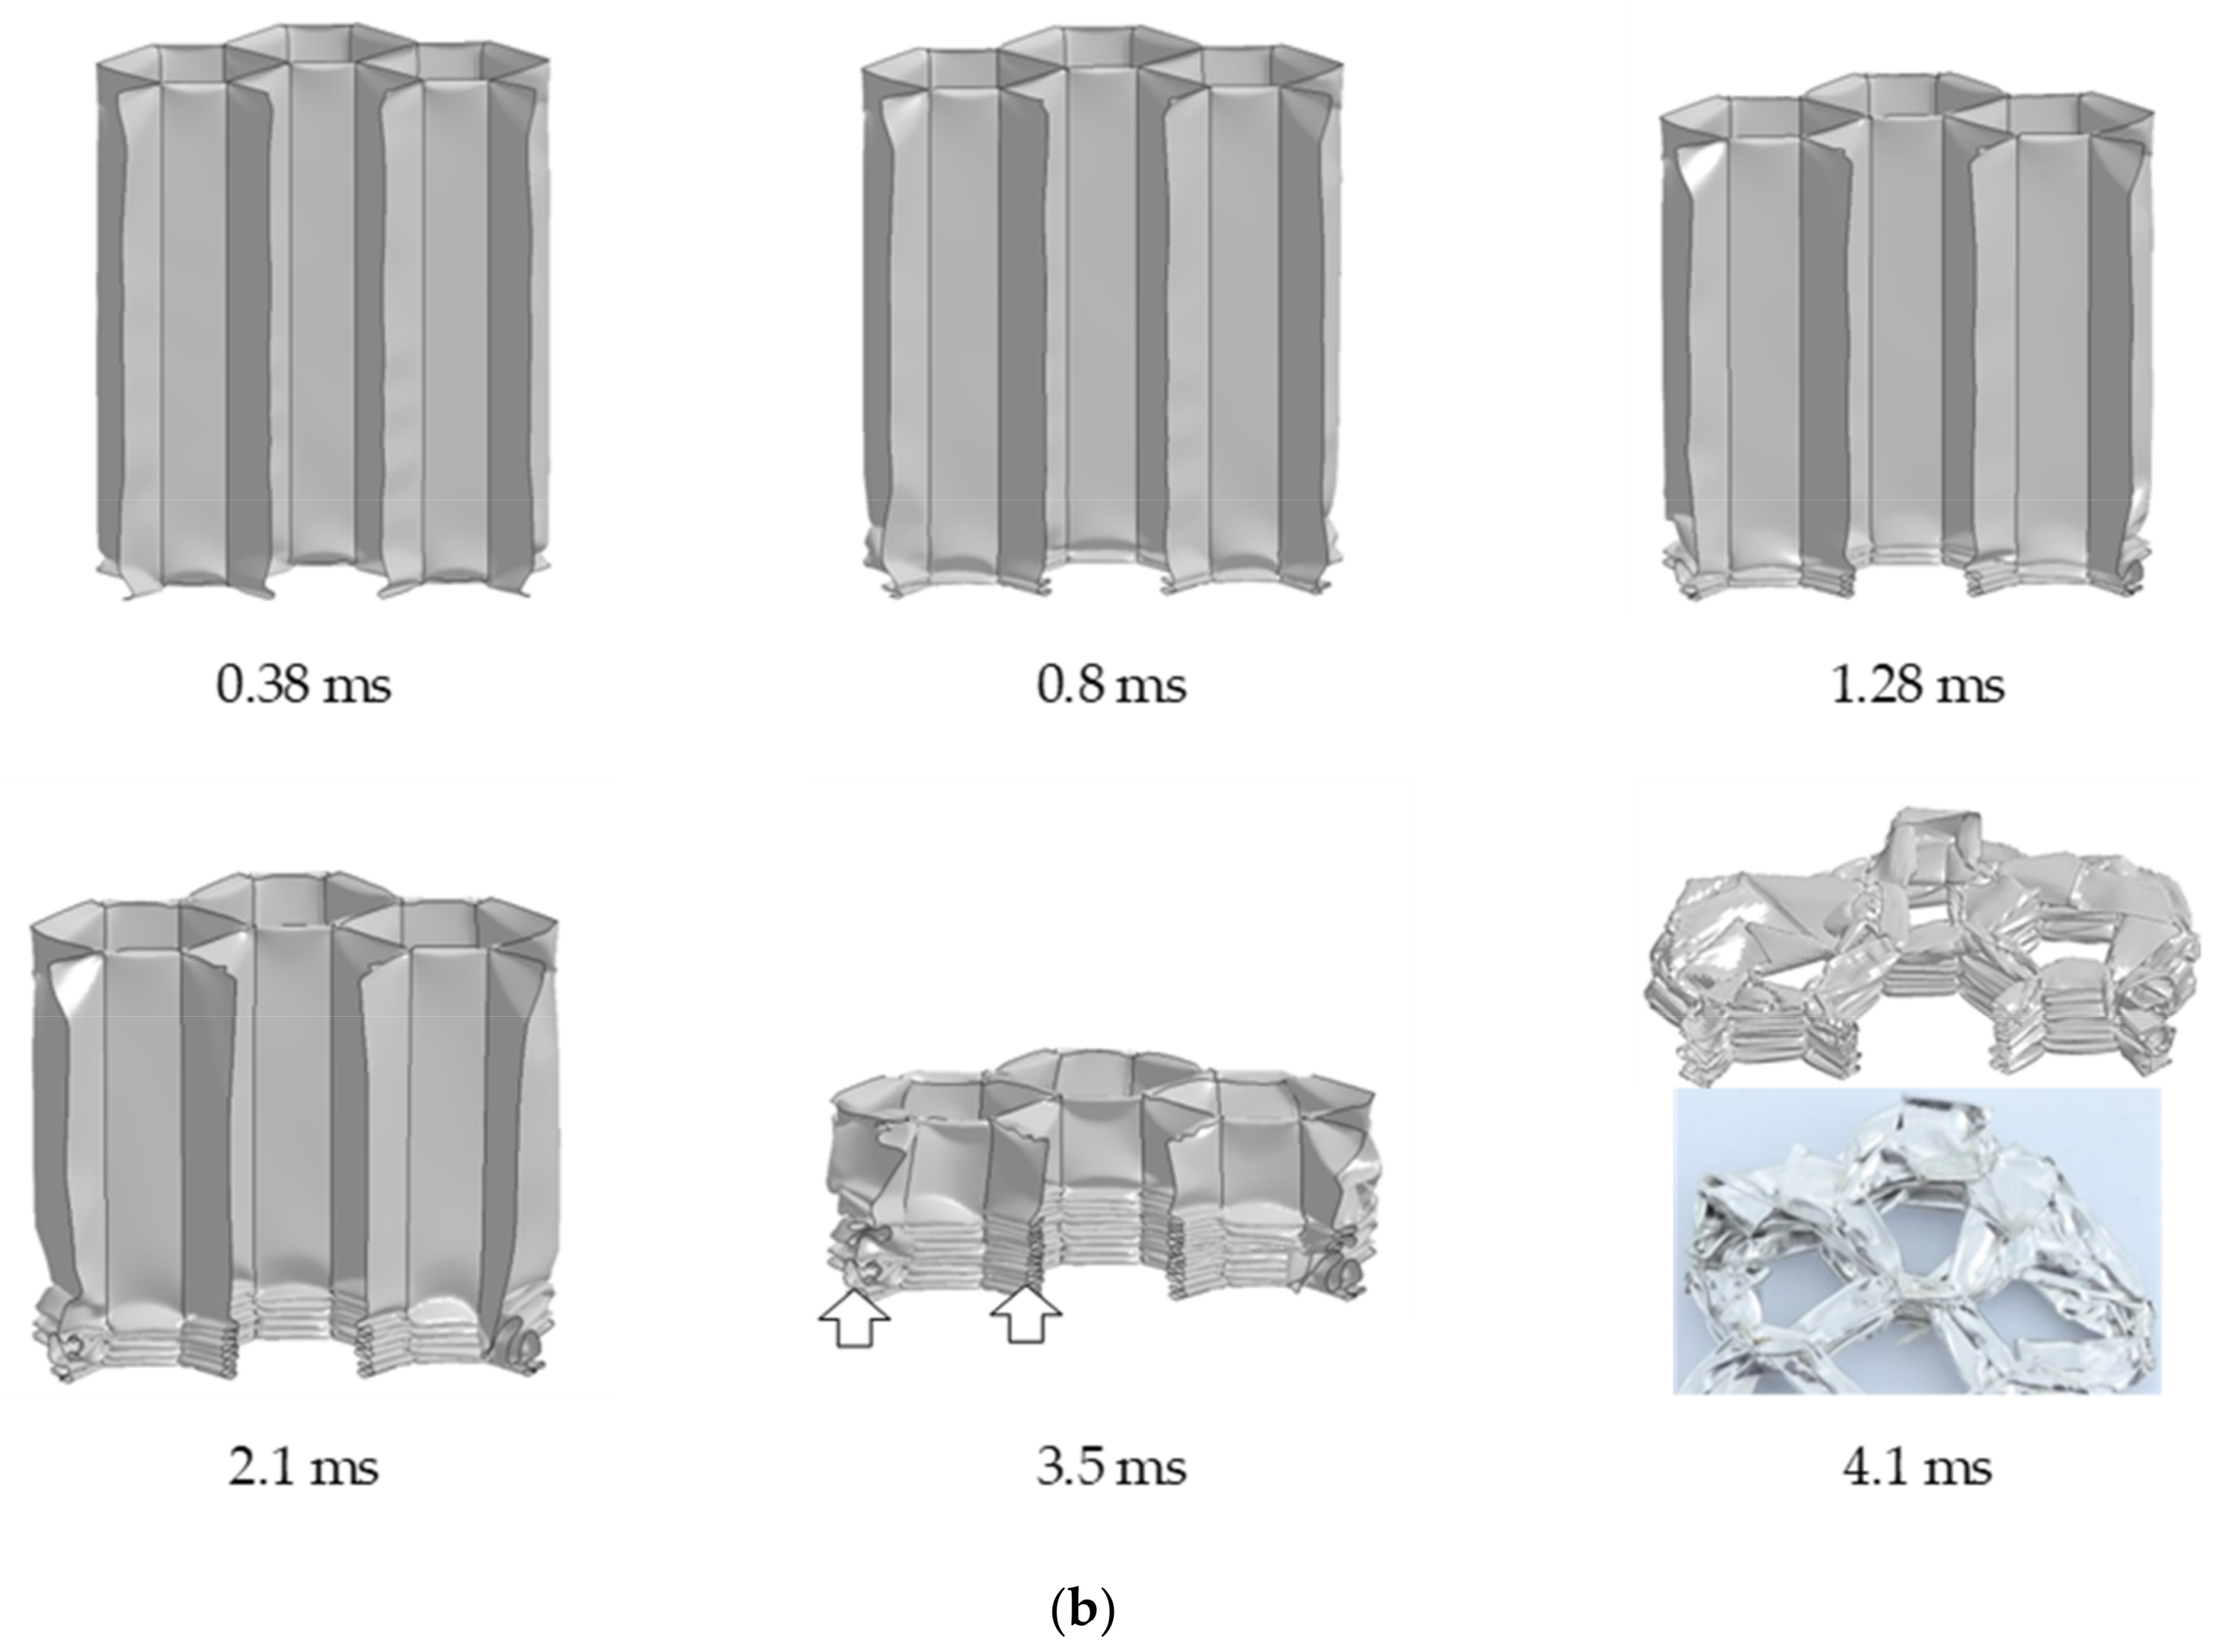
The structural response represented by the stress–strain curves in Figure 12 is complemented by the visualization of deformation, shown in Figure 14. The numerical results may complete the experimental investigation and may add additional analysis to observations provided by means of high-speed camera records (given as an example in Figure 4). The deformation mechanism of the honeycomb consists of the formation of folds. In experimental compression tests, folds are creating very quickly, and finally are strongly compressed and very thin, which makes an analysis of their formation difficult. In the simulation, the compression process may be followed step-by-step and analyzed in detail. Figure 14 shows a sequence of deformation of the 53-cell (Figure 14a) and 7-cell (Figure 14b) honeycombs subjected to a load of 50 g and 15 g of C4, respectively. Because of the larger energy of a 50 g explosion, the 53-cell structure is fully compressed faster (in 3.5 ms) than the 7-cell honeycomb due to the detonation of a 15 g charge (in 4.1 ms). For both structures, the folding formation starts from the bottom and in the final stage they are both fully compressed to 12 (single walls) and 11 (double walls) very thin folds. The boundary cells, not supported by their neighbors, are less stiff so they are more irregularly deformed comparing to the interior cells folded in a more regular manner (Figure 14b, time step: 3.5 ms). Like in the experiment, the upper part of the 7-cell honeycomb is partly folded due to the contact with the accelerated plate (Figure 14b, time step: 4.1ms). As presented in Figure 14, the modeled deformation of the 7- and 53-cell structures (as well as that of the 19-cell structure not shown here) are similar, so for the further analysis of the folding mechanism, the 7-cell structure is chosen.
Figure 15 shows the honeycomb deformation with superimposed maps of the first invariant of the stress tensor (pressure) averaged over the shell thickness. In the early stages of compression, it may be observed that at the moment when the plate hits the structure, the induced stress propagates as a wave to the bottom (0.1 ms) where reflected, starts to travel back (0.12 ms) to the upper part of the honeycomb, where due to the contact with the plate, the structure is already partly strained (0.13 ms). The waves are further reflected and continue their travel again to the bottom part, where the stress concentrates (0.16 ms), forming the first fold. Since then, the deformation is localized behind the fold, which is followed by stress concentrations forming subsequent folds, bent “in” and “out” from the middle plane of cell walls.
The mechanism of fold formation may be analyzed closer by looking at the interior cell walls in Figure 16. Three points, A, B, and C on the double-wall (marked by green color), are indicated on the three first “bent-out” folds. Accordingly, for the single wall, points D, E and F are chosen. Different stress states that the elements undergo are visualized by the maps of pressure in Figure 16d. According to the schematic diagram shown in Figure 2, the first stage of deformation is characterized by an increase of force and elastic deformation of the walls of the honeycomb. During creation of the “A” fold, a local peak of force can be seen in 0.21 ms (Figure 16e). It indicates the beginning of the fold formation on a single wall; however, in the opposite direction than the “A” fold. The minimum force in this range indicates the maximum strains, common in two directions (bending “in” and “out”) and a starting point for the formation the second-level folds (marked by point “D”). After reaching the maximum force in this range (0.32 ms) the single wall is bending until the minimum force when the folds “B” (0.47 ms) and next “E” (0.7 ms) are starting to deform. In 0.8 ms, a new level of fold is occurring (fold “C” and next “F”) according to the schema described above. The process of creating the three first folds ends in 1.3 ms, when the fold “F” is formed.
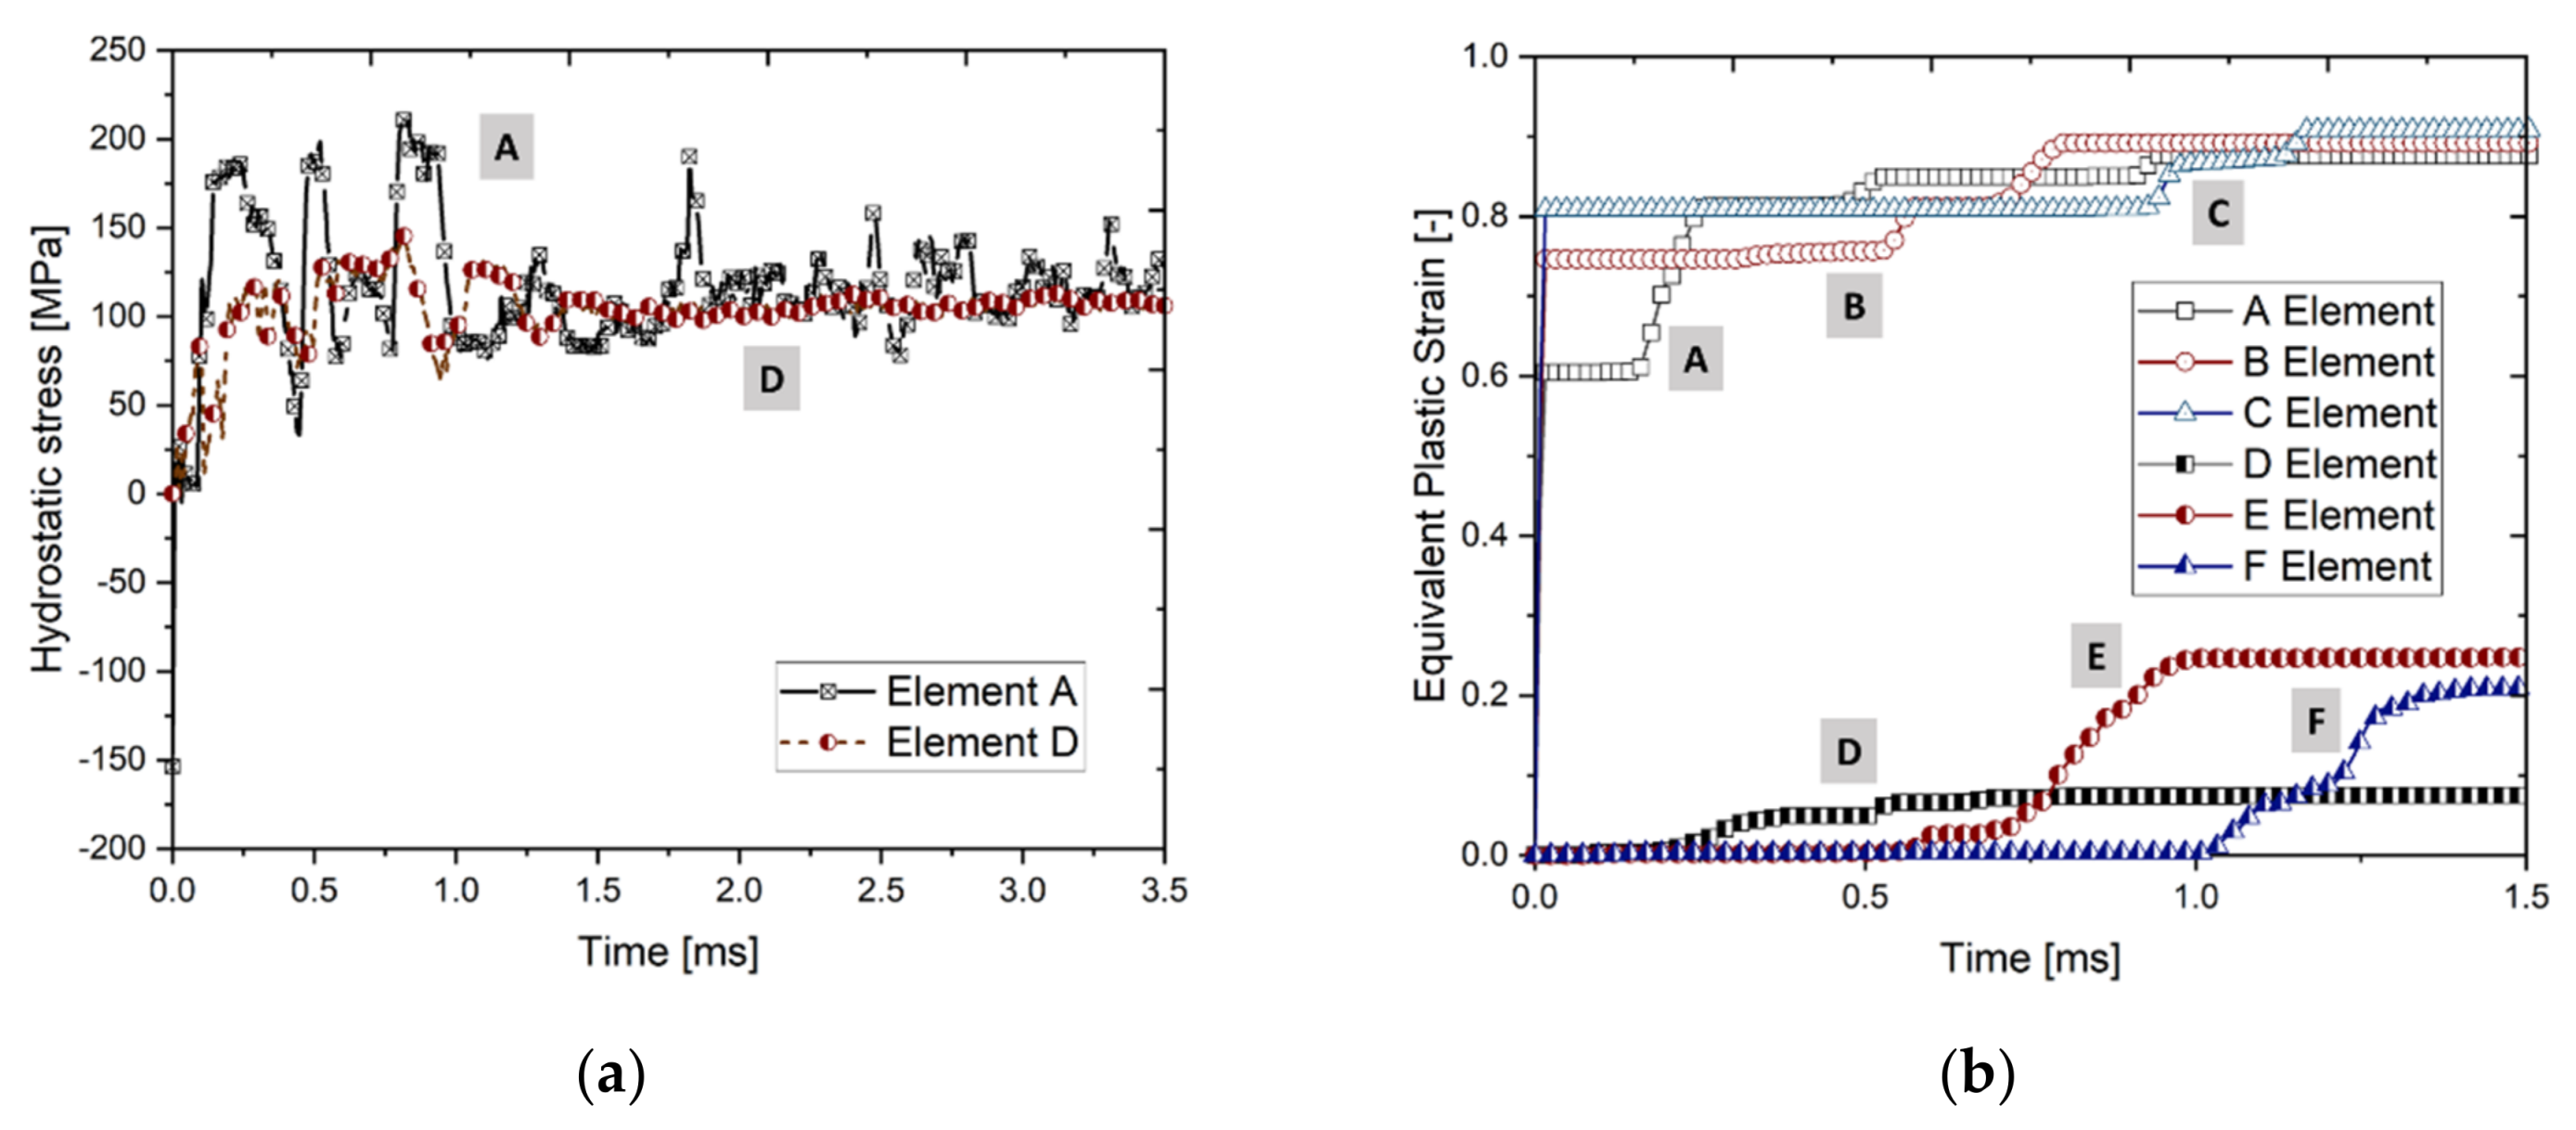
Figure 17 collects the graphs of the time evolution of the hydrostatic stress of the points A and D and of the equivalent plastic strain for all analyzed points. Numerous fluctuations are observed in the pressure curve featuring the complex elements loading paths and are slightly different for the two chosen points. At a certain moment (0.16 ms for A and 0.32 ms for D—Figure 17b), the stresses are concentrating which localizes a fold and causes a sudden increase of the plastic strain. The stiffer double walls are characterized by a higher limit for forces that can be applied without plastic deformation, therefore states of stresses on the yield surface are higher for point A than for D The evolution of equivalent plastic strain in time shows the order of fold formation: fold A (double wall) and then D (single wall) followed by the second folds B and E and, finally, C and F. Figure 17b indicates also that folds A, B and C are forming in a similar way, opposite to the folds on the single walls, which are less stiff and therefore may form a different size of folds.
It is already known that folding of honeycombs in compressive tests may occur in a different order starting from the top or the bottom side of honeycombs, or even sometimes originating in the middle [19]. The reasons which determine the stress concentrations are complex and not fully clear. In the discussed blast and quasi-static experimental tests, folds start to form from the bottom side, which is also reproduced in the simulation. It must be emphasized that in the above-described simulation models the folding process without any additional numerical techniques was sometimes used to impose the first fold (like, for example, an artificial structure weakening by deletion of a mesh element in the place of the expected fold). The above-discussed model consists of the shell honeycomb structure regularly meshed by a fine mesh which coupled with the optimized material model is sufficient to obtain correct results.
5. Conclusions
The presented study concerns a blast test performed by means of the explosive-driven shock tube, in which the thin-walled aluminum honeycomb structures are axially compressed while absorbing the blast energy. The presented experimental results show the structural response to compression induced by the detonation of 15 g, 30 g and 50 g of C4 explosive material.
It is experimentally confirmed that the honeycombs of the same height but covering the different areas (with 7, 19 or 53cells) subjected to compression are characterized by comparable values of the peak and mean equivalent stresses. It can also be concluded that in the EDST blast test, the honeycomb response is not influenced by the area covered by the structure and a smaller structure may represent well the behavior of a structure with a larger number of cells. While comparing the experimental stress–strain curves, an influence of increasing strain rate is noticed. In the dynamic compression, the measured peak and mean stresses may be 35% higher than when obtained at quasi-static rates.
The numerical simulation prepared on the basis of the experimental investigation, and validated in the quasi-static compression test, shows the mechanism of the fold formation that cannot be analyzed during experimental dynamic loading. The shock waves travel along the height of the structure until the stresses achieve the maximum value, forming the first fold. Since then, the deformation is localized and subsequent folds occur to the full densification of the structure.
The presented study can be useful in analyzing the deformation of aluminum thin-walled honeycombs and in the further process of optimization of honeycomb-based structures applied to attenuate explosive waves. It also can be helpful in prototyping other cellular structures tested by means of the discussed experimental blast test technique.
Author Contributions
Conceptualization T.F. and P.P.; methodology L.B.; software M.S.; validation M.S. and P.P.; formal analysis L.B. and M.S.; investigation L.B. and P.P.; resources A.R.; data curation T.F., M.S., P.P, and L.B; writing—original draft preparation T.F. and M.S.; writing—review and editing M.S., T.F., L.B., P.P. and A.R.; visualization M.S.; supervision T.F., P.P. and A.R.; project administration T.F. and A.R.
Funding
This research received no external funding.
Conflicts of Interest
The authors declare no conflict of interest.
References
- Suceska, M. Test Methods for Explosives; Springer Science & Business Media: Berlin/Heidelberg, Germany, 2012. [Google Scholar]
- Needham, C.E. Blast Waves (Shock Wave and High Pressure Phenomena); Springer: London, UK; New York, NY, USA, 2010. [Google Scholar]
- Dang, X.; Chan, P.C. Design and test of a blast shield for Boeing 737 over head compartment. Shock Vib. 2006, 13, 629–650. [Google Scholar] [CrossRef]
- Spranghers, K.; Vasilakos, I.; Lecompte, D.; Sol, H.; Vantomme, J. Identification of the plastic behavior of aluminum plates under free air explosions using inverse methods and full-field measurements. Int. J. Solids Struct. 2014, 51, 210–226. [Google Scholar] [CrossRef] [Green Version]
- Tyas, A. Experimental Measurement of Pressure Loading from Near-Field Blast Events: Techniques, Findings and Future Challenges. Proceedings 2018, 2, 471. [Google Scholar] [CrossRef] [Green Version]
- Henshall, B.D. The Use of Multiple Diaphragms in Shock Tubes; No. ARC-CP-291; ARC-18062; Gt. Brit. Aeronautical Research Council: London, UK, 1955. [Google Scholar]
- Lloyd, A.; Jacques, E.; Saatcioglu, M.; Palermo, D.; Nistor, I.; Tikka, T. Capabilities of a shock tube to simulate blast loading on structures. ACI Spec. Publ. 2010, 281, 35–54. [Google Scholar]
- Andreotti, R.; Colombo, M.; Guardone, A.; Martinelli, P.; Riganti, G.; Di Prisco, M. Performance of a shock tube facility for impact response of structures. Int. J. Non-Linear Mech. 2015, 72, 53–66. [Google Scholar] [CrossRef]
- Aune, V.; Fagerholt, E.; Langseth, M.; Børvik, T. A shock tube facility to generate blast loading on structures. Int. J. Prot. Struct. 2016, 7, 340–366. [Google Scholar] [CrossRef] [Green Version]
- Louar, M.A.; Belkassem, B.; Ousji, H.; Spranghers, H.; Kakogiannis, D.; Pyl, L.; Vantomme, J. Explosive driven shock tube loading of aluminium plates: Experimental study. Int. J. Impact Eng. 2015, 86, 111–123. [Google Scholar] [CrossRef]
- Ousji, H.; Belkassem, B.; Louar, M.A.; Reymen, B.; Martino, J.; Lecompte, D.; Pyl, L.; Vantomme, J. Air-blast response of sacrificial cladding using low density foams: Experimental and analytical approach. Int. J. Mech. Sci. 2017, 128–129, 459–474. [Google Scholar] [CrossRef]
- Blanc, L.; Sturtzer, M.-O.; Schunck, T.; Eckenfels, D.; Legendre, J.-F. Blast Wave Mitigation Using Multi-Phase Solid Material in a Sandwich Cladding; Military Aspects of Blast and Shock 25: The Hague, The Netherland, 2018. [Google Scholar]
- Ashby, M.F.; Gibson, L.J. Cellular Solids: Structure and Properties, Second Edition; Cambridge University Press: Cambridge, UK, 1997; pp. 93–174. [Google Scholar]
- Bixby, H.W. Development of a Paperboard Honeycomb Decelerator for Use with Large Platforms in Aerial Delivery Systems, USAF Report WADC TR-59-776. May 1958.
- Ali, A.; Benson, L.R. Energy Absorption Properties of Aluminum Honeycomb; No. TSB-110; Hexcel Products, Inc.: Berkeley, CA, USA, 1960. [Google Scholar]
- McFarland, R.K. The Development of Metal Honeycomb Energy-Absorbing Elements; Jet Propulsion Laboratory, California Institute of Technology: Pasadena, CA, USA, 1964. [Google Scholar]
- Alexander, J.M. An approximate analysis of the collapse of thin cylindrical shells under axial loading. Q. J. Mech. Appl. Math. 1960, 13, 10–15. [Google Scholar] [CrossRef]
- Wierzbicki, T. Crushing Analysis of Metal Honeycombs. Int. J. Impact Eng. 1983, 1, 157–174. [Google Scholar] [CrossRef]
- Wierzbicki, T.; Abramowicz, W. On the Crushing Mechanism of Thin-walled Structures. J. Appl. Mech. 1983, 50, 727–734. [Google Scholar] [CrossRef]
- AymanAshab, A.S.M.; Ruan, D.; Lu, G.; Bhuiyan, A.A. Finite Element Analysis of Aluminum Honeycombs Subjected to Dynamic Indentation and Compression Loads. Materials 2016, 9, 162. [Google Scholar]
- Yamashita, M.; Gotoh, M. Impact behavior of honeycomb structures with various cell specifications—Numerical simulation and experiment. Int. J. Impact Eng. 2005, 32, 618–630. [Google Scholar] [CrossRef]
- Jeyasingh, V.M.A. Analytical Modeling of Metallic Honeycomb for Energy Absorption and Validation with FEA. Ph.D. Thesis, Department of Mechanical Engineering, College of Engineering, Wichita State University, Wichita, KS, USA, 2005. [Google Scholar]
- Zhang, Y.; Yan, L.; Zhang, W.; Su, P.; Han, B.; Guo, S. Metallic tube-reinforced aluminum honeycombs: Compressive and bending performances. Compos. Part B Eng. 2019, 171, 192–203. [Google Scholar] [CrossRef]
- Yang, X.; Sun, Y.; Yang, J.; Pan, Q. Out-of-plane crashworthiness analysis of bio-inspired aluminum honeycomb patterned with horseshoe mesostructure. Thin Walled Struct. 2018, 125, 1–11. [Google Scholar] [CrossRef]
- Mousanezhad, D.; Haghpanah, B.; Ghosh, R.; Hamouda, A.S.; Nayeb-Hashemi, H.; Vaziri, A. Elastic properties of chiral, anti-chiral, and hierarchical honeycombs: A simple energy-based approach. Theor. Appl. Mech. Lett. 2016, 6, 81–96. [Google Scholar] [CrossRef] [Green Version]
- Ashby, M.F.; Evans, A.G.; Fleck, N.A.; Gibson, L.J.; Hutchinson, J.W.; Wadley, H.N.G. Metal Foams: A Design Guide; USA Butterworth Heinemann: Alpharetta, GA, USA, 2000. [Google Scholar]
- Kang, K.-J. Wire-woven cellular materials: The present and future. Prog. Mater. Sci. 2015, 69, 213–307. [Google Scholar] [CrossRef]
- Honeycomb Panels. Available online: https://www.honeycombpanels.eu/en/products/honeycomb/aluminium (accessed on 28 November 2019).
- Simoens, B.; Lefebvre, M. Influence of the Shape of an Explosive Charge: Quantification of the Modification of the Pressure Field. Cent. Eur. J. Energ. Mater. 2015, 12, 195–213. [Google Scholar]
- Taylor, G.I. The pressure and impulse of submarine explosion waves on plates. In The Scientific Papers of Sir Geoffrey Ingram Taylor; Volume III: Aerodynamics and the Mechanics of Projectiles and Explosions; Batchelor, G.K., Ed.; Cambridge University Press: Cambridge, UK, 1963; pp. 287–303. [Google Scholar]
- Kambouchev, N.; Noels, L.; Radovitzky, R. Nonlinear compressibility effects on fluid structure interactions and their implications on the blast loading of structures. J. Appl. Phys. 2006, 100, 1–12. [Google Scholar] [CrossRef]
- Kambouchev, N.; Noels, L.; Radovitzky, R. Fluid structure interaction effects in the dynamic response of free-standing plates to uniform shock loading. J. Appl. Mech. 2007, 74, 1042–1045. [Google Scholar] [CrossRef]
- Li, Q.M.; Magkiriadis, I.; Harrigan, J.J. Compressive strain at the onset of densification of cellular solids. J. Cell. Solid 2006, 42, 371–392. [Google Scholar] [CrossRef]
- Onate, E.; Labra, C.; Zarate, F.; Rojek, J. Modelling and Simulation of the Effect of Blast Loading on Structures Using an Adaptive Blending of Discrete and Finite Element Methods; Taylor & Francis Group: Abingdon, UK, 2012. [Google Scholar]
- Fras, T.; Roth, C.C.; Mohr, D. Dynamic perforation of ultra-hard high-strength armor steel: Impact experiments and modeling. Int. J. Impact Eng. 2019, 131, 256–271. [Google Scholar] [CrossRef]
- Fras, T.; Colard, L.; Pawlowski, P. Perforation of aluminum plates by fragment simulating projectiles (FSP). Int. J. Multiphys. 2016, 9, 267–285. [Google Scholar] [CrossRef]
- Donea, J.; Huerta, A.; Ponthot, J.-P.; Rodriguez-Ferran, A. Chapter 14: Arbitrary Lagrangian–Eulerian Methods. In Encyclopedia of Computational Mechanics; Stein, E., Borst, R., Hughes, T.J.H., Eds.; John Wiley & Sons: Hoboken, NJ, USA, 2004; Volume 1, pp. 1–25. [Google Scholar]
- Thai, D.-K.; Kim, S.-E. Numerical investigation of the damage of RC members subjected to blast loading. Eng. Fail. Anal. 2018, 92, 350–367. [Google Scholar] [CrossRef]
- Johnson, G.R.; Cook, W.H. A Constitutive Model and Data for Metals Subjected to Large Strains, High Strain Rates, and High Temperatures. In Proceedings of the 7th International Symposium on Ballistics, The Hague, The Netherlands, 19–21 April 1983. [Google Scholar]
- Livermore Software Technology Corporation. LS–Dyna Keyword User’s Manual. Volume II. Material Model; Livermore Software Technology Corporation: Livermore, CA, USA, 2016; pp. 485–487. [Google Scholar]
- Kikuo, I.; Toshiro, S.; Tomoyuki, S.; Hidemitsu, H.; Yasuaki, H. A Study on Mechanical Properties of Aluminum Alloy; Tokyo Institute of Technology: Meguro, Tokyo, 2003. [Google Scholar]
- Aluminum Handbook. Available online: http://metal.matdb.jp/ (accessed on 1 August 2019).
- ASM International. Atlas of Stress-Strain Curves; ASM International: Cleveland, OH, USA, 2002; pp. 367–369. [Google Scholar]
- Ando, M.; Suzuki, Y.; Itoh, G. Effects of magnesium addition on threshold stress of Al–Mn alloys. J. Jpn. Inst. Light Met. 2012, 62, 300–305. [Google Scholar] [CrossRef]
- Higashi, K.; Mukai, T.; Kaizu, K.; Tsuchida, S.; Tanimura, S. High strain rate deformation characteristics in commercial aluminium alloys. J. Soc. Mater. Sci. 1990, 39, 1619–1624. [Google Scholar] [CrossRef]
- Livermore Software Technology. Corporation LS–Dyna Keyword User’s Manual. Volume I; Livermore Software Technology Corporation: Livermore, CA, USA, 2016; pp. 1016–1089. [Google Scholar]
- Nemat-Nasser, S.; Amini, M.R.; Choi, J.Y.; Isaacs, J. Experimental and computional evaluation of compressive response of single and hex-arreayed aluminum tubes. J. Mech. Mater. Struct. 2007, 2, 1910–1920. [Google Scholar] [CrossRef] [Green Version]
- Stanczak, M.; Fras, T.; Blanc, L.; Pawlowski, P.; Rusinek, A. Numerical Modelling of Honeycomb Structure Subjected to Blast Loading. In Proceedings of the 12th European LS-DYNA Conference, Koblenz, Germany, 14–16 May 2019. [Google Scholar]
- Rashed, A.; Babaluo, A.A.; Yazdani, M.; Parvin, P.H. Investigation on high-velocity impact performance of multi-layered alumina ceramic armors with polymeric interlayers. J. Compos. Mater. 2015, 50, 3561–3576. [Google Scholar] [CrossRef]
- Fras, T.; Rusinek, A.; Pęcherski, R.B.; Bernier, R.; Jankowiak, T. Analysis of friction influence on material deformation under biaxial compression state. Tribol. Int. 2014, 80, 14–24. [Google Scholar] [CrossRef]
- Fuller, D.D. Coefficients of Friction. In American Institute of Physics Handbook; Gray, D.E., Ed.; McGraw-Hill Book Company: New York, NY, USA, 1964; pp. 2–42. [Google Scholar]
- Dong, S.; Dapino, M.; Sheldon, A.; Pydimarry, K. Friction in LS-DYNA: Experimental Characterization and Modeling Application. In Proceedings of the 14th International LS-DYNA Users Conference, Dearborn, MI, USA, 12–14 June 2016. [Google Scholar]
Figure 1.
A 53-cell honeycomb structure: (a) non-deformed and (b,c) fully compressed.

Figure 2.
The generalized stress–strain curve representing the response of a metallic cellular structure to a compressive load.
Figure 2.
The generalized stress–strain curve representing the response of a metallic cellular structure to a compressive load.

Figure 3.
Explosive-driven shock tube: (a) scheme of the experimental configuration used to measure a blast wave pressure without application of an energy-absorbing structure, (b) measured blast wave pressures p(t) generated by detonation of several C4 charges, (c) scheme of a test with an energy-absorptive structure and (d) picture of the set-up. Dimensions are in mm.
Figure 4.
Subsequent frames depicting compression of the honeycomb during the explosive-driven shock tube (EDST) blast test: (a–e) Different decrease of the sample height (bottom row) and different recording time (upper row).
Figure 4.
Subsequent frames depicting compression of the honeycomb during the explosive-driven shock tube (EDST) blast test: (a–e) Different decrease of the sample height (bottom row) and different recording time (upper row).

Figure 5.
(a) Comparison between the blast load profiles and the structural responses. (b) Stress–strain curves for the honeycomb structures compressed in the EDST blast test.
Figure 5.
(a) Comparison between the blast load profiles and the structural responses. (b) Stress–strain curves for the honeycomb structures compressed in the EDST blast test.
Figure 6.
Quasi-static compression of 53-cell and 7-cell honeycombs: (a) force over time and (b) stress over strain.
Figure 6.
Quasi-static compression of 53-cell and 7-cell honeycombs: (a) force over time and (b) stress over strain.

Figure 7.
Comparison of the stress-strain curves resulted from quasi-static and blast-induced compression.
Figure 7.
Comparison of the stress-strain curves resulted from quasi-static and blast-induced compression.

Figure 8.
Numerical representation of the tested configuration: (a) side view and (b) isometric view.
Figure 8.
Numerical representation of the tested configuration: (a) side view and (b) isometric view.

Figure 9.
Comparison of cells of the honeycomb structure: (a) top-view on the real sample, (b) geometry idealized by “regular hexagon” cells, and (c) “hexagonal” cells with dimensions closer to the real ones.
Figure 9.
Comparison of cells of the honeycomb structure: (a) top-view on the real sample, (b) geometry idealized by “regular hexagon” cells, and (c) “hexagonal” cells with dimensions closer to the real ones.
Figure 10.
(a) The results from the implicit simulations with the regular hexagonal and hexagonal cells referenced to force results from the quasi-static experiment; (b) close-up of the peak of force; and (c) close-up of the results in the plateau range.
Figure 10.
(a) The results from the implicit simulations with the regular hexagonal and hexagonal cells referenced to force results from the quasi-static experiment; (b) close-up of the peak of force; and (c) close-up of the results in the plateau range.
Figure 11.
Influence of (a) element size and (b) friction coefficients on the numerical results; (c) close-up of the peak of force.
Figure 11.
Influence of (a) element size and (b) friction coefficients on the numerical results; (c) close-up of the peak of force.
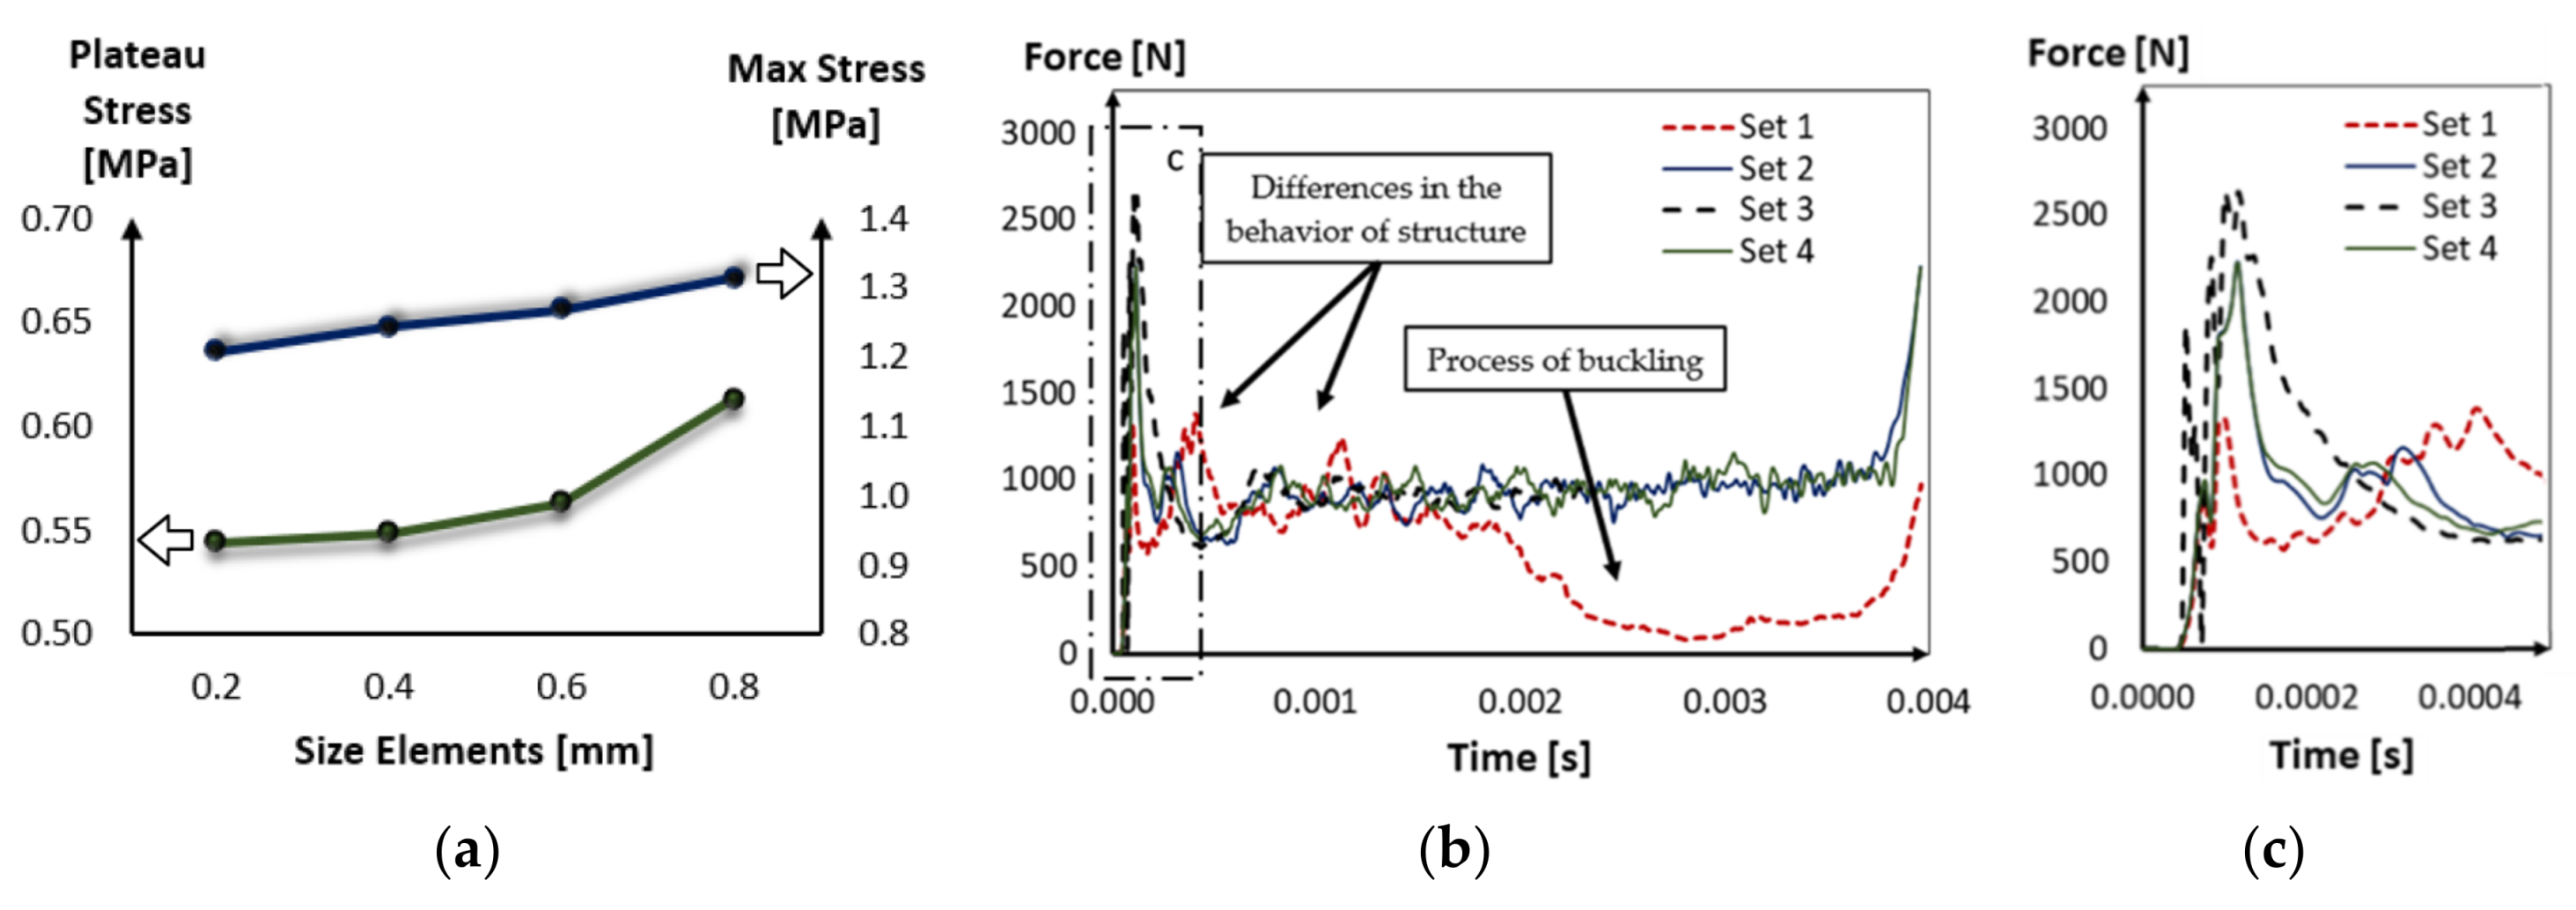
Figure 12.
Comparison between stress–strain curves obtained in the simulation and in the EDST blast test for (a) a 53-cell structure compressed in detonation of 50 g C4 and (b) 7-cell structure compressed in the detonation of 15 g C4.
Figure 12.
Comparison between stress–strain curves obtained in the simulation and in the EDST blast test for (a) a 53-cell structure compressed in detonation of 50 g C4 and (b) 7-cell structure compressed in the detonation of 15 g C4.

Figure 13.
Comparison between the experimental and numerical mean and peak stresses characteristic for the structural responses to compression caused by the detonation of various masses of C4: (a) 15 g of C4, mean stress; (b) 15 g of C4, peak stress; (c) 30 g of C4, mean stress; (d) 30 g of C4, peak stress; (e) 50 g of C4, mean stress; (f) 50 g of C4, peak stress.
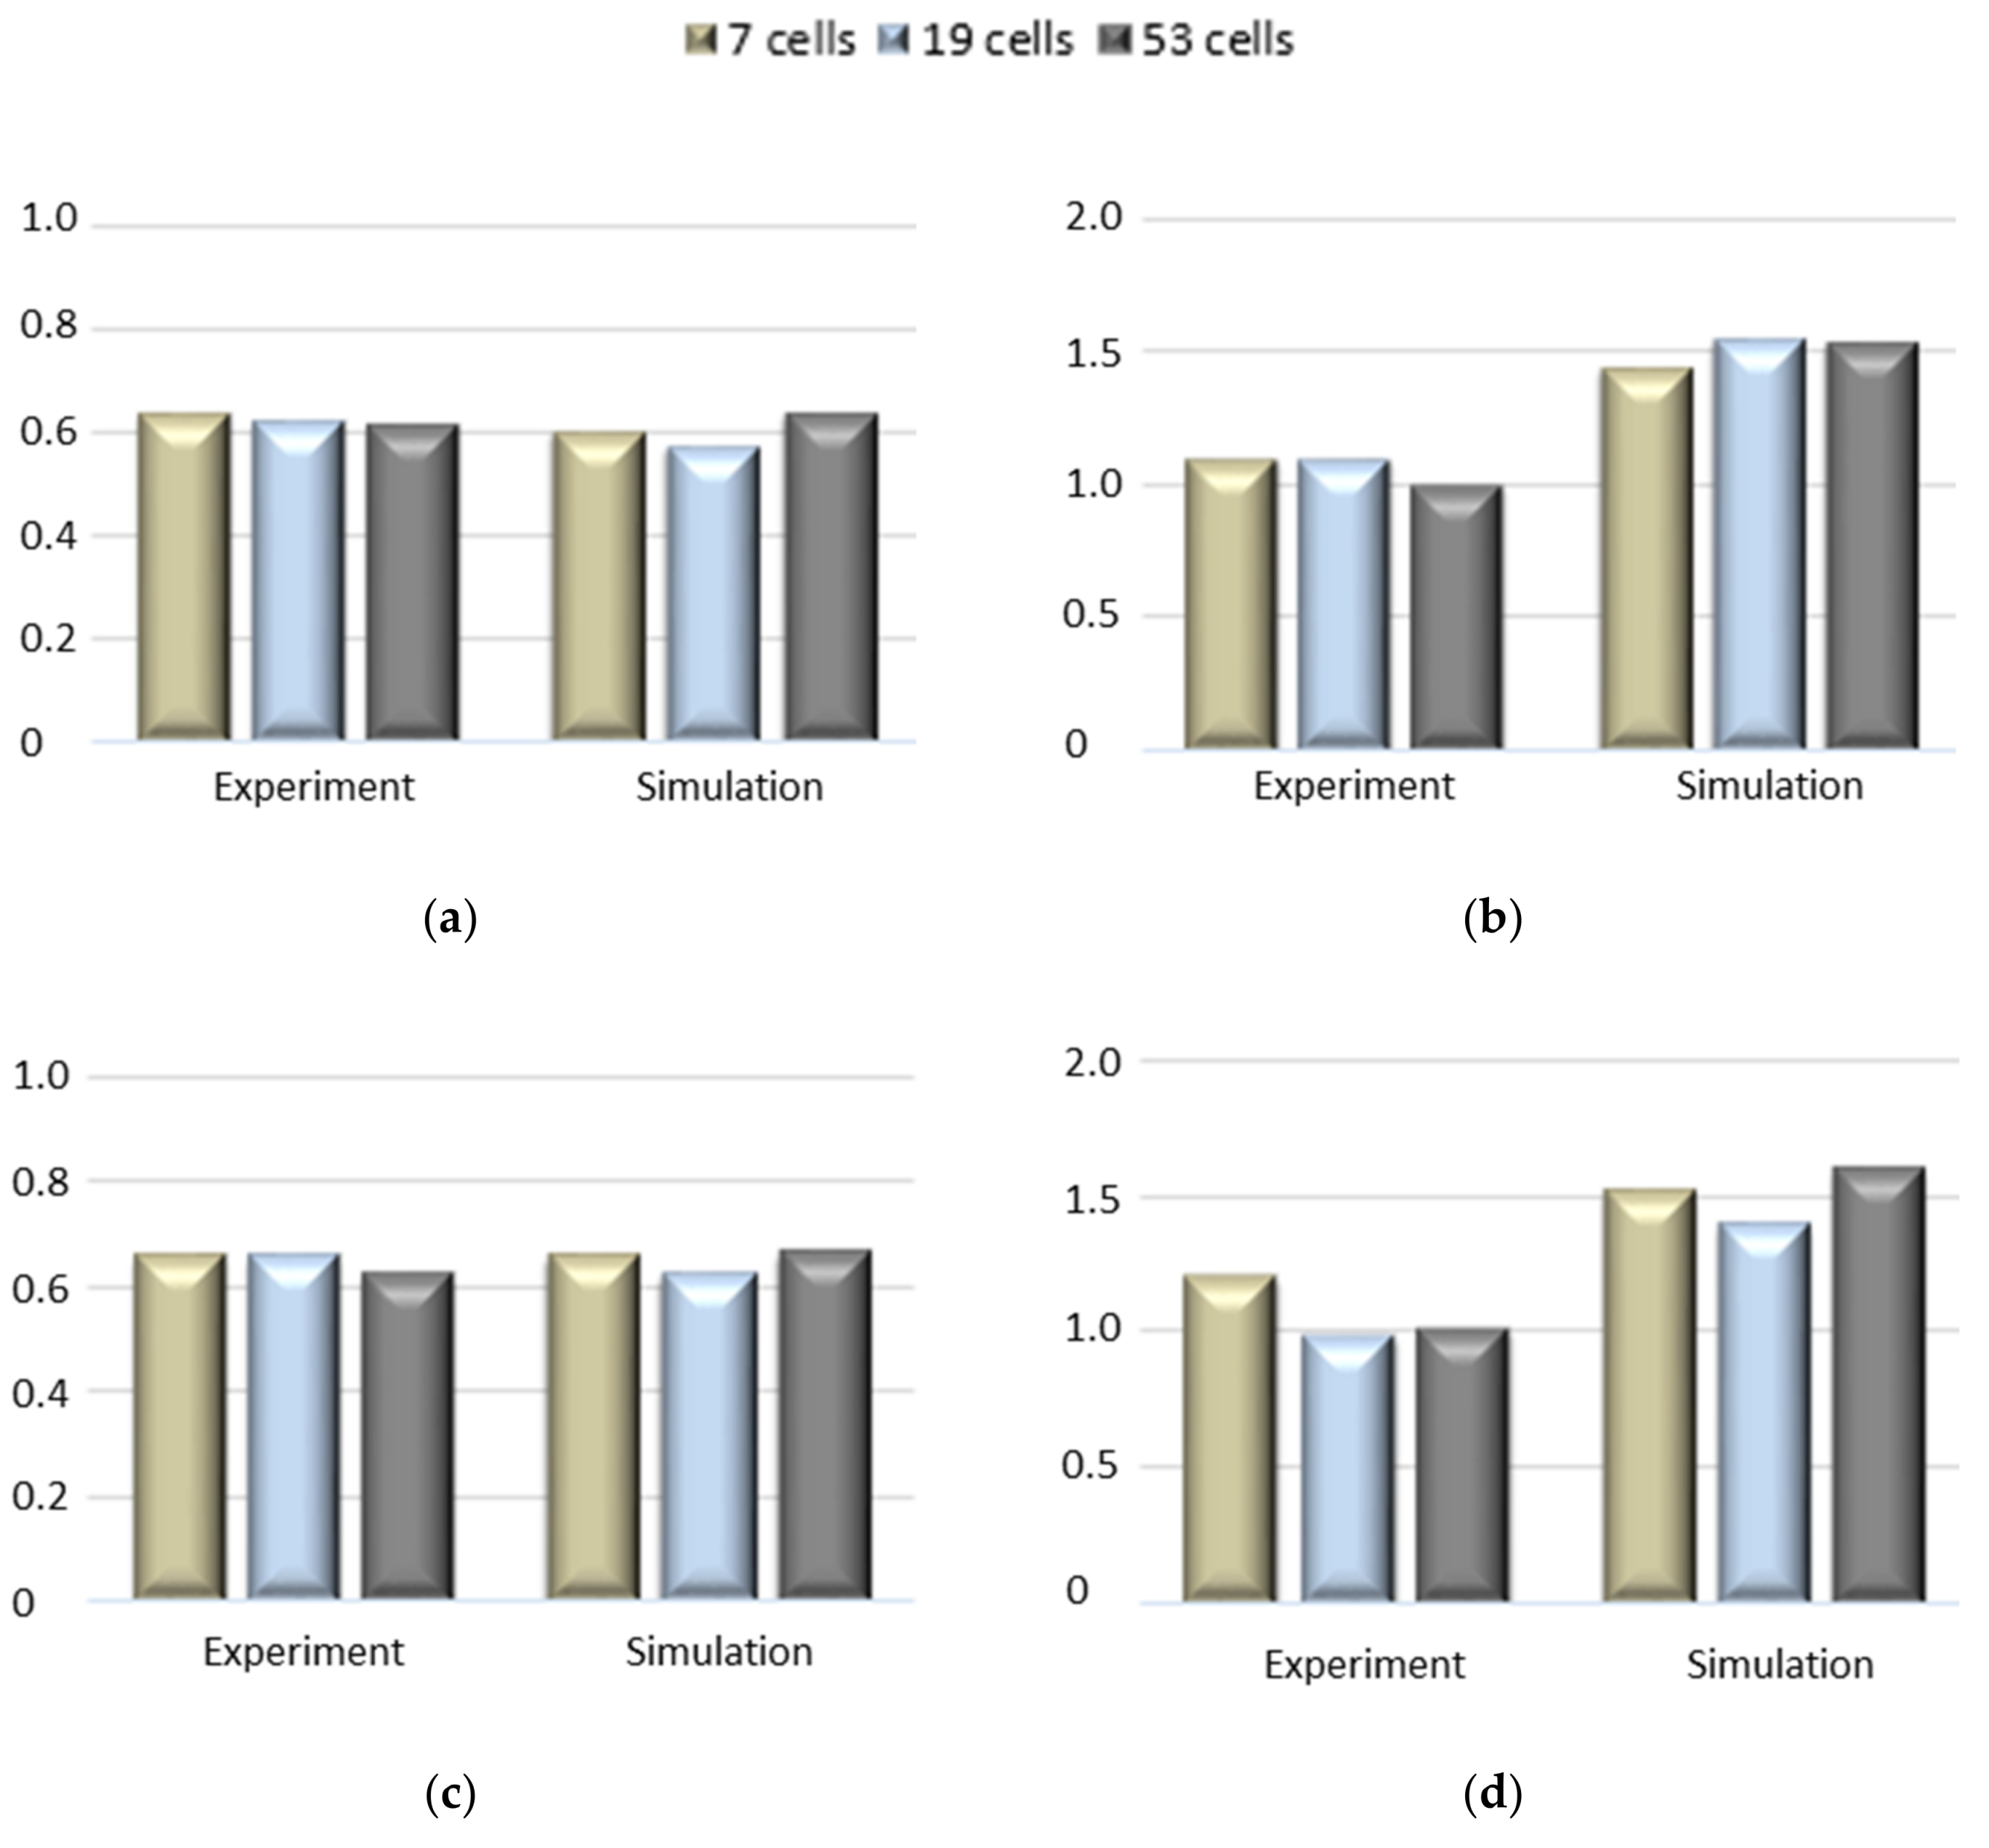

Figure 14.
Subsequent deformation for the cross-sections of (a) a 53-cell structure compressed due to detonation of 50 g C4, and (b) a 7-cell structure compressed due to detonation of 15 g C4.
Figure 14.
Subsequent deformation for the cross-sections of (a) a 53-cell structure compressed due to detonation of 50 g C4, and (b) a 7-cell structure compressed due to detonation of 15 g C4.
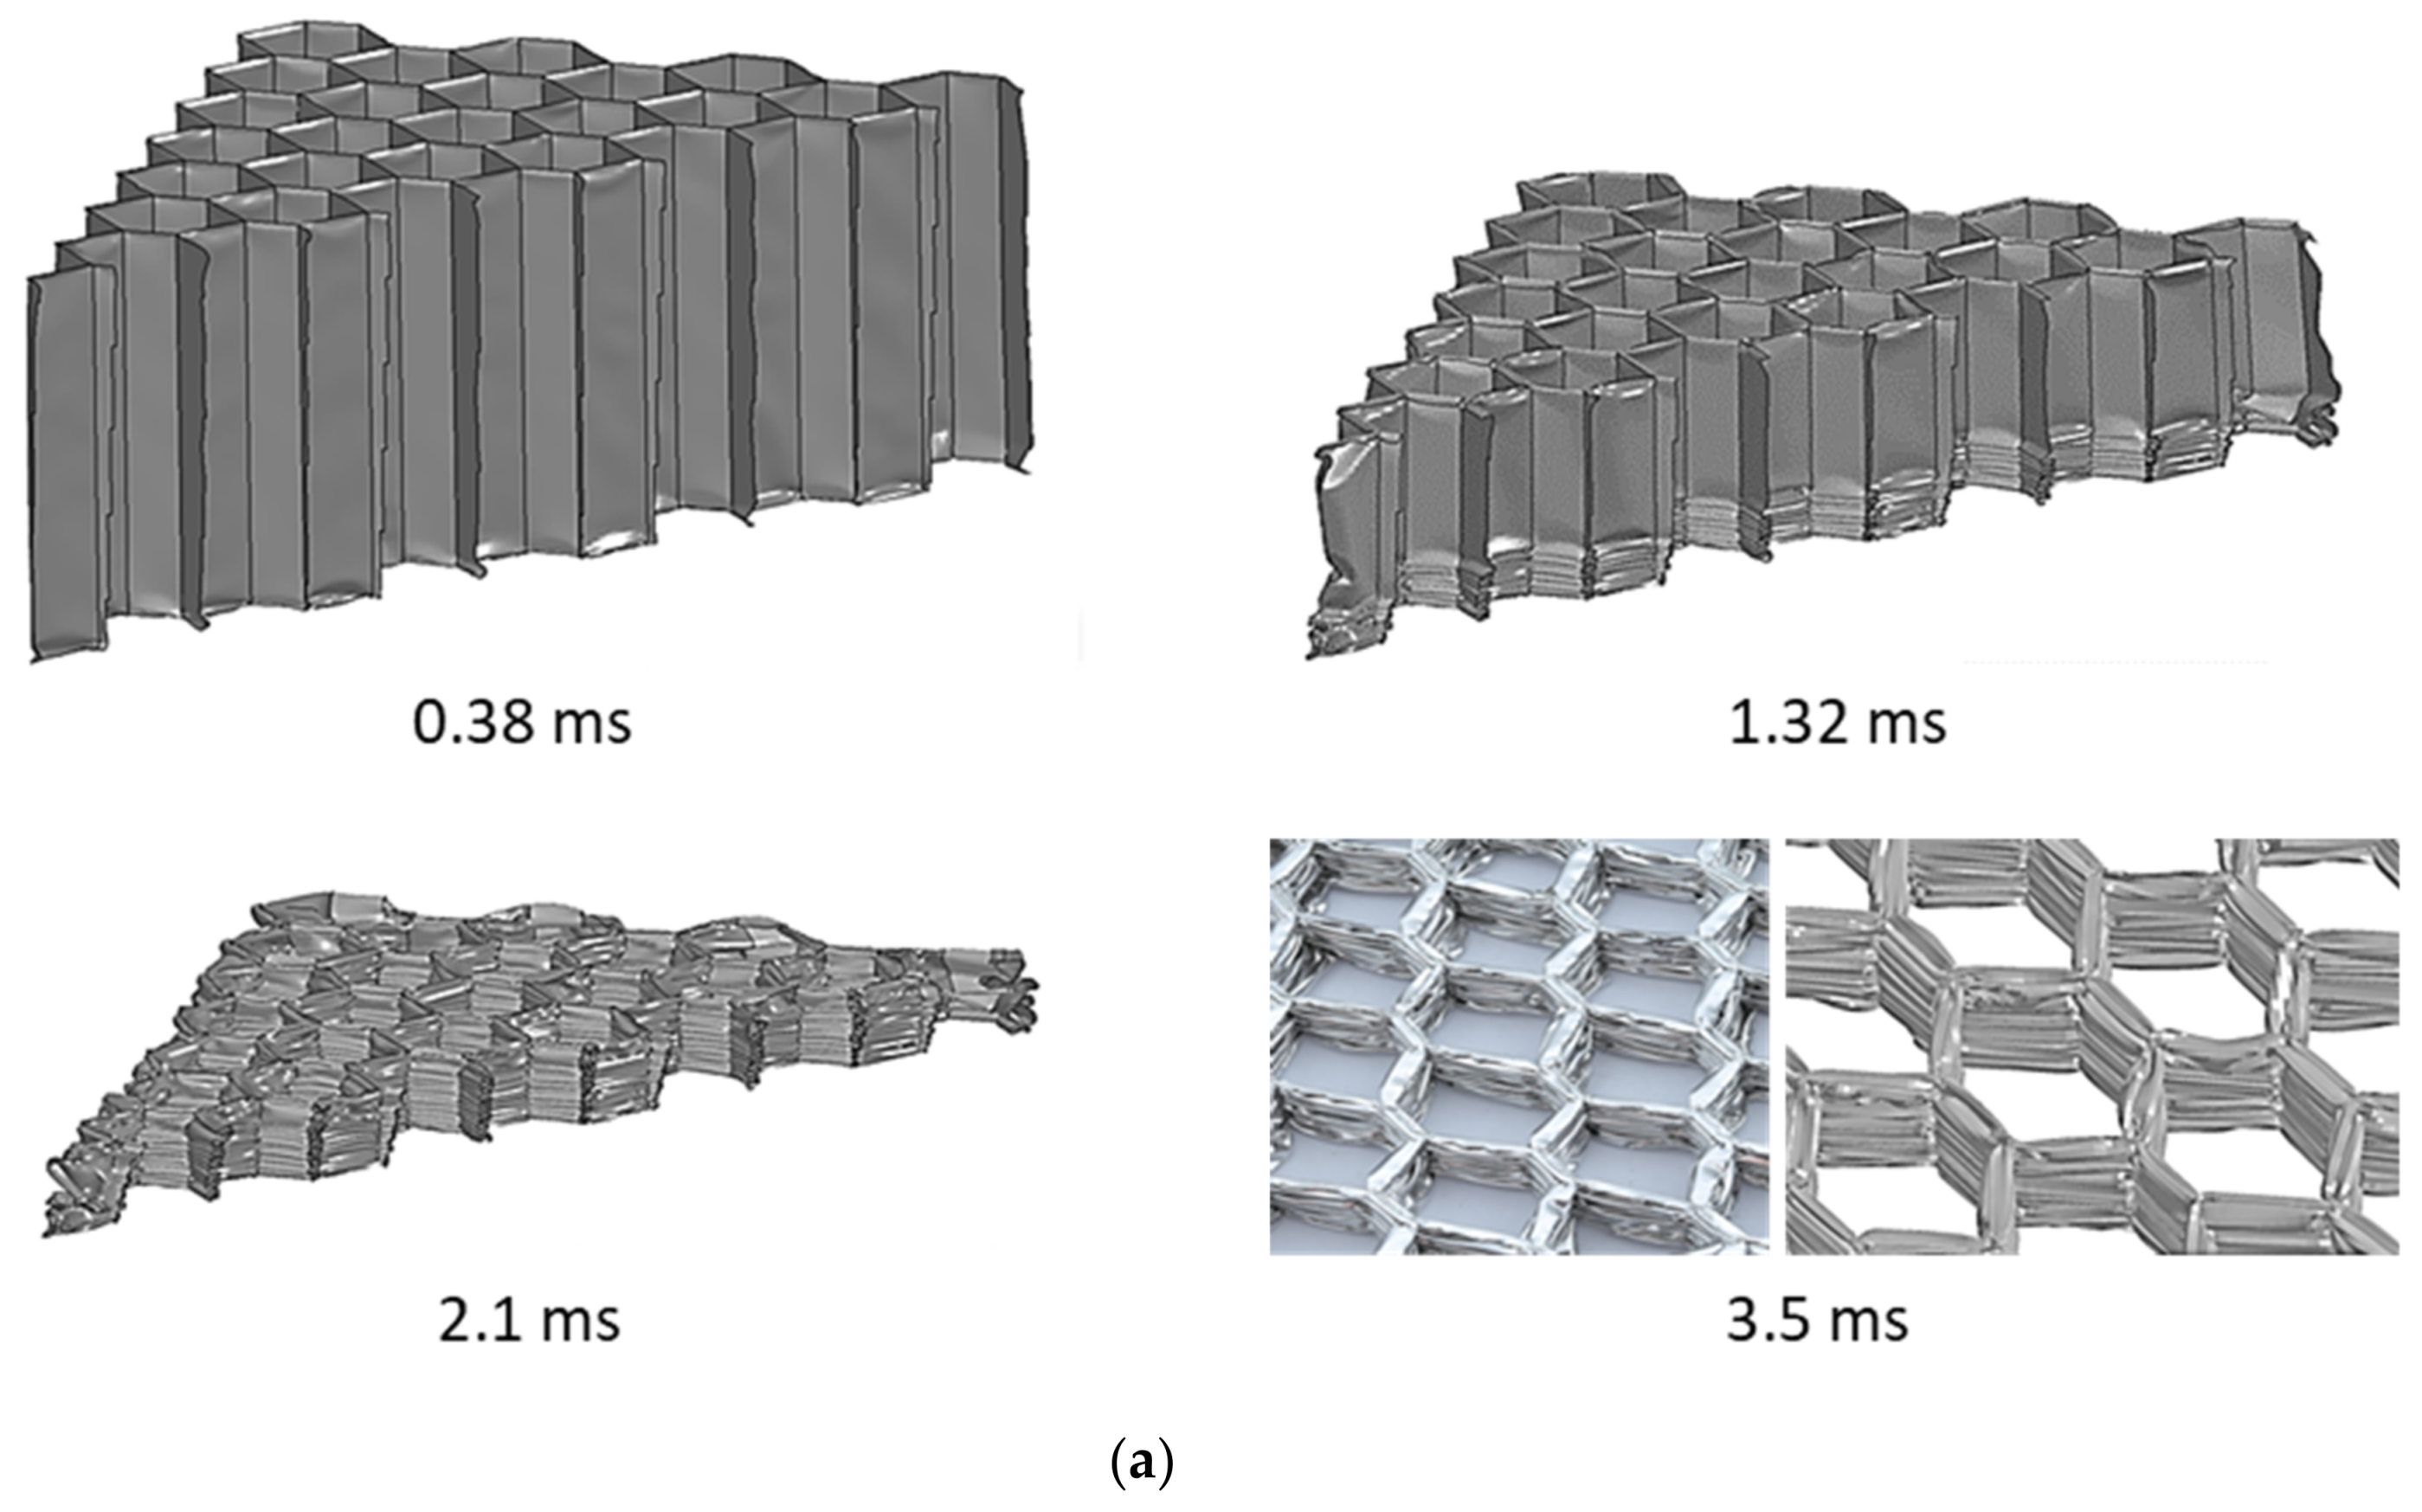

Figure 15.
Beginning of compression of the 7-cell structure caused by a detonation 15 g of C4 charge. Maps of the hydrostatic stresses.
Figure 15.
Beginning of compression of the 7-cell structure caused by a detonation 15 g of C4 charge. Maps of the hydrostatic stresses.

Figure 16.
Formation of the first three folds in the 7-cell honeycomb structure: (a) general view of the chosen walls; location of the points: (b) before deformation and (c) after deformation; and (d) deformation in maps of the pressure in the selected time instance (e) results of force over time.
Figure 16.
Formation of the first three folds in the 7-cell honeycomb structure: (a) general view of the chosen walls; location of the points: (b) before deformation and (c) after deformation; and (d) deformation in maps of the pressure in the selected time instance (e) results of force over time.
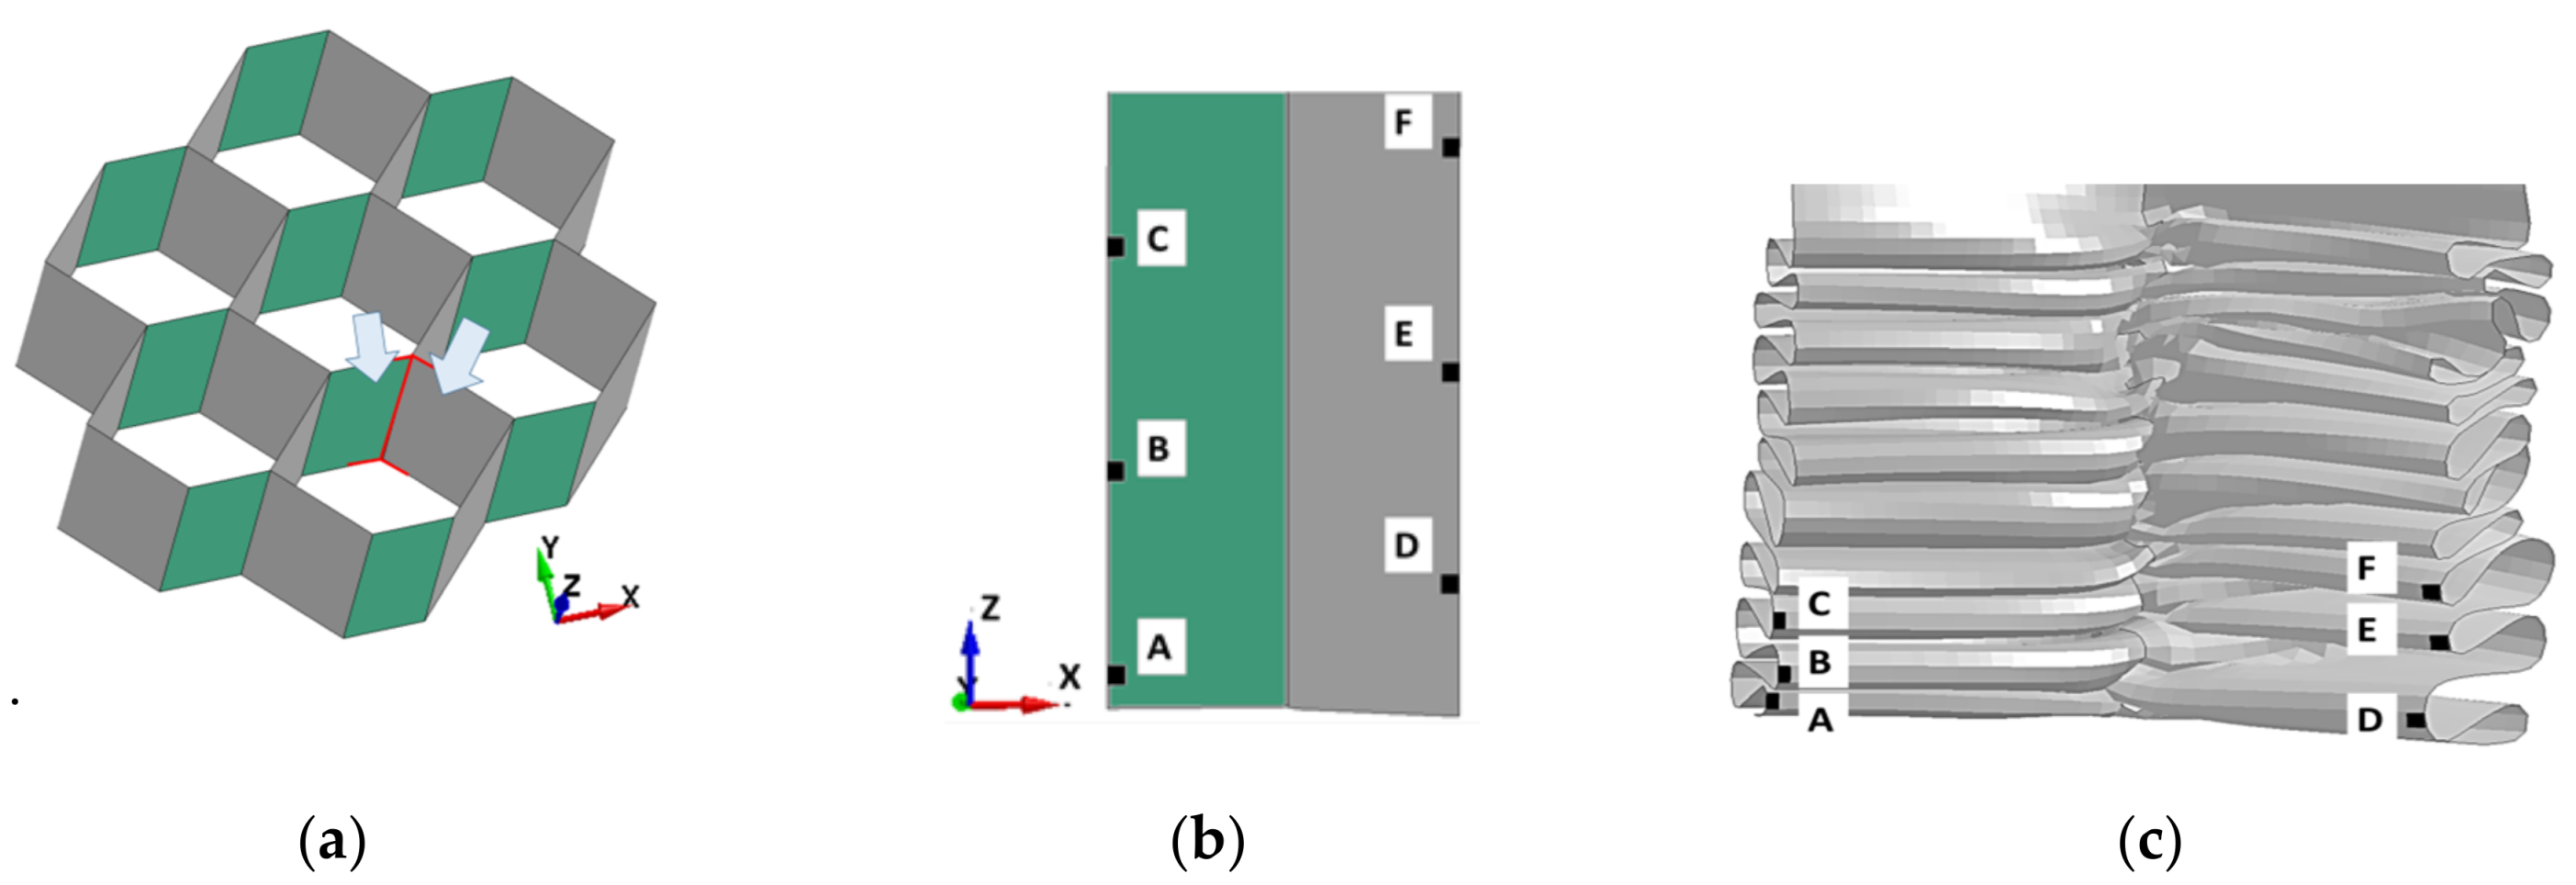
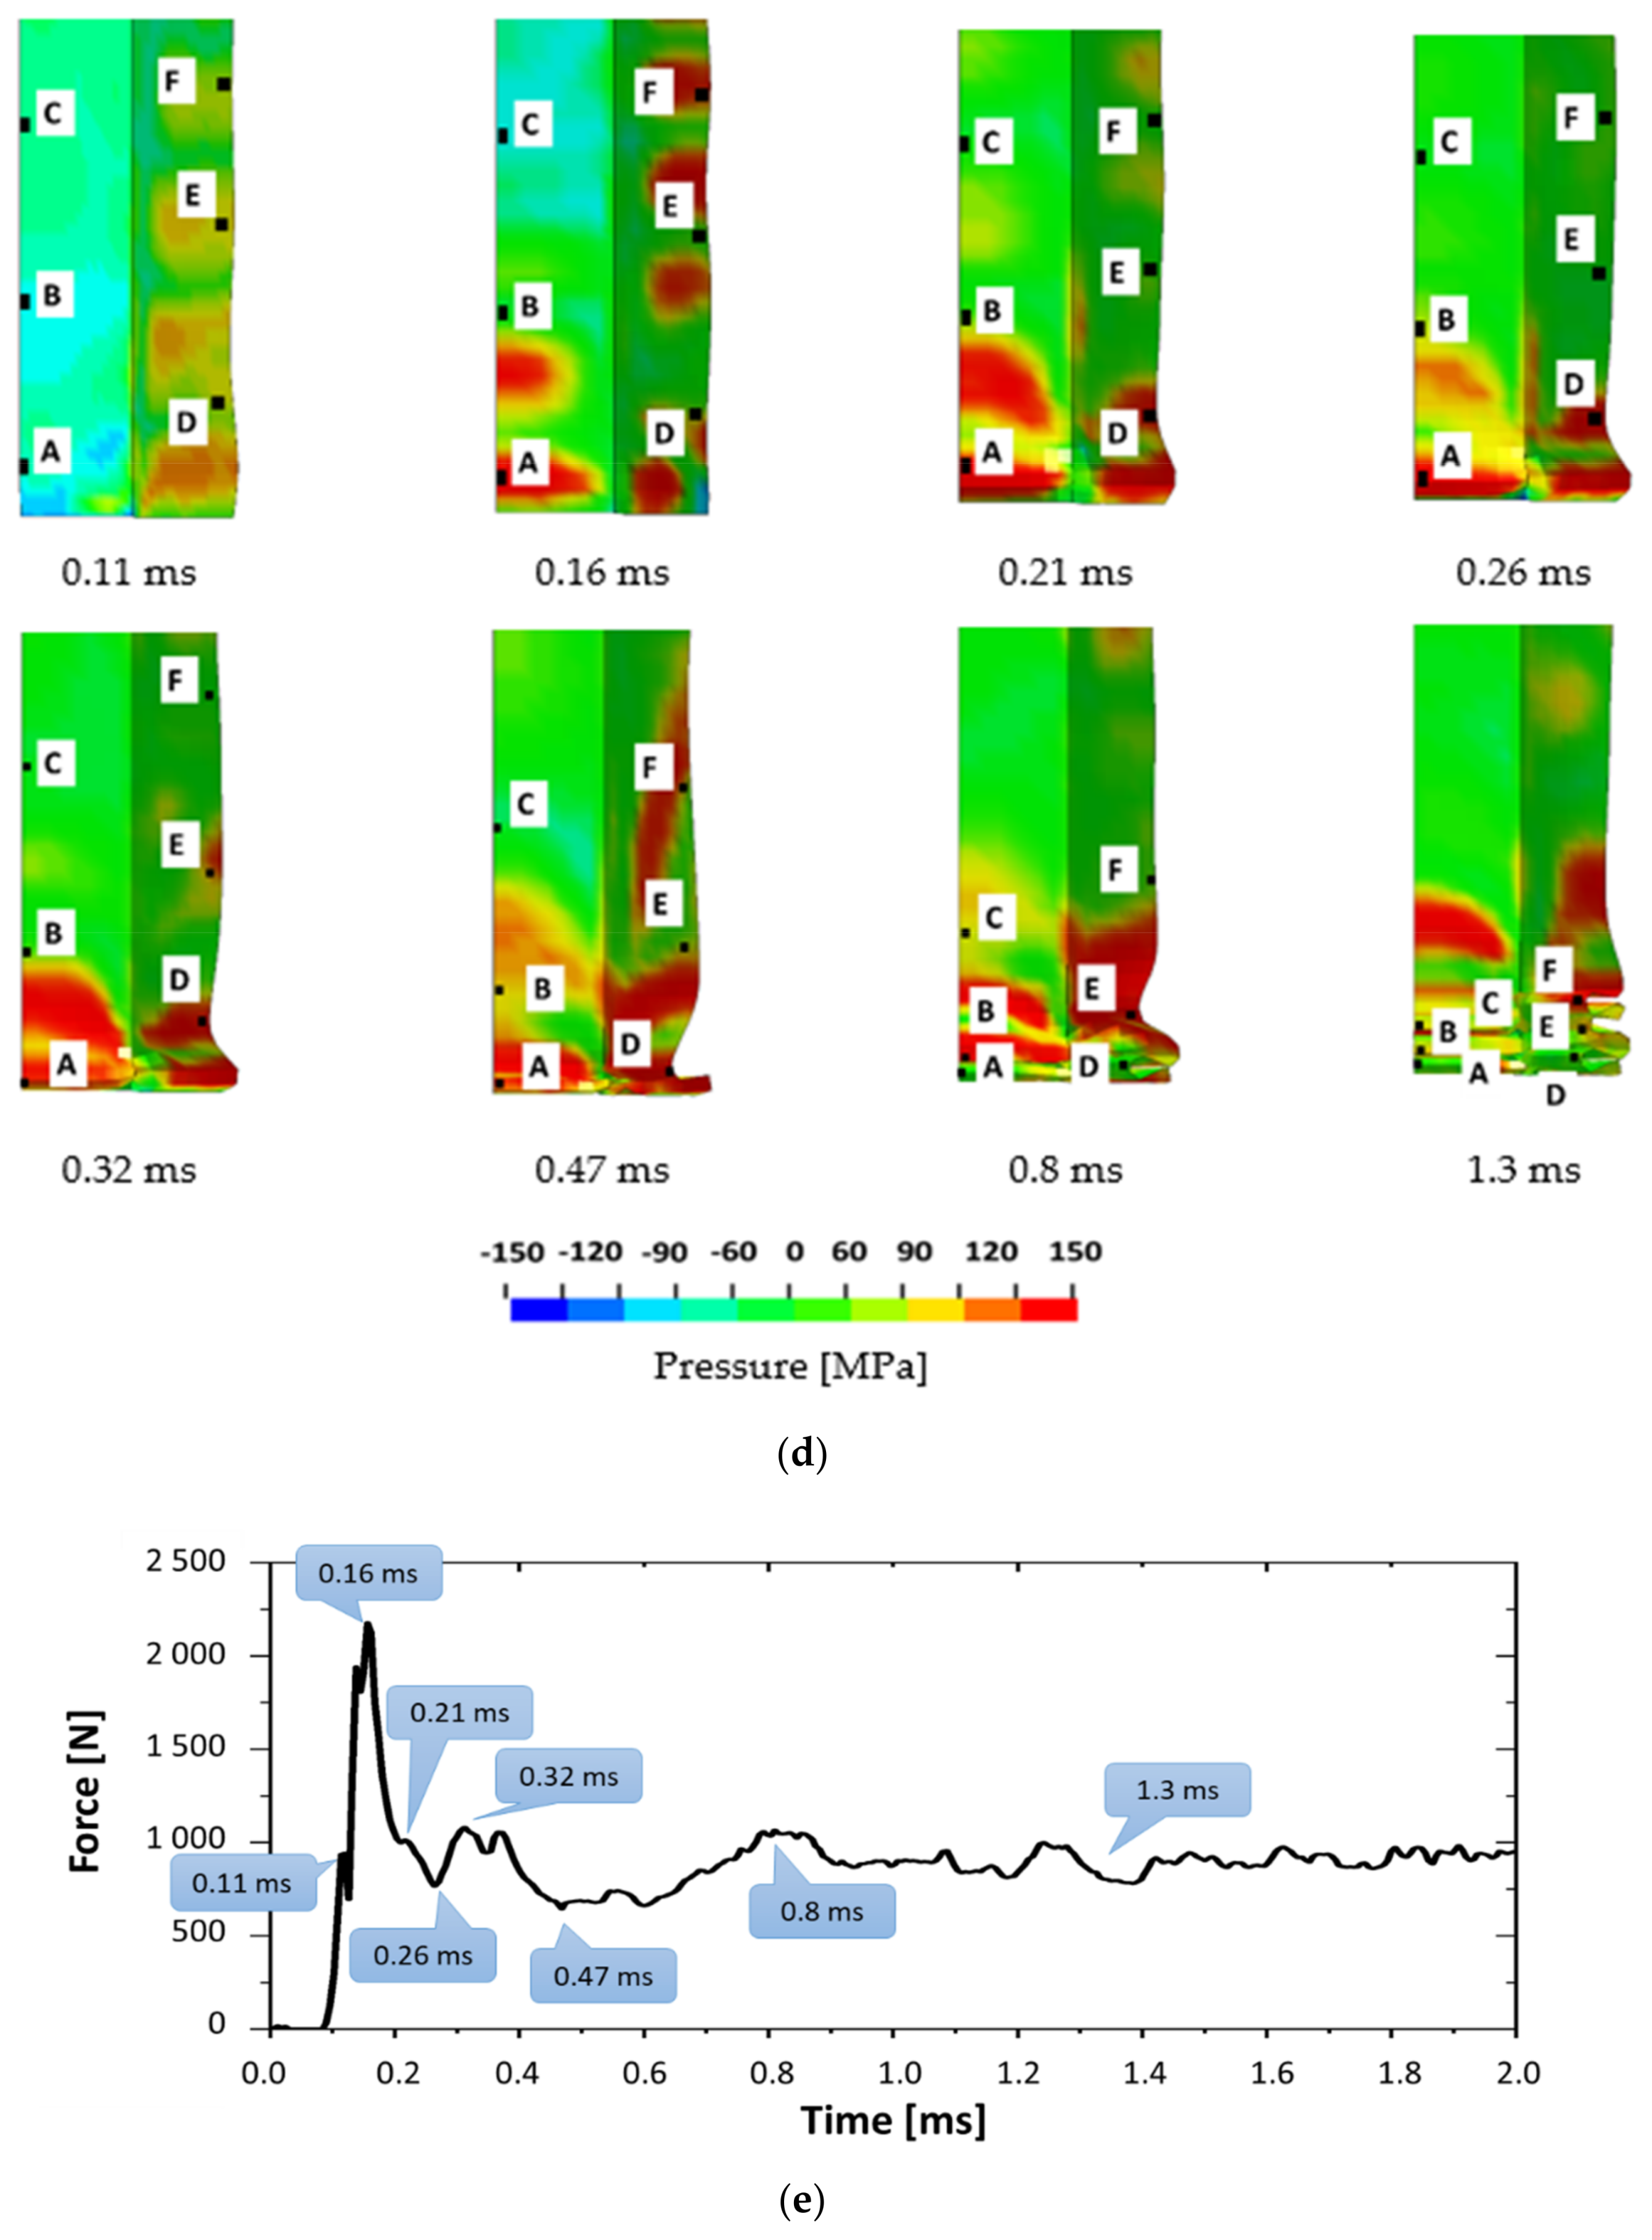
Figure 17.
(a) Hydrostatic stresses in time for the element chosen on the double (A) and the single wall (D) from the folds formed as the first, and (b) evolution of the equivalent plastic strain for the six chosen elements.
Figure 17.
(a) Hydrostatic stresses in time for the element chosen on the double (A) and the single wall (D) from the folds formed as the first, and (b) evolution of the equivalent plastic strain for the six chosen elements.

Table 1.
Summary of the experimental results for the tested honeycomb structures.
| Structure | 7 Cells | 19 Cells | 53 Cells | ||||||||||
|---|---|---|---|---|---|---|---|---|---|---|---|---|---|
| Load | |||||||||||||
| Quasi-Static | 1.37 | 0.85 | 0.91 | 0.56 | - | - | - | - | 8.85 | 5.63 | 0.88 | 0.56 | |
| 15 g of C4 | 1.66 | 0.96 | 1.10 | 0.64 | 2.74 | 1.55 | 1.10 | 0.62 | 10.0 | 6.19 | 1.00 | 0.62 | |
| 30 g of C4 | 1.83 | 0.99 | 1.21 | 0.66 | 2.48 | 1.64 | 0.99 | 0.66 | 10.2 | 6.26 | 1.02 | 0.63 | |
| 50 g of C4 | - | - | - | - | - | - | - | - | 13.6 | 8.18 | 1.36 | 0.82 | |
Table 2.
Parameters of the Johnson–Cook plasticity model.
| Parameters | Unit | AA3003 | AlSl 4340 [49] |
|---|---|---|---|
| ρ | 2.7 | 7.86 | |
| E | GPa | 70 | 209 |
| A | MPa | 90 | 792 |
| B | MPa | 220 | 510 |
| n | - | 0.2 | 0.26 |
| C | - | 0.001 | 0.014 |
Table 3.
Configurations of the friction coefficients between the honeycomb and the plates.
| Friction Coefficients | Set 1 | Set 2 | Set 3 | Set 4 | ||||
|---|---|---|---|---|---|---|---|---|
| Between: | Between: | Between: | Between: | |||||
| Front Plate | Rear Plate | Front Plate | Rear Plate | Front Plate | Rear Plate | Front Plate | Rear Plate | |
| and Structure | and Structure | and Structure | and Structure | |||||
| Dynamic | 0.0 | 0.0 | 0.1 | 0.3 | 0.2 | 0.4 | 0.4 | 0.6 |
| Static | 0.0 | 0.0 | 0.2 | 0.4 | 0.3 | 0.5 | 0.5 | 0.7 |
Table 4.
Comparison between the numerical (S) and experimental (E) characteristics of structural responses.
Table 4.
Comparison between the numerical (S) and experimental (E) characteristics of structural responses.
| Structure | 7 Cells | 19 Cells | 53 Cells | ||||||||||
|---|---|---|---|---|---|---|---|---|---|---|---|---|---|
| Load | |||||||||||||
| E | S | E | S | E | S | E | S | E | S | E | S | ||
| 15 g of C4 | 0.64 | 0.61 | 1.1 | 1.44 | 0.62 | 0.57 | 1.10 | 1.55 | 0.62 | 0.64 | 1.00 | 1.53 | |
| 30 g of C4 | 0.66 | 0.66 | 1.21 | 1.52 | 0.66 | 0.63 | 0.99 | 1.40 | 0.63 | 0.66 | 1.02 | 1.59 | |
| 50 g of C4 | - | 0.71 | - | 1.78 | - | 0.64 | - | 1.43 | 0.82 | 0.71 | 1.36 | 1.37 | |
© 2019 by the authors. Licensee MDPI, Basel, Switzerland. This article is an open access article distributed under the terms and conditions of the Creative Commons Attribution (CC BY) license (http://creativecommons.org/licenses/by/4.0/).
Share and Cite
MDPI and ACS Style
Stanczak, M.; Fras, T.; Blanc, L.; Pawlowski, P.; Rusinek, A. Blast-Induced Compression of a Thin-Walled Aluminum Honeycomb Structure—Experiment and Modeling. Metals 2019, 9, 1350. https://doi.org/10.3390/met9121350
AMA Style
Stanczak M, Fras T, Blanc L, Pawlowski P, Rusinek A. Blast-Induced Compression of a Thin-Walled Aluminum Honeycomb Structure—Experiment and Modeling. Metals. 2019; 9(12):1350. https://doi.org/10.3390/met9121350
Chicago/Turabian StyleStanczak, Magda, Teresa Fras, Ludovic Blanc, Piotr Pawlowski, and Alexis Rusinek. 2019. "Blast-Induced Compression of a Thin-Walled Aluminum Honeycomb Structure—Experiment and Modeling" Metals 9, no. 12: 1350. https://doi.org/10.3390/met9121350
Note that from the first issue of 2016, this journal uses article numbers instead of page numbers. See further details here.