Retardation of Fatigue Crack Growth in Rotating Bending Specimens with Semi-Elliptical Cracks
by
 , and
, and
Martin Leitner
1,* ,
,
David Simunek
1,
Jürgen Maierhofer
2,
Hans-Peter Gänser
2 and
Reinhard Pippan
3 
1
Department Product Engineering, Montanuniversität Leoben, 8700 Leoben, Austria
2
Materials Center Leoben Forschung GmbH, 8700 Leoben, Austria
3
Erich Schmid Institute of Materials Science, 8700 Leoben, Austria
*
Author to whom correspondence should be addressed.
Metals 2019, 9(2), 156; https://doi.org/10.3390/met9020156
Submission received: 15 December 2018
/
Revised: 22 January 2019
/
Accepted: 26 January 2019
/
Published: 1 February 2019
(This article belongs to the Special Issue Fracture, Fatigue and Structural Integrity of Metallic Materials)
Abstract
:This work investigates overload-induced retardation effects for semi-elliptically cracked steel round bars. The specimen geometry equals the shaft area of a 1:3 down-scaled railway axle and the material is extracted from railway axle blanks made of EA4T steel. Rotating bending tests under constant amplitude loading as well as overload tests considering overload ratios of ROL = 2.0 and ROL = 2.5 are conducted. The experimental results are compared to a crack growth assessment based on a modified NASGRO equation as well as the retardation model by Willenborg, Gallagher, and Hughes. The evaluated delay cycle number due to the overload by the experiments and the model shows a sound agreement validating the applicability of the presented approach.
1. Introduction
In order to assess the fatigue life under variable amplitude load (VAL) scenarios, the use of the linear damage accumulation rule according to Palmgren [1] and Miner [2] still acts as a standardized approach, due to the comparably engineering-feasible applicability. However, especially the impact of load sequences, such as retardation effects by intermediate overloads, majorly affect the fatigue life under VAL, which is not properly considered applying this rule [3]. In general, the retardation effect is a physically complex phenomenon, which is influenced by several interacting factors such as the loading condition, metallurgical properties, environment, and others [4].
According to Carlson et al. [5], the most significant mechanisms affecting the retardation behavior after a single overload are based on residual stresses [6], crack deflection [7], crack closure [8], strain hardening [9] as well as plastic crack tip blunting/resharpening [10]. Several models to assess the retardation effect during VAL are available, whereas in [11], a separation in yield zone and crack closure concepts is presented. Herein, the models by Wheeler [12], Willenborg et al. [13], Porter [14], Gray and Gallagher [15], Gallagher and Hughes [16], Johnson [17], as well as by Chang et al. [18] are highlighted in the case of the yield zone concepts. For the crack closure approaches, the models by Elber [8], Bell and Creager [19], Newman [20], Dill and Staff [21], Kanninen et al. [22], Budiansky and Hutchinson [23], as well as by de Koning [24] are referred. Due to their simplicity and the advantage that model parameters can be practicably evaluated by experiments, the yield zone models are commonly applied within crack growth assessments considering retardation effects at VAL [25]. Further details regarding the crack growth behavior under VAL, as well as the application of assessment models are provided in [26].
This paper focuses on the retardation effect in case of round bars containing semi-elliptical cracks. The investigations are part of the research project Eisenbahnfahrwerke 3 (EBFW 3) [27], which holistically analyzes the residual fatigue life of railway axles in order to properly assess inspection intervals [28]. As maintained in [29], the material parameters, loading conditions, as well as the initial crack geometry act as fundamental factors influencing a safe life fatigue assessment of railway axles [30]. A study in [31] demonstrates that measured load spectra of railway axles majorly affect the residual life; hence, sequence effects such as crack retardation need to be considered within the crack growth estimation. In addition, within the EBFW 3 project, the transferability of fracture mechanical parameters from small-scale, single edged tension or bending (SET or SEB) specimens with straight crack fronts to full-scale railway axles, containing semi-elliptical cracks is investigated, see [27]. In between these two completely different geometries and dimension, a down-scaled round bar specimen, denoted as 1:3 specimen, is used to investigate the issue of transferability in detail. Further details regarding the manufacturing and testing procedure of the 1:3 scaled specimens and experimental results covering constant amplitude and overloads are provided in [32]. In summary, this paper scientifically contributes to the following research topics:
- Crack growth tests with 1:3 round bar specimens, incorporating constant amplitude loading, as well as the effect of overloads.
- Application of a yield zone model based on small-scale SEB specimen test data to assess the influence of overloads on the fatigue crack retardation of the 1:3 specimens.
- Comparison of results by experiments, modelling and evaluation of the transferability of test data from small-scale SEB specimens, with straight crack fronts to round bars containing semi-elliptical cracks.
2. Materials and Methods
Within this study, a commonly applied steel for railway axles, namely EA4T, is investigated as base material. In [33] the crack growth behavior for this steel is presented. The nominal chemical composition and mechanical properties are provided in Table 1 and Table 2.
As introduced, 1:3 scaled round specimens, which are manufactured from real railway axle blanks are investigated. The testing diameter of the 1:3 scaled specimens measures 55 mm including one semi-elliptical crack, with an initial minimum surface length of about 2s = 4 mm. The initial crack depth, a, and surface crack length, s, equals a ratio of a/s = 0.8. Prior to this initial crack, a semi-elliptical notch with a notch depth of a = 1 mm and a surface length of 2s = 2.5 mm is manufactured by spark eroding. Based on a cyclic load crack initiation procedure, using similar testing conditions as for the subsequent crack growth tests, the described initial crack dimensions are realized. The size of every initial crack is measured at the fracture surface after each crack growth experiment showing a sound reproducibility of the initial crack characteristics.
The crack growth experiments are conducted under rotating bending loading. Details of the testing procedure and the optical surface crack length measurement are provided in [32]. Firstly, constant amplitude load (CAL) tests are performed in order to validate the applicability of the crack growth model for constant load conditions. Secondly, overload tests that consider the varying overload ratios are executed in order to research retardation effects.
Finally, an analytical fatigue crack growth assessment, using the software, Integrity Assessment for Railway Axles (INARA) (Version 19-3-2018_13-47, Materials Center Leoben Forschungs GmbH, Leoben, Austria), which uses a modified NASGRO approach [34] as well as a yield zone concept [35] to cover retardation effects, is performed. The model parameters are based on small-scale SEB tests; hence, a comparison of the model results and the 1:3 experiments demonstrate the applicability of the assessment procedure and the transferability of fracture mechanical parameters. The utilized crack growth model is described in detail in the following.
According to Forman and Mettu [36], the crack growth rate da/dN can be described, based on Equation (1), which is known as the NASGRO equation.
Herein, a is the crack depth, N is the number of load-cycles, F is the crack velocity factor, R is the load stress intensity factor ratio, ΔK is the stress intensity factor range, ΔKth is the threshold stress intensity range, KC is the fracture toughness, and C, m, p, and q are material constants. The factor F is calculated based on Equation (2) considering the crack opening function f, which is defined as the ratio of the crack opening and maximum value of the stress intensity factor, see [37].
As shown in Equation (1), the threshold stress intensity range ΔKth acts as one input material parameter for the crack growth assessment. Therefore, not only the threshold of the long crack ΔKth,lc, but also the effective value ΔKth,eff for physically short cracks need to be considered. The transition from ΔKth,eff to ΔKth,lc by a certain value of crack extension Δa is based on crack closure effects [38] and denoted as the crack growth resistance curve for the threshold of the stress intensity range, usually abbreviated as R-curve. Details regarding the determination and limitations are provided in [39]. In [34], the R-curve is defined by Equation (3), where the parameters li act as fictitious length scales for the build-up of the different crack closure effects.
Furthermore, an empirical approach for the crack velocity factor F is developed in [34], which additionally considers the R-curve within the evaluation of the factor F, see Equation (4).
Hence, the modified NASGRO equation using Equation (1) considers the R-curve based on Equation (3), and the crack velocity factor F, as given in Equation (4), is applied to assess the crack growth behavior under constant amplitude loading. To additionally cover retardation effects due to overloads under variable amplitude load scenarios, a yield zone concept based on the model by Willenborg [13], Gallagher, and Hughes [16] is presented in [35]. Due to its engineering-feasible applicability, this yield zone concept is used and slightly modified improve the practicability for varying railway axle steel materials, see [35]. Herein, the residual stress intensity factor due to overloads Kres,OL can be determined by Equation (5).
Herein, COL is a dimensionless constant for the plasticity-induced residual stress intensity factor, Kmax,OL is the maximum stress intensity factor during the overload, Δa is the crack extension, zOL is the size of the overload influenced zone, γOL is a material-dependent exponent, and Kmax is the maximum stress intensity factor of the basic load, see Equation (1).
Originally, the parameter zOL is calculated by α(Kmax,OL/σy)2 with α depending on plane stress or strain condition, see [13,16]. In [35], the value zOL is evaluated based on Equation (6), where the parameters LOL and pOL are determined by statistical regression based on experiments with SEB specimens and ΔKth,0 equals the long crack threshold value at R = 0.
Finally, the crack growth retardation effect, due to overloads is accounted in Equation (1) by considering an effective stress intensity factor ratio Reff, which is calculated by Equation (7). One can see that Kres,OL influences Reff and therefore affects the crack growth rate da/dN.
As shown in [35], the parameters of the used retardation model are evaluated based on small-scale SEB tests, with the same base material. In the course of the SEB investigations, it is found that the retardation effect may be over-estimated by the model, leading to significantly low crack growth rates or even no crack propagation at all. This may result in a non-conservative consideration of the retardation effect, which should be avoided in practical application. Hence, an additional factor, denoted as retardation factor RF, is incorporated, which limits the crack growth rate da/dN to a lower boundary value. The factor is defined as the ratio of the reduced crack growth rate after the overload to the crack growth rate, at the base load before the overload. Based on the SEB tests, a value of RF = 0.10 is suggested, which equals a maximum decrease of da/dN by the retardation effect down to 10% of the crack growth rate before the overload. The transferability of this RF-value from SEB to round 1:3 scaled railway axle specimens should be validated within this study.
Besides the overload effect, the software package INARA additionally can also take oxide-induced crack closure effects into account. A recently published study [40] presents results of SEB tests, which concludes that the long crack threshold is very sensitive to the influence of oxide debris effects. However, as the focus of the research within this paper is laid on the influence of overloads, due to plasticity-induced retardation effects, the oxide induced crack closure is not considered within this work. Parameters of the applied modified NASGRO model for the investigated steel EA4T are provided in Table 3.
Regarding the retardation model, values of COL = 1.0, γOL = 0.37, pOL = 2.72, and LOL = 7.62 × 10⁻⁴ mm are used, for details see [35]. In accordance with a preceding study [41] that focuses on the constant crack growth behavior of another commonly used steel material for railway axles, namely EA1N, the stress intensity factor for the semi-elliptical crack in round bars is analytically calculated according to [42], and furthermore summarized in [43]. As aforementioned, the surface crack length is optically measured during the experiments [32]; hence, in the following, all test results, as well as crack propagation parameters are related to the crack extension at the surface. Due to the cut-out of the specimens from real railway axle blanks, minor residual stresses up to 20 MPa are still measured, see [41]. As it is highlighted in [41] that these comparably minor residual stresses significantly affect the crack growth characteristics, the accordant residual stress values are considered within this study to properly assess the crack propagation. Further details are given in [41].
3. Results
3.1. Constant Amplitude Tests
At first, constant amplitude load tests (CAL) are performed to validate the applicability of the utilized crack propagation model under constant loads. Figure 1 shows the results of CAL test #1, which is tested at a nominal bending stress amplitude of σa = 100 MPa. During the experiment, the surface crack length, 2s, is optically measured and the crack propagation test is stopped at a final crack length of 2s~18 mm. Utilizing the crack length 2s versus the accordant number of load-cycles, N, in Figure 1a, the crack propagation rate d(2s)/dN is computed. The corresponding surface stress intensity factor range ΔKS is calculated based on the procedure in [42], thereby enabling the representation of the d(2s)/dN vs. ΔKS diagram, as depicted in Figure 1b, for further comparison with the crack propagation model.
At the beginning of the experiment, decreased crack growth rates down to a value of about 1e-7 mm per load-cycle (LC) are observable, which occur due to the short crack effect [34,39], as well as the prior crack initiation procedure. However, after this initiation and short crack phase, the crack constantly grows leading to a d(2s)/dN vs. ΔKS curve as presented. The fracture surface of CAL test #1 is illustrated in Figure 2. One can clearly see the initial starting notch at the top center of the picture as well as the further crack propagation area. At the final surface crack length of 2s~18 mm, the crack depth exhibits a~8 mm leading to a final ratio of a/s~0.9.
In Figure 3, the results of CAL test #2, which is tested at an increased nominal bending stress amplitude of σa = 150 MPa, is demonstrated. Starting from the same crack length of 2s = 4 mm as for CAL test #1, the total lifetime until the final crack length of 2s~18 mm is only about 1 × 10⁶ load-cycles, due to the increased bending load, see Figure 3a. Again, the crack propagation rate d(2s)/dN versus the surface stress intensity factor range ΔKS is evaluated, shown in Figure 3b.
Based on the described modified NASGRO equation, the constant crack propagation model is applied and the results are compared to the results of CAL test #1 and #2. Cyclic crack resistance (R-) curves as well as the constant long crack growth behavior for the investigated EA4T steel are presented in [27], which act as basis for the crack growth assessment in this work. A comparison of the crack propagation model with the CAL tests is demonstrated in Figure 4. It is shown that the model fits well to both CAL crack propagation tests with a somewhat conservative assessment for lower stress intensity factor ranges. However, these results prove the transferability of the model parameters evaluated by small-scale SEB specimens to semi-elliptically cracked round bars. Further details of the transferability and used parameters are provided in [41].
3.2. Overload Tests
3.2.1. Overload Ratio ROL = 2.0
Second, crack propagation tests, including overloads are performed in order to validate the applicability of the model to cover retardation effects. In Figure 5, the results of Overload test #1 applying ten overloads under the same load stress ratio of R = −1 with an overload ratio of ROL = 2.0 is illustrated. The surface crack length 2s over load-cycles N in Figure 5a shows that the overload is applied at 2s~9.4 mm, which equals a surface stress intensity factor range of ΔKS~17 MPa·m1/2 under the base load bending stress of σa = 100 MPa.
The retardation effect is clearly observable within the d(2s)/dN versus ΔKS diagram in Figure 5b, whereas the crack growth rate after the overload at ΔKS~17 MPa·m1/2 is significantly decreased. However, after a certain number of further load-cycles at the base load, denoted as delay cycles Nd [44], the effect of the overload is passed and the crack propagation rate proceeds in accordance with the constant load tests. For Overload test #1, the delay cycle number is evaluated to Nd~2.6 × 10⁵, which proves the beneficial retardation effect.
The specimen’s fracture surface of Overload test #1 is depicted in Figure 6. In accordance with the CAL tests, the initial starting notch is again observable at the top middle. Again, the crack initiation is visible due to minor crack propagation rates at the beginning of the experiment, compare to Figure 5b, which merges into the crack growth regime. Reaching a surface crack length of 2s~9.4 mm, the applied overload is clearly detectable in the fracture surface. At the end of the experiment, the final a/s-ratio equals about a value of 0.9, which is in accordance to the CAL tests.
Similar to the first overload test, Figure 7 shows the results of the Overload test #2, applying the identical overload ratio of ROL = 2.0 under the same testing conditions. Again, the retardation effect is pronounced, leading to a delay cycle number of Nd~1.7 × 10⁵. Compared with the Overload test #1 this value is reduced; however, it is still beneficial influence as the overload is recognizable.
To assess the overload-induced retardation effect, the previously described procedure, using a modified method based on the approach by Willenborg et al. is applied. Values for the investigated steel EA4T are evaluated on the basis of SEB tests and are provided in Table 3 on the basis of [35]. These parameters are used to estimate the overload effect for the semi-elliptically cracked round bars within this study; therefore, validating the transferability of the model parameters from small-scale SEB to 1:3 scaled railway axle specimen tests, incorporating varying global specimen geometry, as well as different shapes of the crack front.
As previously described, within the crack growth assessment the additional retardation factor RF is included, which defines the maximum decrease of the crack propagation rate, due to the overload compared to the prior base load. A factor of RF = 0.10 means that subsequent to the overload, the retardation effect can decrease the crack propagation rate to a minimum of 10% of the value at the base load, before the overload. In this work, two different RF-values in particular, RF = 0.10 and RF = 0.05, are analyzed to highlight the impact of the retardation factor on the overload effect. As stated, a value of RF = 0.10 is suggested, based on preliminary performed SEB overload tests in [35]. The transferability of this value RF = 0.10 and additionally the effect of using RF = 0.05, which enables a more pronounced retardation effect within the model, is studied.
A comparison of the crack propagation model with the results of the Overload test #1 and #2, both with ROL = 2.0 is shown in Figure 8. In general, the results reveal a sound agreement between the model and the experiments. The parameter set, considering RF = 0.05 exhibits a greater decrease of the retardation-affected crack growth rate, leading to a delay cycle number of Nd~3.78 × 10⁵ compared to RF = 0.10 with Nd~2.1 × 10⁵ as highlighted in the preceding paragraph. However, the applied model seems to cover both the constant amplitude as well as the overload-affected region well. A further discussion comparing the delay cycle number Nd of the model to the experiments is given in Section 4.
Besides the retardation effect, a different crack growth behavior, at the beginning of both tests, can be observed. As aforementioned within the CAL tests, the decreased crack propagation rates at the beginning are a result of the short crack effect as well as the prior crack initiation procedure. The deviation in this case can be primarily explained by a varying initial surface crack length 2s between both tests. However, the same load stress amplitude is used and the overload is applied at the same surface crack length, thereby ensuring a sound comparison of both overload test results.
3.2.2. Overload Ratio ROL = 2.5
Similar to the Overload tests #1 and #2 with ROL = 2.0, two further experiments with ROL = 2.5, denoted as Overload tests #3 and #4, are conducted. The test results are depicted in Figure 9 and Figure 10 respectively, which highlight a pronounced retardation effect in both cases. The delay cycle number of Overload test #3 is evaluated to Nd = 4.7 × 10⁵, and for Overload test #4 to Nd = 8.5 × 10⁵. On average, this equals an increase in Nd from ROL = 2.0 to ROL = 2.5 by about a factor of three, proving the significant impact of the overload ratio ROL on the retardation effect.
As presented for ROL = 2.0 in Figure 8 before, the Overload tests #3 and #4 with ROL = 2.5 are again compared to the crack propagation model considering RF = 0.10 and RF = 0.05, see Figure 11. Here, the model again fits well to both experiments, whereas the retardation factor of RF = 0.10 leads to a reduced pronounced overload effect, with a final delay cycle number of Nd~6.7 × 10⁵ compared with the value of RF = 0.05 leading to Nd~1.6 × 10⁶. A comparison of the delay cycles Nd of the model and the experiments is shown in the next section.
4. Discussion
As the focus of this paper is laid on the applicability of the presented crack growth assessment for overload-induced retardation effects, this section compares the overload tests with the crack propagation model in terms of the evaluated delay cycle numbers Nd. Table 4 summarizes the values of Nd for the Overload tests #1 and #2 with ROL = 2.0 with the results of the model, by considering a retardation factor RF = 0.10 and RF = 0.05. On average, a delay cycle number of Nd~2.2 × 10⁵ is evaluated for the experiments, which equals well the value of 2.1 × 10⁵ of the model using RF = 0.10. Applying a factor of RF = 0.05, a significantly increased pronounced overload effect occurs, which leads to a non-conservative delay cycle number of 3.8 × 10⁵.
A similar analysis for the Overload tests #3 and #4 with ROL = 2.5 is provided in Table 5. There, a mean value of of Nd~6.6 × 10⁵ is evaluated for the experiments, which again matches well to the value of 6.7 × 10⁵ of the model using RF = 0.10. Considering RF = 0.05 leads to a non-conservative assessment with a delay cycle number of 1.6 × 10⁶ as shown for ROL = 2.0.
As shown in Table 5, a comparably increased deviation of Nd between both experiments can be observed. Thereby, the Nd-values are by trend in line with the crack growth behavior at the constant base load, whereby test #3, which exhibits a minor value of Nd due to the overload, reveals a comparably increased crack propagation rate compared to test #4.
5. Conclusions
Based on the investigations in this work, the following scientific conclusions can be drawn:
- Retardation effects, due to the overloads, significantly affect the crack growth rate leading to an enhancement of the lifetime. Considering the presented test results at overload ratios of ROL = 2.0 and ROL = 2.5, the influence is more pronounced at higher ROL-values.
- The presented crack propagation model based on a modified NASGRO equation and considering the approach by Willenborg, Gallagher, and Hughes to cover retardation effects fits well with the conducted 1:3 round specimen overload tests. The additionally introduced retardation factor RF, which defines the maximum decrease of the crack propagation rate due to overloads, seems to exhibit a remarkable influence on the delay cycle number Nd. In this study, the suggested value of RF = 0.10, which is evaluated based on preceding SEB tests, maintains a sound applicability.
- As all model parameters are evaluated on the basis of small-scale SEB tests, the transferability of these values, by considering the effect of specimen size, geometry, as well as shape of the crack front, is validated based on the results in this study.
Author Contributions
Conceptualization, M.L. and D.S.; methodology, M.L.; software, M.L., D.S., J.M., and H.-P.G.; validation, M.L. and D.S.; data curation, D.S. and J.M.; writing—original draft preparation, M.L.; writing—review and editing, D.S., J.M., H.-P.G., and R.P.
Funding
Scientific support was given within the framework of the COMET K2-Programme, whereby the Austrian Federal Government represented by Österreichische Forschungsförderungsgesellschaft mbH and the Styrian and the Tyrolean Provincial Government, represented by Steirische Wirtschaftsförderungsgesellschaft mbH and Standortagentur Tirol, is gratefully acknowledged.
Conflicts of Interest
The authors declare no conflict of interest.
References
- Palmgren, A. Die Lebensdauer von Kugellagern. Zeitschrift des Vereins Deutscher Ingenieure 1924, 68, 339–341. [Google Scholar]
- Miner, M.A. Cumulative Damage in Fatigue. J. Appl. Mech. Trans. ASME 1945, 12, A159–A164. [Google Scholar]
- Ciavarella, M.; D’antuono, P.; Papangelo, A. On the connection between Palmgren-Miner rule and crack propagation laws. Fatigue Fract. Eng. Mater. Struct. 2018, 41, 1469–1475. [Google Scholar] [CrossRef]
- Wei, R.P.; Shih, T.T. Delay in fatigue crack growth. Int. J. Fract. 1974, 10, 77–85. [Google Scholar] [CrossRef]
- Carlson, R.L.; Kardomateas, G.A.; Bates, P.R. The effects of overloads in fatigue crack growth. Int. J. Fatigue 1991, 13, 453–460. [Google Scholar] [CrossRef]
- Schijve, J. Fatigue Crack Propagation in Light Alloy Sheet Materials and Structures; NRL Report MP 195; Elsevier: Amsterdam, The Netherlands, 1960. [Google Scholar]
- Lankford, J.; Davidson, D.L. The effect of overloads upon fatigue crack tip opening displacement and crack tip opening/closing loads in aluminium alloys. In Advances in Fracture Research, (Fracture 81), Proceedings of the 5th International Conference on Fracture (ICF5), Cannes, France, 29 March–3 April 1981; François, D., Ed.; Pergamon: Oxford, NY, USA, 1982; pp. 899–906. [Google Scholar]
- Elber, W. The Significance of Fatigue Crack Closure. In Damage Tolerance in Aircraft Structures: A Symposium Presented at the Seventy-Third Annual Meeting American Society for Testing and Materials, Toronto, ON, Canada, 21–26 June 1970; Rosenfeld, M.S., Ed.; American Society for Testing and Materials: Philadelphia, PA, USA, 1971. [Google Scholar]
- Jones, R.E. Fatigue crack growth retardation after single cycle peak overload Ti-6AI-4V titanium alloy. Eng. Fract. Mech. 1973, 5, 585–604. [Google Scholar] [CrossRef]
- Christensen, R.H. Metal Fatigue; McGraw-Hill: New York, NY, USA, 1959. [Google Scholar]
- Ricardo, L.C.H.; Miranda, C.A.J. Crack simulation models in variable amplitude loading—A review. Frattura ed Integrità Strutturale 2016, 10, 456–471. [Google Scholar] [CrossRef]
- Wheeler, O.E. Spectrum loading and crack growth. J. Basic Eng. Trans. ASME 1972, 94, 181–186. [Google Scholar] [CrossRef]
- Willenborg, J.; Engle, R.M.; Wood, H.A.; Air Force Flight Dynamics Lab Wright-Patterson AFB OH. A Crack Growth Retardation Model Using an Effective Stress Concept; Defense Technical Information Center: Fort Belvoir, VA, USA, 1971.
- Porter, T.R. Method of analysis and prediction of variable amplitude fatigue crack growth. Eng. Fract. Mech. 1972, 4, 717–736. [Google Scholar] [CrossRef]
- Gray, T.D.; Gallagher, J.P. Predicting Fatigue Crack Retardation Following a Single Overload Using a Modified Wheeler Model. In Mechanics of Crack Growth; Rice, J.R., Ed.; American Society for Testing & Materials: West Conshohocken, PA, USA, 1976. [Google Scholar]
- Gallagher, J.P.; Hughes, T.F. Influence of Yield Strength on Overload Affected Fatigue Crack Growth Behavior in 4340 Steel. 1974. Available online: http://www.dtic.mil/dtic/tr/fulltext/u2/787655.pdf (accessed on 29 January 2019).[Green Version]
- Johnson, W.S. Multi-Parameter Yield Zone Model for Predicting Spectrum Crack Growth. In Methods and Models for Predicting Fatigue Crack Growth under Random Loading; Chang, J.B., Hudson, C.M., Eds.; American Society for Testing and Materials: Philadelphia, PA, USA, 1981. [Google Scholar]
- Chang, J.B.; Hiyama, R.M.; Szamossi, M. Improved Methods for Predicting Spectrum Loadings Effects; AFFDL-TR-79-3036; AFFDL: Air Force, OH, USA, 1984. [Google Scholar]
- Bell, P.D.; Creager, M. Crack Growth Analyses for Arbitrary Spectrum Loading; AFFDL-TR-74-129; AFFDL: Air Force, OH, USA, 1974. [Google Scholar]
- Newman, J.C. A Finite-Element Analysis of Fatigue Crack Closure. In Mechanics of Crack Growth; Rice, J.R., Ed.; American Society for Testing & Materials: West Conshohocken, PA, USA, 1976. [Google Scholar]
- Dill, H.D.; Saff, C.R. Spectrum Crack Growth Prediction Method Based on Crack Surface Displacement and Contact Analyses. In Fatigue Crack Growth under Spectrum Loads; Wei, R.P., Ed.; American Society for Testing & Materials: West Conshohocken, PA, USA, 1976. [Google Scholar]
- Kanninnen, M.F.; Atkinson, C.; Feddersen, C.E. A Fatigue Crack Growth Analysis Method Based on a Single Representation of Crack Tip Plasticity; ASTM Special Technical Publication; ASTM: West Conshohocken, PA, USA, 1977. [Google Scholar]
- Budiansky, B.; Hutchinson, J.W. Analysis of Closure in Fatigue Crack Growth. J. Appl. Mech. 1978, 45, 267–276. [Google Scholar] [CrossRef]
- De Koning, A.U. A Simple Crack Closure Model for Prediction of Fatigue Crack Growth Rates Under Variable-Amplitude Loading. In Fracture Mechanics: Proceedings of the Thirteenth National Symposium on Fracture Mechanics; Roberts, R., Ed.; American Society for Testing and Materials: Philadelphia, PA, USA, 1981. [Google Scholar]
- Pereira, M.V.S.; Darwish, F.A.I.; Camarão, A.F.; Motta, S.H. On the prediction of fatigue crack retardation using Wheeler and Willenborg models. Mater. Res. 2007, 10, 101–107. [Google Scholar] [CrossRef]
- Schijve, J. Fatigue Crack Growth Predictions for Variable-Amplitude and Spectrum Loading; LR-526; Delft University of Technology: Delft, The Netherlands, 1987. [Google Scholar]
- Gänser, H.-P.; Maierhofer, J.; Tichy, R.; Zivkovic, I.; Pippan, R.; Luke, M.; Varfolomeev, I. Damage tolerance of railway axles—The issue of transferability revisited. Int. J. Fatigue 2016, 86, 52–57. [Google Scholar] [CrossRef]
- Traupe, M.; Jenne, S.; Lütkepohl, K.; Varfolomeev, I. Experimental validation of inspection intervals for railway axles accompanying the engineering process. Int. J. Fatigue 2016, 86, 44–51. [Google Scholar] [CrossRef]
- Zerbst, U.; Schödel, M.; Beier, H.T. Parameters affecting the damage tolerance behaviour of railway axles. Eng. Fract. Mech. 2011, 78, 793–809. [Google Scholar] [CrossRef] [Green Version]
- Zerbst, U.; Beretta, S.; Köhler, G.; Lawton, A.; Vormwald, M.; Beier, H.T.; Klinger, C.; Černý, I.; Rudlin, J.; Heckel, T.; et al. Safe life and damage tolerance aspects of railway axles—A review. Eng. Fract. Mech. 2013, 98, 214–271. [Google Scholar] [CrossRef]
- Pokorný, P.; Hutař, P.; Náhlík, L. Residual fatigue lifetime estimation of railway axles for various loading spectra. Theor. Appl. Fract. Mech. 2016, 82, 25–32. [Google Scholar] [CrossRef]
- Simunek, D.; Leitner, M.; Maierhofer, J.; Gänser, H.-P. Crack growth under constant amplitude loading and overload effects in 1:3 scale specimens. Procedia Struct. Integr. 2017, 4, 27–34. [Google Scholar] [CrossRef]
- Linhart, V.; Černý, I. An effect of strength of railway axle steels on fatigue resistance under press fit. Eng. Fract. Mech. 2011, 78, 731–741. [Google Scholar] [CrossRef]
- Maierhofer, J.; Pippan, R.; Gänser, H.-P. Modified NASGRO equation for physically short cracks. Int. J. Fatigue 2014, 59, 200–207. [Google Scholar] [CrossRef] [Green Version]
- Maierhofer, J.; Gänser, H.-P.; Pippan, R. Crack closure and retardation effects—Experiments and modelling. Procedia Struct. Integr. 2017, 4, 19–26. [Google Scholar] [CrossRef]
- Forman, R.; Mettu, S.R. Behavior of Surface and Corner Cracks Subjected to Tensile and Bending Loads in Ti-6A1-4V Alloy; NASA Technical Memorandum 102165: Houston, TX, USA, 1990. [Google Scholar]
- Newman, J.C. A crack opening stress equation for fatigue crack growth. Int. J. Fract. 1984, 24, R131–R135. [Google Scholar] [CrossRef]
- Pippan, R.; Hohenwarter, A. Fatigue crack closure: A review of the physical phenomena. Fatigue Fract. Eng. Mater. Struct. 2017, 40, 471–495. [Google Scholar] [CrossRef] [PubMed]
- Maierhofer, J.; Kolitsch, S.; Pippan, R.; Gänser, H.-P.; Madia, M.; Zerbst, U. The cyclic R-curve—Determination, problems, limitations and application. Eng. Fract. Mech. 2018, 198, 45–64. [Google Scholar] [CrossRef]
- Maierhofer, J.; Simunek, D.; Gänser, H.-P.; Pippan, R. Oxide induced crack closure in the near threshold regime: The effect of oxide debris release. Int. J. Fatigue 2018, 117, 21–26. [Google Scholar] [CrossRef]
- Simunek, D.; Leitner, M.; Maierhofer, J.; Gänser, H.-P. Analytical and Numerical Crack Growth Analysis of 1:3 Scaled Railway Axle Specimens. Metals 2019. in review. [Google Scholar]
- Varfolomeev, I.; Burdack, M.; Luke, M. Fracture Mechanics as a Tool for Specifying Inspection Intervals of Railway Axles (Part 2); DVM: Dresden, Germany, 2007. [Google Scholar]
- Madia, M.; Beretta, S.; Schödel, M.; Zerbst, U.; Luke, M.; Varfolomeev, I. Stress intensity factor solutions for cracks in railway axles. Eng. Fract. Mech. 2011, 78, 764–792. [Google Scholar] [CrossRef]
- Ishihara, S.; McEvily, A.; Goshima, T.; Nishino, S.; Sato, M. The effect of the R value on the number of delay cycles following an overload. Int. J. Fatigue 2008, 30, 1737–1742. [Google Scholar] [CrossRef]
- Simunek, D.; Leitner, M.; Maierhofer, J.; Gänser, H.-P. Fatigue Crack Growth Under Constant and Variable Amplitude Loading at Semi-elliptical and V-notched Steel Specimens. Procedia Eng. 2015, 133, 348–361. [Google Scholar] [CrossRef] [Green Version]
- Leitner, M.; Tuncali, Z.; Steiner, R.; Grün, F. Multiaxial fatigue strength assessment of electroslag remelted 50CrMo4 steel crankshafts. Int. J. Fatigue 2017, 100, 159–175. [Google Scholar] [CrossRef]
Figure 1.
Results of amplitude load tests (CAL) test #1 at load of σa = 100 MPa (a) surface crack length vs. load-cycles; (b) crack propagation rate versus stress intensity factor.
Figure 1.
Results of amplitude load tests (CAL) test #1 at load of σa = 100 MPa (a) surface crack length vs. load-cycles; (b) crack propagation rate versus stress intensity factor.

Figure 2.
Representation of fracture surface for specimen utilized within CAL test #1.
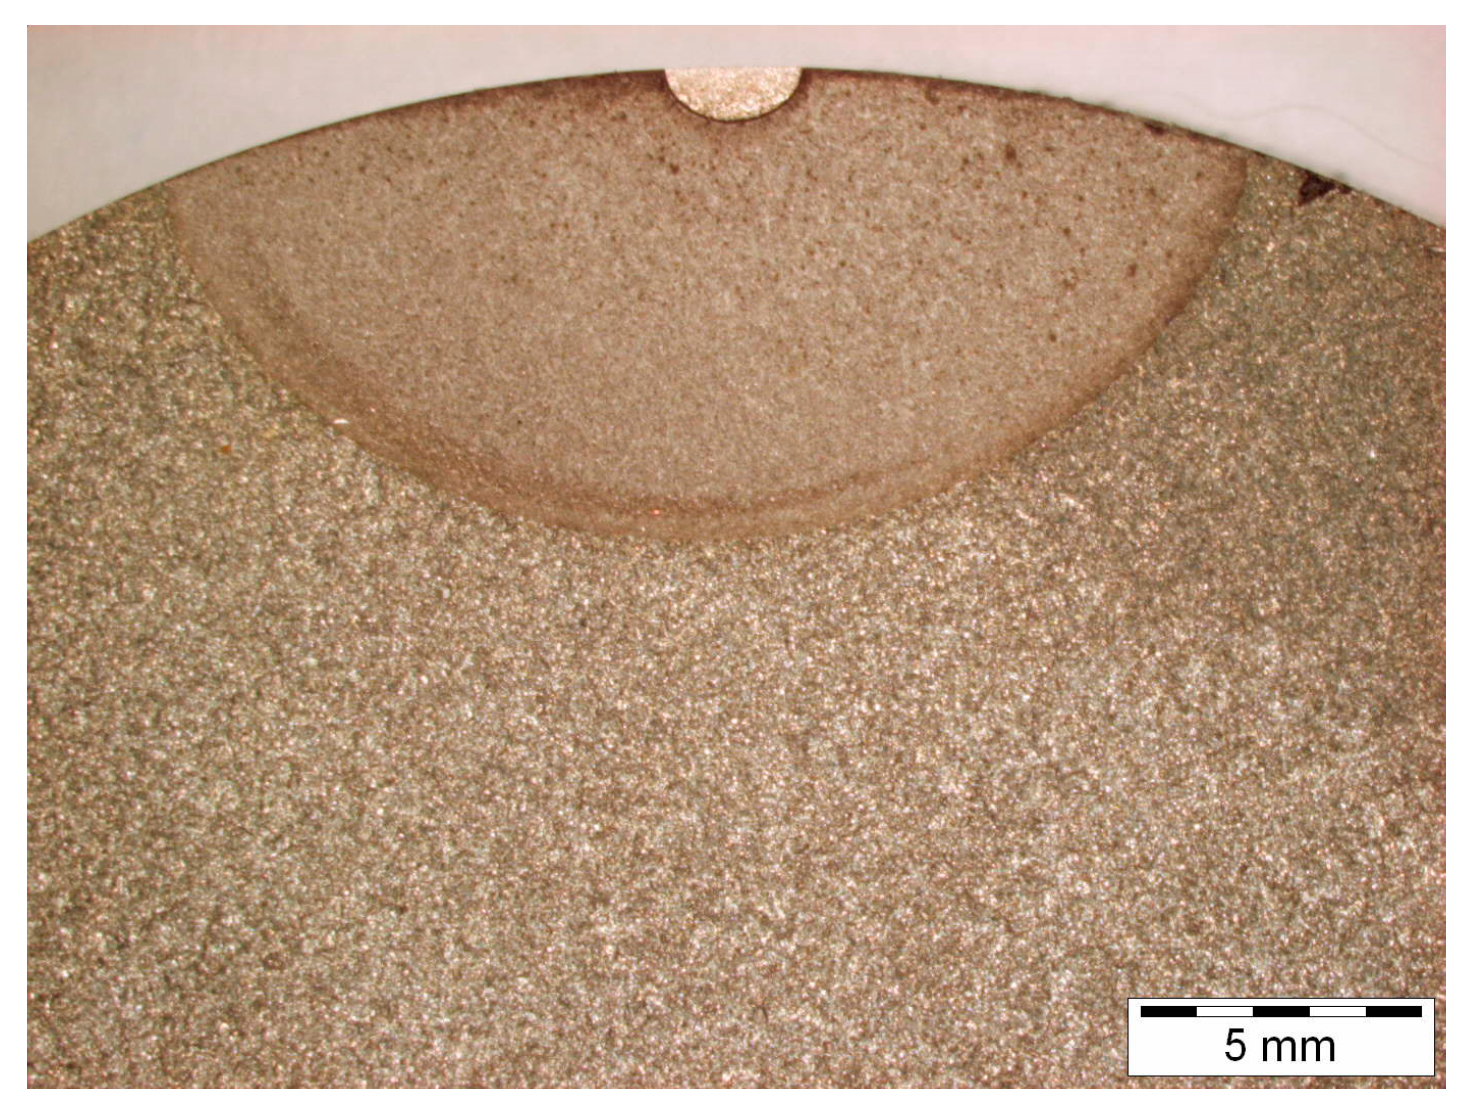
Figure 3.
Results of CAL test #2 at load of σa = 150 MPa (a) surface crack length vs. load-cycles; (b) crack propagation rate vs. stress intensity factor.
Figure 3.
Results of CAL test #2 at load of σa = 150 MPa (a) surface crack length vs. load-cycles; (b) crack propagation rate vs. stress intensity factor.

Figure 4.
Comparison of crack propagation model with results of CAL test #1 and #2.

Figure 5.
Results of Overload test #1 with ROL = 2.0 (a) surface crack length versus load-cycles; (b) crack propagation rate vs. stress intensity factor.
Figure 5.
Results of Overload test #1 with ROL = 2.0 (a) surface crack length versus load-cycles; (b) crack propagation rate vs. stress intensity factor.

Figure 6.
Representation of fracture surface for specimen utilized within Overload test #1.

Figure 7.
Results of Overload test #2 with ROL = 2.0 (a) surface crack length versus load-cycles; (b) crack propagation rate vs. stress intensity factor.
Figure 7.
Results of Overload test #2 with ROL = 2.0 (a) surface crack length versus load-cycles; (b) crack propagation rate vs. stress intensity factor.

Figure 8.
Comparison of crack propagation model with results of Overload test #1 and #2.

Figure 9.
Results of Overload test #3 with ROL = 2.5 (a) surface crack length versus load-cycles; (b) crack propagation rate vs. stress intensity factor.
Figure 9.
Results of Overload test #3 with ROL = 2.5 (a) surface crack length versus load-cycles; (b) crack propagation rate vs. stress intensity factor.

Figure 10.
Results of Overload test #4 with ROL = 2.5 (a) surface crack length versus load-cycles; (b) crack propagation rate vs. stress intensity factor.
Figure 10.
Results of Overload test #4 with ROL = 2.5 (a) surface crack length versus load-cycles; (b) crack propagation rate vs. stress intensity factor.

Figure 11.
Comparison of crack propagation model with results of Overload test #3 and #4.


Table 1.
Nominal chemical composition of investigated steel material in weight per cent [33].
Table 1.
Nominal chemical composition of investigated steel material in weight per cent [33].
| Steel | C | Si | Mn | Cr | Mo | P | S | Fe |
|---|---|---|---|---|---|---|---|---|
| EA4T | 0.26 | 0.29 | 0.70 | 1.00 | 0.20 | 0.0200 | 0.007 | Balance |
Table 2.
Nominal mechanical properties of investigated steel material [33].
Table 2.
Nominal mechanical properties of investigated steel material [33].
| Steel | fy (MPa) | fu (MPa) | A (%) |
|---|---|---|---|
| EA4T | 631 | 789 | 18.5 |
Table 3.
Parameters of applied modified NASGRO model for steel EA4T.
| C (mm/(MPa√m)) | m (-) | p (-) | ν1 (-) | ν2 (-) | l1 (mm) | l2 (mm) | lF (mm) | ΔKth,eff (MPa√m) | ΔKth,0 (MPa√m) |
| 1.92 × 10⁻⁸ | 2.64 | 0.32 | 0.43 | 0.57 | 0.41e-3 | 1.75 | 0.01 | 2.00 | 7.35 |
Table 4.
Delay cycles Nd by experiment and model for overload tests with ROL = 2.0.
| Experiment | Nd by Experiment (-) | Nd by Crack Propagation Model (-) |
|---|---|---|
| Overload test #1 | 2.6 × 10⁵ | 2.1 × 10⁵ (RF = 0.10) and 3.8 × 10⁵ (RF = 0.05) |
| Overload test #2 | 1.7 × 10⁵ |
Table 5.
Delay cycles Nd by experiment and model for overload tests with ROL = 2.5.
| Experiment | Nd by Experiment (-) | Nd by Crack Propagation Model (-) |
|---|---|---|
| Overload test #3 | 4.7 × 10⁵ | 6.7 × 10⁵ (RF = 0.10) and 1.6 × 10⁶ (RF = 0.05) |
| Overload test #4 | 8.5 × 10⁵ |
© 2019 by the authors. Licensee MDPI, Basel, Switzerland. This article is an open access article distributed under the terms and conditions of the Creative Commons Attribution (CC BY) license (http://creativecommons.org/licenses/by/4.0/).
Share and Cite
MDPI and ACS Style
Leitner, M.; Simunek, D.; Maierhofer, J.; Gänser, H.-P.; Pippan, R. Retardation of Fatigue Crack Growth in Rotating Bending Specimens with Semi-Elliptical Cracks. Metals 2019, 9, 156. https://doi.org/10.3390/met9020156
AMA Style
Leitner M, Simunek D, Maierhofer J, Gänser H-P, Pippan R. Retardation of Fatigue Crack Growth in Rotating Bending Specimens with Semi-Elliptical Cracks. Metals. 2019; 9(2):156. https://doi.org/10.3390/met9020156
Chicago/Turabian StyleLeitner, Martin, David Simunek, Jürgen Maierhofer, Hans-Peter Gänser, and Reinhard Pippan. 2019. "Retardation of Fatigue Crack Growth in Rotating Bending Specimens with Semi-Elliptical Cracks" Metals 9, no. 2: 156. https://doi.org/10.3390/met9020156
Note that from the first issue of 2016, this journal uses article numbers instead of page numbers. See further details here.