Optimisation of Heat Treatment Process for Damping Properties of Mg-13Gd-4Y-2Zn-0.5Zr Magnesium Alloy Using Box–Behnken Design Method

Abstract
:1. Introduction
2. Experimental
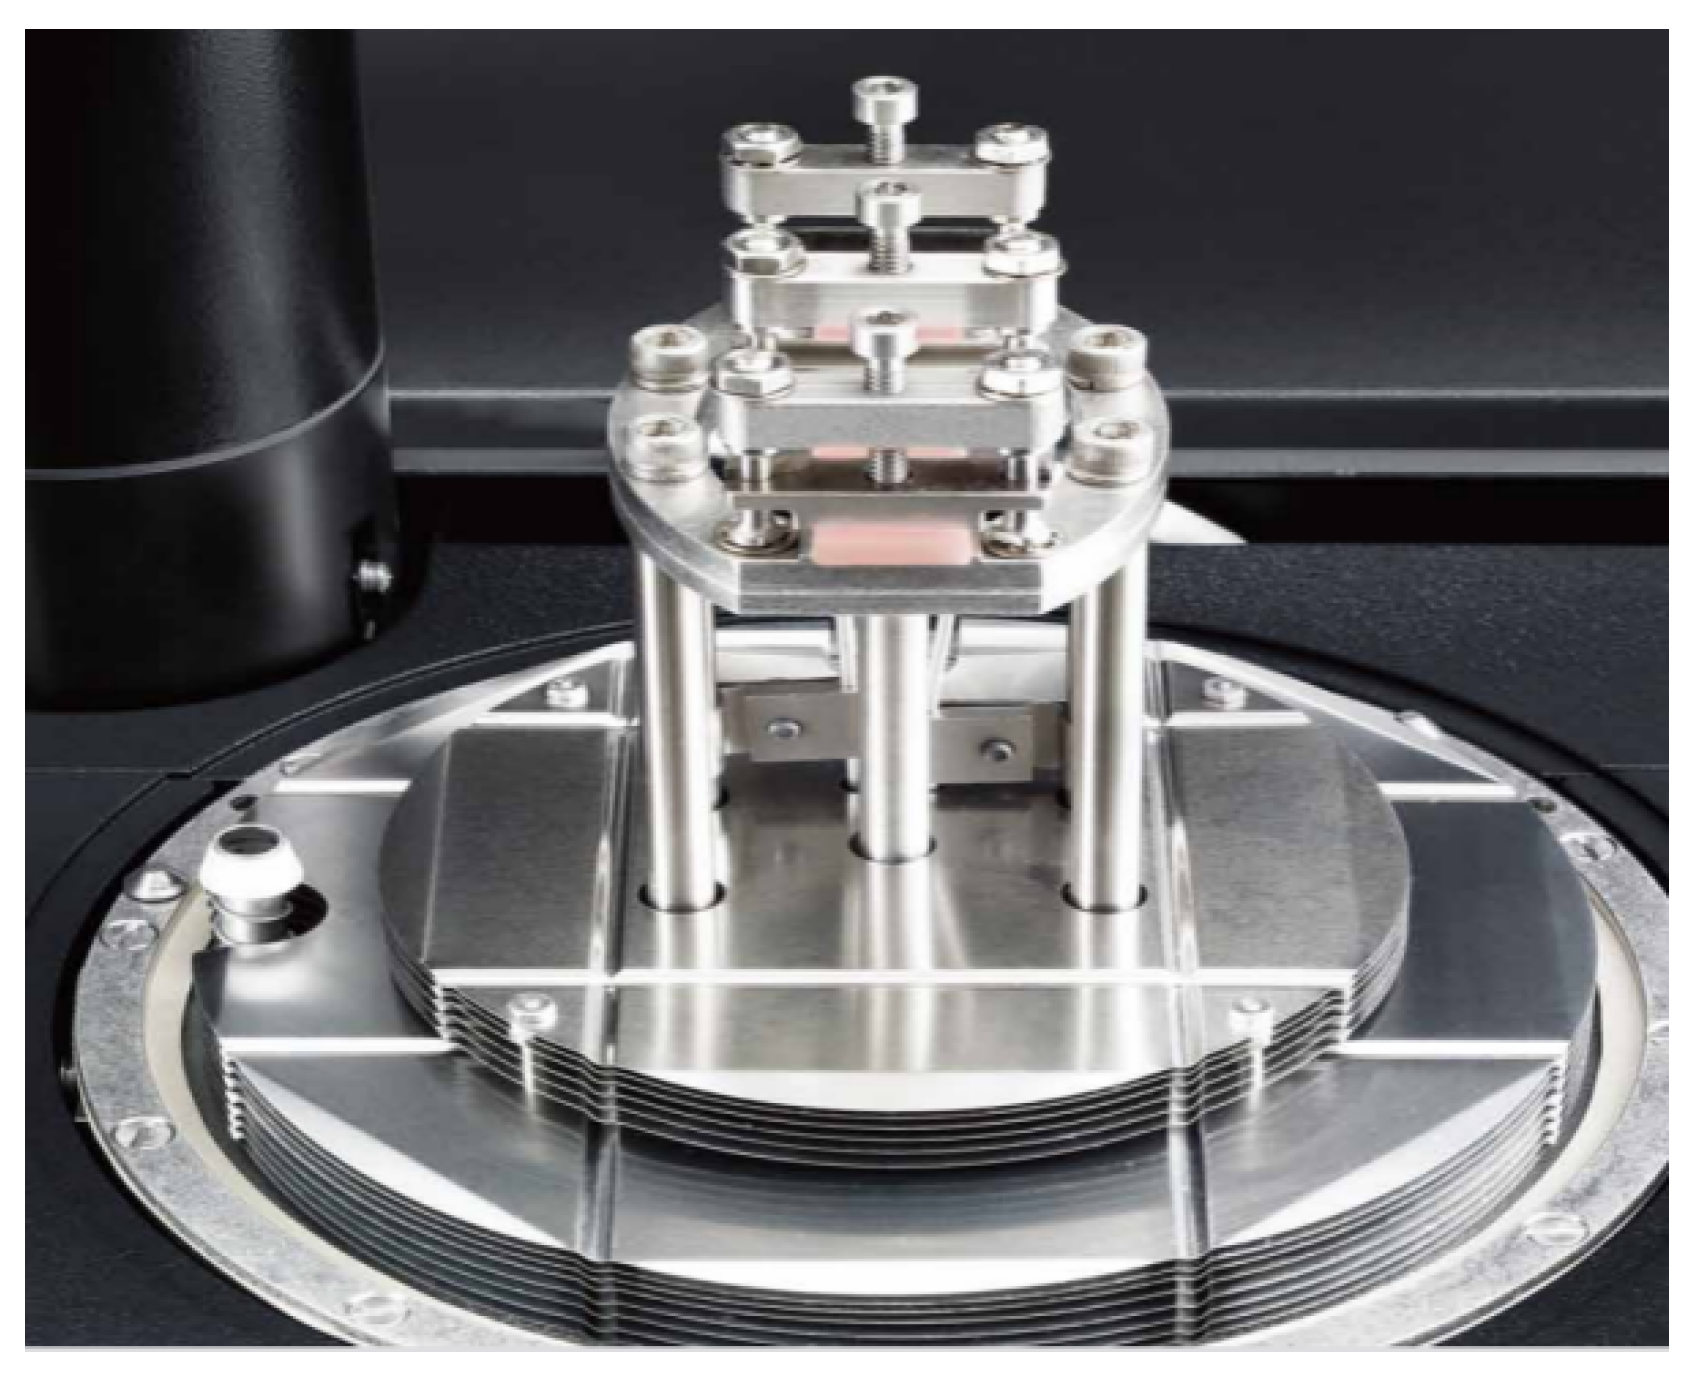
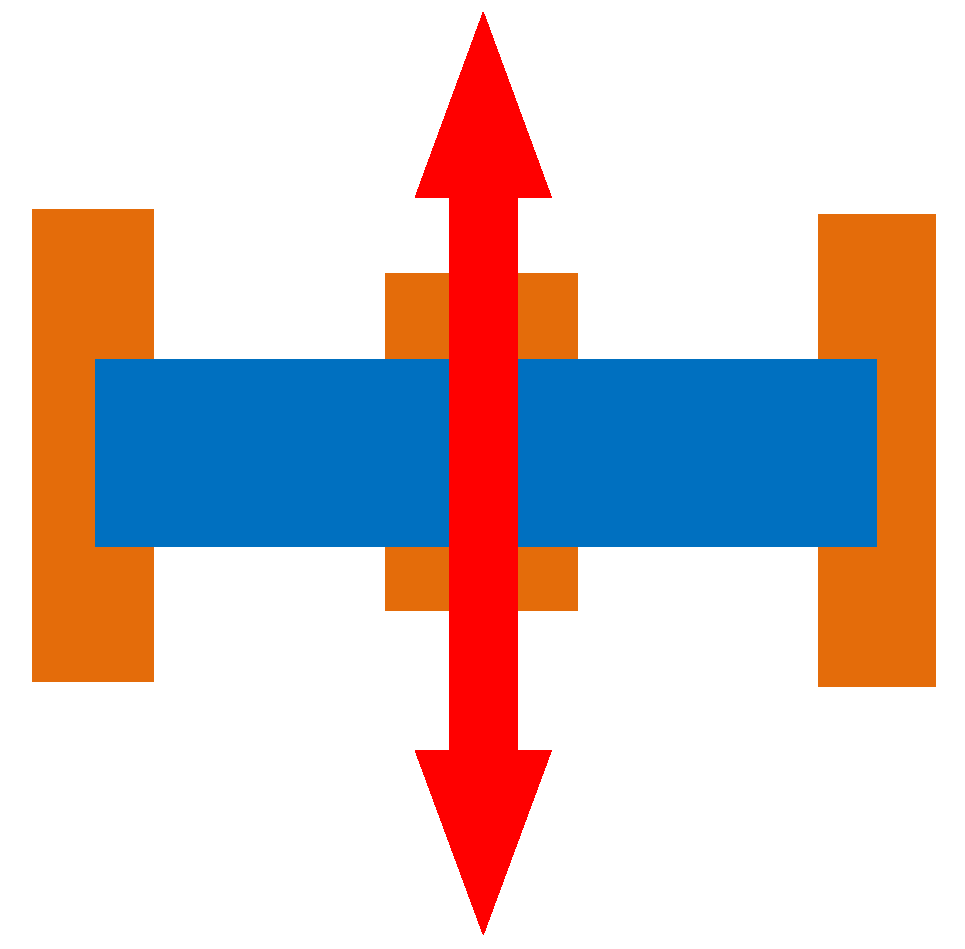
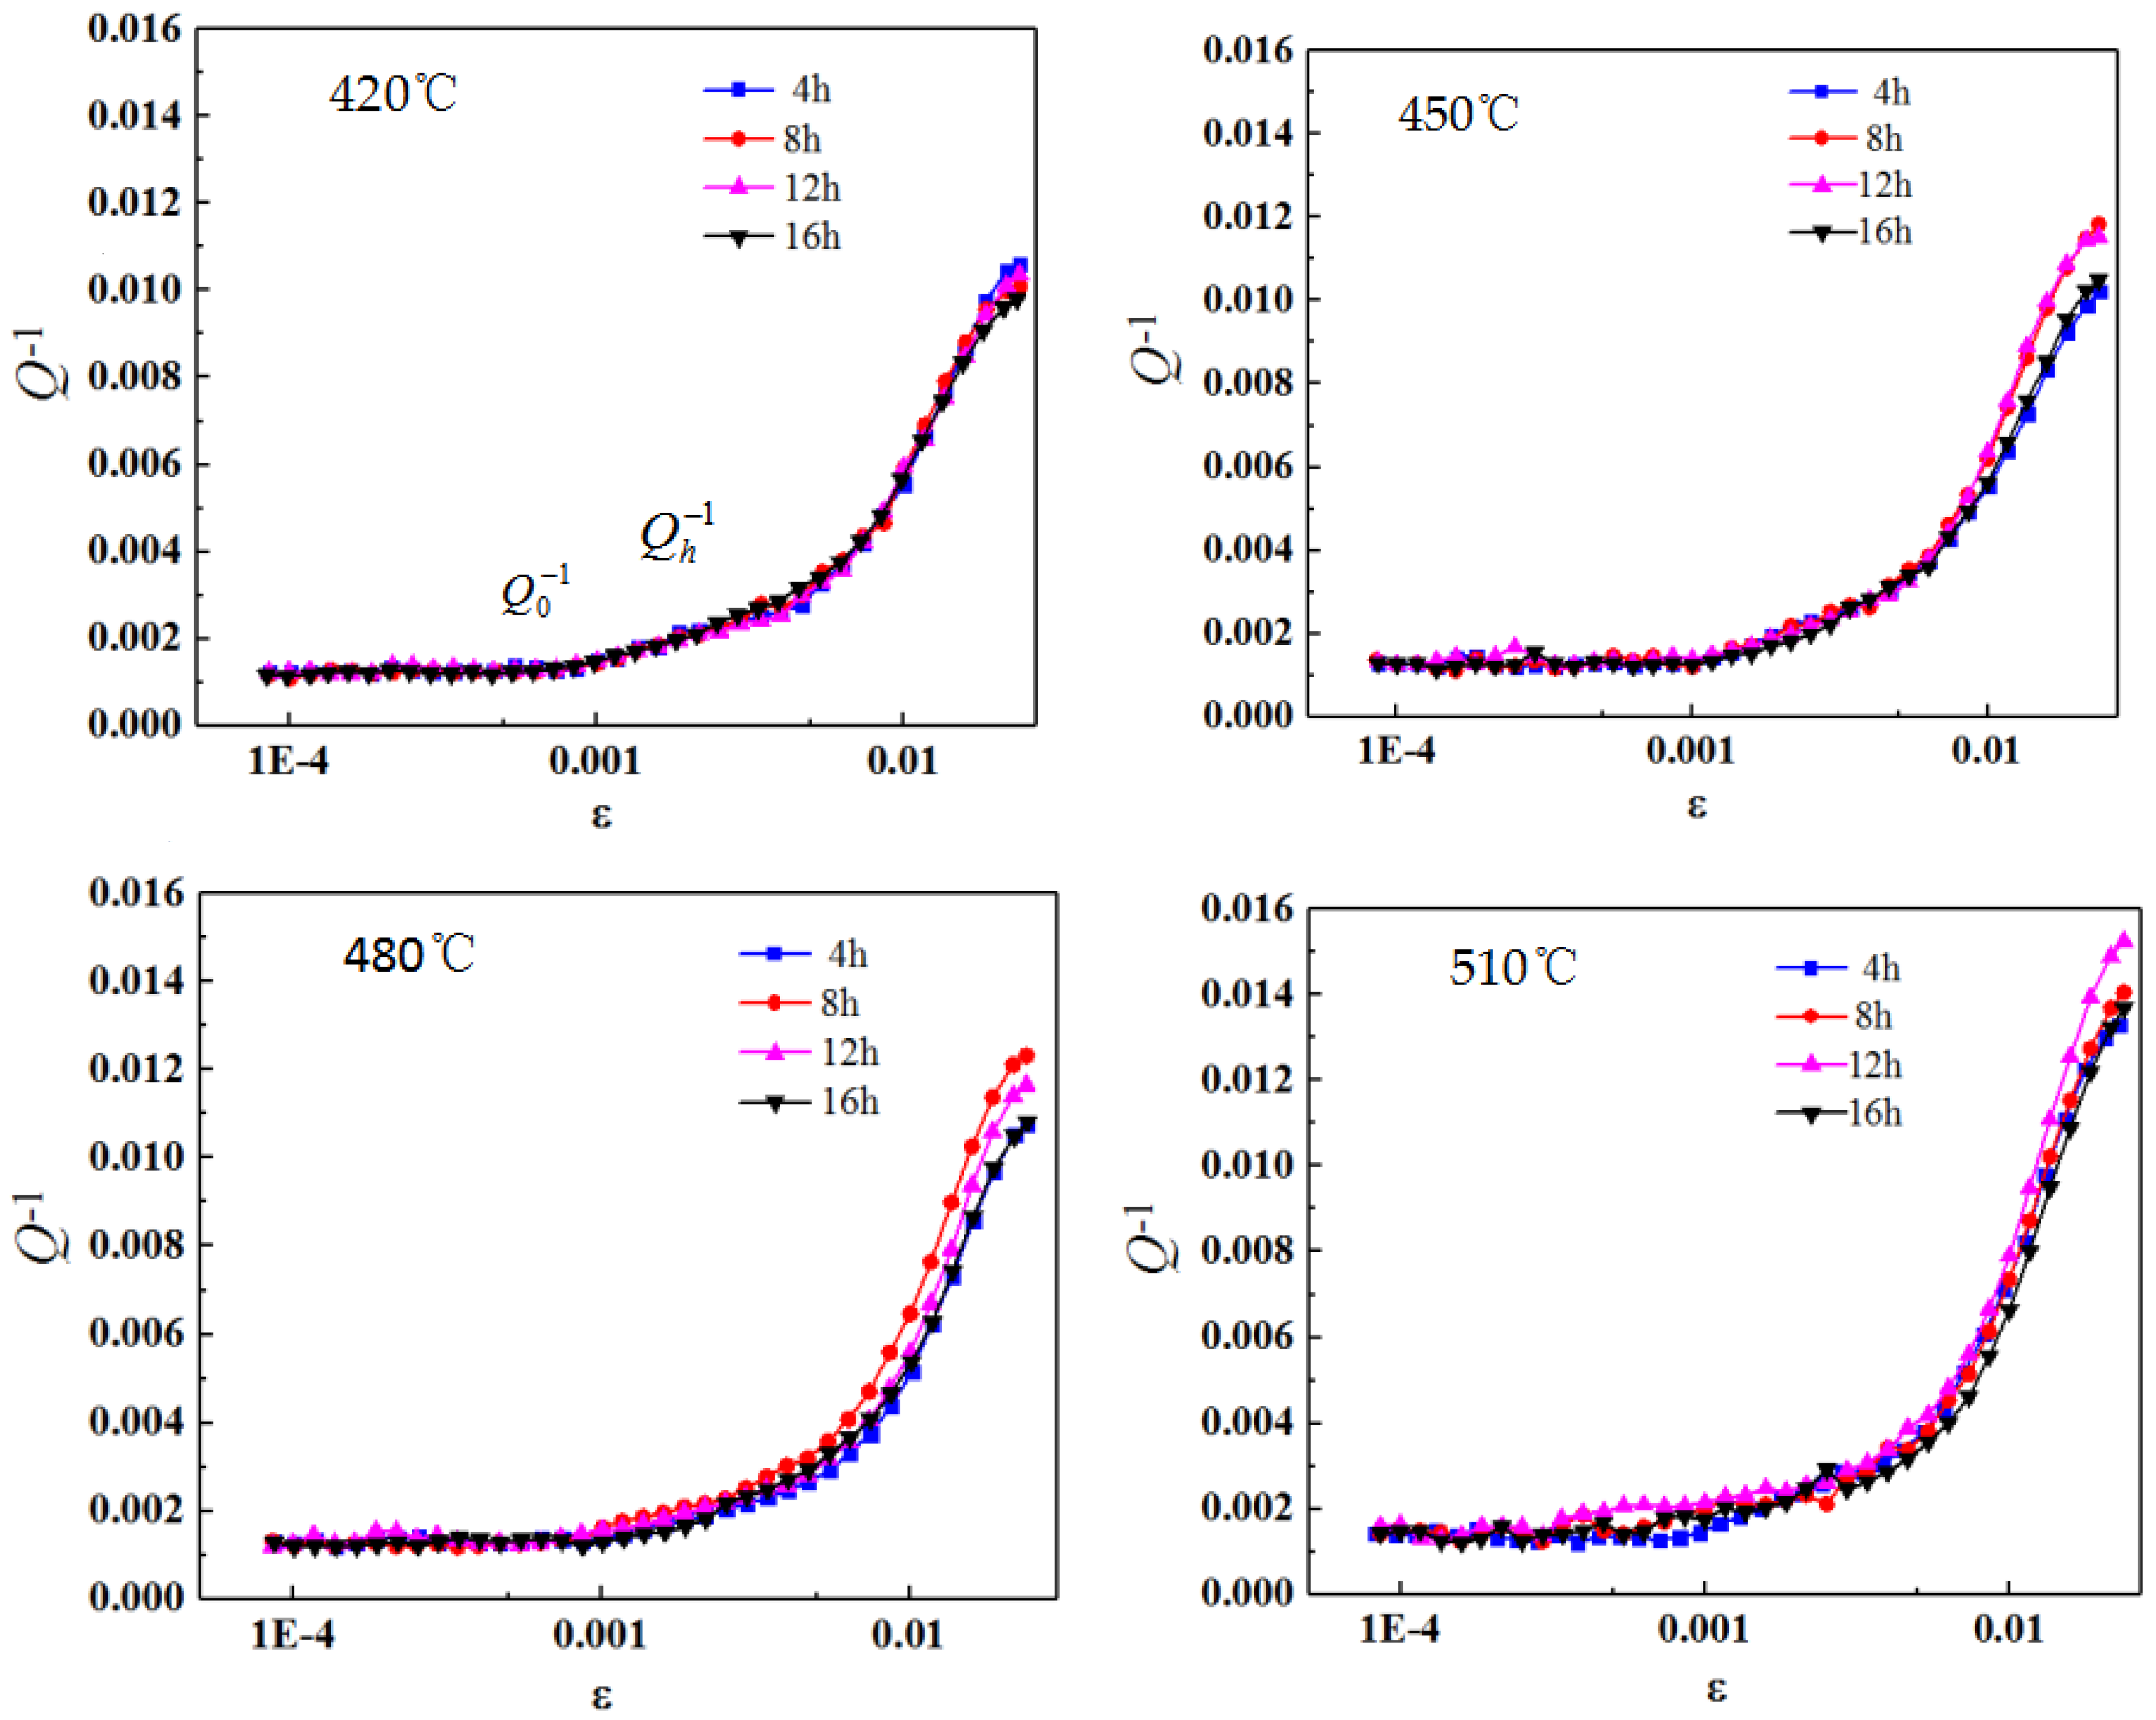
2.1. Damping Experiment
2.2. Heat Treatment
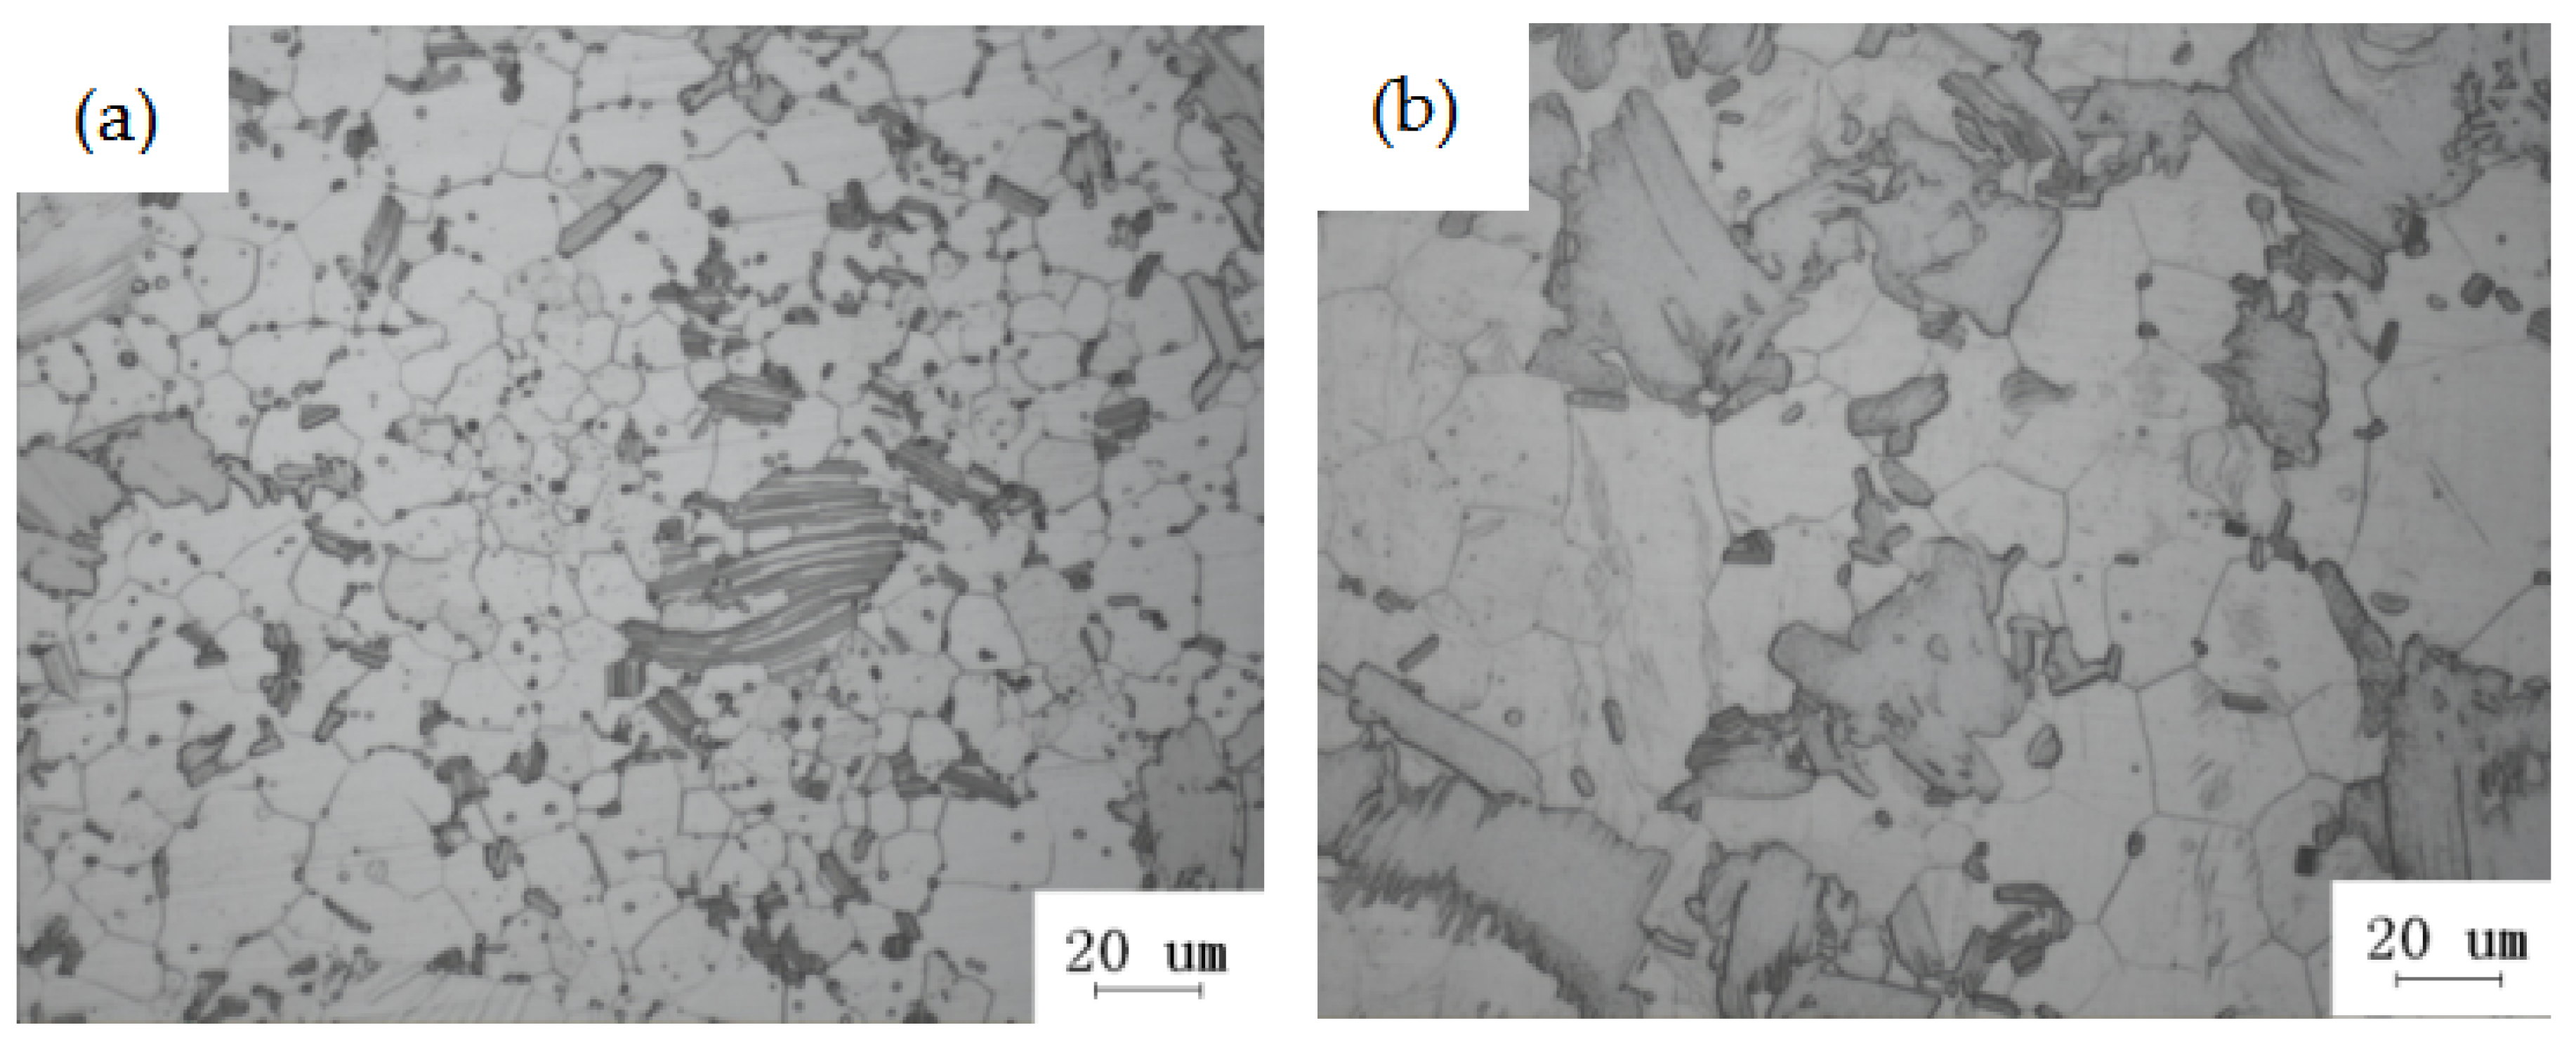
2.3. Microstructure Observation and Mechanical Properties Test
3. Optimisation Analysis of Solid Solution Parameters
4. Optimisation Analysis of Ageing Parameters
5. Mathematical Models
5.1. Design of Experiments
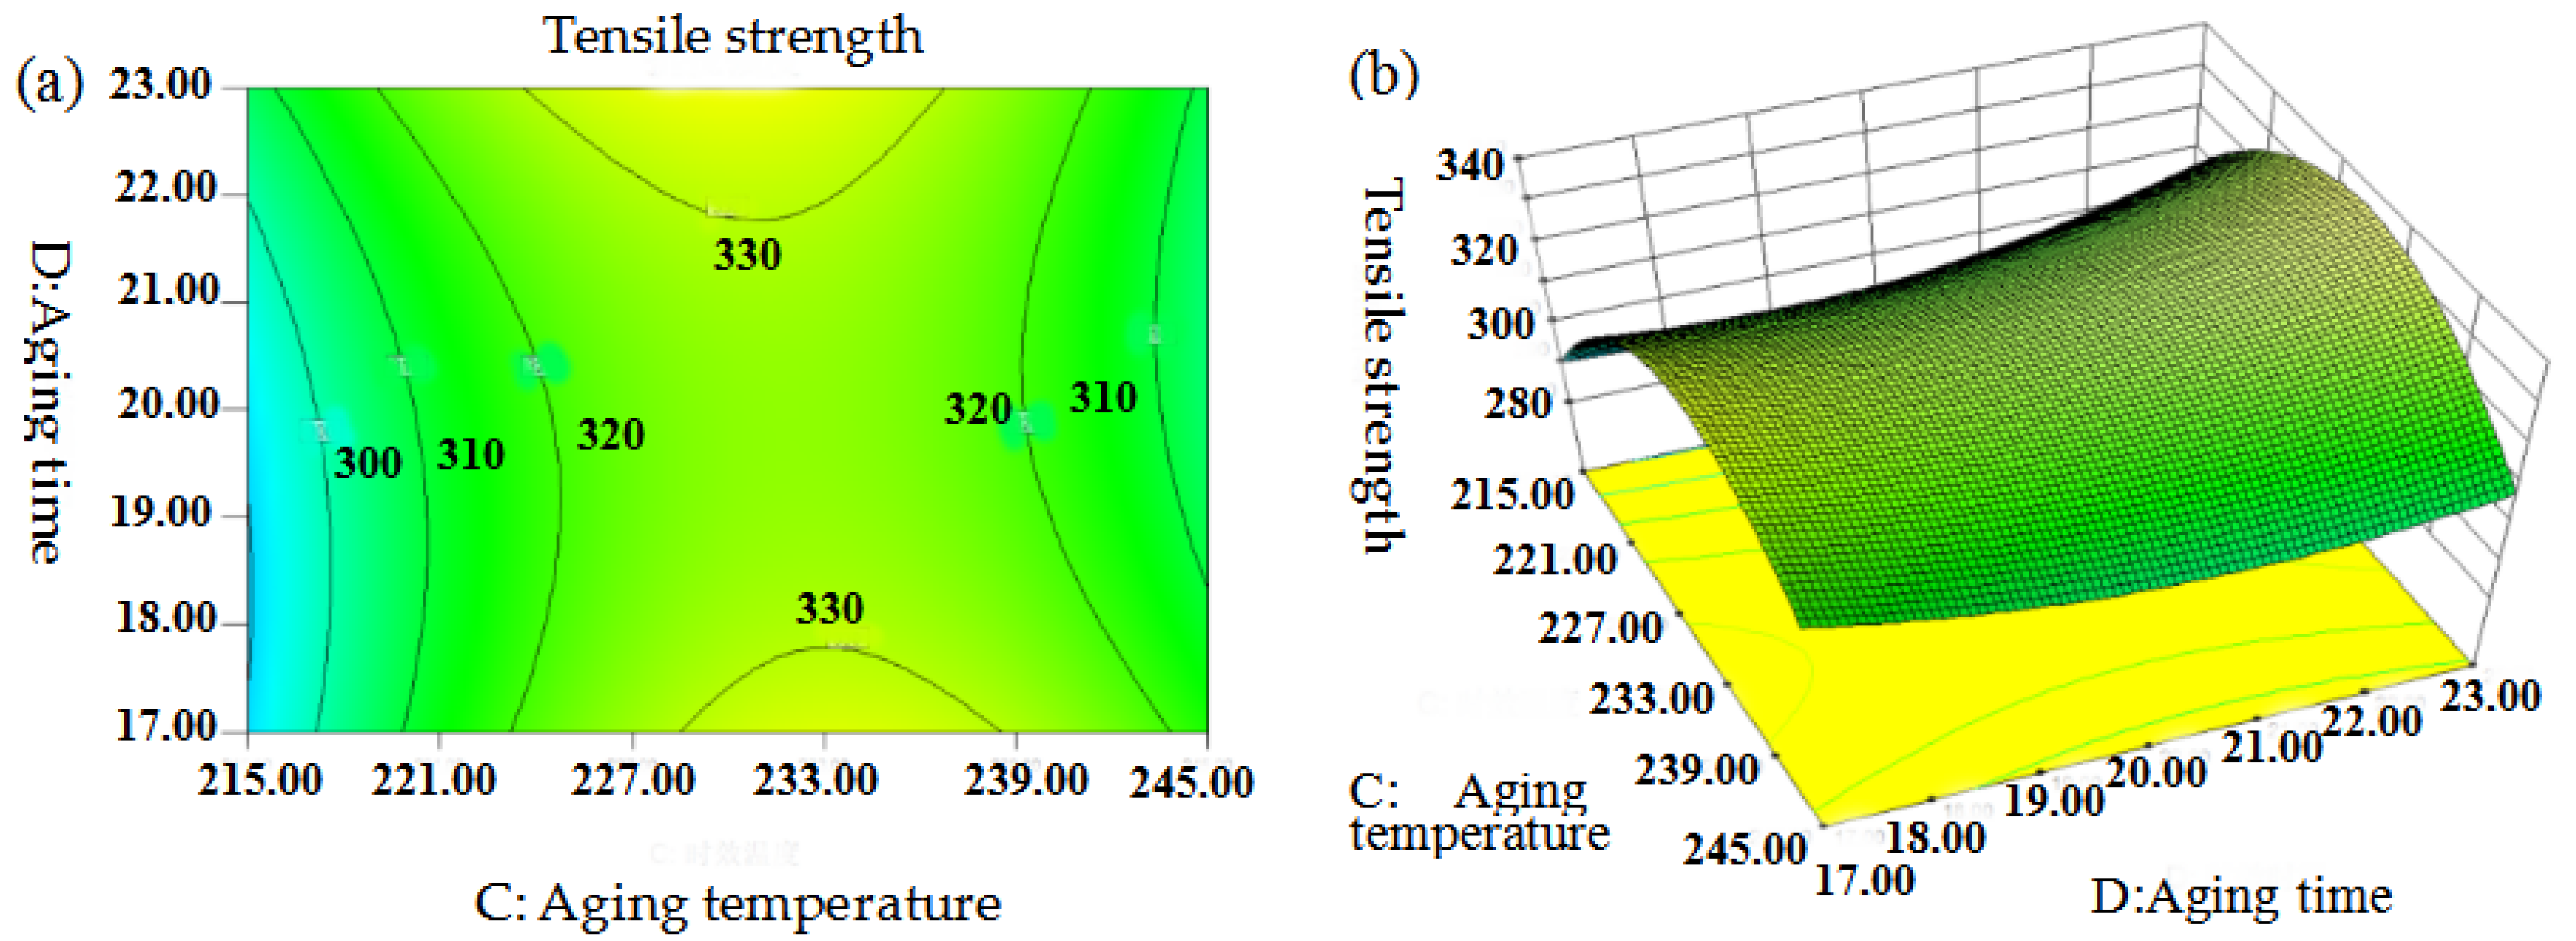
5.2. Regression Analysis of Tensile Strength
5.78889 × 10⁻³AC + 4.22222 × 10⁻³AD + 0.078917BC − 0.44542BD − 0.13733CD +
0.060104A2 + 0.66115B2 − 0.12332C2 + 0.79231D2
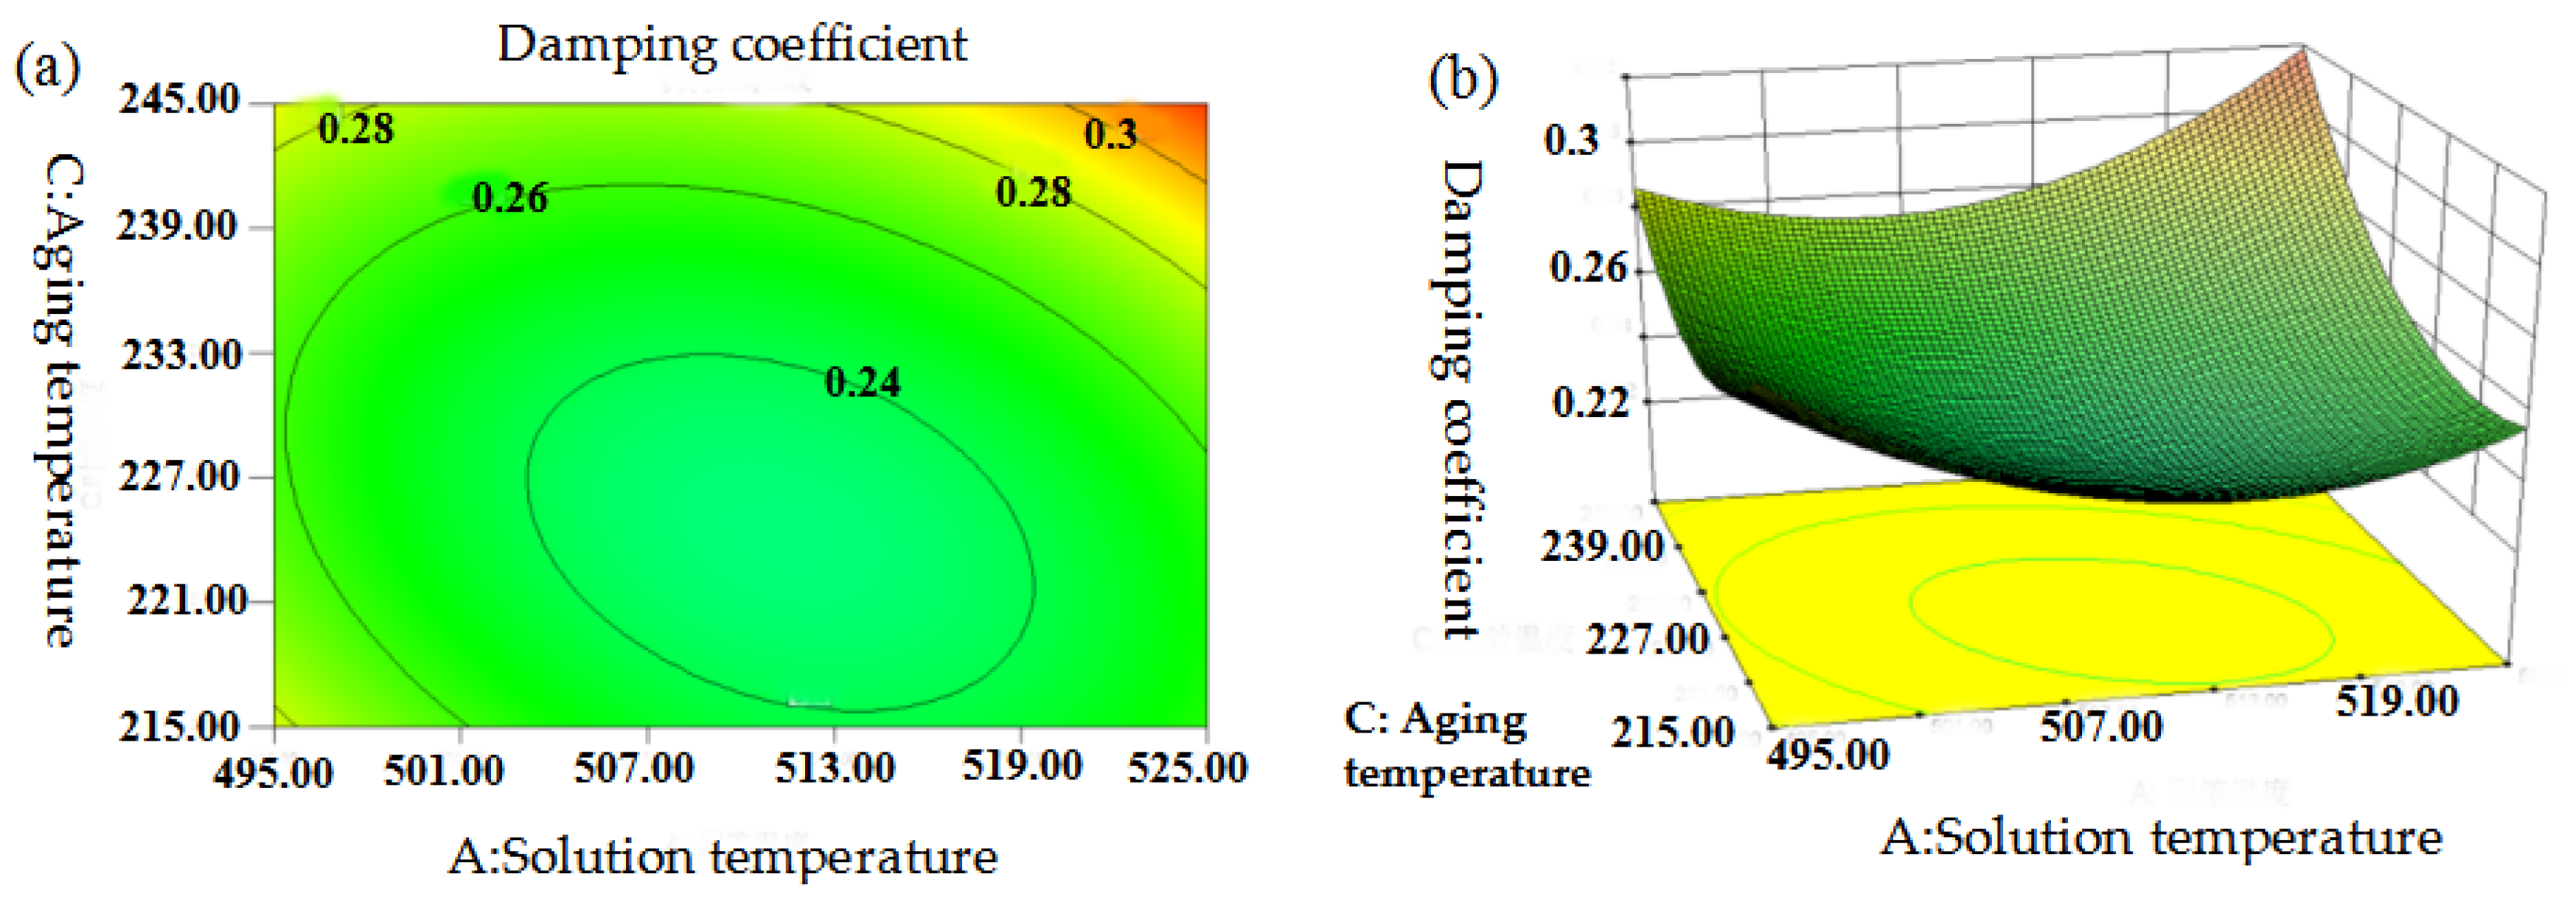
5.3. Regression Analysis of Damping Coefficient
6.55556 × 10⁻⁵AC + 4.72222 × 10⁻⁴AD + 1.91667 × 10⁻⁴BC − 2.41667 × 10⁻³BD + 6.33333
× 10−4CD + 1.17222 × 10⁻⁴A2 − 7.50000 × 10⁻⁴B2 + 1.05556 × 10⁻⁴C2 − 1.51389 × 10⁻³D2
5.4. Parameter Optimisation
6. Verification Experiment
7. Conclusions
Author Contributions
Funding
Acknowledgements
Conflicts of Interest
References
- Wu, Y.W.; Wu, K.; Deng, K.K.; Nie, K.B.; Wang, X.J.; Zheng, M.Y.; Hu, X.S. Damping capacities and microstructures of magnesium matrix composities reinforced by graphite particles. Mater. Des. 2010, 31, 4862–4865. [Google Scholar] [CrossRef]
- Granato, A.; Lücke, K. Theory of Mechanical Damping Due to Dislocations. J. Appl. Phys. 1956, 27, 583–593. [Google Scholar] [CrossRef]
- Tang, Y.X.; Li, B.; Tang, H.X.; Xu, Y.C.; Gao, Y.P.; Huang, L.H.; Guan, J.Y. Effect of long period stacking ordered structure on mechanical and damping properties of as-cast Mg–Zn–Y–Zr alloy. Mater. Sci. Eng. A 2015, 640, 287–294. [Google Scholar] [CrossRef]
- Lan, A.; Huo, L.F. Effect of substitution of minor Nd for Y on mechanical and damping properties of heat-treated Mg–Zn–Y–Zr alloy. Mater. Sci. Eng. A 2016, 615, 646–656. [Google Scholar] [CrossRef]
- Yu, J.M.; Zhang, Z.M.; Zhang, X.; Ren, F.L.; Wu, Y.J. Study on microstructure evolution of deformed Mg-Gd-Y-Nd-Zr heat-resistant magnesium alloys after solid solution and ageing. Sci. Sinter. 2016, 48, 109–117. [Google Scholar] [CrossRef]
- Yu, J.M.; Li, X.B.; Zhang, Z.M.; Wang, Q.; Wu, Y.J.; Wang, J. Mechanical behavior and microstructure evolution of Mg-Gd-Y-Zn-Zr alloy during multipass hot compression deformation. Mater. Sci. Forum 2016, 849, 186–195. [Google Scholar] [CrossRef]
- Yu, J.M.; Zhang, Z.M.; Wang, Q.; Hao, H.Y.; Cui, J.Y.; Li, L.L. Rotary extrusion as a novel severe plastic deformation method for cylindrical tubes. Mater. Lett. 2018, 215, 195–199. [Google Scholar] [CrossRef]
- Zhang, J.; Perez, R.J.; Lavemia, E.J. Effect of SiC and graphite particulates on the damping behavior of metal matrix composites. Acta Metall. Mater. 1994, 42, 395–409. [Google Scholar] [CrossRef]
- Liu, X.L.; Chu, M.L.; Wen, Y.Z.; Hui, Z.L.; Su, M.Z. Effects of Homogenization Treatment on Microstructure and Properties of Mg-Zn-Nd-Cd-Zr Alloy. Adv. Mater. Res. 2011, 11, 76–79. [Google Scholar] [CrossRef]
- Qin, X.P.; Wang, Y.L.; Lu, C.H.; Huang, S.; Zheng, H.; Shen, C.R. Structural acoustics analysis and optimization of an enclosed box-damped structure based on response surface methodology. Mater. Des. 2016, 103, 236–243. [Google Scholar] [CrossRef]
- Abdulhadi, H.A.; Ahmad, S.N.A.S.; Ismail, L.; Ishak, M.; Mohammed, G.R. Experimental Investigation of Thermal Fatigue Die Casting Dies by Using Response Surface Modelling. Metals 2017, 7, 191. [Google Scholar] [CrossRef]
- Sathish, T. BCCS Approach for the Parametric Optimization in Machining of Nimonic-263 alloy using RSM. Mater. Today 2018, 14416–14422. [Google Scholar] [CrossRef]
- Das, A.; Sarkar, S.; karanjai, M.; Sutradhar, G. RSM Based Study on the Influence of Sintering Temperature on MRR for Titanium Powder Metallurgy Products using Box-Behnken Design. Mater. Today 2018, 5, 6509–6517. [Google Scholar] [CrossRef]
- Lorza, R.L.; García, R.E.; Calvo, M.A.M.; Vidal, R.M. Improvement in the Design of Welded Joints of EN 235JR Low Carbon Steel by Multiple Response Surface Methodology. Metals 2016, 6, 205. [Google Scholar] [CrossRef]
- Lorza, R.L.; Calvo, M.A.M.; Labari, C.B.; Fuente, P.R. Using the Multi-Response Method with Desirability Functions to Optimize the Zinc Electroplating of Steel Screws. Metals 2018, 8, 71. [Google Scholar] [CrossRef]
- Tian, Z.K.; Zhang, Z.M.; Yu, J.M.; Yu, H.T.; Yang, Y.Q. Influence of Heat Treatment on Microstructure and Mechanical Properties of Large Deforming and Heat-resisting Magnesium Alloys. New Technol. New Process 2016, 4, 76–78. [Google Scholar] [CrossRef]
- Sahu, U.K.; Mahapatra, S.S.; Patel, R.K. Application of Box-Behnken Design in response surface methodology for adsorptive removal of arsenic from aqueous solution using CeO2/Fe2O3/graphene nanocomposite. Mater. Chem. Phys. 2018, 207, 233–242. [Google Scholar] [CrossRef]
- Sadoun, O.; Rezgui, F.; G’Sell, C. Optimization of valsartan encapsulation in biodegradables polyesters using Box-Behnken design. Mater. Sci. Eng. C 2018, 90, 189–197. [Google Scholar] [CrossRef] [PubMed]
- Niua, R.L.; Yana, F.J.; Wang, Y.S.; Duana, D.P.; Yang, X.M. Effect of Zr content on damping property of Mg–Zr binary alloys. Mater Sci. Eng. A 2018, 718, 418–426. [Google Scholar] [CrossRef]
- Jun, J.H. Damping behavior of Mg–Zn–Al casting alloys. Mater Sci. Eng. A. 2016, 665, 86–89. [Google Scholar] [CrossRef]
- Wan, D.Q.; Wang, J.C. Internal Friction Peaks in Mg-0.6% Zr and Mg-Ni High Damping Magnesium Alloys. Rare Met. Mater. Eng. 2017, 46, 2790–2793. [Google Scholar] [CrossRef]
- Wang, J.F.; Lu, R.P.; Wei, W.W.; Huang, X.F.; Pan, F.S. Effect of long period stacking ordered(LPSO) structure on the damping capacities of Mg-Cu-Mn-Zn-Y alloys. J. Alloys Compd. 2012, 527, 1–5. [Google Scholar] [CrossRef]
- Sugimoto, K.; Niiya, K.; Okamoto, T.; Kishitake, K. Study of damping capacity in Magnesium alloys. Trans. Jpn. Inst. Met. 1977, 18, 277–288. [Google Scholar] [CrossRef]
- Zhen, Y.Z.; Xiao, Q.Z.; Wen, J.J. The influence of heat treatment on damping response of AZ91D magnesium alloy. Mater. Sci. Eng. A 2005, 392, 150–155. [Google Scholar] [CrossRef]
- Lv, B.J.; Peng, J.; Zhu, L.L.; Wang, Y.J.; Tang, A.T. The effect of 14H LPSO phase on dynamic recrystallization behavior and hot workability of Mg–2.0Zn–0.3Zr–5.8Y alloy. Mater. Sci. Eng. A 2014, 599, 150–159. [Google Scholar] [CrossRef]
- Tahreen, N.; Zhang, D.F.; Pan, F.S.; Jiang, X.Q.; Li, C.; Li, D.Y.; Chen, D.L. Characterization of hot deformation behavior of an extruded Mg–Zn–Mn–Y alloy containing LPSO phase. J. Alloys Compd. 2015, 644, 814–823. [Google Scholar] [CrossRef]
- Yu, J.M.; Zhang, Z.M.; Wang, Q.; Yin, X.Y.; Cui, J.Y. Dynamic recrystallization behavior of magnesium alloys with LPSO during hot deformation. J. Alloys Compd. 2017, 704, 382–389. [Google Scholar] [CrossRef]
- Wang, J.F.; Gao, S.; Song, P.F.; Huang, X.F.; Pan, F.S. Effects of phase composition on the mechanical properties and damping capacities of as-extruded Mg-Zn-Y-Zr alloys. J. Alloys Compd. 2001, 509, 8567–8572. [Google Scholar] [CrossRef]
- Zhang, G.S.; Zhang, Z.M.; Du, Y.; Yan, Z.M.; Che, X. Effect of Isothermal Repetitive Upsetting Extrusion on the Microstructure of Mg-12.0Gd-4.5Y-2.0Zn-0.4Zr Alloy. Materials 2018, 11, 2092. [Google Scholar] [CrossRef]
- Zhang, Z.M.; Yan, Z.M.; Du, Y.; Zhang, G.; Zhu, J.; Ren, L.; Wang, Y. Hot Deformation Behavior of Homogenized Mg-13.5Gd-3.2Y-2.3Zn-0.5Zr Alloy via Hot Compression Tests. Materials 2018, 11, 2282. [Google Scholar] [CrossRef]
- Shanavas, S.; Dhas, J.E. Parametric optimization of friction stir welding parameters of marine grade aluminium alloy using response surface methodology. Trans. Nonferrous Met. Soc. 2017, 27, 2334–2344. [Google Scholar] [CrossRef]
- Bhuyan, R.K.; Mohanty, S.; Routara, B.C. RSM and Fuzzy logic approaches for predicting the surface roughness during EDM of Al-SiCp MMC. Mater. Today 2017, 4, 1947–1956. [Google Scholar] [CrossRef]
- Afshar, S.; Banisadi, H. Investigation the effect of graphene oxide and gelatin/starch weight ratio on the properties of starch/gelatin/GO nanocomposite films: The RSM study. Int. J. Biol. Macromol. 2018, 109, 1019–1028. [Google Scholar] [CrossRef] [PubMed]
- Solmaz, S.; Raei, E.; Talebbeydokhti, N. Enhanced removal of phosphate from aqueous solutions using a modified sludge derived biochar: Comparative study of various modifying cations and RSM based optimization of pyrolysis parameters. J. Environ. Manag. 2018, 225, 75–83. [Google Scholar] [CrossRef]
- Lu, R.P.; Song, P.F.; Huang, S.; Pan, F.S. Effects of heat treatment on the morphology of long-period stacking ordered phase and the corresponding mechanical properties of Mg–9Gd–xEr–1.6Zn–0.6Zr magnesium alloys. Mater. Sci. Eng. A 2013, 2, 36–45. [Google Scholar] [CrossRef]


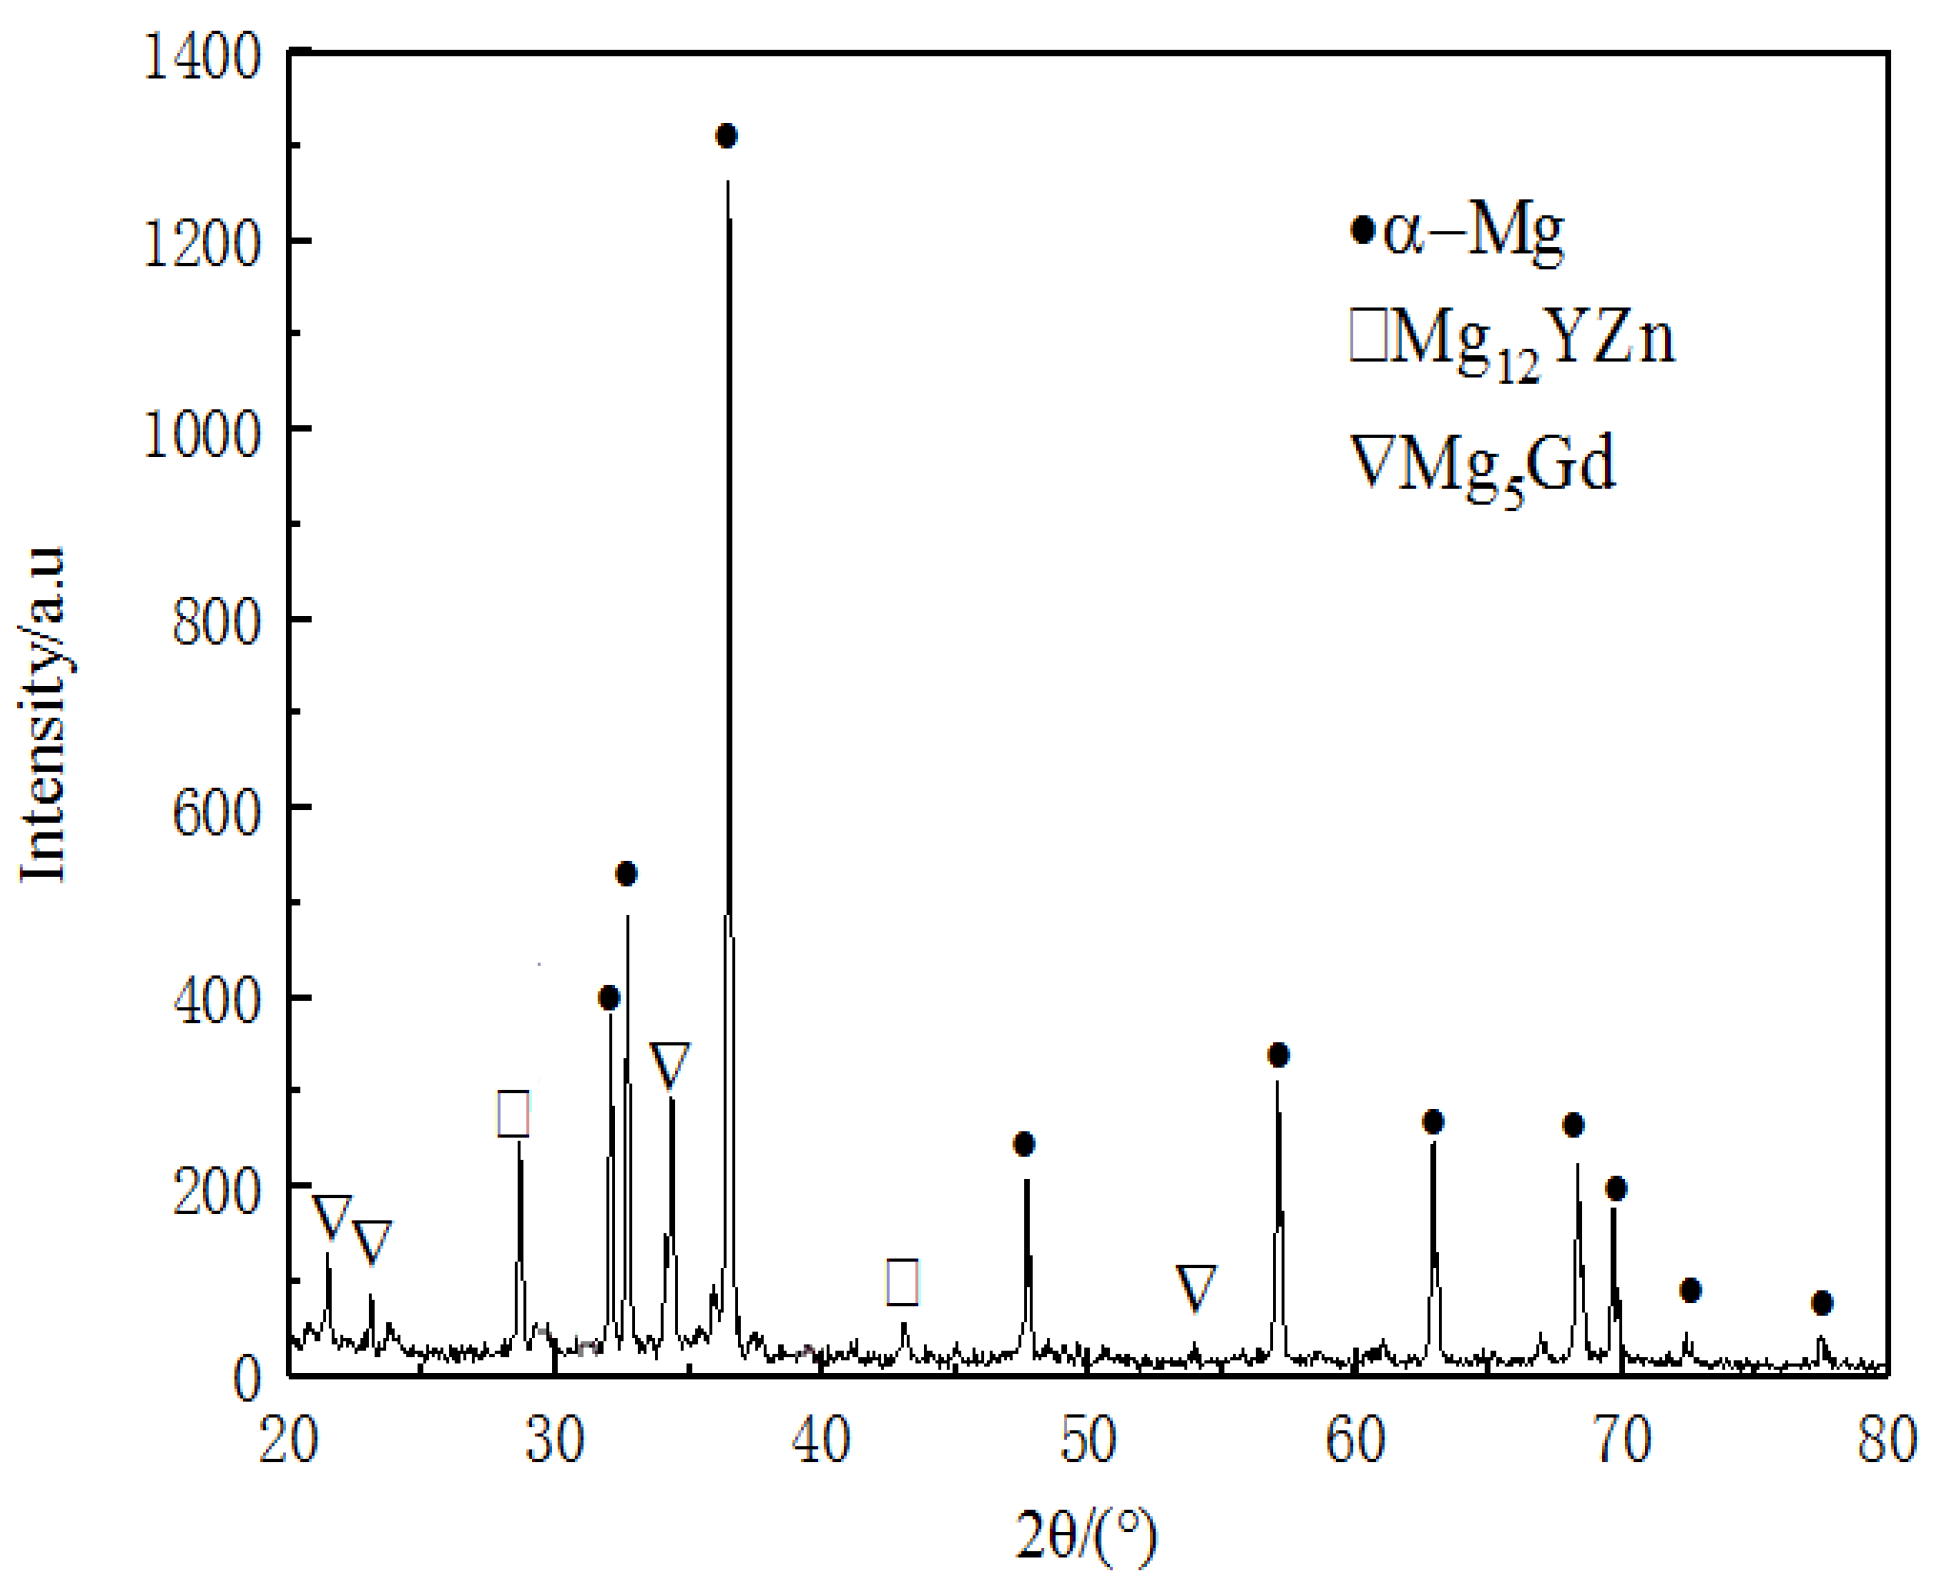
| Mg | Gd | Y | Zn | Zr |
|---|---|---|---|---|
| Bal | 13.77 | 4.64 | 2.39 | 0.29 |
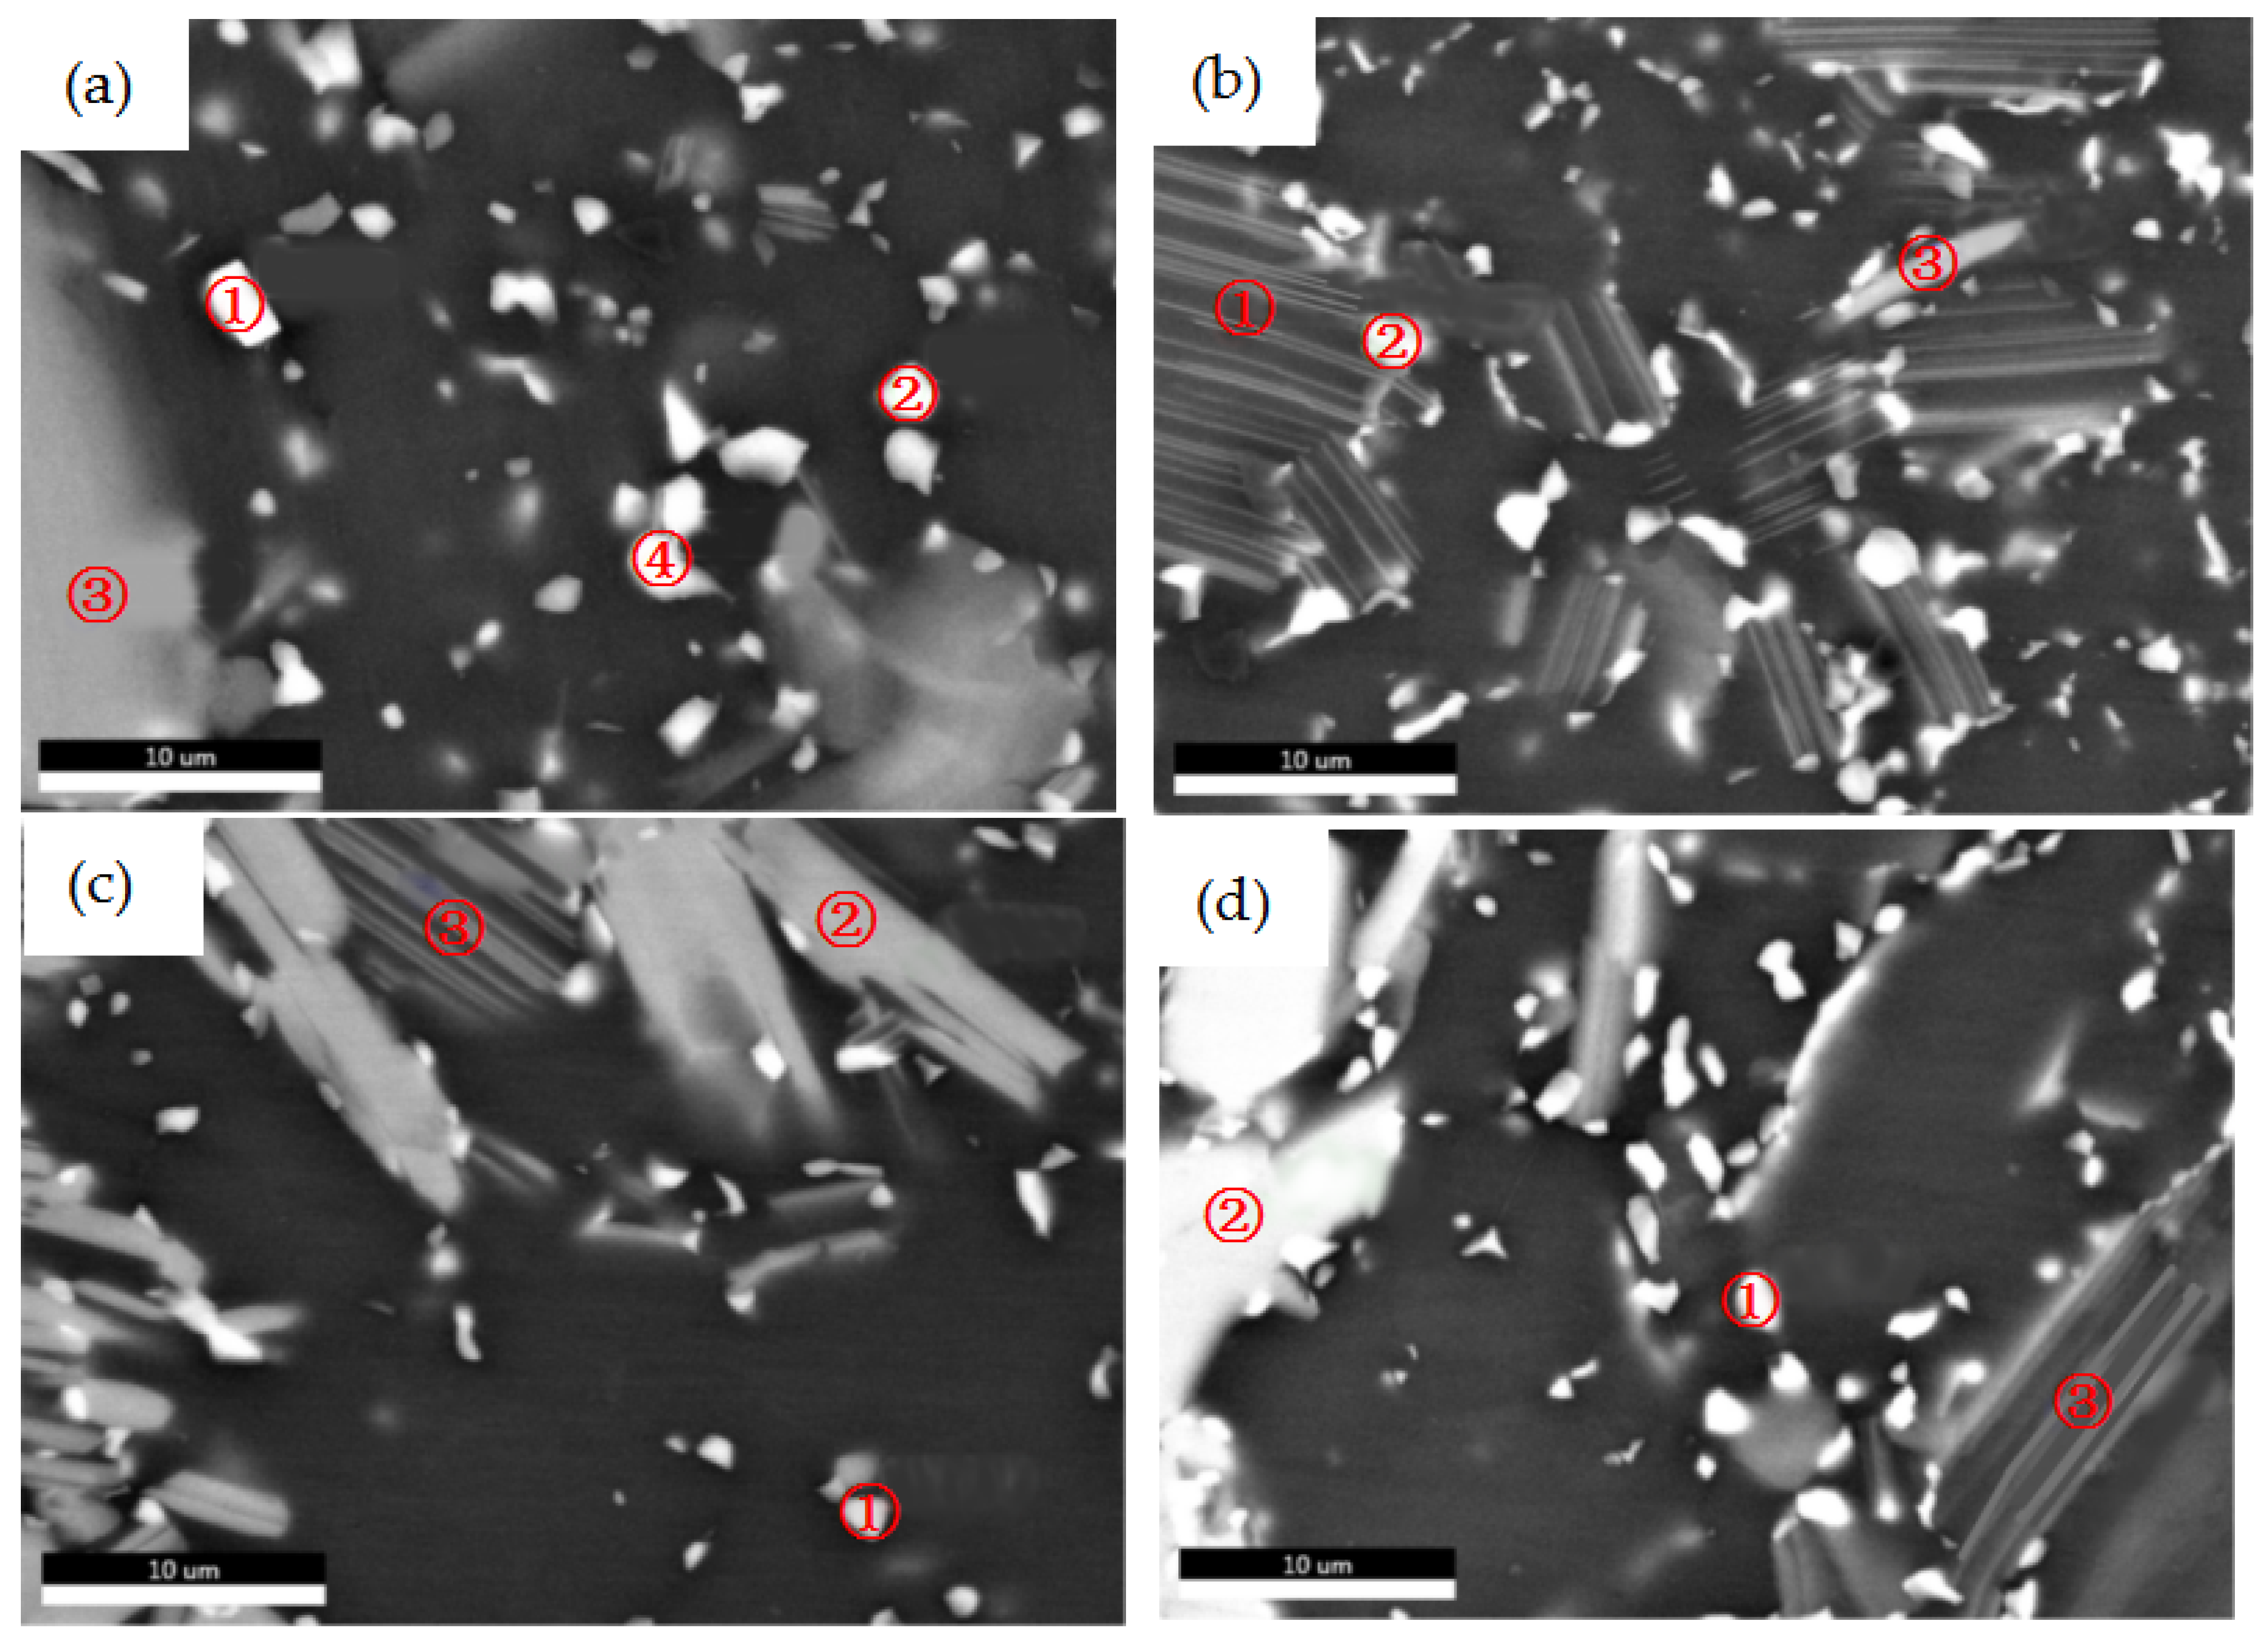
| Sample | Detection Position | Element Content (at. %) | The Possible Phase | ||||
|---|---|---|---|---|---|---|---|
| Mg | Gd | Y | Zn | Zr | |||
| 190 °C × 20 h | Spot 1 | 56.01 | 20.70 | 21.02 | 0.65 | 1.63 | RE-rich phase |
| Spot 2 | 93.17 | 4.42 | 1.64 | 0.49 | 0.29 | Mg5Gd | |
| Spot 3 | 89.92 | 3.62 | 2.21 | 3.99 | 0.26 | Mg12YZn | |
| Spot 4 | 91.80 | 5.40 | 1.85 | 0.66 | 0.29 | Mg5Gd | |
| 210 °C × 20 h | Spot 1 | 96.09 | 1.77 | 0.95 | 0.96 | 0.22 | LPSO |
| Spot 2 | 94.20 | 3.18 | 1.48 | 0.86 | 0.29 | Mg5Gd | |
| Spot 3 | 93.63 | 2.28 | 1.47 | 2.34 | 0.28 | Mg5Gd | |
| 230 °C × 20 h | Spot 1 | 94.25 | 3.54 | 1.42 | 0.52 | 0.28 | Mg5Gd |
| Spot 2 | 90.65 | 3.23 | 1.90 | 3.94 | 0.28 | Mg12YZn | |
| Spot 3 | 93.70 | 2.49 | 1.30 | 2.23 | 0.27 | LPSO | |
| 250 °C × 20 h | Spot 1 | 94.46 | 3.41 | 1.46 | 0.40 | 0.27 | Mg5Gd |
| Spot 2 | 88.76 | 3.84 | 2.46 | 4.64 | 0.30 | Mg12YZn | |
| Spot 3 | 96.89 | 1.63 | 0.76 | 0.51 | 0.21 | LPSO | |
| Ageing Treatment | 190 °C × 20 h | 210 °C × 20 h | 230 °C × 20 h | 250 °C × 20 h |
|---|---|---|---|---|
| Volume (Second phases)% | 29.652 | 33.394 | 28.219 | 29.233 |
| Input | Notation | Level | ||
|---|---|---|---|---|
| −1 | 0 | 1 | ||
| Solution temperature (°C) | A | 495 | 510 | 525 |
| Solution time (h) | B | 10 | 12 | 14 |
| Ageing temperature (°C) | C | 215 | 230 | 245 |
| Ageing time (h) | D | 17 | 20 | 23 |
| Experiment Number | Experimental Conditions | Yield Strength (MPa) | Calculated Parameters | ||||
|---|---|---|---|---|---|---|---|
| Solution | Ageing | ||||||
| A (°C) | B (h) | C (°C) | D (h) | Y1 (MPa) | Y2 | ||
| 1 | 510 | 12 | 215 | 17 | 208.89 | 282.28 | 0.287 |
| 2 | 495 | 12 | 215 | 20 | 227.26 | 307.11 | 0.294 |
| 3 | 510 | 10 | 215 | 20 | 225.09 | 304.18 | 0.235 |
| 4 | 510 | 14 | 215 | 20 | 201.18 | 271.86 | 0.197 |
| 5 | 525 | 12 | 215 | 20 | 231.36 | 312.65 | 0.254 |
| 6 | 510 | 12 | 215 | 23 | 228.56 | 308.87 | 0.211 |
| 7 | 495 | 12 | 230 | 17 | 244.81 | 349.73 | 0.279 |
| 8 | 510 | 10 | 230 | 17 | 229.37 | 327.67 | 0.254 |
| 9 | 510 | 14 | 230 | 17 | 233.39 | 333.42 | 0.229 |
| 10 | 525 | 12 | 230 | 17 | 250.19 | 357.41 | 0.244 |
| 11 | 495 | 10 | 230 | 20 | 237.89 | 339.84 | 0.257 |
| 12 | 495 | 14 | 230 | 20 | 247.72 | 353.88 | 0.249 |
| 13 | 510 | 12 | 230 | 20 | 226.04 | 322.91 | 0.243 |
| 14 | 510 | 12 | 230 | 20 | 230.7 | 329.57 | 0.241 |
| 15 | 510 | 12 | 230 | 20 | 228.57 | 326.53 | 0.224 |
| 16 | 525 | 10 | 230 | 20 | 239.58 | 342.26 | 0.236 |
| 17 | 525 | 14 | 230 | 20 | 235 | 335.72 | 0.289 |
| 18 | 495 | 12 | 230 | 23 | 232.02 | 331.45 | 0.195 |
| 19 | 510 | 10 | 230 | 23 | 243.64 | 348.05 | 0.258 |
| 20 | 510 | 14 | 230 | 23 | 240.18 | 343.11 | 0.175 |
| 21 | 525 | 12 | 230 | 23 | 237.92 | 339.89 | 0.245 |
| 22 | 510 | 12 | 245 | 17 | 221.04 | 315.77 | 0.221 |
| 23 | 495 | 12 | 245 | 20 | 231.52 | 312.87 | 0.308 |
| 24 | 510 | 10 | 245 | 20 | 237.64 | 321.13 | 0.289 |
| 25 | 510 | 14 | 245 | 20 | 220.73 | 298.28 | 0.274 |
| 26 | 525 | 12 | 245 | 20 | 232.08 | 313.62 | 0.327 |
| 27 | 510 | 12 | 245 | 23 | 222.35 | 317.64 | 0.259 |
| Variables | Sum of Squares of Deviations | Degree of Freedom | Mean Square | F-Value | p-Value | Significant |
|---|---|---|---|---|---|---|
| Model | 9167.77 | 14 | 654.84 | 4.18 | 0.0088 | Extremely Significant |
| A | 0.92 | 1 | 0.92 | 5.90 × 10⁻³ | 0.9401 | - |
| B | 182.99 | 1 | 182.99 | 1.17 | 0.3011 | - |
| C | 565.26 | 1 | 565.26 | 3.61 | 0.0818 | - |
| D | 43.06 | 1 | 43.05 | 0.27 | 0.6097 | - |
| AB | 105.88 | 1 | 105.88 | 0.68 | 0.4271 | - |
| dAC | 6.79 | 1 | 6.79 | 0.043 | 0.8387 | - |
| AD | 0.14 | 1 | 0.14 | 9.21 × 10⁻⁴ | 0.9763 | - |
| BC | 22.42 | 1 | 22.42 | 0.14 | 0.7119 | - |
| BD | 28.57 | 1 | 28.57 | 0.18 | 0.677 | - |
| CD | 152.77 | 1 | 152.77 | 0.97 | 0.343 | - |
| A2 | 975.36 | 1 | 975.36 | 6.22 | 0.0282 | - |
| B2 | 37.3 | 1 | 37.3 | 0.24 | 0.6344 | - |
| C2 | 4106.38 | 1 | 4106.38 | 26.2 | 0.0003 | - |
| D2 | 271.19 | 1 | 271.19 | 1.73 | 0.2129 | - |
| Residuals | 1880.66 | 12 | 156.72 | - | - | - |
| Lack of fit | 1858.43 | 10 | 185.84 | 16.72 | 0.0577 | Not Significant |
| Pure Error | 22.23 | 2 | 11.12 | - | - | - |
| Total | 11,048.43 | 26 | - | - | - | - |
| Variables | Sum of Squares of Deviations | Degree of Freedom | Mean Square | F-Value | p-Value | Significant |
|---|---|---|---|---|---|---|
| Model | 0.025 | 14 | 1.78 × 10⁻³ | 2.69 | 0.0470 | Significant |
| A | 1.41 × 10⁻⁵ | 1 | 1.41 × 10⁻⁵ | 0.021 | 0.8864 | - |
| B | 1.12 × 10⁻³ | 1 | 1.12 × 10⁻³ | 1.69 | 0.2174 | - |
| C | 3.33 × 10⁻³ | 1 | 3.33 × 10⁻³ | 5.04 | 0.0444 | - |
| D | 2.44 × 10⁻³ | 1 | 2.44 × 10⁻³ | 3.68 | 0.0791 | - |
| AB | 9.30 × 10⁻⁴ | 1 | 9.30 × 10⁻⁴ | 1.41 | 0.2587 | - |
| AC | 8.70 × 10⁻⁴ | 1 | 8.70 × 10⁻⁴ | 1.32 | 0.2738 | - |
| AD | 1.81 × 10⁻³ | 1 | 1.81 × 10⁻³ | 2.73 | 0.1244 | - |
| BC | 1.32 × 10⁻⁴ | 1 | 1.32 × 10⁻⁴ | 0.2 | 0.6628 | - |
| BD | 8.41 × 10⁻⁴ | 1 | 8.41 × 10⁻⁴ | 1.27 | 0.2816 | - |
| CD | 3.25 × 10⁻³ | 1 | 3.25 × 10⁻³ | 4.91 | 0.0468 | - |
| A2 | 3.71 × 10⁻³ | 1 | 3.71 × 10⁻³ | 5.61 | 0.0355 | - |
| B2 | 4.80 × 10⁻⁵ | 1 | 4.80 × 10⁻⁵ | 0.073 | 0.7922 | - |
| C2 | 3.01 × 10⁻³ | 1 | 3.01 × 10⁻³ | 4.55 | 0.0543 | - |
| D2 | 9.90 × 10⁻⁴ | 1 | 9.90 × 10⁻⁴ | 1.5 | 0.2447 | - |
| Residuals | 7.94 × 10⁻³ | 12 | 6.62 × 10⁻⁴ | - | - | - |
| Lack of fit | 7.72 × 10⁻³ | 10 | 7.72 × 10⁻⁴ | 7.08 | 0.1299 | Not Significant |
| Pure Error | 2.18 × 10⁻⁴ | 2 | 1.09 × 10⁻⁴ | - | - | - |
| Total | 0.033 | 26 | - | - | - | - |
| Sample | Heat Treatment | Tensile Strength (MPa) | Damping Coefficient |
|---|---|---|---|
| 1 | 520 °C × 10 h + 239 °C × 22 h | 346.78 | 0.296 |
| 2 | 520 °C × 10 h + 205 °C × 22 h | 340.21 | 0.257 |
| 3 | 520 °C × 9 h + 230 °C × 20 h | 298.53 | 0.247 |
| 4 | 520 °C × 11 h + 249 °C × 24 h | 330.94 | 0.288 |
| 5 | 510 °C × 9 h + 230 °C × 20 h | 317.33 | 0.252 |
| Sample | 1 | 2 | 3 | 4 | 5 |
|---|---|---|---|---|---|
| Volume (Second phases )% | 17.104 | 20.973 | 22.31 | 16.322 | 17.463 |
© 2019 by the authors. Licensee MDPI, Basel, Switzerland. This article is an open access article distributed under the terms and conditions of the Creative Commons Attribution (CC BY) license (http://creativecommons.org/licenses/by/4.0/).
Share and Cite
Zhang, J.; Kou, Z.; Yang, Y.; Li, B.; Li, X.; Yi, M.; Han, Z. Optimisation of Heat Treatment Process for Damping Properties of Mg-13Gd-4Y-2Zn-0.5Zr Magnesium Alloy Using Box–Behnken Design Method. Metals 2019, 9, 157. https://doi.org/10.3390/met9020157
Zhang J, Kou Z, Yang Y, Li B, Li X, Yi M, Han Z. Optimisation of Heat Treatment Process for Damping Properties of Mg-13Gd-4Y-2Zn-0.5Zr Magnesium Alloy Using Box–Behnken Design Method. Metals. 2019; 9(2):157. https://doi.org/10.3390/met9020157
Chicago/Turabian StyleZhang, Jun, Ziming Kou, Yaqin Yang, Baocheng Li, Xiaowen Li, Ming Yi, and Zhongjian Han. 2019. "Optimisation of Heat Treatment Process for Damping Properties of Mg-13Gd-4Y-2Zn-0.5Zr Magnesium Alloy Using Box–Behnken Design Method" Metals 9, no. 2: 157. https://doi.org/10.3390/met9020157