Article

Occupational Exposure to Fine Particles and Ultrafine Particles in a Steelmaking Foundry

1
Department of Medical Sciences and Public Health, University of Cagliari, 09042 Monserrato, Italy
2
Department of Civil and Environmental Engineering and Architecture, University of Cagliari, 09123 Cagliari, Italy
3
Department of Medical and Surgical Specialties, Radiological Sciences, and Public Health, University of Brescia, 25123 Brescia, Italy
4
Department of Civil and Mechanical Engineering, University of Cassino and Southern Lazio, I-03043 Cassino, Italy
5
International Laboratory for Air Quality and Health, Queensland University of Technology (QUT), 4001 Brisbane, Australia
6
Department of Engineering, University of Naples “Parthenope”, 80133 Naples, Italy
*
Author to whom correspondence should be addressed.
Metals 2019, 9(2), 163; https://doi.org/10.3390/met9020163
Submission received: 30 December 2018 / Revised: 27 January 2019 / Accepted: 28 January 2019 / Published: 1 February 2019
(This article belongs to the Special Issue Ironmaking and Steelmaking)

Abstract

:
Several studies have shown an increased mortality rate for different types of tumors, respiratory disease and cardiovascular morbidity associated with foundry work. Airborne particles were investigated in a steelmaking foundry using an electric low-pressure impactor (ELPI+™), a Philips Aerasense Nanotracer and traditional sampling equipment. Determination of metallic elements in the collected particles was carried out by inductively coupled plasma mass spectrometry. The median of ultrafine particle (UFP) concentration was between 4.91 × 10³ and 2.33 × 10⁵ part/cm3 (max. 9.48 × 10⁶ part/cm3). Background levels ranged from 1.97 × 10⁴ to 3.83 × 10⁴ part/cm3. Alveolar and deposited tracheobronchial surface area doses ranged from 1.3 × 10² to 8.7 × 103 mm2, and 2.6 × 101 to 1.3 × 103 mm2, respectively. Resulting inhalable and respirable fraction and metallic elements were below limit values set by Italian legislation. A variable concentration of metallic elements was detected in the different fractions of UFPs in relation to the sampling site, the emission source and the size range. This data could be useful in order to increase the knowledge about occupational exposure to fine and ultrafine particles and to design studies aimed to investigate early biological effects associated with the exposure to particulate matter in the foundry industries.

Graphical Abstract

1. Introduction

The exposure to contaminants generated by iron and steel melting processes has been included in the monograph of the International Agency for Research on Cancer (IARC) as a Group 1 human carcinogen [1]. Several studies have shown an increased mortality rate for different types of tumors, respiratory disease and cardiovascular morbidity associated with foundry work [2,3,4,5,6]. Foundry workers, during the processing stages, could be exposed to a multitude of breathable dust types and aerosols, such as metal fumes, polycyclic aromatic hydrocarbons (PAH), mineral powders, resins and isocyanates [7]. Among the several toxic and carcinogenic substances contained in foundry dust, heavy and transition metal fumes represent a major health concern, as they can induce local inflammation in the lung tissue, lipid peroxidation of cell membranes and oxidative damage to the genome [8,9].
Several studies have shown that different hot processes in the metallurgical industry have the capacity to generate high concentrations of sub-micrometric particles. In particular, important number concentrations of ultrafine particles (UFPs, <100 nm in diameter) were generated as combustion products or in saturated vapors [10,11,12,13,14,15,16,17,18]. UFPs may have more pronounced toxic effects than larger particles, due to their larger surface area to unit mass ratio, which determines their peculiar physicochemical properties and increased biological activity [19,20,21,22,23]. Recently, some studies have shown an association between ultrafine particulate exposure and health effects on the cardiovascular and respiratory tract [24,25,26], however, epidemiological evidence on UFP-related adverse health effects is still limited and subject to disagreement [27,28,29,30,31].
Some studies have focused on surface-related effects [24,32,33,34], particle-related effects [25,35,36,37], mass-related effects [38] or effects related to metallic elements contained in the particulate matter [39,40,41]; however, the role that the different (size- or non-size-related) components in particulate matter play in determining the adverse health effects observed, and the most appropriate metric (or metrics) for exposure assessment and control, remain unclear [42,43,44].
Although in recent decades research has increased into UFP exposure in living and working environments [45,46], there is limited evidence of the epidemiological studies about UFP-related adverse health effects, probably attributable to the lack of available data for UFP exposure assessment. Therefore, more knowledge is needed on the different metrics that may be associated with health effects, which may provide data for the realization of job-exposure matrices. The latter are indispensable for designing epidemiological studies aimed at investigating the health effects of the airborne dispersed particulate matter and of the various components that make it up. The main objective of this study was to assess the occupational exposure to fine and ultrafine particles in a steelmaking factory, with a multi-metric and multi-instrumental approach, in order to increase knowledge about sources of fine and ultrafine particles and possible health implications.

2. Materials and Methods

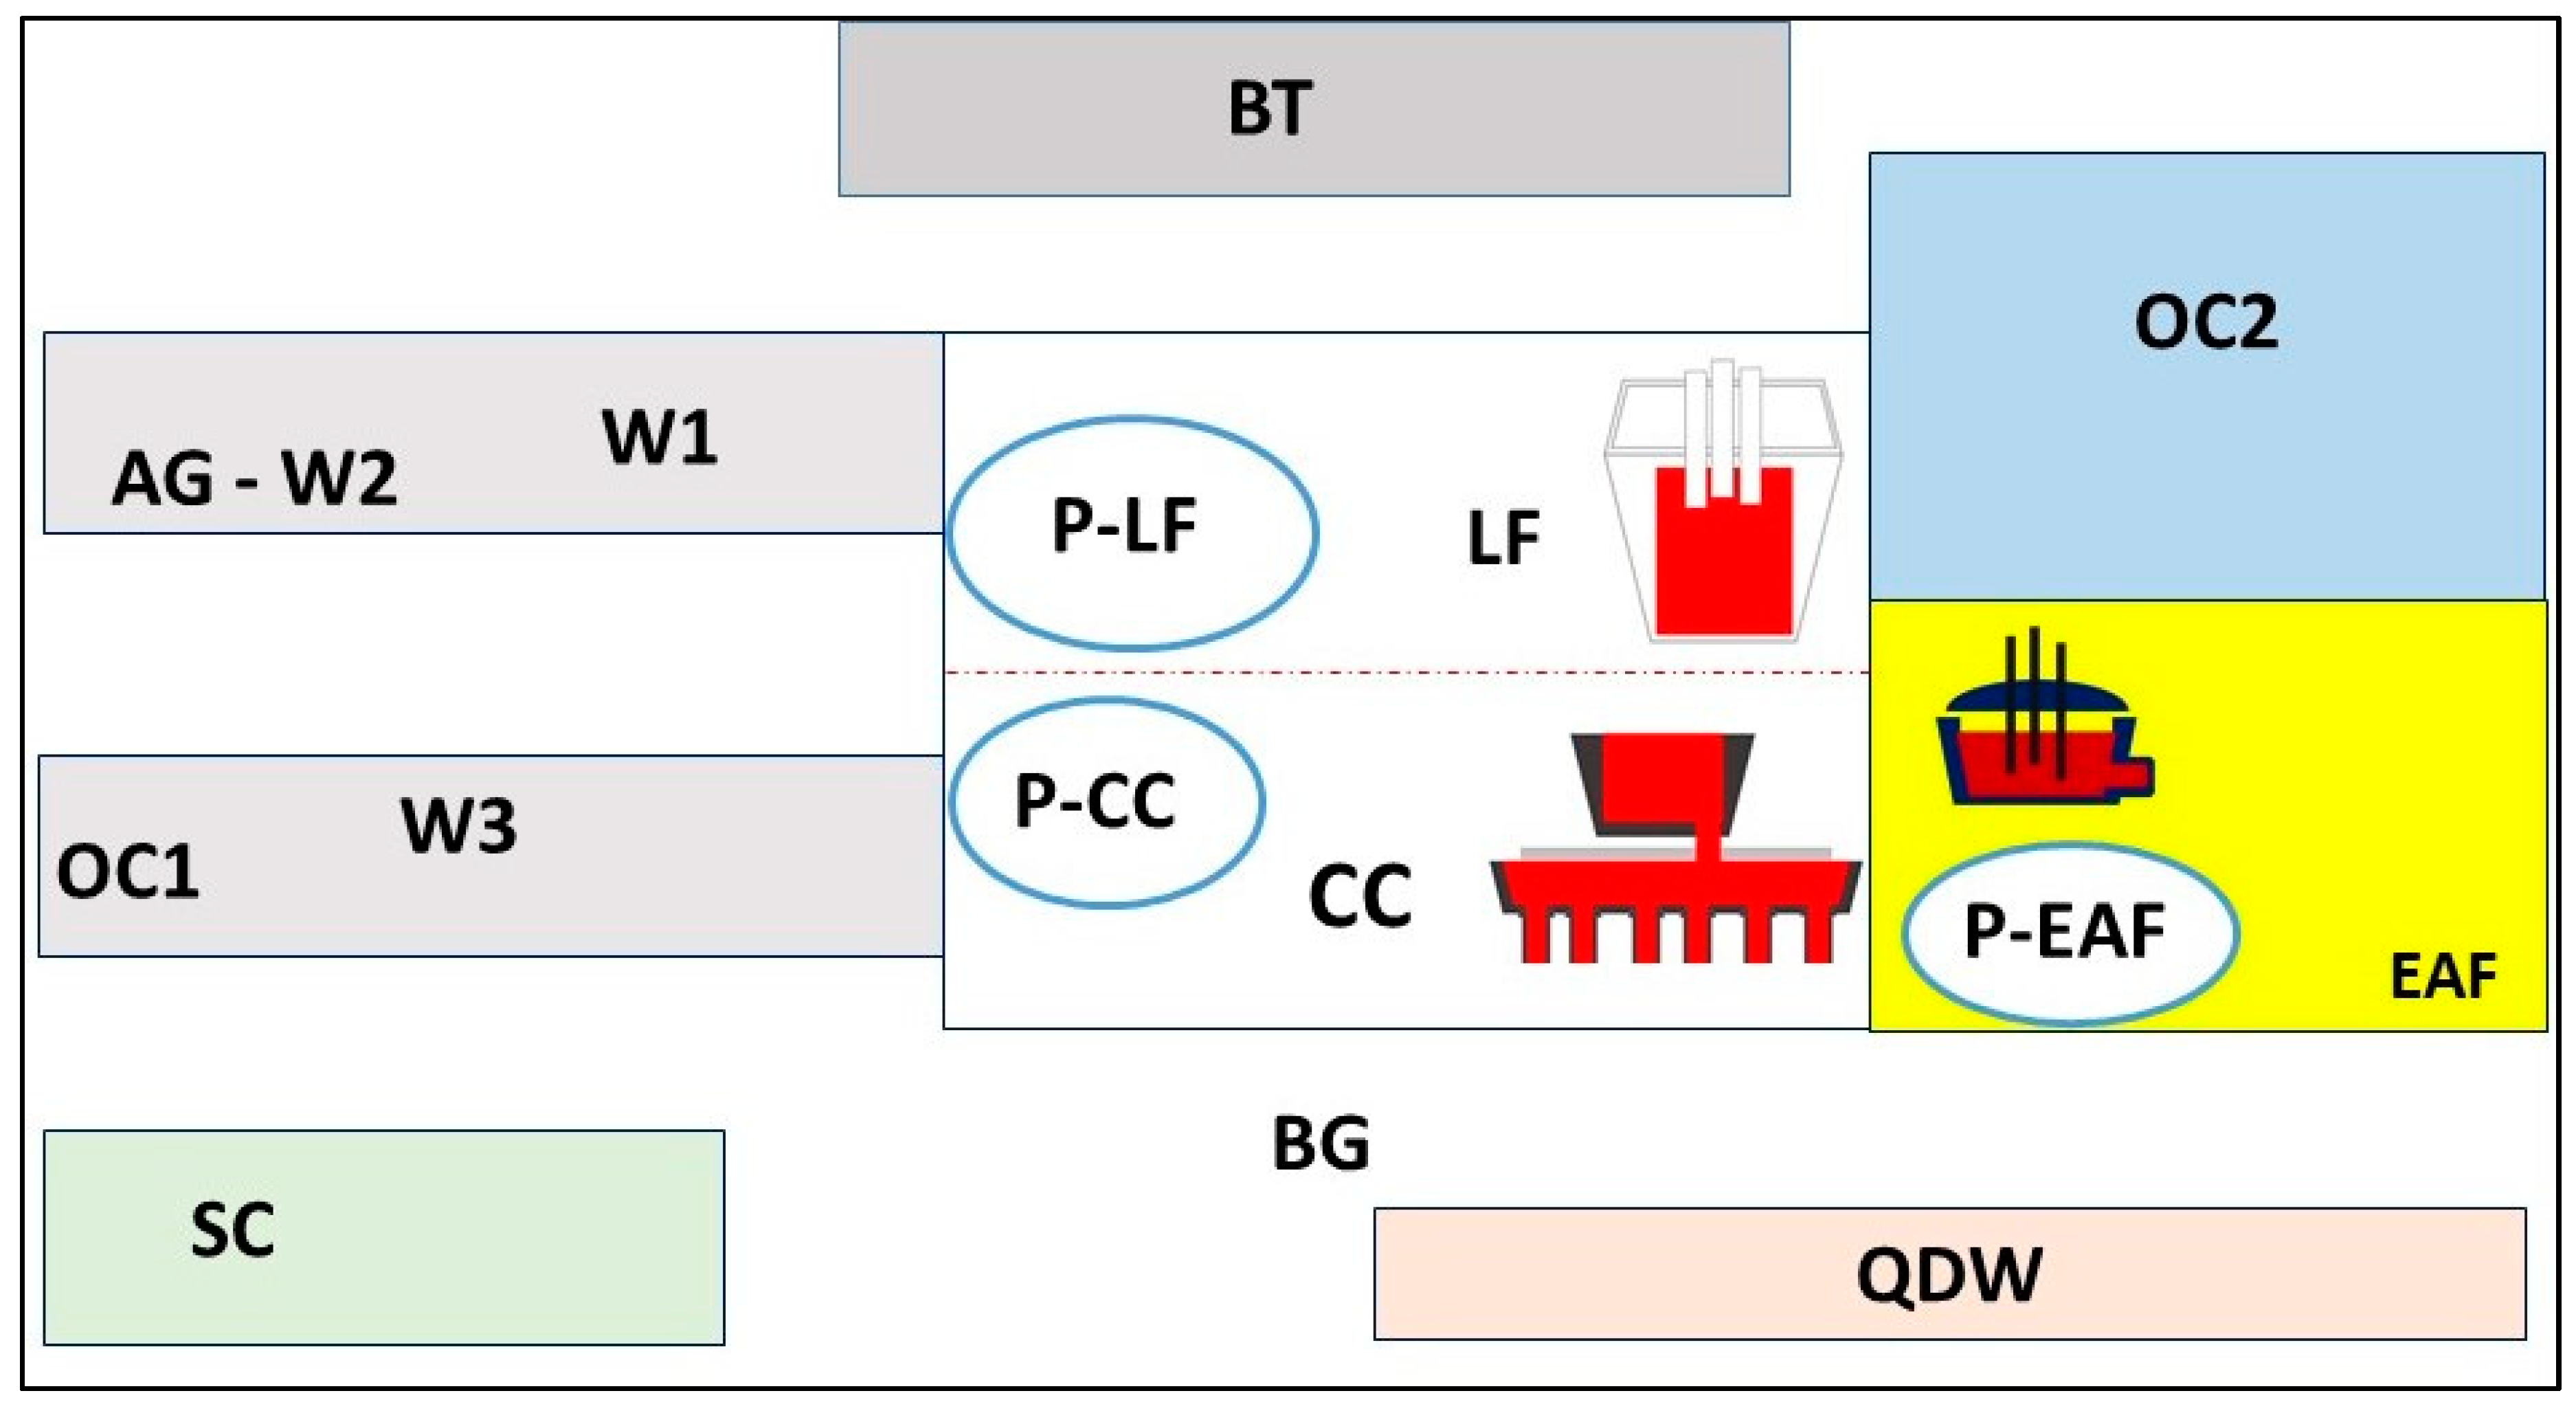
2.1. Sampling Site and Study Design

Sampling was performed in a foundry that uses the “Mini Mills” electric arc furnace technology (EAF) for the treatment of molten steel in the ladle and subsequent continuous casting line for the production of steel billets intended for feeding the rolling plant. Iron scrap is used as raw material for feeding the furnace. The factory produces steel of different qualities and diameter intended for concrete reinforcing in the construction industry.
The exposure assessment strategy was mainly based on a previous study conducted in the same working environment for testing assessment of fine and ultrafine particle emissions [47]. Furthermore, the deposited particle surface area per unit volume of inhaled air in some regions of the respiratory tract (particularly in the tracheobronchial and alveolar regions) was assessed.
The basic strategy combined with additional monitoring equipment to obtain additional information is described below. The monitoring strategy (for six days in the summer season) consisted of stationary, quasi-personal and personal samples in 16 different work environments during standard working conditions. The sampling time varied according to work activities. For logistical reasons, it was not possible to use all the sampling equipment at all sampling sites at the same time. The sampling sites were identified as the areas where worker exposure could be more relevant. The quasi-personal samplings were carried out in the welding laboratory at approximately 30 cm from the worker’s breathing zone. In addition, where stationary sampling was not feasible, personal samplings were carried out close to the worker’s breathing zone. Table 1 summarizes all the sampling methods, sampling sites, sampling equipment, and sampling times.
Figure 1 shows sampling sites inside and outside the plant. Monitoring was carried out in the following areas or workstations:
  • outside the plant, to measure general environmental background levels (BG) not influenced by the factory emissions;
  • at a distance of 50 m from the electric arc furnace (EAF), 2 m from the ladle furnace (LF), 2 m from the continuous casting (CC), and within the control consoles (respectively P-EAF, P-LF and P-CC);
  • in three welding stations (W1, W2, W3), respectively, with CASTOLIN 5006 electric welding on steel (55 electrodes), Nicro HLS on cast iron and electrode welding on knife (special iron) (21 electrodes);
  • inside the mechanical workshop (BT), in which various activities were carried out, including the use of an oxide flame and a grinder;
  • inside the rolling mill department (AG), welding station with use of angle grinder;
  • inside the overhead crane cabin in the finished product department (OC1);
  • in the scrap yard and in the overhead crane in the scrap yard (OC2);
  • inside the quality department workshop (QDW);
  • inside the company canteen during the lunch break (SC).

2.2. Sampling Equipment

The UFP distribution and number concentration were measured using an electric low pressure impactor and a portable particle counter. The electric low pressure impactor, model ELPI+™ (electric low pressure impactor—Dekati Ltd., Kangasala, Finland) allows the measurement of particulate matter at a stationary location. This instrument, through the dimensional selection of airborne particulates, detects in real time the particle diameter (sizes between 6 nm and 10 μm), the concentration and, based on the data collected, provides an estimate of the concentration in surface area/mass/volume of sampled particulates [48]. The ELPI+ was connected to an air intake pump with 0.6 m³/h flow rate and a pressure of 40 mbar at the final stage of the impactor (absolute filter). The number of ultrafine particles was calculated as the sum of the particles having a central geometric mean diameter (Di) between 10 nm and 314 nm (D50% range 6 nm–257 nm), assuming a density of 1 g/cm³. Data provided by ELPI+ were processed with the ELPI+ VI 2.0 software (Dekati Ltd., Kangasala, Finland). It was not possible to carry out measurements with the ELPI+ in all workstations investigated due to logistical reasons. From the second to the fifth stage of the ELPI+, the polycarbonate foils not greased were mounted for subsequent chemical analysis of the collected particulate matter, in order to determine the concentration of metals contained in it, by inductively coupled plasma inductivity mass spectrometry (ICP-MS). In this study the substrates were not greased to avoid any potential interference with the chemical analyses [49].
Personal samplings were carried out using a Philips Aerasense Nanotracer (NT—Koninklijke Philips Electronics N.V., Eindhoven, Netherlands) portable particle counter, which allows the real time measurement of particles number concentration with a diameter between 10 nm and 300 nm. The NT is a portable sampler that measures particle concentration up to 1 × 106 cm3 in the 10 nm to 300 nm size range for an airflow 0.3–0.4 L/min. The NT design and operation characteristics, as well as sensitivity and limitations, were discussed in detail in a previous study [50]; charging time and battery life is seven hours. The NT was operated in advanced mode, measuring particle concentration and average particle diameter at a fixed sampling interval of 10 s.
The lung-deposited surface area concentration was calculated using data recorded by NT. The NT monitor provides real time information about their concentration, average size, and surface area per unit volume of inhaled air that deposits in the various compartments of the respiratory tract [50]. Marra et al. [50] report that the data are obtained from the International Commission on Radiological Protection (ICRP) Publication 66 [51] with an air volume assumed for normal flow (light exercise) of workers of 1.5 m³/h. The dose (in terms of deposited alveolar or tracheobronchial surface area particles per mm²) received by workers in different areas was determined with the means of the particle surface area concentration in the alveolar or tracheobronchial tract (µm²/cm³), weighted for a time of six hours exposure. In addition, samples of powders, inhalable and respirable fraction (respectively, IF and RF), were performed, according to the Italian UNI EN 481 standard method [52], by means of samplers with 2 L/min constant flow for the inhalable fraction and 1.7 L/min for the respirable fractions. The airborne inhalable fraction was collected by filtration, using the Institute of Occupational Medicine (IOM) selector (IOM Sampler, SKC Inc., Eighty Four, PA, USA), while a Dorr-Oliver selector was used for the respirable fraction. Both fractions were collected on cellulose ester membranes with a diameter of 25 mm and porosity of 0.8 μm, according to the Unichim 1998:13 and 2010:11 methods [53,54]. The dust analysis was conducted with the microgravimetric method on the conditioned membranes, before and after collection, in the Activa Climatic box (at constant temperature and humidity for 24 h) and weighed with a fifth decimal place electronic analytical balance. The difference in weight, related to the volume of air intake, allowed the calculation of dustiness in mg/m3. The limit of detection of the method is 0.03 mg and the coefficient of variation is 0.2%.

2.3. Chemical Characterization

Particulate collected through sampling performed by ELPI+ and through the traditional methods (inhalable fraction) was analyzed by ICP-MS for the determination of the metallic elements. The analysis was aimed at determining the following metallic elements: Al, Mn, Co, Ni, Cu, Zn, As, Sr, Mo, Cd, Sn, Sb, Ba, Hg, Pb, Be, Fe and Cr. These particle samples were analyzed by ICP-MS analysis on a Perkin Elmer ELAN DRC II instrument (Perkin Elmer Sciex, Woodbridge, ON, Canada) equipped with dynamic cell reaction (DRC) to analyze chromium and iron. The analytical method and specific technical details have been reported in previous studies [47,55]. The mixed cellulose ester membrane filters and the polycarbonate foil substrates were extracted overnight in a nitric acid (HNO3) American Chemical Society (ACS)Reagent (Purity 90.0%; Sigma, Milan, Italy) 70% (v/v), and the extracted samples were diluted into Ultrapure deionized water (Tracepure® water for inorganic analysis, Merck, Rome, Italy). The reagent blank was made from blank membranes, acid, and deionized water used for the sampled membranes The limits of detection (LOD) were determined on the basis of three standard deviations (SDs) of the background signal; LOD ranged from 0.0001 µg to 0.0006 µg and the coefficient of variation ranged from 6.5% to 9%. The accuracy of the method was determined on the basis of the mean values obtained on certified reference materials submitted to the same treatment as the samples (trace elements in water National Institute of Standards and Technology (NIST) 1640). Our method of determination of metallic elements in environmental and biological samples is validated and the laboratory participates in the inter-comparison program for toxicological analysis in biological materials (G-EQUAS of the German Society of Occupational and Environmental Medicine). The limit of detection of the laboratories was accredited (ISO 9001:2000 No. 9122 SP 16).

3. Results

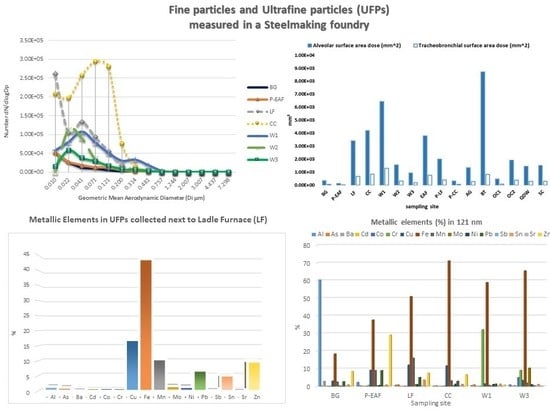
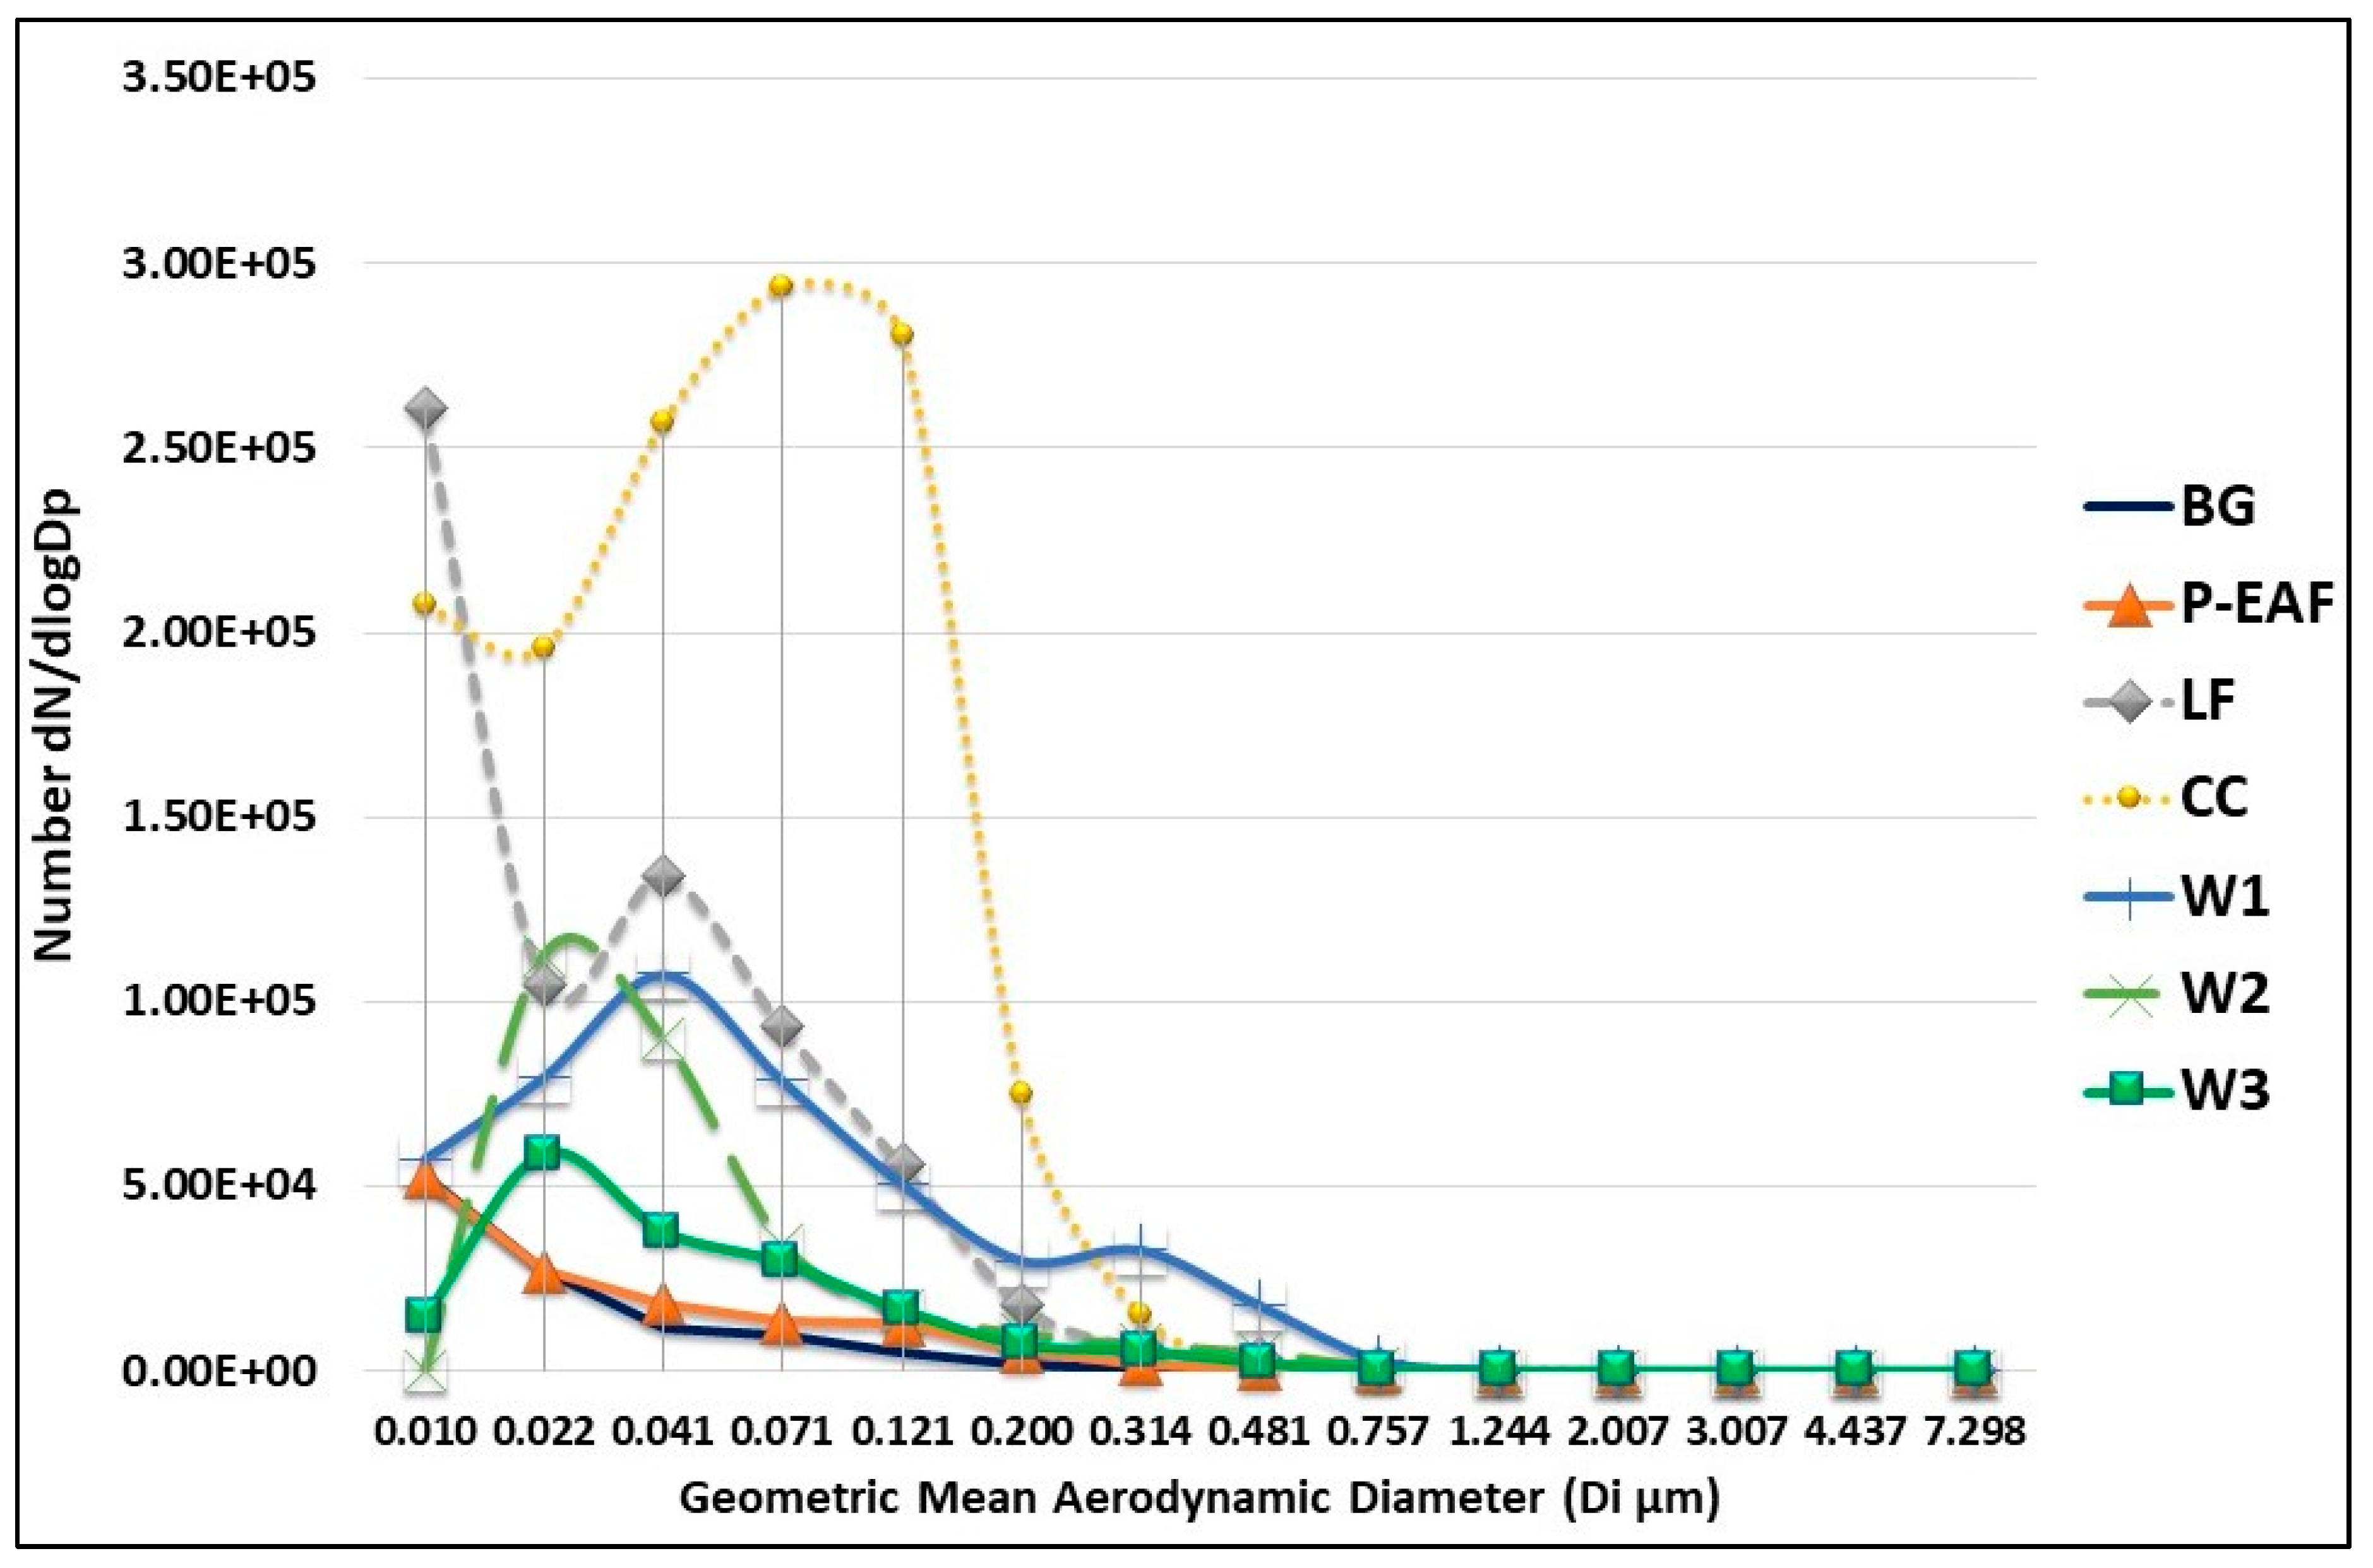
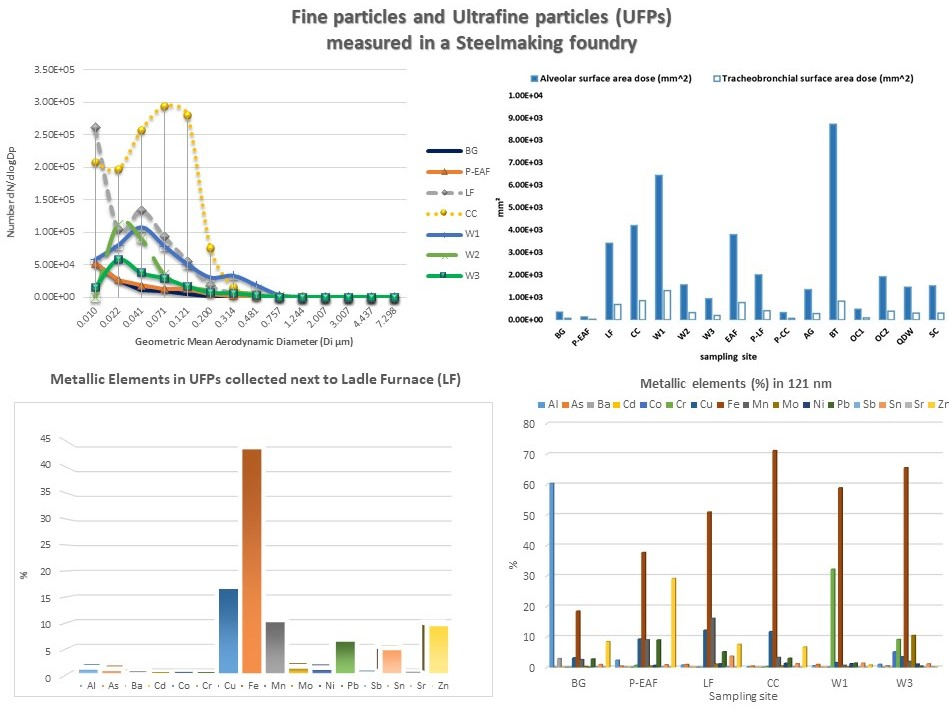
3.1. Particle Size Distribution

Figure 2 shows the distribution of particle number concentration measured by ELPI+ in the BG, P-EAF, LF, CC, W1, W2 and W3 samples.
The BG and P-EAF distributions show a modal value at 10 nm. Measurements carried out near the ladle furnace (LF) show a bimodal distribution, with the highest peak centered at 10 nm and a second peak at 41 nm. The distribution measured near the continuous casting shows a modal value at about 71 nm, with an additional peak at 10 nm. The distributions of W2 and W3 show a mode at about 22 nm, while W1 shows a bimodal distribution with two peaks at 41 nm and 314 nm.

3.2. Particle Number Concentration

Figure 3 shows median, interquartile range, minimum and maximum UFP number concentration, measured by ELPI+ and NT.
The UFP median of background levels was found to range from 1.97 × 10⁴ to 3.83 × 10⁴ part/cm3. The median of UFP ranged from 4.91 × 10³ to 2.33 × 10⁵ part/cm3, respectively, inside the EAF control pulpit and next to the ladle furnace sampling site. The maximum concentration was measured in close proximity to the continuous casting line (9.48 × 10⁶ part/cm3), while in the welding positions the median of UFP ranged between 3.15 × 10⁴ and 1.57 × 10⁵. Finally, the UFP median measured during the lunch break was 9.64 × 10⁴ part/cm³.

3.3. Particle Surface Area Concentration

Table 2 shows average particle size range, median and mean of particle surface area concentration (µm2/cm3) deposited in the alveolar and tracheobronchial tract.
The maximum UFP surface area concentration (µm2/cm3) in the alveolar tract was found in BT, and the maximum UFP surface area concentration (µm2/cm3) in the tracheobronchial tract was found in W1 (mean) and BT (median). The minimum value of UFP surface area concentration was found in P-EAF. Figure 4 shows the estimated doses of UFP surface areas in the alveolar and tracheobronchial tracts for each measuring point. The highest average values of surface area, in terms of dose deposited in the alveolar tract, were measured at BT, W1, CC, EAF and LF, whereas, the highest average surface area values, in terms of dose deposited in the tracheobronchial tract, were measured at W1, CC, BT, EAF and LF.

3.4. Particle Mass Concentration

Table 3 shows the mass concentration (mg/m³) of inhalable and respirable fraction measured by gravimetric method. The concentrations measured for both fractions collected in the external environment (BG) were found to be below the analytical detection limit. The highest concentrations were measured at welding station 1 (W1), both for the inhalable and the respirable fractions.

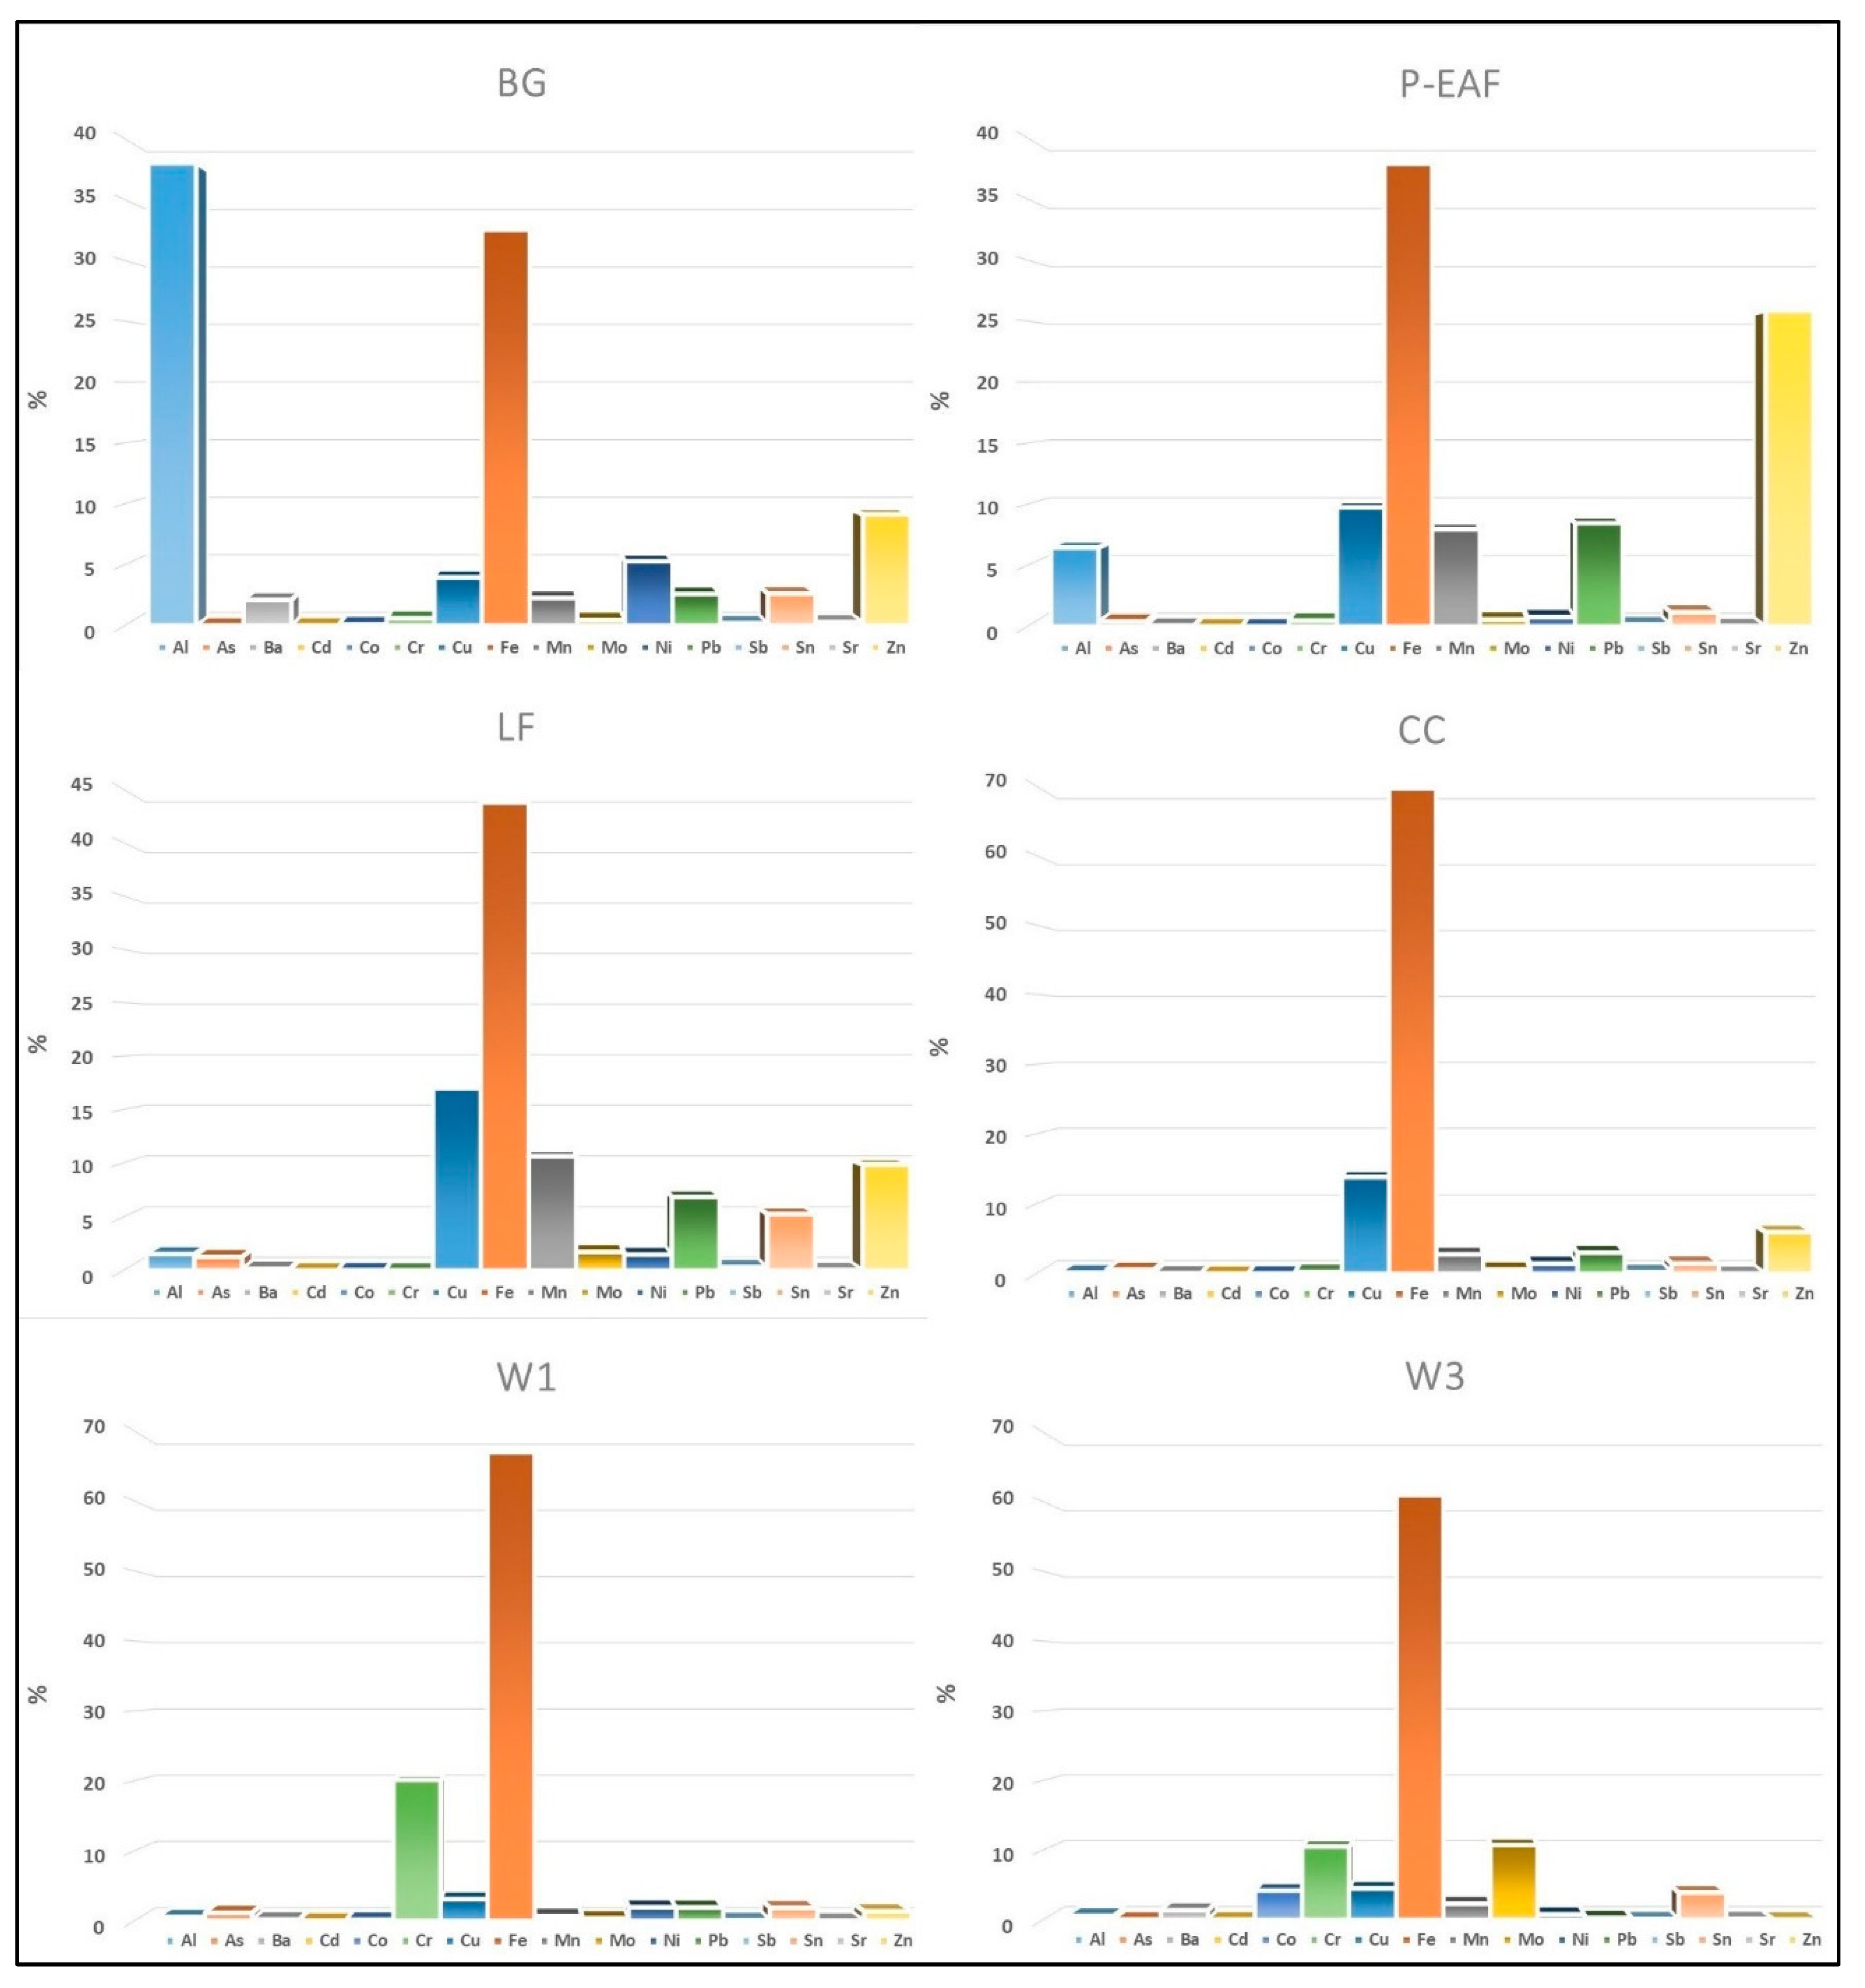
3.5. Chemical Composition

Table 4 shows metallic element concentration (μg/m³) determined in the inhalable infraction sampled at the sampling sites corresponding to BG, P-EAF, LF, CC, W1 and W3. Different concentrations of the analyzed metal elements were observed in relation to the different sampling sites investigated. Overall, the concentrations of the determined metallic elements, for which occupational exposure limits are available, were below the limits set by Italian legislation [56]. The highest levels of Al, As, Ba, Cu, Mo, Pb, Sb and Sn were found in the particles collected near the continuous casting line. The highest levels of Cd and Zn were determined in the particle collected inside P-EAF. The highest levels of Co, Mn and Sr were measured close to LF. The highest levels of Cr and Fe were found in W1 and the highest levels of Ni in W3. Overall, the lowest levels were measured in the background (BG).
Figure 5 shows the concentration of the metal elements analysed in the ultrafine particulate collected by ELPI+. Variable concentrations of the metallic elements were observed in relation to the different sampling sites and to the different granulometric fractions analysed. In particular, Al 38%, Fe 33%, Zn 9%, Ni 5% and Cu 4% were the metallic elements most represented in BG. Fe 38%, Zn 26%, Cu 10%, Mn 8% and Pb 8% were the metallic elements most represented in P-EAF. Fe 44%, Cu 17%, Mn 11% and Zn 10% are the most represented metallic elements in LF. Fe 70%, Cu 14%, Zn 6%, Mn 3%, Pb 3% were the most represented metallic elements in CC. Fe 67%, Cr 20% and Fe 61%, Mo 11%, Cr 10% were the major metallic elements represented in W1 and W3, respectively. Figure 5 shows the concentrations of the metallic elements (in percentage) analysed in the ultrafine particulate collected in BG, P-EAF, LF, CC and in two welding stations (W1 and W3).
Table 5 shows mass concentration (ng/m³) of the metallic elements determined in the UFPs collected by ELPI+ in BG, P-EAF, LF, CC, W1 and W3.
Overall, the metallic elements determined in LF, CC and P-EAF showed a trend comparable with a greater concentration of metallic elements in the fractions of 71 nm and 121 nm. The metallic elements determined in the particles collected outside the plant did not show a clear trend. Some of these elements are more present in particulates of 22 nm, others in the fraction of 71 nm or 121 nm. The metallic elements determined in the UFPs collected in W1 show a trend similar to that observed in the other sampling sites inside the plant, however an important concentration is present in the size range of 41 nm. In W3, the metallic elements show a less clear trend compared to the elements determined in W1, however, most of the metallic elements are present in the size range between 71 and 121 nm. Figure 6 shows the chemical composition in percent (left) and in ng/m³ (right) of the metallic elements in the different particle size ranges, for each area and working station.
Overall, considering the total of the metallic elements determined in all the fractions of UFPs, in the particles collected near the LF, Mn and Co were present at more than 95% in the size range of 121 nm. Ba was present at more than 89% in the size range of 41 nm. Al showed a substantially homogeneous distribution in all size fractions. The others metallic elements were present for more than 75% in the size range between 71 nm and 121 nm.
In the particles collected near the CC, Al and Ba were present at more than 65% in the size range between 71 nm and 121 nm. As, Mo and Pb were present at more than 80% in UFPs of 71 nm and 121 nm. Co and Sr were present at 100% in the size range of 71 nm and 121 nm. The other metallic elements were present at more than 90% in the size range between 71 nm and 121 nm.
In the UFPs collected in the P-EAF, Cr, Ba and Sr were present at 100% in the size range of 121 nm. Ni, As and Sn were found at 100% in the size range between 71 nm and 121 nm. Fe, Sb, Mo, Al, presented a homogeneous distribution in the nanometric fractions, although Al was present at about 64% in the size range of 71 nm. The other metallic elements were present at more than 90% in particles between 71 nm and 121 nm.
Overall, the metallic element concentrations determined in the UFPs collected outside the plant were lower than the concentrations determined in the samples collected inside the plant. The determination of the different nanometric fractions allowed the observation that Cr, Fe, Co, and Ni were present at higher concentrations in the size range of 22 nm (100%, 59%, 57%, 91%, respectively). Al, Mn, Pb were present at about 90% in particles between 71 nm and 121 nm. Sr was present at 90% in the particles of 71 nm, whereas Ba was present at 79% in the size range of 121 nm. As was below the limit of detection. The other metallic elements showed a substantially homogeneous distribution in the UFPs.
In the UFPs collected in W1, Mn, Co, Ni and Cu showed a substantially homogeneous concentration distribution. Zn, As and Mo showed a homogeneous distribution in the particles between 41 nm and 121 nm. Sn, Fe and Pb were present at 90% in the size range of 71 nm and 121 nm. Al was present at 100% in the size range of 41 and 121 nm, Sb was present at 100% in the fractions of 71 and 121 nm, and Ba was present at 100% in particulate matter between 41 nm and 71 nm. Cr was present at 90% in the 121 nm fraction. Sr was below the limit of detection.
In the nanometric particles collected in W3, As and Zn were below the limit of detection. Al, Sr and Pb were present at 100% in 121 nm particles. Sb was present at 100% in the 71 nm fraction, while Sn was present at 70% in the 22 nm fraction. Co, Ni and Mo were present at more than 85% in the fractions of 71 nm and 121 nm. Mn, Cu, Ba, Fe and Cr showed a homogeneous concentration distribution.
Cd was lower than the limit of detection in all UFPs collected in all sampling sites.

4. Discussion

The assessment of occupational fine and ultrafine particles carried out in the steelmaking factory allowed the detection of variations in particle number distribution, number, mass and surface area concentration and chemical composition, in different areas and work stations in the factory.
The particle number distribution measured next to continuous casting (CC) shows a main mode around 71 nm, with additional peak at 10 nm (Figure 2). Measurements performed near the ladle furnace (LF) show a bimodal distribution, with the highest peak centered at 10 nm and a second peak at 41 nm. A previous study has observed a higher presence of small particles in the size range between 72 and 316 nm and an additional peak in the 22 nm size range next to the casting process [47], whereas, next to the ladle furnace, particle number distribution measured showed a peak at 10 nm, accounting for 63% of the total particle number. As suggested by previous studies, the largest particle size of the emission fumes of the casting process could depend on a vapor species available for condensation and coagulation. In contrast, the smallest particles measured next to the ladle furnace (diameter 10 nm) fumes were likely composed of freshly nucleated particles [18]. The distributions of W2 and W3 show a mode about 22 nm, while W1 shows a bimodal distribution with two peaks at 41 nm and 314 nm. A previous study has showed that the particle number size distributions resulting from gas metal arc welding activity was multi-modal and may change with respect to time. The authors have highlighted that welding particles are initially formed from the nucleation of vapors emanating from the superheated metal droplets located within the arc, and from spatter particles ejected from the welding process, and they suggest that coagulation can be responsible for scavenging of smaller particles by larger particles [57].
Background UFP number concentrations have proved to be similar to UFP levels measured by three previous studies of similar areas outside plants [12,47,58], which measured levels ranging from 3.30 to 3.69 × 10⁴ and 1.26 to 1.89 × 10⁴, and of 4.00 × 10⁴, respectively.
Some studies have shown that particle bounce could lead to an increase in particle number at the lower working range of the ELPI with greased foil and not greased foil [59,60]. Although the concentration and number distribution measured are in agreement with previous studies, further studies are needed in order to estimate if and how the particle bounce that could occur in the different stages of the ELPI influences the particle number concentration measured in a steelmaking foundry. The melting, casting, and welding operations and the activity inside the mechanical workshop resulted in the primary sources of UFPs, compared to all the investigated activities, with UFPs’ number concentration higher than for the outdoor background. These findings are in agreement, in terms of concentration and number distribution, with previous studies, which were conducted in similar working environments, such as iron and steel foundries, engine machining and assembly facilities [12,13,14,47,58]. In particular, Evans et al. [12], in an automotive grey iron foundry, and Cheng et al. [58] in the casting area in an iron foundry, have measured particle number concentration between 7.0 × 10⁴ and 2.39 × 10⁵ particles/cm3 and between 2.07 × 10⁴ and 2.82 × 10⁵ particles/cm3, respectively. In a previous study carried out in a steelmaking foundry it was observed that next to the ladle furnace and continuous casting the median UFP number concentrations were 1.64 × 10⁵ particles/cm3 and 2.92 × 10⁵ particles/cm3, respectively [47]. Heitbrink et al. [13] have observed in an engine machining and assembly facility a very fine particle concentration which ranged from 3.0 × 10⁵ to 7.5 × 10⁵ (geometric mean); Peters et al. [14] have measured the maximum particle number concentrations (>1,000,000 particles/cm3) from the operation of direct-fire natural gas burners. In the present study, the highest UFP number concentration was measured next to continuous casting (9.48 × 10⁶ particles/cm³). However, UFP number concentrations above 1,000,000 particles/cm3 were measured in, LF, W1, EAF, AG and BT. Several studies have observed that welding activity can determine a high emission of UFP. Zimmer et al. [57], during a characterization of the aerosols generated by arc welding processes, measured an average number concentration range from 1.6× 10⁷ particles/cm3 near the arc (0 cm horizontal, 4.8 cm vertical) to 3.2 × 10⁶ particles/cm3 at the point corresponding to the farthest point measured (15 cm horizontal, 19.2 cm vertical). A previous study, carried out in automotive plants at a distance of 3 m from welding activities, showed an average UFP concentration of 1 × 10⁵ particles/cm3, with a peak of concentrations, particularly for surface area (3 × 103 mm2/cm3, max. 3 × 104 mm2/cm3) observed in the area characterized by high density of manual resistance welding activities or close to oxyacetylene welding activities [61]. Others authors [62] have reported high concentrations of fine particles in welding and grinding activities at a distance of 1.5 m from the job activities (total particles between 9.9 × 10⁴ and 1.0 × 10⁵ particles/cm3), highlighting that the welding and/or grinding activities can produce a greater number of UFPs compared with brazing operations. In the present study, welding activities showed UFP number concentrations and surface area concentrations in the alveolar tract from 3.15 × 10⁴ (W3) part/cm³ to 1.57 × 10⁵ part/cm³ (W1) (median), and from 9.10 × 101 µm2/cm3 to 4.28 × 102 µm2/cm3 (median), respectively. While the grinding activity resulted in a lower average concentration compared to welding activity, in agreement with previous studies, a concentration of 3.51 × 10⁴ particles/ cm3 during abrasive blasting/grinding operations has been reported [12].
Furthermore, it has been possible to observe that in some work stations in the steelworks, in particular in the control consoles (P-EAF, P-CC), in the cabin of the overhead crane used for the finished products (OC1), and in the quality department workshop (QDW), the median UFP number concentrations were comparable with outdoor background levels.
The UFP number concentrations measured in QDW may depend on the restricted use of particulate sources. The main activities carried out in QDW mainly involve the assessment of the quality of the finished products. The UFP number concentration measured in control consoles (P-EAF, P-CC) and in the cabin of the overhead crane used for handling finished products (OC1), may be influenced by the efficiency of the ventilation system installed inside such work environments. The UFP number concentrations measured inside the pulpit of the ladle furnace were found to be higher than the outdoor background, however, the median concentration measured was low compared to the concentration detected near the ladle furnace (LF) and substantially overlapping the levels measured during the lunch break in the company canteen (far from industrial emission sources).
The dose estimated, in terms of deposited alveolar or tracheobronchial surface area in particles per mm² received by workers in the different working stations (weighted for a 6-h exposure), ranged from a minimum of 1.3 × 102 mm2 for the alveolar tract and a minimum of 2.6 × 101 mm2 for the tracheobronchial tract to a maximum of 8.7 × 103 mm2 for the alveolar tract and a maximum of 1.3 × 10³ for the tracheobronchial tract. The highest deposition levels for the alveolar tract and the tracheobronchial tract were recorded in the mechanical workshop and in the first welding station (Figure 4). Several studies have suggested that a large surface area or number may play an important role to causing adverse health effects [24,26,32,37,63,64,65]. The respiratory dose could be a key factor for assessing potential health effects of inhaled particles. Lung dose assessment can help to verify the effective dose relating to possible subclinical and clinical adverse health effects [34]. In this study, the dose of UFPs in terms of surface area deposition in the alveolar tract is greater by one order of magnitude compared to the dose values measured in Italian children living in urban or rural areas [66] and below the total daily deposited dose for typical Italian smokers [67].
Indoor levels of mass concentration of the inhalable and respirable fraction and airborne concentrations of metallic elements in the inhalable fraction were higher than those measured outside the plant, even if they were below the limits established by the Italian legislation [56]. Dust concentration and metallic element concentration were in line with other studies carried out in the iron and steel industry in Italy [68], but they differ from the findings of Nurul et al. [69], who reported for a steelmaking plant, a mean concentration and a range of total particulate matter of 2.76 mg/m3, and 0.13–11.18 mg/m3 respectively, with Co, Cr (VI) and Ni concentration at 2.36 mg/m3, 8.36 mg/m3 and 1.10 mg/m3, respectively. In our study, the highest dust concentration, in terms of inhalable and respirable fractions, was measured in W1 (IF 1.63 mg/m3, RF 0.99 mg/m3), while in the steelmaking section (next to LF and CC), dust concentration did not exceed 0.77 mg/m3 (Table 3). The highest metal concentration measured in the inhalable fraction was found in W1 (Fe 129 µg/m³) and in P-EAF the highest metal concentration measured was Zn (7.89 µg/m³), which was the highest measured concentration of Zn among all samples. The highest metal concentration measured in the inhalable fraction collected in LF, CC and W3 was Mn with a concentration of 44.64 µg/m³ 16.21 µg/m³ and 8.05 µg/m³, respectively. In the inhalable fraction collected outside the plant (BG) the highest metal concentration was Zn (0.68 µg/m³) (Table 4).
Overall, the chemical characterization of UFPs shows that the highest total metallic element (of the all metallic elements determined) mass concentration was found in the UFPs collected in CC, followed by UFPs collected in W1 and LF, while the lowest was measured in the UFPs collected in BG and P-EAF (Table 5 and Figure 5). However, the distribution of metallic elements in the different fractions of UFP collected in P-EAF shows a pattern more similar to LF and CC compared to the trend observed in the UFPs collected outside the plant. This could show a greater contribution of the melting and casting operations in the issuance of UFPs within the control consoles compared to the UPFs measured outside the plant, which means the particles may have different sources. In the UFPs collected during welding activity, an important presence of chrome was detected compared to the UFPs collected in the other sampling sites. Moreover, except for the UFPs collected in BG, which showed a greater presence of Al than the other elements, in UFPs collected in LF, CC, P-EAF, W1 and W3, iron (Fe) was found to be relatively higher compared to metals across all size ranges (Figure 6), which was consistent with results from previous studies [47,62,70,71].
Although further studies are needed in order to investigate more and other workstations and also to include chemical characterization (not only of metallic elements) in different fractions of particulates through personal sampling, this study provided useful information on the possible exposure to particulate-dispersed and metallic elements of workers within the steel factory. Indeed, to the best of our knowledge, this is the first study to measure airborne particle exposure in a steel factory by simultaneously assessing size distribution, number, mass, surface area concentration, dose deposited in the respiratory system, and the composition of the airborne metals, and also with reference to different nanometric fractions.
The exposure assessment carried out allowed observation of a wide spatial distribution of the airborne particulate levels and the contained metallic elements, thus allowing identification of the main sources of exposure in term of mass, number and lung-deposited surface area of particles (in terms of deposited alveolar or tracheobronchial surface area, mm2). Furthermore, it was possible to detect the concentration of low doses of metallic elements in the different fractions of UFPs. Chemical composition in terms of metallic elements determined in the UFPs varied depending on the sampling site, the emission source and the size range. In particular, Fe, Cu, Mn, Zn, Pb and Al were the most represented elements in that context and this result is in agreement with other studies conducted in foundries [47,71,72].
An in-depth assessment that takes into account the different chemical–physical characteristics of the airborne particulate may provide useful information for increasing the knowledge about occupational exposure to fine and ultrafine particles. In addition, although further research is needed to confirm the observations, the results achieved could also prove useful for designing studies aimed to investigate early biological effects associated with exposure to particulate matter and to several components within metal industries. Future studies based on job-exposure matrices could clarify the role of the different components (both size and non-size related) which could determine adverse health effects on respiratory and cardiovascular systems, in particular.

5. Conclusions

This study measured and assessed the occupational exposure concentrations of fine particles in a steel factory. Stationary and personal samples were carried out in different workstations and during different work phases in standard working conditions. UFP number, surface area concentration and metallic element composition were measured. Results confirmed the findings of previous studies conducted in similar industrial contexts, and improved the knowledge about ultrafine particle exposure and the fractions of metallic elements in nanometric particles.
These results may be useful for identifying preventive measures aimed at limiting workers’ exposure and could lead to a better knowledge of the characterization of occupational exposure to UFPs. Furthermore, our results provided relevant information for the development of work-based exposure matrices, for epidemiological studies design, and for the planning of studies on early biological effects, in order to improve knowledge on health effects related to exposure to UFPs in the workplaces.

Author Contributions

Conceptualization, G.M. (Gabriele Marcias), J.F., A.M.S., M.U., S.C., S.P., D.F., I.P., F.M., L.I.L., E.M., G.D.P. and M.C.; data curation, G.M. (Gabriele Marcias), J.F., A.M.S., M.U., S.C., S.P., D.F., I.P., F.M., L.I.L., E.M.; formal analysis, G.M. (Gabriele Marcias), J.F., A.M.S., M.U., S.C., S.P., D.F., I.P., F.M., L.I.L., E.M., L.S.; investigation, G.M. (Gabriele Marcias), S.C., M.U., A.M.S., D.F., E.M. and L.I.L.; project administration, G.D.P., E.D., M.C.; validation, J.F., S.C., G.M. (Giorgio Massacci), L.S., E.D., G.B., G.D.P., M.C.; visualization, G.M. (Gabriele Marcias), J.F., A.M.S., M.U., S.C., S.P., I.P.; writing—original draft, G.M. (Gabriele Marcias) and J.F.; writing—review and editing, G.M. (Gabriele Marcias), J.F., S.C., S.P., G.M. (Giorgio Massacci), L.S., E.D., G.B., G.D.P., M.C.

Funding

This research received no external funding.

Acknowledgments

The authors are grateful to Denise Festa and Roberta Ghitti of the University of Brescia, for the support in carrying out the environmental sampling.

Conflicts of Interest

The authors declare no conflict of interest.

References

  1. IARC Working Group on the Evaluation of Carcinogenic Risk to Humans. Chemical Agents and Related Occupations Volume 100 F—A Review of Human Carcinogens; International Agency for Research on Cancer (IARC) Monographs on the Evaluation of Carcinogenic Risks to Humans, No. 100F; OCCU: Lyon, France, 2012. [Google Scholar]
  2. Hobbesland, A.; Kjuus, H.; Thelle, D.S. Study of cancer incidence among 8530 male workers in eight Norwegian plants producing ferrosilicon and silicon metal. Occup. Environ. Med. 1999, 56, 625–631. [Google Scholar] [CrossRef] [PubMed]
  3. Kjuus, H.; Andersen, A.; Langård, S.; Knudsen, K.E. Cancer incidence among workers in the Norwegian ferroalloy industry. Br. J. Ind. Med. 1986, 43, 227–236. [Google Scholar] [CrossRef] [PubMed]
  4. Tossavainen, A. Estimated risk of lung cancer attributable to occupational exposures in iron and steel foundries. IARC Sci. Publ. 1990, 104, 363–367. [Google Scholar]
  5. Koskela, R.-S.; Mutanen, P.; Sorsa, J.-A.; Klockars, M. Respiratory disease and cardiovascular morbidity. Occup. Environ. Med. 2005, 62, 650–655. [Google Scholar] [CrossRef] [PubMed]
  6. Hałatek, T.; Trzcinka-Ochocka, M.; Matczak, W.; Gruchała, J. Serum Clara cell protein as an indicator of pulmonary impairment in occupational exposure at aluminum foundry. Int. J. Occup. Med. Environ. Health 2006, 19, 211–223. [Google Scholar] [CrossRef] [PubMed]
  7. Liu, X.; Lee, S.; Pisaniello, D. Measurement of fine and ultrafine dust exposure in an iron foundry in South Australia. J. Heal. 2010, 26, 5–9. [Google Scholar]
  8. Leonard, S.S.; Chen, B.T.; Stone, S.G.; Schwegler-Berry, D.; Kenyon, A.J.; Frazer, D.; Antonini, J.M. Comparison of stainless and mild steel welding fumes in generation of reactive oxygen species. Part. Fibre Toxicol. 2010, 7, 32. [Google Scholar] [CrossRef]
  9. Antonini, J.M.; Leonard, S.S.; Roberts, J.R.; Solano-Lopez, C.; Young, S.-H.; Shi, X.; Taylor, M.D. Effect of stainless steel manual metal arc welding fume on free radical production, DNA damage, and apoptosis induction. Mol. Cell. Biochem. 2005, 279, 17–23. [Google Scholar] [CrossRef]
  10. Vincent, J.H.; Clement, C.F. Ultrafine particles in workplace atmospheres. Philos. Trans. R. Soc. A Math. Phys. Eng. Sci. 2000, 358, 2673–2682. [Google Scholar] [CrossRef]
  11. Wake, D.; Mark, D.; Northage, C. Ultrafine Aerosols in the Workplace. Ann. Occup. Hyg. 2002, 46, 235–238. [Google Scholar] [CrossRef]
  12. Evans, D.E.; Heitbrink, W.A.; Slavin, T.J.; Peters, T.M. Ultrafine and Respirable Particles in an Automotive Grey Iron Foundry. Ann. Occup. Hyg. 2007, 52, 9–21. [Google Scholar] [CrossRef] [PubMed]
  13. Heitbrink, W.A.; Evans, D.E.; Peters, T.M.; Slavin, T.J. Characterization and Mapping of Very Fine Particles in an Engine Machining and Assembly Facility. J. Occup. Environ. Hyg. 2007, 4, 341–351. [Google Scholar] [CrossRef] [PubMed]
  14. Peters, T.M.; Heitbrink, W.A.; Evans, D.E.; Slavin, T.J.; Maynard, A.D. The Mapping of Fine and Ultrafine Particle Concentrations in an Engine Machining and Assembly Facility. Ann. Occup. Hyg. 2005, 50, 249–257. [Google Scholar] [CrossRef] [PubMed]
  15. Kero, I.; Naess, M.K.; Tranell, G. Particle size distributions of particulate emissions from the ferroalloy industry evaluated by electrical low pressure impactor (ELPI). J. Occup. Environ. Hyg. 2015, 12, 37–44. [Google Scholar] [CrossRef] [PubMed]
  16. Kero, I.T.; Jørgensen, R.B. Comparison of Three Real-Time Measurement Methods for Airborne Ultrafine Particles in the Silicon Alloy Industry. Int. J. Environ. Res. Public Health 2016, 13, 871. [Google Scholar] [CrossRef] [PubMed]
  17. Debia, M.; Weichenthal, S.; Tardif, R.; Dufresne, A. Ultrafine Particle (UFP) Exposures in an Aluminium Smelter: Soderberg vs. Prebake Potrooms. Environ. Pollut. 2011, 1, 2. [Google Scholar] [CrossRef]
  18. Chang, M.-C.O.; Chow, J.C.; Watson, J.G.; Glowacki, C.; Sheya, S.A.; Prabhu, A. Characterization of Fine Particulate Emissions from Casting Processes. Aerosol Sci. Technol. 2005, 39, 947–959. [Google Scholar] [CrossRef]
  19. Oberdörster, G. Pulmonary effects of inhaled ultrafine particles. Int. Arch. Occup. Environ. Health 2001, 74, 1–8. [Google Scholar] [CrossRef] [PubMed]
  20. Oberdörster, G.; Oberdörster, E.; Oberdörster, J. Nanotoxicology: An emerging discipline evolving from studies of ultrafine particles. Environ. Health Perspect. 2005, 113, 823–839. [Google Scholar] [CrossRef] [PubMed]
  21. Donaldson, K.; Brown, D.; Clouter, A.; Duffin, R.; MacNee, W.; Renwick, L.; Tran, L.; Stone, V. The Pulmonary Toxicology of Ultrafine Particles. J. Aerosol Med. 2002, 15, 213–220. [Google Scholar] [CrossRef] [PubMed]
  22. Manke, A.; Wang, L.; Rojanasakul, Y. Mechanisms of nanoparticle-induced oxidative stress and toxicity. Biomed Res. Int. 2013, 2013, 942916. [Google Scholar] [CrossRef] [PubMed]
  23. Cho, W.-S.; Duffin, R.; Poland, C.A.; Howie, S.E.M.; MacNee, W.; Bradley, M.; Megson, I.L.; Donaldson, K. Metal Oxide Nanoparticles Induce Unique Inflammatory Footprints in the Lung: Important Implications for Nanoparticle Testing. Environ. Health Perspect. 2010, 118, 1699–1706. [Google Scholar] [CrossRef] [PubMed]
  24. Hennig, F.; Quass, U.; Hellack, B.; Küpper, M.; Kuhlbusch, T.A.J.; Stafoggia, M.; Hoffmann, B. Ultrafine and Fine Particle Number and Surface Area Concentrations and Daily Cause-Specific Mortality in the Ruhr Area, Germany, 2009–2014. Environ. Health Perspect. 2018, 126. [Google Scholar] [CrossRef] [PubMed]
  25. Lanzinger, S.; Schneider, A.; Breitner, S.; Stafoggia, M.; Erzen, I.; Dostal, M.; Pastorkova, A.; Bastian, S.; Cyrys, J.; Zscheppang, A.; et al. Associations between ultrafine and fine particles and mortality in five central European cities—Results from the UFIREG study. Environ. Int. 2016, 88, 44–52. [Google Scholar] [CrossRef] [PubMed]
  26. Clark, J.; Gregory, C.C.; Matthews, I.P.; Hoogendoorn, B. The biological effects upon the cardiovascular system consequent to exposure to particulates of less than 500 nm in size. Biomarkers 2016, 21, 1–47. [Google Scholar] [CrossRef] [PubMed]
  27. HEI Review Panel on Ultrafine Particles. Understanding the Health Effects of Ambient Ultrafine Particles; HEI Perspectives 3; Health Effects Institute: Boston, MA, USA, 2013. [Google Scholar]
  28. Stone, V.; Miller, M.R.; Clift, M.J.D.; Elder, A.; Mills, N.L.; Møller, P.; Schins, R.P.F.; Vogel, U.; Kreyling, W.G.; Alstrup Jensen, K.; et al. Nanomaterials Versus Ambient Ultrafine Particles: An Opportunity to Exchange Toxicology Knowledge. Environ. Health Perspect. 2017, 125, 106002. [Google Scholar] [CrossRef] [PubMed]
  29. Magalhaes, S.; Baumgartner, J.; Weichenthal, S. Impacts of exposure to black carbon, elemental carbon, and ultrafine particles from indoor and outdoor sources on blood pressure in adults: A review of epidemiological evidence. Environ. Res. 2018, 161, 345–353. [Google Scholar] [CrossRef] [PubMed]
  30. Downward, G.S.; van Nunen, E.J.H.M.; Kerckhoffs, J.; Vineis, P.; Brunekreef, B.; Boer, J.M.A.; Messier, K.P.; Roy, A.; Verschuren, W.M.M.; van der Schouw, Y.T.; et al. Long-Term Exposure to Ultrafine Particles and Incidence of Cardiovascular and Cerebrovascular Disease in a Prospective Study of a Dutch Cohort. Environ. Health Perspect. 2018, 126, 127007. [Google Scholar] [CrossRef] [PubMed]
  31. Regional Office for Europe, World Health Organization. Review of Evidence on Health Aspects of Air Pollution—REVIHAAP Project Technical Report; Regional Office for Europe: Copenhagen, Denmark, 2013. [Google Scholar]
  32. Maynard, A.D.; Maynard, R.L. A derived association between ambient aerosol surface area and excess mortality using historic time series data. Atmos. Environ. 2002, 36, 5561–5567. [Google Scholar] [CrossRef]
  33. Buonanno, G.; Marks, G.B.; Morawska, L. Health effects of daily airborne particle dose in children: Direct association between personal dose and respiratory health effects. Environ. Pollut. 2013, 180, 246–250. [Google Scholar] [CrossRef]
  34. Kim, C.S.; Jaques, P.A. Analysis of Total Respiratory Deposition of Inhaled Ultrafine Particles in Adult Subjects at Various Breathing Patterns. Aerosol Sci. Technol. 2004, 38, 525–540. [Google Scholar] [CrossRef]
  35. Franck, U.; Odeh, S.; Wiedensohler, A.; Wehner, B.; Herbarth, O. The effect of particle size on cardiovascular disorders—The smaller the worse. Sci. Total Environ. 2011, 409, 4217–4221. [Google Scholar] [CrossRef] [PubMed]
  36. Peters, A.; Wichmann, H.E.; Tuch, T.; Heinrich, J.; Heyder, J. Respiratory effects are associated with the number of ultrafine particles. Am. J. Respir. Crit. Care Med. 1997, 155, 1376–1383. [Google Scholar] [CrossRef] [PubMed]
  37. Stafoggia, M.; Schneider, A.; Cyrys, J.; Samoli, E.; Andersen, Z.J.; Bedada, G.B.; Bellander, T.; Cattani, G.; Eleftheriadis, K.; Faustini, A.; et al. Association Between Short-term Exposure to Ultrafine Particles and Mortality in Eight European Urban Areas. Epidemiology 2017, 28, 172–180. [Google Scholar] [CrossRef] [PubMed]
  38. Dockery, D.W.; Pope, C.A.; Xu, X.; Spengler, J.D.; Ware, J.H.; Fay, M.E.; Ferris, B.G.; Speizer, F.E. An Association between Air Pollution and Mortality in Six U.S. Cities. N. Engl. J. Med. 1993, 329, 1753–1759. [Google Scholar] [CrossRef] [PubMed]
  39. Chen, L.C.; Lippmann, M. Effects of Metals within Ambient Air Particulate Matter (PM) on Human Health. Inhal. Toxicol. 2009, 21, 1–31. [Google Scholar] [CrossRef] [PubMed]
  40. Gray, D.L.; Wallace, L.A.; Brinkman, M.C.; Buehler, S.S.; La Londe, C. Respiratory and Cardiovascular Effects of Metals in Ambient Particulate Matter: A Critical Review. Rev. Environ. Contam. Toxicol. 2015, 234, 135–203. [Google Scholar] [PubMed]
  41. Cakmak, S.; Dales, R.; Kauri, L.M.; Mahmud, M.; Van Ryswyk, K.; Vanos, J.; Liu, L.; Kumarathasan, P.; Thomson, E.; Vincent, R.; et al. Metal composition of fine particulate air pollution and acute changes in cardiorespiratory physiology. Environ. Pollut. 2014, 189, 208–214. [Google Scholar] [CrossRef] [PubMed]
  42. Cassee, F.R.; Héroux, M.E.; Gerlofs-Nijland, M.E.; Kelly, F.J. Particulate matter beyond mass: Recent health evidence on the role of fractions, chemical constituents and sources of emission. Inhal. Toxicol. 2013, 25, 802–812. [Google Scholar] [CrossRef] [PubMed]
  43. Atkinson, R.W.; Mills, I.C.; Walton, H.A.; Anderson, H.R. Fine particle components and health—A systematic review and meta-analysis of epidemiological time series studies of daily mortality and hospital admissions. J. Expo. Sci. Environ. Epidemiol. 2015, 25, 208–214. [Google Scholar] [CrossRef] [PubMed]
  44. Wyzga, R.E.; Rohr, A.C. Long-term particulate matter exposure: Attributing health effects to individual PM components. J. Air Waste Manag. Assoc. 2015, 65, 523–543. [Google Scholar] [CrossRef] [PubMed]
  45. Kumar, P.; Morawska, L.; Birmili, W.; Paasonen, P.; Hu, M.; Kulmala, M.; Harrison, R.M.; Norford, L.; Britter, R. Ultrafine particles in cities. Environ. Int. 2014, 66, 1–10. [Google Scholar] [CrossRef]
  46. Viitanen, A.-K.; Uuksulainen, S.; Koivisto, A.J.; Hämeri, K.; Kauppinen, T. Workplace Measurements of Ultrafine Particles—A Literature Review. Ann. Work Expo. Heal. 2017, 61, 749–758. [Google Scholar] [CrossRef] [PubMed]
  47. Marcias, G.; Fostinelli, J.; Catalani, S.; Uras, M.; Sanna, A.; Avataneo, G.; De Palma, G.; Fabbri, D.; Paganelli, M.; Lecca, L.; et al. Composition of Metallic Elements and Size Distribution of Fine and Ultrafine Particles in a Steelmaking Factory. Int. J. Environ. Res. Public Health 2018, 15, 1192. [Google Scholar] [CrossRef] [PubMed]
  48. Dekati Ltd. ELPI VI Software Manual, version 4.1 0; Dekati Ltd.: Kangasala, Finland, 2008. [Google Scholar]
  49. Cernuschi, S.; Giugliano, M.; Ozgen, S.; Consonni, S. Number concentration and chemical composition of ultrafine and nanoparticles from WTE (waste to energy) plants. Sci. Total Environ. 2012, 420, 319–326. [Google Scholar] [CrossRef] [PubMed]
  50. Marra, J.; Voetz, M.; Kiesling, H.-J. Monitor for detecting and assessing exposure to airborne nanoparticles. J. Nanopart. Res. 2010, 12, 21–37. [Google Scholar] [CrossRef]
  51. ICRP. Human Respiratory Tract Model for Radiological Protection; ICRP Publication 66. Ann; ICRP: Ottawa, ON, Canada, 1994; Volume 24. [Google Scholar]
  52. UNI EN 481:1994—Atmosfera Nell’ambiente di Lavoro. Definizione Delle Frazioni Granulometriche per la Misurazione Delle Particelle Aerodisperse. Available online: http://store.uni.com/catalogo/index.php/uni-en-481-1994.html (accessed on 30 December 2018).
  53. Ambienti di Lavoro—Determinazione Della Frazione Inalabile Delle Particelle Aerodisperse—Metodo Gravimetrico—UNICHIM—Associazione Per l’Unificazione Nel Settore Dell’industria Chimica, Federato All’uni (Ente Nazionale di Unificazione); Italy. Available online: https://www.unichim.it/metodi/ (accessed on 30 December 2018).
  54. Ambienti di Lavoro—Determinazione Della Frazione Respirabile Delle Particelle Aerodisperse—Metodo Gravimetrico—UNICHIM—Associazione Per l’Unificazione Nel Settore Dell’industria Chimica—Federato All’uni (Ente Nazionale di Unificazione); Italy. Available online: https://www.unichim.it/metodi/ (accessed on 30 December 2018).
  55. Apostoli, P.; De Palma, G.; Catalani, S.; Bortolotti, F.; Tagliaro, F. Multielemental analysis of tissues from Cangrande della Scala, Prince of Verona, in the 14th century. J. Anal. Toxicol. 2009, 33, 322–327. [Google Scholar] [CrossRef]
  56. D.lgs. 9 Aprile 2008, n. 81 Testo Coordinato con il D.Lgs. 3 Agosto 2009, n. 106; Italy, 2008. Available online: http://www.gazzettaufficiale.it/eli/id/2008/04/30/008G0104/sg (accessed on 30 December 2018).
  57. Zimmer, A.T.; Biswas, P. Characterization of the aerosols resulting from arc welding processes. J. Aerosol Sci. 2001, 32, 993–1008. [Google Scholar] [CrossRef]
  58. Cheng, Y.-H.; Chao, Y.-C.; Wu, C.-H.; Tsai, C.-J.; Uang, S.-N.; Shih, T.-S. Measurements of ultrafine particle concentrations and size distribution in an iron foundry. J. Hazard. Mater. 2008, 158, 124–130. [Google Scholar] [CrossRef]
  59. Virtanen, A.; Joutsensaari, J.; Koop, T.; Kannosto, J.; Yli-Pirilä, P.; Leskinen, J.; Mäkelä, J.M.; Holopainen, J.K.; Pöschl, U.; Kulmala, M.; et al. An amorphous solid state of biogenic secondary organic aerosol particles. Nature 2010, 467, 824–827. [Google Scholar] [CrossRef]
  60. Leskinen, J.; Joutsensaari, J.; Lyyränen, J.; Koivisto, J.; Ruusunen, J.; Järvelä, M.; Tuomi, T.; Hämeri, K.; Auvinen, A.; Jokiniemi, J. Comparison of nanoparticle measurement instruments for occupational health applications. J. Nanopart. Res. 2012, 14. [Google Scholar] [CrossRef]
  61. Buonanno, G.; Morawska, L.; Stabile, L. Exposure to welding particles in automotive plants. J. Aerosol Sci. 2011, 42, 295–304. [Google Scholar] [CrossRef]
  62. Iavicoli, I.; Leso, V.; Fontana, L.; Cottica, D.; Bergamaschi, A. Characterization of inhalable, thoracic, and respirable fractions and ultrafine particle exposure during grinding, brazing, and welding activities in a mechanical engineering factory. J. Occup. Environ. Med. 2013, 55, 430–445. [Google Scholar] [CrossRef] [PubMed]
  63. Weichenthal, S. Selected physiological effects of ultrafine particles in acute cardiovascular morbidity. Environ. Res. 2012, 115, 26–36. [Google Scholar] [CrossRef] [PubMed]
  64. Oberdörster, G.; Ferin, J.; Gelein, R.; Soderholm, S.C.; Finkelstein, J. Role of the alveolar macrophage in lung injury: Studies with ultrafine particles. Environ. Health Perspect. 1992, 97, 193–199. [Google Scholar] [CrossRef] [PubMed]
  65. Donaldson, K.; Li, X.; MacNee, W. Ultrafine (nanometre) particle mediated lung injury. J. Aerosol Sci. 1998, 29, 553–560. [Google Scholar] [CrossRef]
  66. Buonanno, G.; Marini, S.; Morawska, L.; Fuoco, F.C. Individual dose and exposure of Italian children to ultrafine particles. Sci. Total Environ. 2012, 438, 271–277. [Google Scholar] [CrossRef] [PubMed]
  67. Fuoco, F.; Stabile, L.; Buonanno, G.; Scungio, M.; Manigrasso, M.; Frattolillo, A.; Fuoco, F.C.; Stabile, L.; Buonanno, G.; Scungio, M.; et al. Tracheobronchial and Alveolar Particle Surface Area Doses in Smokers. Atmosphere 2017, 8, 19. [Google Scholar] [CrossRef]
  68. Soleo, L.; Lovreglio, P.; Panuzzo, L.; Nicolà D’errico, M.; Basso, A.; Gilberti, M.E.; Drago, I.; Tomasi, C.; Apostoli, P. Valutazione del rischio per la salute da esposizione a elementi metallici nei lavoratori del siderurgico e nella popolazione generale di Taranto (Italia). G. Ital. Med. Lav. Erg. 2012, 34, 381–391. [Google Scholar]
  69. Nurul, A.H.; Shamsul, B.M.T.; Noor Hassim, I. Assessment of dust exposure in a steel plant in the eastern coast of peninsular Malaysia. Work 2016, 55, 655–662. [Google Scholar] [CrossRef]
  70. Chang, C.; Demokritou, P.; Shafer, M.; Christiani, D. Physicochemical and toxicological characteristics of welding fume derived particles generated from real time welding processes. Environ. Sci. Process. Impacts 2013, 15, 214–224. [Google Scholar] [CrossRef] [PubMed]
  71. Mohiuddin, K.; Strezov, V.; Nelson, P.F.; Stelcer, E.; Evans, T. Mass and elemental distributions of atmospheric particles nearby blast furnace and electric arc furnace operated industrial areas in Australia. Sci. Total Environ. 2014, 487, 323–334. [Google Scholar] [CrossRef] [PubMed]
  72. Marris, H.; Deboudt, K.; Augustin, P.; Flament, P.; Blond, F.; Fiani, E.; Fourmentin, M.; Delbarre, H. Fast changes in chemical composition and size distribution of fine particles during the near-field transport of industrial plumes. Sci. Total Environ. 2012, 427–428, 126–138. [Google Scholar] [CrossRef] [PubMed]
Figure 1. Sampling sites inside and outside the factory.
Metals 09 00163 g001
Figure 2. Number distribution measured by ELPI+ in sampling sites: BG, P-EAF, LF, CC, W1, W2 and W3.
Metals 09 00163 g002
Figure 3. Median, interquartile range, minimum and maximum UFP number concentration measured through stationary, quasi-personal and personal samplings. Red boxes show the highest UFPs median number concentrations measured.
Metals 09 00163 g003
Figure 4. Alveolar deposited surface area dose (mm2) and the tracheobronchial deposited surface area dose (mm2). Both values were weighted for a six-hours exposure.
Metals 09 00163 g004
Figure 5. Concentration of metallic elements (percentage values) analysed in the ultrafine particulate collected by ELPI+ at the several sampling sites.
Metals 09 00163 g005
Figure 6. Distribution of the metallic elements (percentage value (left) and ng/m³ (right) for each fraction) in the different UFP size ranges collected by ELPI+, for each area and working station. The percentages shown in the figure represent the fraction of each metallic element on the total of the metallic elements determined in each size range for each sampling site.
Metals 09 00163 g006
Table 1. Summary of sampling methods carried out in steelmaking foundry.
Sampling SiteEquipmentSampling MethodsSampling TimeSampling SiteEquipmentSampling MethodsSampling Time
BGIF and RFStationary6 h 26 minW2IF and RFNDND
ELPI+Stationary6 h 4 minELPI+Quasi-personal1 h 18 min
NTStationary6 h 26 minNTQuasi-personal1 h 18 min
P-EAFIF and RFStationary5 h 34 minW3IF and RFQuasi-personal1 h 33 min
ELPI+Stationary5 h 34 minELPI+Quasi-personal1 h 33 min
NTStationary1 h 9 minNTQuasi-personal1 h 33 min
LFIF and RFStationary4 h 14 minEAFNTStationary1 h 27 min
ELPI+Stationary4 h 14 minP-LFNTPersonal2 min
NTStationary4 h 57 minP-CCNTPersonal51 min
CCIF and RFStationary3 h 51 minAGNTPersonal1 h 41 min
ELPI+Stationary3 h 51 minBTNTPersonal41 min
NTStationary2 h 21 minOC1NTPersonal25 min
W1IF and RFQuasi-personal1 h 24 minOC2NTPersonal35 min
ELPI+Quasi-personal1 h 24 minQDWNTPersonal25 min
NTQuasi-personal1 h 24 minSCNTPersonal1 h
Abbreviations: IF = inhalable fraction; RF = respirable fraction; ELPI+ = electric low pressure impactor; NT = Philips Aerasense Nanotracer; ND = not detected. Sampling sites are described below in the text.
Table 2. Particle size range (average, nm), particle surface area concentration deposited in alveolar and tracheobronchial tract (µm2/cm3) measured by NT in each sampling site.
Sampling SiteParticle Average Size Range (nm)Particle Surface Area Concentration (µm2/cm3)
Alveolar TractTracheobronchial Tract
MeanMedianMeanMedian
BG41.33.93 × 1013.91 × 1017.95 × 1007.90 × 100
P-EAF56.51.45 × 1011.30 × 1012.93 × 1002.63 × 100
LF29.873.79 × 1023.01 × 1027.65 × 1016.09 × 101
CC32.684.66 × 1023.08 × 1029.42 × 1016.23 × 101
W152.397.16 × 1024.28 × 1021.45 × 1028.64 × 101
W238.171.73 × 1021.06 × 1023.50 × 1012.14 × 101
W359.191.05 × 1029.10 × 1012.12 × 1011.84 × 101
EAF46.714.22 × 1023.12 × 1028.53 × 1016.30 × 101
P-LF42.832.24 × 1022.08 × 1024.52 × 1014.20 × 101
P-CC47.583.52 × 1012.91 × 1017.11 × 1005.88 × 100
AG34.71.49 × 1021.19 × 1023.01× 1012.41 × 101
BT61.49.69 × 1024.52 × 1029.33 × 1019.13 × 101
OC133.045.20 × 1014.79 × 1011.05 × 1019.68 × 100
OC2432.13 × 1022.01 × 1024.31 × 1014.07 × 101
QDW61.41.62 × 1027.53 × 1013.28 × 1011.52 × 101
SC40.691.68 × 1021.73 × 1023.40 × 1013.49 × 101
Table 3. Mass concentration (mg/m³) of the inhalable and respirable fractions measured in BG, P-EAF, LF, CC, W1 and W3 sampling locations.
Sampling SiteBGP-EAFLFCCW1W3
Inhalable Fraction<LOD0.110.70.771.630.5
Respirable Fraction<LOD0.110.460.080.920.59
Table 4. Concentration in μg/m³ of the metallic elements determined in the inhalable fraction.
Metallic ElementSampling Site
BGP-EAFLFCCW1W3
Al0.430.463.586.42.594.82
As<LOD<LOD0.0780.1360.087<LOD
Ba0.050.0340.240.2480.07<LOD
Be<LOD<LOD<LOD<LOD<LOD<LOD
Cd0.00060.0070.0010.0020.0010.001
Co0.0010.0020.0420.0240.031<LOD
Cr0.070.0090.210.07838.23.63
Cu0.070.131.12.70.970.21
Fe0.011.1615.714.11129.12.64
Hg<LOD<LOD<LOD<LOD<LOD<LOD
Mn0.180.6344.6416.213.948.05
Mo0.0090.0130.080.1570.02<LOD
Ni0.050.0530.40.3461.56.47
Pb0.091.820.641.830.420.07
Sb0.0030.0040.020.0480.01<LOD
Sn0.010.0660.220.2880.220.03
Sr0.010.0050.080.0660.070.02
Zn0.687.891.746.191.040.73
Table 5. Concentration (ng/m³) of the metallic elements determined in the UFPs collected by ELPI+ for each size range in BG, P-EAF, LF, CC, W1 and W3.
Sampling SiteDi nmMetallic Elements
AlAsBaCdCoCrCuFeMnMoNiPbSbSnSrZn
BG22<LOD<LOD<LOD<LOD0.111.180.9340.220.330.1410.030.380.050.49<LOD3.71
P-EAF2.39<LOD<LOD<LOD<LOD<LOD0.423.710.240.24<LOD0.21<LOD<LOD<LOD<LOD
LF2.09<LOD<LOD<LOD<LOD<LOD8.03<LOD<LOD1.02<LOD3.540.162.72<LOD7.95
CC<LOD1.730.69<LOD<LOD<LOD17.126.491.132.640.310.390.30.95<LOD7.57
W1<LOD<LOD<LOD<LOD0.477.7110.0810.440.47<LOD5.340.47<LOD1.3<LOD<LOD
W3<LOD<LOD2.64<LOD0.8231.322.1436.270.491.98<LOD<LOD<LOD23.9<LOD<LOD
BG416.59<LOD0.69<LOD<LOD<LOD1.37<LOD0.190.080.160.30.050.55<LOD2.61
P-EAF0.54<LOD<LOD<LOD<LOD<LOD2.6321.550.750.48<LOD1.50.09<LOD<LOD1.92
LF5.241.691.69<LOD<LOD<LOD25.793.742.093.27<LOD11.970.5110.470.1214.33
CC4.337.231.21<LOD<LOD1.17116.87372.2410.397.798.4432.461.7314.72<LOD39.39
W14.863.561.66<LOD0.367.9418.97175.52.852.256.523.79<LOD2.25<LOD6.88
W3<LOD<LOD2.97<LOD1.81<LOD5.9365.944.957.75<LOD<LOD<LOD<LOD<LOD<LOD
BG71<LOD<LOD0.22<LOD0.08<LOD2.144.951.130.410.711.370.083.210.492.47
P-EAF20.510.51<LOD<LOD<LOD<LOD12.328.746.50.571.418.380.212.72<LOD22.9
LF4.85.98<LOD<LOD<LOD<LOD72.64125.391.977.768.5826.181.1420.670.1635.83
CC3.4628.571.95<LOD1.347.36716.353185.71107.3430.0870.55116.8712.5576.830.13227.24
W1<LOD9.491.66<LOD0.9528.8220.75583.422.852.3716.0120.160.9520.16<LOD13.04
W3<LOD<LOD3.3<LOD8.571514.01105.514.7832.150.99<LOD0.494.45<LOD<LOD
BG12171.84<LOD3.43<LOD<LOD<LOD3.7121.983.020.3<LOD3.30.161.150.0510.08
P-EAF8.231.530.36<LOD<LOD2.3932.48131.7231.581.52.3931.430.542.990.15101.93
LF5.717.090.2<LOD0.28<LOD89.96376.18118.98.078.6637.991.7327.170.2455.91
CC9.5224.461.95<LOD1.5617.53668.744051.39186.1225.3278.34170.9710.1767.740.26380.9
W17.1112.45<LOD<LOD0.95415.0420.16758.928.892.4915.4218.380.7117.79<LOD10.08
W34.95<LOD2.8<LOD25.7246.1617.31329.719.8952.755.442.14<LOD5.770.66<LOD

