The Evaluation of the Fracture Surface in the AW-6060 T6 Aluminium Alloy under a Wide Range of Loads


Institute of Structural Engineering, Faculty of Civil and Environmental Engineering, Poznan University of Technology, 5 Piotrowo Street, 60-965 Poznan, Poland
*
Author to whom correspondence should be addressed.
Metals 2019, 9(3), 324; https://doi.org/10.3390/met9030324
Submission received: 8 February 2019
/
Revised: 7 March 2019
/
Accepted: 8 March 2019
/
Published: 13 March 2019
(This article belongs to the Special Issue Metallic Materials under Dynamic Loading)
Abstract
:The present study focused on the behaviour of the AW-6060 aluminium alloy in peak temper condition T6 under a wide range of loads: tensile loading, projectile and explosion. The alloy is used as a structural component of civil engineering structures exposed to static or dynamic loads. Therefore, it was crucial to determine the material’s behaviour at low and intermediate rates of deformation. Despite the fact that the evaluation of the strain rate sensitivity of the AW-6060 aluminium alloy has already been discussed in literature, the authors of this paper wished to further investigate this topic. They conducted tensile tests and confirmed the thesis that the AW-6060 T6 aluminium alloy has low strain rate sensitivity at room temperature. In addition, the fracture surfaces subjected to different loading (tensile loading, projectile and explosion) were investigated and compared using a scanning electron microscope, because the authors of this paper were trying to develop a new methodology for predicting how samples had been loaded before failure occurred based on scanning electron microscopy (SEM) micrographs. Projectile and explosion tests were performed mainly for the SEM observation of the fracture surfaces. These tests were unconventional and they represent the originality of this research. It was found that the type of loading had an impact on the fracture surface.
1. Introduction
The use of civil engineering structures made of aluminium alloys is on the rise. The useful and well-known structural applications of aluminium are presented by Mazzolani [1]. Aluminium alloys may also be used in complex multi-layered structures, for example, aluminium-concrete composite beams [2,3,4], aluminium-timber composite beams [5] and blast- or impact-resistant panels [6]. These structures are exposed to static or dynamic loads. For this reason, it was crucial to investigate the material behaviour under low and high strain rate loading as well as under blast load and gun shots. The authors of this paper chose to investigate the AW-6060 T6 (AW-AlMgSi) aluminium alloy. It is a wrought heat-treatable alloy suitable for structural applications. The AW-6060 T6 aluminium alloy belongs to the aluminium–magnesium–silicon family (6000 or 6xxx series). The alloys belonging to the 6000 series contain relatively small amounts of magnesium and silicon, and additions such as Mn, Cu, Cr and Zn. They contain about 1% of magnesium and silicon, which is a small amount compared to the 4000 series alloys, which are alloyed with silicon (up to 13% of Si) and the 5000 series alloys, which are alloyed with magnesium (up to 5% of Mg). The addition of silicon increases strength and improves corrosion resistance. Aluminium combined with magnesium and silicon creates a pseudo-binary Al-Mg2Si system. The intermetallic phase Mg2Si is responsible for the precipitation hardening of these alloys. Depending on the alloy components, the 6000 family alloys may also include AlMg2Mn, Al3Mg2 and CuAl2 phases. These alloys are characterised by durability rating B according to the standard [7]. Thanks to this rating, it is possible to determine the need for and the degree of the required protection. For example, it means that for a material with a minimum thickness of 3 mm, no protection against atmospheric conditions (rural; industrial/urban: moderate and severe; marine: nonindustrial and moderate) is normally required. The EN AW-6060 alloy is a widely-used heat-treatable alloy and often the principal structural alloy for welded and non-welded applications. It comes in a variety of forms, such as extruded tubes, profiles, rods, bars and drawn tubes. This alloy is used for elements for which the strength of the structure, the surface finish, as well as the possibility of extruding intricate shapes and thin-walled profiles is important. It is suitable for anodising and similar finishing operations. This alloy is easily weldable using the tungsten inert gas (TIG) and metal inert gas (MIG) welding processes but loses strength in the heat-affected zone (HAZ) [7]. For example, depending on the temper and thickness of the element in the MIG process, the characteristic value of the 0.2% proof strength fo decreases in the heat-affected zone to fo,haz by 50–62% [7], while the ultimate tensile strength fu decreases in HAZ to fu,haz by 41–53% [7].
Table 1 presents the chemical composition of the analysed aluminium alloy as indicated in the references [8,9,10].
The three main goals of this paper are presented below. First of all, the authors investigated the strain rate sensitivity of the AW-6060 T6 aluminium alloy at room temperature using universal testing machines and tensile tests at low and intermediate strain rates. In addition, they evaluated the impact of the sample size on the tensile strength, comparing the results for the long and short samples from tensile tests. Civil engineers often prepare building regeneration, renovation or reinforcement projects, in which they encounter the problem of the lack of reliable data describing the structural elements used [11]. Sometimes it is impossible to take larger samples from the construction, because this could reduce the load capacity. If the size does not have an impact on the tensile strength, it is possible to take small samples from the construction. Last but not least, the authors of this paper evaluated the impact of the type of loading on the fracture surface using a scanning electron microscope and comparing the fracture surface after tensile tests, perforation tests and an explosion. The strain rate can have a significant influence on the fracture process [12]. It was the first step in developing a new methodology for predicting how samples had been loaded before failure occurred. The evaluation of the strain rate sensitivity and the fracture surface is an important scientific problem, as evidenced by a number of research articles presented below.
Vilamosa et al. investigated the behaviour of the AA6060 (AW-6060) aluminium alloy subjected to a wide range of strain rates [13]. The material had a low strain rate sensitivity at room temperature. However, for temperatures exceeding 200 °C, the AW-6060 aluminium alloy exhibited a strong positive strain rate sensitivity. Bobbili et al. conducted tensile tests on the 7017 aluminium alloy using different strain rates and temperatures. Moreover, they analysed the fracture surfaces of the tested specimens using SEM [14]. The tensile flow stress of the 7017 alloy was higher in the high strain rate tension tests than in the low strain rate tension tests. The strain rate had an impact on the fracture mode. At lower strain rates (0.01 and 500 s−1), the shear mode of fracture was dominant. At higher strain rates (1000 and 1500 s−1), cup- and cone-like surfaces representing a dimple structure were predominant. Lee et al. investigated the dynamic material properties of the 7075 aluminium alloy [15]. The compressive stress–strain response of this material depended on the strain rate. Chen et al. found that the AA6xxx alloys exhibited an insufficient strain rate sensitivity, whereas for the AA7xxx alloys, they exhibited a moderate strain rate sensitivity [16]. Oosterkamp et al. showed that AA6082 and AA7108 in peak temper T6 and overaged T79 condition exhibited a low strain rate sensitivity [17]. Smerd et al. tested the AA5754 and AA5182 aluminium alloys at a high strain rate [18]. The strength of these alloys did not change significantly with the change of the strain rate, so the strain rate sensitivity was low. The SEM analysis showed that, for these alloys, the ductile shear failure mode was predominant. For both the alloys the rise of the strain rate was accompanied by the rise of porosity. Moreover, these alloys exhibited a significant increase in ductility when the strain rate increased. Similarly, El-Magd and Abouridouane demonstrated that the ductility of AA7075 increased with the increasing strain rate [19]. Bendara et al. analysed the mechanical behaviour of the AW 5005 (AA5005) aluminium alloy under impact loading [20]. They conducted tensile tests for a wide range of strain rates and a perforation test. The strain rate had no influence on the strength of the AW 5005 aluminium alloy. However, the authors observed that the ductility increased as the strain rate increased. The influence of the strain rate and the notch geometry of the specimens on the mechanical properties and the damage mechanisms of AW-AlZn5Mg1Zr and AW-Alzn5Mg1.5CuZr were analysed by Jurczak and Kyzioł [21]. They observed an increase in the strength of the tested alloys subjected to dynamic loading, compared to those subjected to a static tensile test. The dynamic behaviour of the 6061 T6 and 6061 OA (over-aged) aluminium alloys was investigated by Tang et al. [22]. The SEM micrographs of the fracture surface of these alloys after dynamic tests demonstrated a number of microscopic dimples due to very high levels of plastic deformation, which occurred as the dynamic tension test proceeded. Motsi et al. showed that the fracture surface of the 5083-H0 aluminium alloy after the tensile test was characterised by a nucleation of micro-dimples of varying sizes and shapes, which became shallower with increasing strain rates [23].
Heat treatment has an impact on the mechanical properties of aluminium alloys. The impact of the various ageing conditions on the tensile deformation and fracture behaviour of the AA 2219 aluminium alloy was analysed by Narasayya et al. [24]. The influence of heat treatment on the ballistic penetration resistance of the AA7055 aluminium alloy was studied by Mondal et al. [25].
The dynamic behaviour of the 2024 aluminium alloy under blast loading was analysed by Mediavilla Varas et al. [26]. The authors placed a trinitrotoluene charge (TNT) in a barrel. The SEM images of the fracture revealed a dimple-like structure due to a ductile manner of failure. The 2024 T3 aluminium alloy showed no strain rate effect (constant strain and failure strength upon different strain rates).
The results of the tests from the literature described above suggest that:
- the strain rate has little or no influence (no or low strain rate sensitivity) on the strength of AA6082 and AA7108 in peak temper T6 and overaged T79 condition, AA6060, AA5754, AA5182 and AA 5005;
- the strain rate has an impact (strain rate sensitivity) on the strength of the 7075, 7017, AW-AlZn5Mg1Zr and AW-Alzn5Mg1.5CuZr aluminium alloys;
- the ductility of the AA5754, AA5182, AA7075, AA 5005 aluminium alloys increased with the strain rate;
- the fracture surface in the AA 6061 T6, AA 6061 OA, 7017, 5083-H0, 2024 T3 aluminium alloys after dynamic tests demonstrated a number of dimples.
2. Materials and Methods
2.1. Material
The present paper examined the mechanical properties of the AW-6060 T6 (AW-AlMgSi) aluminium alloy at room temperature. It is a wrought alloy whose strength is achieved by heat treatment followed by cooling and artificial ageing. The AW-6060 T6 aluminium alloy belongs to the 6000 series and it is a typical alloy for extrusion. It has a medium strength value and it enables the production of very complex extruded sections at a moderate cost [27]. In addition, the AW-6060 aluminium alloy may be used both for civil engineering and automotive applications. It is used, for example, in the production of automotive air-conditioning ducts [28]. Moreover, the 6000 series aluminium alloys are suitable for the realisation of architectural decorative elements where the aesthetic aspects are fundamental. For this reason, some investigations are focused on further improvements in the surface quality. For example, Ciuffini et al. observed a significant increase in the surface quality whenever the extrusion mould was cooled with liquid nitrogen fluxes [29].
2.2. Tensile Tests
The uniaxial tensile tests were divided into three groups (see Figure 1).
Flat specimens were used in all groups. The tests were conducted at room temperature. In the first group, the tensile tests were carried out in an Instron Satec testing machine (Instron, Grove City, PA, USA) using six long samples and an extensometer (Epsilon, Jackson, WY, USA) with a 50 mm gauge. The initial stress rate Ṙ of 2.0 MPa/s was used up to 0.2% of the nominal elongation (in the elastic range). In the plastic range, the strain rate ė = 0.03 mm/s was used. In these tests, the temperature of the samples was measured when cracks appeared using a FLIR S7000 thermal infrared camera (FLIR Systems, Wilsonville, OR, USA). In the second group, the tensile tests were conducted using six long samples and an Instron Satec testing machine at the strain rate ė = 1.25 mm/s. In the third group, the tensile tests were done using six short samples, an extensometer (Epsilon, Jackson, WY, USA) with a 25 mm gauge and an Instron ElectroPuls E10000 testing machine (Instron, High Wycombe, Buckinghamshire, UK). The initial stress rate Ṙ of 2.0 MPa/s was used up to 0.2% of the nominal elongation (in the elastic range). In the plastic range, the strain rate ė = 0.03 mm/s was used. In all the test groups, the ultimate strength, Young’s modulus and the yield strength (0.2% proof strength) were determined in accordance with the principles set out in the standard [30]. The geometry of the samples from group 3 was different than of the samples from groups 1 and 2, to evaluate the impact of the sample size on tensile strength. Both long and short flat samples were prepared in accordance with the rules presented in the standard [30]. The authors of this paper used proportional test specimens with a gauge length Lo = 5.65√So, where So represents the original cross-sectional area. The samples were cut out from two 500 mm long I-beams using waterjet cutting to limit the influence of heat on the strength parameters of the aluminium alloy. In the tensile tests, the tensile direction was parallel to the direction of extrusion (0°). The tensile direction has an impact on the tensile strength [31]. The ultimate tensile strength is higher in the 0° direction than in the 45° or 90° directions [31].
2.3. Explosion Tests
It is difficult to assess the behaviour of civil engineering materials and composite structures loaded by high strain loading. It is equally difficult to investigate the reason for the initial failure (e.g., in the coupled loading scenario). In such a scenario, the blast wave accelerates some fragments which penetrate the obstacle. Finally, it is very hard to assess the real reason for failure and to be sure which loading reached the obstacle first—the projectiles or the explosive wave. Obviously, there are some recommendations in the STANAG code. For instance, versions 2920 [32] and 4569 [33] deal with the guidelines for steel armour sheet testing and its protection level under such loadings for the military certification of material. In this paper, the authors tried to find clear differences between different loading scenarios based on the failure surface of the obstacle. Plates (5 mm × 150 mm × 150 mm) made of the AW-6060 aluminium alloy were exposed to blast load (see Figure 2). The primary purpose of such an experiment was to obtain a failure edge base from the blast wave loading. The side-on pressure and impulse values were measured using a PCB pencil probe (PCB Piezotronics MTS Systems Corporation, Depew, NY, USA) located 0.95 m away from the charge centre. Finally, high intensity explosive loading was analysed. For this, 10 kg of TNT were placed 0.91 m away from the specimens. The estimated overpressure peak and the positive impulse values were 5341 kPa and 294 kPa × ms respectively [34]. The distance was crucial to causing serious damage to the plates, while not removing the specimens far from their initial location. Moreover, the specimens were supported by concrete blocks. The depth of support was 0.03 m on each side of the plate. The authors performed a series of such experiments. In some of them, the specimens were seriously damaged. They were unsuitable for further analysis, because their edges had been damaged by the concrete fragments from the supporting block units. This occurred because the blast wave reflected from the ground and accelerated the concrete block. The concrete debris pushed the aluminium plate up to 50 m away from its initial position. In such cases, it was very difficult to determine the real reason for failure. The authors selected only one sample with a torn edge for further analysis. Obviously, the standard of the tests was far from laboratory conditions; however, it was good enough to capture the pure failure edge caused only by the rapid pressure wave action. As a result of the tests, the edge of the aluminium plate was torn. It was very challenging to perform any measurements at such a close distance because of the risk of gauge destruction. Yet another important fact is that the diameter of the fireball obtained during the explosion of the 10 kg of TNT exceeded 7 m. For this reason, it was impossible to record the blast wave loading and the obstacle failure using high speed cameras.
2.4. Perforation Tests
The remaining tests dealt with projectile perforation. In this case, a flying military bullet went through the obstacle. Nevertheless, the strain rates were much higher than in the previously presented explosive loading. In projectile perforation tests, the failure edge strongly depended on the bullet or fragment geometry. However, a similar value of the strain rate allowed the authors to obtain a constant failure mode on the damaged material edge. This methodology is relatively new, and there are no papers in which the assessment of the final failure allows for the prediction of the initial loading scenario. In a series of tests, two plates made of aluminium alloy were exposed to gun shots (see Figure 3). A sniper rifle (muzzle velocity = 806 m/s, .308WM (7.62 × 51 NATO) bullet) and a Glock pistol (muzzle velocity = 400 m/s, 9 mm × 19 mm Parabellum bullet) were used. The distance between the barrel and the plates was 25 m. This distance ensured a stable flight of the .308WM bullet. The idea of the test was simple. The plates (5 mm × 150 mm × 150 mm) made of the AW-6060 aluminium alloy were suspended in the air and fixed by threads. After the shot, the plates were found in a pile of sand located 2 m away from their original position.
2.5. Scanning Electron Microscope with Energy-Dispersive X-Ray (EDX) Analysis
The chemical composition of the analysed aluminium alloy was obtained using an energy-dispersive X-ray (EDX) analysis. The authors wanted to present proof that it belonged to the aluminium–magnesium–silicon family (6000 series).
The tensile samples were cut out from extruded I-beams using waterjet cutting. The microstructures of the I-beam web (see Figure 4a) and the intersection zone of one sample (see Figure 4b) were observed under a scanning electron microscope (Tescan, Brno, Czech Republic) to collect additional information about the sample preparation. The authors of this paper expected to observe die lines—continuous deep grooves parallel to the direction of extrusion [35]—on the surface of the web. Additionally, they expected to observe abrasive wear tracks [36] on the fracture surface of the sample after waterjet cutting.
To achieve one of the goals of the present article, the fracture surfaces after the tensile tests (4c), the explosion test (4d) and the perforation tests (4e,f) were investigated using a scanning electron microscope. The SEM micrographs of the samples were obtained using a TESCAN Vega 3 scanning electron microscope (Tescan, Brno, Czech Republic) with a secondary electron (SE) detector. Due to the electrical properties of aluminium, the coating of the samples was not necessary. The SEM micrographs were supplemented by grey-scale intensity profiles.
3. Results and Discussion
3.1. Tensile Tests
The measured mean values from the tensile tests are presented in Table 2. In the case of aluminium alloys, yield strength is difficult to evaluate. The authors of this article assumed that yield strength was equal to stress when the material underwent plastic deformation of 0.2%. In the European standard [7], this yield strength is referred to as the 0.2% proof strength. The mean value of the 0.2% proof strength of the samples from group 2 was only 1.10 times greater than the mean value of the 0.2% proof strength of the samples from group 1. Moreover, the mean value of the ultimate tensile strength of the samples from group 2 was only 1.03 times greater than the mean value of the ultimate tensile strength of the samples from group 1. Therefore, the strain rate sensitivity of the AW-6060 T6 aluminium alloy was close to none at room temperature. This outcome is compatible with the results of the tests presented for the AW-6060 T6 aluminium alloy by Vilamosa et al. [13].
The temperature of the samples from group 1 reached approximately 100 °C when failure occurred (see Figure 5). The important fact is that in the classic tensile static test the fracture time was 0.03256 s. Moreover, the temperature rose by approximately 100 °C only 0.00111 s after the first cracking appeared. This temperature value remained high for another 0.01 s. In Figure 5, the time representing the peak of the tensile force is marked with a yellow star. At that point, the outside specimen temperature was still 67 °C higher than the room temperature.
Figure 1d–f and Figure 5 demonstrate the types of fractures of the AW-6060 T6 alloy. In the first and second groups of tests, ductile cup and cone type fractures occurred. In the third group of tests, shear fractures occurred. The modulus of elasticity of group 2 was not reported because the obtained values were not reliable. There was a slip in the initial part of the stress–strain curve. The samples had not been properly fixed in the clamps of the testing machine when the strain rate ė = 1.25 mm/s (the highest possible value of the strain rate for the Instron Satec testing machine). The mean value of the 0.2% proof strength of the samples from group 3 was only 1.03 times greater than the mean value of the 0.2% proof strength of the samples from group 1. Moreover, the mean value of the ultimate tensile strength of the samples from group 3 was almost the same as the mean value of the ultimate tensile strength of the samples from group 1. The size of the sample did not have an impact on the tensile strength. However, the authors wish to emphasize the fact that both long and short flat samples were proportional test specimens prepared in accordance with the rules presented in [30].
3.2. Chemical Composition
Table 3 presents the chemical composition of the analysed alloy obtained from the authors’ own laboratory test using energy-dispersive X-ray (EDX) spectroscopy.
The chemical composition provided important information about the investigated aluminium alloy and a proof that it belonged to the aluminium–magnesium–silicon family (6000 series). It can be seen that the analysed alloy contained a greater amount of magnesium (0.88%) than presented in the references (0.35–0.60%). Magnesium improves the hardness [37] and strength [38,39] of the aluminium alloy.
3.3. Evaluation of Fracture Surfaces
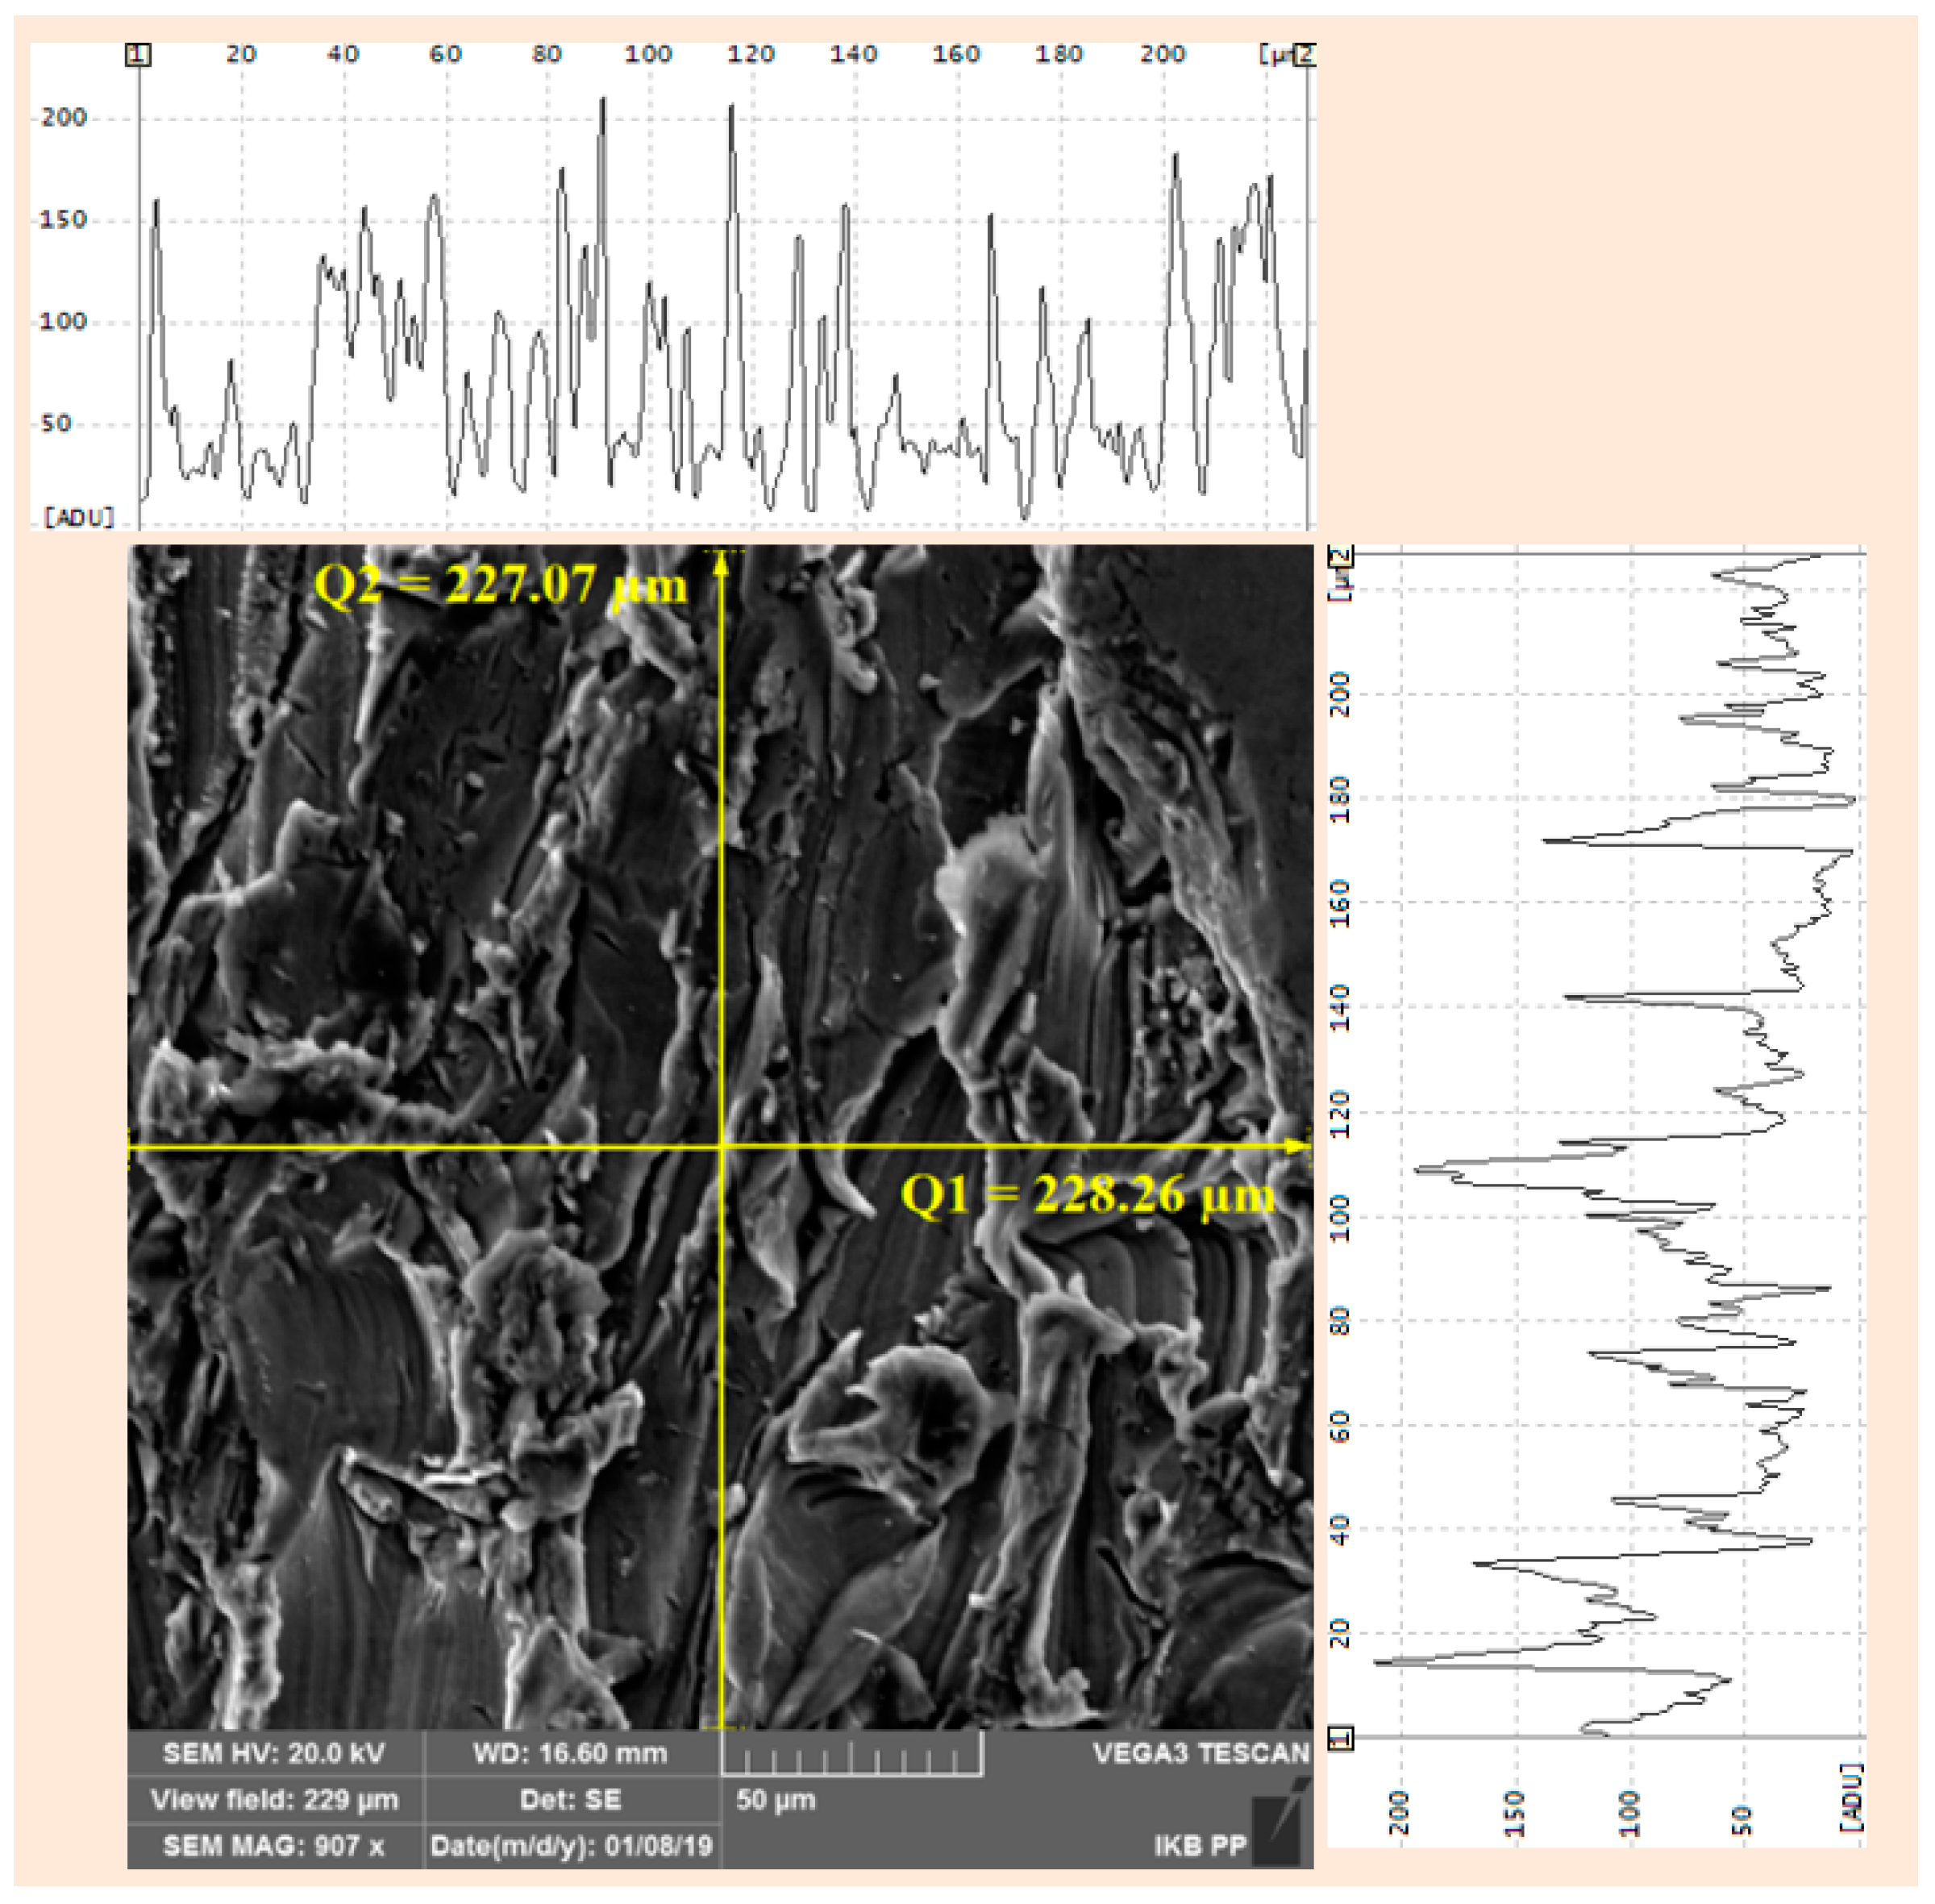
In this section the authors analysed the SEM micrographs. The two graphs at the top and on the right-hand side of the SEM micrographs present grey-scale intensity profiles (grey-scale intensity A.U.: 0-255). The microstructures of the I-beam web and the intersection zone of one sample observed under a scanning electron microscope are presented in Figure 6 and Figure 7.
In Figure 6, one can observe die lines parallel to the direction of extrusion. The fracture surfaces after the tensile tests (Figure 7 and Figure 8) were perpendicular to the direction of extrusion. The tensile direction was oriented at 0° with respect to the direction of extrusion. Due to the fact that the tensile direction has an impact on the tensile strength [31], the authors obtained the highest values of the ultimate tensile strength for the 0° direction. Moreover, the surface presented in Figure 6 is fibrous [40]. This structure is characterised by bands composed of very fine equiaxed grains [40].
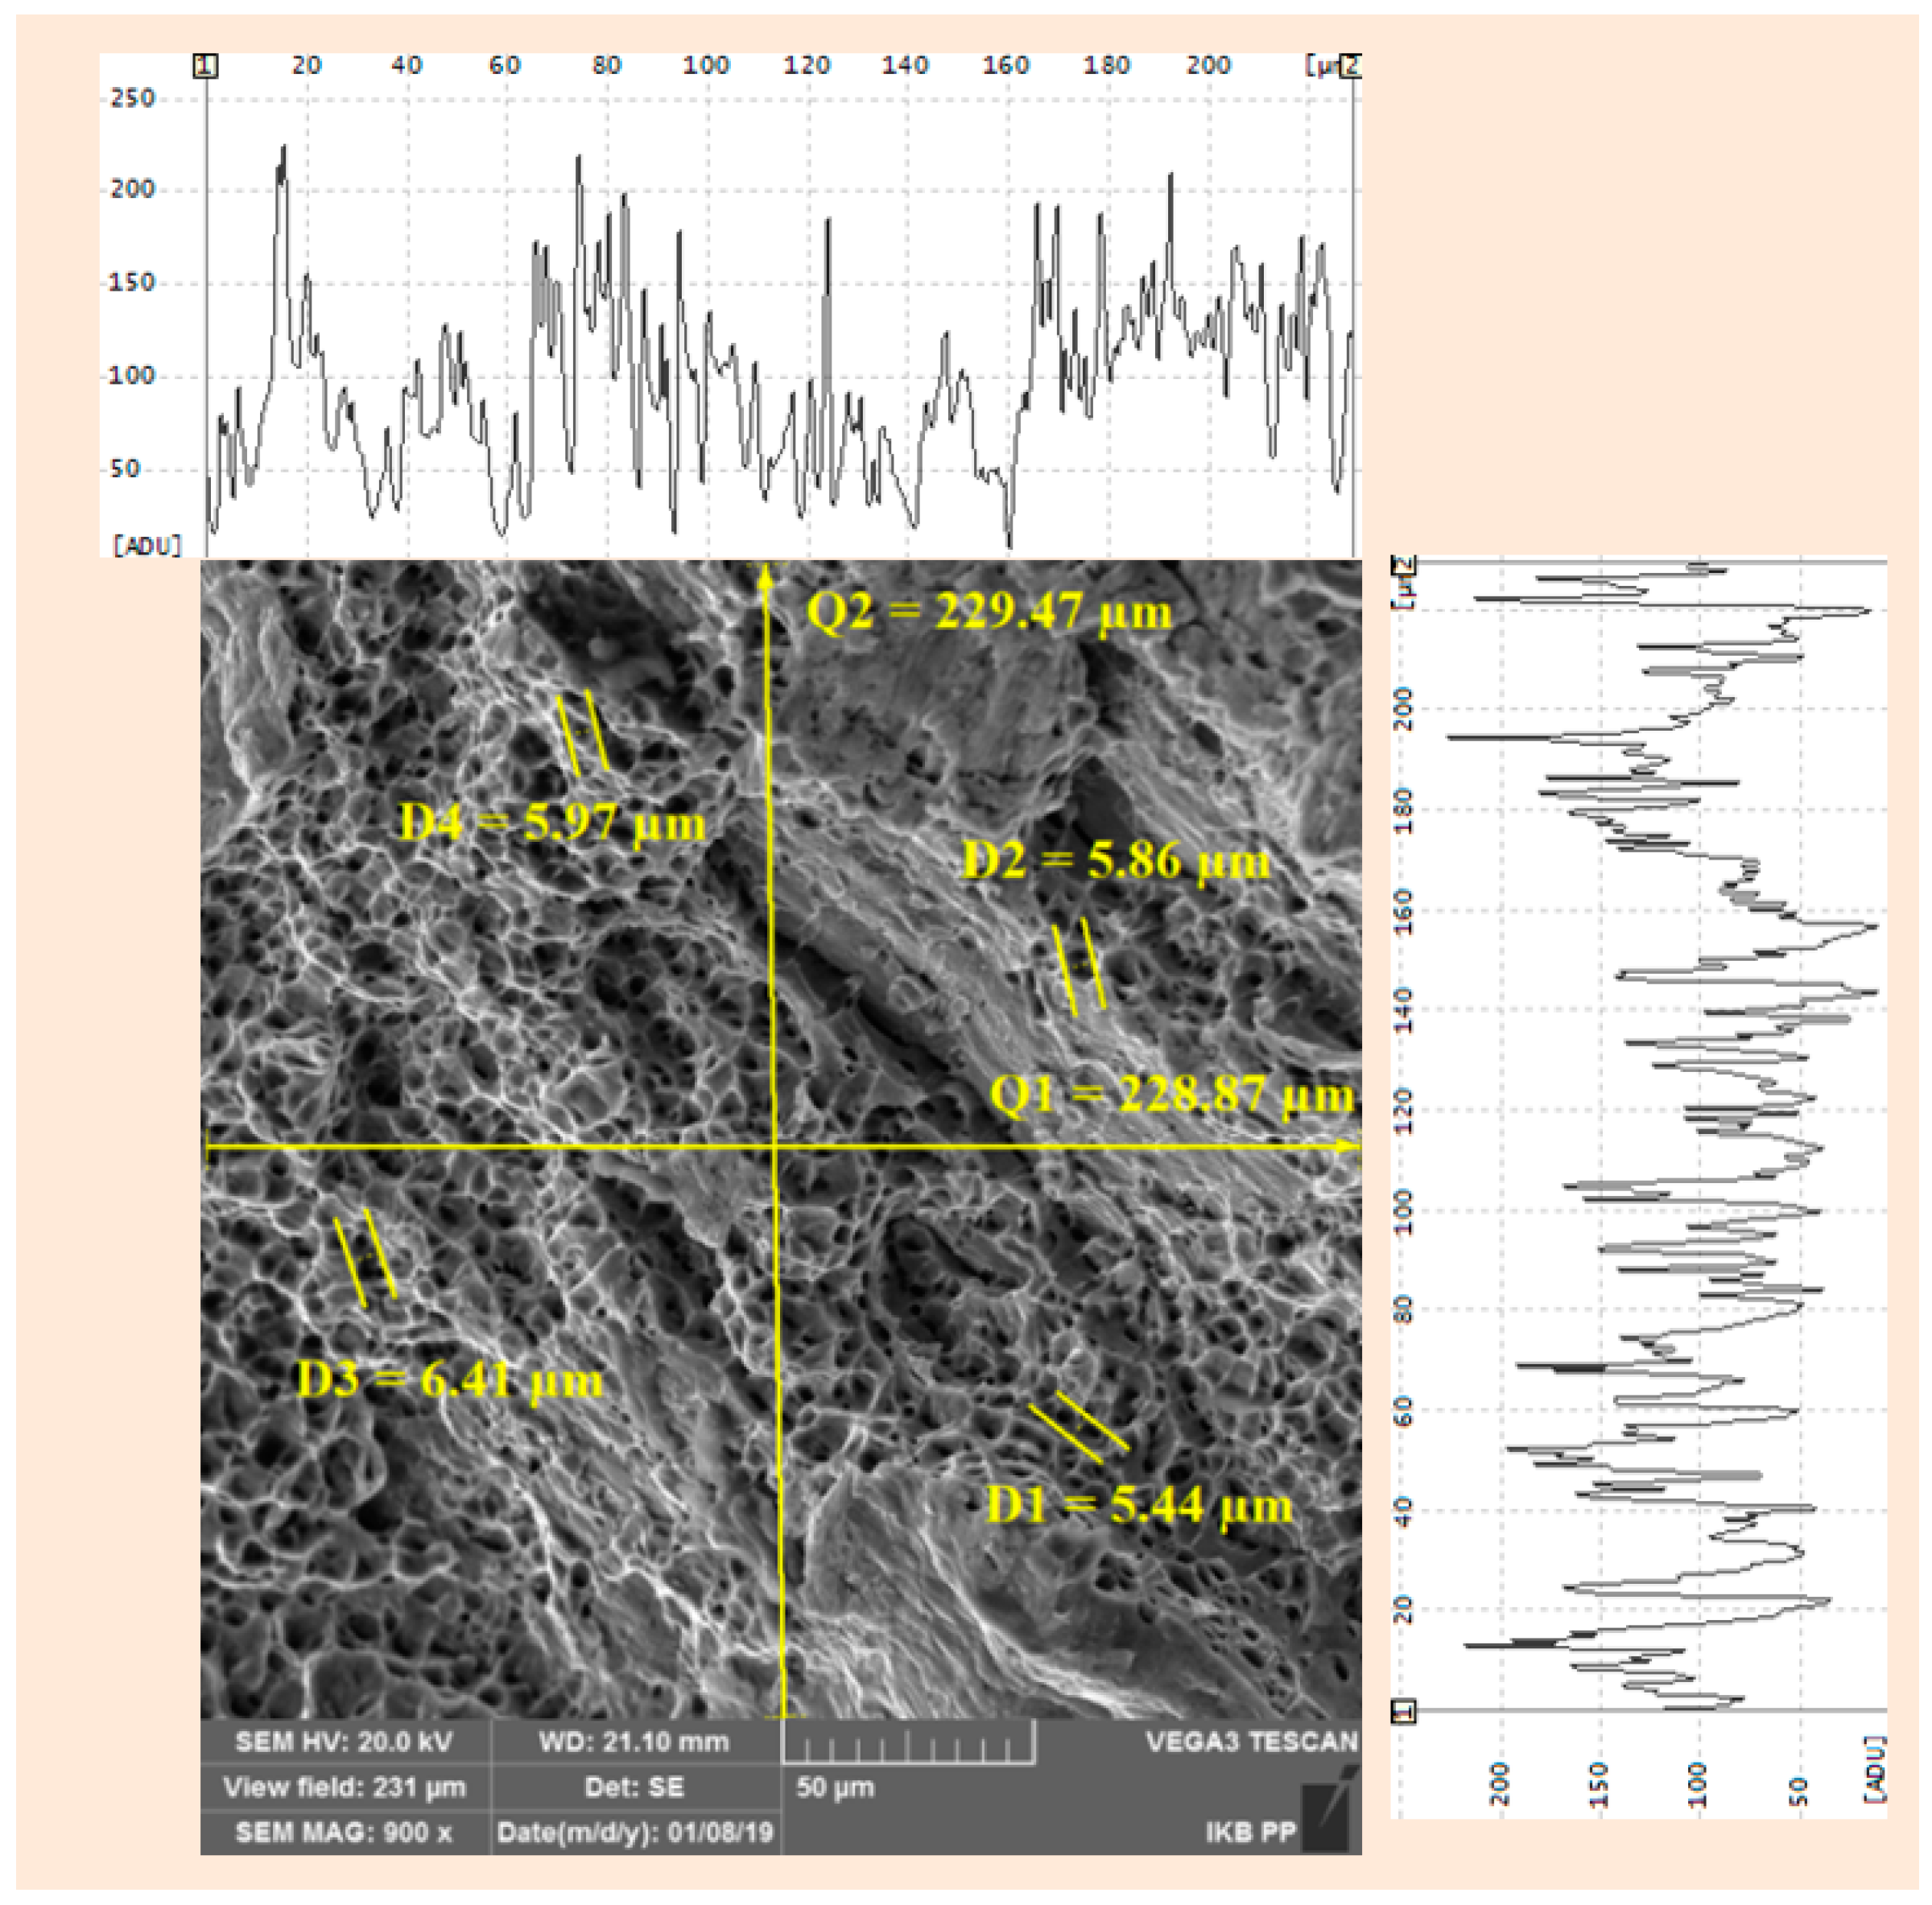
In Figure 7, the authors observed abrasive wear tracks caused by waterjet cutting. Figure 8 and Figure 9 show the failure surfaces of the aluminium alloy specimens after tensile tests.
The dimple structure with deep spherical pores after the tensile tests demonstrated that the material sustained ductile fractures and had been overloaded (see Figure 8 and Figure 9). The micro-dimples observed in Figure 8 and Figure 9 were of varying sizes and shapes. The fracture surface after the tensile test (strain rate ė = 0.03 mm/s) had 5.44–6.41-µm wide dimples. Motsi et al. showed that the fracture surface of the 5083-H0 aluminium alloy after a tensile test was characterised by micro-dimples, which became shallower with increasing strain rates [23]. The number of dimples on the fracture surfaces presented by Motsi el al. was higher at low strain rates than at intermediate strain rates. In the present article, the authors confirmed these findings. However, in the case of the 7017 aluminium alloy, Bobbili el al. suggested that the number of dimples was higher at high strain rates than at intermediate strain rates and that the number of dimples grew with the rise in temperature from 25 °C to 300 °C [14]. Bobbili el al. presented SEM micrographs of the fracture surface in Figure 7 of the article [14]. In the opinion of the authors of this paper, the number of dimples was higher at high strain rates than at intermediate strain rates at high temperature, but at room temperature, the number of dimples was higher at intermediate strain rates than at high rates in Figure 7 of the article [14]. This confirms the finding of the present authors that the number of dimples decreases with the rise in strain rates. However, this conclusion seems to be reliable only for the sample tested at room temperature, which should be further investigated in the future.
Figure 10, Figure 11, Figure 12 and Figure 13 show the failure surfaces of aluminium alloy specimens after the explosion and perforation tests.
A small number of dimples with cleavage portions was observed on the fracture surfaces of the samples after the explosion test (see Figure 10). A large number of dimples with cleavage portions was noticed on the fracture surfaces of the samples after exposure to the Glock pistol shot (see Figure 13). The pores on the fracture surface after the Glock pistol shot had different shapes than the pores on the fracture surfaces after the tensile tests. The pores on the fracture surface after the explosion test were wider than the pores on the fracture surfaces after the tensile tests and the Glock pistol shot. The cleavage portions suggest that the material was rapidly torn. They were not observed on the fracture surface after the tensile tests. The number of dimples on the fracture surface was higher after the tensile tests than after the explosion test and the Glock pistol shot. The width of the dimples in the fracture surface after the Glock pistol shot and the explosion test ranged from 4.75 to 14.32 µm. Two SEM micrographs were done after the sniper rifle shot, one for the inside surface and one for the fracture edge. Cleavage portions with no dimples were observed on the fracture surface of the sample after the sniper rifle shot (see Figure 12). The fractures after the sniper rifle shot were found to occur predominantly in the cleavage mode [41]. The material was rapidly torn. The fracture surface presented in Figure 11 appeared to be smooth. This occurred because the analysed surface was perpendicular to the bullet’s trajectory and was subjected to bullet friction. The differences between the SEM micrographs of the fracture surfaces are evident.
4. Conclusions
SEM analysis is a powerful tool. The AW-6060 T6 aluminium alloy samples were subjected to a wide range of loads: static tension, quasi-static tension, projectile and explosion. The fracture surfaces were different for each load. The original contributions of this work include an extensive comparison of the fracture surfaces after many loading cases. This study is the first step in developing a new methodology for predicting how samples have been loaded before failure occurred based on SEM micrographs.
The authors reached the following conclusions:
- The strain rate sensitivity of the AW-6060 T6 aluminium alloy was close to none at room temperature.
- The size of the sample does not have an impact on the tensile strength when the flat samples are proportional and prepared in accordance with the rules presented in [30].
- The type of loading has an impact on the fracture mode. The number of dimples proved to be higher at low strain rates than at intermediate strain rates at room temperature. Cleavage portions were observed on the fracture surfaces after an explosion or gun shots, and they suggest that the material was rapidly torn. The fracture surfaces after the tensile tests revealed a dimple-like structure due to a ductile manner of failure. The fracture surface after the Glock pistol shot demonstrated a dimple structure with cleavage portions. The fracture surface after the explosion test had cleavage portions with a small number of wide pores, whereas the fracture surface after the sniper rifle shot revealed a cleavage type of failure. For the surfaces which were rapidly torn, the cleavage type of failure with no or a small number of pores was dominant. The findings presented above are important for the development of a new methodology for predicting how samples have been loaded before failure occurred. It seems that SEM analysis and its results may be used to determine the loading which causes material failure. However, additional tests are necessary. They should focus on different strain rates and temperatures.
Author Contributions
P.W.S. conceived, designed and performed the perforation and explosion tests; M.C. and Ł.P. conducted the tensile tests; M.R. performed the scanning electron microscope analysis; M.C., Ł.P. and P.W.S. contributed materials; All of the authors analysed the data, discussed the results and wrote the paper; They approved the final manuscript.
Funding
This research was funded by the Polish National Science Centre (NCN) under contract 2017/01/X/ST8/01035.
Acknowledgments
The constructive comments of anonymous reviewers are gratefully acknowledged.
Conflicts of Interest
The authors declare no conflict of interest.
References
- Mazzolani, F.M. Structural Applications of Aluminium in Civil Engineering. Struct. Eng. Int. 2006, 16, 280–285. [Google Scholar] [CrossRef]
- Szumigała, M.; Polus, Ł. Applications of Aluminium and Concrete Composite Structures. Procedia Eng. 2015, 108, 544–549. [Google Scholar] [CrossRef] [Green Version]
- Polus, Ł.; Szumigała, M. An experimental and numerical study of aluminium–concrete joints and composite beams. Arch. Civ. Mech. Eng. 2019, 19, 375–390. [Google Scholar] [CrossRef]
- Chybiński, M.; Polus, Ł. Bending resistance of metal-concrete composite beams in a natural fire. Civ. Environ. Eng. Rep. 2018, 28, 149–162. [Google Scholar] [CrossRef]
- Szumigała, M.; Chybiński, M.; Polus, Ł. Preliminary analysis of the aluminium-timber composite beams. Civ. Environ. Eng. Rep. 2017, 27, 131–141. [Google Scholar] [CrossRef]
- Sielicki, P.W.; Łodygowski, T.; Al-Rifaie, H.; Sumelka, W. Designing of blast resistant lightweight elevation system-numerical study. Procedia Eng. 2017, 172, 991–998. [Google Scholar] [CrossRef]
- European Committee for Standardization. EN 1999-1-1, Eurocode 9, Design of Aluminium Structures. Part 1-1: General Structural Rules; European Committee for Standardization: Brussels, Belgium, 2007. [Google Scholar]
- European Committee for Standardization. EN 573-1, Aluminium and Aluminium Alloys. Chemical Composition and Form of Wrought Products. Numerical Designation System; European Committee for Standardization: Brussels, Belgium, 2006. [Google Scholar]
- European Committee for Standardization. EN 573-2, Aluminium and Aluminium Alloys. Chemical Composition and Form of Wrought Products. Chemical Symbol Based Designation System; European Committee for Standardization: Brussels, Belgium, 1997. [Google Scholar]
- European Committee for Standardization. EN 573-3, Aluminium and Aluminium Alloys. Chemical Composition and Form of Wrought Products. Chemical Composition and Form of Products; European Committee for Standardization: Brussels, Belgium, 2014. [Google Scholar]
- Chybiński, M.; Kurzawa, Z.; Polus, Ł. Problems with buildings lacking basic design documentation. Procedia Eng. 2017, 24–31. [Google Scholar] [CrossRef]
- Łodygowski, T.; Jankowiak, T.; Sielicki, P.W. Safety of concrete and masonry structures under unusual loadings. CISM Int. Cent. Mech. Sci. Courses Lect. 2011, 525, 379–411. [Google Scholar]
- Vilamosa, V.; Børvik, T.; Hopperstad, O.S.; Clausen, A.H. Behaviour and modelling of aluminium alloy AA6060 subjected to a wide range of strain rates and temperatures. EPJ Web Conf. 2015, 94, 04018. [Google Scholar] [CrossRef] [Green Version]
- Bobbili, R.; Madhu, V.; Gogia, A.K. Tensile behaviour of aluminium 7017 alloy at various temperatures and strain rates. J. Mater. Res. Technol. 2016, 5, 190–197. [Google Scholar] [CrossRef] [Green Version]
- Lee, W.-S.; Sue, W.-C.; Lin, C.-F.; Wu, C.-J. The strain rate and temperature dependence of the dynamic impact properties of 7075 aluminum alloy. J. Mater. Process. Technol. 2000, 100, 116–122. [Google Scholar] [CrossRef]
- Chen, Y.; Clausen, A.H.; Hopperstad, O.S.; Langseth, M. Stress-strain behaviour of aluminium alloys at a wide range of strain rates. Int. J. Solid Struct. 2009, 46, 3825–3835. [Google Scholar] [CrossRef]
- Oosterkamp, L.D.; Ivankovic, A.; Venizelos, G. High strain rate properties of selected aluminium alloys. Mater. Sci. Eng. 2000, 278, 225–235. [Google Scholar] [CrossRef]
- Smerd, R.; Winkler, S.; Salisbury, C.; Worswick, M.; Lloyd, D.; Finn, M. High strain rate tensile testing of automotive aluminum alloy sheet. Int. J. Impact Eng. 2005, 32, 541–560. [Google Scholar] [CrossRef]
- El-Magd, E.; Abouridouane, M. Characterization, modelling and simulation of deformation and fracture behaviour of the light-weight wrought alloys under high strain rate loading. Int. J. Impact Eng. 2006, 32, 741–758. [Google Scholar] [CrossRef]
- Bendara, A.; Jankowiak, T.; Łodygowski, T.; Rusinek, A.; Klósak, M. Experimental and numerical analysis of aluminum alloy AW5005 behavior subjected to tension and perforation under dynamic loading. J. Theor. Appl. Mech. 2017, 55, 1219–1233. [Google Scholar] [CrossRef]
- Jurczak, W.; Kyzioł, L. Dynamic properties of 7000—Series aluminum alloys at large strain rates. Pol. Marit. Res. 2012, 19, 38–43. [Google Scholar] [CrossRef]
- Tang, X.; Prakash, V.; Lewandowski, J. Dynamic Tensile Deformation of Aluminum Alloy 6061-T6 and 6061-OA. In Proceedings of the 2006 SEM Annual Conference and Exposition on Experimental and Applied Mechanics, Saint Louis, MO, USA, 4–7 June 2006. [Google Scholar]
- Motsi, G.D.; Shongwe, M.B.; Sono, T.J.; Olubambi, P.A. Anisotropic behavior studies of aluminum alloy 5083-H0 using a micro-tensile test stage in a FEG-SEM. Mater. Sci. Eng. 2016, 656, 266–274. [Google Scholar] [CrossRef]
- Narasayya, C.V.A.; Rambabu, P.; Mohan, M.K.; Mitra, R.; Prasad, N.E. Tensile deformation and fracture behavior of an aerospace aluminium alloy AA2219 in different ageing conditions. Procedia Mater. Sci. 2014, 6, 322–330. [Google Scholar] [CrossRef]
- Mondal, C.; Mishra, B.; Jena, P.K.; Kumar, K.S.; Bhat, T.B. Effect of heat treatment on the behavior of an AA7055 aluminum alloy during ballistic impact. Int. J. Impact Eng. 2011, 38, 745–754. [Google Scholar] [CrossRef]
- Mediavilla Varas, J.; Soetens, J.; van der Meulen, O.R.; Kroon, E.; Aanhold, J.E. Dynamic behaviour of AA2024 under blast loading: Experiments and simulations. In Proceedings of the 11th International Aluminium Conference (INALCO 2010); Katgerman, L., Soetens, F., Eds.; ISO Press: Amsterdam, The Netherlands, 2010; pp. 409–417. [Google Scholar]
- Gitter, R. Design of Aluminium Structures: Selection of Structural Alloys Structural Design according to Eurocode 9, Essential Properties of Materials and Background Information; Eurocodes-Background and Applications: Brussels, Belgium, 2008. [Google Scholar]
- Leszczyńska-Madej, B.; Richert, M.; Wąsik, A.; Szafron, A. Analysis of the microstructure and selected properties of the aluminium alloys used in automotive air-conditioning systems. Metals 2018, 8, 10. [Google Scholar] [CrossRef]
- Ciuffini, A.F.; Barella, S.; Di Cecca, C.; Gruttadauria, A.; Mapelli, C.; Merello, L.; Mainetti, G.; Bertoletti, M. Surface quality improvement of AA6060 aluminum extruded components through liquid nitrogen mold cooling. Metals 2018, 8, 409. [Google Scholar] [CrossRef]
- European Committee for Standardization. EN ISO 6892-1, Metallic Materials. Tensile Testing. Part 1: Method of Test at Room Temperature; European Committee for Standardization: Brussels, Belgium, 2016. [Google Scholar]
- Snilsberg, K.E.; Westermann, I.; Holmedal, B.; Hopperstad, O.S.; Langsrud, Y.; Marthinsen, K. Anisotropy of bending properties in industrial heat-treatable extruded aluminium alloys. Mater. Sci. Forum 2010, 638–642, 487–492. [Google Scholar] [CrossRef]
- NATO Standardization Agency. STANAG 2920 PPS, Ballistic Test Method for Personal Armour Materials and Combat Clothing, 2nd ed.; NATO Standardization Agency: Brussels, Belgium, 2003. [Google Scholar]
- NATO Standardization Agency. STANAG 4569, Protection Levels for Occupants of Logistic and Light Armoured Vehicles; NATO Standardization Agency: Brussels, Belgium, 2004. [Google Scholar]
- Sielicki, P.W.; Stachowski, M. Implementation of sapper-blast-module, a rapid prediction software for blast wave properties. Cent. Eur. J. Energ. Mater. 2015, 12, 473–486. [Google Scholar]
- Peris, R.G. Effects of Extrusion Conditions on “Die Pick-Up” Formed during Extrusion of Aluminium Alloy AA6060. Master’s Thesis, AUT Univeristy, Auckland, New Zealand, 2007. [Google Scholar]
- Kovacevic, R. Surface texture in abrasive waterjet cutting. J. Manuf. Syst. 1991, 10, 32–40. [Google Scholar] [CrossRef]
- Wesołowski, K. Metaloznawstwo; Wydawnictwo Naukowo-Techniczne: Warszawa, Poland, 1966. (In Polish) [Google Scholar]
- Ściężor, W.; Mamala, A. Evaluation of the effect of selected alloying elements on the mechanical aluminium properties and strengthening during deformation. Logistyka 2013, 4. (In Polish). Available online: http://yadda.icm.edu.pl/yadda/element/bwmeta1.element.baztech-8fc7c58a-7f46-4099-aa5b-01f33f1d701d?q=bwmeta1.element.baztech-94331a14-ae8b-47e3-b137-846f827239d3;18&qt=CHILDREN-STATELESS (accessed on 8 March 2019).
- Hirsch, J. Aluminium alloys for automotive application. Mater. Sci. Forum 1997, 242, 33–50. [Google Scholar] [CrossRef]
- Jaskowski, M.; Pieła, K.; Błaż, L. Structure and mechanical properties of AlMg4.5 and AlMg4.5Mn wires extruded by KoBo method. Arch. Metall. Mater. 2014, 59, 473–479. [Google Scholar] [CrossRef]
- Mohammad, A.; Alahmari, A.M.; Mohammed, M.K.; Renganayagalu, R.K.; Moiduddin, K. Effect of energy input on microstructure and mechanical properties of titanium aluminide alloy fabricated by the additive manufacturing process of electron beam melting. Materials 2017, 10, 211. [Google Scholar] [CrossRef]
Figure 1.
(a) I-beam; (b) dimensions of the long sample; (c) dimensions of the short sample; samples after tensile tests: (d) long samples from group 1; (e) long samples from group 2; (f) short samples from group 3.
Figure 1.
(a) I-beam; (b) dimensions of the long sample; (c) dimensions of the short sample; samples after tensile tests: (d) long samples from group 1; (e) long samples from group 2; (f) short samples from group 3.

Figure 2.
Explosion test: stand view, 10 kg TNT box, whole sample and torn edge.

Figure 3.
Failure patterns after gun shots: two sniper rifle shots vs. Glock pistol shot.

Figure 4.
Surfaces observed by the authors of this article after: (a) extrusion; (b) waterjet cutting; (c) tensile test; (d) explosion test; (e) sniper rifle shot; (f) Glock pistol shot.
Figure 4.
Surfaces observed by the authors of this article after: (a) extrusion; (b) waterjet cutting; (c) tensile test; (d) explosion test; (e) sniper rifle shot; (f) Glock pistol shot.

Figure 5.
Sample temperature during the static tensile test.

Figure 6.
SEM micrograph of the extruded I-beam web with grey-scale intensity profiles along the depicted lines, magnification factor ×900.
Figure 6.
SEM micrograph of the extruded I-beam web with grey-scale intensity profiles along the depicted lines, magnification factor ×900.
Figure 7.
SEM micrograph of the fracture surface after waterjet cutting with grey-scale intensity profiles along the depicted lines, magnification factor ×900.
Figure 7.
SEM micrograph of the fracture surface after waterjet cutting with grey-scale intensity profiles along the depicted lines, magnification factor ×900.

Figure 8.
SEM micrograph of the fracture surface after a tensile test (strain rate ė = 0.03 mm/s) with grey-scale intensity profiles along the depicted lines, magnification factor ×900.
Figure 8.
SEM micrograph of the fracture surface after a tensile test (strain rate ė = 0.03 mm/s) with grey-scale intensity profiles along the depicted lines, magnification factor ×900.

Figure 9.
SEM micrograph of the fracture surface after a tensile test (strain rate ė = 1.25 mm/s) with grey-scale intensity profiles along the depicted lines, magnification factor ×900.
Figure 9.
SEM micrograph of the fracture surface after a tensile test (strain rate ė = 1.25 mm/s) with grey-scale intensity profiles along the depicted lines, magnification factor ×900.

Figure 10.
SEM micrograph of the fracture surface after explosion test with grey-scale intensity profiles along the depicted lines, magnification factor ×900.
Figure 10.
SEM micrograph of the fracture surface after explosion test with grey-scale intensity profiles along the depicted lines, magnification factor ×900.

Figure 11.
SEM micrograph of the fracture surface after sniper rifle shot with grey-scale intensity profiles along the depicted lines, magnification factor ×900.
Figure 11.
SEM micrograph of the fracture surface after sniper rifle shot with grey-scale intensity profiles along the depicted lines, magnification factor ×900.

Figure 12.
SEM micrograph of the fracture surface after sniper rifle shot with grey-scale intensity profiles along the depicted lines, magnification factor ×900 (edge).
Figure 12.
SEM micrograph of the fracture surface after sniper rifle shot with grey-scale intensity profiles along the depicted lines, magnification factor ×900 (edge).

Figure 13.
SEM micrograph of the fracture surface after Glock pistol shot with grey-scale intensity profiles along the depicted lines, magnification factor ×900.
Figure 13.
SEM micrograph of the fracture surface after Glock pistol shot with grey-scale intensity profiles along the depicted lines, magnification factor ×900.


Table 1.
Chemical composition of the EN AW-6060 T6 aluminium alloy as indicated in the references [8,9,10].
| EN 573-1 | EN 573-2 | Mg | Mn | Fe | Si | Cu | Zn |
| EN AW-6060 T6 | AlMgSi | 0.35–0.60 | ≤ 0.1 | 0.1–0.3 | 0.30–0.60 | ≤ 0.1 | ≤ 0.15 |
| Cr | Ti | Others each | Others total | Al | |||
| EN AW-6060 T6 | AlMgSi | ≤ 0.05 | ≤ 0.1 | ≤ 0.05 | ≤ 0.15 | balance | |
Table 2.
Set of samples, measured mean values.
| Group of Tests | Parameter | Measured Mean Value |
|---|---|---|
| 1 | 0.2% proof strength (MPa) | 181.5 ± 1.92 (1.06%)+ |
| Ultimate tensile strength (MPa) | 209.8 ± 1.05 (0.50%)+ | |
| Modulus of elasticity (GPa) | 66.4 ± 0.51 (0.77%)+ | |
| Elongation (%) | 8.2 ± 0.23 (2.84%)+ | |
| 2 | 0.2% proof strength (MPa) | 200.0 ± 2.51 (1.25%)+ |
| Ultimate tensile strength (MPa) | 216.9 ± 2.54 (1.17%)+ | |
| 3 | 0.2% proof strength (MPa) | 186.7 ± 7.05 (3.78%)+ |
| Ultimate tensile strength (MPa) | 210.2 ± 2.90 (1.38%)+ | |
| Modulus of elasticity (GPa) | 63.7 ± 2.01 (3.15%)+ | |
| Elongation (%) | 10.1 ± 0.78 (7.79%)+ |
+ The measurement errors were calculated using Student’s t-distribution with 5 degrees of freedom and a confidence level of 0.95.
Table 3.
Chemical composition of the EN AW-6060 T6 aluminium alloy obtained from the test.
| EN 573-1 | EN 573-2 | Mg | Mn | Fe | Si | Cu | Zn |
| EN AW-6060 T6 | AlMgSi | 0.88 | 0.04 | 0.1 | 0.38 | 0.06 | 0.07 |
| Cr | Ti | Others each | Others total | Al | |||
| EN AW-6060 T6 | AlMgSi | 0.03 | 0.04 | - | - | 98.41 | |
© 2019 by the authors. Licensee MDPI, Basel, Switzerland. This article is an open access article distributed under the terms and conditions of the Creative Commons Attribution (CC BY) license (http://creativecommons.org/licenses/by/4.0/).
Share and Cite
MDPI and ACS Style
Chybiński, M.; Polus, Ł.; Ratajczak, M.; Sielicki, P.W. The Evaluation of the Fracture Surface in the AW-6060 T6 Aluminium Alloy under a Wide Range of Loads. Metals 2019, 9, 324. https://doi.org/10.3390/met9030324
AMA Style
Chybiński M, Polus Ł, Ratajczak M, Sielicki PW. The Evaluation of the Fracture Surface in the AW-6060 T6 Aluminium Alloy under a Wide Range of Loads. Metals. 2019; 9(3):324. https://doi.org/10.3390/met9030324
Chicago/Turabian StyleChybiński, Marcin, Łukasz Polus, Maria Ratajczak, and Piotr W. Sielicki. 2019. "The Evaluation of the Fracture Surface in the AW-6060 T6 Aluminium Alloy under a Wide Range of Loads" Metals 9, no. 3: 324. https://doi.org/10.3390/met9030324
Note that from the first issue of 2016, this journal uses article numbers instead of page numbers. See further details here.