Article

Effect of Cooling Methods on the Strength of Silico-ferrite of Calcium and Aluminum of Iron Ore Sinter during the Cooling Process

1
School of Metallurgical and Ecological Engineering, University of Science and Technology Beijing, Beijing 100083, China
2
Graduate School of Engineering, Tohoku University, Miyagi 980-8579, Japan
3
Ministry of Environmental Protection Energy of SGIS Songshan co., Ltd., Shaoguan 512123, China
*
Author to whom correspondence should be addressed.
Metals 2019, 9(4), 402; https://doi.org/10.3390/met9040402
Submission received: 7 March 2019 / Revised: 27 March 2019 / Accepted: 29 March 2019 / Published: 2 April 2019

Abstract

:
In the iron making process, a high mechanical strength is favorable for iron ore sinters in the blast furnace, and the bonding phase is regarded as one of the key components that determines the quality of the iron ore sinter, in which the silico-ferrite of calcium and aluminum (SFCA) is one of the typical phases. In this study, synthesized samples with different SFCA mass fractions were prepared to study the effect of different cooling methods on the strengths of the SFCA samples. The results showed that the strength of a sample could be improved by increasing the SFCA content during a temperature change. Further, the test results for the compressive strength suggested that the SFCA had a positive effect on the strength of the iron ore sinter during cooling, with slow cooling being significantly effective at preventing the generation of thermal stress. Moreover, the Biot number was introduced to normalize all of the cooling methods. The results showed that higher mechanical strengths for iron ore sinters will be obtained with higher SFCA content and lower Biot numbers, which will guide the evaluation of mechanical strength of iron ore sinter after the cooling process in industry.

1. Introduction

The metallurgical performance of the iron ore sinter, especially its mechanical strength, plays a significant role in the blast furnace during the iron making process. In general, the mineral structure of the iron ore sinter mainly consists of the core ores and the bonding phase. The core ores are mainly bonded by the bonding phase during the sintering process, while the strength of the core ores is relatively high and will not be the limiting factor for the mechanical strength of the iron ore sinter, therefore, the strength of the bonding phase to a great extent determines the quality of the iron ore sinter [1,2]. The mineral composition of the bonding phase mainly consists of calcium silicate and calcium ferrite, with the latter having better resistance to fracture and having been proven to be crucial for the strength of the bonding phase [3]. Most of the calcium ferrite in the iron ore sinter was considered to be a solid solution of calcium ferrite (CaFe2O4, CF) with dissolved SiO2 and Al2O3, and was called the silico-ferrite of calcium and aluminum (Ca5Si2(FeAl)18O36, SFCA) by Hancart et al. [4]. Moreover, it has been shown to positively influence metallurgical performance, including for the strength of the iron ore sinter in the blast furnace [5].
The SFCA has been extensively studied as a key bonding phase because of its important role in determining the quality of the iron ore sinter, with most studies focusing on the mechanism of its formation. Some researchers [6,7,8] found that the crystallization mechanism of SFCA was more complex than that reported in the previous papers based on the results of in situ X-ray diffraction (XRD). Others [9,10] reported that the structure and stability of the SFCA were closely related to the content of Al2O3 and Fe3O4. All of these studies involved the formation process of the SFCA, which is above 1000 °C. In addition, the strength of iron ore sinter or bonding phase was also studied. Zhang et al. [11] measured the strength of sinter body of iron ores using a microsintering method, while the relationship between the chemical composition and strength of sinter body was discussed. The results showed that the compressive strengths of iron ores decreased with the increasing of the contents of SiO2 and Al2O3. Liu et al. [12] found that Australian iron ore concentrate exhibited high strength during the bonding phase, the tumbler index of the sinter first increased and then decreased with the increasing of Ore-A ratio. Wei et al. [13] studied the effect of immersion depth of ultrasonic probe (IDUP) on the properties of CF, the results showed that the compressive strength of CF increased from 52.5 MPa to 87.3 MPa when the IDUP increased from 10 mm to 30 mm. Tang et al. [14] investigated the influence of basicity and temperature on the bonding phase strength of iron ore sinters, the results showed that the bonding strength exceeds 4000 N, which was equal to 80 MPa for a sample with diameter of 8 mm, with the temperature in the range of 1280–1300 °C and the basicity at 2.0, 2.4, and 3.4–4.0. However, iron ore sinters are always cooled down to lower than 150 °C from above 750 °C on the cooling machine in a sintering plant and then delivered to the iron making process. Thus, consideration should be given to the effect of the cooling process on the quality of the iron ore sinter, and especially the strength of the bonding phase, which has scarcely been studied previously. Therefore, in this study, a novel evaluation criterion was created to correlate the cooling method and the strength of the bonding phase during the cooling process of the iron ore sinter. As we know, the temperature gradient may cause the generation of thermal stress during the cooling process of the iron ore sinter, and a stress concentration will lead to cracking along the bonding phase, which will affect the mechanical performance of the iron ore sinter in the blast furnace. Therefore, it is necessary to study the effect of the cooling method on the strength of the main bonding phase, namely the SFCA, in the iron ore sinter. In fact, a series of different cooling methods, in which the cooling in air, forced air and the vertical tank (a new cooling process that has been applied to some of the steel plants in China) was set according to the real industrial cooling process and the cooling in water and furnace was under extreme conditions, were applied to the synthesized samples, whose component is mostly the SFCA, a key composition in the iron ore sinter. Therefore, the “strength” obtained in this paper would fundamentally be a reference to the tumbler strength and shatter strength in metallurgical properties of the iron ore sinter after cooling process. Further, the Biot number was introduced to normalize all the cooling methods considered in the study, which means that the iron ore sinter after the cooling process, whose Biot number can be calculated, will not perform well in mechanical strength if the “strength” of SFCA samples is relatively low under the cooling method of the same Biot number in this paper.
In this study, sintered samples with different SFCA contents were synthesized. Next, the thermal expansion coefficients of the SFCA samples were obtained, which caused the generation of thermal stress in the iron ore sinter when heated or cooled, and the changing rate of the linear expansion coefficient with temperature (CRT) was defined to study the effect of SFCA content on strength of samples during temperature change. Further, to study the effect of different cooling methods on the strength of the SFCA, a series of cooling methods were investigated, followed by compressive strength tests. Finally, the relationship between SFCA content, Biot number, and strength of the samples were created to guide the evaluation of mechanical strength of iron ore sinter after the cooling process in industry.

2. Materials and Methods

2.1. Materials and Preparation

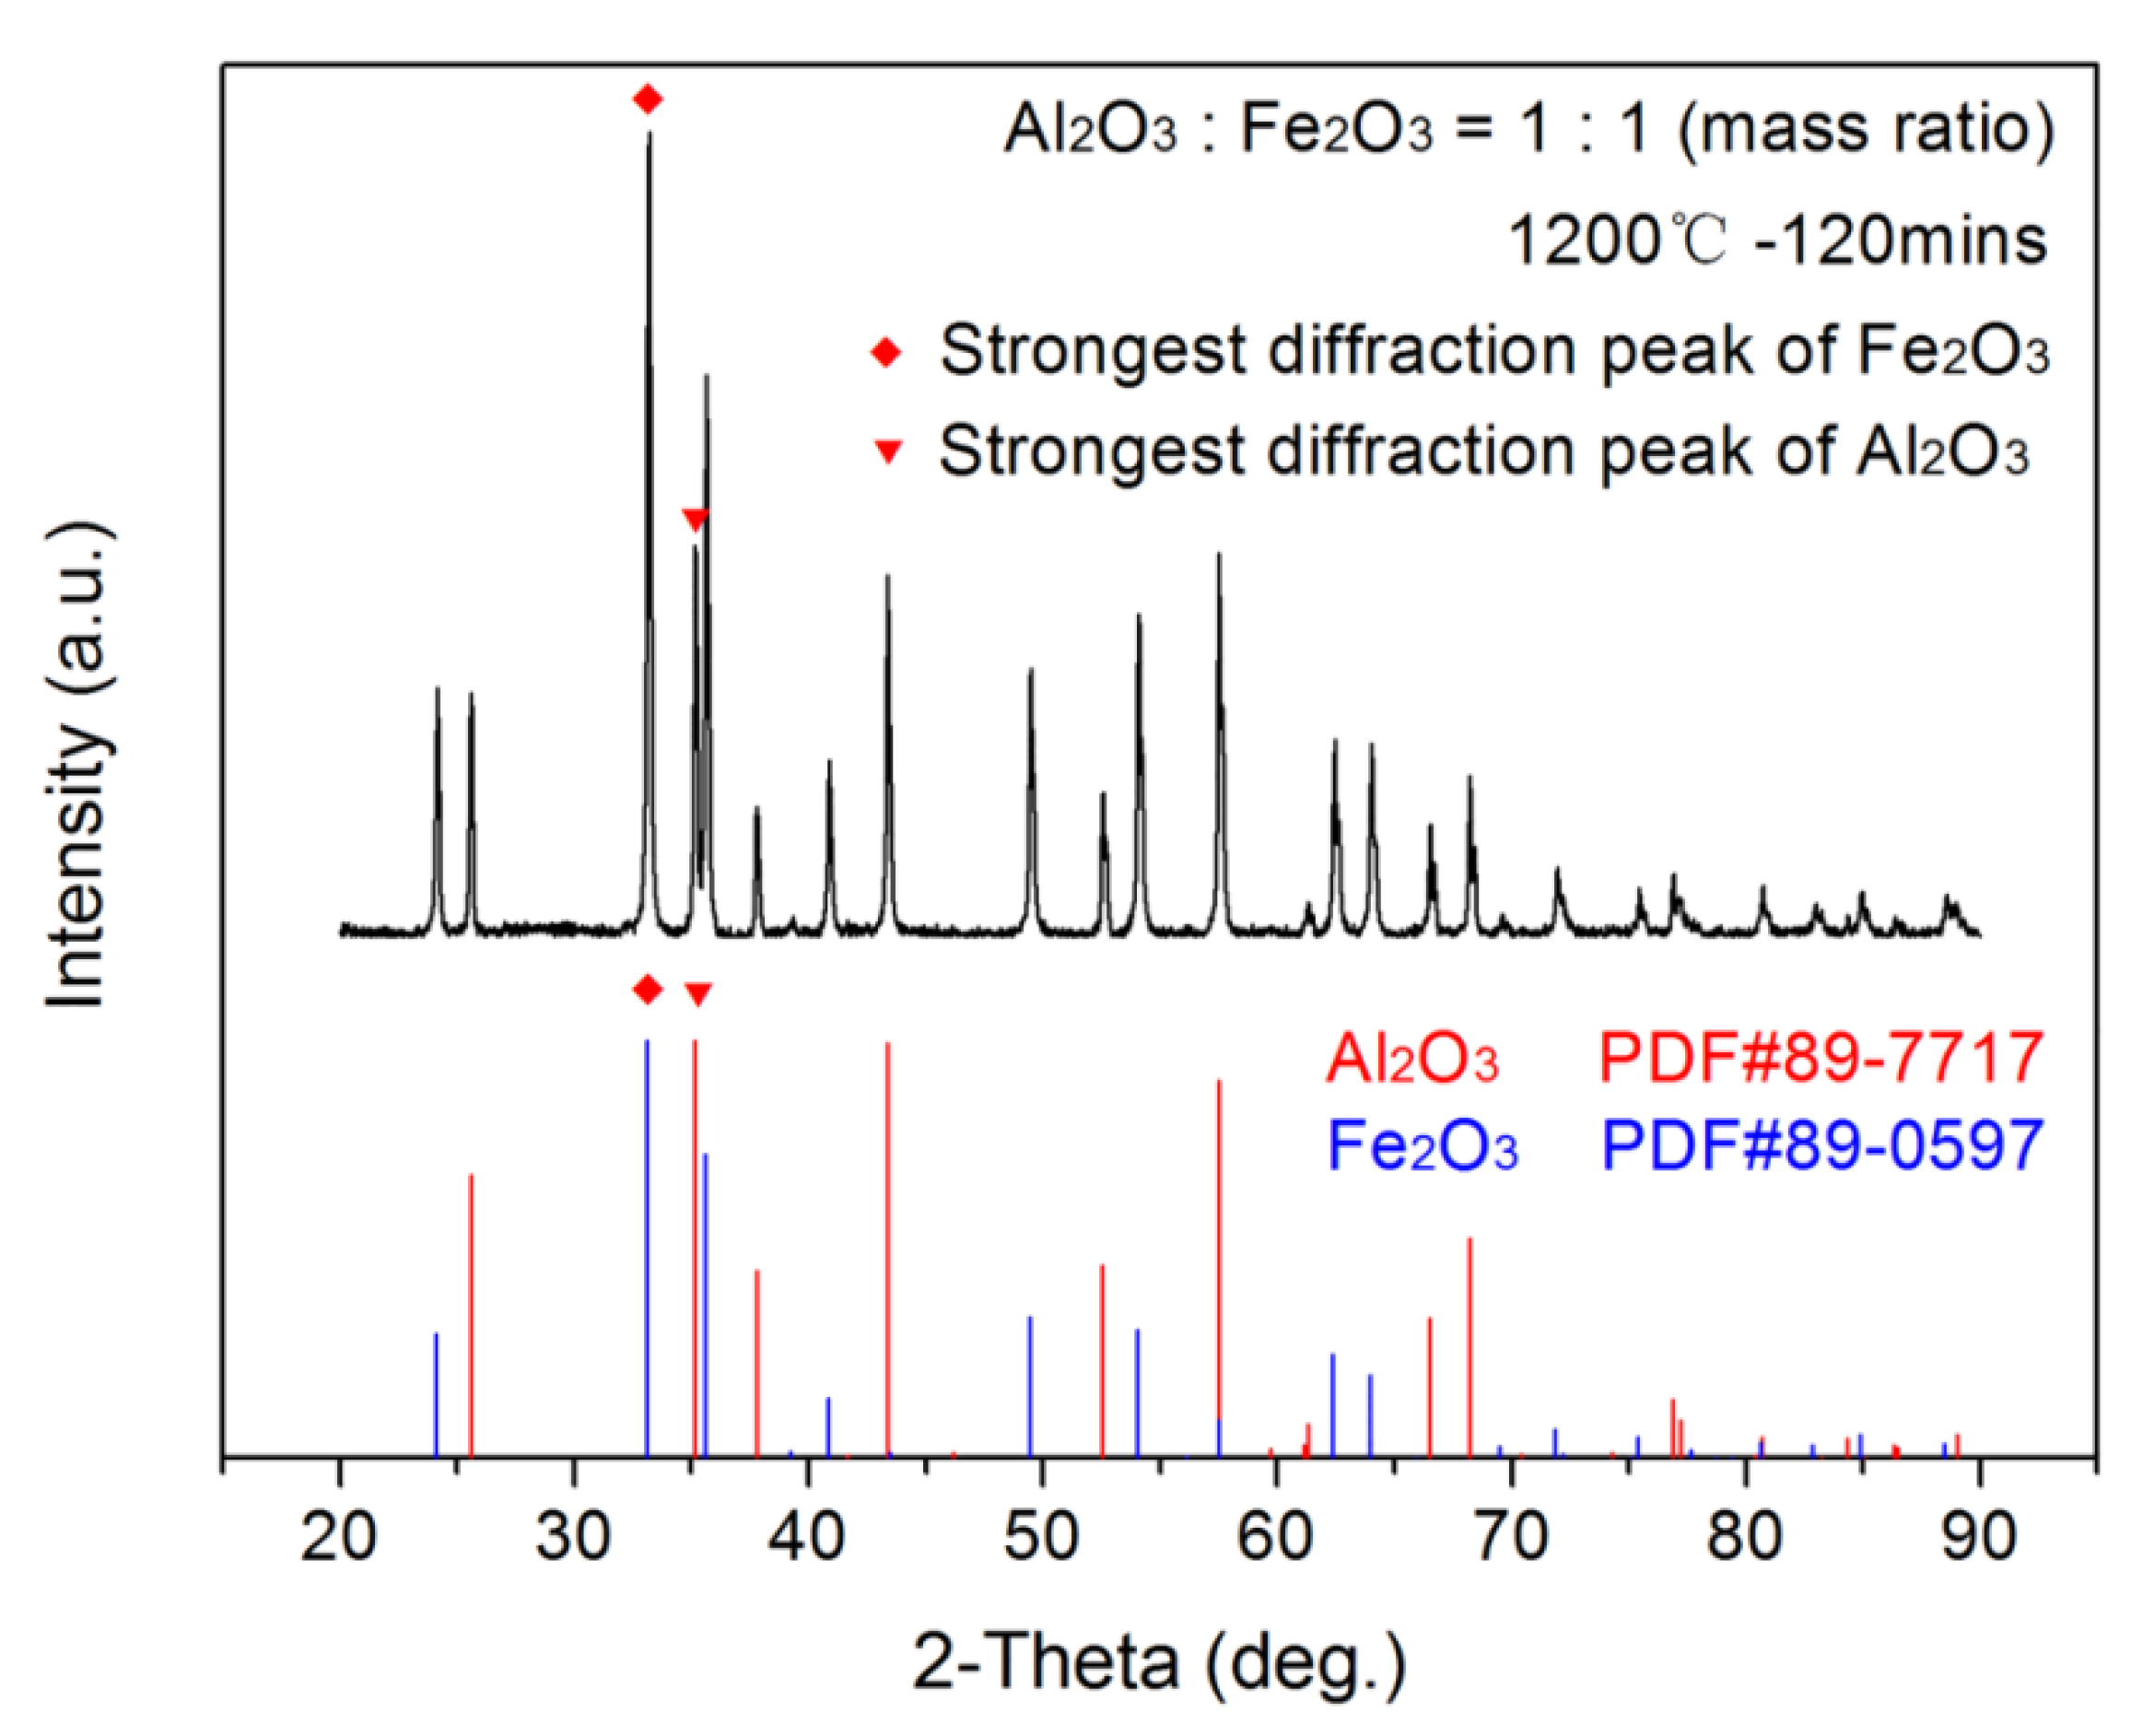
2.1.1. Synthesis and Verification of Calcium Ferrite

All of the analytical reagents (chemical purity > 99.5%) used in this study, including calcium carbonate (CaCO3), ferric oxide (Fe2O3), silicon dioxide (SiO2) and aluminum oxide (Al2O3), were purchased from an e-commerce supplier. After being fully dried in a drying oven for 6 h at 80 °C and sifted through a 200 mesh sieve (75 μm), sufficient quantities of CaCO3 and Fe2O3 were weighed to obtain a mole ratio of 1:1 using an electronic scale. Then, they were stirred together clockwise with a glass rod for 30 min and thoroughly blended in an agate crucible for 2 h. Next, moderate deionized water was added to the raw materials and acted as an adhesive. A cylindrical mold was filled with 10 g of this powder and compression molding proceeded with a briquetting machine at a holding pressure of 5 MPa for 1 min. The cake-shaped samples (approximately 9 mm in height and 22 mm in diameter) were fully dried in a drying oven for 12 h at 80 °C and prepared for sintering. Groups of five samples were placed in a 100 cm2 corundum crucible, as shown in Figure 1a, and sintered in a high-temperature box furnace in air according to the sintering schedule. As shown in Figure 1b, the temperature in the furnace rose from ambient temperature to 1200 °C at a rate of 5 °C/min, during which the temperature remained constant for 30 min periods at 200 °C, 400 °C and 800 °C. Then the samples were slowly cooled down to ambient temperature in the furnace after being sintered for 120 min at 1200 °C in the furnace. Thus, the CF samples were synthesized for the subsequent research.
As an acknowledged method to obtain the chemical composition of a specific material, XRD was employed to verify the composition of the CF that was synthesized as previously described. One CF sample was crushed completely in an electromagnetic crusher. Then, the powder was sifted through a 325 mesh sieve (45 μm) and analyzed with an Ultima IV X-ray diffractometer made by the Rigaku Corporation of Japan (Tokyo, Japan). The Cu was used as the target material, and the diffractometer was operated at 40 kV and 40 mA, with a scanning speed of 20°/min. A comparison of the XRD patterns for the synthesized and standard CF, depicted in Figure 2, shows that their diffraction intensities, half peak widths, and peak positions coincide completely, which indicates that the CF was successfully synthesized as previously described and could be used as the raw material in the SFCA synthesis.

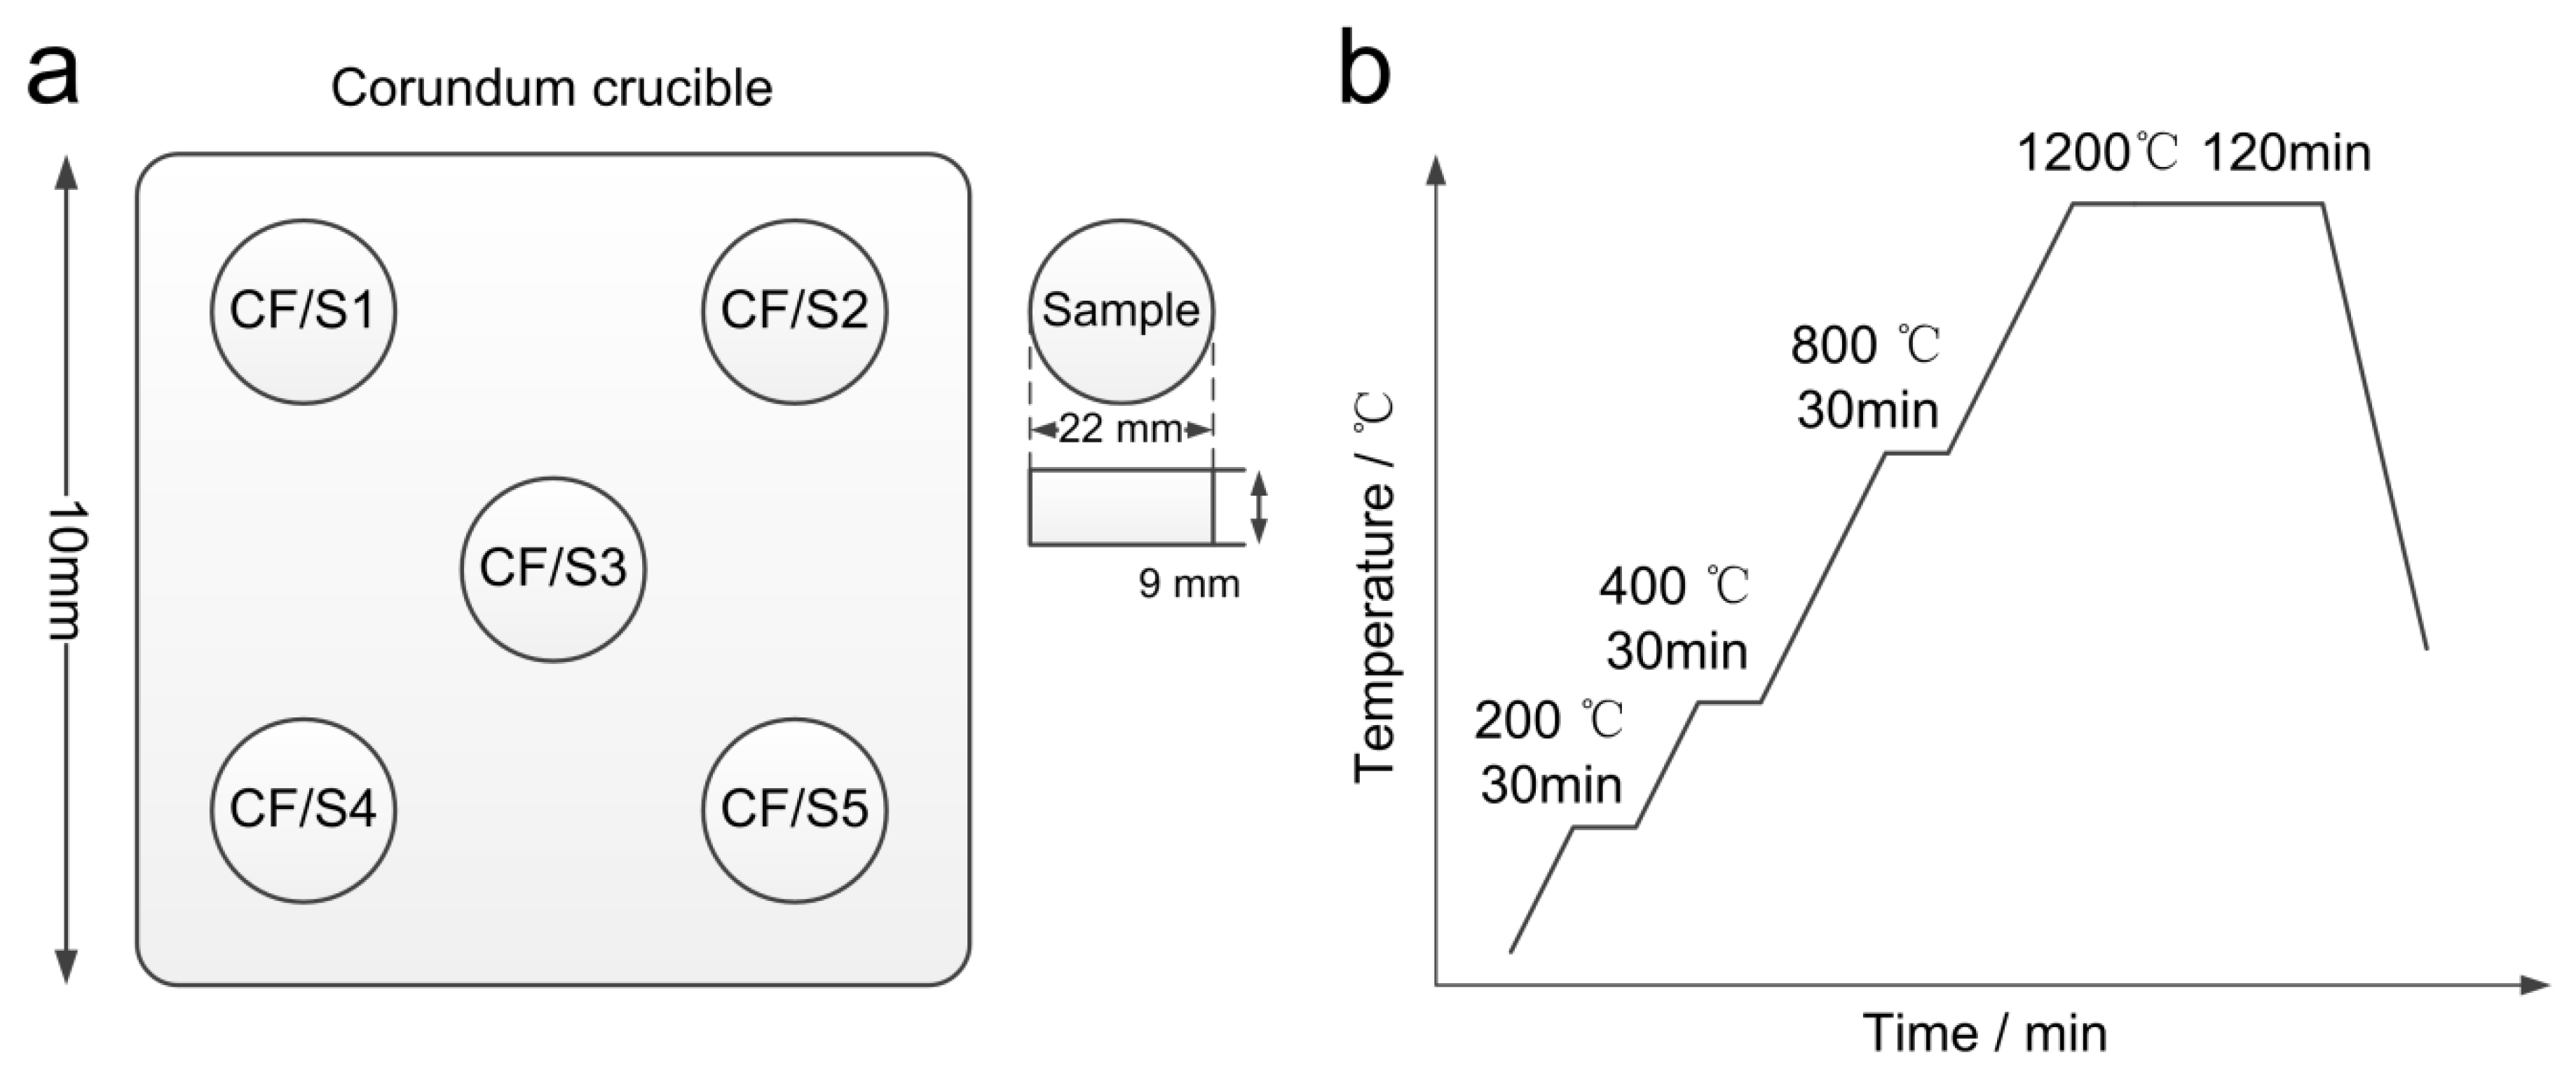
2.1.2. Synthesis of Silico-Ferrite of Calcium and Aluminum

Similarly to the procedure for the CF synthesis, the SFCA samples were synthesized through weighing, blending, molding, and sintering. The composition ratios of the raw materials for the SFCA samples, which are listed from S1 to S5 in Table 1, were based on the work of Xue [15]. The proportions of Fe2O3 and Al2O3 changed with changes in the n(Al2O3)/n(Fe2O3) value, the molar ratio of Al2O3 to Fe2O3, while the mass ratio of CF and SiO2 remained constant. The CF samples obtained as described in Section 2.1.1 were crushed and sifted completely through a 200 mesh sieve before being mixed in the raw materials for the SFCA samples, as were the Fe2O3, Al2O3, and SiO2. Note that the sintering schedule used here was the same as that used in the CF synthesis.

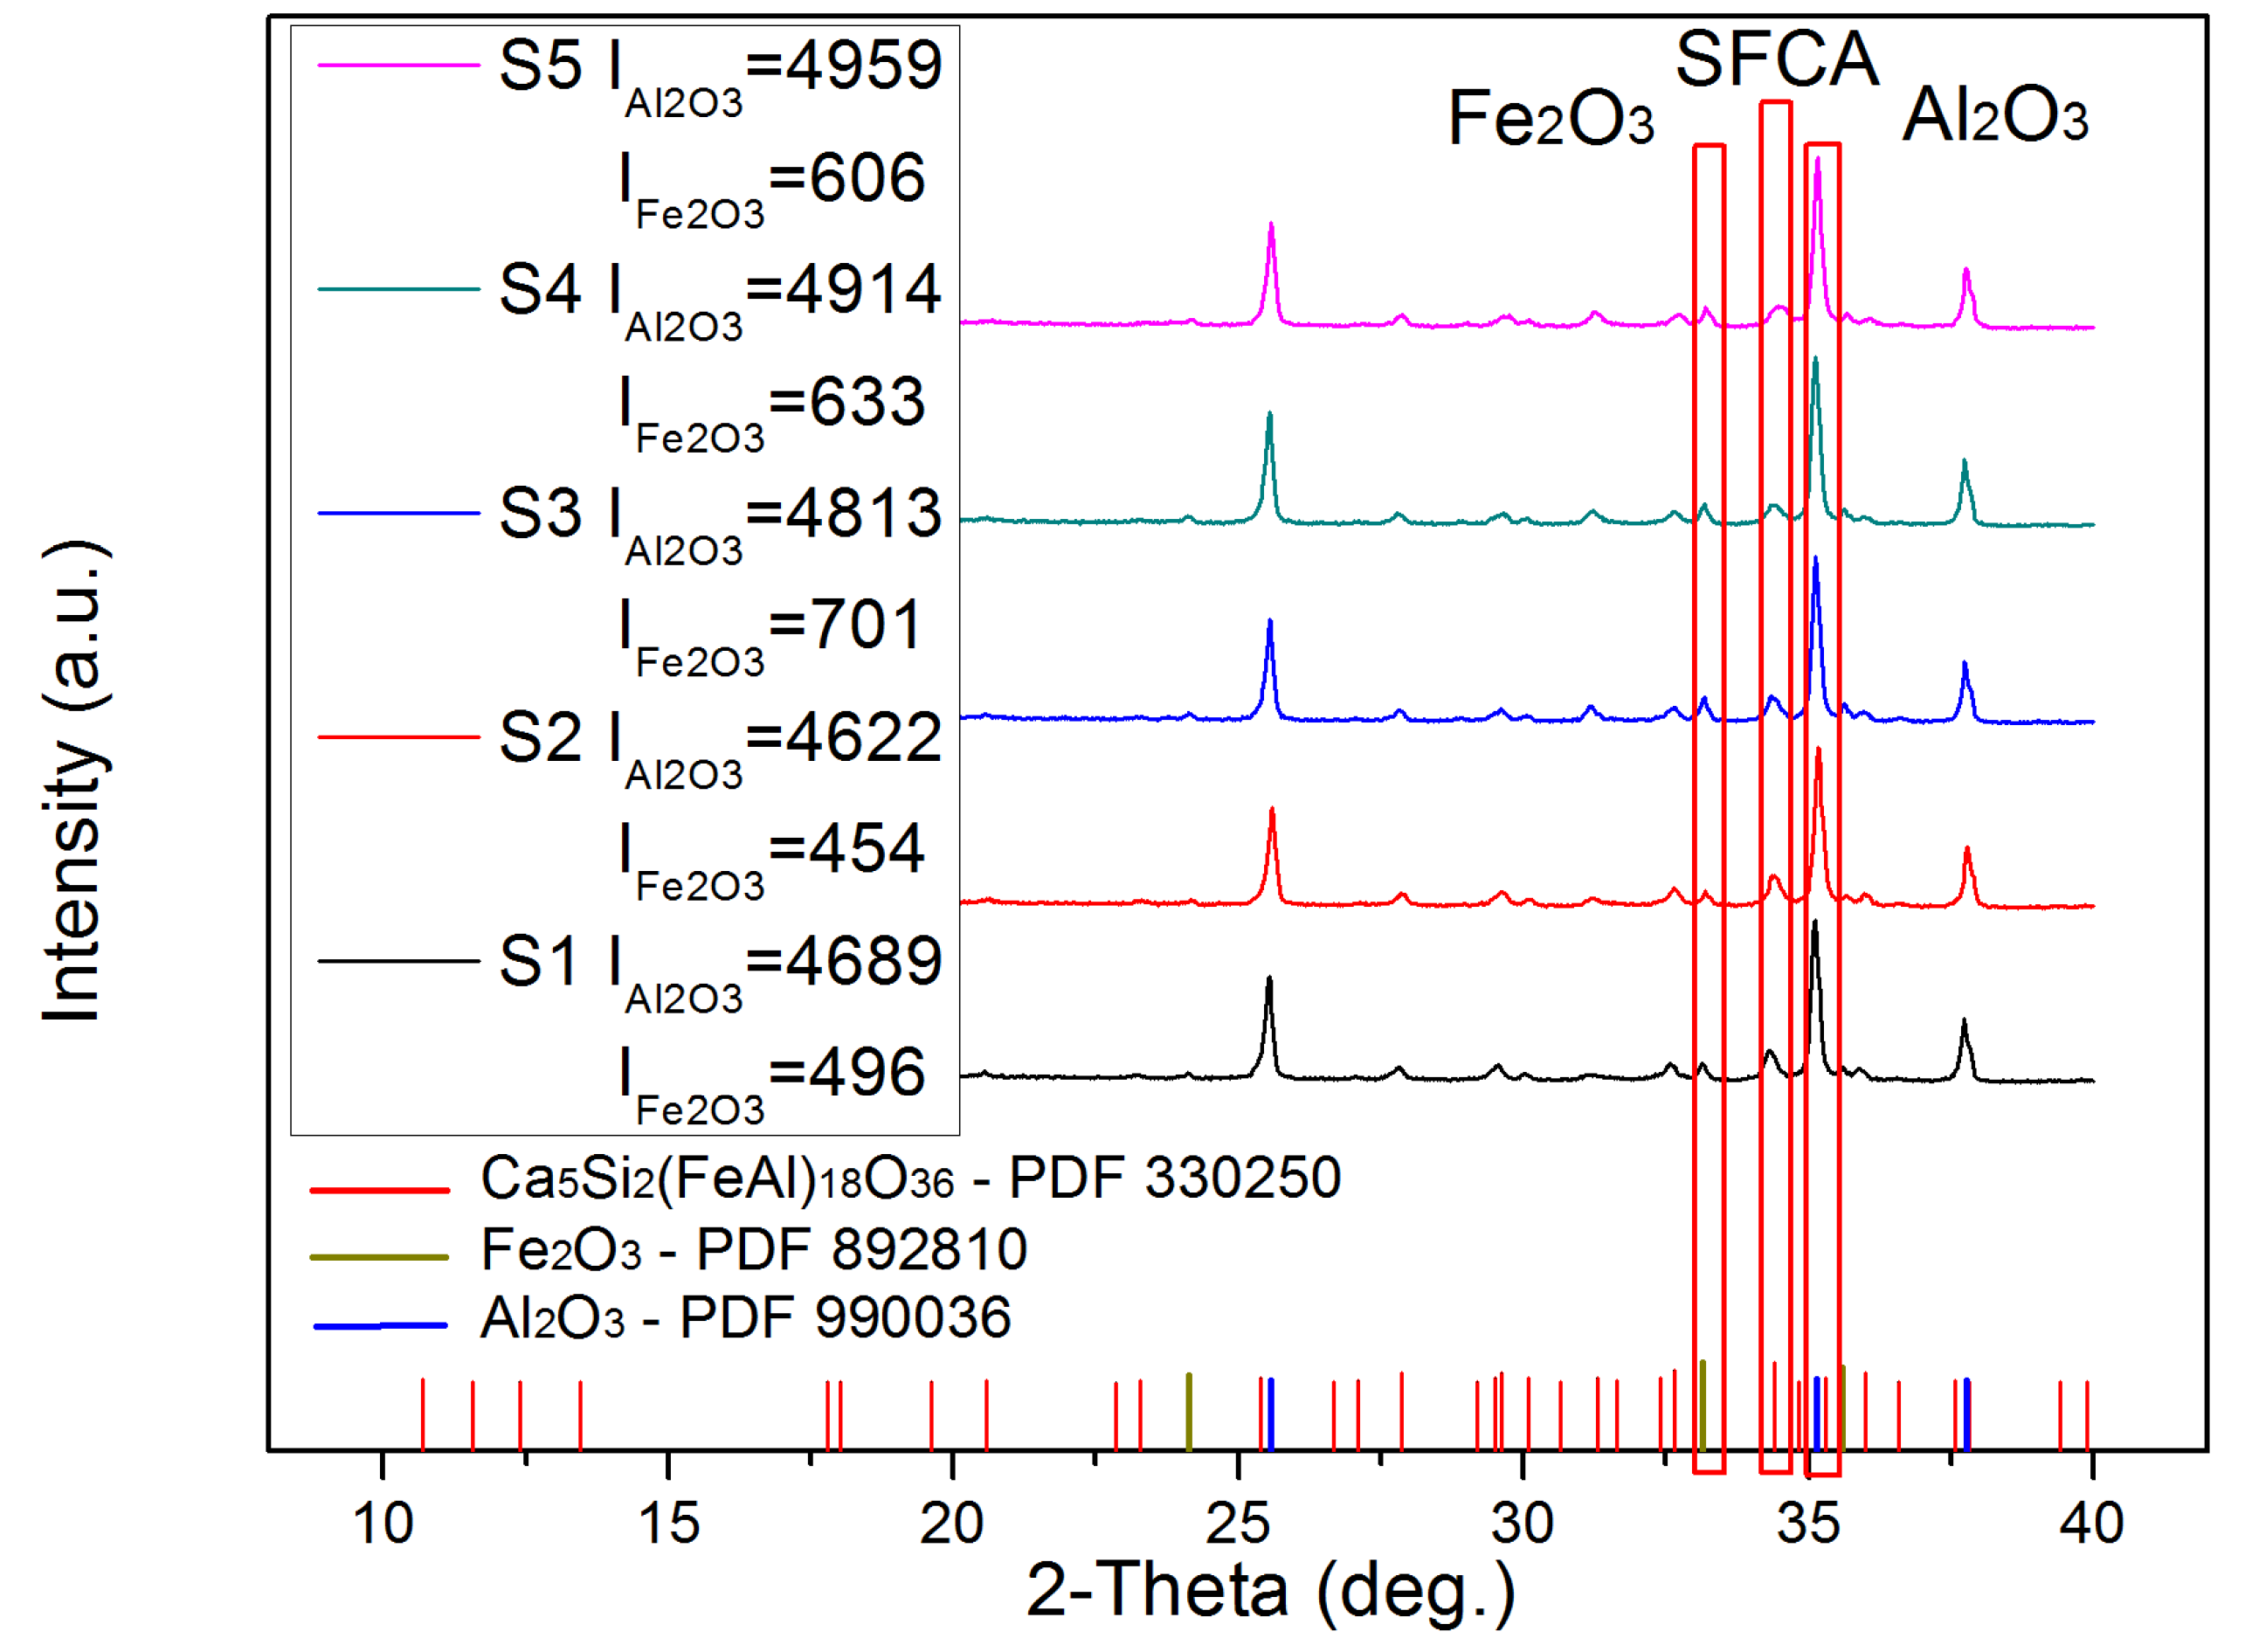
2.2. Semi-Quantitative Analysis of X-ray Diffraction

To obtain the mass fractions of the pure SFCA phase in samples S1–S5, the semi-quantitative K-value method based on XRD analysis, proposed by Frank H. Chung in 1974 [16], was introduced. In this study, corundum (α-Al2O3) was selected as the calibration compound and mixed well with Fe2O3 at a mass ratio of 1:1 for the XRD analysis. The ratio of the strongest peak intensity of Fe2O3 to that of α-Al2O3 was defined as the K-value. Then, the crushed and sifted samples (S1–S5) were mixed with α-Al2O3 at equivalent known quantities. The equations for the SFCA content calculation are as
I Fe 2 O 3 I Al 2 O 3 = K Al 2 O 3 Fe 2 O 3 ω Fe 2 O 3 ω Al 2 O 3
ω Fe 2 O 3 = ω Fe 2 O 3 1 ω Al 2 O 3
ω SFCA = 1 ω Fe 2 O 3
where K Al 2 O 3 Fe 2 O 3 is the K-value mentioned above; I represents the strongest peak intensity of the corresponding compound; and ω and ω' represent the mass ratio of the corresponding compound in S1–S5 and the mixtures, respectively. Thus, the mass ratio of the pure SFCA in samples S1–S5 could be obtained.

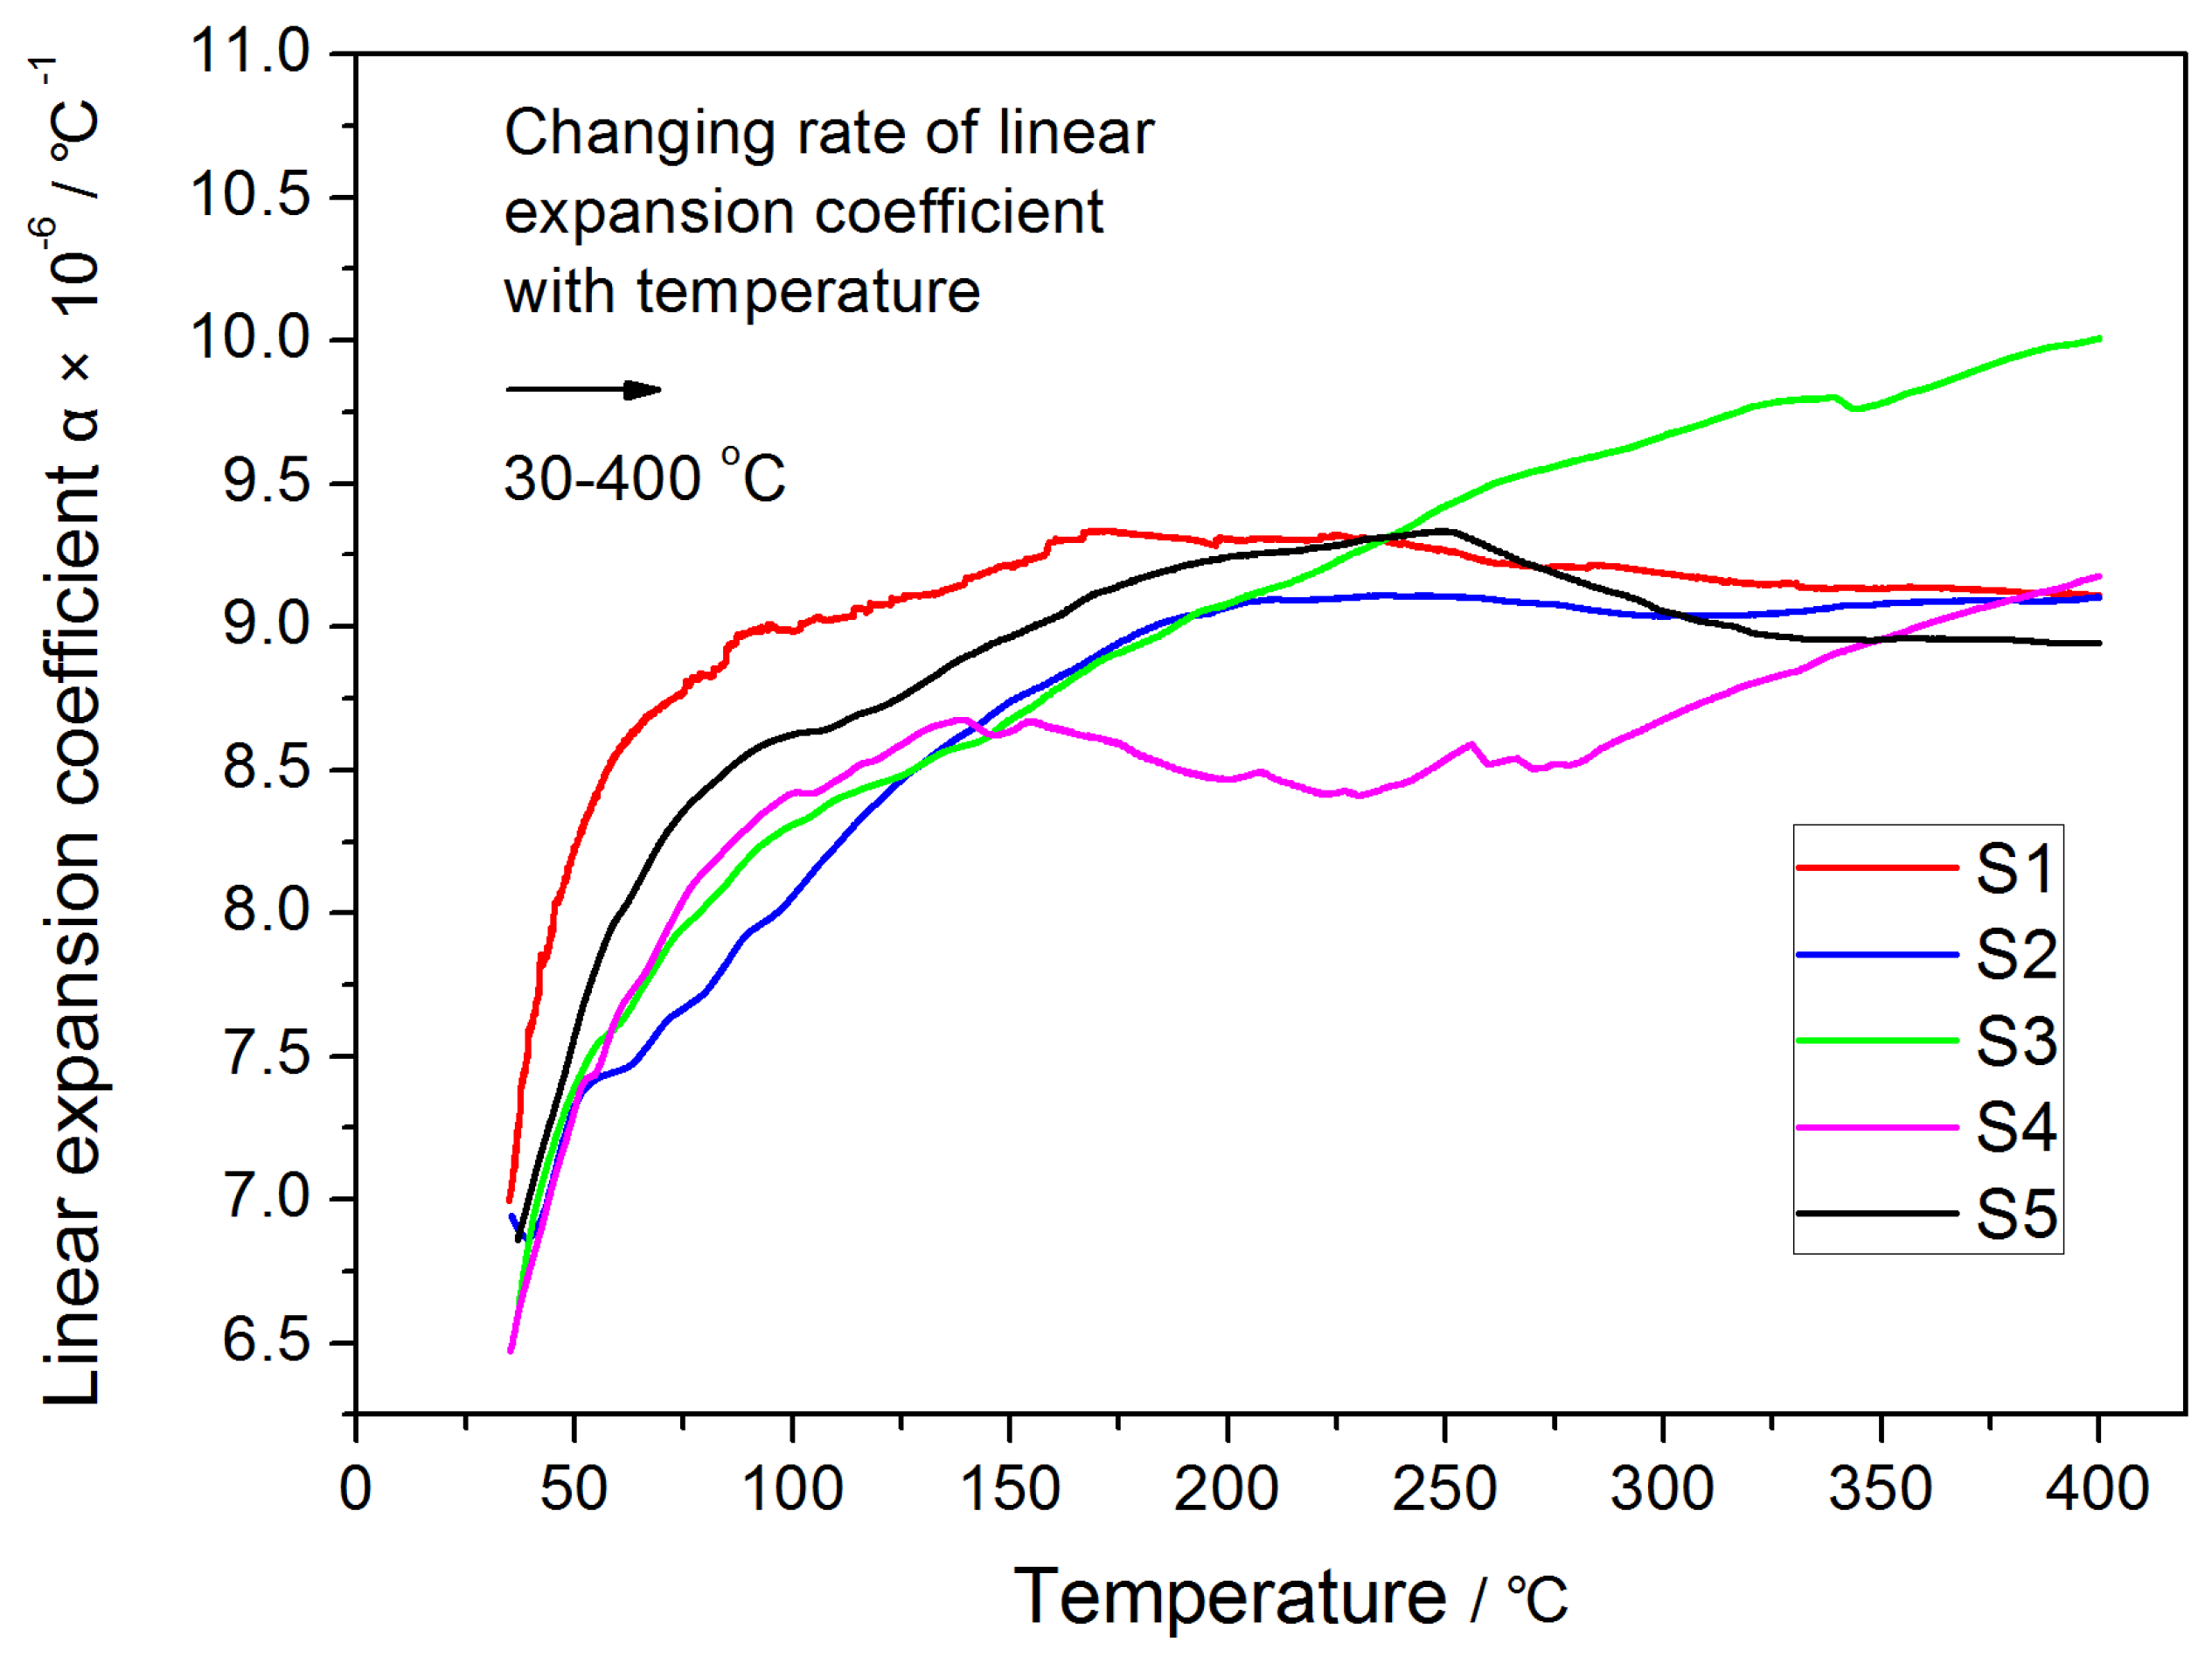
2.3. Test of Linear Expansion Coefficient

The linear expansion coefficients (LECs) of samples S1–S5 from 30 to 400 °C were measured with the NETZSCH DIL 402SE made by the NETZSCH Group of Germany (Selb, Germany). The samples S1–S5 were prepared as described in Section 2.1.2 in a strip-shaped mold for the test, as shown in Figure 3. After one of the samples was fixed in the chamber, the following parameters should be input to the machine: the number of sample, the length of sample, the range of temperature, and the heating rate. The rest of the parameters remained at their default. Then the thermal expansion instrument was started to obtain the LEC of each sample from 30 to 400 °C.

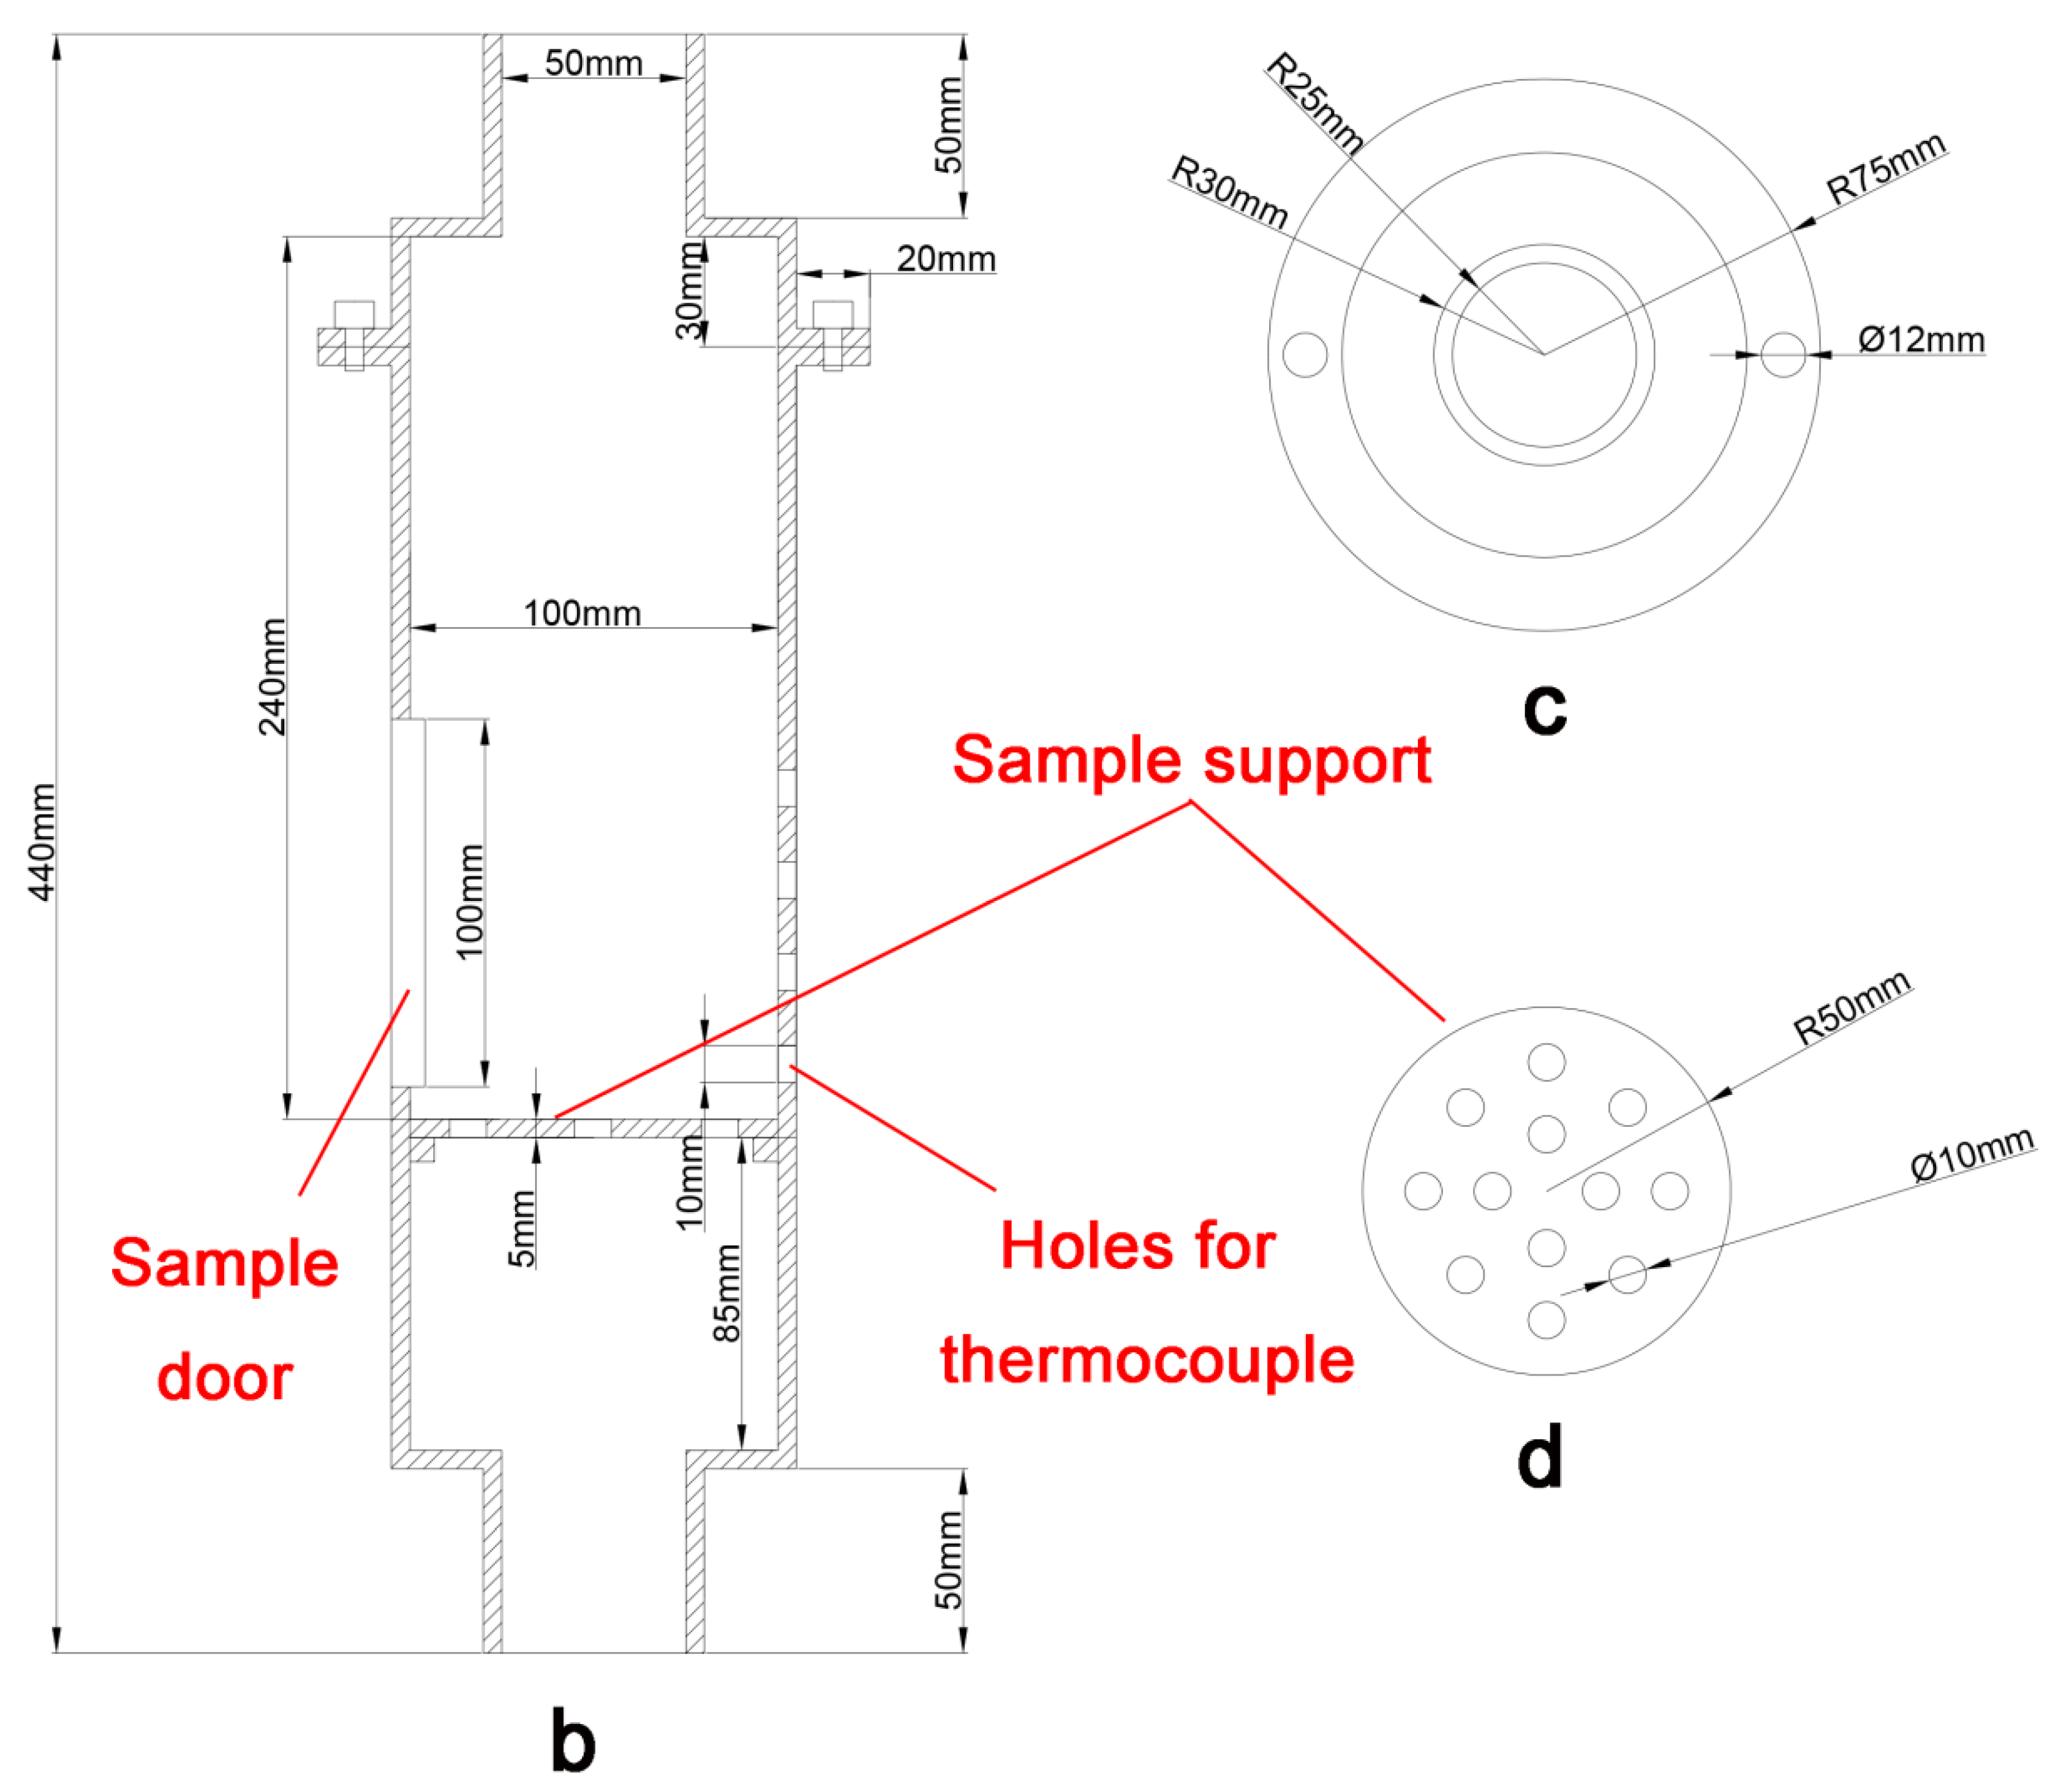
2.4. Test of Cooling and Compressive Strength

Just like the cooling process for an iron ore sinter in a steel plant, samples S1–S5 were cooled down to 800 °C in the furnace after being held at 1200 °C for 120 min. After that, five different cooling methods, classified as (I) cooling in water, (II) cooling in forced air, (III) cooling in air, (IV) cooling in the furnace, and (V) vertical tank cooling, were used to cool the samples down from 800 °C to ambient temperature, as listed in Table 2.
(I) Cooling in water: a fast cooling method for an extreme case was tested first. After 800 °C, samples S1–S5 were poured into a barrel with 5 L of water at ambient temperature. They were removed after 3 min and dried in an oven for 6 h.
(II) Cooling in forced air: after 800 °C, samples S1–S5 were moved into a vertical tank and cooled with forced air at 30 m3/h in 1 atm and 20 °C using a homemade cooling device, which consisted of a blower, flowmeter, and vertical tank, as shown in Figure 4. To minimize the heat loss, the door of the tank was shut and sealed immediately after the samples were placed on a porous grate in the tank. Here, a thermocouple was used for the real-time monitoring of the surface temperatures of the samples, and the samples were removed after being cooled down to the ambient temperature.
(III) Cooling in air: after 800 °C, samples S1–S5 were removed from the furnace with a corundum crucible and exposed to the atmosphere for slow cooling until their surface temperatures dropped to the ambient temperature.
(IV) Cooling in the furnace: after 800 °C, samples S1–S5 were kept in the furnace in air until their surface temperatures dropped to the ambient temperature.
(V) Vertical tank cooling: as shown in Figure 4, a homemade vertical tank cooling device was designed to simulate a semi-industrial experiment with a vertical tank cooling process for the iron ore sinter. The surface temperatures of samples S1–S5 first dropped to 600 °C in the sealed vertical tank. Then, they were processed with forced air at 10 m3/h in 1 atm and 20 °C. The blower was stopped when the samples cooled down to 150 °C, after which they were removed from the tank and cooled down to the ambient temperature in the atmosphere.
All of the samples were subjected to a compressive strength test using an electro-hydraulic servo pressure testing machine, after being processed with the five cooling methods previously described. Some of the parameters needed to be set before the test: the sectional area of each sample was set as 380 mm2, the loading rate was set as 100 N/s, and the rest of the parameters remained default. Next, one of the samples was fixed at the center of the fixture, and then the machine was started. After the sample was completely crushed, the machine stopped automatically and the test of the next sample continued. Note that the cooling and compressive strength tests were repeated twice to ensure their accuracy.

3. Results and Discussions

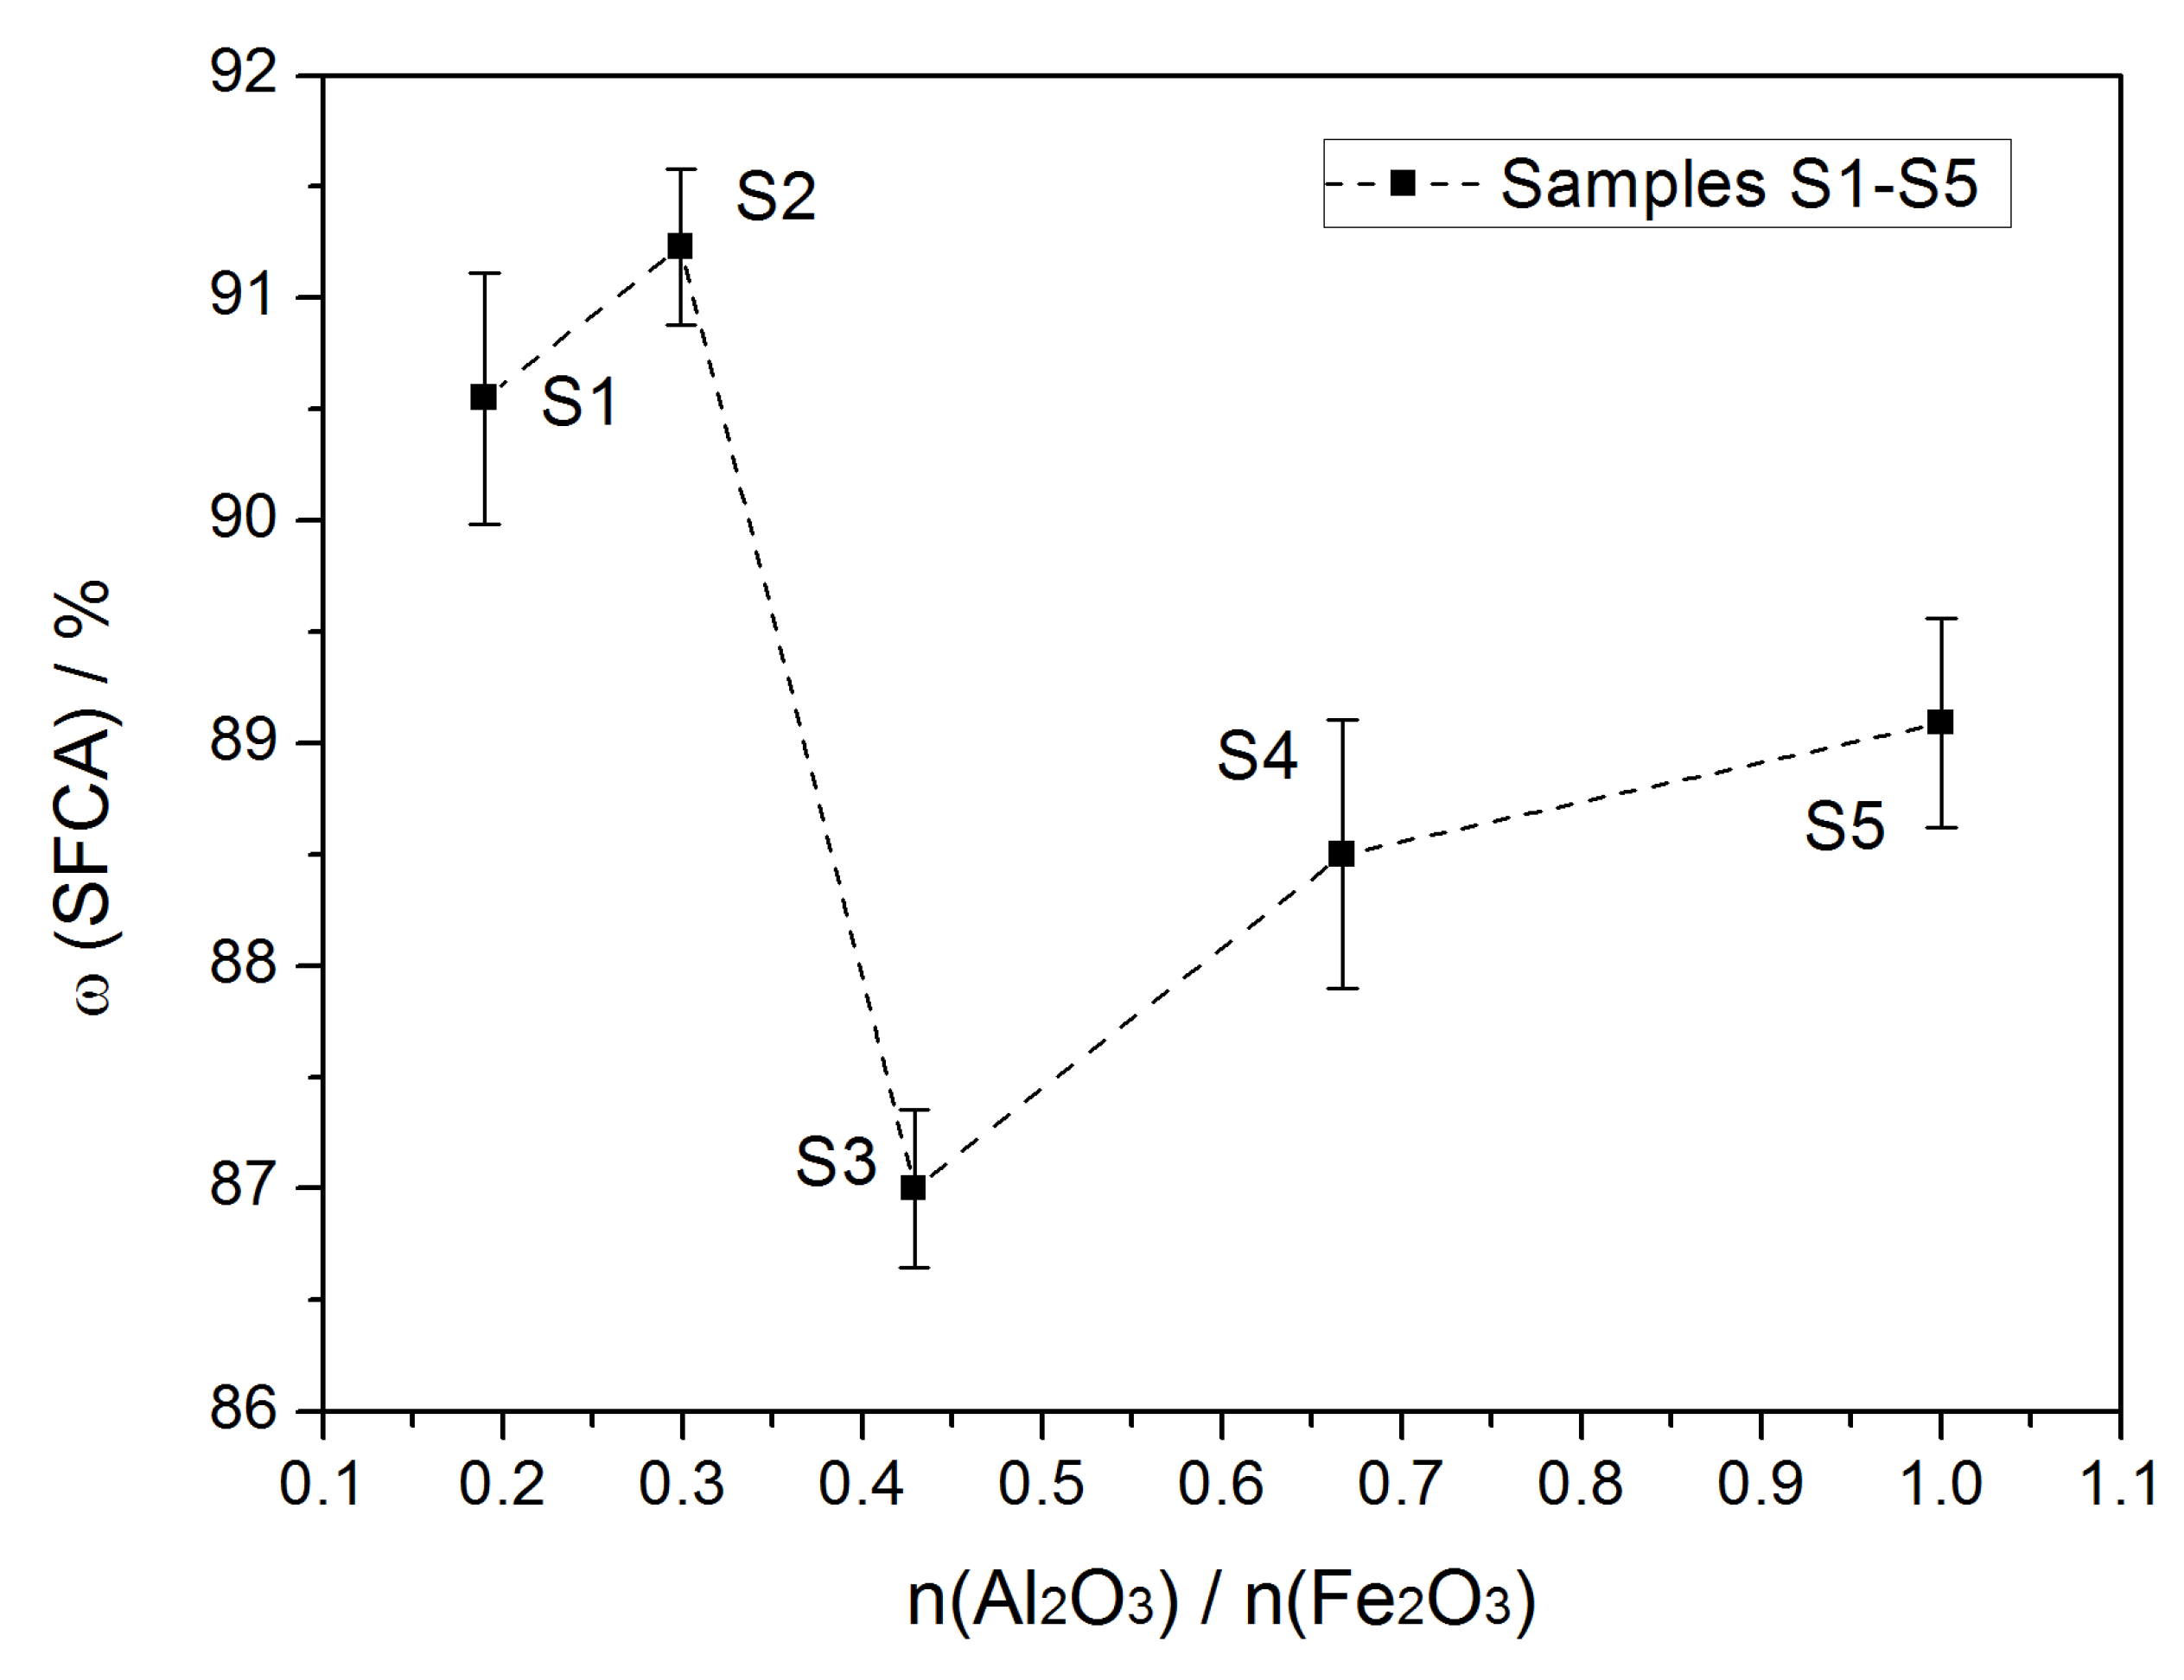
3.1. Semi-Quantitative Analysis of X-ray Diffraction

The XRD pattern of the mixture consisting of Fe2O3 and α-Al2O3 with a mass ratio of 1:1 is shown in Figure 5. The ratio of the strongest peak intensity of Fe2O3 to that of α-Al2O3 suggests that the K-value mentioned in Section 2.2 is 2.24.
The XRD patterns of samples S1–S5, mixed with equivalent known quantities of α-Al2O3, are shown in Figure 6. The relative peak intensities of Fe2O3 and α-Al2O3 were measured with the software MDI Jade version 6.1 developed by the Materials Data, Inc. (Livermore, CA, USA) [17]. Therefore, the mass ratios of the SFCA in samples S1–S5, averaging two repeated test results, are listed in Table 3, and the relationship between the n(Al2O3)/n(Fe2O3) value and the mass ratios are shown in Figure 7. As can be seen, there was a maximum of 91.23% and minimum of 86.70% in S2 and S3, respectively, with increases occurring from S1 to S2 and from S3 to S4, and a stable trend occurring for samples S4 and S5.

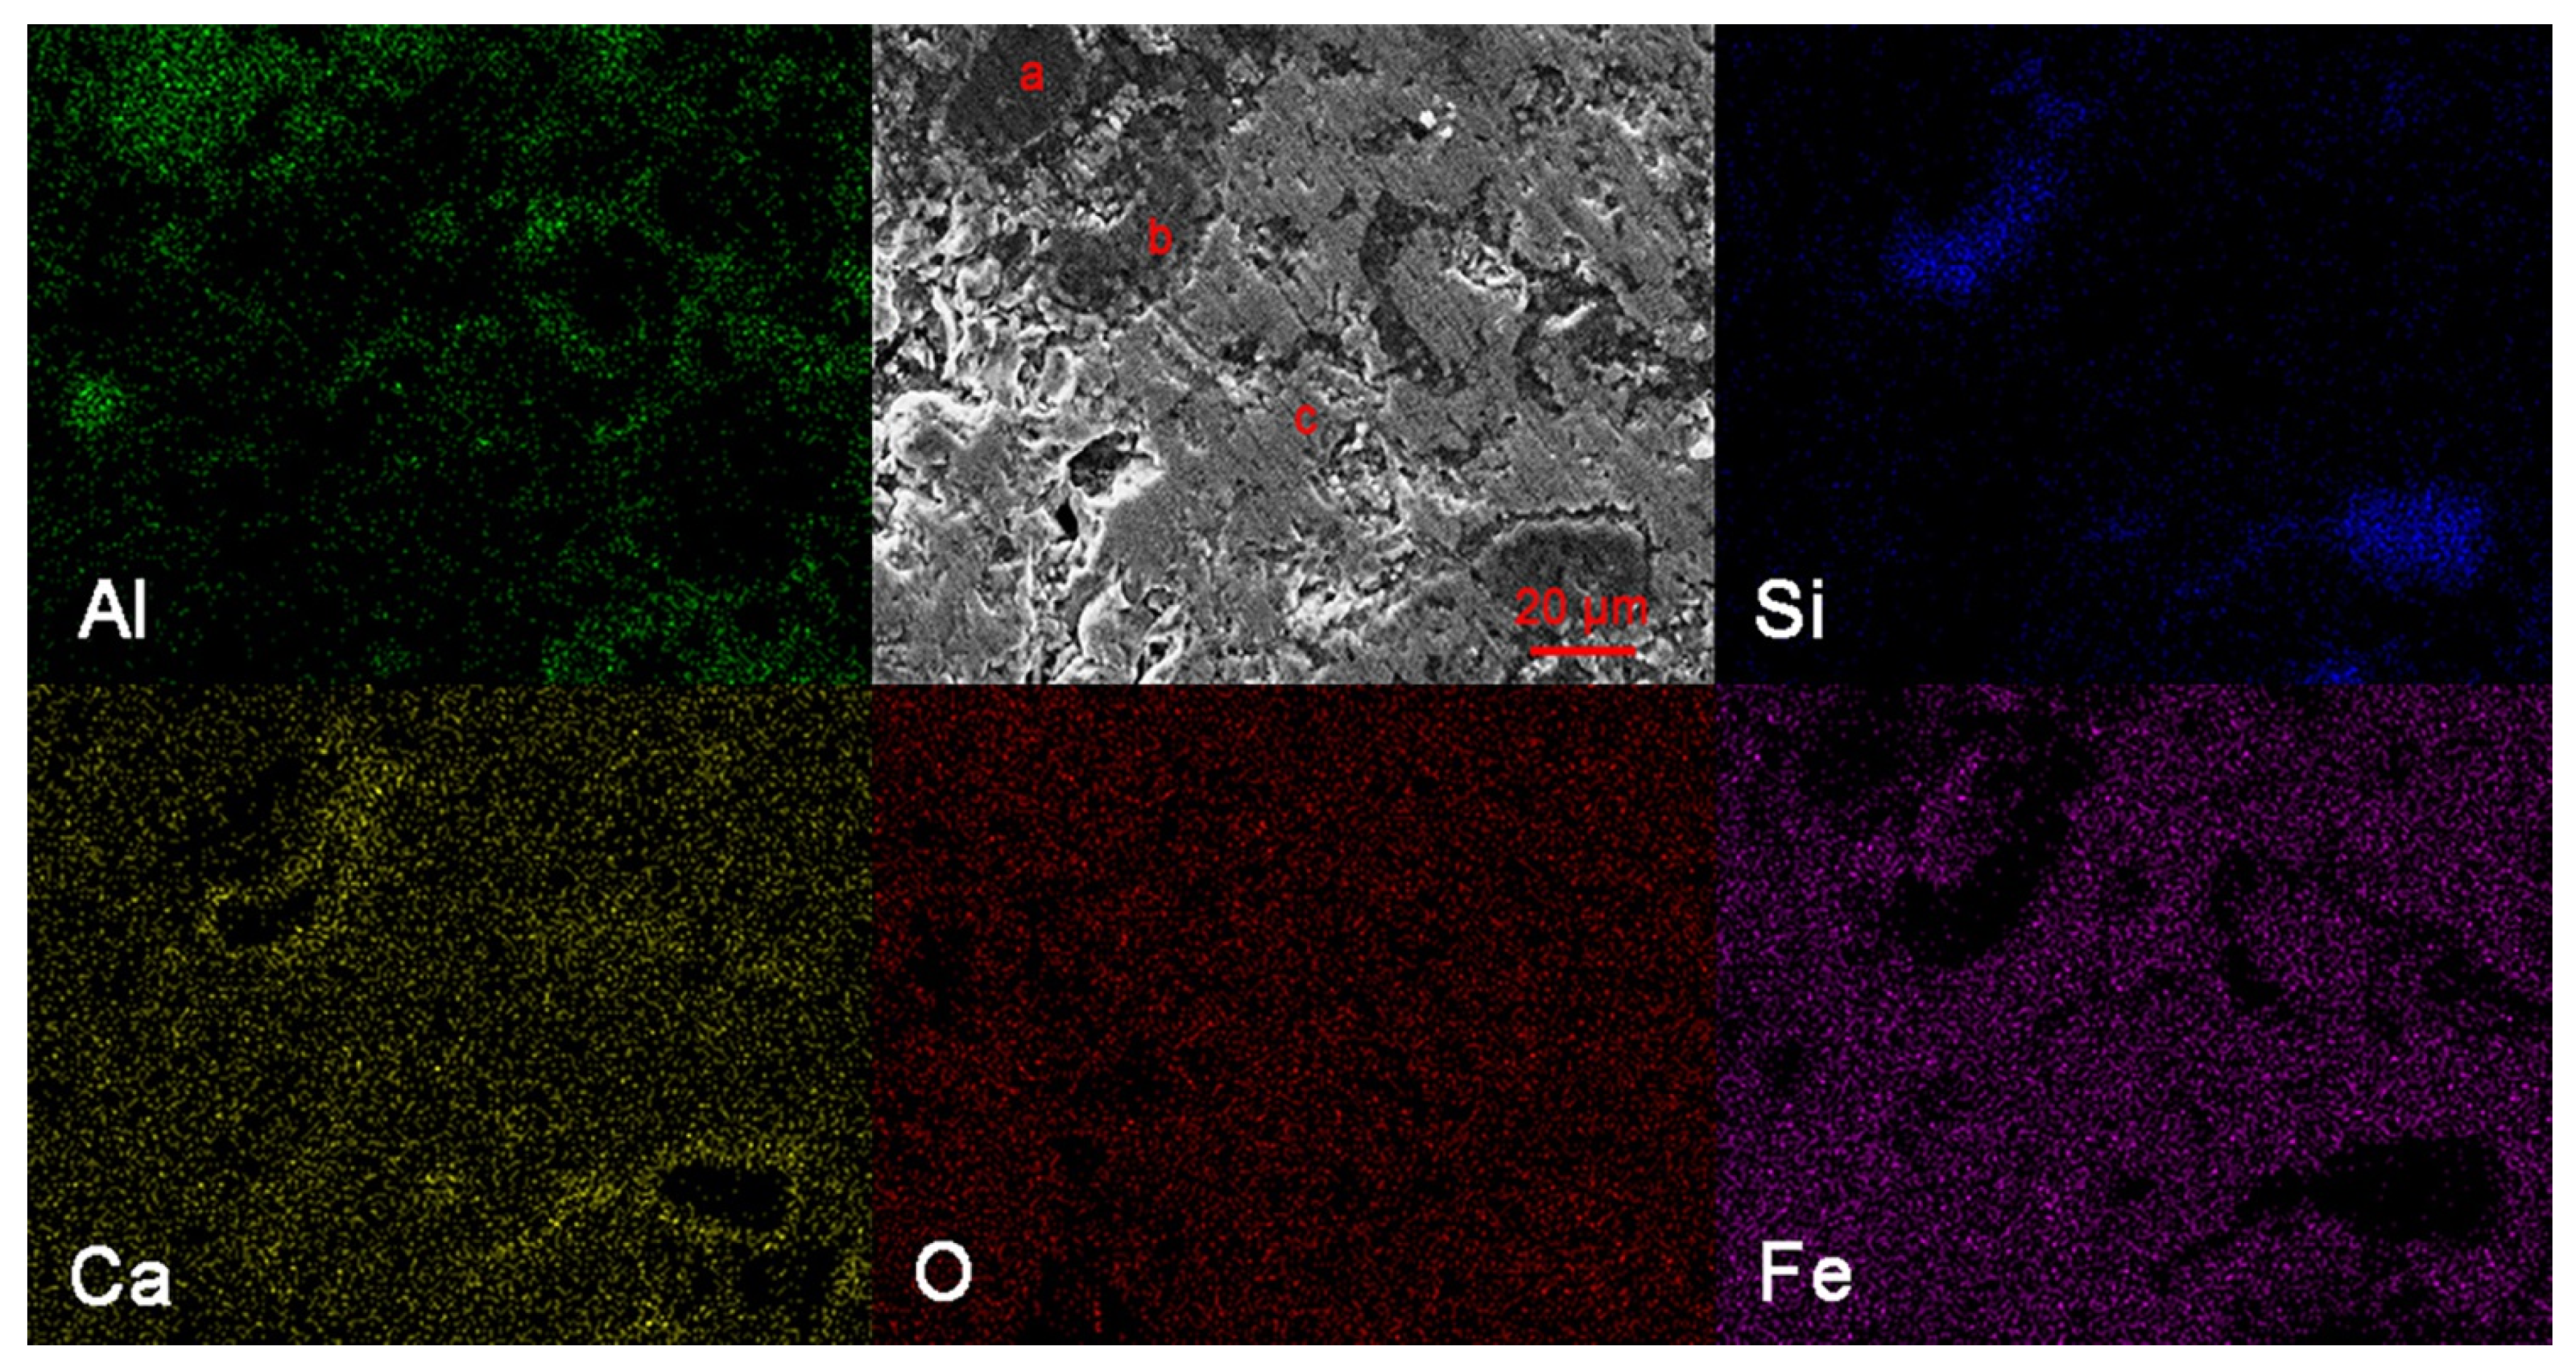
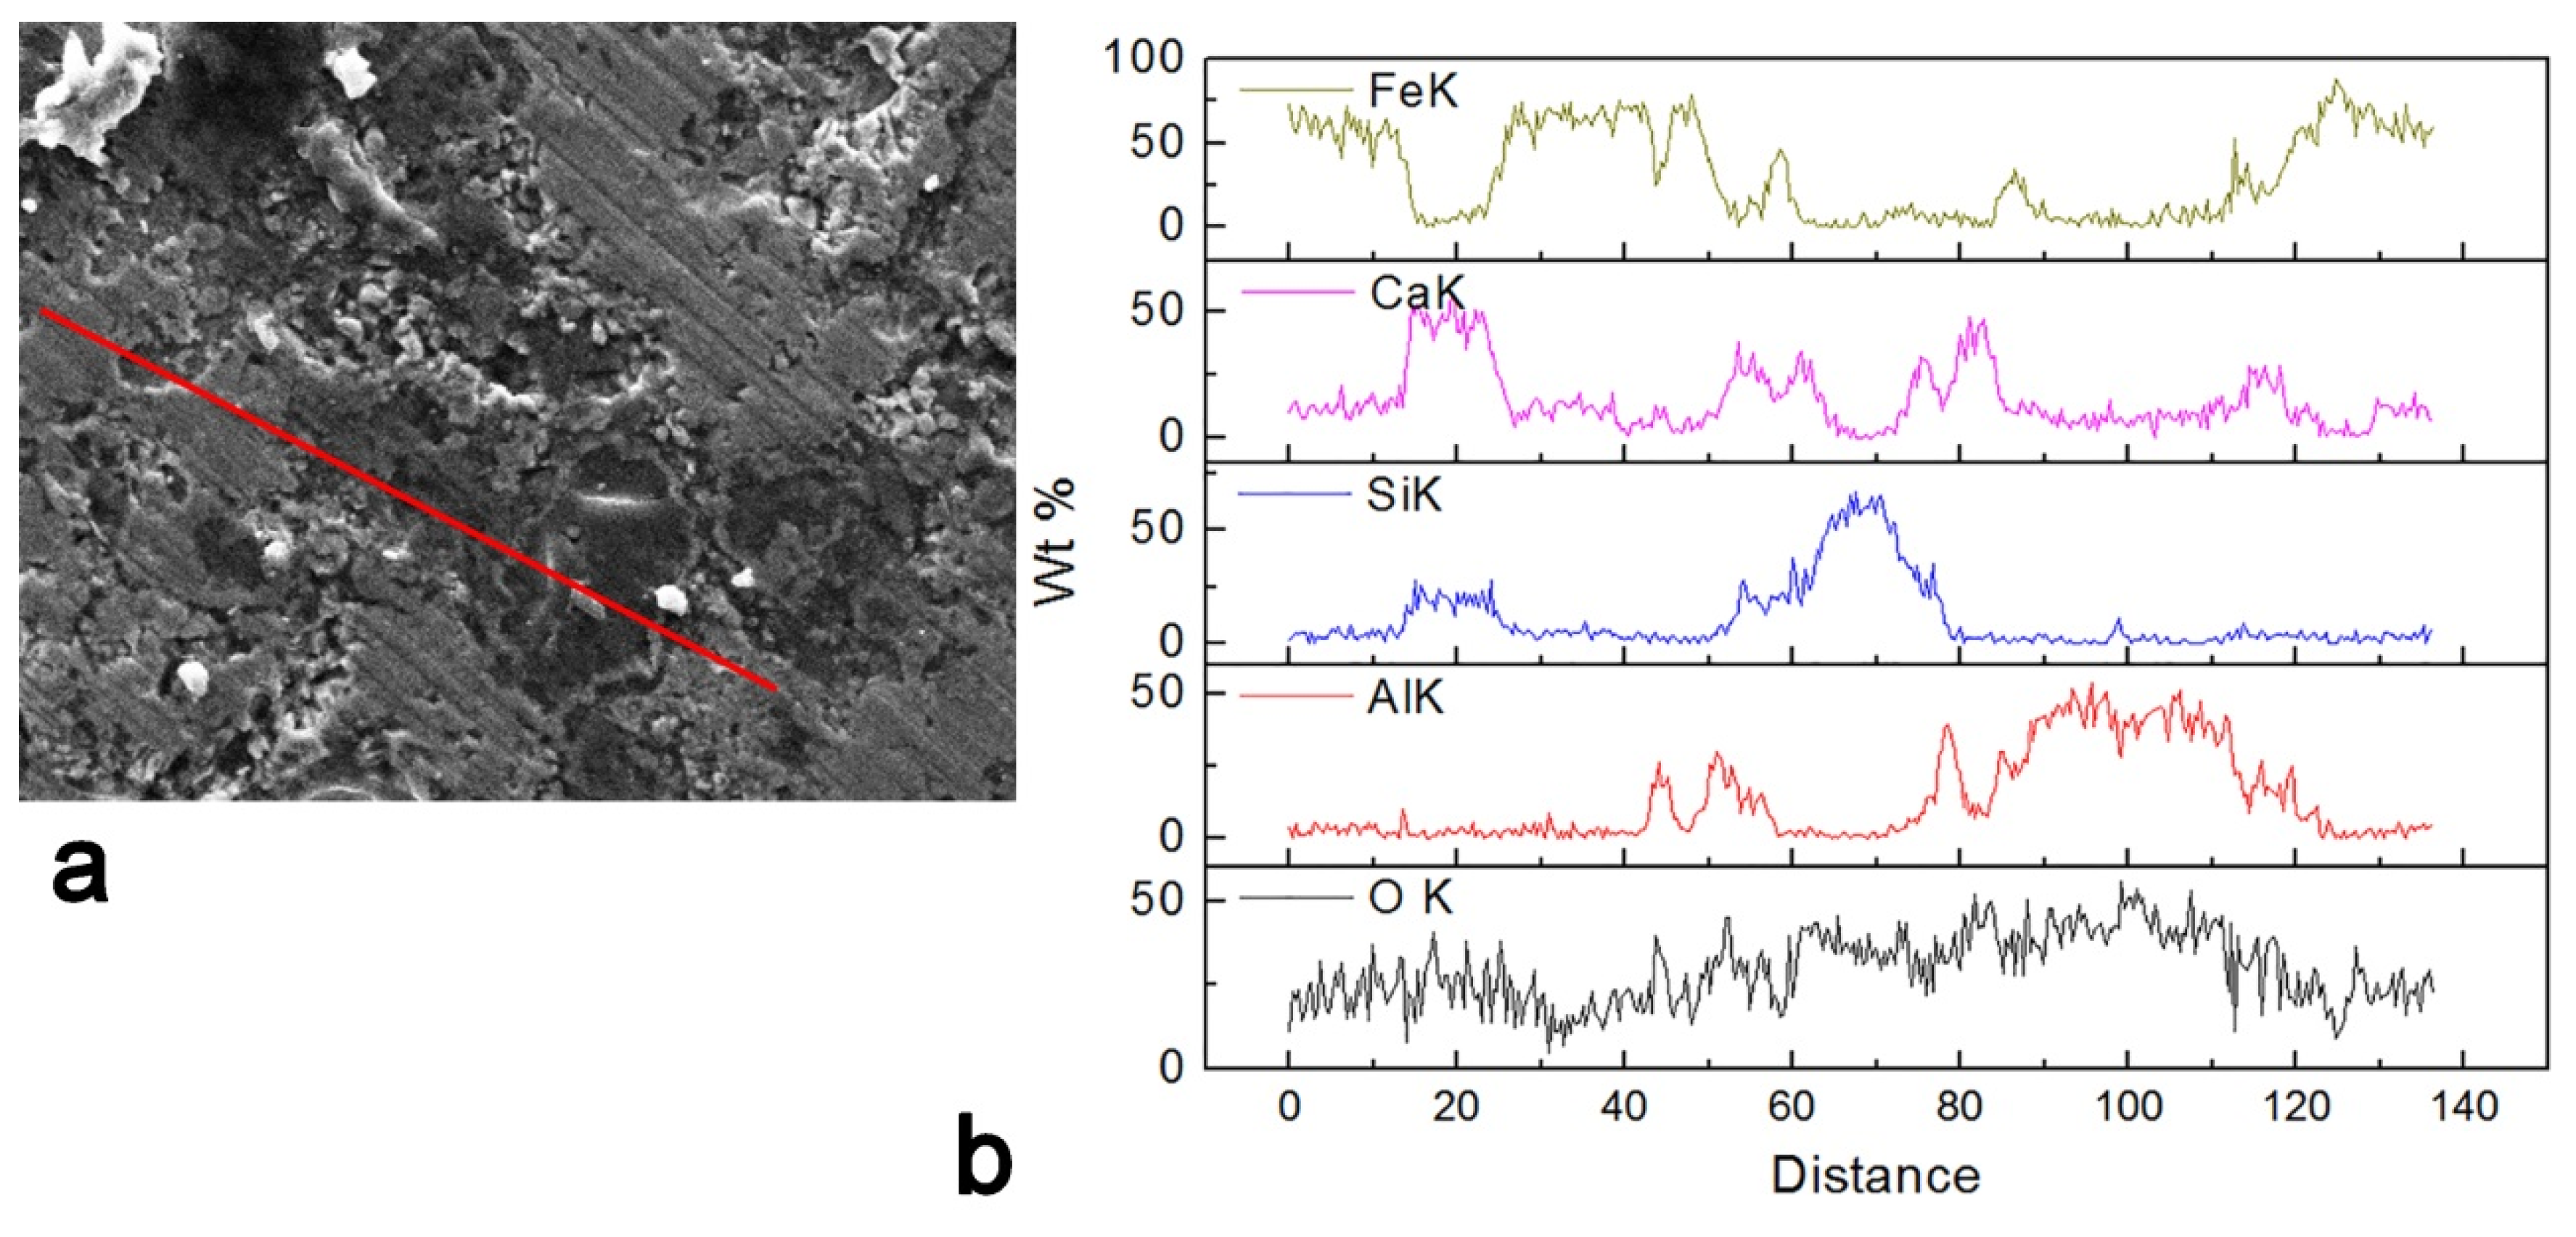
3.2. Scanning Electron Microscope and Energy Dispersive Spectrometer Analyses

The SFCA morphologies obtained using a scanning electron microscope (SEM) with back scattered electron imaging (BSE) for samples S1–S5 are shown in Figure 8. To obtain the phase compositions of the samples, the SEM morphologies with the corresponding EDS analysis results for the line and map scanning of sample S2 are shown in Figure 9 and Figure 10. The element analysis results for points a, b, and c in Figure 9 are listed in Table 4. The enrichment of the element Ca around the SiO2 contributed to the formation of CaSiO3. The dark gray Al2O3 particles are larger than those of the SiO2, and the gaps between phases are obvious. Further, the grayish white or bright white phases are CF, mixed with a small amount of the incompletely reacted Fe2O3. Generally, SFCA is a kind of solid solution cooled down from high-temperature liquid CF with dissolved Al2O3 and SiO2, which accounts for most of the entire sample.

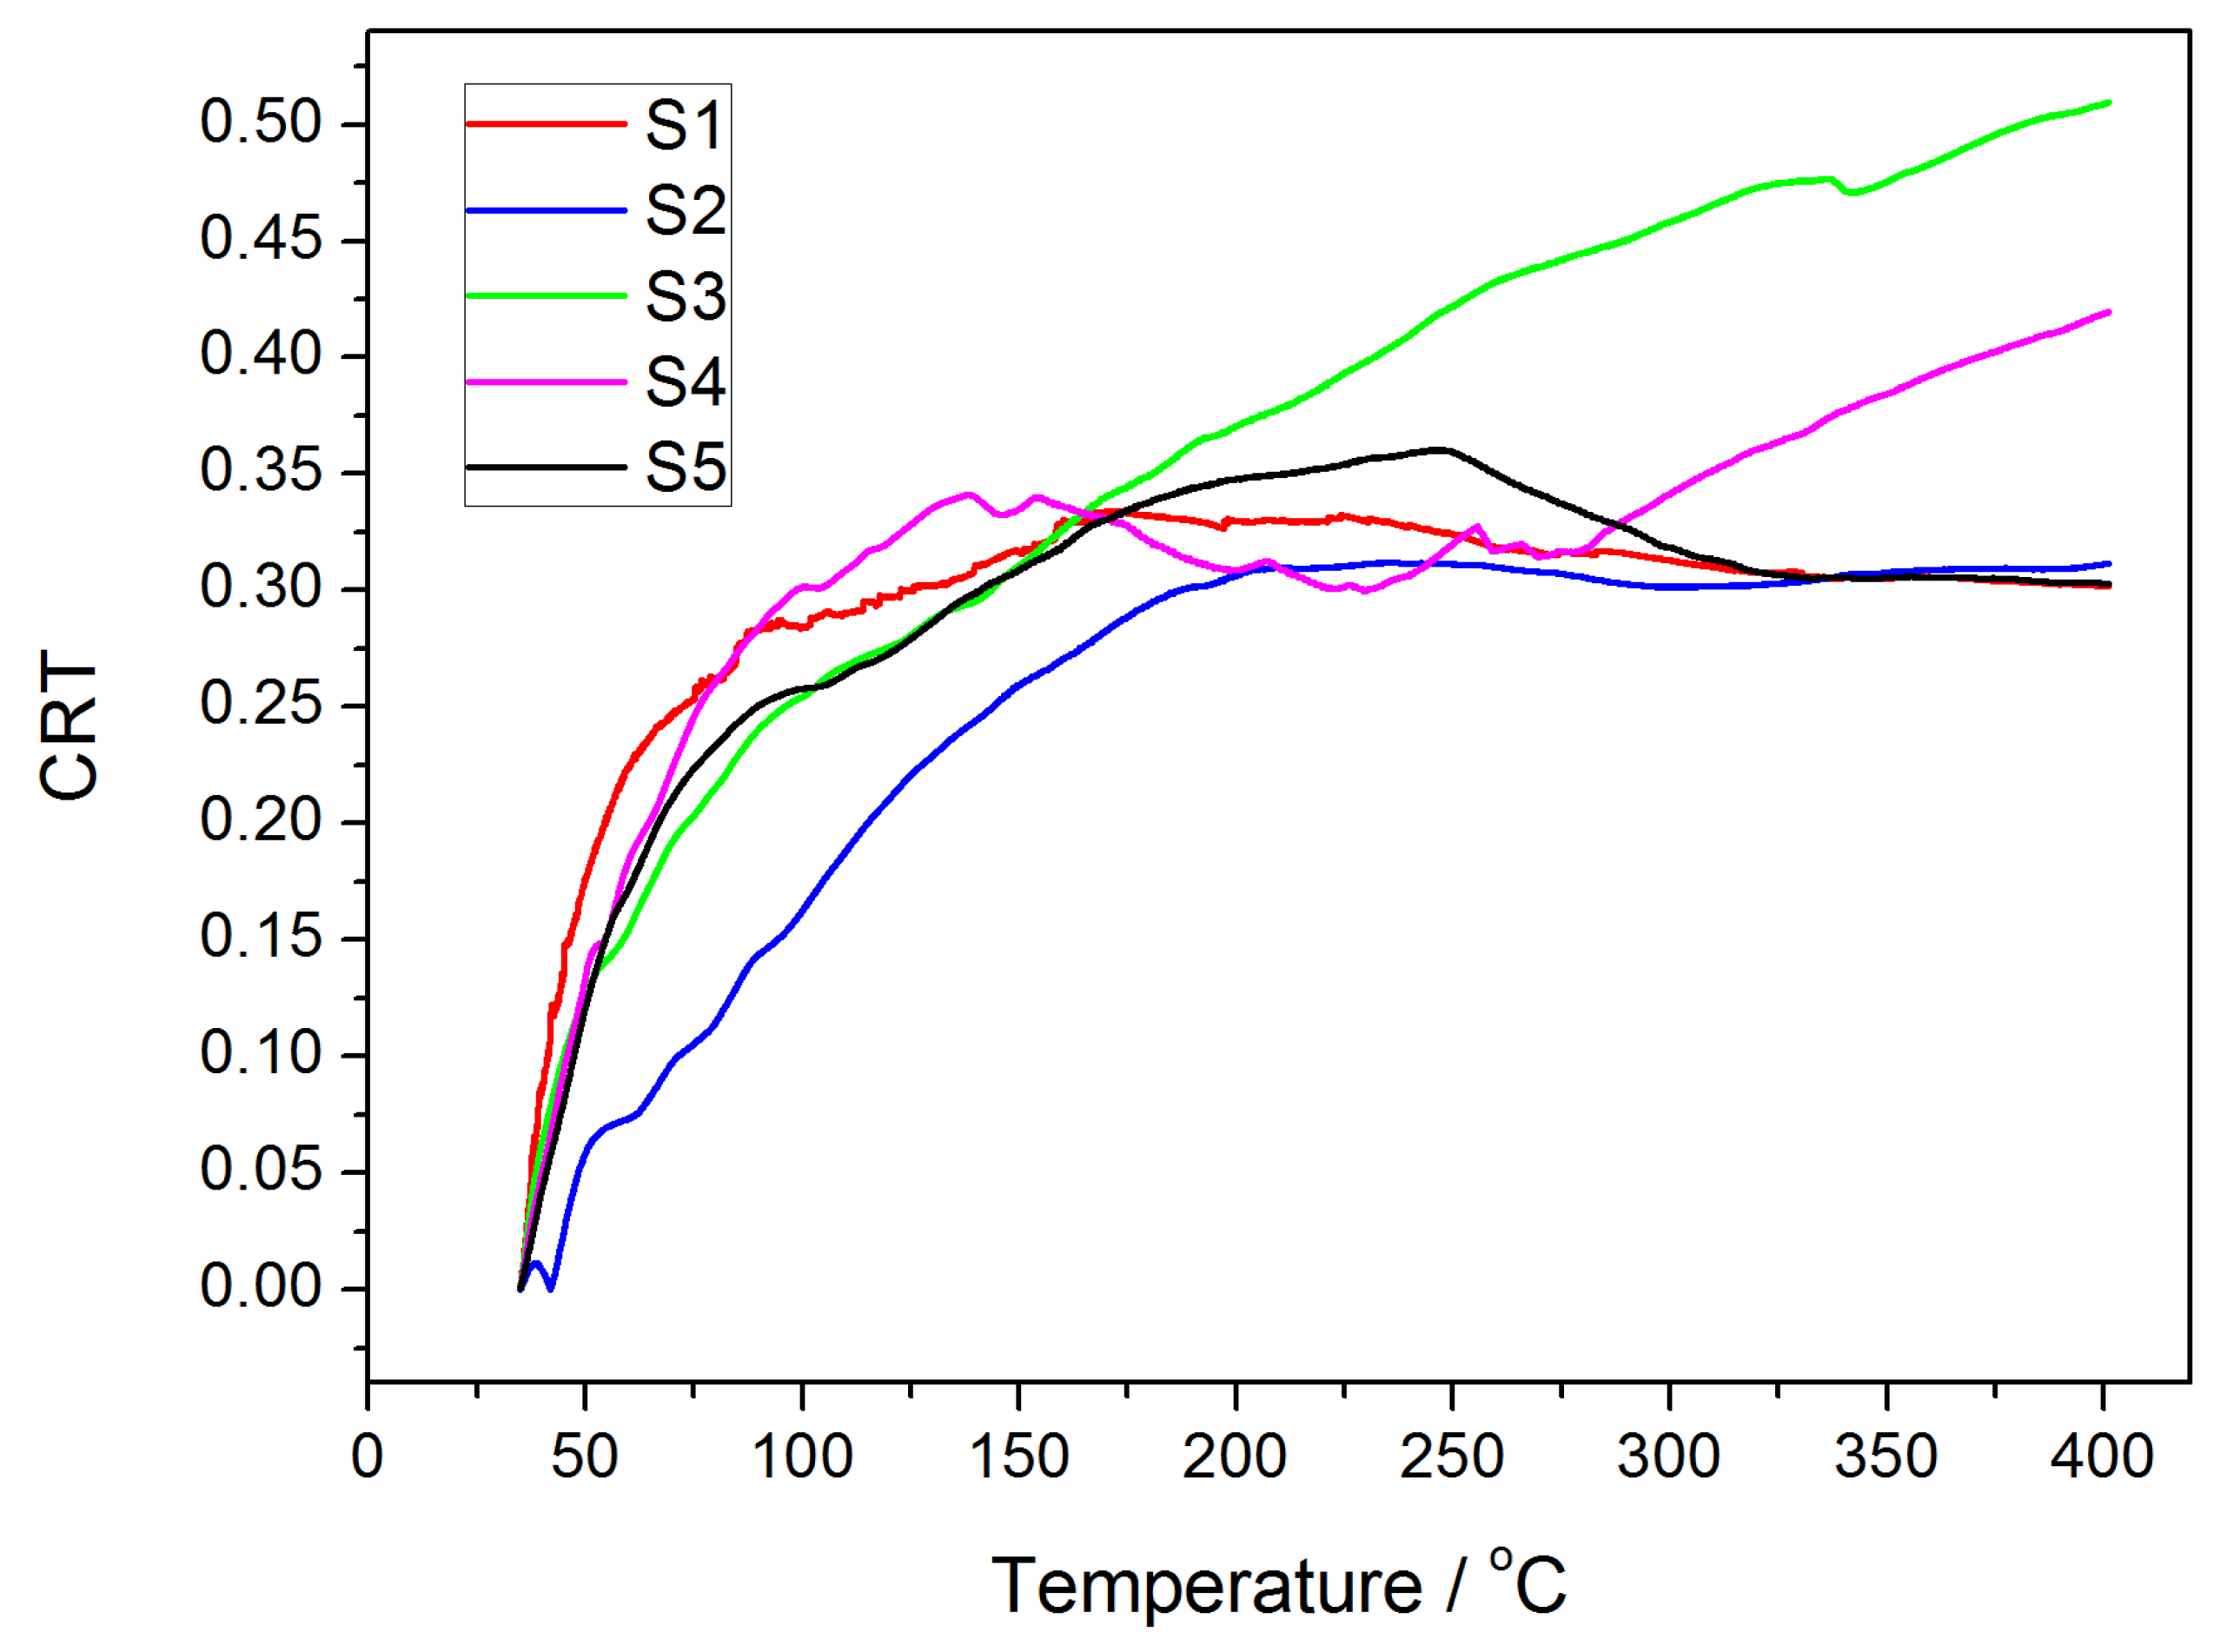
3.3. Effect of SFCA Content on Strength of Samples during Temperature Change

The LECs of samples S1–S5 from 30 to 400 °C are shown in Figure 11. The variation trends of curves S1, S2, and S5 are similar, with the LEC increasing significantly from 30 °C to 200 °C and then stabilizing at 9.0 × 10⁻⁶ °C−1 until the end. Curve S3 rises continuously to 400 °C and finally reaches a maximum of 10.0 × 10⁻⁶ °C−1. Curve S4 rises significantly from 30 °C to 150 °C and then declines slightly to 225 °C, followed by another rise until the maximum of 9.1 × 10⁻⁶ °C−1. Curve S5 ascends to a maximum of 9.25 × 10⁻⁶ °C−1 at 250 °C and then drops until the end.
In order to study the relationship between the SFCA content and LEC for samples S1–S5, the changing rate of the linear expansion coefficient with temperature (CRT), which was equal to the ratio of the absolute value of the difference between the LEC at 30 °C and those after 30 °C and the LEC at 30 °C for samples S1–S5, was defined and obtained as
C R T = | L E C after   30   ° C L E C 30   ° C | L E C 30 ° C
As shown in Figure 12, the curves show that the CRT represents the growing trend of the LECs of samples S1–S5 from 30 to 400 °C, with curve S3 inclined the most and S2 the least, especially after 200 °C. To study the relationship between the SFCA contents and CRT curves of samples S1–S5, an obvious negative correlation between the content of SFCA and the average of the CRT was obtained, as shown in Figure 13. The following equations are introduced to clarify the significance of CRT here
α = l T l 0 l 0 1 T
ε = lim l 0 l l
where α is the LEC (1/°C); lt and l0 are the lengths of the samples at temperature t and 30 °C (m), respectively; ε is the strain of samples during the change of the temperature. Therefore, the relationship between the LEC and the strain can be expressed as
α = ε T
as shown in the equation, during the change of the temperature, the changing rate of strain, which is the main factor leading to the crack initiation, will remain constant when the LEC remains constant, therefore, the more stable the value of the CRT is, the lower the probability of the crack generation is, which indicates that the mechanical strength of the samples increases with the SFCA content during the temperature change.

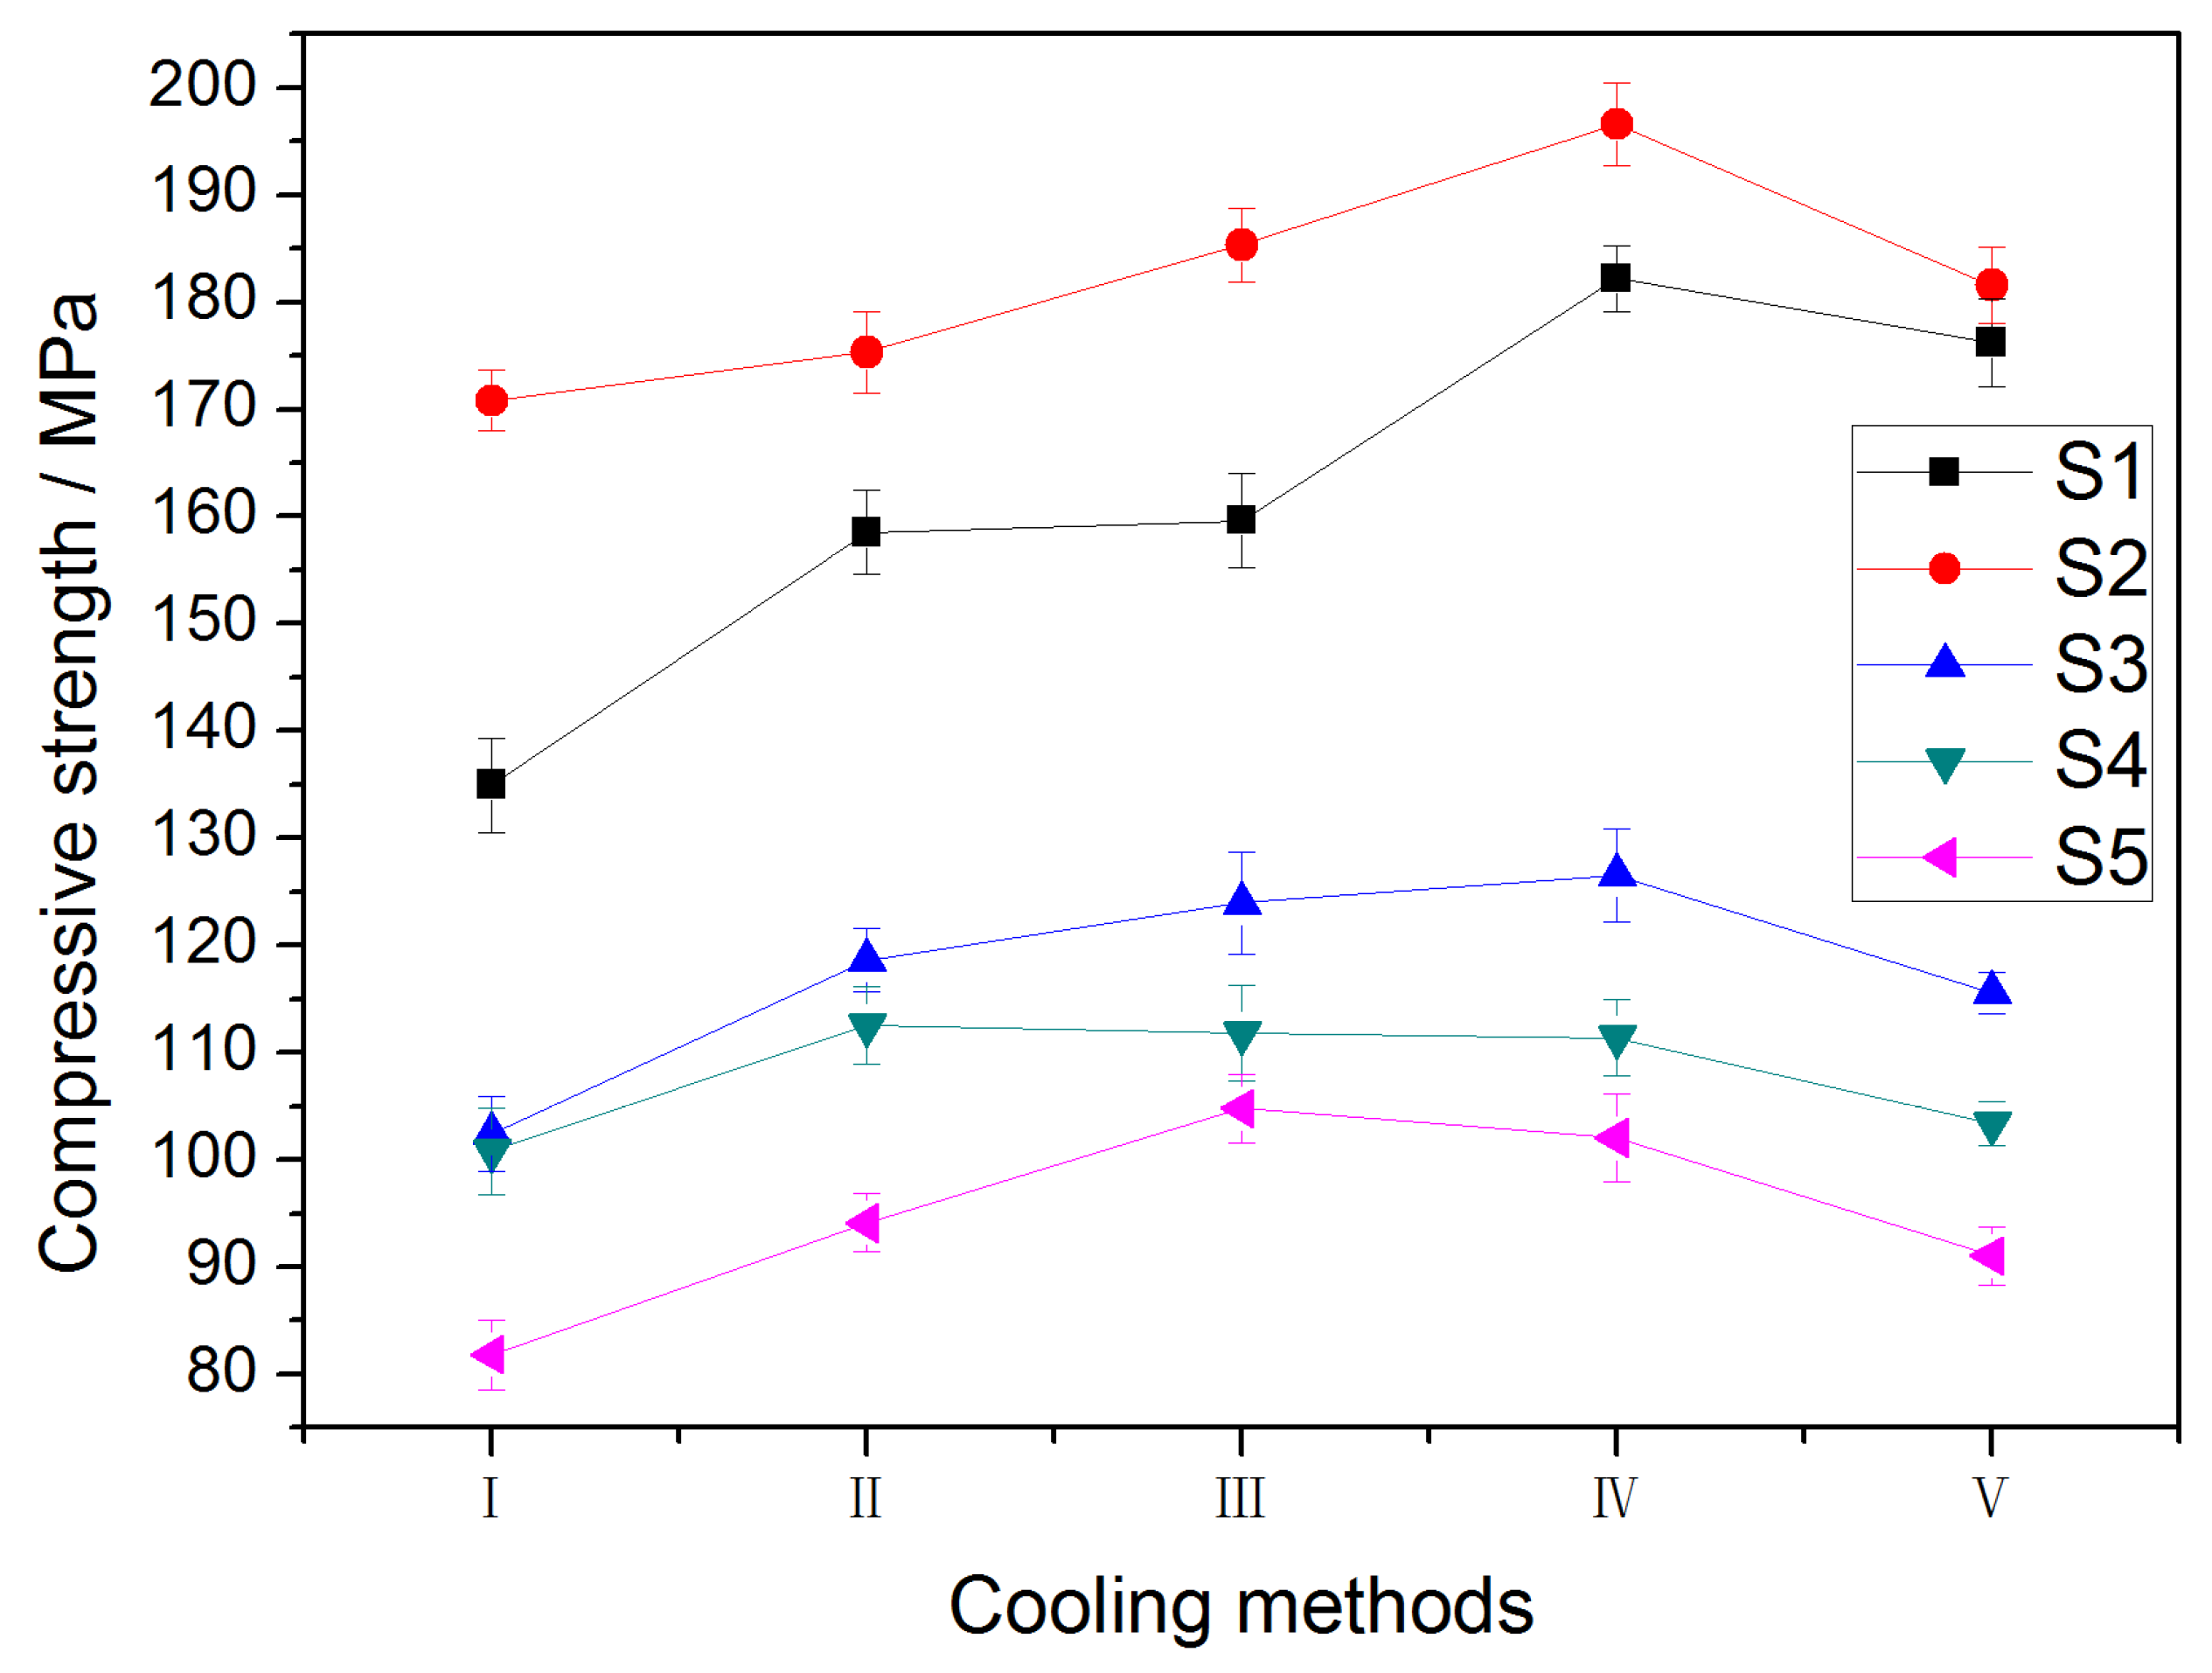
3.4. Effect of Cooling Method on Strength of Samples during Cooling Process

The relationships between the cooling methods and the compressive strengths of samples S1–S5 are plotted with error bars in Figure 14, which show that S2 has the highest and S5 the lowest compressive strengths in samples S1–S5 with all the cooling methods. Meanwhile, for samples S1–S3, the compressive strength of (IV) cooling in the furnace is the highest, while that of (I) cooling in water is the lowest, which indicates that the compressive strength after slow cooling is higher than that after fast cooling. Further, the relationships between the compressive strengths of samples S1–S5 and the SFCA contents for all of the cooling methods are depicted in Figure 15. As shown in the results, the strengths of samples S1–S5 are basically positively correlated with the SFCA contents, indicating that the SFCA plays a positive role in improving the strength in a specific cooling process.
In order to investigate the impact of the vertical tank cooling and other four cooling methods on the quality of the samples, the average compressive strengths with the different cooling methods were obtained. As shown in Figure 16, the average strength after (I) cooling in water is the lowest (only 118.16 MPa); the average strength after (IV) cooling in the furnace is the highest (up to 143.75 MPa); and the average strength after (V) vertical tank cooling is 133.55 MPa, which is between those after (II) cooling in forced air and (III) cooling in air. The results show that (IV) cooling in the furnace has an obvious positive effect on the strength of the samples, followed by (III) cooling in air, with (I) cooling in water leading to the greatest deterioration in the strengths of the samples. Because the vertical tank cooling process consists of (II) and (III), the result of the corresponding average strength is reasonable.

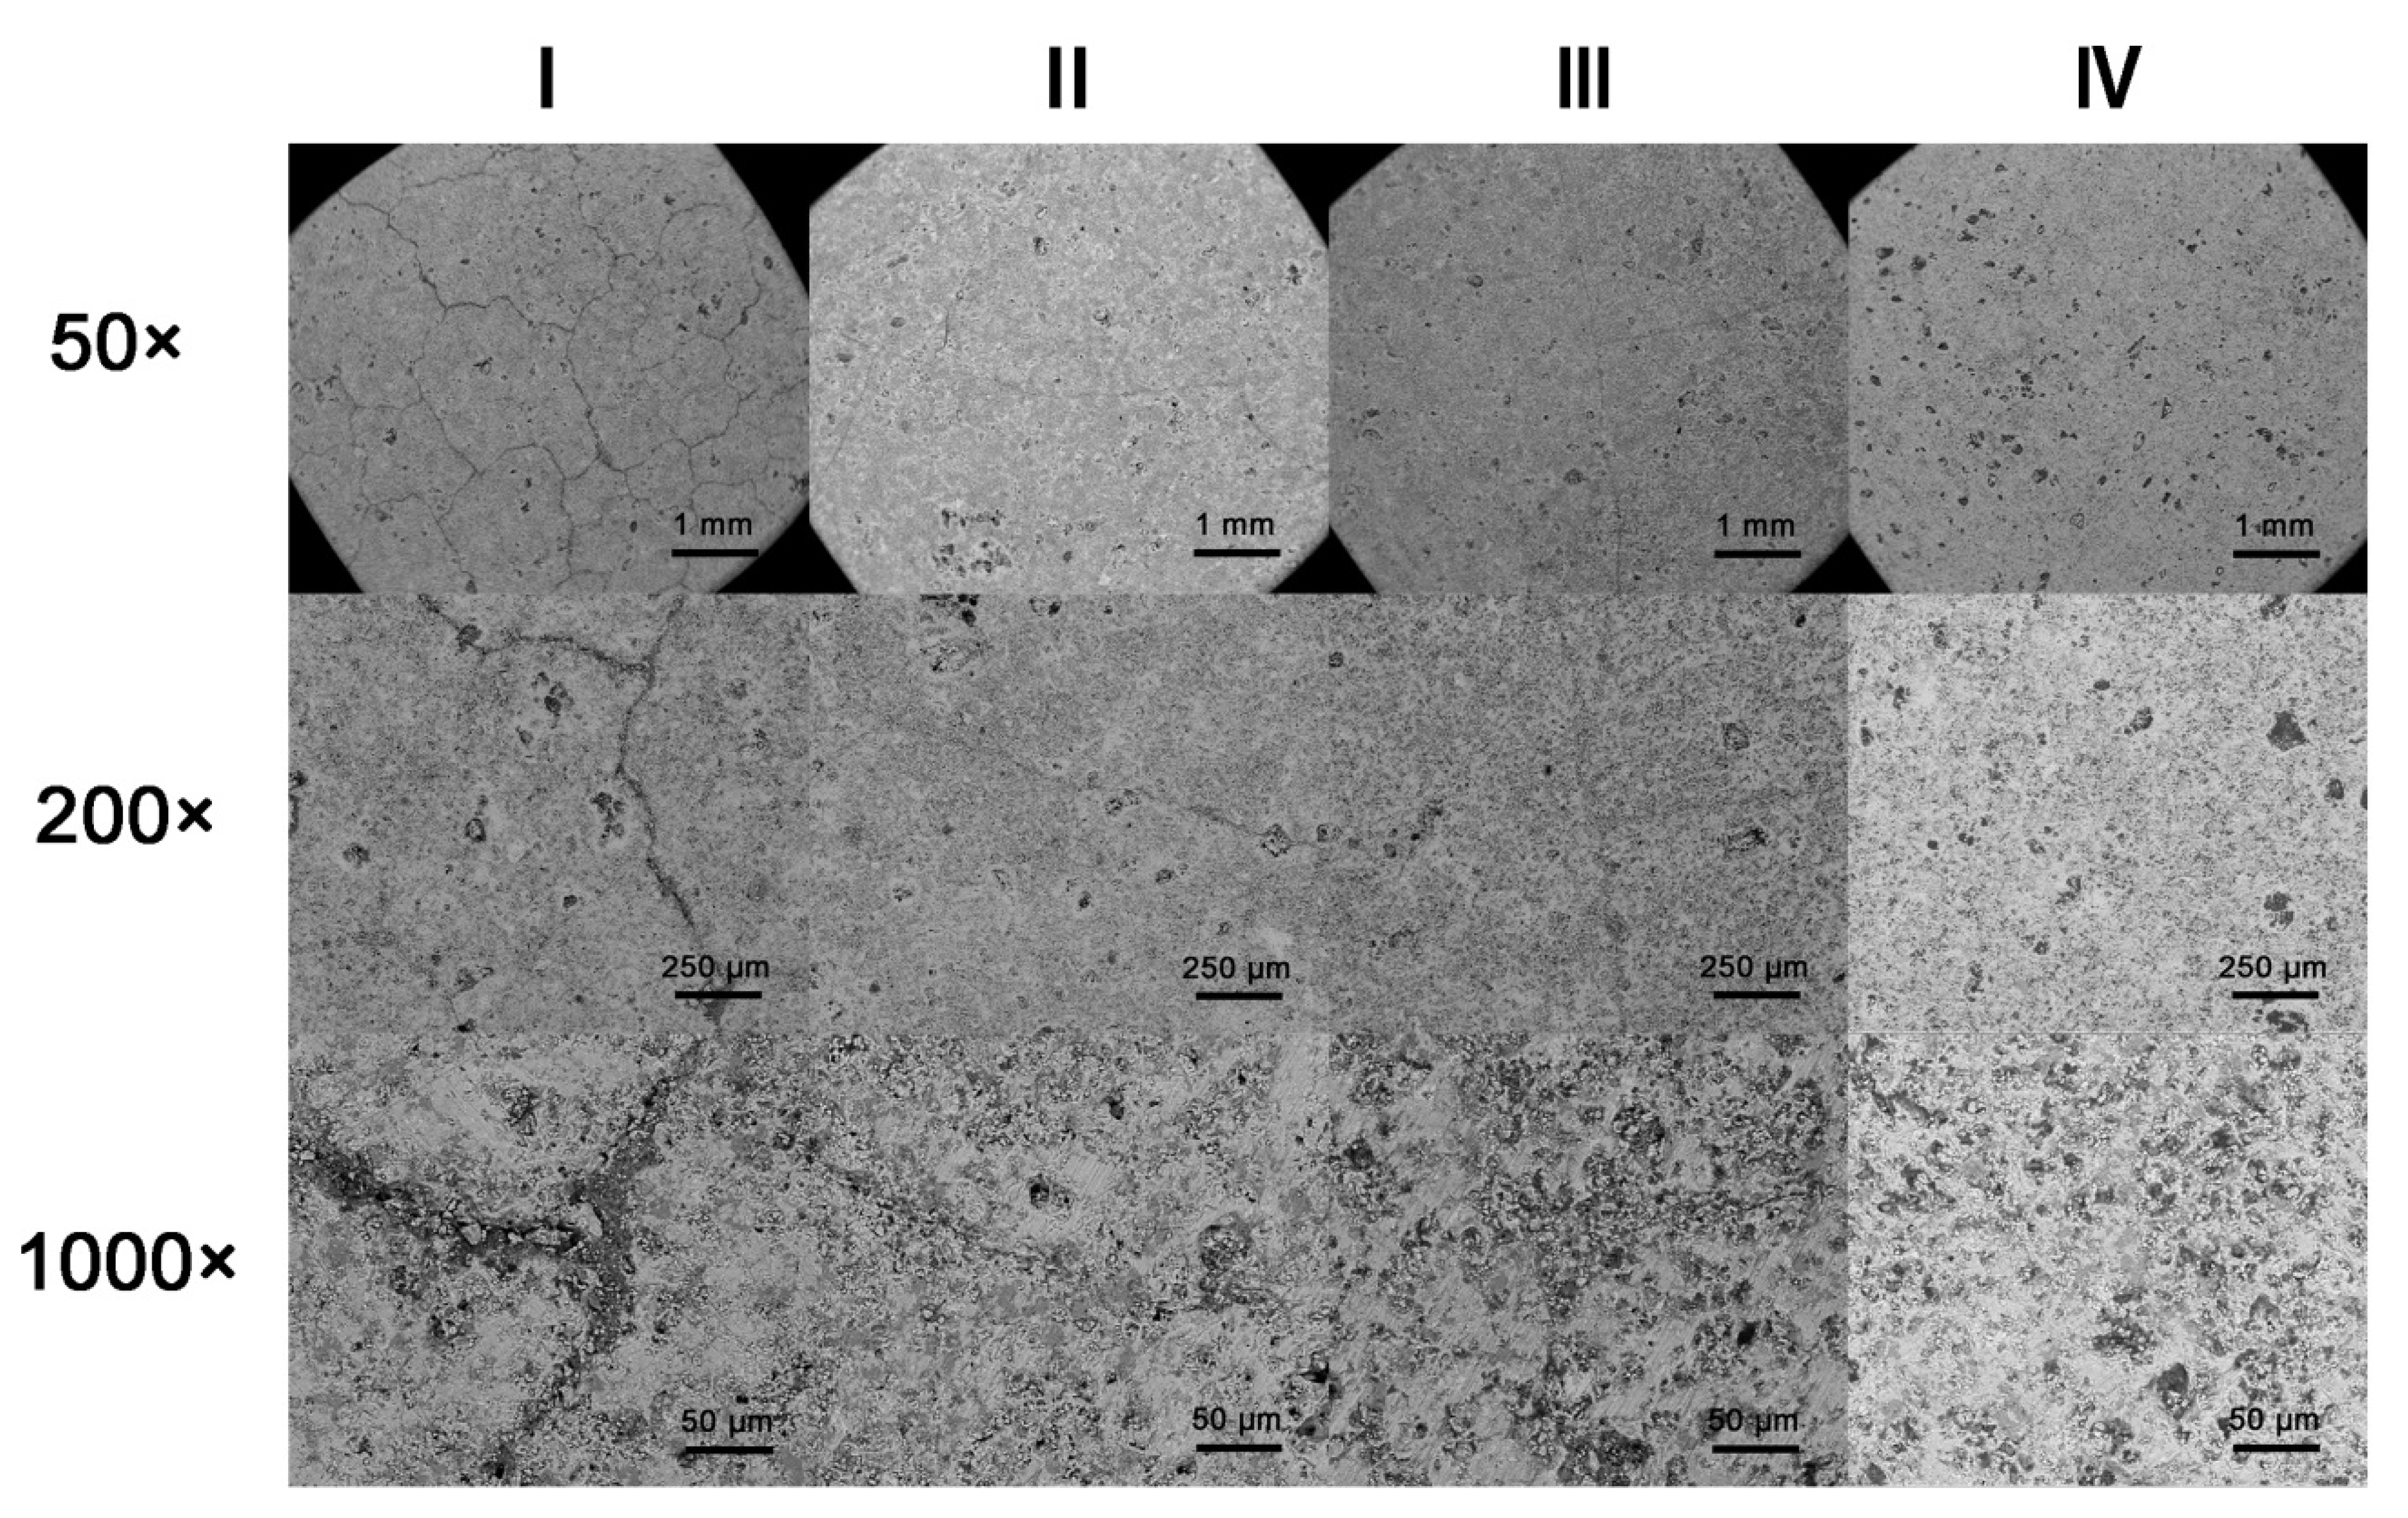
3.5. Scanning Electron Microscopy Analysis

The SEM morphologies of sample S2 magnified 50, 200, and 1000 times after using four different cooling methods are shown in Figure 17.
As shown in the SEM morphologies, (I) cooling in water caused the largest number of the cracks, followed by (II) cooling in forced air and (III) cooling in air, whereas no cracks formed in the sample subjected to (IV) cooling in the furnace. In fact, the different thermal stresses generated in the interior of the sample, varied with the cooling rates of the different cooling fluids, leading to different degrees of cracking, which is presumed to be the main factor affecting the compressive strengths of samples S1–S5 under the different cooling methods.

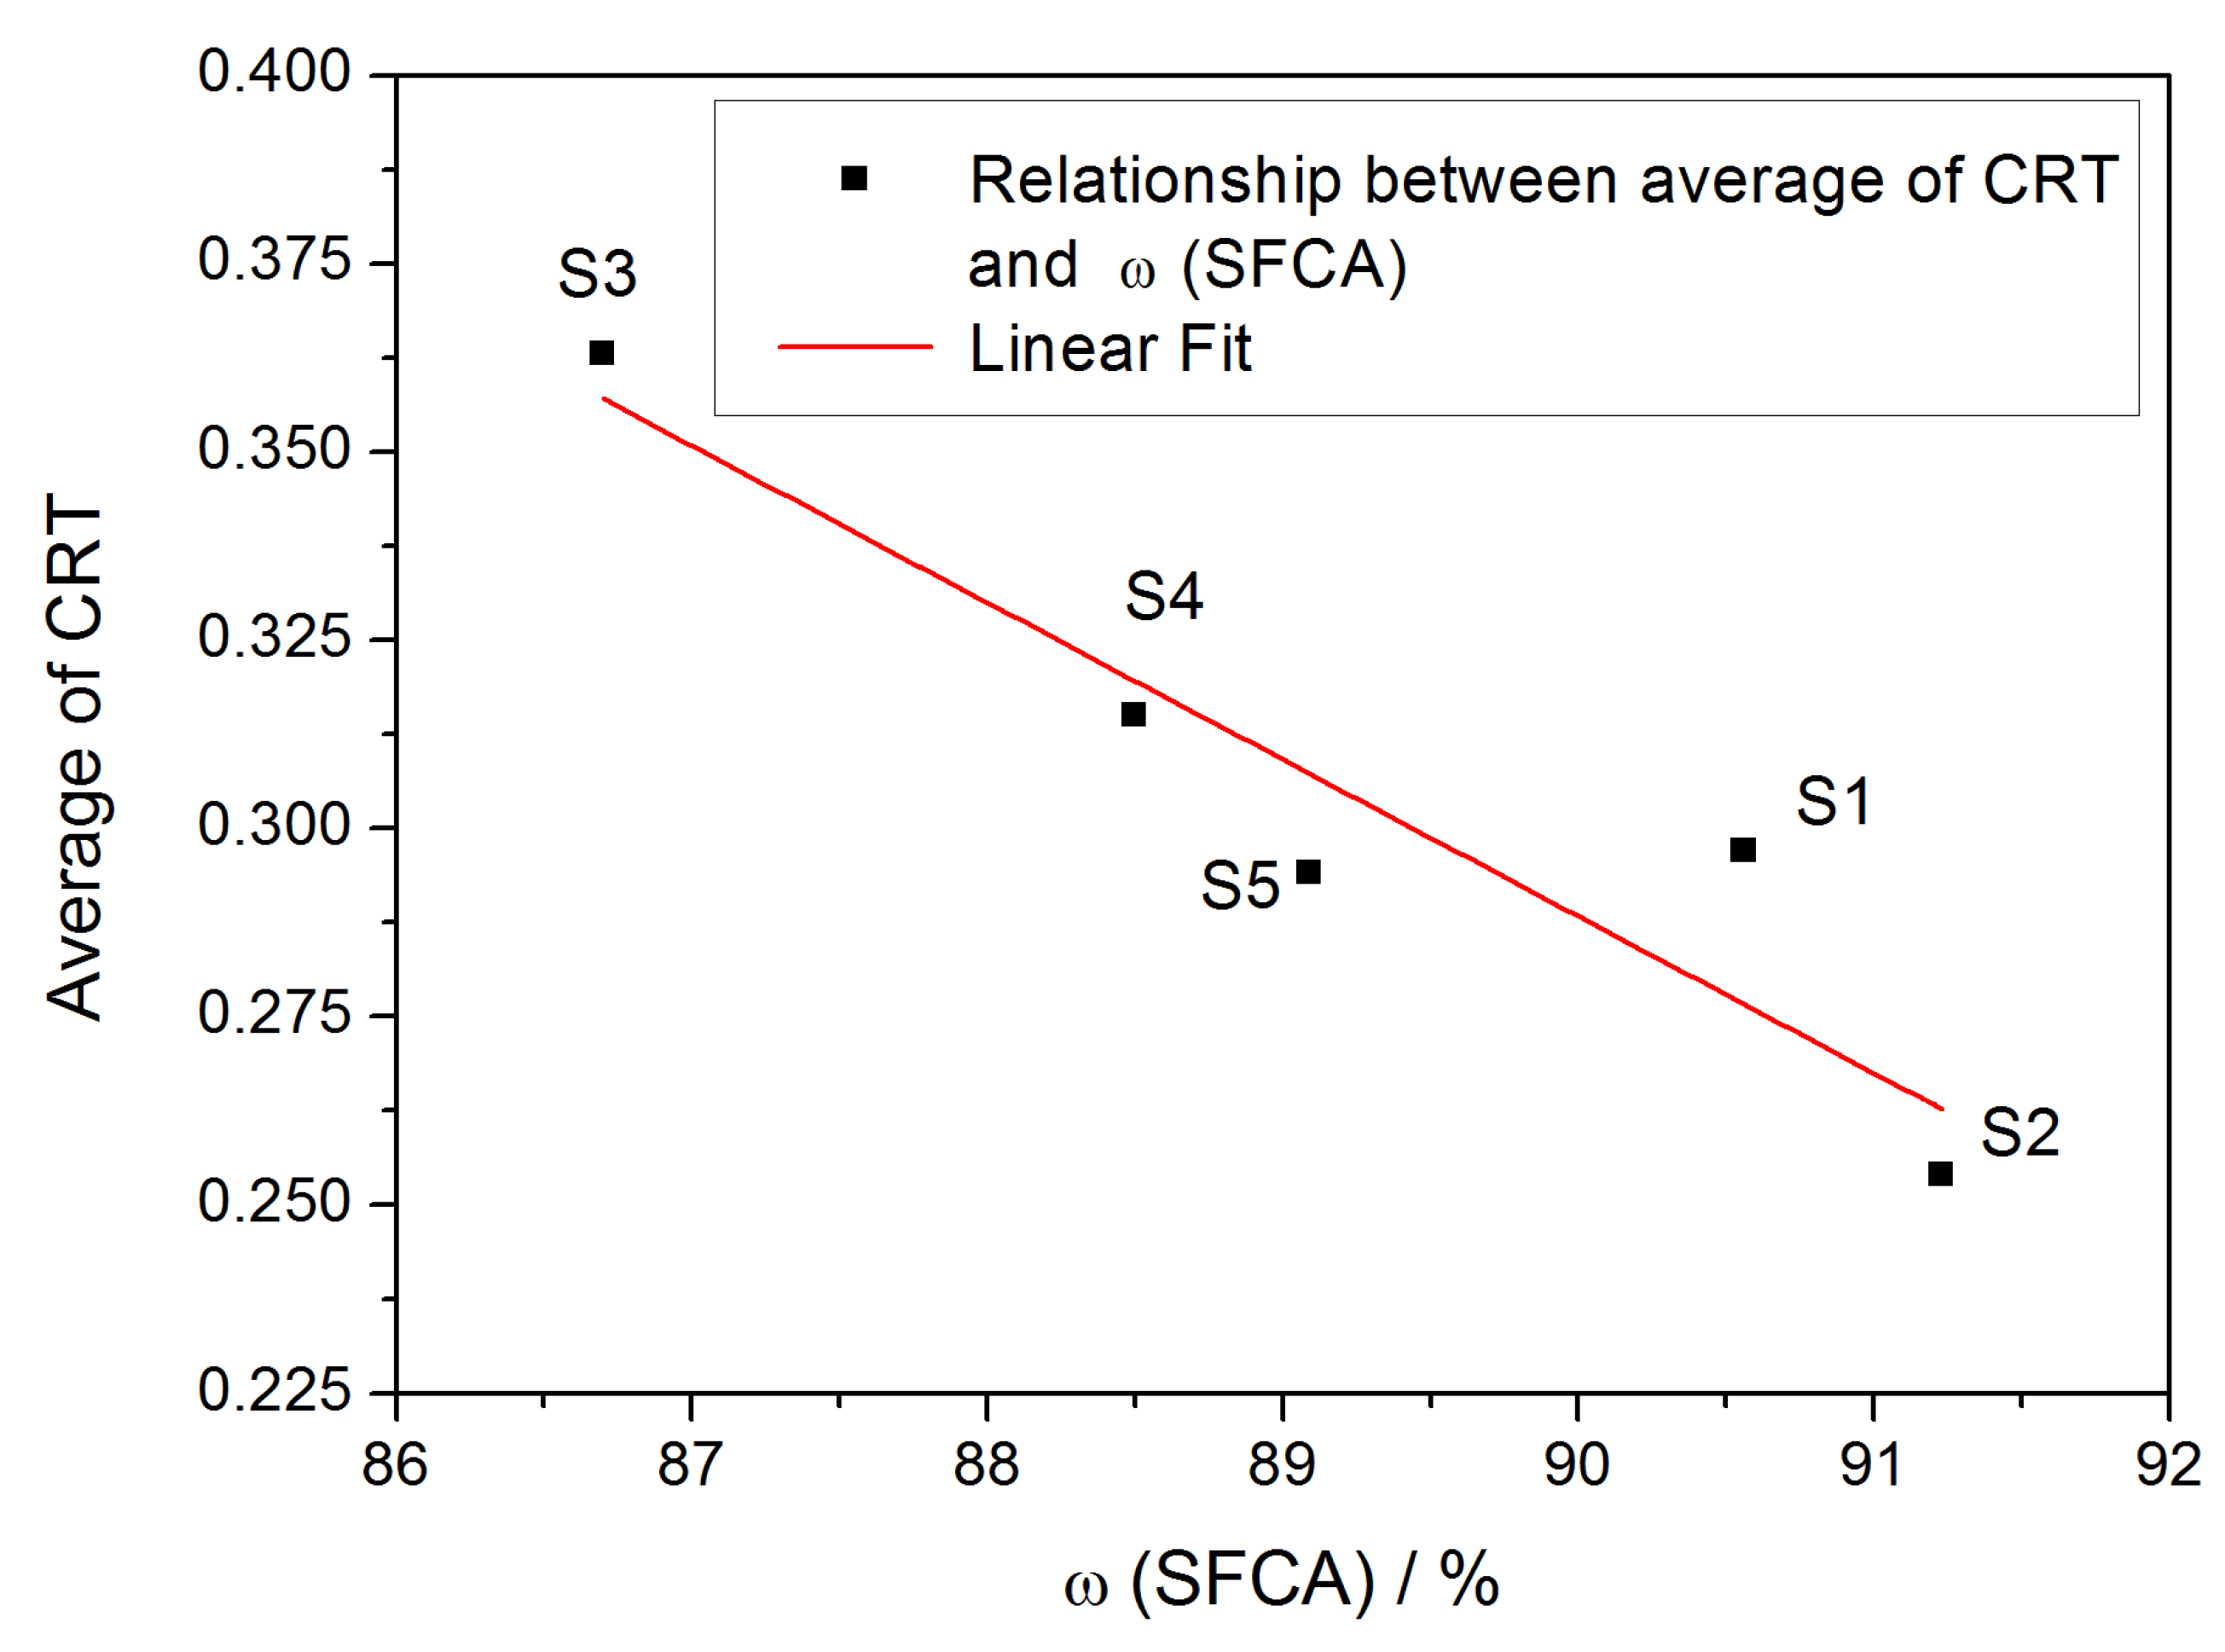
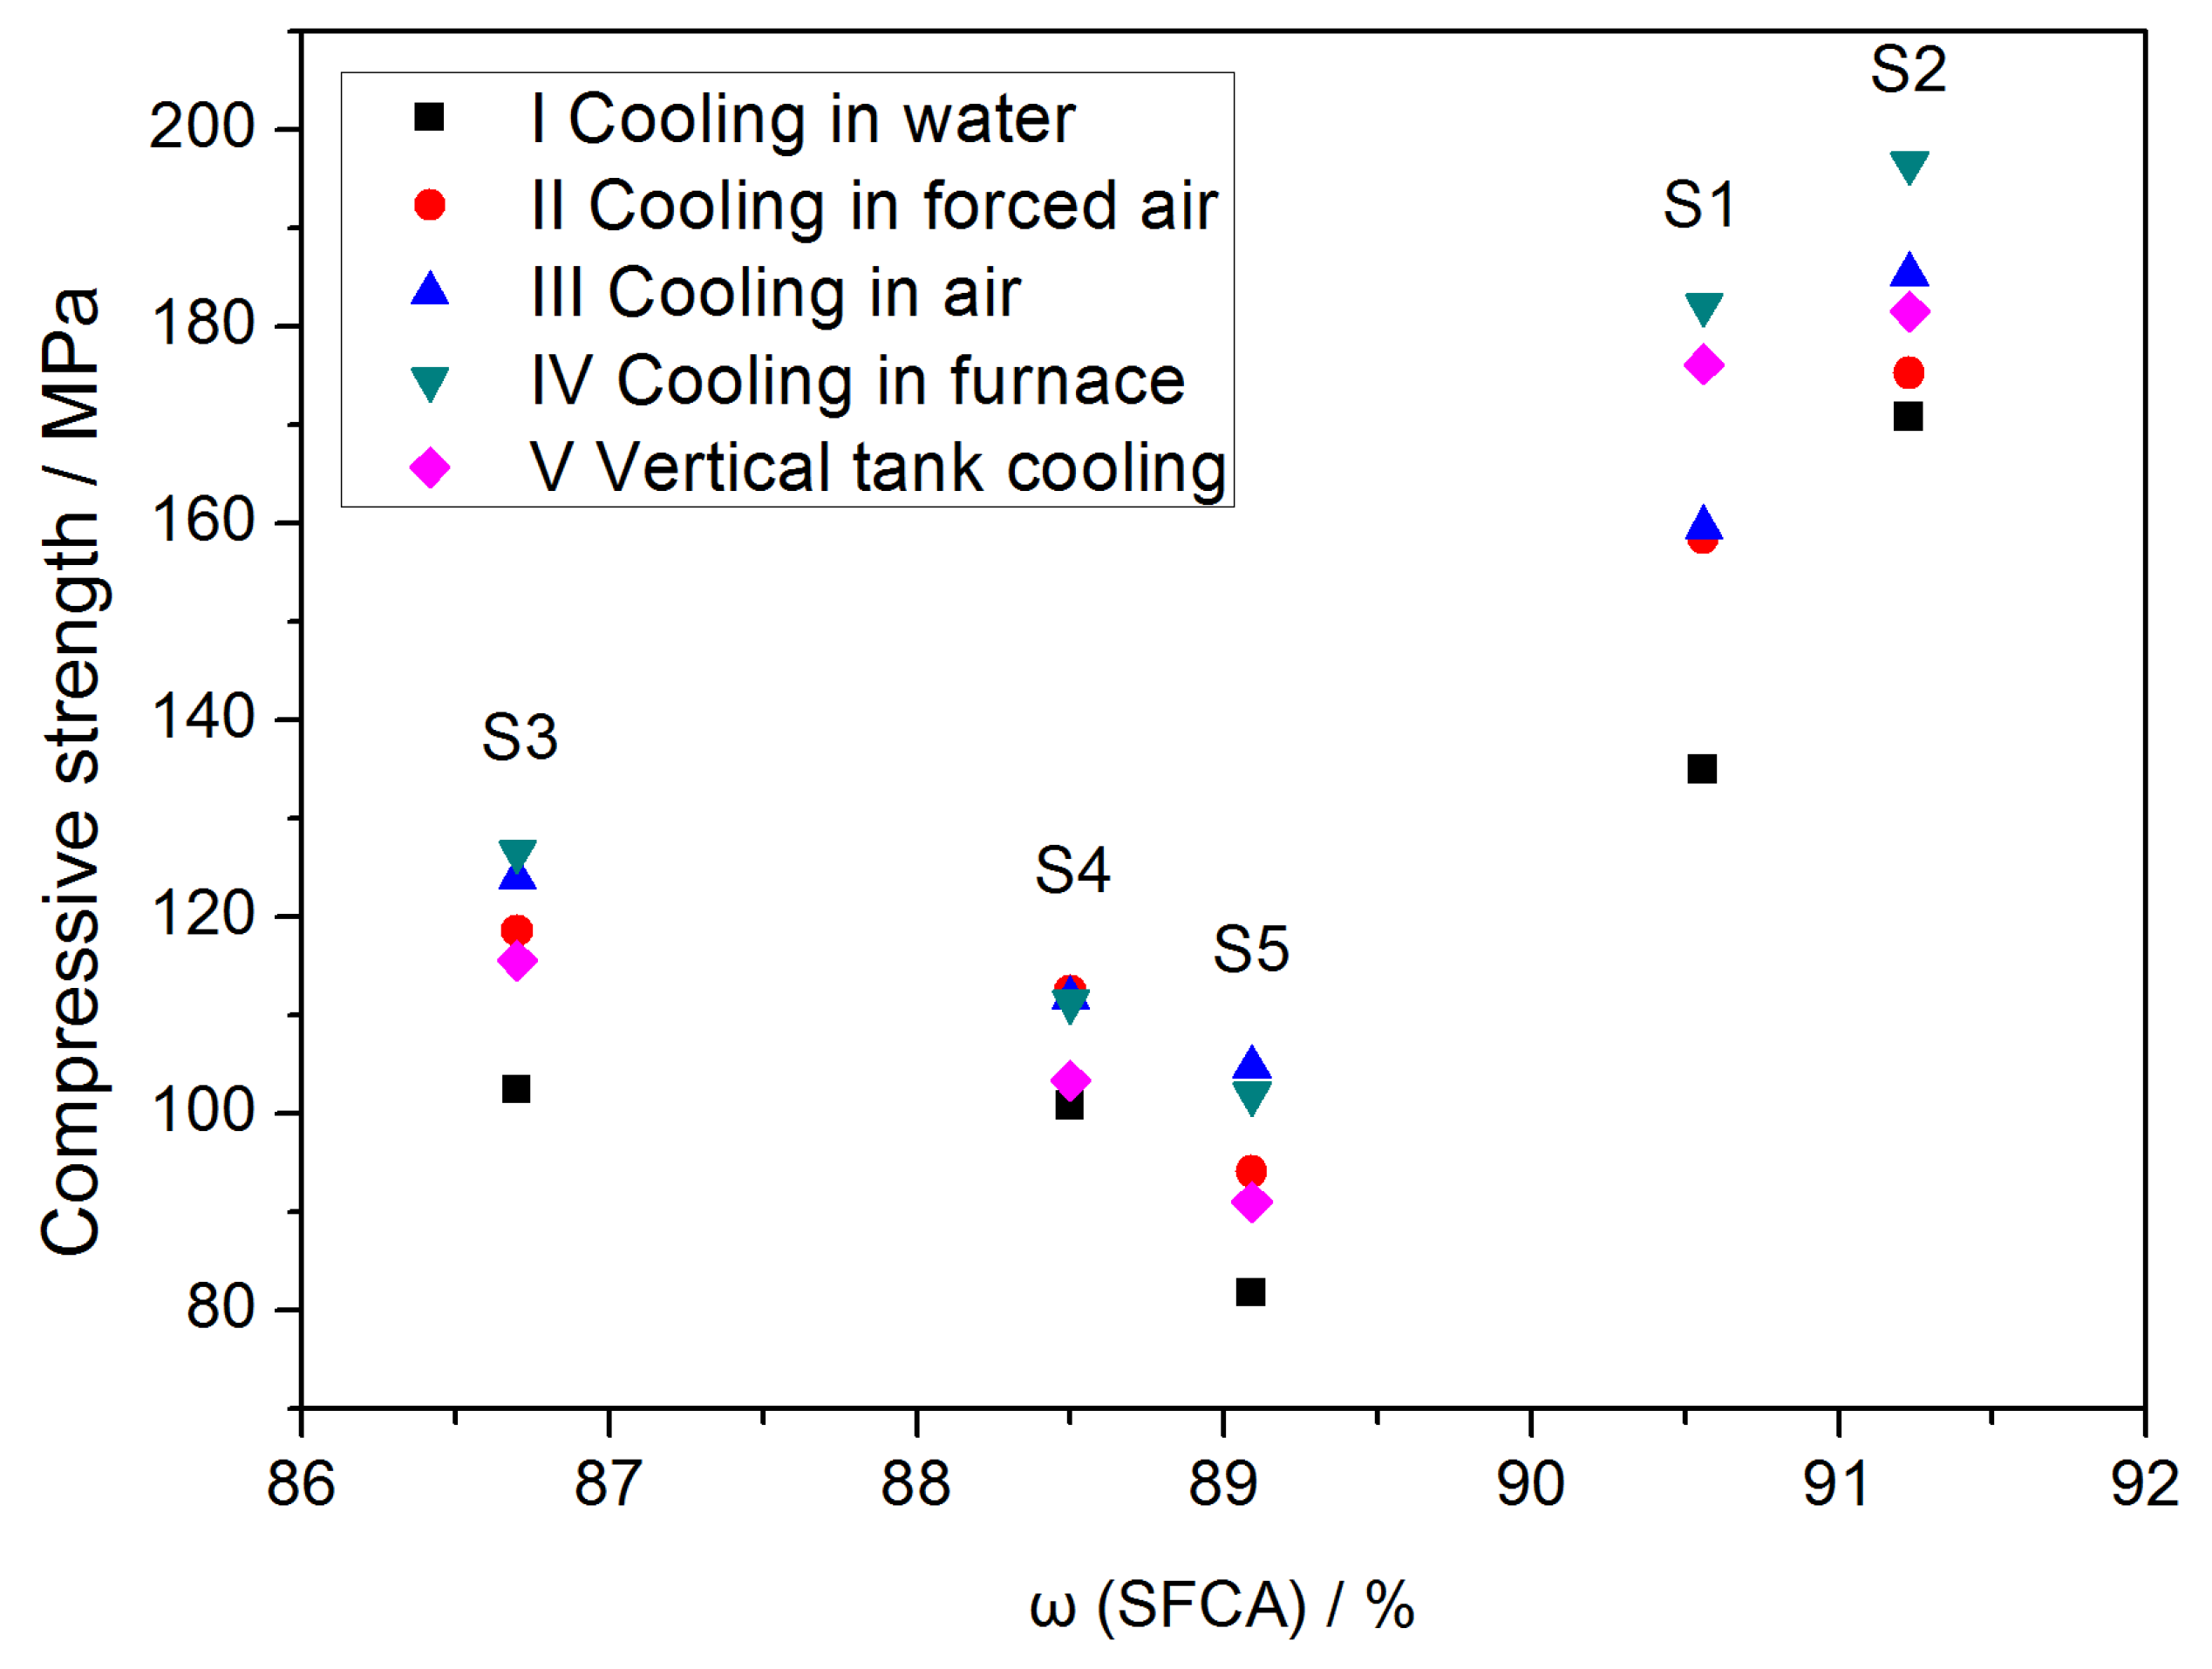
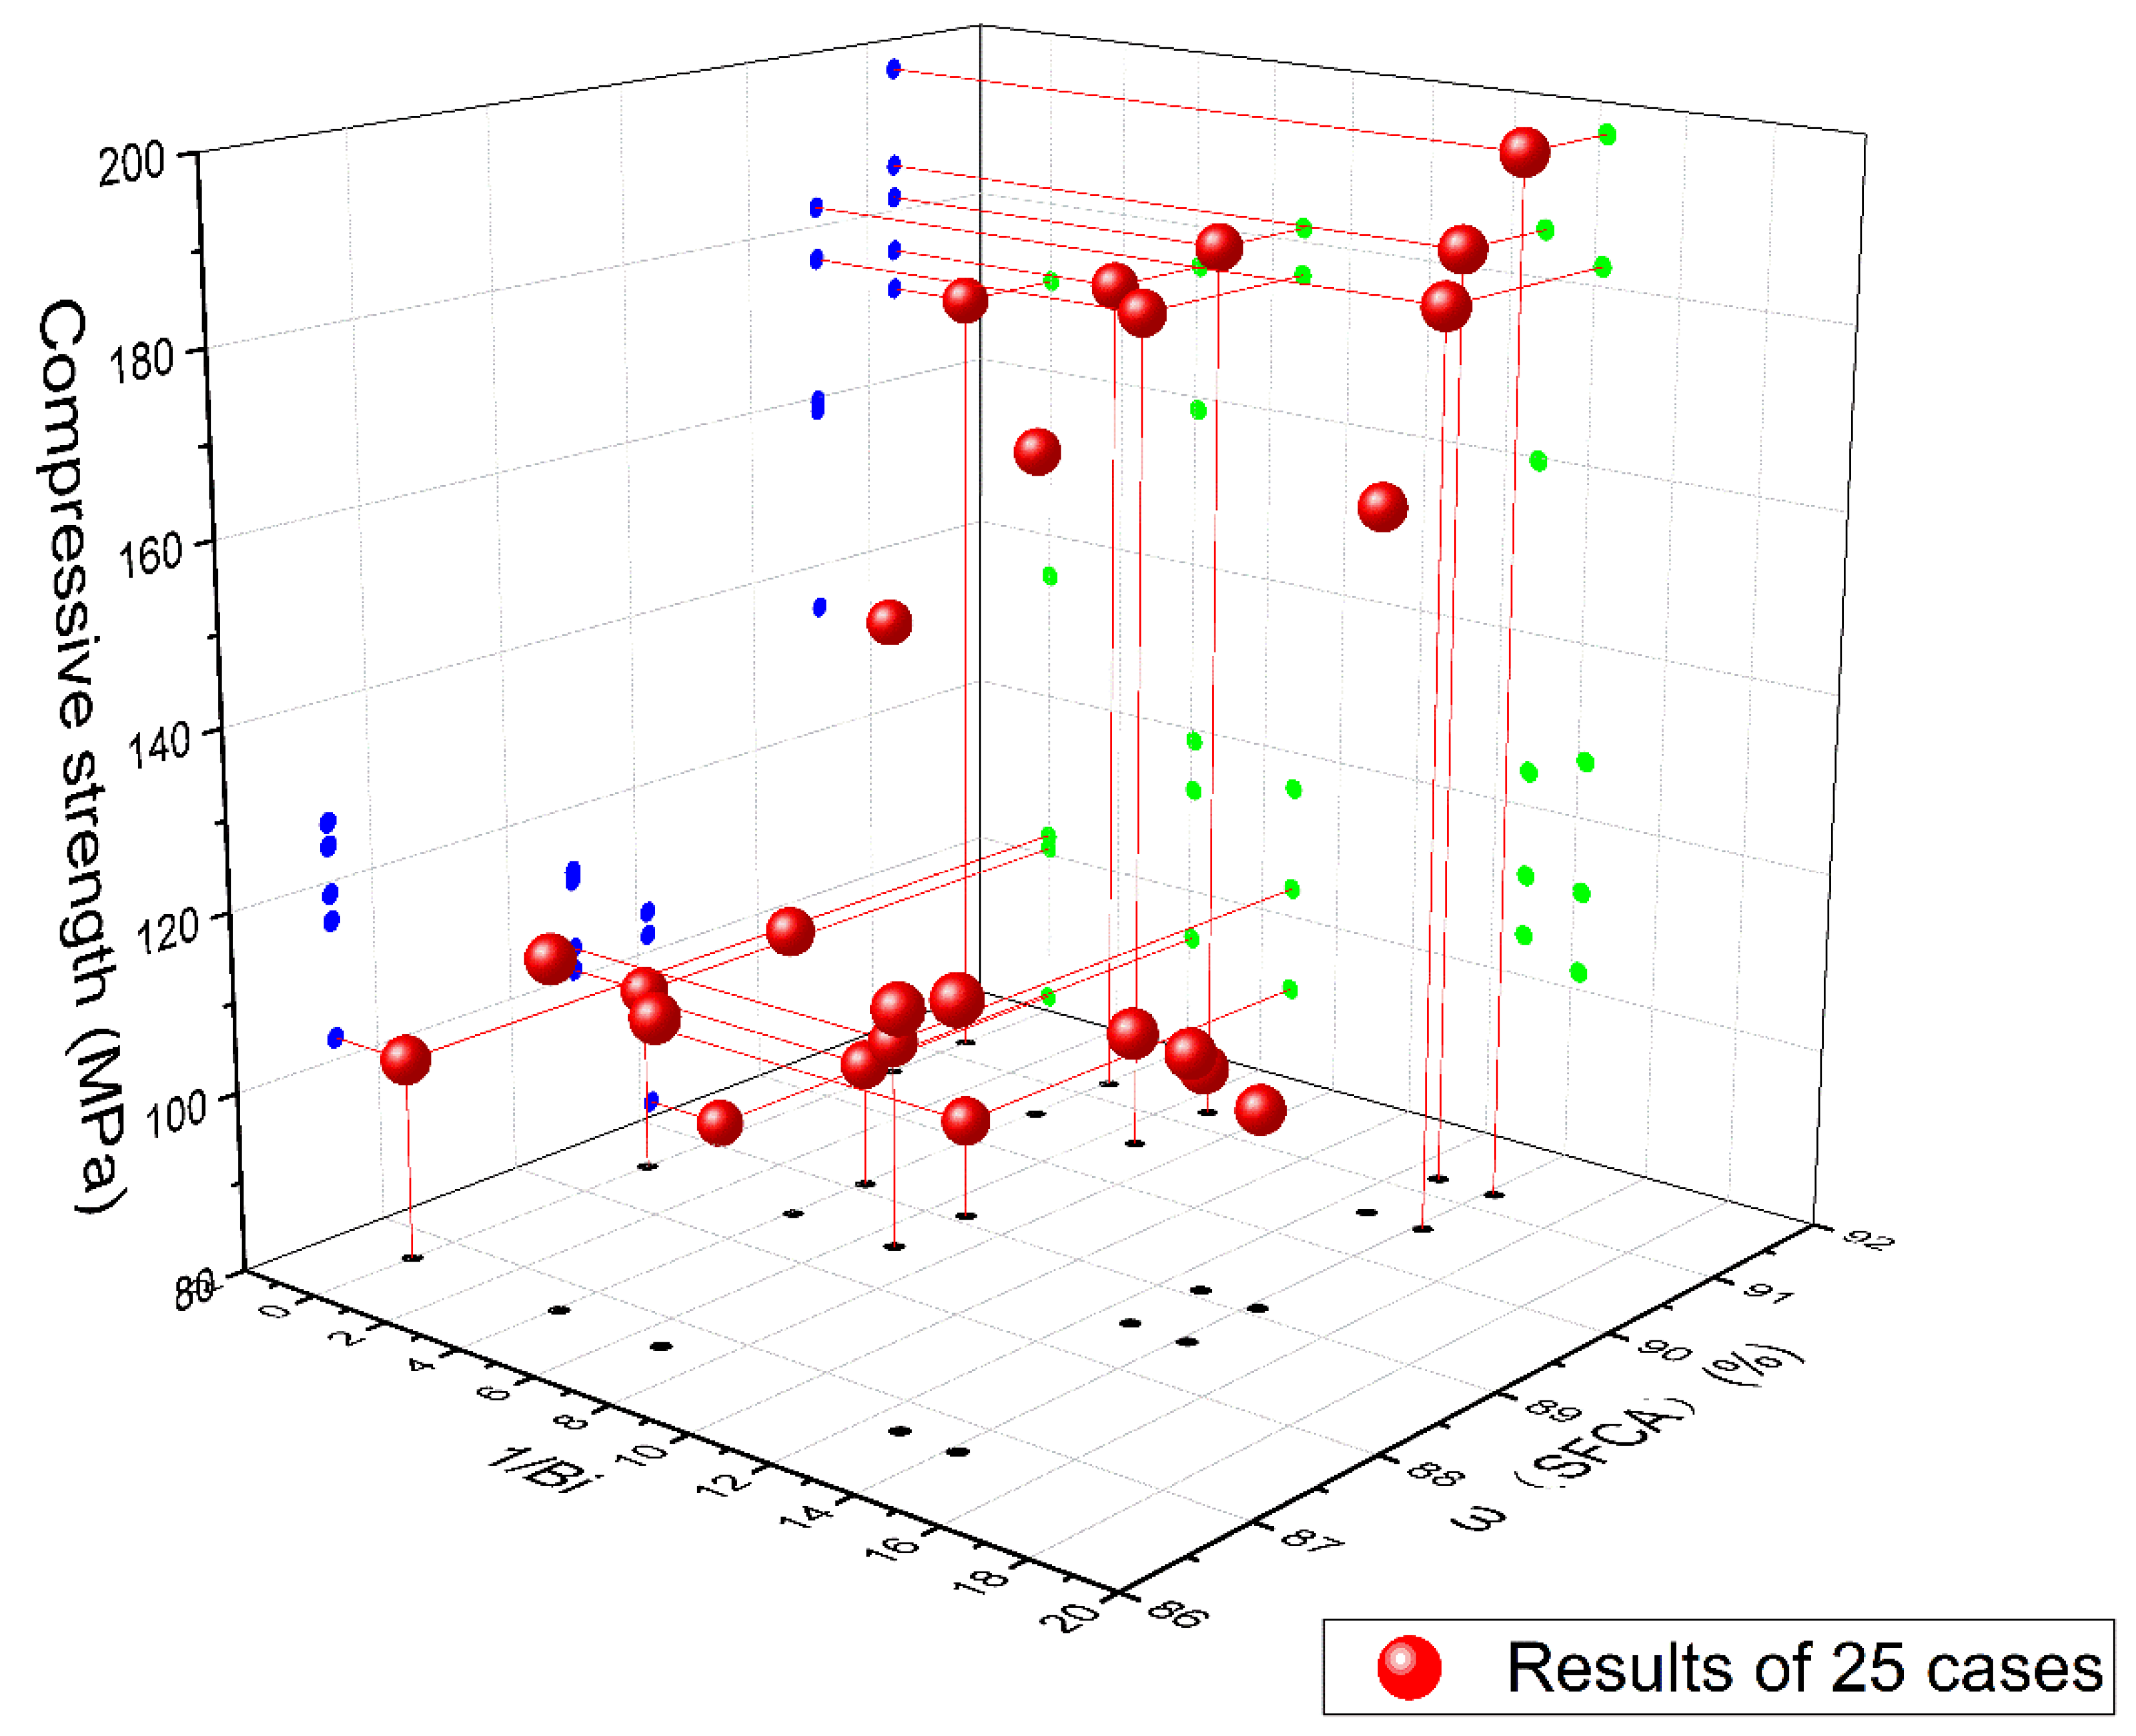
3.6. Effect of SFCA Content and Cooling Method on Strength of Iron Ore Sinter during Cooling Process

As we know, the cooling process of iron ore sinter can be regarded as a gas-solid convection heat transfer process from outside, and Biot number is a dimensionless number which represents the ratio of internal thermal conductivity resistance to surface heat transfer resistance of an object, therefore, it can unify different geometric dimensions of SFCA samples or iron ore sinters and different cooling methods, by which the relationship can be created between the compressive strength obtained in this research and the mechanical strength in industrial process. Therefore, in order to study the effect of the SFCA content and cooling method on strength of the iron ore sinter during the cooling process, the Biot number, which reflects the distribution of the temperature field inside an object under non-steady-state heat conduction conditions, was introduced to normalize the five cooling methods considered in the study as
B i = α cooling d 0 2 λ sinter
where Bi is the Biot number; αcooling is the convective heat transfer coefficient of the cooling method (I)–(V) (W/(m2·K)); d0 is the diameter of samples S1–S5 of iron ore sinter and is 0.022 (m); and λsinter is the coefficient of thermal conductivity for the iron ore sinter and is 1.91 (W/(m·K)) [18]. For the method of (I) cooling in water, depending on the temperature difference between the surface of the sample and water, the stable film boiling occurred when the temperature of surface of the sample was in range of 800–220 °C, during which the α can be obtained as
α = 0.62 [ g r ρ v ( ρ l ρ v ) λ v 3 μ v d 0 ( t w t s ) ( 1 + 0.4 c p , v ( t w t s ) r ) ] 1 / 4
where g is the acceleration of gravity (m/s2); r is the latent heat of vaporization (J/kg); ρv and ρl are the densities of the saturated vapor and water (kg/m3); λv is the coefficient of thermal conductivity for the saturated vapor (W/(m·K)); μv is the dynamic viscosity of the saturated vapor (kg/(m·s)); tw and ts are the temperatures of the surface of sample and saturated water (°C); and cp,v is the specific heat capacity at constant pressure for the saturated vapor (J/(kg·K)). The unstable film boiling (transition boiling) occurred in 130–220 °C, during which the q and α can be obtained as
q = π 24 r ρ v [ σ g ( ρ l ρ v ) ρ v 2 ] 1 / 4 ( ρ l ρ l + ρ v ) 1 / 2
α = q t w t s
where σ is the surface tension at the gas-liquid interface (N/m). The bubble boiling occurred in 130–105 °C, during which the q can be obtained as
q = μ l r [ g ( ρ l ρ v ) σ ] 1 / 2 [ c p , l ( t w t s ) C w , l r P r l ] 3
where Cw,l is an experimental constant related to the combination of liquid and wall materials. The natural convection occurred in 105–20 °C, during which the Grashof number, Nusselt number, and α can be obtained as
G r = g β d 0 3 ( t w t f ) υ 2
N u = C ( G r P r ) n
α = λ f N u d 0
β is the coefficient of volumetric thermal expansion (1/K); tf is the temperature of the cooling fluid (°C); ν is the kinematic viscosity of the fluid (m2/s); C and n are experimental constants; Pr is the Prandtl number; λf is the coefficient of thermal conductivity for the cooling fluid (W/(m·K)). For the methods of (III) cooling in air and (IV) cooling in the furnace, which can be regarded as the natural convection, equations (13)–(15) can be used to calculate the α. The values of Cw,l, C, and n of method (I), (III), and (IV) are listed in Table 5 [19]. Besides, as the methods of (II) cooling in forced air and the main process of (V) vertical tank cooling can be considered as forced convection, the following equations can be used
R e = v d 0 υ
N u = 2.0 + 0.6 R e 1 / 2 P r 1 / 3
where Re is the Reynolds number; and v is the velocity of the specific fluid (m/s). The following assumptions were necessary for the calculation of Biot number: the samples synthesized in the study were regarded as the spherical iron ore sinter with 0.022 m in diameter; the cooling media of method (I) and other four are the water at 20 °C and air at 20 °C. Table 5 lists the α and Biot numbers of all the cooling methods obtained in this section. Note that the Biot numbers of different types of convection for cooling method (I) were averaged for convenience in the subsequent research.
The effect of the SFCA content and Biot number on the compressive strength of the iron ore sinter during the cooling process is shown in Figure 18. As shown in the results, a high (low) strength basically corresponds to a high (low) value for ω(SFCA) or 1/Bi. In particular, the highest strength of 196.56 MPa was obtained with the highest ω(SFCA) (91.23%) and 1/Bi (14.18), which indicated that higher mechanical strengths for iron ore sinters will be obtained with higher SFCA content and lower Biot numbers during the cooling, and this will guide the evaluation of mechanical strength of iron ore sinter after the cooling process in industry.

4. Conclusions

In this paper, the effect of a cooling method on the strength of SFCA, a kind of desirable bonding phases with good metallurgical properties in sinter, was represented by correlation analyses of the SFCA contents and the thermal expansion coefficients and compressive strengths under different cooling methods. All of the measurements in the study, especially the tests of thermal expansion, cooling process and compressive strength, were arranged to study the effect of cooling methods on the strength of SFCA of iron ore sinter during the cooling process, which was meaningful to the industrial cooling process of iron ore sinter. The synthesized SFCA was regarded as the important phase in iron ore sinter, the compressive strength represented the mechanical strength of iron ore sinter, and Biot number correlated the cooling method used in the study with the cooling process of iron ore sinter in industry. However, the results in this paper merely provided a reference to the industrial process, which were limited by the equipment and parameters in laboratory. The conclusions can be summarized as follows:
  • An obvious negative correlation between the SFCA content and CRT average suggests that the SFCA in the bonding phase significantly influences the mechanical strength of the iron ore sinter.
  • For a specific cooling method, the compressive strength of the SFCA samples increased with the SFCA content, suggesting that the SFCA phase has a positive effect on the mechanical strength of the iron ore sinter during the cooling process.
  • The results of a compressive strength test suggested that slow cooling can prevent the generation of thermal stress which leads to a deterioration in the strength of the iron ore sinter.
  • The mechanical strength of an iron ore sinter could be improved by decreasing the Biot number and increasing the SFCA content, which will guide the evaluation of mechanical strength of iron ore sinter after the cooling process in industry.

Author Contributions

Conceptualization, X.Z.; Data curation, X.Z.; Funding acquisition, H.B.; Investigation, X.Z.; Methodology, X.Z.; Resources, T.H.; Supervision, J.Z.; Validation, H.Y.; Visualization, Z.Z.; Writing – original draft, X.Z.; Writing – review & editing, H.B. and X.L.

Funding

This research was funded by Beijing Chinatop Tech. Co.

Acknowledgments

The authors would like to thank Tian He for his support in materials preparation.

Conflicts of Interest

The authors declare no conflict of interest.

References

  1. Wu, S.; Liu, Y.; Du, J.; Mi, K.; Lin, H. New concept of iron ores sintering basic characteristics. J. Univ. Sci. Technol. Beijing 2002, 24, 254–257. [Google Scholar]
  2. Zhou, Q.; Kong, L. Agglomeration Theory and Process of Iron Ore; Metallurgical Industry Press: Beijing, China, 1989. [Google Scholar]
  3. Wu, S.; Du, J.; Ma, H.; Zhang, Z.; Chen, H. Self-intensity of binding phase in iron ores during sintering. J. Univ. Sci. Technol. Beijing 2005, 27, 169–172. [Google Scholar]
  4. Hancart, J.; Leroy, V.; Bragard, A. A study of the phases present in blast furnace sinter. Some considerations on the mechanism of their formation. CNRM Metall. Rep. 1967, 3–7. [Google Scholar]
  5. Kim, H.S.; Park, J.H.; Cho, Y.C. Crystal structure of calcium and aluminium silicoferrite in iron ore sinter. Ironmak. Steelmak. 2002, 29, 266–270. [Google Scholar] [CrossRef]
  6. Scarlett, N.V.Y.; Madsen, I.C.; Pownceby, M.I.; Christensen, A.N. In situ X-ray diffraction analysis of iron ore sinter phases. J. Appl. Crystallogr. 2004, 37, 362–368. [Google Scholar] [CrossRef]
  7. Scarlett, N.V.Y.; Pownceby, M.I.; Madsen, I.C.; Christensen, A.N. Reaction sequences in the formation of silico-ferrites of calcium and aluminum in iron ore sinter. Metall. Mater. Trans. B 2004, 35, 929–936. [Google Scholar] [CrossRef]
  8. Webster, N.A.S.; Pownceby, M.I.; Madsen, I.C.; Kimpton, J.A. Silico-ferrite of calcium and aluminum (sfca) iron ore sinter bonding phases: new insights into their formation during heating and cooling. Metall. Mater. Trans. B 2012, 43, 1344–1357. [Google Scholar] [CrossRef]
  9. Hessien, M.M.; Kashiwaya, Y.; Ishii, K.; Nasr, M.I.; EI-Geassy, A.A. Sintering and heating reduction processes of alumina containing iron ore samples. Ironmak. Steelmak. 2008, 35, 191–204. [Google Scholar] [CrossRef]
  10. Jeon, J.W.; Kim, S.W.; Jung, S.M. Utilization of magnetite concentrate as an additive in adhering fines of quasi-particle and its effect on assimilation behavior. ISIJ Int. 2015, 55, 513–520. [Google Scholar] [CrossRef]
  11. Zhang, G.L.; Wu, S.L.; Su, B.; Que, Z.G.; Hou, C.G.; Jiang, Y. Influencing factor of sinter body strength and its effects on iron ore sintering indexes. Int. J. Miner. Metall. Mater. 2015, 22, 553–561. [Google Scholar] [CrossRef]
  12. Liu, D.H.; Liu, H.; Zhang, J.L.; Liu, Z.J.; Xue, X.; Wang, G.W.; Kang, Q.F. Basic characteristics of Australian iron ore concentrate and its effects on sinter properties during the high-limonite sintering process. Int. J. Miner. Metall. Mater. 2017, 24, 991–998. [Google Scholar] [CrossRef] [Green Version]
  13. Wei, R.R.; Lv, X.W.; Yang, M.R.; You, Z.X. Solidification of calcium ferrite melt using ultrasonic vibration: effect and mechanism. Metall. Mater. Trans. B 2018, 49, 2658–2666. [Google Scholar] [CrossRef]
  14. Tang, W.D.; Xue, X.X.; Yang, S.T.; Zhang, L.H.; Huang, Z. Influence of basicity and temperature on bonding phase strength, microstructure, and mineralogy of high-chromium vanadium–titanium magnetite. Int. J. Miner. Metall. Mater. 2018, 25, 871–880. [Google Scholar] [CrossRef]
  15. Xue, M.S.; Guo, X.M. Effect of Al2O3 and SiO2 on formation and crystal structure of calcium ferrite containing Al2O3 and SiO2. J. Chin. Rare Earth Soc. 2008, 26, 205–209. [Google Scholar]
  16. Chung, F.H. Quantitative interpretation of X-ray diffraction patterns of mixtures. I. Matrix-flushing method for quantitative multicomponent analysis. J. Appl. Crystallogr. 1974, 7, 519–525. [Google Scholar] [CrossRef] [Green Version]
  17. The XRD Pattern Processing Software Jade 6 for Identification and Quantification. Available online: http://www.materialsdata.com (accessed on 28 November 2018).
  18. Wang, J.F.; Wang, Z.; Guo, L.L. Measurement and Analysis of Equivalent Thermal Conductivity of Sinter. Chin. J. Proc. Eng. 2017, 17, 879–882. [Google Scholar]
  19. Incropera, F.P.; Lavine, A.S.; Bergman, T.L. Fundamentals of Heat and Mass Transfer, 6th ed.; John Wiley & Sons: Hoboken, NJ, USA, 2007. [Google Scholar]
Figure 1. Samples arrangement (a) and sintering schedule for CF and SFCA (b).
Metals 09 00402 g001
Figure 2. Comparison of XRD patterns of synthesized and standard CF.
Metals 09 00402 g002
Figure 3. Samples S1–S5 prepared with dimensions for test of linear expansion coefficient.
Metals 09 00402 g003
Figure 4. Homemade vertical tank cooling device: (a) Schematic diagram; (b) Detailed drawing of cooling tank with dimensions; (c) Top view of cooling tank; (d) Top view of sample support.
Metals 09 00402 g004aMetals 09 00402 g004b
Figure 5. XRD pattern of mixture of Fe2O3 and α-Al2O3 with mass ratio of 1:1.
Metals 09 00402 g005
Figure 6. XRD pattern of samples S1–S5 mixed with equivalent known quantities of α-Al2O3.
Metals 09 00402 g006
Figure 7. Relationship between the mass fraction of the SFCA and the corresponding n(Al2O3)/n(Fe2O3) value of the samples S1–S5.
Metals 09 00402 g007
Figure 8. SEM morphologies of samples S1–S5 magnified 50 times, 500 times, and 2000 times.
Metals 09 00402 g008
Figure 9. SEM morphology of sample S2 and corresponding map scan.
Metals 09 00402 g009
Figure 10. Secondary electron micrograph of sample S2 (a) and corresponding EDS line scanning spectrum (b).
Metals 09 00402 g010
Figure 11. Linear expansion coefficients of samples S1–S5 from 30 to 400 °C.
Metals 09 00402 g011
Figure 12. CRT values of samples S1–S5 from 30 to 400 °C.
Metals 09 00402 g012
Figure 13. Relationship between ω (SFCA) and average CRT of samples S1–S5.
Metals 09 00402 g013
Figure 14. Relationship between cooling methods and compressive strength of samples S1–S5.
Metals 09 00402 g014
Figure 15. Relationship between ω (SFCA) values and compressive strengths of samples S1–S5 with all cooling methods.
Metals 09 00402 g015
Figure 16. Comparison of average compressive strengths of samples S1–S5 after vertical tank cooling and other four cooling methods.
Metals 09 00402 g016
Figure 17. SEM morphologies of S2 magnified 50, 200, and 1000 times after using four different cooling methods: (I) cooling in water, (II) cooling in forced air, (III) cooling in air, and (IV) cooling in furnace.
Metals 09 00402 g017
Figure 18. Effect of SFCA content and Biot number on strength of iron ore sinter during cooling process.
Metals 09 00402 g018
Table 1. Initial composition of raw materials for SFCA synthesis.
SampleComposition/gn(Al2O3)/n(Fe2O3)
CFFe2O3Al2O3SiO2
S15.4002.6880.3260.6000.190
S25.4002.4640.4690.6000.299
S35.4002.2400.6120.6000.429
S45.4001.9200.8160.6000.667
S55.4001.6001.0200.6001.000
Table 2. Details of five cooling methods.
No.Cooling MethodCooling Process
ICooling in water800 °C→water
IICooling in forced air800 °C→forced air in 30 m3/h
IIICooling in air800 °C→air
IVCooling in the furnace800 °C→in the furnace
VVertical tank cooling800 °C→in tank to 600 °C→
forced air in 10 m3/h to 150 °C→in air
Table 3. Mass fractions of pure SFCA in samples S1–S5.
SampleS1S2S3S4S5
ω (SFCA)/%91.1191.5887.3589.1089.56
89.9890.8886.6587.9088.62
Average90.5691.2386.7088.5089.09
Table 4. EDS analysis results for the points a, b, and c in Figure 9.
ElementWeight Percent/%Atom Percent/%
Point aPoint bPoint cPoint aPoint bPoint c
O38.9338.9323.9254.5653.2949.23
Al44.730.954.3537.170.775.31
Si0.3957.341.160.3144.721.36
Ca9.800.8610.735.480.478.82
Fe6.151.9359.832.470.7635.28
Table 5. The values of Cw,l, C, n of method (I), (III), (IV) and the calculated α and Biot numbers.
Cooling MethodType of ConvectionCw,lCnα/W/(m2 · °C)Biot Number
Istable film boiling---1973.1011.36Average
231.30
transition boiling---23965.83138.02
bubble boiling0.0128--133224.6767.26
natural convection-0.1250.33314908.57
IIforced convection---42.5190.245
IIInatural convection-0.4800.25013.6000.0781
IVnatural convection-0.8500.18812.2000.0705
Vforced convection---25.5480.147

