Article

Influence of Excess Volumes Induced by Re and W on Dislocation Motion and Creep in Ni-Base Single Crystal Superalloys: A 3D Discrete Dislocation Dynamics Study

Interdisciplinary Centre for Advanced Materials Simulation, Ruhr-Universität Bochum, 44801 Bochum, Germany
*
Author to whom correspondence should be addressed.
Metals 2019, 9(6), 637; https://doi.org/10.3390/met9060637
Submission received: 20 March 2019 / Revised: 23 May 2019 / Accepted: 25 May 2019 / Published: 1 June 2019
(This article belongs to the Special Issue Creep and High Temperature Deformation of Metals and Alloys)

Abstract

:
A comprehensive 3D discrete dislocation dynamics model for Ni-base single crystal superalloys was used to investigate the influence of excess volumes induced by solute atoms Re and W on dislocation motion and creep under different tensile loads at 850 ° C. The solute atoms were distributed homogeneously only in γ matrix channels. Their excess volumes due to the size difference from the host Ni were calculated by density functional theory. The excess volume affected dislocation glide more strongly than dislocation climb. The relative positions of dislocations and solute atoms determined the magnitude of back stresses on the dislocation motion. Without diffusion of solute atoms, it was found that W with a larger excess volume had a stronger strengthening effect than Re. With increasing concentration of solute atoms, the creep resistance increased. However, a low external stress reduced the influence of different excess volumes and different concentrations on creep.

1. Introduction

The new generation Ni-base single crystal superalloys that are used to make turbine blades in aero engines show a significant improvement of the mechanical properties at high temperatures when adding specific solid solution elements, such as Re and W [1,2,3]. The cuboidal γ precipitates with a high volume fraction separated by the narrow γ matrix channels form the typical microstructure of superalloy single crystals [4]. Both the γ / γ microstructure and dislocation motion inside are influenced by these elements. An increasing content of Re and W increases the volume fraction of cuboidal γ phase, and Re decreases the γ particle size, while W has no effect on the size of γ [5,6]. During creep, Re decelerates the coarsening and rafting of γ precipitates [7,8], as well as Re and W retard the dislocation motion through solid solution strengthening mechanisms [9,10]. Due to the atomic size difference and shear modulus mismatch between solute and solvent, the solute atoms can impede dislocation motion by parelastic and dielastic interactions, respectively [11,12,13]. Moreover, the stacking fault energy can be reduced by increasing solute concentration, such that more solute atoms segregate to the core of the dissociated dislocation and therefore drag dislocation glide [14]. The mobility of vacancies is hardly influenced by the solute atoms within the dilute limit [15], but the low stacking fault energy induced by the solute atoms can raise the migration energy of vacancies to hinder dislocation climb [9]. Although discussions about the effect of solute atoms in superalloys, especially Re, have been proposed in a view of experiments [2,8,16,17,18,19], the debate still exists. Furthermore, in complex superalloys, many possible effects of solute atoms can occur simultaneously, thus it is difficult to clarify how each individual mechanism relates to the creep properties. A 3D discrete dislocation dynamics (DDD) model is used in the present work to exclusively elucidate the effect of excess volume due to the size mismatch between solute atoms (Re and W) and the Ni matrix on the dislocation motion and creep.
Extensive experimental studies have shown that the creep mechanisms in single crystal superalloy involve the dislocation motion. The creep deformation generally starts with the dislocations filling γ matrix channels, and continues with the dislocation climb along γ / γ interfaces and the shearing of γ precipitates [4,20,21]. For different temperatures and different loading conditions, the microstructural and dislocation evolution during creep is diverse. At high temperatures above 900 ° C and low stresses below 400 MPa, the rafting of γ precipitates happens due to the γ / γ lattice mismatch and the heterogeneity of γ matrix plasticity [22,23]. The shearing of γ precipitates by pairs of superdislocations combined with anti-phase boundary (APB) is usually observed at the temperature higher than 850 ° C [24,25,26,27]. When the temperature is lower than 850 ° C and the stress is higher than 500 MPa, the shearing of γ precipitates by superlattice stacking faults is found, and the microtwins appear for some non-〈100〉-oriented superalloys [28,29,30,31,32]. The DDD model, as an outstanding tool to simulate the dislocation motion, has been used to investigate the deformation behavior in superalloys widely. The dislocation glide in γ channels, the shearing of γ precipitates, the effect of dislocation climb, and the interaction of interfacial dislocations are well discussed by using different DDD methods [33,34,35,36,37,38,39]. However, the DDD study on the influence of substitutional atoms in superalloys is rare thus far. In addition, some authors incorporate the elastic stress induced by the concentration of interstitial atoms in the DDD simulation to quantify the effect of hydrogen on dislocations [40,41]. For the large substitutional atoms which form neither the cluster nor the cloud, we introduced the individual solute atoms in specific positions of our DDD simulation cell. In this work, the DDD model captures all the important deformation mechanisms of superalloys, including the dislocation glide and dislocation climb associated with the vacancy diffusion in the γ / γ microstructure [39]. We performed simulations at a temperature of 850 ° C, at which the morphology change of γ precipitates is absent. According to a previous study [15], the diffusion coefficients of Re and W at 850 ° C are approximately 1.0 × 10 18 m 2 /s and 1.0 × 10 17 m 2 /s, respectively. In the DDD time scale, such slow diffusion can be neglected. Moreover, it is stated that the mobility of vacancies is only minimally influenced by the solute atoms in Ref. [15]. Therefore, the diffusion of solute atoms and their interaction with vacancies were not taken into account. Furthermore, the segregation of Re around the dislocation line in γ precipitates by the pipe diffusion at the later creep stage observed at 750 ° C and 800 MPa could not be simulated by our current model [19]. For the shear modulus, we utilized a general value of Ni-base superalloys [42]. The excess volumes of Re and W solute atoms in pure Ni were obtained by density functional theory (DFT) calculations, which were applied in the DDD simulation to determine the back stresses on dislocations. Some experimental evidence shows that Re and W mainly partition to the γ matrix and no Re cluster is found in the undeformed microstructure [43,44,45,46,47]. Therefore, in this work, Re and W were only introduced into the γ channels to qualitatively study the influence of their respective excess volumes on the dislocation motion, and the corresponding dislocation motion controlled creep behavior was compared for different concentrations of Re and W.

2. Simulation Method

2.1. Implementation of Excess Volume Effect in Dislocation Dynamics

In our previously developed 3D discrete dislocation dynamics model [39], the shear stress of dislocation glide and the mechanical force of dislocation climb are generally determined from the main stresses by the Peach–Köhler equation in the glide and climb directions, respectively. The main stresses include the external stress, the internal stress from other dislocations, and the misfit stress due to the γ / γ lattice mismatch [48]. The total effective stress on dislocation glide is also influenced by the line tension and the Peierls stress. In addition, the local chemical potential of vacancies gives rise to an osmotic force, which varies with the temperature and the local concentration of vacancies, affecting the dislocation climb. The vacancy diffusion is solved in a “meso” scale by a combination of finite difference method and fast Fourier transformation method. The velocity of dislocation motion is calculated by a linear relation from the effective stress with a mobility. The mobility of dislocation glide is determined by the drag coefficient, while the mobility of dislocation climb is based on the bulk diffusion such as other studies, in which the pipe diffusion along the dislocation line is not considered [49,50,51,52]. Because the mobility of dislocation climb is much smaller than the dislocation glide, we used a larger time step for dislocation climb. Initially, only dislocation glide with a small time step starts. When the plastic strain produced by dislocation glide is smaller than a threshold value, one step of dislocation climb with a large time step is activated, and afterwards dislocation climb step changes back to the glide step. The criterion of dislocation glide step changing to dislocation climb step is defined as | 1 ϵ eq t / ϵ eq t Δ t | < 10 4 , where ϵ eq t and ϵ eq t Δ t are the equivalent plastic strains produced by dislocation glide in the present and previous time step, respectively. The dislocation glide dominates the primary creep stage. The alternating dislocation glide and climb governs the secondary creep stage. For the shearing of γ precipitates, we implemented the mechanism of the creation of APB by a single cutting dislocation and the destruction of APB by a second dislocation on the same slip plane behind the first dislocation, which is explained in our previous paper [48]. A single dislocation has to overcome a high APB stress to move in the γ precipitate further. Without another dislocation coming from the same slip plane to delimit the APB, the cutting event rarely occurs. If we set the periodical boundary condition as an exact cubic periodicity for the dislocation motion in the simulation, the dislocation going out of the simulation box would return back on the exact same slip plane. This would increase the probability of two dislocations forming the pair of superdislocations artificially. To avoid the spurious self-cutting, an orthorhombic periodicity was used.
The dislocation line is discretized into an alternating sequence of pure straight edge and screw segments in our DDD code [53,54,55]. Each edge or screw dislocation segment was characterized by its line direction and glide direction precisely. The stress field of dislocation segment is calculated by a sum of stress fields of two semi-infinite dislocations [55,56]. The effective stress was applied on the middle point of each dislocation segment. On the basis of this edge-screw structure, we introduced additional back stresses due to the parelastic interaction between solute atoms and dislocations. If a solute atom with a different size from the matrix atoms were incorporated into the crystal, the generated excess volume would result in an interaction energy [13] of
Δ E = p Δ V 3 1 ν 1 + ν ,
where p is the hydrostatic stress field of a dislocation, Δ V is the excess volume, and ν is the Poisson’s ratio. From a cross-section of an edge dislocation segment at the middle point perpendicular to its line direction, we found the stress field of the dislocation segment has the same feature as that of an infinite long straight edge dislocation [57]. For the qualitative study, we used the hydrostatic stress from an infinite long straight edge dislocation to calculate the back stress approximately, which is given by
p = 1 3 ( σ x x + σ y y + σ z z ) = μ b 3 π 1 + ν 1 ν y x 2 + y 2 ,
where σ x x , σ y y , and σ z z are the normal stress components of the elastic stress field of an edge dislocation, μ is the shear modulus, and b is the magnitude of the Burgers vector. The dislocation line is along z-direction, while x and y represent the coordinates with respect to the glide and climb directions, respectively. By inserting Equation (2) into Equation (1), we obtain
Δ E = μ b Δ V π y x 2 + y 2 .
Thus, the parelastic interaction forces due to a solute atom can be determined by the derivatives of Δ E with respect to x in the dislocation glide direction
F gl p = Δ E x = μ b Δ V π 2 x y ( x 2 + y 2 ) 2 ,
and y in the dislocation climb direction
F cl p = Δ E y = μ b Δ V π y 2 x 2 ( x 2 + y 2 ) 2 ,
respectively. For a dislocation segment of length l, the back stress due to the parelastic interaction force is given by
τ bk = F p b l .
The back stress has the opposite sign of the effective stress on the dislocation, which is only added on edge dislocation segments, because screw dislocations have no hydrostatic stress field. When edge segments in a dislocation line are hindered by the back stress, their connected screw segments will be also hindered due to the local line tension.

2.2. Calculation of Excess Volumes

To obtain accurate values for the excess volume of the solute atoms, we employed DFT calculations. We used the projector augmented wave (PAW) method [58,59] as implemented in the Vienna Ab initio Simulation Package (VASP 5.4) [59,60,61,62] with the gradient corrected PBE exchange-correlation functional [63]. All calculations were carried out spin-polarized in ( 3 × 3 × 3 ) face-centered cubic (fcc) supercells with a [ 5 × 5 × 5 ] Monkhorst–Pack k-point mesh [64]. The lattice constant before relaxation is around 3.518 Å, which is close to the equilibrium lattice constant of Ni. The convergence of the electronic self-consistency was set to 10 7 eV and ionic positions were relaxed until all forces were below 0.01 eV Å 1 .
The equilibrium volumes of the supercells are determined in two different ways: by direct relaxation of the ionic positions, the cell shape, and the cell volume; and by fitting energy-volume curves using the Birch–Murnaghan equation of state [65]. In the former approach, the change in volume during the calculation leads to Pulay stresses [66], which result in an underestimation of the equilibrium volume. Furthermore, this approach is more sensitive with respect to the energy cutoff for the plane waves. To check the convergence of the excess volume as a function of the energy cutoff, calculations were performed for cutoffs of 450–700 eV. To record the energy–volume curves in the latter approach, supercells with ± 2 % change in the lattice constant around the equilibrium value are setup. For each volume, ionic positions are fully relaxed. The excess volume of atom X is calculated as
Δ V X = V Ni 107 X V Ni 108 ,
where V is the volume of the ( 3 × 3 × 3 ) fcc supercell with one solute atom ( V Ni 107 X ) and in pure Ni ( V Ni 108 ).

2.3. Dislocation Dynamics Setup and Solute Atom Arrangement

The same γ / γ microstructure of Ni-base single crystal superalloys as in our previous study [39] was used in this work. As shown in Figure 1, 48 Frank–Read sources with an average length of 154 nm were randomly distributed on 12 slip systems in the γ channels with a uniform width of approximately 80 nm. The volume fraction of the cuboidal γ precipitates was approximately 66%. The initial dislocation density was 1.8 × 10 12 m 2 . The whole simulation box had a size of 1890×1890×1890 nm 3 , but the periodicity for the dislocation motion was set as 1890 nm×1910 nm×1930 nm. The material parameters used in the current study were the same as in Ref. [39]. The time steps of dislocation glide, climb and vacancy diffusion were 0.1 ns, 0.3 s, and 0.3 s, respectively.
A strong partitioning of Re to the γ phase has been observed experimentally [43,44]. In addition, no Re clusters and no Re enrichment in the un-crept superalloys have been detected in 3D atom probe analysis and scanning transmission electron microscopy [45,46,47]. Although W is found in both the γ and γ phase with similar concentrations [43,44], only W in the γ phase was considered in the present study to directly compare the effect of Re and W. Neglecting the influence of solute atoms in the γ precipitates, we introduced homogeneously distributed solute atoms only in γ channels in our DDD simulations. The individual solute atoms were distributed on regular 3D grids with three different grid lengths of 5.4 nm, 10.8 nm, and 12.6 nm, which correspond to different solute concentrations of approximately 7 × 10 3 at.%, 9 × 10 4 at.%, and 6 × 10 4 at.%, respectively. These concentrations are much lower than the actual solute concentration in superalloys, but our simulations could provide qualitative trends with increasing solute content.
To determine the back stresses, the distances between the middle point of every edge dislocation segment and every solute atom in both glide and climb directions were calculated. The total back stress for one edge dislocation segment was the sum over the interaction with all solute atoms. We assumed that the minimum effective distance between the dislocation segment and the solute atom was 1.5 Å. The mechanism of the solute atom passing through the dislocation core was not taken into account, since there is no unequivocal theory to describe the interaction between a solute atom and a dislocation core thus far. Hence, when the distances in both glide and climb directions were smaller than 1.5 Å, the back stress was set to the value at the the minimum effective distance in the present simulations.

3. Results

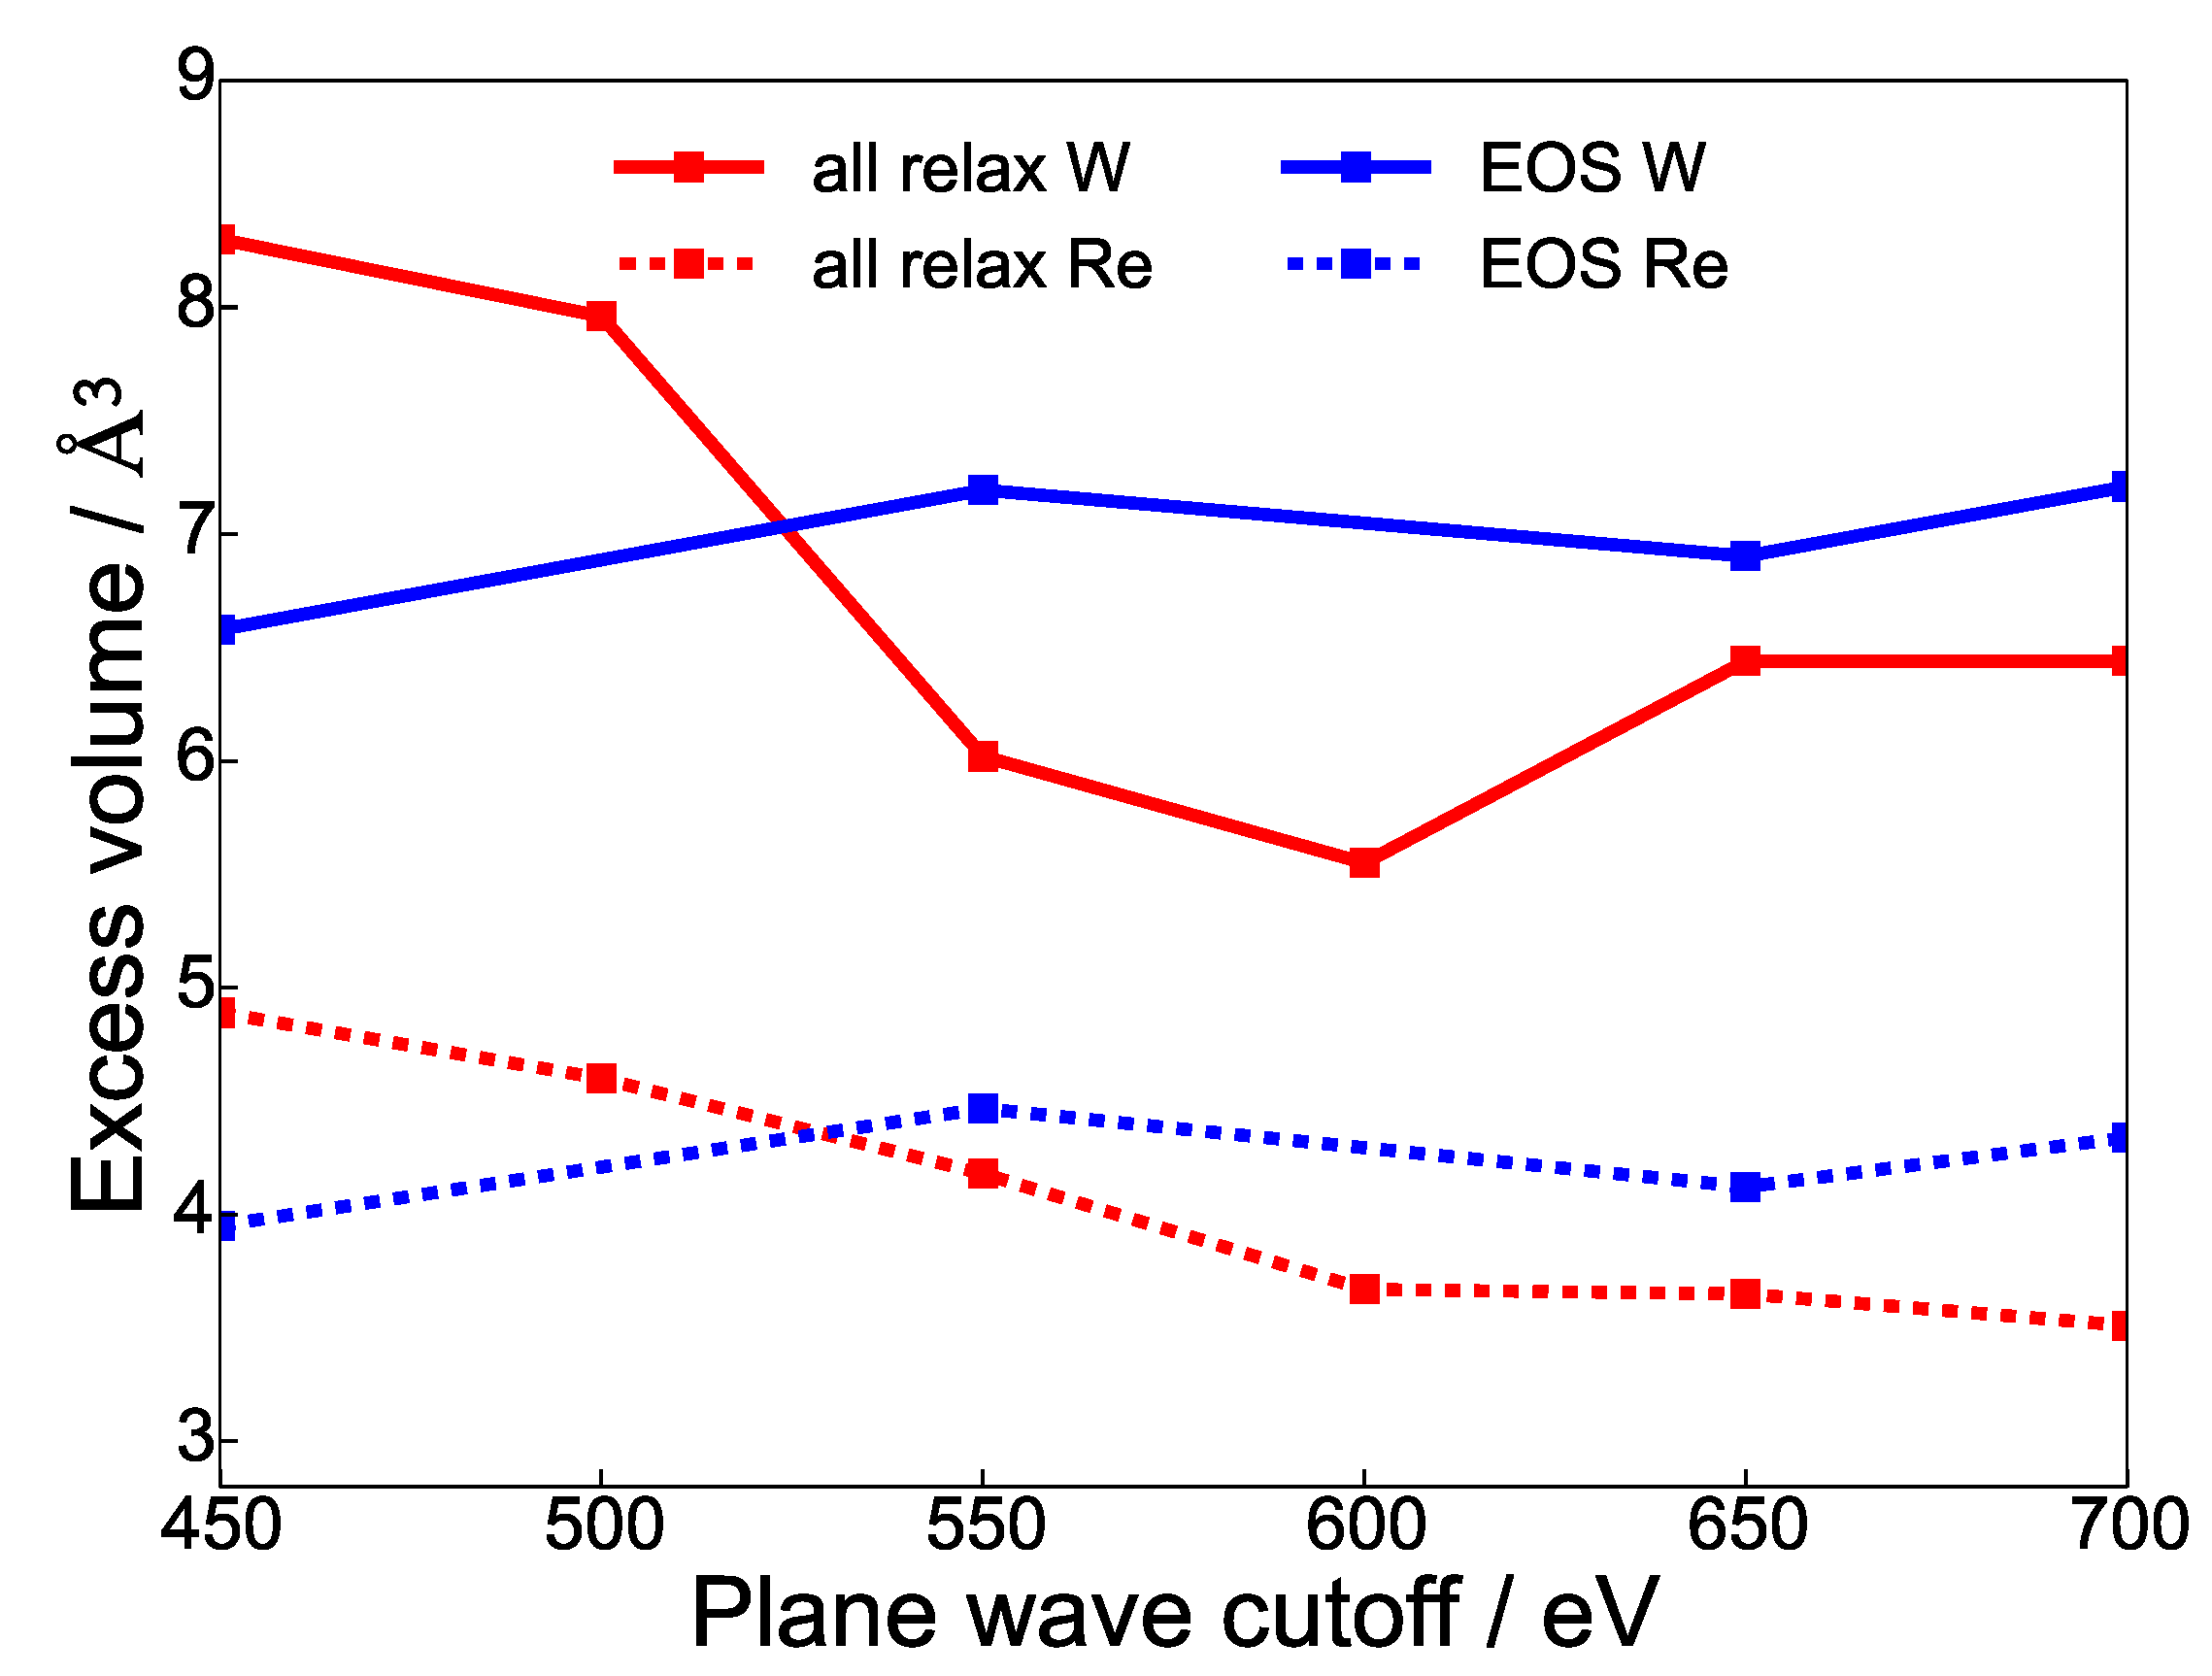
3.1. Calculated Excess Volumes

The dependence of the excess volume of Re and W in Ni on the energy cutoff for the plane waves in the DFT calculations is shown in Figure 2. As discussed in Section 2.2, we employed two approaches to determine the equilibrium volumes, a complete relaxation of all degrees of freedom including the cell shape and volume (red lines in Figure 2) and a fit to the energy–volume curves using the Birch–Murnaghan equation of state (blue lines in Figure 2). Due to the Pulay stresses, the excess volume extracted from the complete relaxation converged only slowly with the plane wave cutoff, and even for a rather high energy cutoff of 700 eV the values were not fully converged. The values extracted from the Birch–Murnaghan fits converged much more quickly and were more robust. The excess volumes of both Re and W determined by the complete relaxation were underestimated, also due to the presence of Pulay stresses. For the DDD simulations, we correspondingly used the excess volumes calculated with our second approach yielding values of 4.34 Å 3 for Re and 7.21 Å 3 for W at an energy cutoff of 700 eV. Independent of the computational approach, the excess volume of Re was always smaller than the one of W.
The excess volume could also be estimated based on the atomic radii. The conventional covalent radii of Ni, Re, and W are r Ni = 1.24 Å, r Re = 1.51 Å, and r W = 1.62 Å, respectively. The corresponding excess volumes are 6.43 Å 3 for Re and 9.82 Å 3 for W. Qualitatively, this simple estimate was in agreement with our DFT calculations, but quantitatively the excess volumes were significantly overestimated. The implications for the corresponding deformation resistance is discussed below.

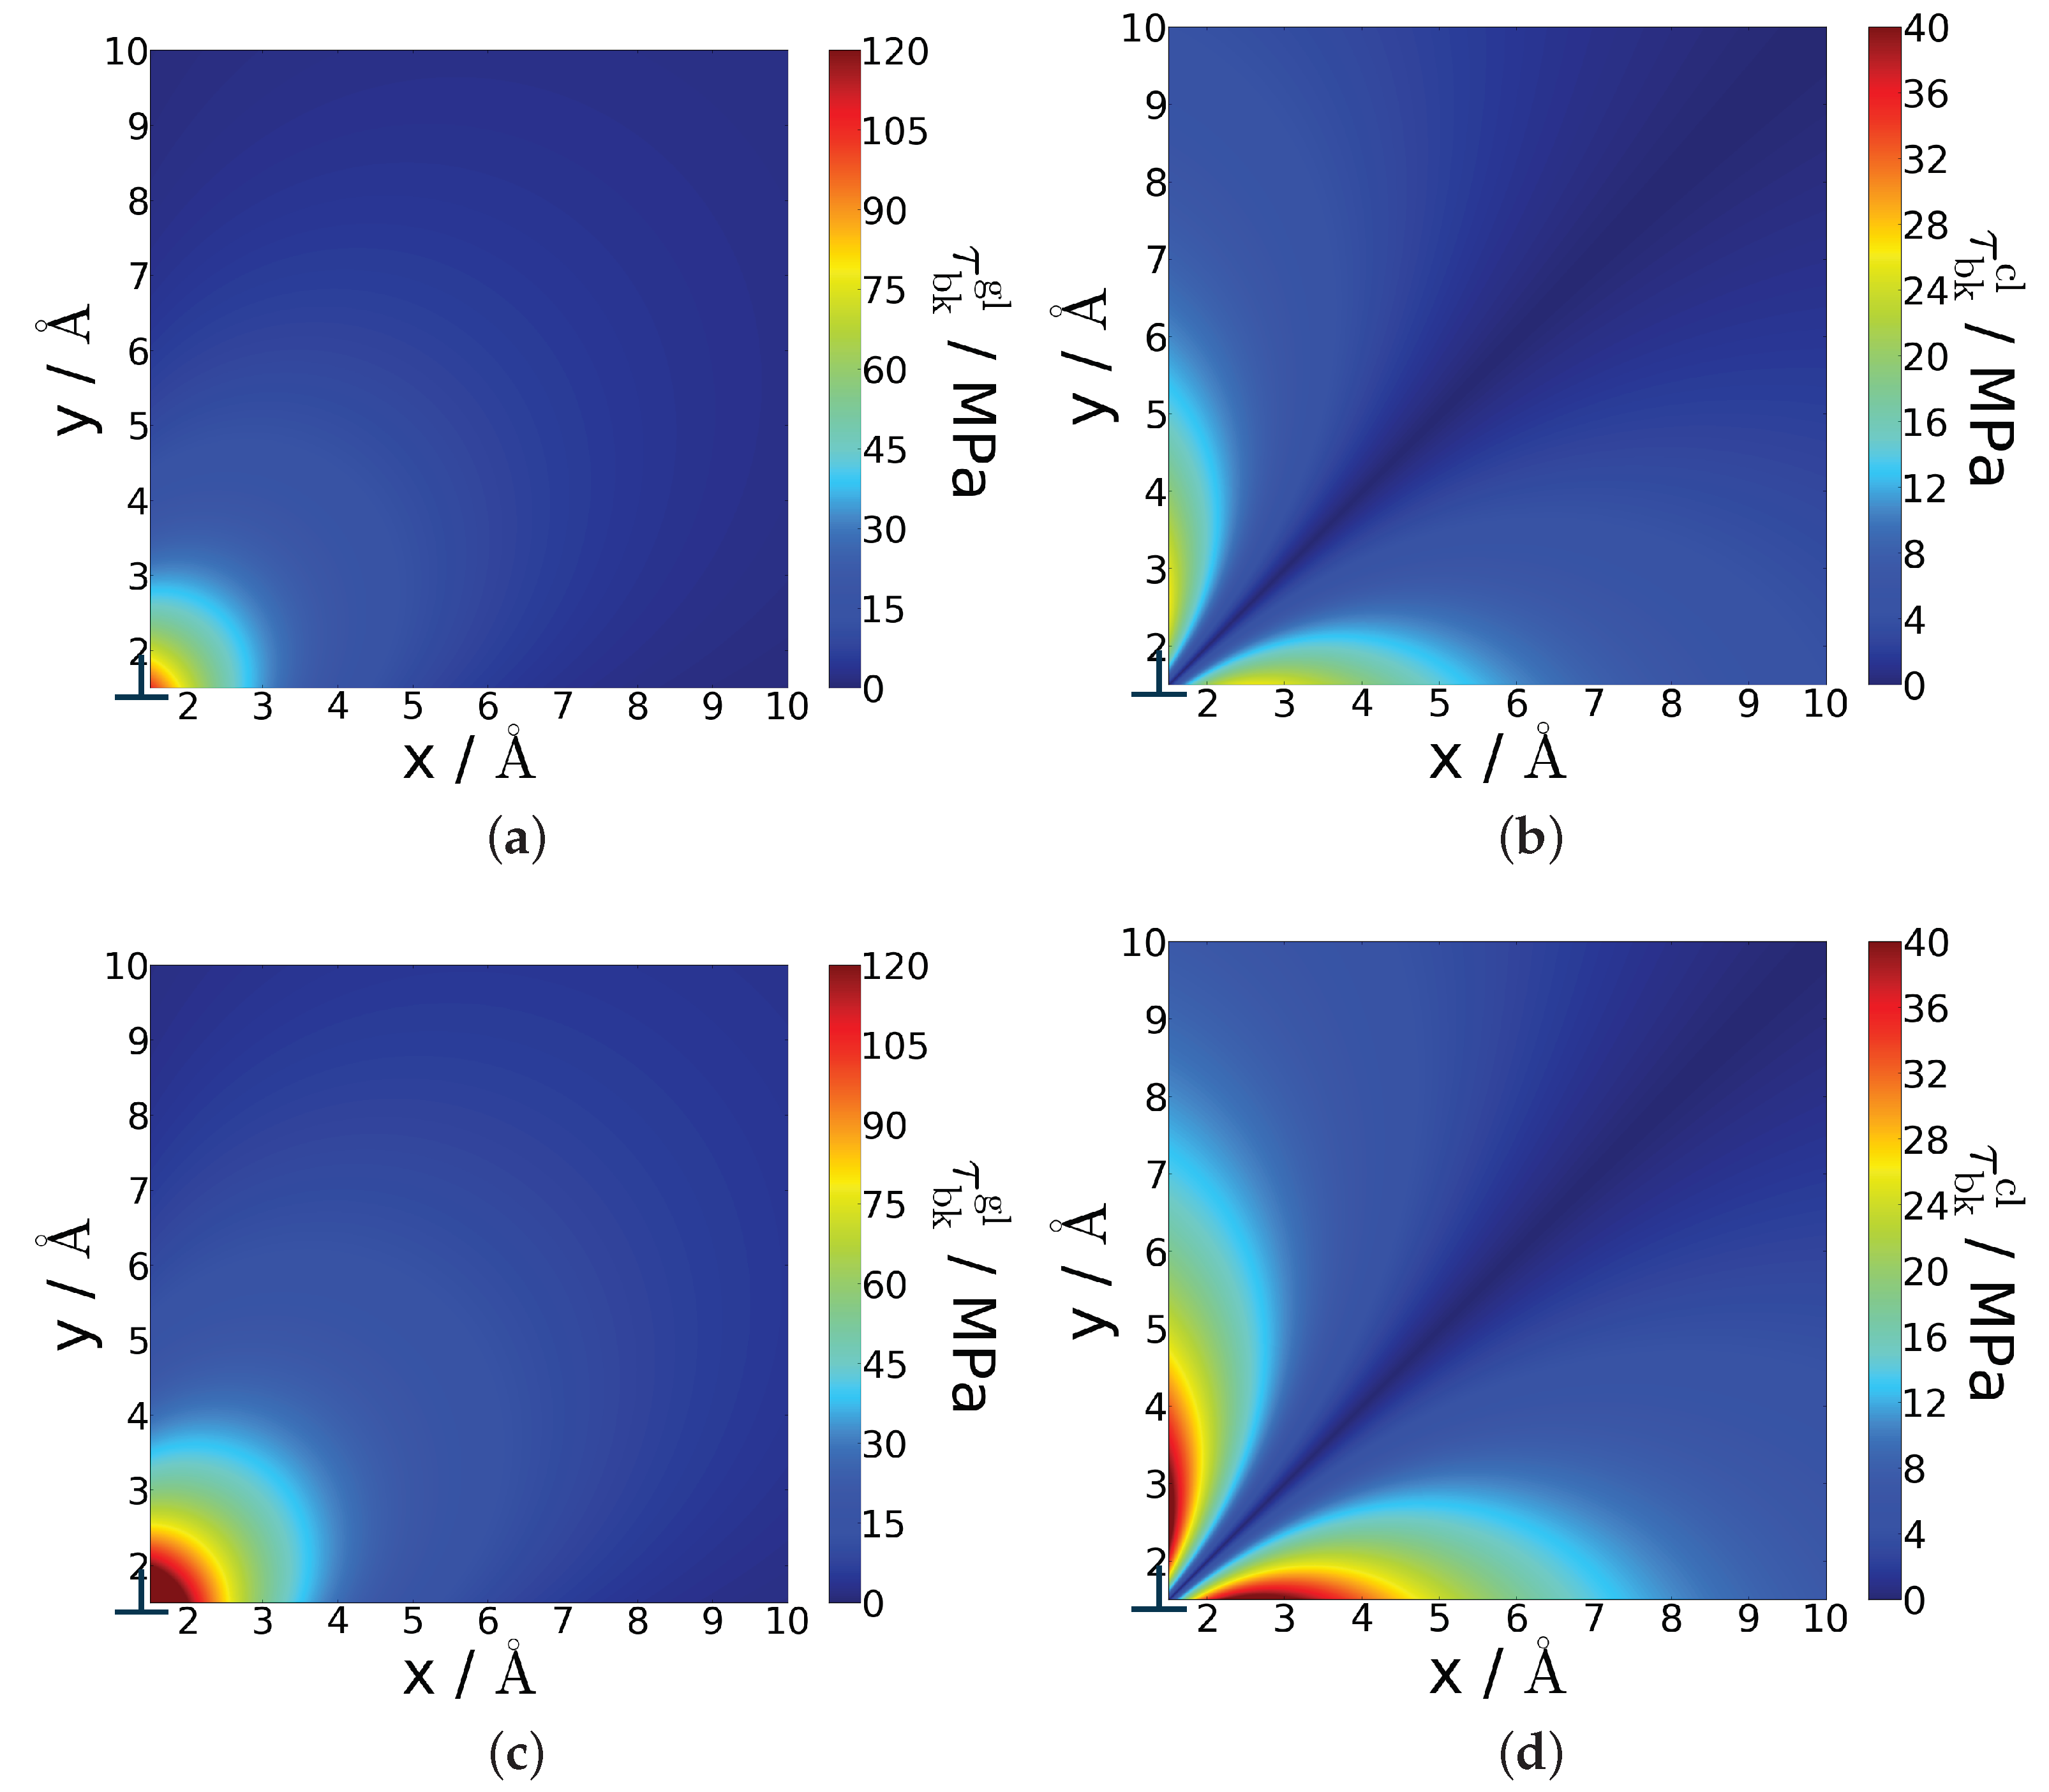
3.2. Back Stress on Dislocations Due to Excess Volume

Assuming an edge dislocation segment with a length of 1 nm, the back stresses for its glide and climb due to the presence of a Re or W atom was calculated using the DFT excess volumes and Equations (4)–(6). Neglecting any influence along the dislocation line direction, the back stresses decreased with increasing distance between the atom and the dislocation core, as shown in Figure 3. When the distance was larger than 10 Å, the back stresses were almost zero. This demonstrated that only when the atom was very close to the dislocation core the effect of the back stresses became important. The back stresses for dislocation glide and climb showed a different dependence on the position of the atom in the plane. For instance, if a Re atom were located at x = 2.0 Å and y = 2.0 Å, the back stress for glide, τ bk gl , would be approximately 60 MPa (Figure 3a), whereas the back stress for climb, τ bk cl , would be lower than 4 MPa (Figure 3b). For some other configurations, τ bk cl could be larger than τ bk gl . However, the maximum value of the back stress for dislocation climb was much smaller than for dislocation glide. Moreover, because of the larger excess volume of W, the back stresses for W were higher than for Re.

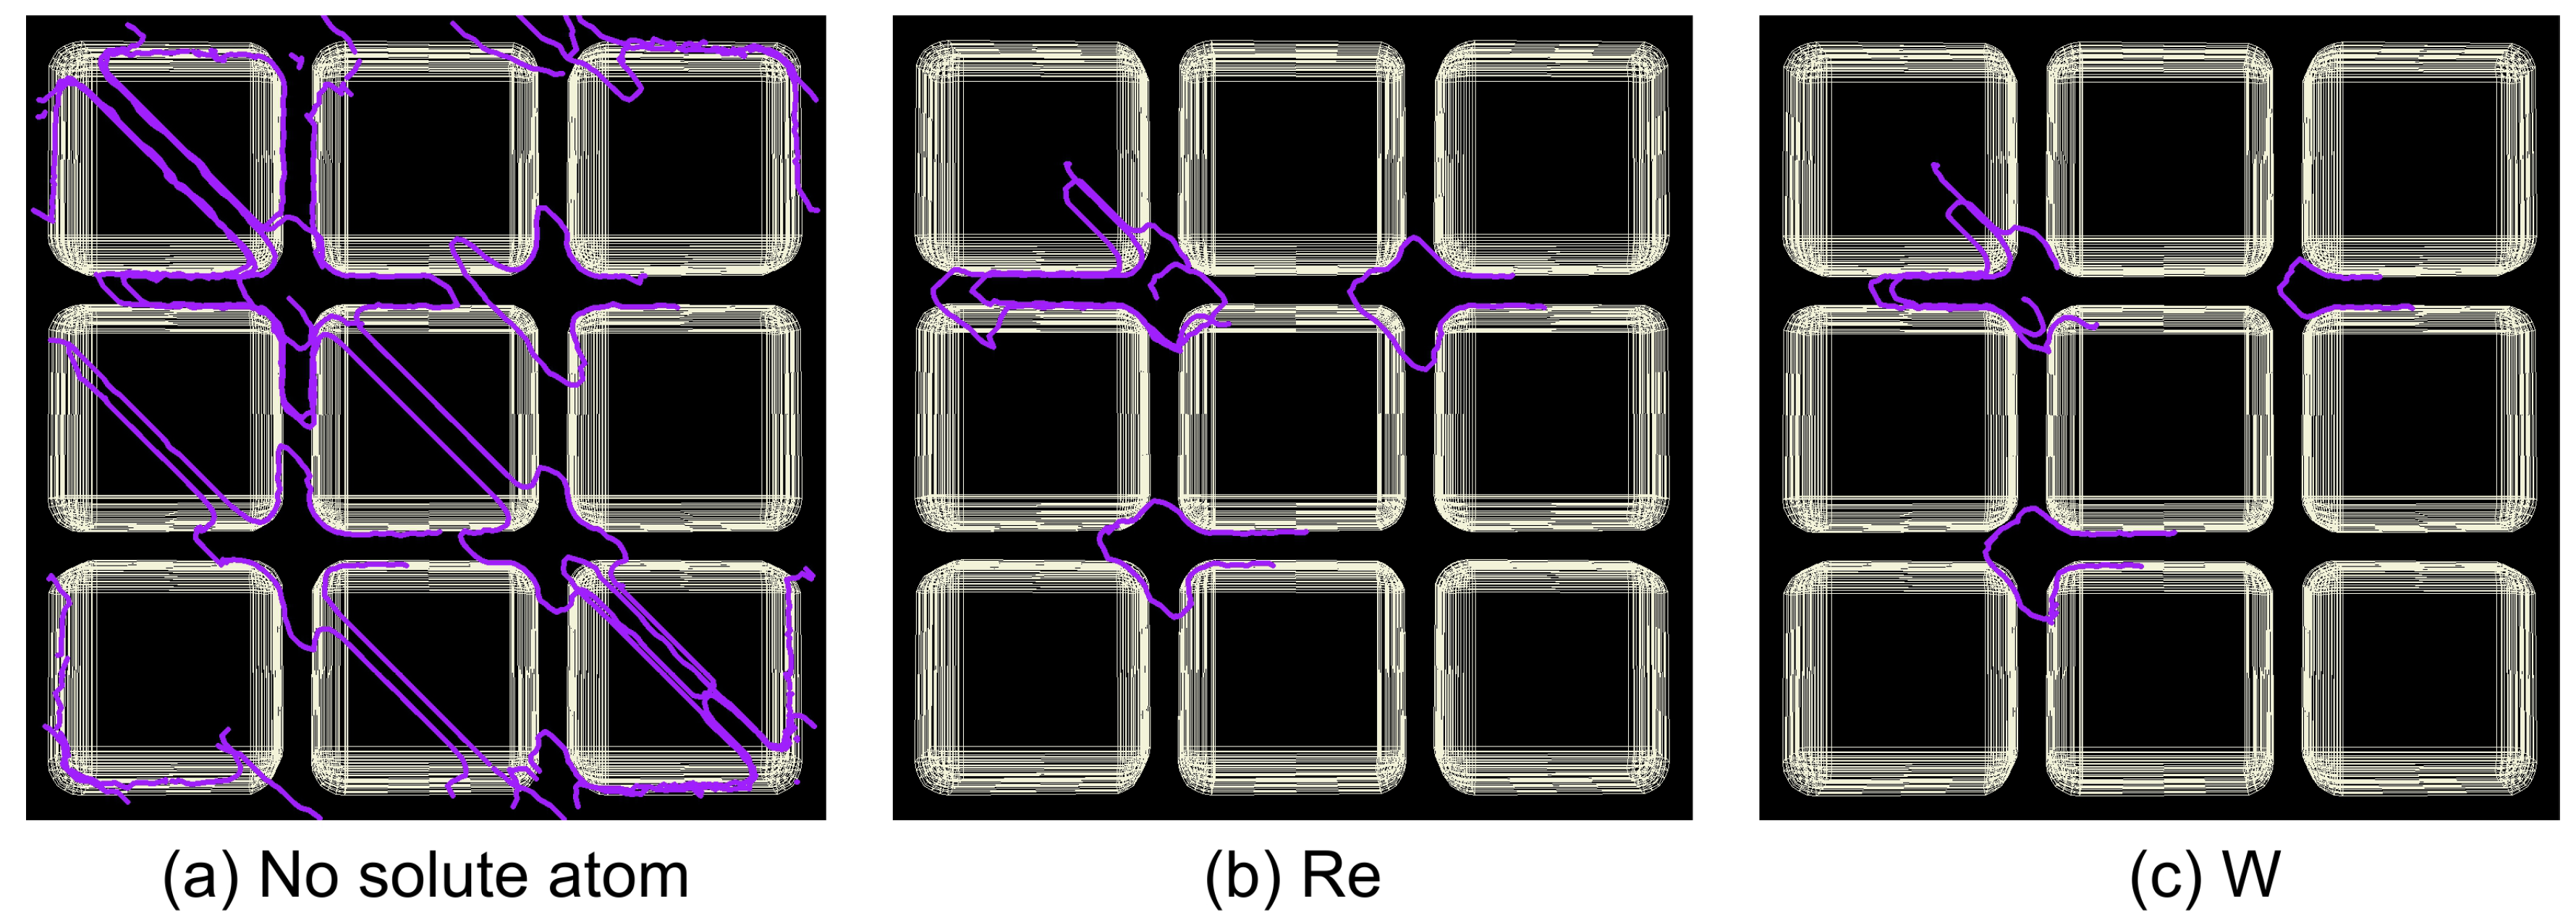
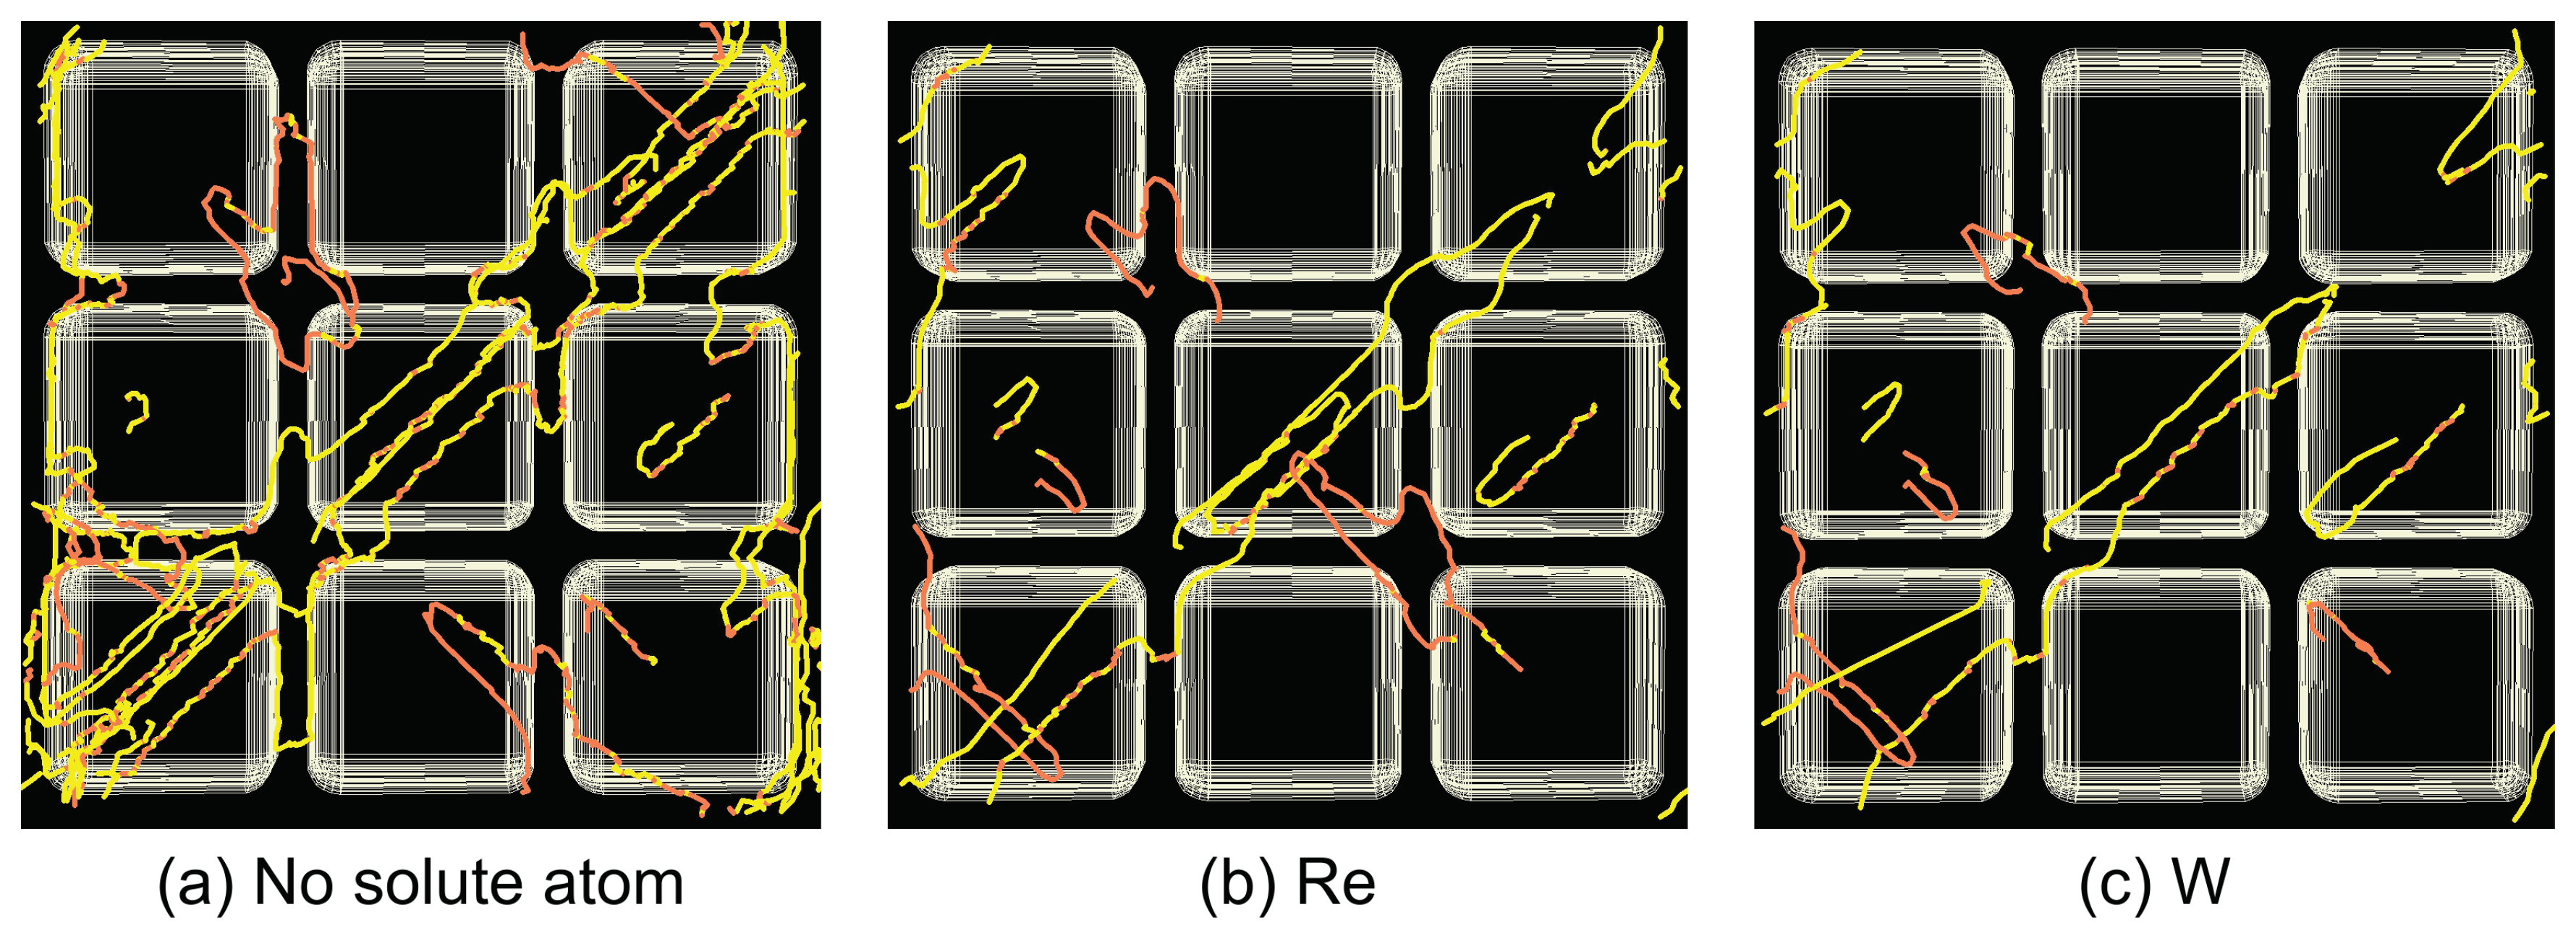
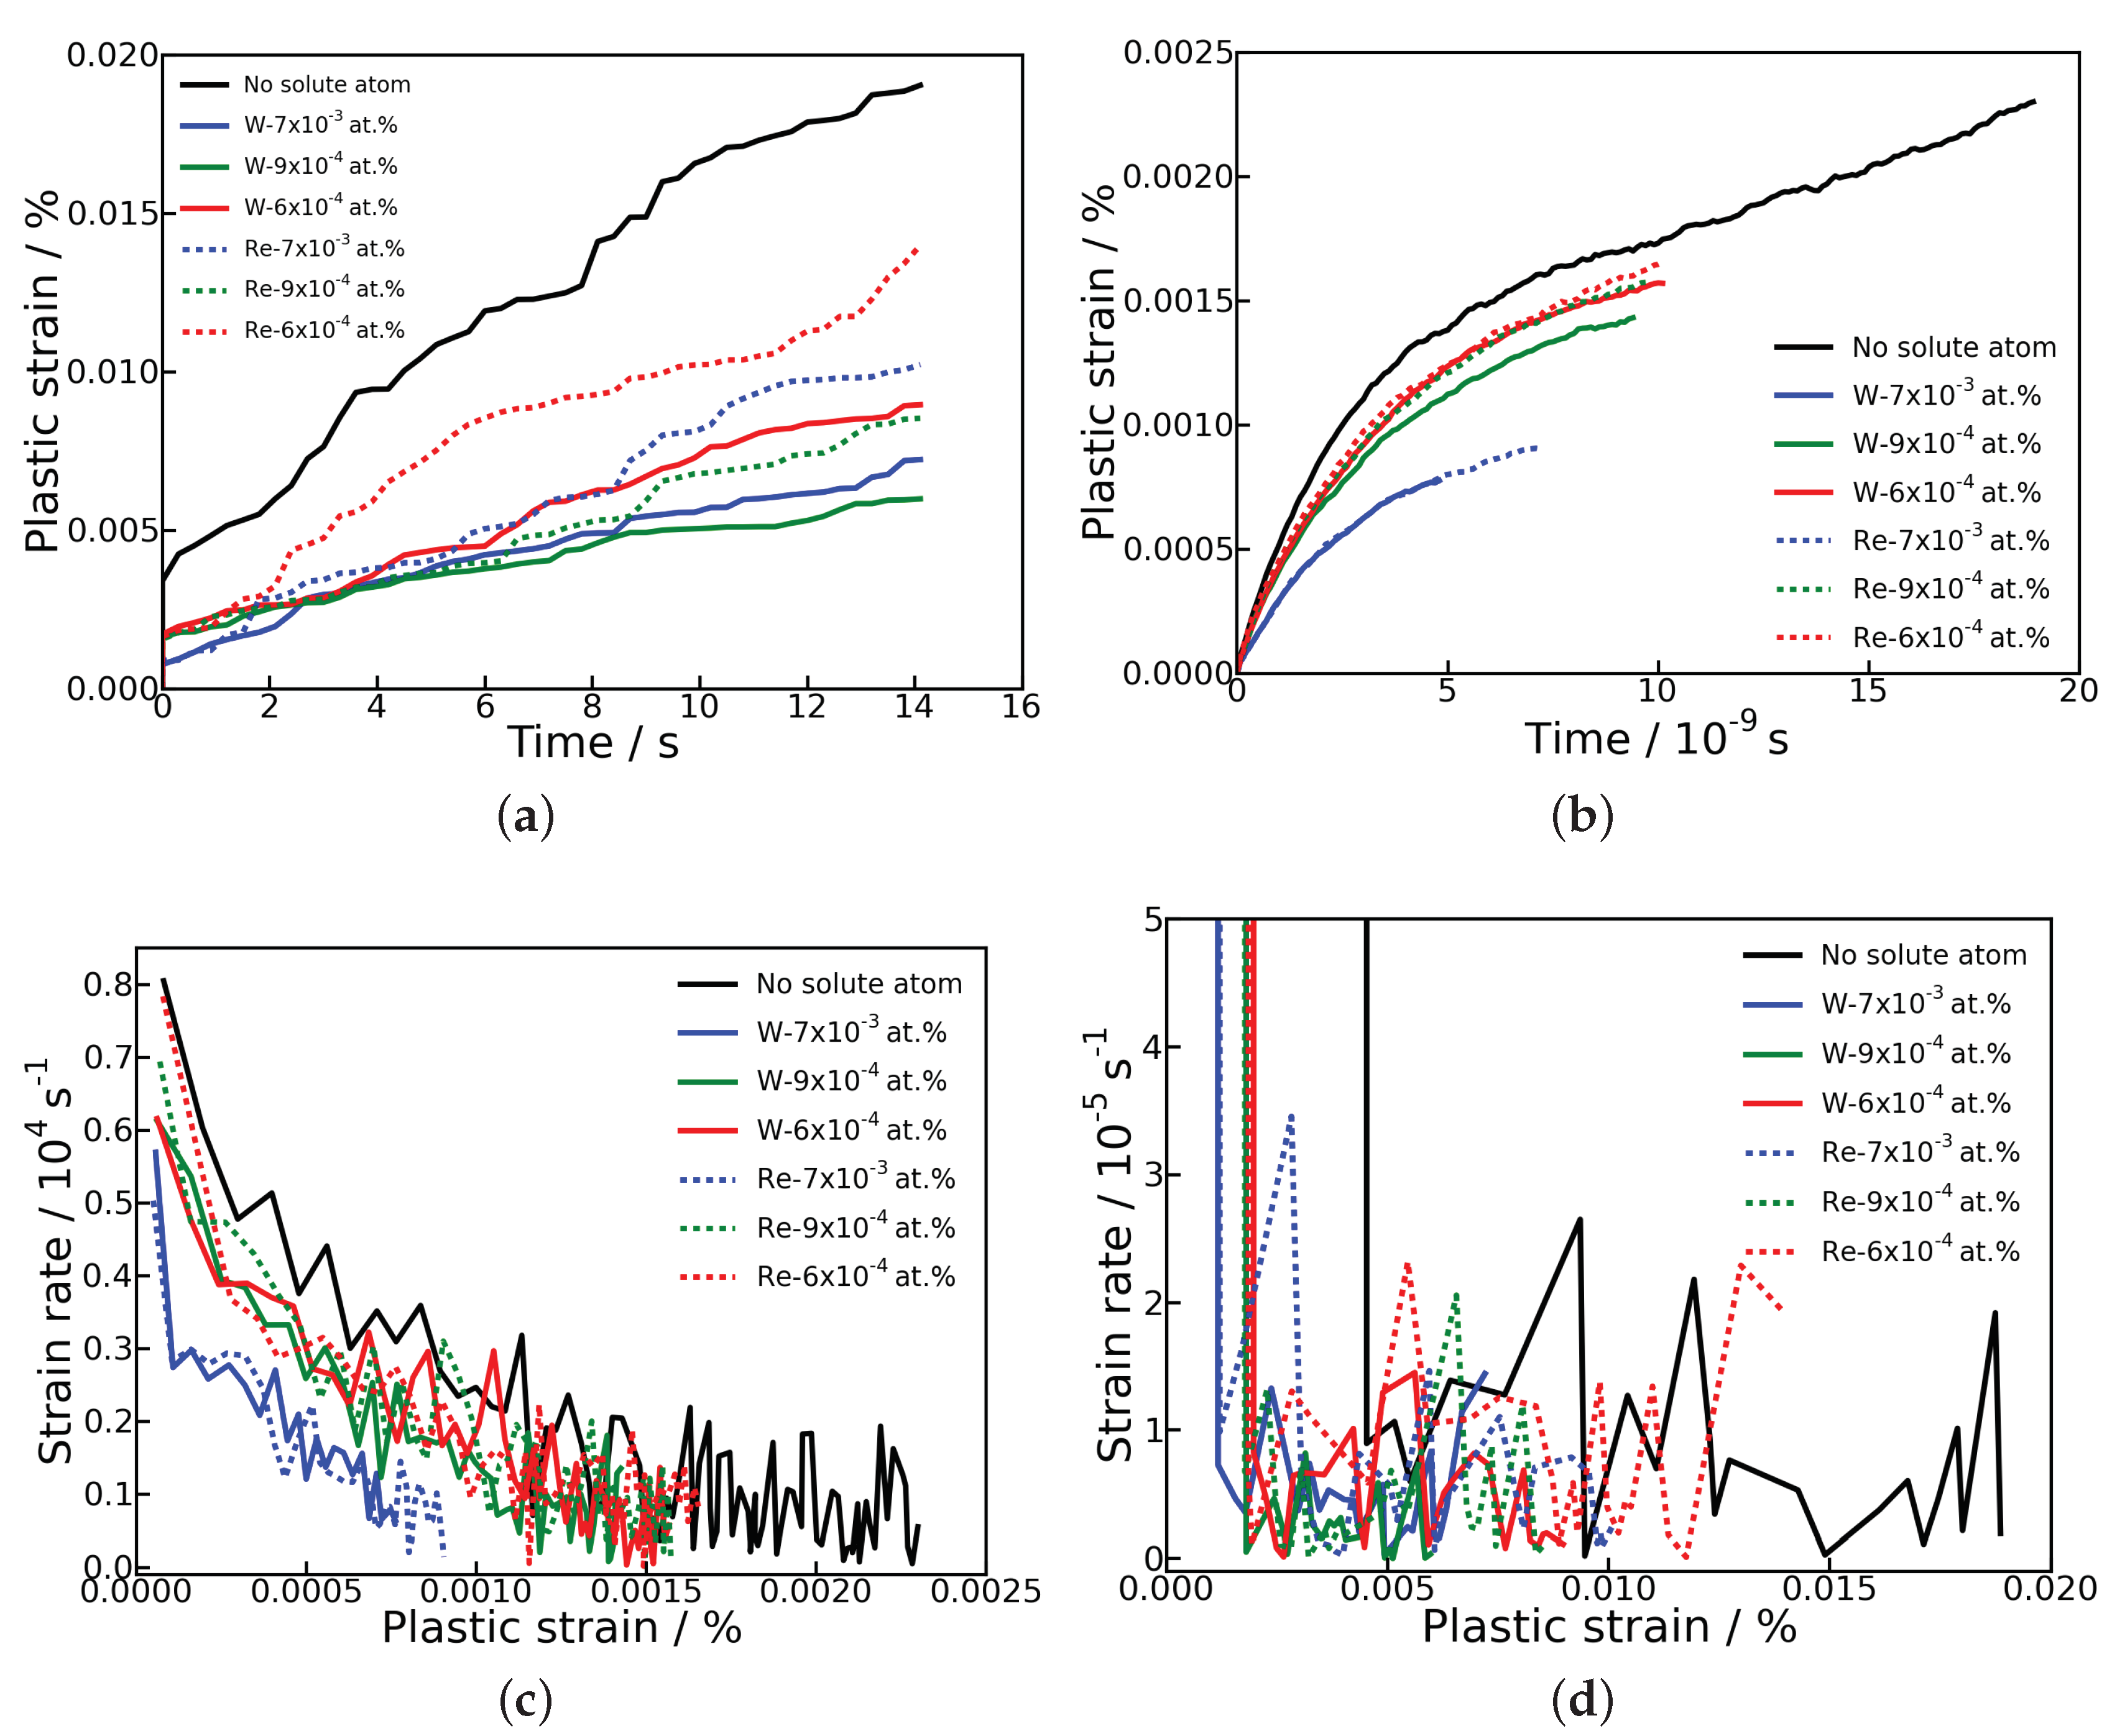
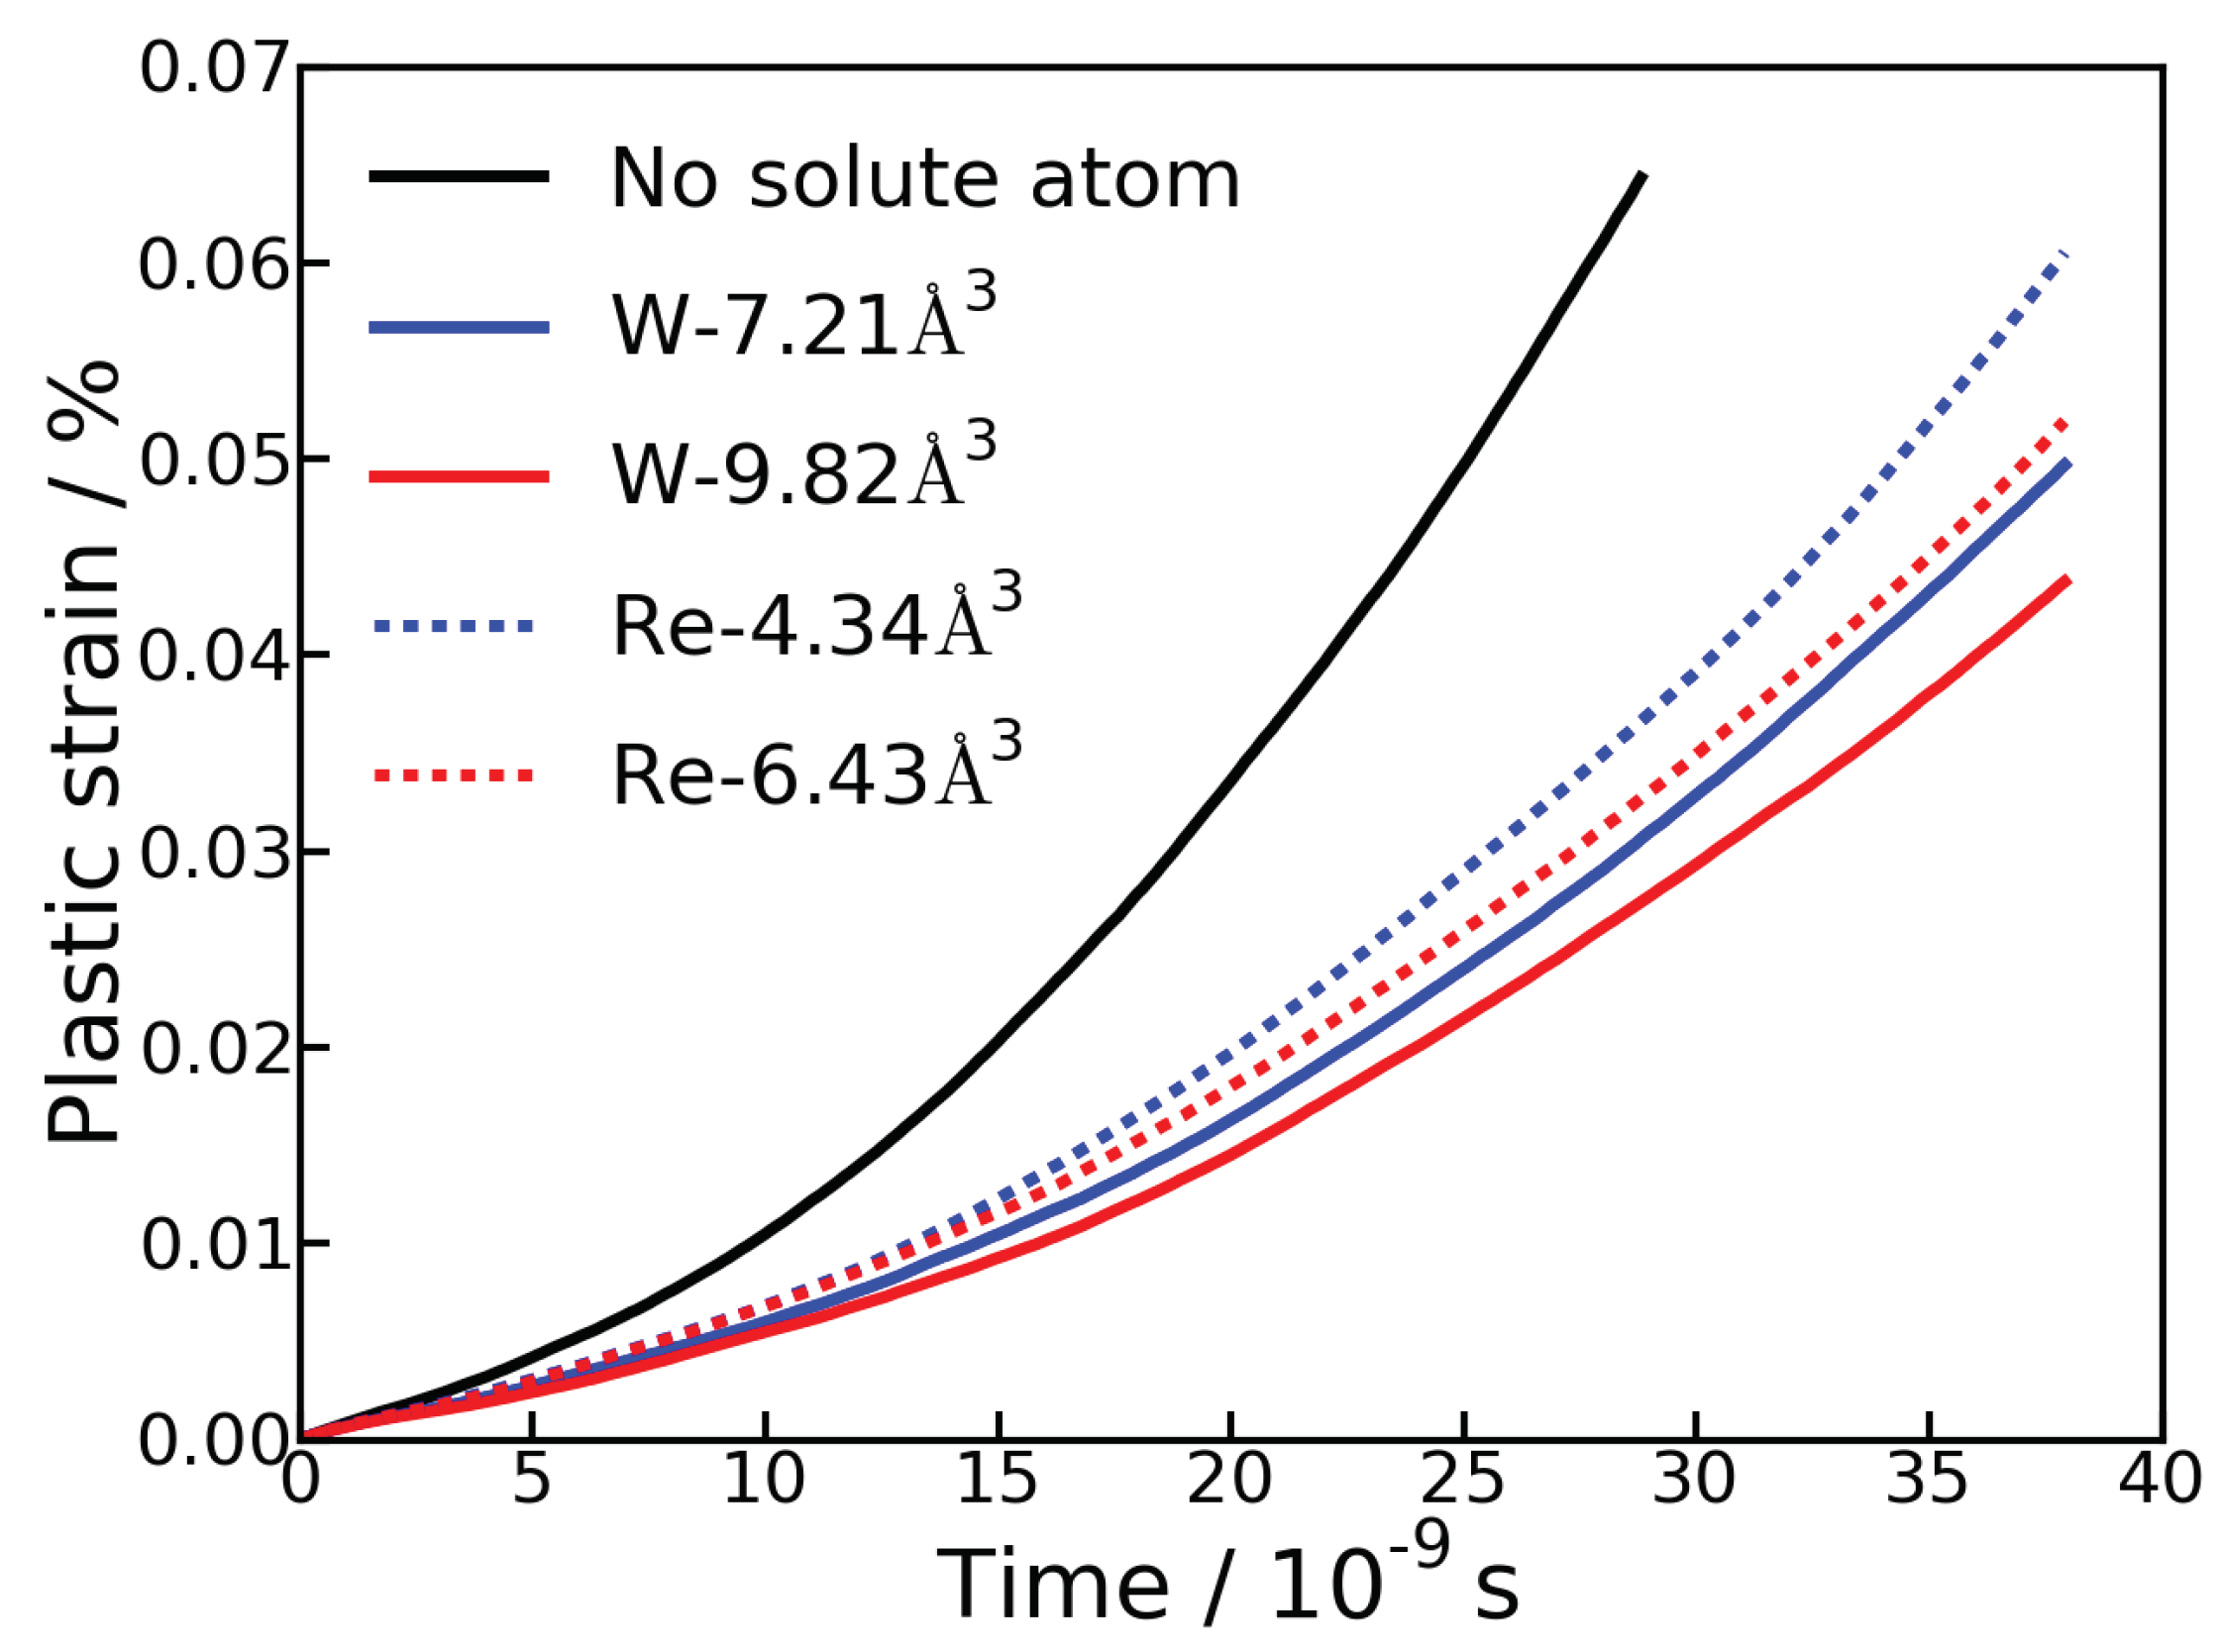
3.3. Influence of Excess Volume on Dislocation Motion and Creep

In the DDD simulation, two constant external tensile loads of 500 MPa and 200 MPa along the [001] direction were applied at 850 ° C. At the high stress of 500 MPa, only dislocation glide in the microstructure was considered, while at the low stress of 200 MPa both dislocation glide and climb were included. The plastic strain discussed in this work was the equivalent plastic strain and the strain rate was its corresponding derivative. In the present study, it was found that only a few single dislocations slightly cut into the γ precipitates and no shearing by superdislocations was observed, because we used a high APB energy of 250 mJ/m 2 [67] and there was no second dislocation coming on the exact same slip plane to destruct the APB. Hence, the cutting event is not the focus here.
In Figure 4, we show the evolution of the plastic strain, the strain rate, and the dislocation density in our DDD simulations at 500 MPa. The addition of both Re and W decreased the plastic strain and the strain rate. With increasing concentration of solute atoms, the deformation resistance was further improved. At the same concentration, W had a stronger retard effect than Re, which was due to its larger excess volume and correspondingly larger back stresses. However, an increase of concentration could compensate the insufficient resistance due to low excess volume, because the highest concentration of Re resulted in lower strain and strain rate than the medium concentration of W, as shown in Figure 4a,b. The analysis of the dislocation evolution in the simulation cell showed that the dislocation filling γ channels was decelerated by adding solute atoms. To avoid the visual confusion due to the full of dislocations in the microstructure, we take the dislocation pattern in one slip system as an example to show the influence of solute atoms on the dislocation evolution. It can be seen in Figure 5a that the dislocations in the [0 1 ¯ 1](111) slip system glided and multiplied easily in γ matrix channels without the solute atom, resulting in a high dislocation density. The existence of 7 × 10 3 at.% Re in γ matrix channels hindered the dislocation glide and multiplication evidently (Figure 5b). The 7 × 10 3 at.% W enhanced the retard effect even more, where the dislocations hardly propagated in γ matrix channels (Figure 5c). The solute atoms led to slow rises of dislocation densities, as shown in Figure 4c, corresponding to small plastic strains in Figure 4a.
In the case of 200 MPa tensile load, the plastic strains and strain rates during creep for the addition of Re and W with different concentrations are compared in Figure 6. Because the small and large time steps were used for dislocation glide and climb, respectively, as explained in Ref. [39], the primary creep merely ascribed to the dislocation glide ended in a short time, which is hardly seen in Figure 6a but is partly displayed in Figure 6b. The high concentration of solute atoms restricted the dislocation glide and reduced the plastic strain at the primary creep stage, which was similar to the previous results at 500 MPa. According to the setting in our DDD simulation, when the dislocation glide was limited, the dislocation climb was activated, and the creep entered the secondary creep stage with alternating dislocation glide and climb. The more solute atoms triggered the dislocation climb early due to their obstruction on dislocation glide. However, the different excess volumes of Re and W did not lead to distinct discrepancies of plastic strains and strain rates at the primary stage, as can be seen in Figure 6b,c. At the secondary creep stage, the plastic strains in Figure 6a did not show a completely monotonous decreasing behavior with increasing concentration. The plastic strain for the highest concentration of Re (blue dashed line in Figure 6a) became higher than the lower concentration (green dashed line in Figure 6a) during the later deformation. The back stress on dislocation climb was essentially small compared to dislocation glide, and only atoms in particular positions near the dislocation core led to higher back stresses. If dislocation glide were retarded by a solute atom due to the local high back stress, but the back stress on dislocation climb were still small, the dislocation could climb to a new position where the glide resistance would be relatively low. Subsequently, the dislocation could glide again. In this case, dislocation climb assisted the dislocation to overcome the barriers from the solute atoms. Although a high concentration of solute atoms was substantial in achieving high deformation resistance, the dislocation climb could rearrange the dislocation configuration, which also played an important role on creep. Once the dislocation pattern changed, the local stress environment altered, which influenced the further deformation. Therefore, the highest concentration of solute atoms in our simulations may not have led to the best creep resistance. In addition, the influence of different excess volumes on deformation became obvious in a longer time. This indicated that the lower back stress on dislocation climb for smaller excess volume supplied more opportunities to let the dislocation move far away from the atom, so as to avoid the barrier. In general, the low external load reduced the difference of strains for different atoms and different concentrations. Furthermore, if the concentration of Re were 3 wt.%, as is the real case in CMSX-4 [68], the distance between Re atoms would be approximately 10 Å. Such a fine distribution of solute atoms would make the dislocations nearly have no chance to avoid a high resistance. Figure 7 displays a comparison of dislocation patterns in [101]( 1 ¯ 1 ¯ 1) and [101](1 1 ¯ 1 ¯ ) slip systems in γ matrix channels for different solute atoms at 200 MPa. From this, we could find a similar phenomenon as shown in Figure 5, where the solute atoms hindered the dislocation motion, but the dislocation climb complicated the dislocation evolution.

4. Discussion

In the present work, we focused on the effect of the excess volume of Re and W on creep deformation in Ni-base single crystal superalloys to elucidate its role in solid solution strengthening. Different from other works [11,12,40,41,69,70,71], in which only the value of concentration of atoms is concerned, we introduced the individual solute atoms in the DDD simulation to explicitly consider the interaction of atoms and dislocations. We only added a certain number of solute atoms in the γ channels, which corresponded to a much lower concentration compared to actual superalloys. If realistic concentrations of Re and W in Ni-base superalloys were considered, the number of atoms in the simulation cell would dramatically increase. Since the dislocation segments have to interact with all atoms in the microstructure, the DDD simulations would become computationally extravagant. Although the applied concentrations were low, the influence of different concentrations could be still revealed. The current setup represents a suitable compromise between meaningful results and affordable computational costs, but restricts our interpretation to qualitative trends.
This study was a qualitative analysis, in which the accurate quantitative comparison was not of importance, since the DDD simulation results vary with the initial dislocation sources. If the dislocation sources were assigned in different ways, the resulting specific strains and dislocation densities at the specific time step would be various. For instance, if we used different random dislocation sources with the same initial dislocation density in two simulations, we could obtain similar plastic strain curves as a function of time. However, the values of strain and dislocation density at each time step were not exactly same, but the difference was small for these two simulations. In addition, if we used different dislocation sources with different initial dislocation densities or the dislocation sources were not random, we would obtain different plastic strain curves as a function of time. Thus, at the same time step, the strains and dislocation densities would certainly be different.As long as we kept the same initial dislocation microstructure for different alloy elements and different alloy concentrations, we always found the same trend: the high excess volume and high concentration resulted in the small deformation, regardless of the accurate difference of values. Therefore, if we only discuss the influence of solute atoms on the deformation qualitatively, the choice of initial dislocation microstructure is not strict.
In the DDD simulations, we used the excess volumes for Re and W extracted from our DFT calculations. As discussed in Section 2.2, a simple estimate of the excess volume based on the covalent radii led to the same trend, but the absolute values were significantly larger. A comparison of the plastic strain for the different values of the excess volume with a solute concentration of 9 × 10 4 at.% under 500 MPa tensile load along the [001] direction at 850 ° C is shown in Figure 8. Since the difference between excess volumes of Re and W in the simple estimate was nearly the same as that in our DFT calculations, the observed result in the reduction of plastic strains was similar. However, for a quantitative evaluation of the solid solution strengthening effect, an accurate determination of the excess volumes appears to be important.
Experimentally, it has been observed that solute atoms with a larger size mismatch to Ni exhibit a stronger strengthening effect at 800 ° C, while Re with a smaller size has a more potent effect at temperatures higher than 1000 ° C [10]. Without considering the diffusion of solute atoms in our present simulations at 850 ° C, our results confirm the experimental observation at a lower temperature in Ref. [10] that W has a stronger hardening effect than Re, due to the larger excess volume. The slower diffusing Re may influence vacancy diffusion at non-dilute solute concentrations, thereby slowing down the dislocation motion at high temperatures. This will be investigated by DFT calculations first [72], and the findings will be applied in DDD simulation to clarify the diffusion effect of solute atoms on creep in the future work.

5. Summary and Conclusions

The parelastic interaction between solute atoms and dislocations due to the excess volume of large atoms in the host matrix was implemented in a 3D discrete dislocation dynamics model. By using this model, the influence of excess volumes of Re and W on dislocation motion and creep in Ni-base single crystal superalloys under tensile loads of 200 MPa and 500 MPa along the [001] direction at 850 ° C was studied. The excess volumes obtained from DFT calculations were used to determine the back stresses on dislocation glide and climb. The relative positions of dislocations and solute atoms governed the magnitude of back stresses. The excess volume affected dislocation glide more strongly than dislocation climb. The DDD simulation results show that W with a larger excess volume had a stronger strengthening effect than Re, ignoring the diffusion of solute atoms. An increase in the concentration of solute atoms resulted in a decrease of plastic strain associated with dislocation glide at a high stress lever, while the different concentrations did not lead to a pronounced difference in creep at a low stress level where both dislocation glide and climb were considered.

Author Contributions

Conceptualization, S.G. and A.H.; methodology, S.G., Z.Y. and M.G.; formal analysis, S.G., Z.Y. and M.G.; investigation, S.G., Z.Y. and M.G.; visualization, S.G.; writing–original draft preparation, S.G.; writing–review and editing, J.R., R.D. and A.H.; supervision, R.D. and A.H.

Funding

This research was funded by the Deutsche Forschungsgemeinschaft (DFG) through project C2 and project C4 of the collaborative research center SFB/Transregio 103 superalloy single crystals under grant number INST 213/747-2.

Acknowledgments

The authors are grateful for the funding by the Deutsche Forschungsgemeinschaft (DFG) through project C2 and project C4 of the collaborative research center SFB/Transregio 103 superalloy single crystals.

Conflicts of Interest

The authors declare no conflict of interest.

References

  1. Geddes, B.; Leon, H.; Huang, X. Superalloys: Alloying and Performance; ASM International: Novelty, OH, USA, 2010. [Google Scholar]
  2. Huang, M.; Zhu, J. An overview of rhenium effect in single-crystal superaloys. Rare Metals 2016, 35, 127–139. [Google Scholar] [CrossRef]
  3. Erickson, G. The Development and Application of CMSX-10; Superalloys, The Minerals, Metals and Materials Society: Warrendale, PA, USA, 1996; pp. 35–44. [Google Scholar]
  4. Reed, R. The Superalloys: Fundamentals and Applications; Cambridge University Press: Cambridge, UK, 2008. [Google Scholar]
  5. Wang, B.; Zhang, J.; Huang, T.; Su, H.; Li, Z.; Liu, L.; Fu, H. Influence of W, Re, Cr, and Mo on the microstructural stability of the third generation Ni-based single-crystal superalloys. J. Mater. Res. 2016, 31, 3381–3389. [Google Scholar] [CrossRef]
  6. Ritter, N.; Sowa, R.; Schauer, J.; Gruber, D.; Göhler, T.; Rettig, R.; Povoden-Karadeniz, E.; Körner, C.; Singer, R. Effects of Solid Solution Strengthening Elements Mo, Re, Ru, and W on Transition Temperatures in Nickel-Based Superalloys with High γ-Volume Fraction: Comparison of Experiment and CALPHAD Calculations. Metall. Mater. Trans. A 2018, 49, 3206–3216. [Google Scholar] [CrossRef]
  7. Yoon, K.; Nöbe, R.; Seidman, D. Effects of rhenium addition on the temporal evolution of the nanostructure and chemistry of a model Ni-Cr-Al superalloy. II: Analysis of the coarsening behavior. Acta Mater. 2007, 55, 1159–1169. [Google Scholar] [CrossRef]
  8. Mottura, A.; Reed, R. What is the role of rhenium in single crystal superalloys? In Proceedings of the 2nd European Symposium on Superalloys and Their Applications; MATEC Web of Conferences: New York, NY, USA, 2014; pp. 1–6. [Google Scholar]
  9. Yu, X.; Wang, C. The effect of alloying elements on the dislocation climbing velocity in Ni: A first-principles study. Acta Mater. 2009, 57, 5914–5920. [Google Scholar] [CrossRef]
  10. Rehman, H.; Durst, K.; Neumeier, S.; Sato, A.; Reed, R.; Göken, M. On the temperature dependent strengthening of nickel by transition metal solutes. Acta Mater. 2017, 137, 54–63. [Google Scholar] [CrossRef]
  11. Fleischer, R. Substitutional solution hardening. Acta Mater. 1963, 11, 203–209. [Google Scholar] [CrossRef]
  12. Labusch, R. A statistical theory of solid solution hardening. Phys. Status Solidi (B) 1970, 41, 659–669. [Google Scholar] [CrossRef]
  13. Gottstein, G. Physical Foundations of Materials Science; Springer: Berlin/Heidelberg, Germany, 2004. [Google Scholar]
  14. Suzuki, H. Segregation of Solute Atoms to Stacking Faults. J. Phys. Soc. Jpn. 1962, 17, 322–325. [Google Scholar] [CrossRef]
  15. Schuwalow, S.; Rogal, J.; Drautz, R. Vacancy mobility and interaction with transition metal solutes in Ni. J. Phys. Condens. Matter 2014, 26, 485014. [Google Scholar] [CrossRef]
  16. Giamei, A.; Anton, D. Rhenium additions to a Ni-base superalloy: Effects on microstructure. Metall. Trans. A 1985, 16, 1997–2005. [Google Scholar] [CrossRef]
  17. Wollgramm, P.; Buck, H.; Neuking, K.; Parsa, A.; Schuwalow, S.; Rogal, J.; Drautz, R.; Eggeler, G. On the role of Re in the stress and temperature dependence of creep of Ni-base single crystal superalloys. Mater. Sci. Eng. A 2015, 628, 382–395. [Google Scholar] [CrossRef]
  18. Ding, Q.; Li, S.; Chen, L.; Han, X.; Zhang, Z.; Yu, Q.; Li, J. Re segregation at interfacial dislocation network in a nickel-based superalloy. Acta Mater. 2018, 154, 137–146. [Google Scholar] [CrossRef]
  19. Wu, X.; Makineni, S.; Kontis, P.; Dehm, G.; Raabe, D.; Gault, B.; Eggeler, G. On the segregation of Re at dislocations in the γ phase of Ni-based single crystal superalloys. Materialia 2018, 4, 109–114. [Google Scholar] [CrossRef]
  20. Zhang, J.; Murakumo, T.; Harada, H.; Koizumi, Y.; Kobayashi, T. Creep deformation mechanisms in some modern single-crystal superalloys. Superalloys 2004, 189–195. [Google Scholar]
  21. Rae, C.; Reed, R. Primary creep in single crystal superalloys: Origins, mechanisms and effects. Acta Mater. 2007, 55, 1067–1081. [Google Scholar] [CrossRef]
  22. Reed, R.; Matan, N.; Cox, D.; Rist, M.; Rae, C. Creep of CMSX-4 superalloy single crystals: Effects of rafting at high temperature. Acta Mater. 1999, 47, 3367–3381. [Google Scholar] [CrossRef]
  23. Kamaraj, M.; Mayr, C.; Kolbe, M.; Eggeler, G. On the influence of stress state on rafting in the single crystal superalloy CMSX-6 under conditions of high temperature and low stress creep. Scr. Mater. 1998, 38, 589–594. [Google Scholar] [CrossRef]
  24. Eggeler, G.; Dlouhy, A. On the formation of 〈010〉-dislocations in the γ-phase of superalloy single crystals during high temperature low stress creep. Acta Mater. 1997, 45, 4251–4262. [Google Scholar] [CrossRef]
  25. Srinivasan, R.; Eggeler, G.; Mills, M. γ-cutting as rate-controlling recovery process during high-temperature and low-stress creep of superalloy single crystals. Acta Mater. 2000, 48, 4867–4878. [Google Scholar] [CrossRef]
  26. Kostka, A.; Mälzer, G.; Eggeler, G. High-temperature dislocation plasticity in the single-crystal superalloy LEK94. J. Microsc. 2006, 223, 295–297. [Google Scholar] [CrossRef]
  27. Jácome, L.A.; Nörtershäuser, P.; Somsen, C.; Dlouhy, A.; Eggeler, G. On the nature of γ phase cutting and its effect on high temperature and low stress creep anisotropy of Ni-base single crystal superalloys. Acta Mater. 2014, 69, 246–264. [Google Scholar] [CrossRef]
  28. Rae, C.; Matan, N.; Reed, R. The role of stacking fault shear in the primary creep of [001]-oriented single crystal superalloys at 750 °C and 750 MPa. Mater. Sci. Eng. A 2001, 300, 125–134. [Google Scholar] [CrossRef]
  29. Knowles, D.; Chen, Q. Superlattice stacking fault formation and twinning during creep in γ/γ single crystal superalloy CMSX-4. Mater. Sci. Eng. A 2003, 340, 88–102. [Google Scholar] [CrossRef]
  30. Caron, P.; Khan, T.; Nakagawa, Y. Effect of orientation on the intermediate temperature creep behaviour of Ni-base single crystal superalloys. Scr. Metall. 1986, 20, 499–502. [Google Scholar] [CrossRef]
  31. Wu, X.; Wollgramm, P.; Somsen, C.; Dlouhy, A.; Kostka, A.; Eggeler, G. Double minimum creep of single crystal Ni-base superalloys. Acta Mater. 2016, 112, 242–260. [Google Scholar] [CrossRef]
  32. Sass, V.; Glatzel, U.; Feller-Kniepmeier, M. Anisotropic creep properties of the nickel-base superalloy CMSX-4. Acta Mater. 1996, 44, 1967–1977. [Google Scholar] [CrossRef]
  33. Huang, M.; Zhao, L.; Tong, J. Discrete dislocation dynamics modelling of mechanical deformation of nickel-based single crystal superalloys. Int. J. Plast. 2012, 28, 141–158. [Google Scholar] [CrossRef] [Green Version]
  34. Yang, H.; Li, Z.; Huang, M. Modelling dislocation cutting the precipitate in nickel-based single crystal superalloy via the discrete dislocation dynamics with SISF dissociation scheme. Comput. Mater. Sci. 2013, 75, 52–59. [Google Scholar] [CrossRef]
  35. Yang, H.; Li, Z.; Huang, M. Modeling of abnormal mechanical properties of nickel-based single crystal superalloy by three-dimensional discrete dislocation dynamics. Model. Simul. Mater. Sci. Eng. 2014, 22, 085009. [Google Scholar] [CrossRef]
  36. Hussein, A.; Rao, S.; Uchic, M.; Parthasarathay, T.; El-Awady, J. The strength and dislocation microstructure evolution in superalloy microcrystals. J. Mech. Phys. Solids 2017, 99, 146–162. [Google Scholar] [CrossRef]
  37. Hafez Haghighat, S.; Eggeler, G.; Raabe, D. Effect of climb on dislocation mechanisms and creep rates in γ-strengthened Ni base superalloy single crystals: A discrete dislocation dynamics study. Acta Mater. 2013, 61, 3709–3723. [Google Scholar] [CrossRef]
  38. Liu, B.; Raabe, D.; Roters, F.; Arsenlis, A. Interfacial dislocation motion and interactions in single-crystal superalloys. Acta Mater. 2014, 79, 216–233. [Google Scholar] [CrossRef] [Green Version]
  39. Gao, S.; Fivel, M.; Ma, A.; Hartmaier, A. 3D discrete dislocation dynamics study of creep behavior in Ni-base single crystal superalloys by a combined dislocation climb and vacancy diffusion model. J. Mech. Phys. Solids 2017, 102, 209–223. [Google Scholar] [CrossRef]
  40. Gu, Y.; El-Awady, J. Quantifying the effect of hydrogen on dislocation dynamics: A three-dimensional discrete dislocation dynamics framework. J. Mech. Phys. Solids 2018, 112, 491–507. [Google Scholar] [CrossRef] [Green Version]
  41. Yu, H.; Cocks, A.; Tarleton, E. Discrete dislocation plasticity HELPs understand hydrogen effects in bcc materials. J. Mech. Phys. Solids 2019, 123, 41–60. [Google Scholar] [CrossRef]
  42. Demtröder, K.; Eggeler, G.; Schreuer, J. Influence of microstructure on macroscopic elastic properties and thermal expansion of nickel-base superalloys ERBO/1 and LEK94. Mater. Sci. Eng. Technol. 2015, 46, 563–576. [Google Scholar] [CrossRef]
  43. Warren, P.; Cerezo, A.; Smith, G. An atom probe study of the distribution of rhenium in a nickel-based superalloy. Mater. Sci. Eng. A 1998, 250, 88–92. [Google Scholar] [CrossRef]
  44. Parsa, A.; Wollgramm, P.; Buck, H.; Somsen, C.; Kostka, A.; Povstugar, I.; Choi, P.; Raabe, D.; Dlouhy, A.; Müller, J.; et al. Advanced Scale Bridging Microstructure Analysis of Single Crystal Ni-Base Superalloys. Adv. Eng. Mater. 2014, 17, 216–230. [Google Scholar] [CrossRef]
  45. Mottura, A.; Miller, M.; Reed, R. Atom Probe Tomography Analysis of Possible Rhenium Clustering in Nickel-Based Superalloys; Superalloys, The Minerals, Metals and Materials Society: Warrendale, PA, USA, 2008; pp. 891–900. [Google Scholar]
  46. Mottura, A.; Warnken, N.; Miller, M.; Finnis, M.; Reed, R. Atom probe tomography analysis of the distribution of rhenium in nickel alloys. Acta Mater. 2010, 58, 931–942. [Google Scholar] [CrossRef]
  47. Ge, B.; Luo, Y.; Li, J.; Zhu, J. Distribution of rhenium in a single crystal nickel-based superalloy. Scr. Mater. 2010, 63, 969–972. [Google Scholar] [CrossRef]
  48. Gao, S.; Fivel, M.; Ma, A.; Hartmaier, A. Influence of misfit stresses on dislocation glide in single crystal superalloys: A three-dimensional discrete dislocation dynamics study. J. Mech. Phys. Solids 2015, 76, 276–290. [Google Scholar] [CrossRef]
  49. Bakó, B.; Clouet, E.; Dupuy, L.; Blétry, M. Dislocation dynamics simulations with climb: Kinetics of dislocation loop coarsening controlled by bulk diffusion. Philos. Mag. 2011, 91, 3173–3191. [Google Scholar] [CrossRef]
  50. Ayas, C.; Deshpande, V.; Geers, M. Tensile response of passivated films with climb-assisted dislocation glide. J. Mech. Phys. Solids 2012, 60, 1626–1643. [Google Scholar] [CrossRef]
  51. Danas, K.; Deshpande, V. Plane-strain discrete dislocation plasticity with climb-assisted glide motion of dislocations. Model. Simul. Mater. Sci. Eng. 2013, 21, 045008. [Google Scholar] [CrossRef]
  52. Geers, M.; Cottura, M.; Appolaire, B.; Busso, E.; Forest, S.; Villani, A. Coupled glide-climb diffusion-enhanced crystal plasticity. J. Mech. Phys. Solids 2014, 70, 136–153. [Google Scholar] [CrossRef]
  53. Verdier, M.; Fivel, M.; Groma, I. Mesoscopic scale simulation of dislocation dynamics in fcc metals: Principles and applications. Model. Simul. Mater. Sci. Eng. 1998, 6, 755–770. [Google Scholar] [CrossRef] [Green Version]
  54. Fivel, M.; Canova, G. Developing rigorous boundary conditions to simulations of discrete dislocation dynamics. Model. Simul. Mater. Sci. Eng. 1999, 7, 753–768. [Google Scholar] [CrossRef]
  55. Shin, C. 3D Discrete Dislocation Dynamics Applied to Dislocation-Precipitate Interactions. Ph.D. Thesis, INP Grenoble and Séoul National University, Seoul, Korea, 2004. [Google Scholar]
  56. Li, J. Stress field of a dislocation segment. Philos. Mag. 1964, 10, 1097–1098. [Google Scholar] [CrossRef]
  57. Fivel, M. Discrete Dislocation Dynamics: Principles and Recent Applications. In Multiscale Modeling of Heterogenous Materials; John Wiley & Sons, Ltd.: Hoboken, NJ, USA, 2010; Chapter 2; pp. 17–36. [Google Scholar]
  58. Blöchl, P. Projector augmented-wave method. Phys. Rev. B 1994, 50, 17953. [Google Scholar] [CrossRef]
  59. Kresse, G.; Joubert, D. From ultrasoft pseudopotentials to the projector augmented-wave method. Phys. Rev. B 1999, 59, 1758. [Google Scholar] [CrossRef]
  60. Kresse, G.; Hafner, J. Ab initio molecular dynamics for liquid metals. Phys. Rev. B 1993, 47, 558. [Google Scholar] [CrossRef]
  61. Kresse, G.; Furthmüller, J. Efficiency of ab-initio total energy calculations for metals and semiconductors using a plane-wave basis set. Comput. Mater. Sci. 1996, 6, 15. [Google Scholar] [CrossRef]
  62. Kresse, G.; Furthmüller, J. Efficient iterative schemes for ab initio total-energy calculations using a plane-wave basis set. Phys. Rev. B 1996, 54, 11169. [Google Scholar] [CrossRef]
  63. Perdew, J.; Burke, K.; Ernzerhof, M. Generalized Gradient Approximation Made Simple. Phys. Rev. Lett. 1996, 77, 3865. [Google Scholar] [CrossRef]
  64. Monkhorst, H.; Pack, J. Special points for Brillouin-zone integrations. Phys. Rev. B 1976, 13, 5188. [Google Scholar] [CrossRef]
  65. Birch, F. Finite Elastic Strain of Cubic Crystals. Phys. Rev. 1947, 71, 809. [Google Scholar] [CrossRef]
  66. Francis, G.; Payne, M. Finite basis set corrections to total energy pseudopotential calculations. J. Phys. Condens. Matter 1990, 2, 4395–4404. [Google Scholar] [CrossRef]
  67. Rao, S.; Uchic, M.; Shade, P.; Woodward, C.; Parthasarathy, T.; Dimiduk, D. Critical percolation stresses of random Frank-Read sources in micrometer-sized crystals of superalloys. Model. Simul. Mater. Sci. Eng. 2012, 20, 065001. [Google Scholar] [CrossRef]
  68. Harris, K.; Erickson, G.; Sikkenga, S.; Brentnall, W.; Aurrecoeche, J.; Kubarych, K. Development of the Rhenium Containing Superalloys CMSX-4 and CM186 LC for Single Crystal Blade and Directionally Solidified Vane Applications in Advanced Turbine Engines; Superalloys, The Minerals, Metals and Materials Society: Warrendale, PA, USA, 1992; pp. 297–306. [Google Scholar]
  69. Nabarro, F. The theory of solution hardening. Philos. Mag. 1977, 35, 613–622. [Google Scholar] [CrossRef]
  70. Butt, M. Review solid-solution hardening. J. Mater. Sci. 1993, 28, 2557–2576. [Google Scholar] [CrossRef]
  71. Mishima, Y.; Ochiai, S.; Hamao, N.; Yodogawa, M.; Suzuki, T. Solid Solution Hardening of Nickel—Role of Transition Metal and B-subgroup Solutes. Trans. Jpn. Inst. Metals 1986, 27, 656–664. [Google Scholar] [CrossRef]
  72. Grabowski, M.; Rogal, J.; Drautz, R. Kinetic Monte Carlo simulations of vacancy diffusion in nondilute Ni-X (X = Re, W, Ta) alloys. Phys. Rev. Mater. 2018, 2, 123403. [Google Scholar] [CrossRef]
Figure 1. Representative γ / γ microstructure with uniformly distributed cuboidal γ precipitates surrounded by narrow γ matrix channels. Dislocation segments representing initial Frank–Read sources are distributed on 12 slip systems displayed by different colors as given in the color bar.
Metals 09 00637 g001
Figure 2. Calculated excess volumes for Re and W as a function of the plane wave cutoff for different methods determining the equilibrium volume.
Metals 09 00637 g002
Figure 3. Back stresses for dislocation glide τ bk gl and dislocation climb τ bk cl with respect to the distance between one atom and an edge dislocation core. The x-axis and y-axis represent the glide and climb directions, respectively. The plotted range in x- and y-direction is from 1.5 Å to 10 Å: (a,b) for Re; and (c,d) for W. Note the different scales on the colorbars for glide and climb back stresses, respectively.
Metals 09 00637 g003
Figure 4. (a) Plastic strains as a function of time; (b) strain rates as a function of plastic strain; and (c) total dislocation densities as a function of time for the addition of Re and W with different concentrations under 500 MPa tensile load along [001] direction at 850 ° C.
Metals 09 00637 g004
Figure 5. Dislocation patterns in the [0 1 ¯ 1](111) slip system in γ matrix channels after 30 ns under 500 MPa tensile load along [001] direction at 850 ° C for different solute atoms. Dislocations are viewed in the projection on (100) crystallographic planes, corresponding to Figure 1: (a) no solute atom; and (b) 7 × 10 3 at.% Re; (c) 7 × 10 3 at.% W.
Metals 09 00637 g005
Figure 6. (a) Plastic strains as a function of time; (b) plastic strains in the primary stage of creep as a function of time; (c) strain rates in the primary stage of creep as a function of plastic strain; and (d) strain rates in the secondary stage of creep as a function of plastic strain for the addition of Re and W with different concentrations under 200 MPa tensile load along [001] direction at 850 ° C.
Metals 09 00637 g006
Figure 7. Dislocation patterns in [101]( 1 ¯ 1 ¯ 1) (yellow) and [101](1 1 ¯ 1 ¯ ) (orange) slip systems in γ matrix channels after 14 s under 200 MPa tensile load along [001] direction at 850 ° C for different solute atoms. Dislocations are viewed in the projection on (001) crystallographic planes, corresponding to Figure 1. One dislocation line containing some dislocation jogs with another color indicates the occurrence of dislocation climb: (a) no solute atom; (b) 7 × 10 3 at.% Re; and (c) 7 × 10 3 at.% W.
Metals 09 00637 g007
Figure 8. Plastic strains as a function of time for different excess volumes of Re and W for a concentration of 9 × 10 4 at.% under 500 MPa tensile load along the [001] direction at 850 ° C.
Metals 09 00637 g008

