Article

Development of a Modular Fretting Wear and Fretting Fatigue Tribometer for Thin Steel Wires: Design Concept and Preliminary Analysis of the Effect of Crossing Angle on Tangential Force

1
Surface Technologies, Faculty of Engineering, Mondragon University, Loramendi 4, 20500 Arrasate-Mondragon, Spain
2
Orona EIC, Orona Ideo, Jauregi bidea s/n, 20120 Hernani, Spain
*
Author to whom correspondence should be addressed.
Metals 2019, 9(6), 674; https://doi.org/10.3390/met9060674
Submission received: 9 May 2019 / Revised: 6 June 2019 / Accepted: 10 June 2019 / Published: 11 June 2019
(This article belongs to the Special Issue Recent Advances on Fretting Fatigue)

Abstract

:
This work presents the design of a modular ad-hoc fretting fatigue and fretting wear tribotester for thin steel wires. The working principles of the different modules are described, such as the displacement and contact modules. Preliminary studies for understanding the effect of crossing angle between wires on tangential force measurement has been carried out on 0.45 mm diameter cold-drawn eutectoid carbon steel (0.8% C). The results show that due to the developed wear scar geometry for high crossing angles there is a non-Coulomb behaviour that is not seen for low crossing angles.

1. Introduction

Steel wire ropes used in the lift industry, off-shore or other structural elements such as reinforcement for tires exhibit high strength and bending flexibility. Although they have exceptional mechanical properties steel wire ropes are susceptible to fretting damage. Fretting occurs when two or more bodies are in contact subjected to relative small displacement, producing damage to the contact surface [1]. This damage is of particular relevance for steel wires, since the wear scar is massive in comparison to the reduced section of the wire. Figure 1 shows a broken wire used in a wire rope. It is observed that the fracture in the wire is located at the edge of the wear scar. Therefore, combined fretting wear and fretting fatigue failure is observed. In order to increase the fatigue performance of steel wire ropes, the characterization of the steel wires under fretting phenomena is of great interest.
In the literature, a variety of tribometers have been designed to study the underlying mechanisms of fretting. Those tribometers can be broadly classified into two main categories, namely: (i) fretting wear test rigs [2,3,4,5] used for friction and wear characterization; and (ii) fretting fatigue test rigs [6,7,8,9] mostly used to study the effect of fretting on material fracture. In their most basic form, both rigs must be able to apply a predefined contact force and a very small oscillating displacement. On the one hand, the oscillating displacement for fretting wear tests (Figure 2a) is usually generated by some sort of reciprocating linear actuator. On the other hand, the oscillating displacement for fretting fatigue experiments (Figure 2b) is usually applied by straining one specimen while the contacting pads are held stationary. Shear force is therefore generated and fretting phenomena appear across the contact interface.
The selection of one test over the other depends on the objective of the work. It is obvious that the fretting wear test is easier and faster to perform, as only two wires are in contact (Figure 2a). On the other hand, in fretting fatigue tests two contacting points frequently exist perpendicular to the bulk stress (Figure 2b) in order to maintain the symmetry of forces. Friction, wear, lubrication, or coating research typically employ the fretting wear test as they are generally use in tribological quantity characterization. However, if the research interest is focused on the impact of the aforementioned quantities on fatigue life, fretting fatigue test is the best option.
With respect to fretting studies on steel wires, few tribometers have been reported in the literature. The research group led by Professor Zhang of China University of Mining and Technology developed a fatigue machine to perform fretting fatigue tests. Over several years they have presented several papers studying the behavior of steel wires under fretting fatigue phenomena, for example Wang et al. [9] analyzed the effect of the displacement amplitude on fretting fatigue of hoisting wires in low cycle fatigue. A decrease of fatigue life was found for higher displacement amplitudes. In all cases, a mixed slip regime contact condition was generated. Zhang et al. [10] characterised fretting fatigue behaviour under different strain ratios. Results revealed that the fretting regime changes from partial slip to mixed and gross slip as the strain ratio decreases. For lower strain ratios, shorter fatigue life was found, although the wear rate was higher. Wang et al. [11] analysed the dynamic wear evolution and proposed a theoretical model of wear depth. Later on, Wang et al. [12] characterized the effect of torsion angle on tension-torsion behavior of steel wires. Zhang et al. [13] analysed the effect of crossing angle on fatigue lifetime. They found that higher crossing angles induced lower fatigue life.
Zhou et al. developed a fretting fatigue test bench that was driven by a motor-eccentric system [14] specifically for single aluminum wire fretting fatigue testing. The research group of the present paper, in collaboration with the Bundesanstalt für Materialforschung und -prüfung (BAM, Germany), also studied the wear behavior of thin steel wires with a fretting wear tribometer that was developed at BAM [4,15]. In both cases, the fretting testers developed were only for fretting fatigue or fretting wear studies, respectively.
In this paper, a modular tribometer that could perform both fretting wear (FW) and fretting fatigue (FF) test with thin steel wires is designed and developed. First, an overview of the tribotester is given in Section 2. The section has been divided in 4 subsections where the analysis of the displacement module, the contact module, the acquisition system and the wear scar measurement methodology are presented. In Section 3 the test program for the analysis of the effect of crossing angle on tangential force is presented, followed by the results and discussion of the observed phenomena. Finally, the main conclusions are summarized.

2. Designed Tribotester

Figure 3 shows the final version of developed test rig. The tribotester consists of two main modules: (i) the displacement module; and (ii) the contact module. On the one hand, the displacement module is able to reduce the alternative displacement generated by the eccentric by up to three orders of magnitude. The actual stroke is adjusted accordingly depending on which type of test is performed. In most cases, the applied remote displacement for the fretting fatigue test is higher, as the actual displacement amplitude is calculated by scaling down the displacement of the fatigued wire (where the contact spot is located). If gross slip is induced in a fretting fatigue test, a combination of both phenomena (fretting wear and fretting fatigue) can be generated, as observed in wire ropes applications. The contact module has been designed to test thin wires ranging from 0.1–1 mm, and it is able to apply low contact forces (0.1–10 N) between the contacting surfaces, where high contact pressure is developed (~3000 MPa). The configuration of the contact module is also changed depending on the test. For fretting fatigue tests, two contacts are used to avoid the bending of the fatigue wire, while for fretting wear only one contact is used. In the following subsections, the displacement module, the contact module, the data acquisition system and the wear scar measurement methodology will be analyzed.

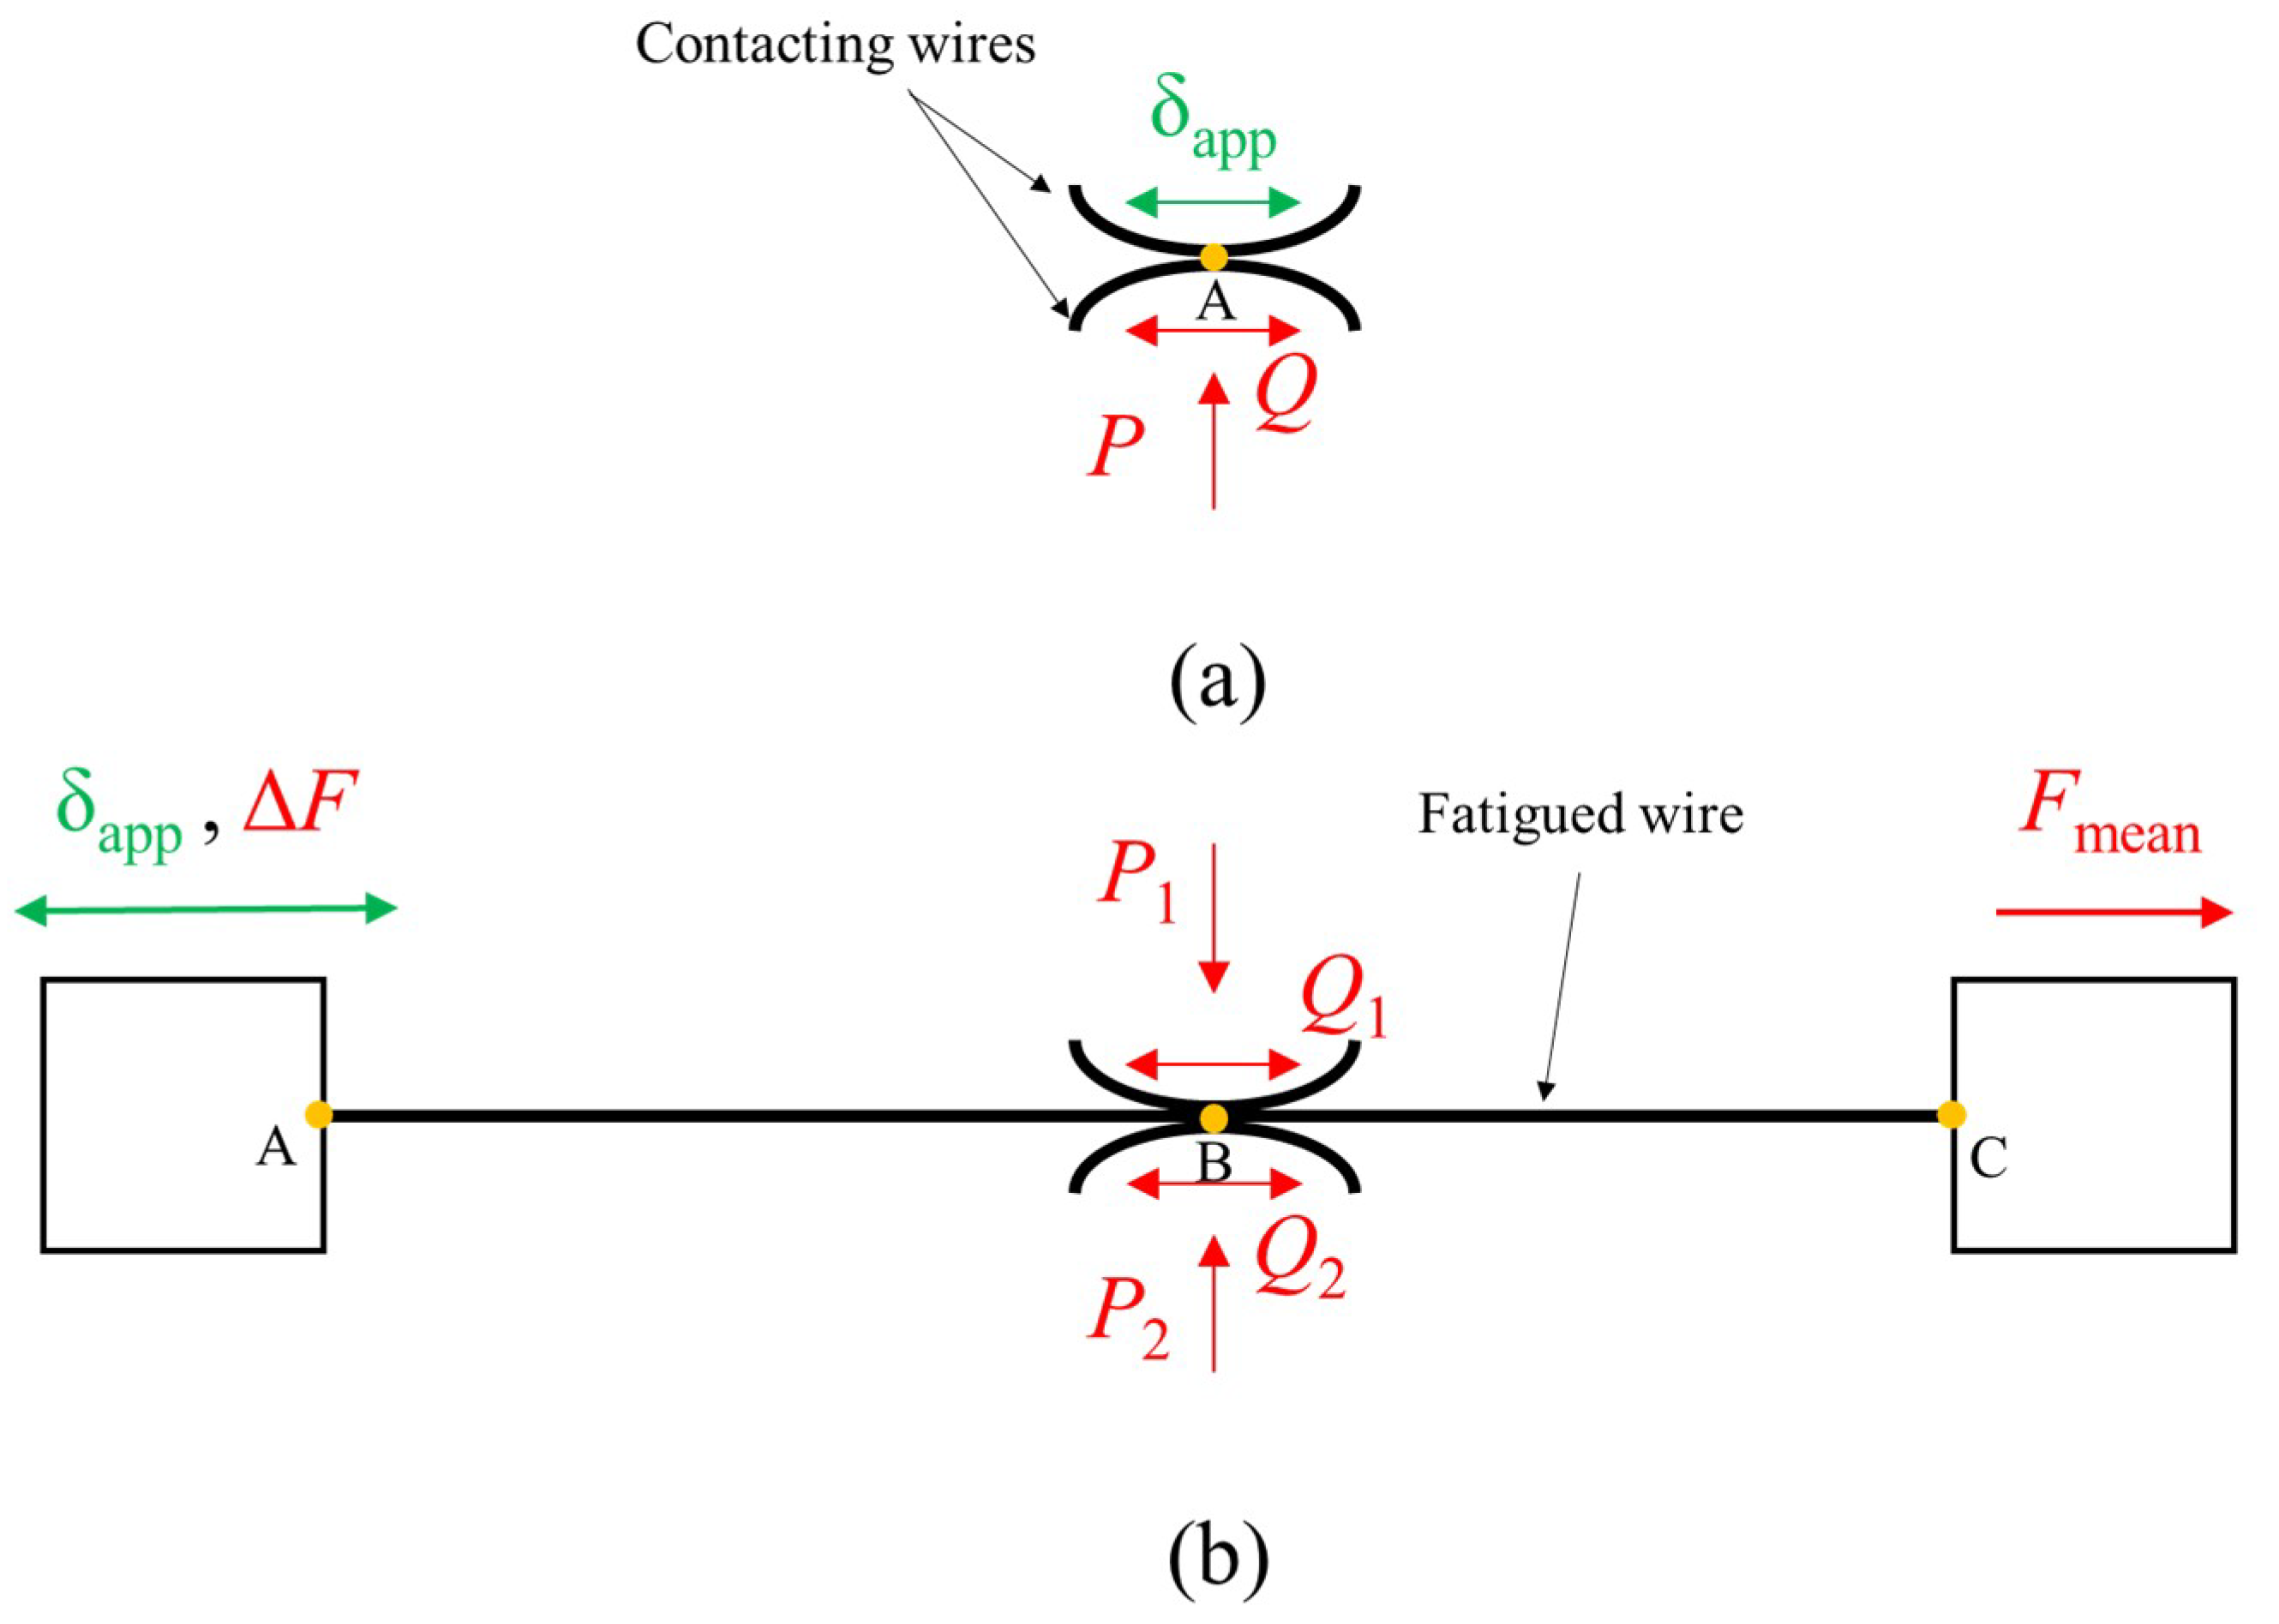
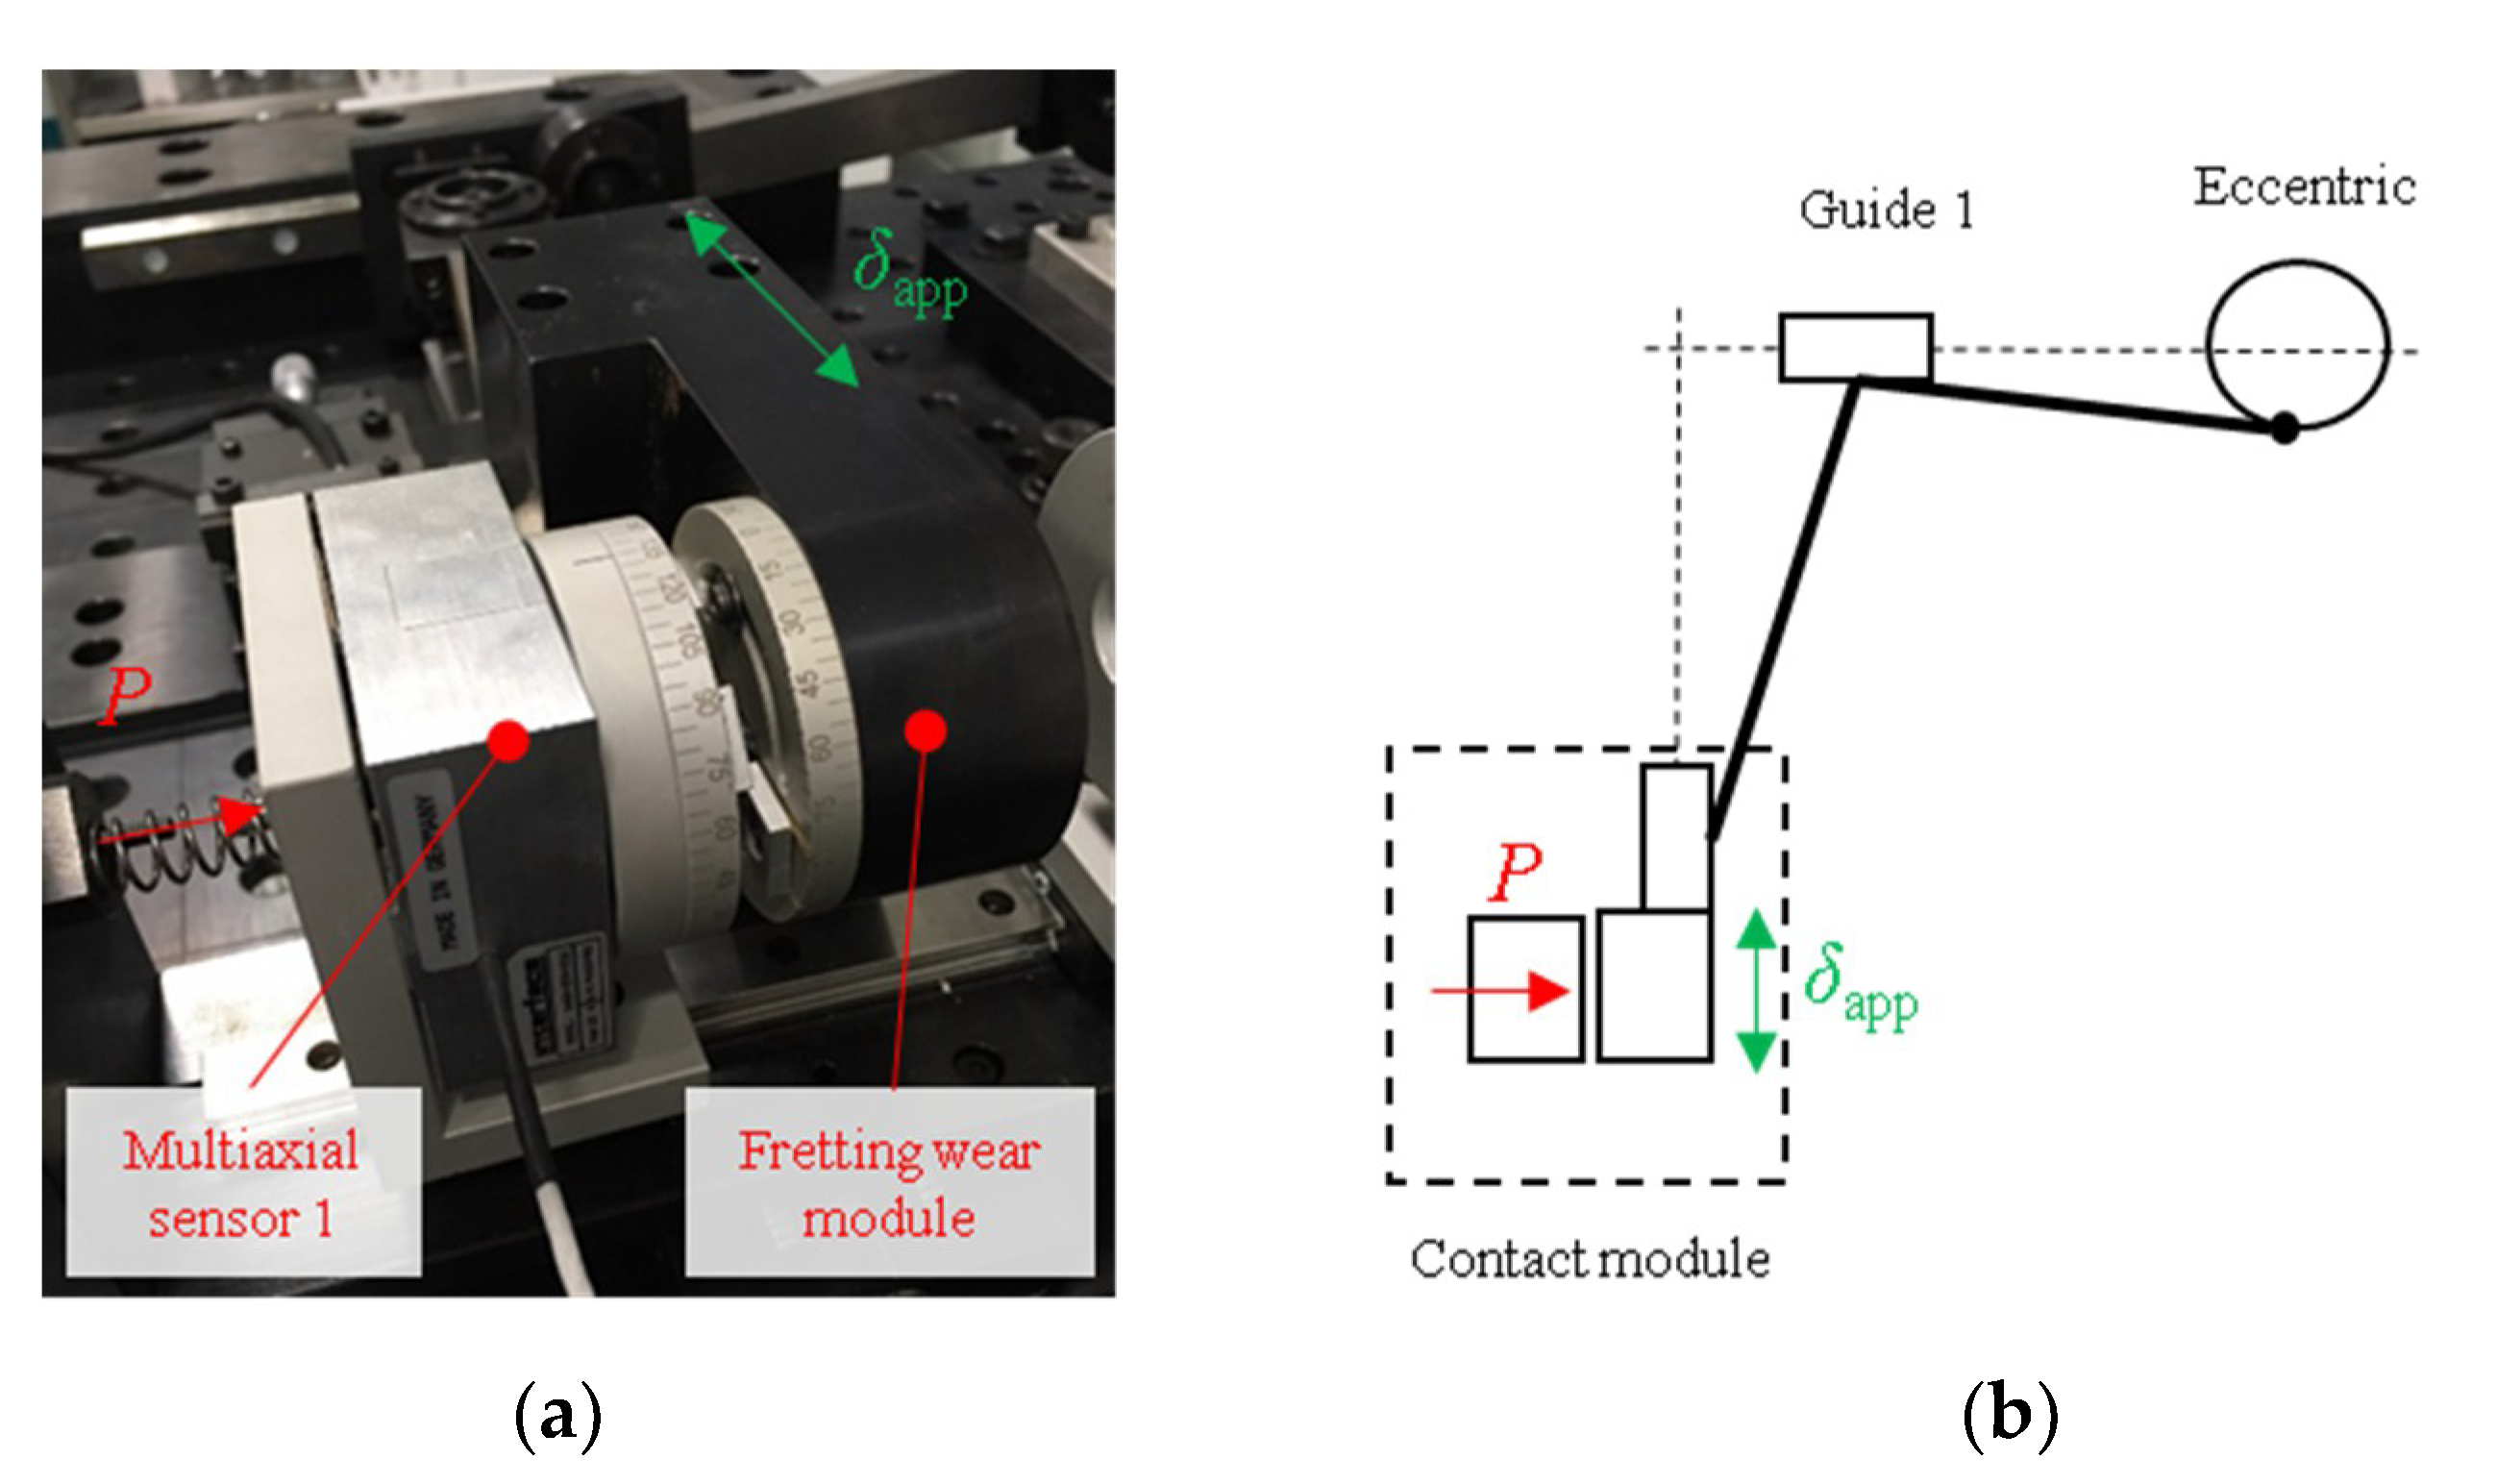
2.1. Displacement Module

A variety of actuator systems have been used in the literature to generate the short cyclic displacement, such as servo-hydraulic actuators [16], piezo-electric actuators [17], or electro-mechanical actuators [2,3]. Servo-hydraulic actuators provide a very precise control of the displacement, since the system is very stiff. For short stroke, low mass and elevated frequency, piezo-electric actuators are a very good choice, however, fatigue life is dependent upon the displacement applied. On the other hand, electro-mechanical systems provide a cost effective solution with a very simple design.
In the present tribotester, an electro-mechanical system has been used. Figure 4 shows the sketch of the displacement system. This design allows converting the rotational motion into a short reciprocating displacement. Due to the geometrical properties of the design, the fretting stroke amplitude is dependent on the angle θ (Equation (1), Figure 4). Two interchangeable oscillating bars allows obtaining the desired reciprocating displacement (δapp).
δ app = l or 2 ( cos θ 1 cos θ 2 )
where lor2 is the length of the oscillating bar 2, and θ1 and θ2 are the maximum and minimum angles obtained with the variable eccentric and the oscillating bar 1, respectively. It should be mentioned that the displacement amplitude for the fretting fatigue test is calculated by scaling down the applied displacement of the guide 2.

2.2. Contact Module

A variety of mechanical designs have been used to apply the contact force [2,3,9,18]. In this work, a mechanical screw coupled with an adjustable spring was used [7]. Figure 5 shows the designed contact module for fretting fatigue tests. The fretting fatigue test configuration employs two multiaxial sensors capable of measuring the contact and tangential forces, one on each side of the fatigue wire located between the wire fixation system and the contact actuator. As mentioned in the introduction, the remote displacement amplitude is generated by straining one specimen while the contacting wires are held stationary. Thus, the actual displacement amplitude along the fatigue wire is dependent on the location of the contact system. The entire contact module is therefore attached to a linear translation stage which is used to adjust the correct location for the selected displacement amplitude.
On the other hand, fretting wear test configuration employs one multiaxial sensor, since only one contact interface exists. Figure 6 shows the contact module developed for the fretting wear test, where the wire fixation system of the displacement module is changed accordingly.
Figure 7 shows the wire fixation system developed. As can be noted in the figure, the wire presents a toroid shape, being the radius of the support (20 mm) considerably superior compared to the wire diameter range (0.1–1 mm). Therefore, the contact achieved between the two wires can be considered a cross cylinder configuration. It is noteworthy that the fixing system allows the wire to be located at different angles (0–90°), thus making it possible to simulate different crossing angle contacts present in ropes.

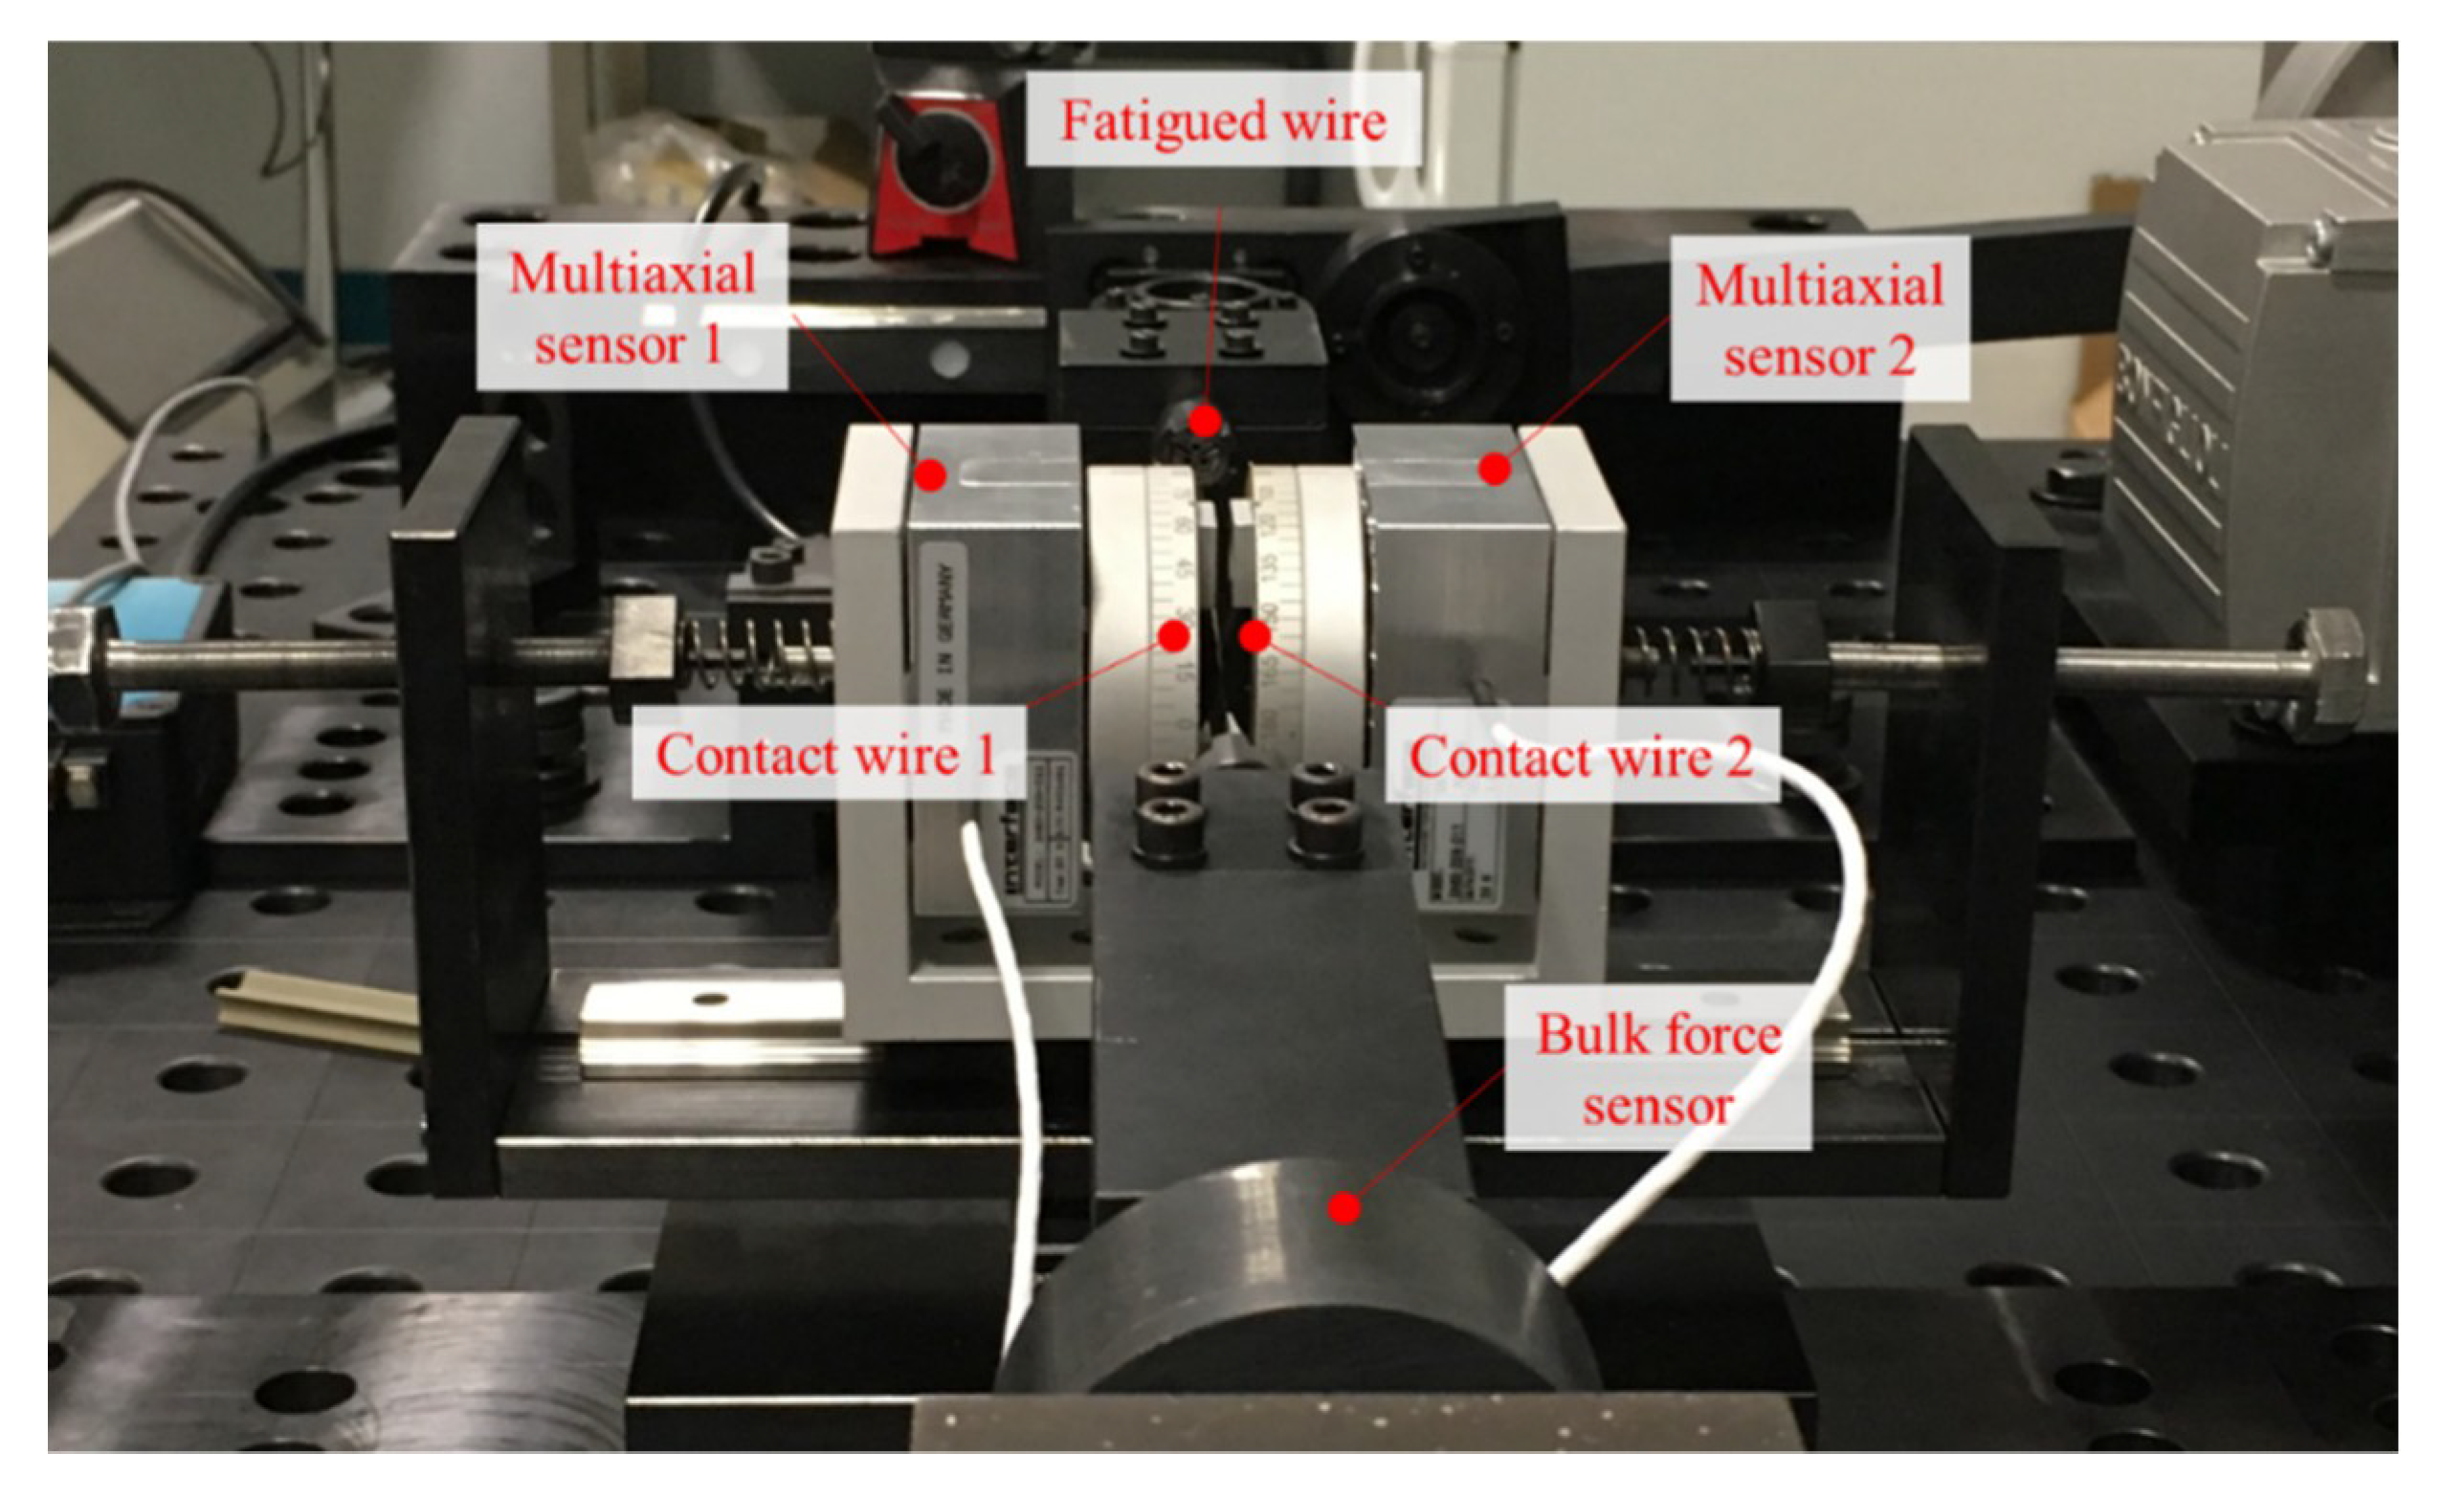
2.3. Data Acquisition System

The machine developed employs 4 sensors: 2 multi-axis load cells (Interface Inc. 3A60) for contact and friction force, 1 uniaxial load cell (Interface Inc. WMC) for axial cyclic force and 1 fiber-optic sensor (Philtec RC90) for displacement measurements. All sensors are connected to a computer through a National Instruments DAQ device, where a custom Python-based program has been developed for real time plotting and data management. A sample of the unfiltered measurements of combined fretting fatigue and wear is shown in Figure 8.

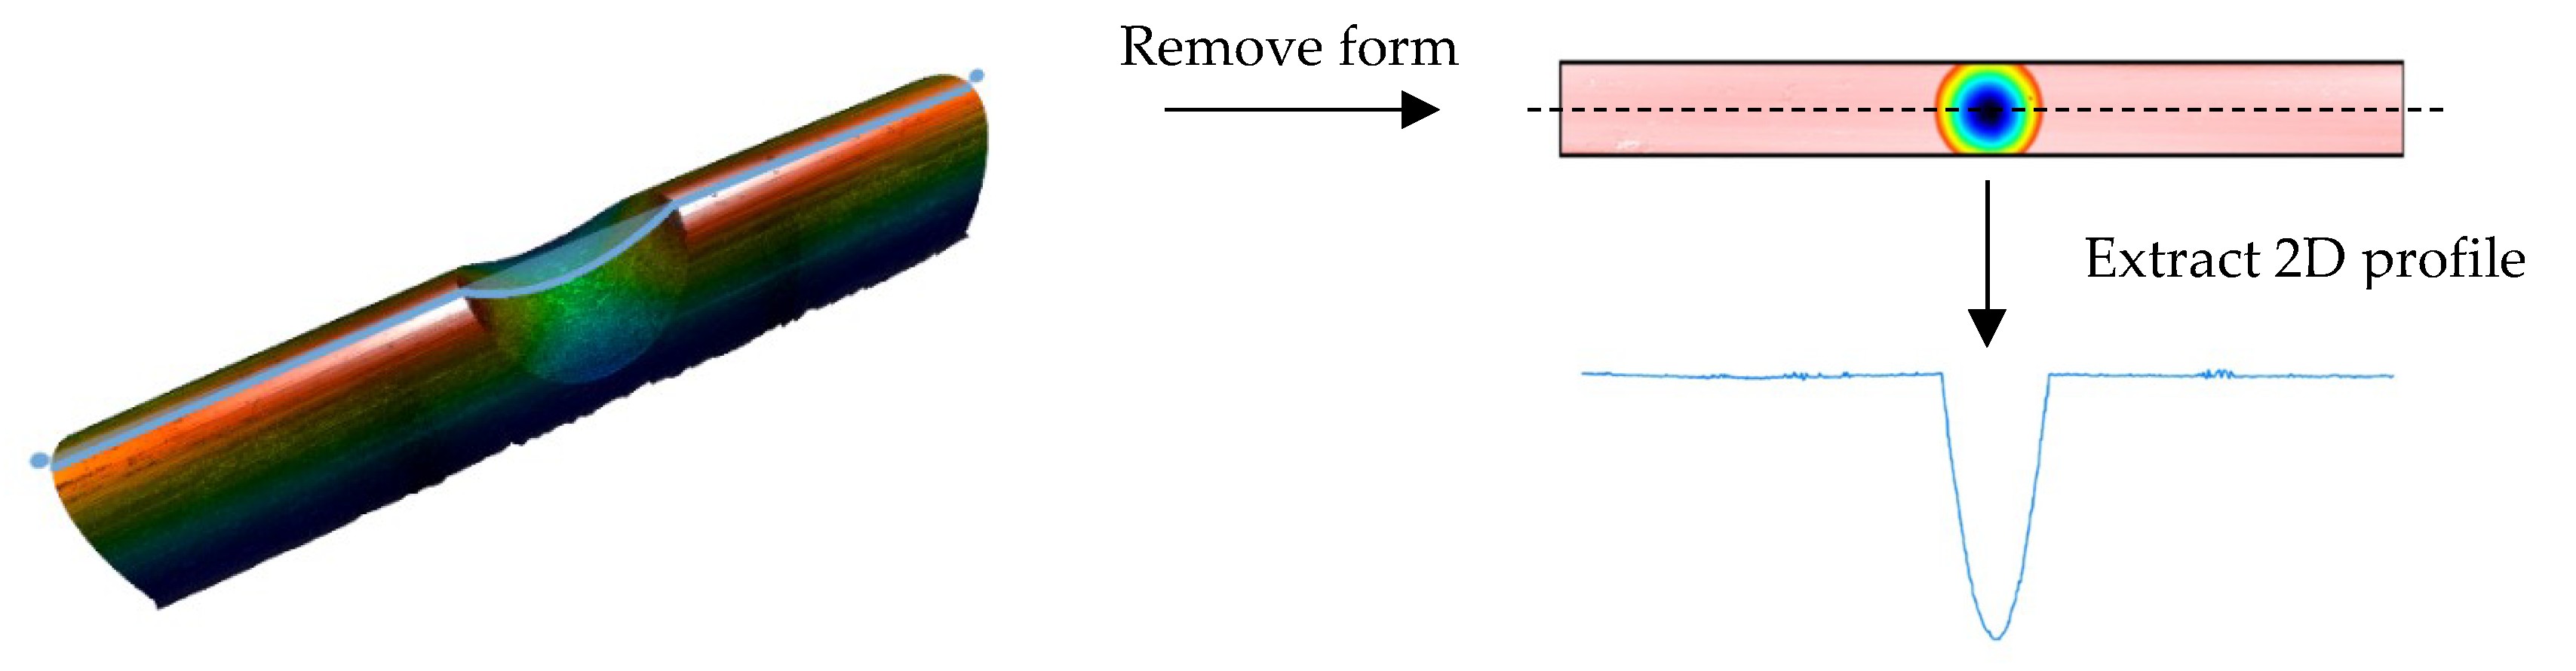
2.4. Surface Metrology: Wear Profile Measurement

Wear scars were measured using a non-contact 3D optical profiler Sensofar S neox (Sensofar, Barcelona, Spain), using white light interferometry with an objective of 20 × DI (optical resolution = 0.41 µm, vertical resolution nm). 3D areal measurements of 2450 × 267 µm were taken, and 2D profiles were extracted (Figure 9) in order to characterize main wear scar properties (width, depth) through metrological software SensoMap Premium 7 (Digital Surf, Besançon, France).

3. Description of Experimental Tests

In this work, fretting fatigue tests were carried out on 0.45 mm diameter cold-drawn eutectoid carbon steel (0.8% C), which are summarized in Table 1. Each test configuration was repeated 3 times to ensure repeatability. The objective of these tests was to analyse the effect of the crossing angle on the measured tribological quantities such as the frictional force that can serve as a baseline for future works.
All tests were performed at a frequency of 2 Hz and a pre-defined number of cycles of 150 × 103 (i.e., tests were not carried out until the final fracture). According to previous studies [4,15], real test conditions were simulated in the experimental campaign. The geometrical, mechanical and surface properties of the specimen are given in Table 2.

4. Results and Discussion

One of the most important methods to identify the fretting regime is through so-called fretting loops, as shown in Figure 8b. Vingsbo and Söderberg identified the partial slip or stick-slip regime with an elliptical shape, whereas in gross slip the fretting loops takes a parallelogram-like shape [19].
Figure 10 shows the frictional loops of FF tests for the 3 crossing angles (0°, 45°, and 90°). It can be observed that in all cases the fretting loop takes a parallelogram-like shape. Therefore all 3 tests were performed in gross slip regime which is in good agreement with previous works [4,15]. Due to the fact that gross slip was generated, a combined fretting wear and fretting fatigue condition was reached.
A typical flat topped-loop (Coulomb behavior) was observed for the 0° crossing angle test (Figure 10a), which remains constant throughout the entire test. Conversely, as the crossing angle increases (Figure 10b for 45° and Figure 10c for 90°), a more distorted loop is induced during the test, showing a non-Coulomb frictional behavior. It can be noted that this evolution toward a non-Coulomb behavior is more pronounced and occurs faster along the 90° test comparing to the 45° test. Figure 10d shows the wear scar profiles corresponding to the three crossing angle conditions (0°, 45°, 90°) and the numerical values are shown in Figure 11. It can be observed that the maximum wear scar depth (Figure 11a) increases with the crossing angle, while the width of the scar decreases (Figure 11b). The distortion of the fretting loop is therefore correlated with the wear scar evolution, since the test condition showing the biggest distortion (90°) is the one presenting a more pronounced wear scar. It has been reported by many researchers that sometimes the tangential force varies significantly across the stroke [20,21,22]. As a consequence of these changes, a more distorted loop is induced, showing non-Coulomb frictional behavior, which is in good agreement with the results obtained. This non-Coulomb behavior has been previously reported for different materials, predominantly for ductile materials [22]. In this work, it is shown that the behavior can be also induced due to contact geometry, such as the crossing angle between the wires.
The coefficient of friction (CoF) was computed through the geometric independent coefficient of friction derivative method (GICoF) following the recommendation given in [22] for non-Coulomb fretting loops. Figure 12a shows the obtained CoF for the selected crossing angles. It can be observed that the CoF decreases slightly for higher crossing angles, although it could be considered almost constant, taking into account the scatter. In Figure 12b, the CoF calculated by Cruzado et al. [15], who employed the same material but in fretting wear configuration in a tribometer developed by Klaffke [2], is shown. The same trends can be drawn, thus confirming the results obtained in this work.

5. Conclusions

  • A modular tribotester that could perform both fretting wear and fretting fatigue test with thin steel wires was designed and developed.
  • Non-Coulomb frictional behavior has so far been associated with certain kinds of materials (ductile materials). This work demonstrates that the behavior could also be induced due to a change in the contact geometry.
  • As the crossing angle increases, a more distorted loop is induced (due to the increased wear scar geometry) as the number of cycles increases, showing a non-Coulomb frictional behavior. As the crossing angle increases, the width of the wear scar decreases, while the maximum wear depth increases. It can be observed that this behavior is more pronounced for the 90° test, which occurs more rapidly than in the case of the 45° test.
  • Results were compared to reported data, and the same trends in terms of coefficient of friction were drawn, thus confirming the robustness of the tribometer.

Author Contributions

Conceptualization, I.L., W.T. and X.G.; methodology, I.L. and X.G.; software, I.L.; validation, I.L., A.Z., W.T. and X.G.; formal analysis, I.L. and A.Z.; investigation, I.L. and A.Z.; resources, X.G. and N.O.; data curation, I.L. and A.Z.; writing—original draft preparation, I.L. and A.Z.; writing—review and editing, I.L., A.Z., W.T. and X.G.; visualization, I.L. and A.Z.; supervision, W.T. and X.G.; project administration, I.L. and A.Z.; funding acquisition, X.G. and N.O.

Funding

This research was funded by Eusko Jaurlaritza under “Programa de apoyo a la investigación colaborativa en áreas estratégicas”, grant number “Ref. KK-2017/00053”, and “Ref. KK-2018/00013”.

Conflicts of Interest

The authors declare no conflict of interest.

References

  1. Waterhouse, R.B. Fretting wear. Wear 1984, 100, 107–118. [Google Scholar] [CrossRef]
  2. Klaffke, D. Fretting wear of ceramic-steel: The importance of wear ranking criteria. Wear 1985, 104, 337–343. [Google Scholar] [CrossRef]
  3. Ramesh, R.; Gnanamoorthy, R. Development of a fretting wear test rig and preliminary studies for understanding the fretting wear properties of steels. Mater. Des. 2006, 27, 141–146. [Google Scholar] [CrossRef]
  4. Cruzado, A.; Hartelt, M.; Wäsche, R.; Urchegui, M.A.; Gómez, X. Fretting wear of thin steel wires. Part 1: Influence of contact pressure. Wear 2010, 268, 1409–1416. [Google Scholar] [CrossRef]
  5. Pearson, S.R. The Effect of Nitriding on the Fretting Wear of a High Strength Steel at Ambient and Elevated Temperatures. Available online: http://eprints.nottingham.ac.uk/29004/ (accessed on 18 January 2019).
  6. Bramhall, R. Studies in Fretting Fatigue. Ph.D. Thesis, University of Oxford, Oxford, UK, 1973. [Google Scholar]
  7. Wittkowsky, B.U.; Birch, P.R.; Dominguez, J.; Suresh, S. An apparatus for quantitative fretting testing. Fatigue Fract. Eng. Mater. Struct. 1999, 22, 307–320. [Google Scholar] [CrossRef]
  8. Magaziner, R.; Jin, O.; Mall, S. Slip regime explanation of observed size effects in fretting. Wear 2004, 257, 190–197. [Google Scholar] [CrossRef]
  9. Wang, D.; Zhang, D.; Ge, S. Effect of displacement amplitude on fretting fatigue behavior of hoisting rope wires in low cycle fatigue. Tribol. Int. 2012, 52, 178–189. [Google Scholar] [CrossRef]
  10. Zhang, D.; Geng, H.; Zhang, Z.; Wang, D.; Wang, S.; Ge, S. Investigation on the fretting fatigue behaviors of steel wires under different strain ratios. Wear 2013, 303, 334–342. [Google Scholar] [CrossRef]
  11. Wang, D.; Li, X.; Wang, X.; Zhang, D.; Wang, D. Dynamic wear evolution and crack propagation behaviors of steel wires during fretting-fatigue. Tribol. Int. 2016, 101, 348–355. [Google Scholar] [CrossRef]
  12. Wang, X.; Wang, D.; Zhang, D.; Ge, S.; Alexander Araújo, J. Effect of torsion angle on tension-torsion multiaxial fretting fatigue behaviors of steel wires. Int. J. Fatigue 2018, 106, 159–164. [Google Scholar] [CrossRef]
  13. Zhang, D.; Yang, X.; Chen, K.; Zhang, Z. Fretting fatigue behavior of steel wires contact interface under different crossing angles. Wear 2018, 400, 52–61. [Google Scholar] [CrossRef]
  14. Zhou, Z.R.; Goudreau, S.; Fiset, M.; Cardou, A. Single wire fretting fatigue tests for electrical conductor bending fatigue evaluation. Wear 1995, 181, 537–543. [Google Scholar] [CrossRef]
  15. Cruzado, A.; Hartelt, M.; Wäsche, R.; Urchegui, M.A.; Gómez, X. Fretting wear of thin steel wires. Part 2: Influence of crossing angle. Wear 2011, 273, 60–69. [Google Scholar] [CrossRef]
  16. Fouvry, S.; Kapsa, Ph.; Vincent, L. An elastic–plastic shakedown analysis of fretting wear. Wear 2001, 247, 41–54. [Google Scholar] [CrossRef]
  17. Marui, E.; Endo, H.; Hasegawa, N.; Mizuno, H. Prototype fretting-wear testing machine and some experimental results. Wear 1998, 214, 221–230. [Google Scholar] [CrossRef]
  18. Mohrbacher, H.; Celis, J.-P.; Roos, J.R. Laboratory testing of displacement and load induced fretting. Tribol. Int. 1995, 28, 269–278. [Google Scholar] [CrossRef]
  19. Vingsbo, O.; Söderberg, S. On fretting maps. Wear 1988, 126, 131–147. [Google Scholar] [CrossRef]
  20. Mulvihill, D.M.; Kartal, M.E.; Olver, A.V.; Nowell, D.; Hills, D.A. Investigation of non-Coulomb friction behaviour in reciprocating sliding. Wear 2011, 271, 802–816. [Google Scholar] [CrossRef]
  21. Hintikka, J.; Lehtovaara, A.; Mäntylä, A. Normal displacements in non-Coulomb friction conditions during fretting. Tribol. Int. 2016, 94, 633–639. [Google Scholar] [CrossRef]
  22. Jin, X.; Sun, W.; Shipway, P.H. Derivation of a wear scar geometry-independent coefficient of friction from fretting loops exhibiting non-Coulomb frictional behaviour. Tribol. Int. 2016, 102, 561–568. [Google Scholar] [CrossRef]
Figure 1. SEM micrograph showing the fracture of the wire at the edge of the wear scar produced by a combined fretting wear and fretting fatigue phenomena.
Metals 09 00674 g001
Figure 2. Schematic of the performed tests: (a) fretting wear; (b) combined fretting wear and fretting fatigue, where P is the normal load, Q is the tangential load, δapp and ΔF are the reciprocating displacement and the applied force range respectively and Fmean is the mean force.
Metals 09 00674 g002
Figure 3. (a) Developed fretting wear and fretting fatigue tribometer for thin steel wires. Combined fretting wear and fatigue configuration; (b) schematic of the fretting fatigue configuration.
Metals 09 00674 g003
Figure 4. (a,b) Sketch of the camshaft mechanism designed for the tribotester displacement.
Metals 09 00674 g004
Figure 5. The contact module for fretting fatigue configuration.
Metals 09 00674 g005
Figure 6. (a,b) The contact module for fretting wear configuration.
Metals 09 00674 g006
Figure 7. Developed wire fixation system that allows different crossing angles (0–90°). (a) Top view of the fixation system; (b) detail of the contact zone to locate the desired crossing angle; (c) different crossing angles.
Metals 09 00674 g007
Figure 8. Evolution of the contact force (a) and tangential force (b) along a fretting cycle. Note: unfiltered data.
Metals 09 00674 g008
Figure 9. Image of 3D measurement of wear scar and 2D profile extraction procedure.
Metals 09 00674 g009
Figure 10. Evolution of the tangential force during tests and wear scar results: (a) 0° crossing angle; (b) 45° crossing angle; (c) 90° crossing angle; (d) comparison of the wear profile of each crossing angle test at 150 × 103 cycles.
Metals 09 00674 g010
Figure 11. Quantitative characterization of the wear scar depth (a) and width (b) from 3D interferometry measurements corresponding to the crossing angles under analysis.
Metals 09 00674 g011
Figure 12. Coefficient of friction results: (a) CoF values for different crossing angles obtained in this work; (b) CoF values reported by Cruzado et al. [15] employing the same material but in fretting wear contact configuration in a tribometer developed by Klaffke [2] (Reproduced with permission from [2], Elsevier, 1985).
Metals 09 00674 g012
Table 1. Fretting fatigue (FF) test summary.
Test NumberTest ConfigurationContact Force [N]Applied Displacement [μm]Crossing Angle [°]Mean Stress [MPa]Stress Amplitude [MPa]
1–3FF21000597283
4–6FF210045597283
7–9FF210090597283
Table 2. Geometrical, mechanical and surface properties.
PropertiesSymbolUnitValue
Fatigued wire lengthlmm155
Wire diameterdmm0.45
Tensile strengthσuMPa>3200
Yield strengthσyMPa>2650
Elastic modulusEGPa200
Vickers hardnessHV0.05-659 ± 81
Average roughness drawn direction (DD)Raμm0.35
Average roughness perpendicular to the DDRaμm0.7

