A Surface Transition Layer Model for Size Effect in T2 Copper Micro-Compression

State Key Laboratory of Material Processing and Die & Mould Technology, Huazhong University of Science and Technology, 1037 Luoyu Road, Wuhan 430074, China
*
Author to whom correspondence should be addressed.
Metals 2019, 9(7), 736; https://doi.org/10.3390/met9070736
Submission received: 5 June 2019
/
Revised: 24 June 2019
/
Accepted: 28 June 2019
/
Published: 29 June 2019
(This article belongs to the Special Issue Size Effects in Metals and Alloys and Impact on the Miniaturization of Metallic Parts)
Abstract
:The effects of sample size and grain size on the surface morphology and flow stress of deformed samples were investigated by means of copper micro-cylinder compression experiments at room temperature. The results of SEM showed that when the grain size increased or the sample size decreased, the deformation non-uniformity of samples’ free surfaces increased. Meanwhile, the stress–strain curves showed that during the compression process, the flow stress of the sample also tended to decrease as the grain size increased or the sample size decreased. According to the experimental results of nanoindentation, a surface transition layer model was established on the basis of the surface layer model by considering the mutual constraint of grains and the existence of transition layer grains. The experimental results indicated that the stress–strain curve calculated by the surface transition layer model can more accurately reflect the actual deformation situation of the material compared to the surface layer model.
1. Introduction
In recent years, with the increasing demand for processing micro-parts, the micro-plastic forming process has developed rapidly as an important processing method in the microscopic field. Due to the size effect, there are marked differences between the micro-forming process and the macro-forming process in terms of forming mechanism, material deformation law, and friction phenomenon. Therefore, structural parameters, physical parameters, and process parameters in macro-forming cannot be simply scaled down to the micro-forming process [1,2,3,4]. A large number of studies have been carried out by scholars for the size effect in the micro-forming process of crystalline and amorphous materials. The tensile test results of Zr65Ni35 amorphous alloy films with sub-micron thickness by Matteo et al. [5] suggested that yield stress increases with decreasing sample size. The compression test results of metallic glass pillars on a sub-micron scale by Greer et al. [6] suggested that the stress necessary for the failure of a metallic glass pillar decreases with increasing pillar height. Nanoindentation experiments by Ghidelli et al. [7] showed that micro-hardness increases with the decrease of film thickness. Copper sheet tensile tests by Chan and Fu [8] and the three-point bending tests of aluminum sheets by Raulea et al. [9] showed that the flow stress decreases as the ratio of sheet thickness to grain size decreases. The tensile tests of H62 wire by Liu et al. [10], the pure nickel compression tests by Wang et al. [11] and the compression performance tests by Conrad and Jung [12] in Ag (d > 10 nm) showed that with a decrease of grain size, the material exhibits a significant hardening tendency during the deformation process.
According to the property tests of crystal metallic materials above, the ratio of sample size to grain size plays a key role in the change of flow stress. A reasonable explanation for this phenomenon is the theory of the surface layer model, which considers that polycrystalline materials consist of surface grains and inner grains [13,14]. During the plastic deformation process, dislocations move through the inner grains and accumulate at the grain boundaries, however, grains on the free surface have less constraint on dislocation motion, which makes deformation resistance and the hardening tendency of the surface grains relatively reduced. In the surface layer model, a highly important parameter is the ratio of grian size to sample size. When the sample size decreases or the grain size increases, the ratio increases, which results in an overall reduction in flow stress.
The surface layer model considers the difference between surface grains and inner grains in flow stress, and explains the size effect phenomenon well. However, in the surface layer model, the mechanical properties of the material are determined only by the inner grains and the surface grains, and the mechanical properties between the two parts are discontinuous. Actually, in the plastic deformation of polycrystalline material, the mechanical property of each grain is affected by the surrounding deformed grains and shows continuity. Therefore, in this paper, a compression experiment of micro copper cylinder was designed to further study the size effect phenomenon, and a nanoindentation experiment was carried out to observe the distribution of mechanical properties of the material grains from the inside to the surface. Based on the experimental results, a surface transition layer model considering the continuity of grain mechanical properties was proposed to compensate for the inherent theoretical defects of the surface layer model.
2. Materials and Methods
The material used in the micro-cylinder compression experiment was T2 copper, which is widely used in micro-forming research due to its good plasticity and low resistance to deformation. In order to study the effect of grain size on the results of compression tests, three different heat treatment processes were used to treat the original Ø6 rods × 20 rods to obtain different average grain sizes. Figure 1 shows the microstructures of the copper rods, which were etched by FeCl3 alcohol solution for 10 s after heat treatment. The average grain sizes were 15 μm, 30 μm, and 50 μm, as shown in Table 1, measured three times respectively by a linear intercept method. For studying the influence of sample size on compression test results, the copper rods were cut and turned into cylindrical samples with diameters of 0.8 mm, 1 mm, and 2 mm, respectively, and the height-to-diameter ratio of the samples was 1.5:1. In order to ensure the accuracy of the compression experiment, it was necessary to ensure the perpendicularity of the end face of the cylindrical sample to the axis and the parallelism between the end faces during processing.
The compression equipment was an AG 100 kN material performance testing machine (Shimadzu Corporation, Kyoto, Japan), and the experiment was carried out at room temperature. The initial strain rate during compression was 0.002 s−1, and the applied loading rate remained constant during compression. In order to reduce the influence of friction on the compression experiment, the interface between the plate and the sample was lubricated with oil and the surfaces of the upper and lower anvil plates used for compression were polished to a mirror surface, the roughness of which was controlled to be less than Ra 0.05 μm. Because the diameters of T2 copper samples are very small and T2 copper has a low yield strength and an excellent plasticity ability, the influence of machine stiffness on the development of size effects can be neglected [15]. The cylindrical samples before and after compression are shown in Figure 2. The photos of the end surfaces of the compressed samples were taken by a JSM-7600F thermal field emission scanning electron microscope (JEOL Ltd., Tokyo, Japan) to observe the difference in the surface deformation uniformity of samples.
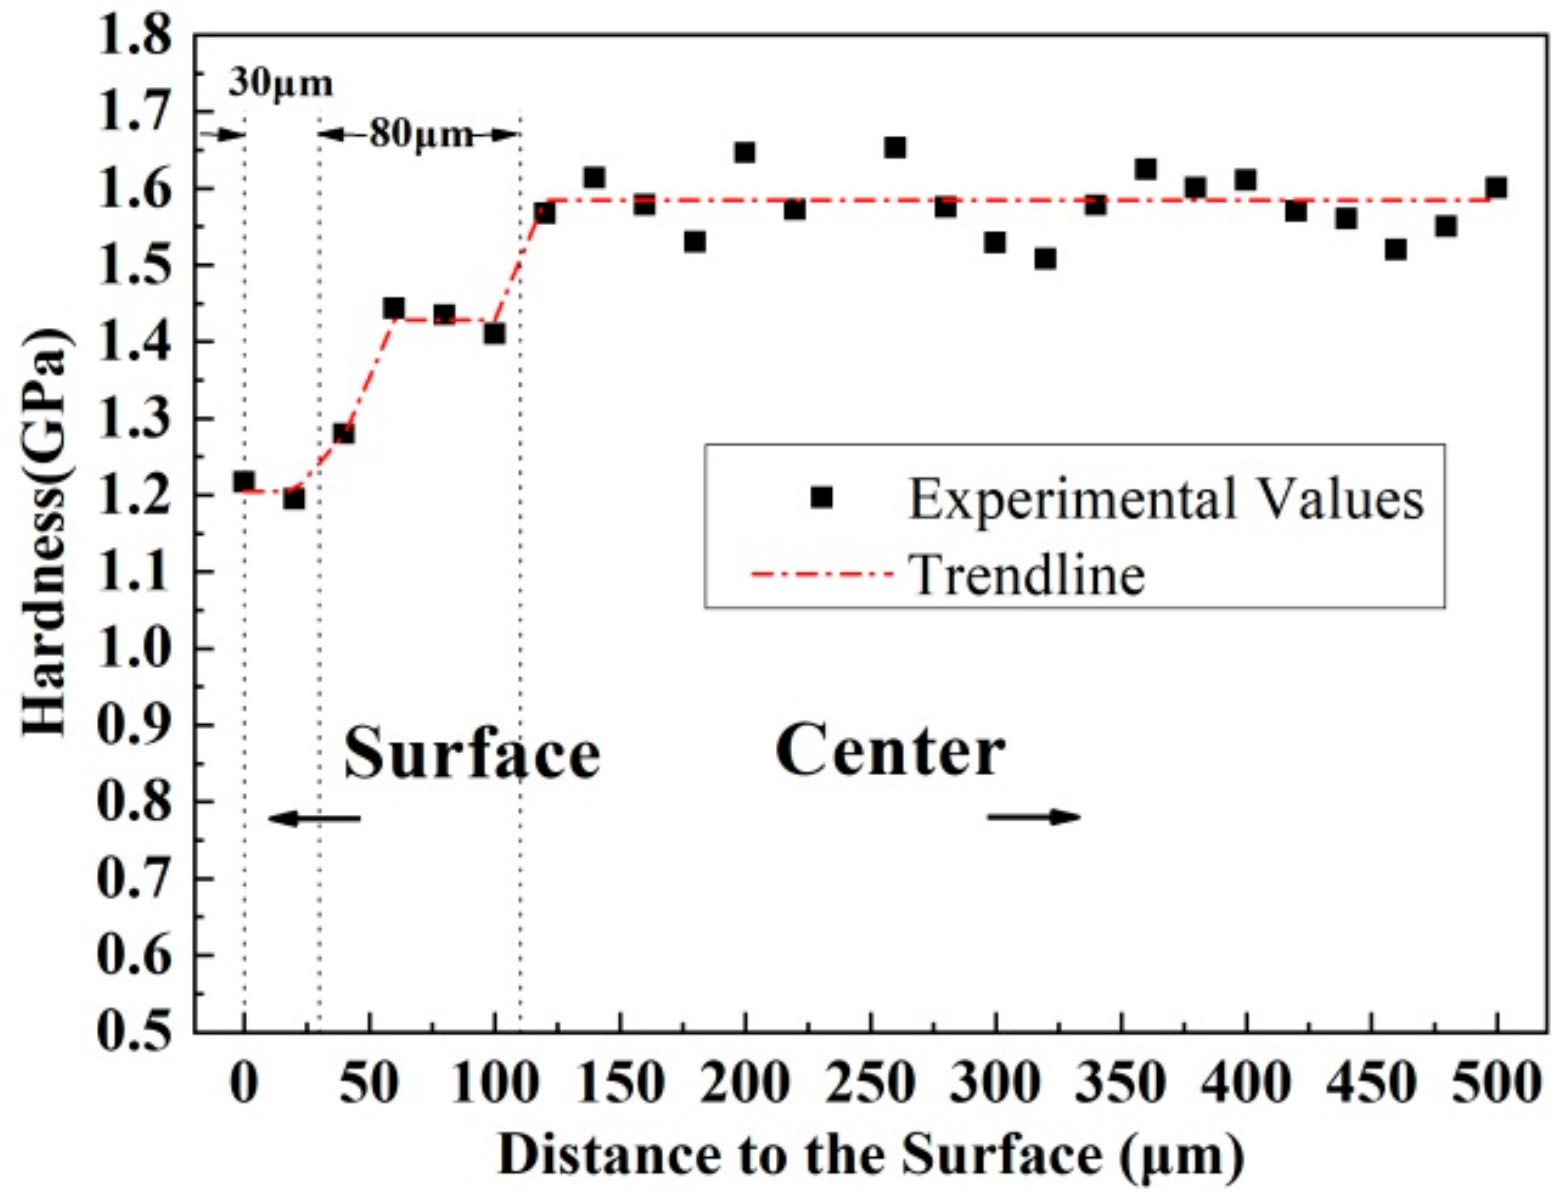
The end face of a Ø1 mm × 1.5 mm original cylindrical sample with a grain size of 30 μm was polished for the nanoindentation tests. From the edge to the center, nanoindentation tests were carried out with an applied load of 3000 μN at 20 μm intervals to measure the changes of micro-hardness values.
3. Results and Discussion
3.1. Surface Morphology Analysis of Micro-Compressed Cylindrical Samples
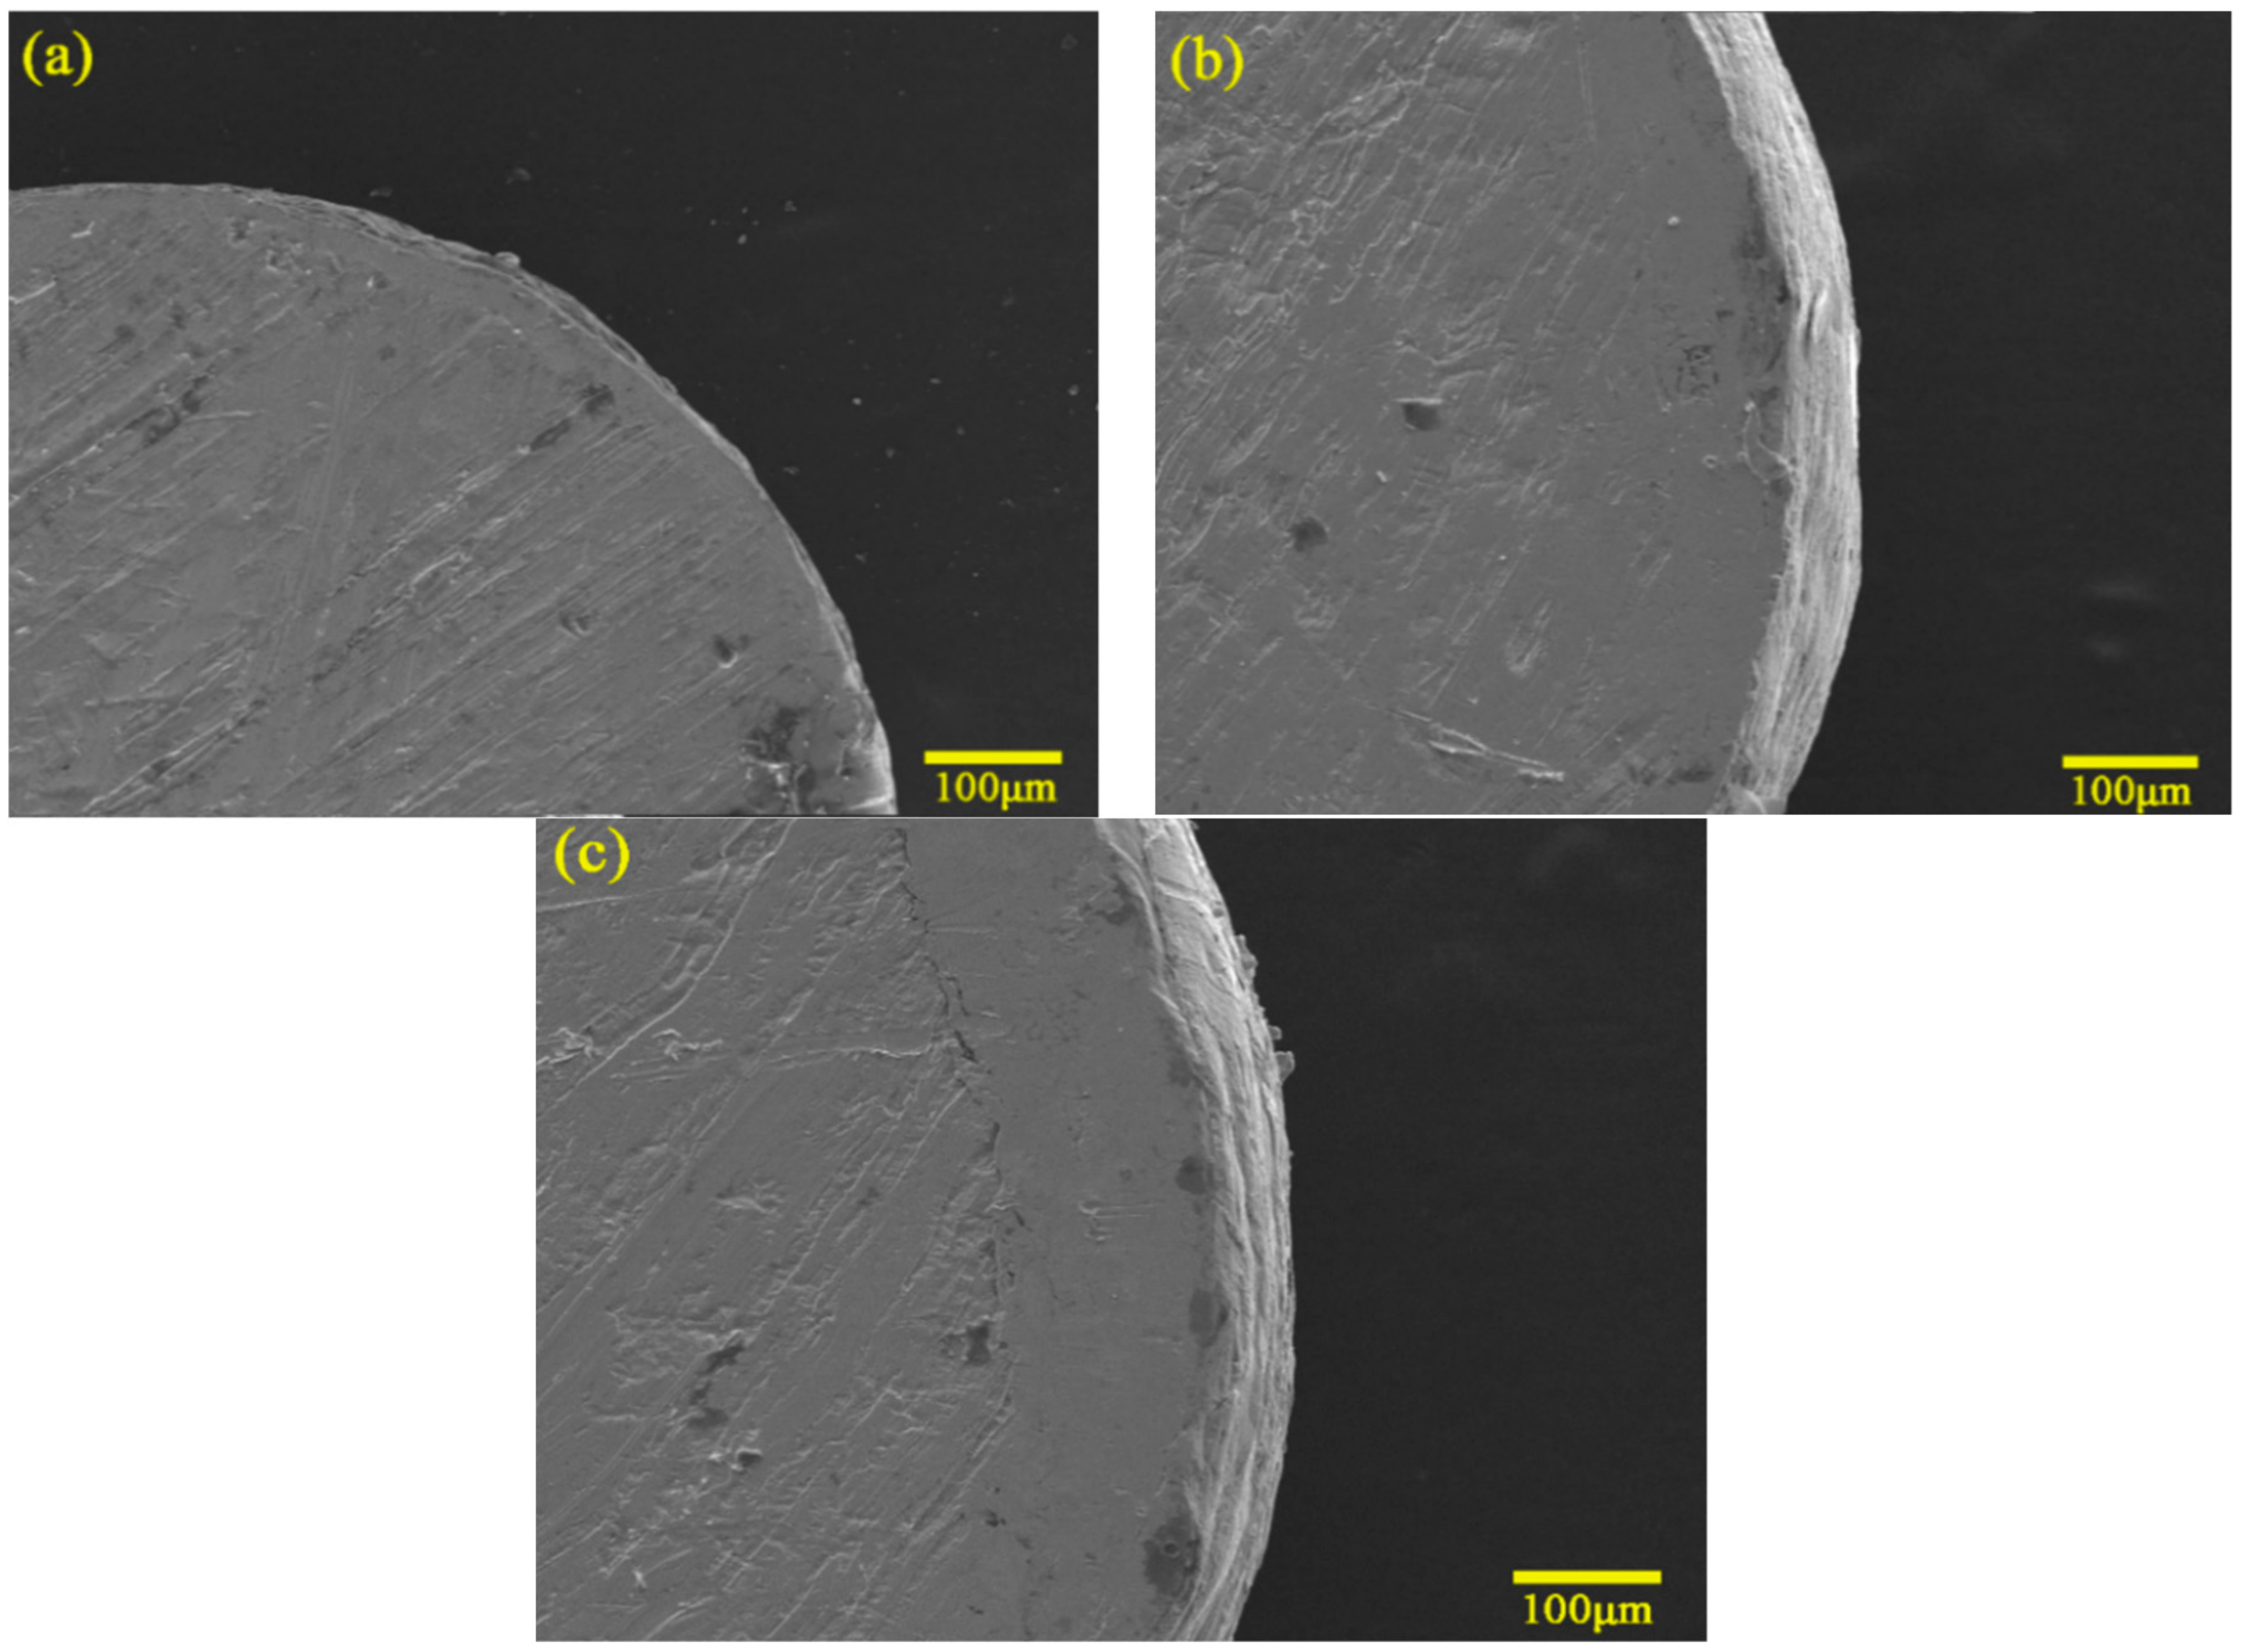
Figure 3 is an SEM photograph of the surface morphology of Ø0.8 mm × 1.2 mm cylindrical samples with an average grain size of 30 μm and at deformation amounts of 30%, 60%, and 75%. It was found from this figure that due to the influence of the friction between the contact surface of the sample and the anvil plate, a drum shape appeared on the side of the cylindrical sample, but no crack appeared. At the same time, it can be seen that the cylindrical surfaces of samples had different degrees of surface roughening. As the degree of deformation increased, the surface roughness of the cylindrical profile of the sample also increased. This is because when the cylindrical sample is loaded, the anisotropy of the grain leads to inconsistency in grain displacement and deformation. The free surface grains are less constrained by other grains, and during the deformation process, the deformation and displacement of these surface grains can be inconsistent due to lack of coordination. When the amount of deformation increases, the inconsistency of surface grain deformation and displacement becomes more obvious [14].
Figure 4 is an SEM photograph of the cylindrical surface morphology of cylindrical samples with a compression amount of 60% and different sample sizes and grain sizes. As can be seen from Figure 4, all samples showed good plasticity and no crack appeared. From Figure 4a–c, it can be seen that when the grain size remained unchanged, the surface roughening degree of the cylindrical compression sample increased with the decrease of the sample size, that is, the non-uniform flow degree of the material increased. From Figure 4a,d,e, it can be seen that in the case of a smaller average grain size, the profile of the cylindrical sample after compression was relatively flat, and the edges were relatively rounded. When the average grain size increased, the surface roughness of the compressed cylindrical sample increased remarkably, and the edge became irregular. From Figure 4c,f, it can be also observed that the same cylindrical profile surface roughness increased with the increase of average grain size, but compared with Figure 4a,e, the change of surface roughness was smaller, that is, the cylindrical surface of the compressed sample was less affected by the change of grain size. The phenomenon of Figure 4 can be explained from both surface roughening [16] and the surface layer model [17,18,19]. The surface grain obviously flowed unevenly due to less constraint from the surrounding grains. When the ratio of the grain size to the sample size was large, the proportion of surface grains was larger, which led to greater inhomogeneity of the plastic deformation of the whole sample.
3.2. Stress Analysis of Cylindrical Micro-Compression Deformation Process
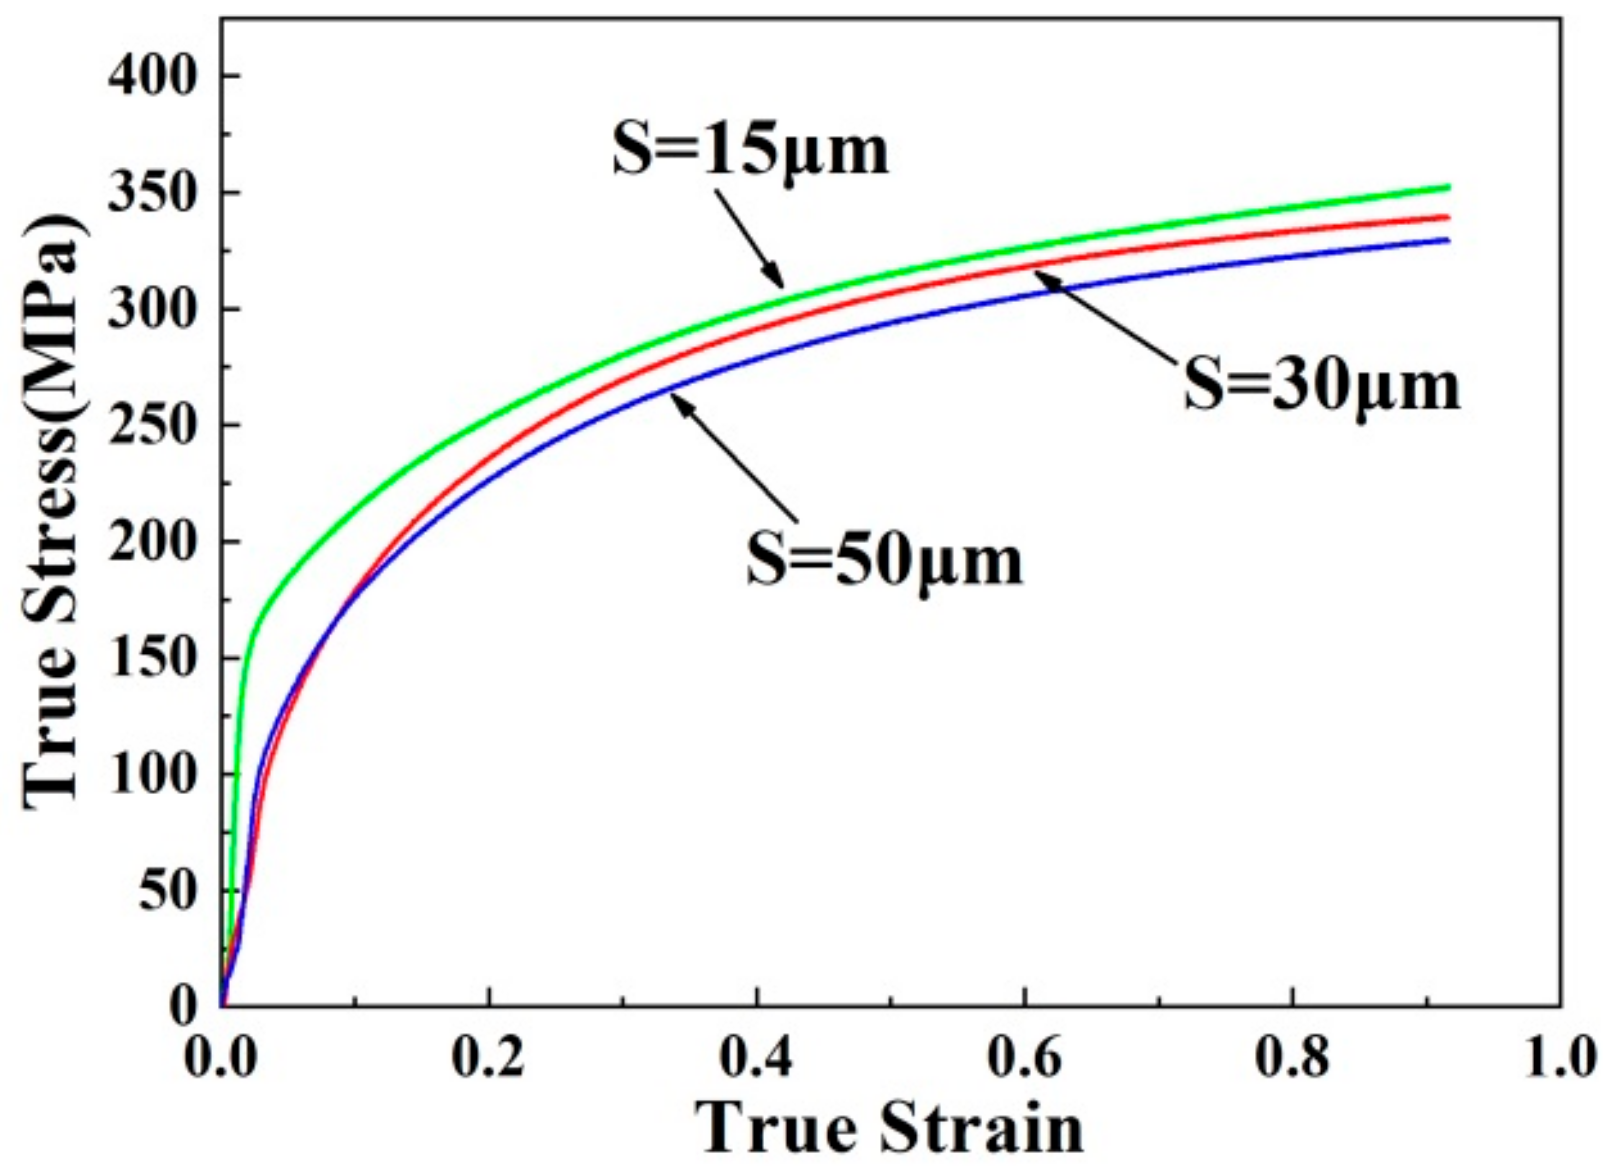
The true stress–strain curve of the sample can truly reflect the relationship between the instantaneous deformation degree and the deformation resistance during the actual deformation of the sample. Figure 5 shows the corresponding flow stress curves of samples with different sizes under the condition of an average grain size of 15 μm. It can be seen that the flow stress of the material shows a significant downward trend with the decrease of the size of the cylindrical compressed sample. Figure 6 shows the corresponding flow stress curves of samples with different average grain sizes under the condition of a micro-cylindrical diameter of 1 mm. It can be seen that the flow stress shows a significant decrease trend with the increase of average grain size. The phenomenon that the flow stress decreased with the decrease of sample size or the increase of average grain size can be explained from two aspects. First, according to the theory of dislocation pile-up [20], due to the inhibition of the grain boundary structure itself, the difference in orientation between adjacent grains, and the external force, it is difficult for the dislocation to pass through the grain boundary, and it is easy to accumulate near the grain boundary and form stress concentration on the grain boundary. This is also the reason that grain refinement can improve the strength of the material. Second, since one side of the surface grain is a free surface, dislocations cannot accumulate on the free surface of the grain during the plastic deformation of the material, so the hardening effect of the surface grain on the deformation and resistance is much lower. According to the surface layer model, when the average grain size increases or sample size decreases, the relative volume fraction of the less constrained surface layer grains increases, and the effect of the surface layer grains in the overall deformation process increases, thereby causing the overall flow stress of the material reduced.
3.3. Analysis of Nanoindentation Experiment Results
The micro-hardness value changed with the distance between the measuring point and the surface as shown in Figure 7. The inner grains were constrained and influenced by grain boundaries and surrounding grains, making the inner grains more resistant to deformation, resulting in higher micro-hardness values. The surface grains were less constrained, so the surface of the sample had a lower micro-hardness value. At the same time, there was indeed a transition region between the surface layer grains and the inner grains. In this region, the change of micro-hardness value had a certain degree of continuity, and on the whole showed an increasing trend as the distance to the surface increased. According to the results of the nanoindentation experiment, it has been proved that the sample is composed of three different areas, namely, the surface layer, the transition layer, and the inner layer.
3.4. Surface Transition Layer Model
Because surface grains are less constrained and dislocations are not easy to accumulate here, the flow stress of surface grains is smaller than that of inner grains during the deformation process. Taking the differences of flow stresses between surface grains and inner grains into account, the surface layer model (hereinafter referred to as SLM) thinks that the flow stress of material is determined by the two parts together. Considering the volume fraction of surface grains and inner grains, the material flow stress can be expressed as follows [13,21]:
where σs(ε) and σi(ε) represent the flow stress of the surface grain and the inner grain, respectively. Correspondingly, αs and αi are the volume fraction of surface grains and inner grains in the total grains, respectively, αs + αi = 1. For the cylindrical sample, as shown in Figure 8, αs can be calculated by the following equation:
where ds and hs are the diameter and original height of the cylindrical sample, respectively, and dg is the average grain size. When the sample size is much larger than the grain size, the αs value is close to 0, and the effect of surface grain is negligible. As the sample size decreases or the average grain size increases, the αs value increases, and the effect of surface grains increases as well.
The surface layer model only considers the effect of flow stress and the volume fraction of surface and inner grains on the calculation results, which are often not accurate. In recent years, based on the surface layer model, some scholars have tried to construct a more accurate model by considering plastic strain gradient hardening, such as Wang et al. [21], or subdividing the inner grain into grain interior and grain boundary, such as Li et al. [22]. In this paper, the nanoindentation results show that there was a transition layer between the surface layer with low flow stress and the inner layer with high flow stress. Thus, taking the continuity between the deformation and the mechanical properties of grains into account, a surface transition layer model (hereinafter referred to as STLM) is established based on the surface layer model. The area where mechanical properties (hardness) do not change with position is regarded as the inner layer, the area where the surface grains are located is regarded as the surface layer, and the area where the hardness increases with the distance to the surface is regarded as the transition layer. Some assumptions are promoted for establishing the model:
- (1)
- It is assumed that the grain size is uniform in the same heat treatment state and is uniformly distributed in the cross section of the sample.
- (2)
- In order to simplify the model, the influence of the grain orientation difference in the surface grains is not considered in the calculation process.
- (3)
- The grains that are in contact with the anvils are also regarded as surface grains, and the grain volume fractions of each part are calculated by the average grain size and the sample size.
- (4)
- There are transition layer grains between surface grains and inner grains. The mechanical properties of the transition layer grains are between the surface and the inner grains and are affected by the surrounding grains.
- (5)
- The applied strain rate has the same hardening effect on the flow stress of the three layers.
- (6)
- The mechanical properties of the material are determined by the grains of each part and their respective volume fractions.
The global flow stress of the material can be expressed as follows:
where σs(ε), σm(ε) and σi(ε) are the flow stresses of surface grains, transition layer grains, and inner grains, respectively, and αs, αm and αi are the volume fractions of surface grains, transition layer grains, and inner grains, respectively. Since the transition layer contains multiple layers, the flow stress of each layer is between the surface grains and the inner grains, with a linear increase trend from the outside to the inside, so the value of αmσm(ε) can be decomposed according to Equations (5) and (6):
where n is the number of grain layers, and σs(ε) < σ1(ε) < σ2(ε) < … < σn(ε) < σi(ε). From the grain near the surface layer to the grain near the inner grains, the flow stress of the grain gradually increases, so that the flow stress of the material continuously propagates between the surface layer and the inside. The thickness of the transition layer grains, that is, the volume fraction αm of the transition layer grains, varies with the average grain size of the material and the characteristic size of the sample.
It can be seen from the variation in the micro-hardness values of Figure 7 that the range of the transition region is about two grain sizes. Therefore, in the microscopic scale, the thickness of the transition layer is simplified to the size of two layers of grains between the surface layer grains and the inner layer grains, as shown in Figure 8. At the same time, the mechanical properties of the transition layer grains are simplified to the average of the surface grains and the inner grains, as shown in Equation (7):
Then, combining Equations (2), (3), (4), (7), and (8), the surface transition layer model is as follows:
To simplify the calculation, the influence of grain size on the inner grain and surface grain flow stress values is not considered. The flow stresses of inner and surface grains are calculated by choosing the average grain size sizes dg of 30 μm, and αs and αi of the sample size of Ø0.8 mm × 1.2 mm and Ø2 mm × 3 mm. The values of σ(ε) of the two kinds of sample sizes were obtained from the micro-compression experimental stress–strain curves. The flow stress curves of inner grains, transition layer grains, and surface grains calculated according to Equation (9) are shown in Figure 9.
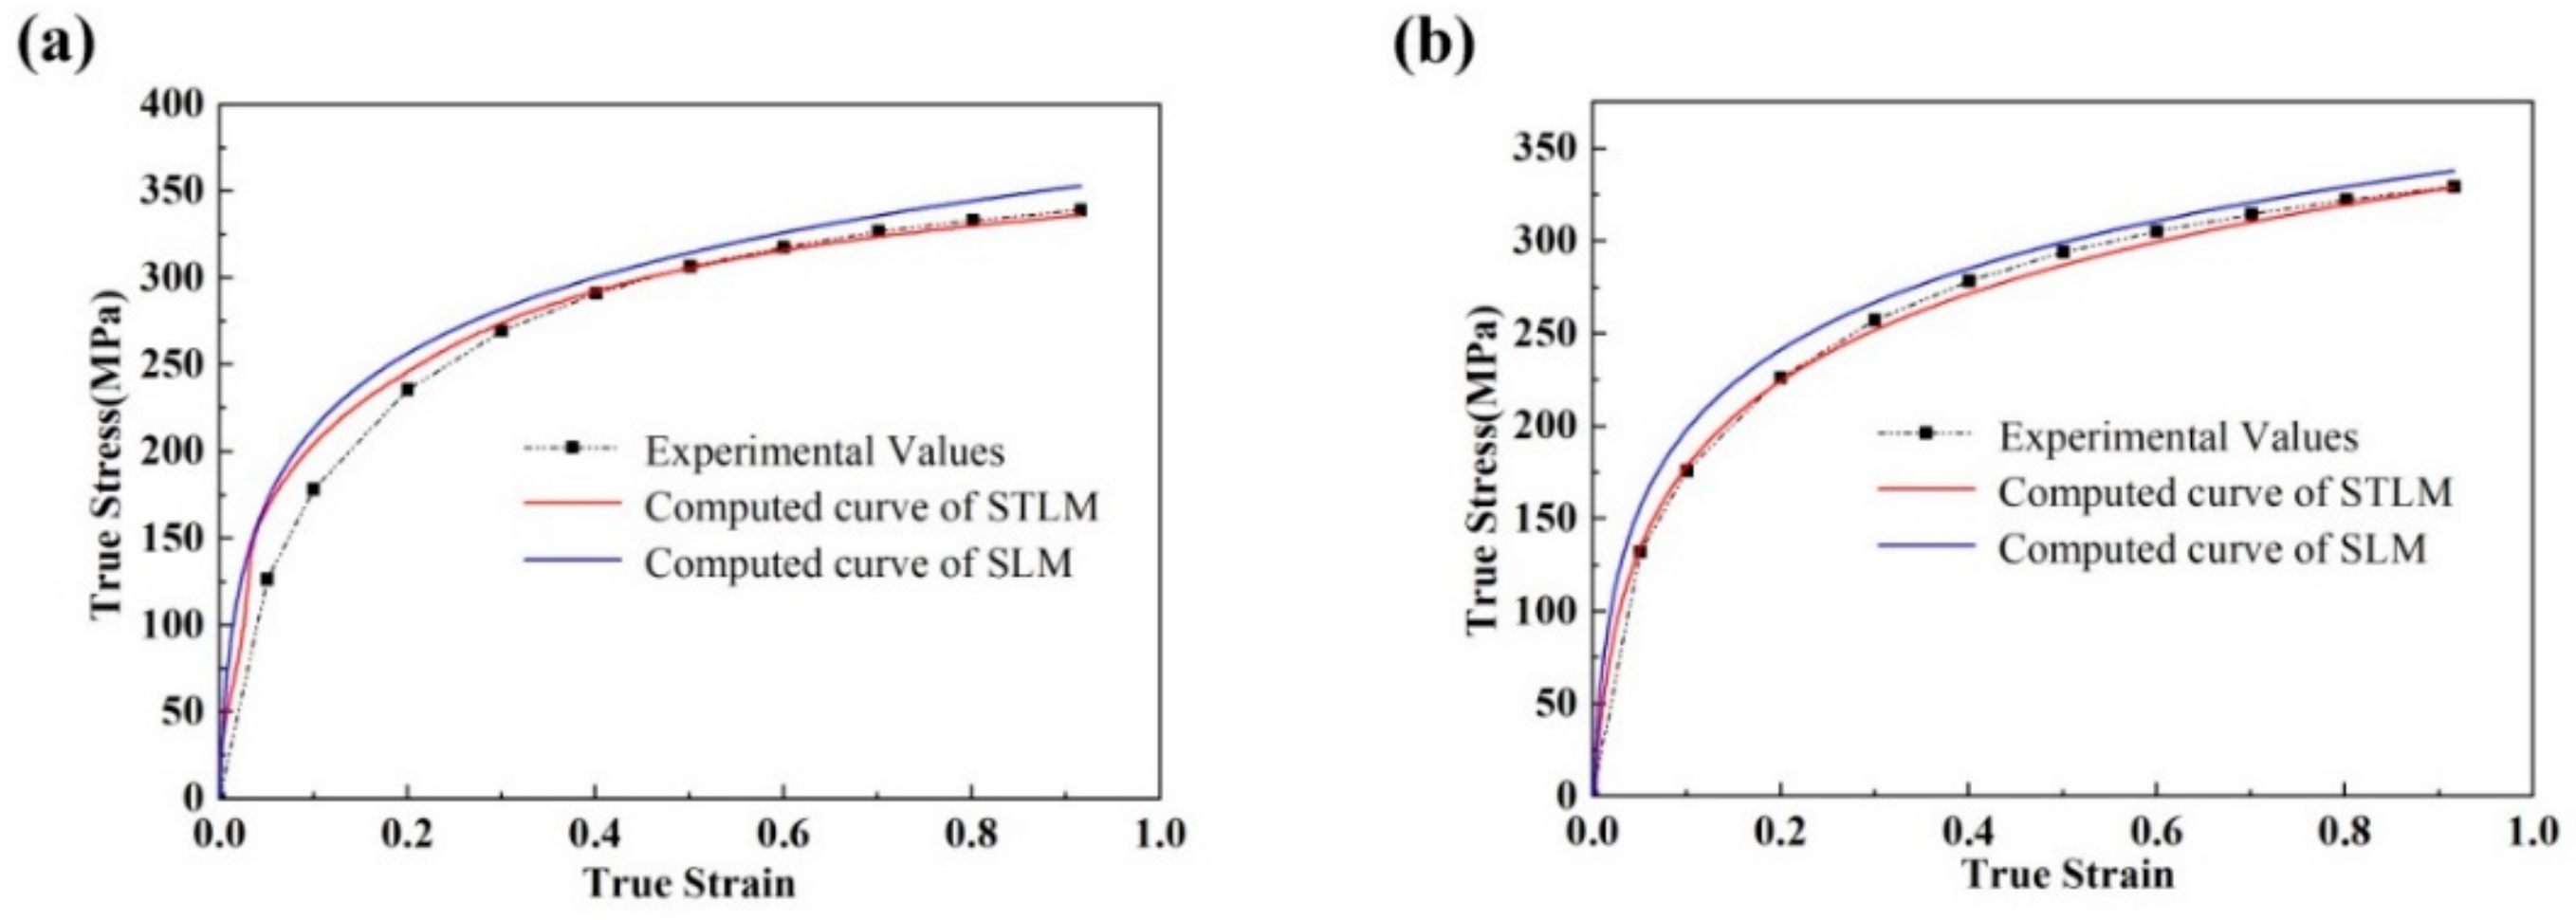
The calculated flow stress curves of inner grains, transition layer grains, and surface grains are substituted into Equation (9) to calculate the true stress–strain curves of Ø1 mm × 1.5 mm cylindrical samples. Similarly, the flow stress–strain curves corresponding to the surface layer model can be calculated from Equations (1) and (2), and the stress–strain curves calculated by the two models are compared with the experimentally measured values. As shown in Figure 10, it can be seen that in the case of an average grain size of 30 μm and 50 μm, the flow stresses calculated by the surface layer model are higher than those of the surface transition layer model, because the surface layer model regards transition layer grains as inner grains for the calculation. The results in Figure 10 show that the true stress–strain curve calculated by the surface transition layer model agrees well with the experimentally measured values. At the same time, when the average grain size becomes larger, the calculated value of the transition layer model will be more consistent with the experimental value than the surface layer model. This may be due to the increase in the volume fraction of the transition layer grains in the case of a large grain size, making the surface transition layer model more reflective of the actual deformation situation of the material due to the consideration of the transition layer. It should be noted that the new model is very sensitive to the number of grain layers in the transition layer and its statistical scatter. The calculation of transition layer thickness depends on the number of micro-hardness measurement points. If the number of measurement points is too small, the calculation of transition layer thickness will come into errors. Moreover, the thickness of the transition layer does not exactly correspond to two layers of grains, so the number of grain layers in the transition layer may be uncertain in the model. However, combining the theoretical hypothesis of transition layer and the fitting analysis based on experimental data, the predicted results are still in good agreement with the actual situation. Of course, some factors that affect the size effect still need to be studied further, for example, the hardening effect of the applied strain rate on the flow stress of the three layers.
4. Conclusions
- (1)
- As the grain size or compressive account of deformation of the micro-cylindrical sample increases, the flow deformation non-uniformity of the surface layer of the sample increases. As the size of the cylindrical sample decreases, the non-uniformity of the flow deformation of the surface layer increases. As the size of the cylindrical sample decreases or the average grain size increases, the flow stress of the micro-cylindrical sample decreases, which can be explained by surface roughening and the surface layer model.
- (2)
- Through the nanoindentation experiment, it was found that the micro-hardness value increases with the increase of the distance between the measurement point and the surface, and the change of the hardness value has continuity, which indicated that there is a transition layer between the surface layer grain and the inner grain.
- (3)
- On the basis of the surface layer model, considering the influence of the transition layer grains, the grains of a micro-cylindrical sample were divided into three parts: surface layer grains, inner grains, and transition layer grains. The surface transition layer model was proposed. The experimental results showed that the surface transition layer model can more accurately reflect the actual condition of the material, especially when the grain size is larger.
Author Contributions
Conceptualization, L.D.; methodology, J.J.; investigation, W.L.; writing—original draft preparation, L.D.; project administration, J.J.; funding acquisition, X.W. and L.D.
Funding
This research was funded by the National Natural Science Foundation of China (Grant No.: 51675200 and 51725504), and the Fundamental Research Funds for the Central Universities (Grant No.: 2018KFYYXJJ027).
Acknowledgments
The authors are also grateful for the fruitful discussion with Xutang Li and the technical assistance from the Analytical Platform of the State Key Laboratory of Materials Processing and Die & Mould Technology.
Conflicts of Interest
The authors declare no conflict of interest.
References
- Parasiz, S.A. Investigation and Characterization of Size Effects in Microforming Processes. Ph.D. Thesis, University of New Hampshire, Durham, NH, USA, 24 November 2008. [Google Scholar]
- Sun, C.Q.; Song, Q.Y. A method for predicting the effects of sample geometry and loading condition on fatigue strength. Metals 2018, 8, 811. [Google Scholar] [CrossRef]
- Li, L.; Zhou, Q.; Zhou, Y.Y.; Cao, J.G. Numerical study on the size effect in the ultra-thin sheet’s micro-bending forming process. Mater. Sci. Eng. A 2009, 499, 32–35. [Google Scholar] [CrossRef]
- Liu, H.X.; Zhang, W.H.; Gau, J.T.; Shen, Z.B.; Ma, Y.J.; Zhang, G.C.; Wang, X. Feature size effect on formability of multilayer metal composite sheets under microscale laser flexible forming. Metals 2017, 7, 275. [Google Scholar] [CrossRef]
- Matteo, G.; Hosni, I.; Sebastien, G.; Jean-Jacques, B. Homogeneous flow and size dependent mechanical behavior in highly ductile Zr65Ni35 metallic glass films. Acta Mater. 2017, 131, 246–259. [Google Scholar]
- Greer, J.R.; De Hosson, J.T.M. Plasticity in small-sized metallic systems: Intrinsic versus extrinsic size effect. Prog. Mater Sci. 2011, 56, 654–724. [Google Scholar] [CrossRef]
- Ghidelli, M.; Gravier, S.; Blandin, J.-J.; Djemia, P.; Mompiou, F.; Abadias, G.; Raskin, J.-P.; Pardoen, T. Extrinsic mechanical size effects in thin ZrNi metallic glass films. Acta Mater. 2015, 90, 232–241. [Google Scholar] [CrossRef]
- Chan, W.L.; Fu, M.W. Experimental studies and numerical modeling of the sample and grain size effects on the flow stress of sheet metal in microforming. Mater. Sci. Eng. A 2011, 528, 7674–7683. [Google Scholar] [CrossRef]
- Raulea, L.V.; Goijaerts, A.M.; Govaert, L.E.; Baaijens, F.P.T. Size effects in the processing of thin metal sheets. J. Mater. Process. Tech. 2001, 115, 44–48. [Google Scholar] [CrossRef]
- Liu, F.; Peng, L.F.; Lai, X.M. Study on the size effect and the effect of the friction coefficient on the micro-extrusion process. Lect. Notes Control Inf. 2007, 362, 493–499. [Google Scholar]
- Wang, C.J.; Wang, C.J.; Guo, B.; Shan, D.B.; Huang, G. Size effect on flow stress in uniaxial compression of pure nickel cylinders with a few grains across thickness. Mater. Lett. 2013, 106, 294–296. [Google Scholar] [CrossRef]
- Conrad, H.; Jung, K. Effect of grain size from mm to nm on the flow stress and plastic deformation kinetics of Au at low homologous temperatures. Mater. Sci. Eng. A 2005, 406, 78–85. [Google Scholar] [CrossRef]
- Geiger, M.; Mebner, A.; Engel, U. Production of microparts-size effects in bulk metal forming: Similarity theory. Prod. Eng. 1997, 4, 55–58. [Google Scholar]
- Geiger, M.; Kleiner, M.; Eckstein, R.; Tiesler, N.; Engel, U. Microforming. CIRP Ann.-Manuf. Technol. 2001, 50, 445–462. [Google Scholar] [CrossRef]
- Han, Z.; Wu, W.F.; Li, Y.; Wei, Y.J.; Gao, H.J. An instability index of shear band for plasticity in metallic glasses. Acta Mater. 2009, 57, 1367–1372. [Google Scholar] [CrossRef]
- Choi, Y.S.; Piehler, H.R.; Rollett, A.D. Formation of mesoscale roughening in 6022-T4 Al sheets deformed in plane-strain tension. Metall. Mater. Trans. A 2004, 35, 513–524. [Google Scholar] [CrossRef] [Green Version]
- Huang, X.H.; Tan, X.F. Creation and simulation of surface layer model in micro-forming based on size effect. Hot Working Techn. 2013, 42, 118–121. [Google Scholar]
- Chan, W.L.; Fu, M.W.; Lu, J. The size effect on micro deformation behaviour in micro-scale plastic deformation. Mater. Des. 2011, 32, 198–206. [Google Scholar] [CrossRef]
- Lai, X.M.; Peng, L.F.; Hu, P.; Lan, S.H.; Ni, J. Material behavior modelling in micro/meso-scale forming process with considering size/scale effects. Comp. Mater. Sci. 2008, 43, 1003–1009. [Google Scholar] [CrossRef]
- Kuhlmann-Wilsdorf, D. The theory of dislocation-based crystal plasticity. Philos. Mag. 1999, 79, 955–1008. [Google Scholar] [CrossRef]
- Wang, Z.; Li, S.H.; Wang, X.K.; Gui, R.G.; Zhang, W.G. Modeling of surface layer and strain gradient hardening effects on microbending of non-oriented silicon steel sheet. Mater. Sci. Eng. A 2018, 711, 498–507. [Google Scholar] [CrossRef]
- Li, W.T.; Fu, M.W.; Shi, S.Q. Study of deformation and ductile fracture behaviors in micro-scale deformation using a combined surface layer and grain boundary strengthening model. Int. J. Mech. Sci. 2017, 131, 924–937. [Google Scholar] [CrossRef]
Figure 1.
Various grain sizes under different heat treatment conditions: (a) 430 °C for an hour and air cooling; (b) 700 °C for 8 h and air cooling; (c) 700 °C for 24 h and air cooling.
Figure 1.
Various grain sizes under different heat treatment conditions: (a) 430 °C for an hour and air cooling; (b) 700 °C for 8 h and air cooling; (c) 700 °C for 24 h and air cooling.

Figure 2.
T2 copper cylindrical samples.

Figure 3.
Surface morphology of compressed samples (Ø0.8 mm × 1.2 mm and grain size 30 μm) under various compression degrees: (a) 30%; (b) 60%; (c) 75%.
Figure 3.
Surface morphology of compressed samples (Ø0.8 mm × 1.2 mm and grain size 30 μm) under various compression degrees: (a) 30%; (b) 60%; (c) 75%.

Figure 4.
Surface morphology of compressed samples with various sample sizes and various grain sizes (compression degrees are all 60%): (a) Ø0.8 mm × 1.2 mm and grain size 15 μm; (b) Ø1 mm × 1.5 mm and grain size 15 μm; (c) Ø2 mm × 3 mm and grain size 15 μm; (d) Ø0.8 mm × 1.2 mm and grain size 30 μm; (e) Ø0.8 mm × 1.2 mm and grain size 50 μm; (f) Ø2 mm × 3 mm and grain size 50 μm.
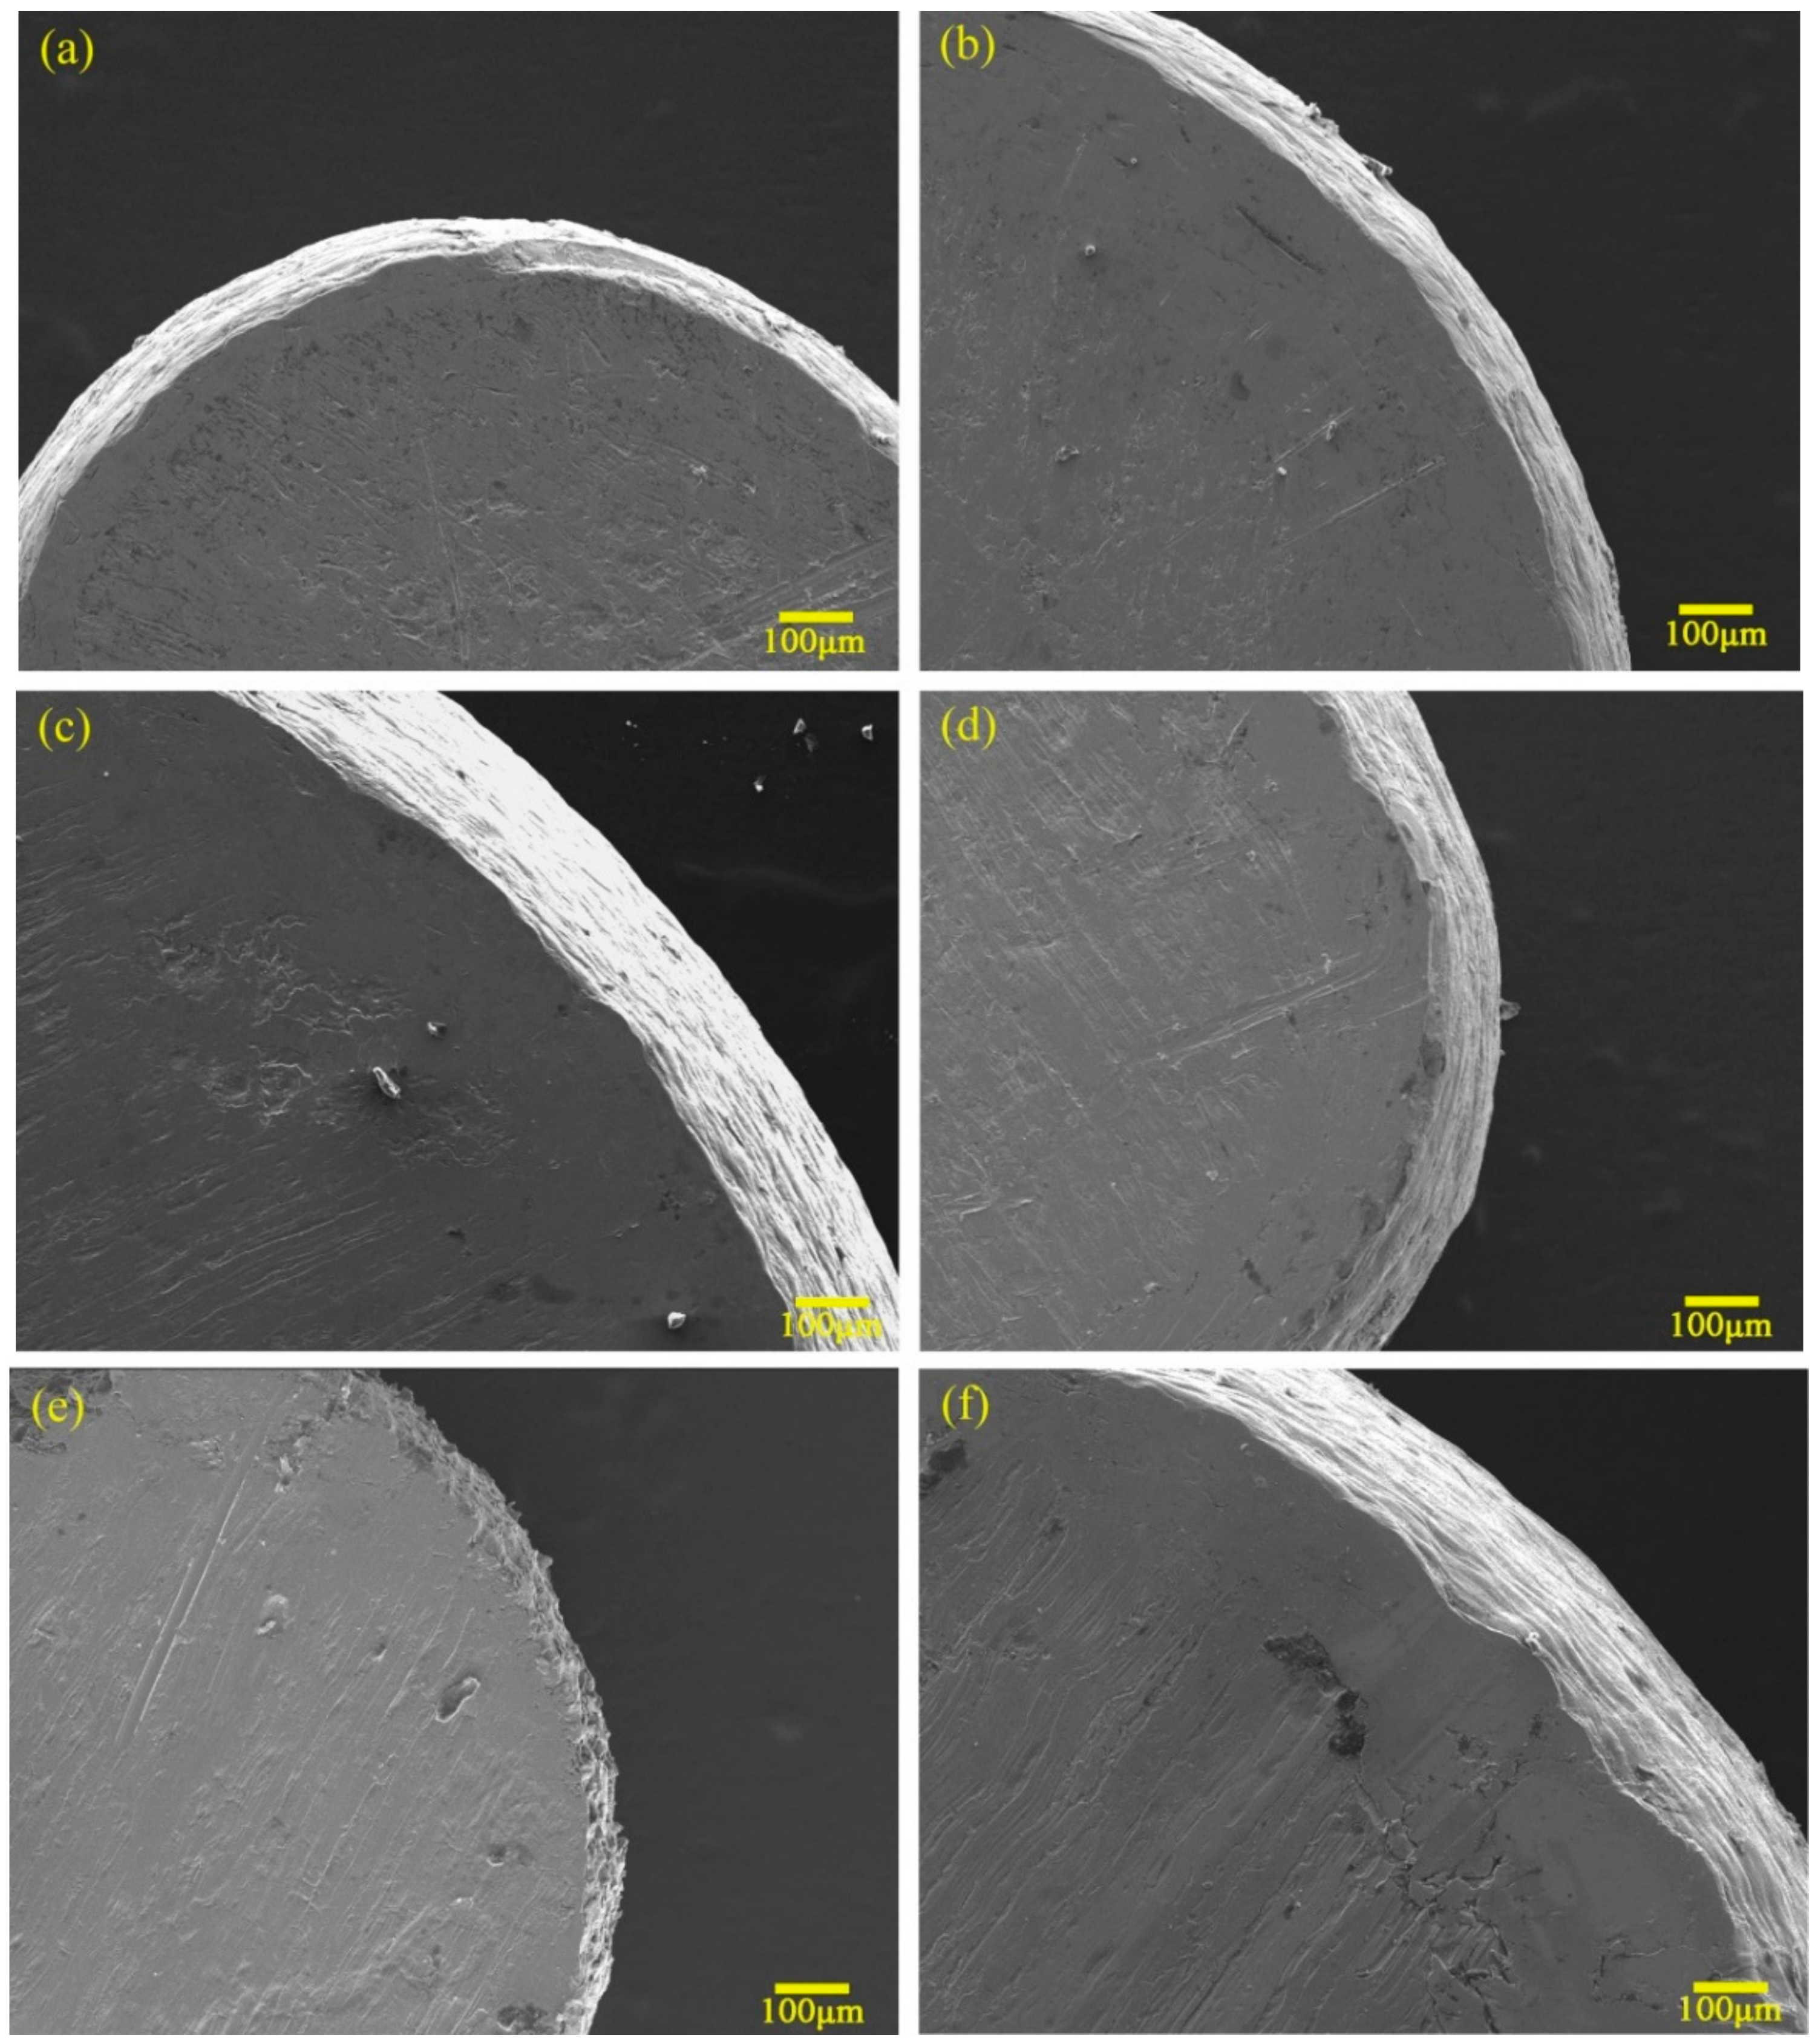
Figure 5.
Flow stress of compressed samples with various geometry sizes.

Figure 6.
Flow stress of compressed samples with various grain sizes.

Figure 7.
Micro-hardness values of different positions of original copper cylinder with a diameter of 1 mm.
Figure 7.
Micro-hardness values of different positions of original copper cylinder with a diameter of 1 mm.

Figure 8.
Schematic picture of the transition layer model: The left is the actual distribution model of three kinds of grains, and the right is the model after simplifying the transition layer into two layers of grains.
Figure 8.
Schematic picture of the transition layer model: The left is the actual distribution model of three kinds of grains, and the right is the model after simplifying the transition layer into two layers of grains.

Figure 9.
Flow stress of three kinds of grains at an average grain size of 30 μm.
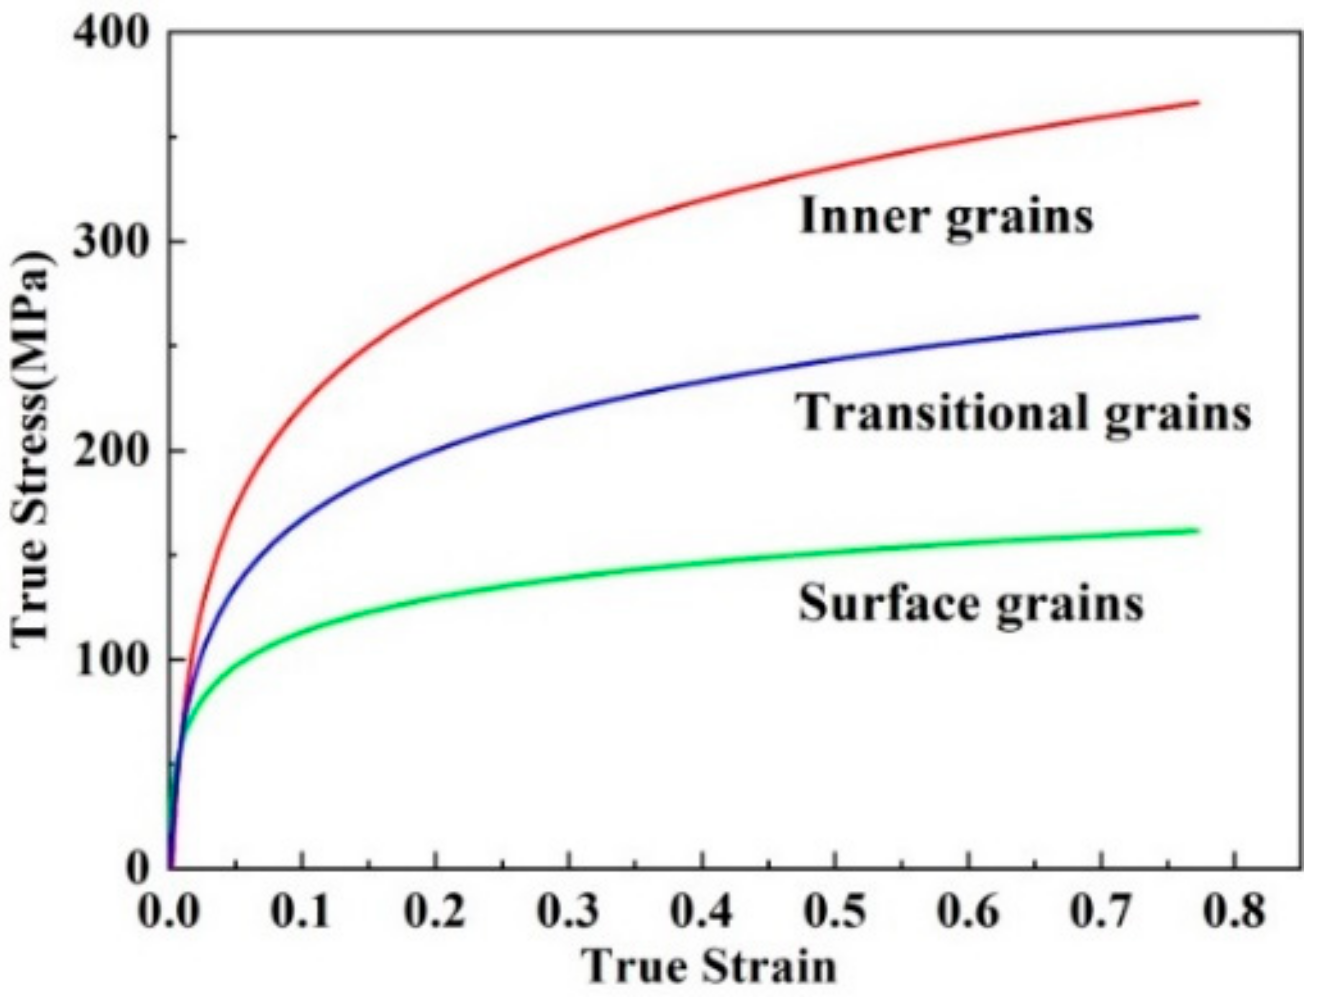
Figure 10.
Comparison of stress–strain curves calculated by two models with actual stress–strain curves: (a) when the grain size is 30 μm, Ø1 mm × 1.5 mm; (b) when the grain size is 50 μm, Ø1 mm × 1.5 mm.
Figure 10.
Comparison of stress–strain curves calculated by two models with actual stress–strain curves: (a) when the grain size is 30 μm, Ø1 mm × 1.5 mm; (b) when the grain size is 50 μm, Ø1 mm × 1.5 mm.

Table 1.
Heat treatment process and average grain size.
| Heat Treatment Process | 430 °C 1 h + Air Cooling | 700 °C 8 h + Air Cooling | 700 °C 24 h + Air Cooling |
|---|---|---|---|
| Average grain size S (μm) | 15 | 30 | 50 |
| Standard deviation σ (μm) | 1.7 | 2.4 | 4.3 |
© 2019 by the authors. Licensee MDPI, Basel, Switzerland. This article is an open access article distributed under the terms and conditions of the Creative Commons Attribution (CC BY) license (http://creativecommons.org/licenses/by/4.0/).
Share and Cite
MDPI and ACS Style
Deng, L.; Liu, W.; Wang, X.; Jin, J. A Surface Transition Layer Model for Size Effect in T2 Copper Micro-Compression. Metals 2019, 9, 736. https://doi.org/10.3390/met9070736
AMA Style
Deng L, Liu W, Wang X, Jin J. A Surface Transition Layer Model for Size Effect in T2 Copper Micro-Compression. Metals. 2019; 9(7):736. https://doi.org/10.3390/met9070736
Chicago/Turabian StyleDeng, Lei, Wei Liu, Xinyun Wang, and Junsong Jin. 2019. "A Surface Transition Layer Model for Size Effect in T2 Copper Micro-Compression" Metals 9, no. 7: 736. https://doi.org/10.3390/met9070736
Note that from the first issue of 2016, this journal uses article numbers instead of page numbers. See further details here.