Article

Optimization of Process Parameters to Improve the Effective Area of Deposition in GMAW-Based Additive Manufacturing and its Mechanical and Microstructural Analysis

School of Mechanical Engineering, Northwestern Polytechnical University, Xi’an 710072, China
*
Author to whom correspondence should be addressed.
Metals 2019, 9(7), 775; https://doi.org/10.3390/met9070775
Submission received: 29 May 2019 / Revised: 28 June 2019 / Accepted: 5 July 2019 / Published: 10 July 2019
(This article belongs to the Special Issue Arc-based Additive Manufacturing)

Abstract

:
Additive manufacturing of metals using gas metal arc welding has an associated problem of variations of height in the onset and extinguishing parts of the weld bead. In this research, robot-assisted welding has been performed to investigate the problem, using AWS ER70S-6 low alloy steel welding electrode wire. After adjustment of welding parameters for a single-layer, single-pass, an optimal profile of welding energy was used to construct a thin wall which exhibited good forming characteristics with an effective area of approximately 97%. The resulting structure was ductile in nature with better tensile strength and microhardness as compared to the rolled steel available in industry with similar carbon content. The microstructure analysis revealed equiaxed grains in most parts of the structure having a fine grain size.

1. Introduction

Layer-by-layer addition of materials is a more efficient way of manufacturing in terms of time and cost compared with conventional subtractive manufacturing [1,2]. Additive manufacturing is being used for manufacturing expensive and difficult to process parts, and can also be used to repair damaged parts [3,4]. Laser energy, electron beam, and wire arc differ in terms of their deposition rates and dimensional accuracies, with laser and electron beam techniques eliciting finer deposition responses [5,6]. Gas metal arc welding (GMAW) and gas tungsten arc welding (GTAW) have the advantage of lower cost and lesser time consumption as the deposition rate is increased [7]. GMAW is considered to have a better bonding strength, and it can be used to build components with large dimensions [8]. The process of deposition is not very simple, thus making it harder to attain the required accuracy and shape. A few techniques from the previous studies include research using robotic GMAW to create parts with simple shapes, while controlling the surface roughness by interlayer temperature [9]. In other studies, density and geometry have been controlled by droplet transfer, while the formation appearance has been controlled based on the heat input of GMAW additive manufacturing [10]. In one of these cases, the path had been reversed in each layer [11]. Various research studies have been conducted to control the deposition accuracy by controlling the wire feed system in the arc zone [12] by heat flow and capillary action of the molten pool [13].
During GMAW-based multilayer deposition, the layer geometry exhibits accumulated errors because of variable conditions between the previously deposited layers and the distance between the nozzle and the top surface. Adaptive control has been developed by monitoring the distance between the nozzle and the top surface [14]. However, the arc onset and extinguishing parts are the most difficult to be controlled as they differ from those at the steady stage. The onset of the bead exhibits an increased height and width, while the end is lower than that elicited at the steady stage. This makes it nonuniform, and this nonuniformity gets exaggerated as the number of layers increases. After a few layers, the difference in height between the onset and the terminating point becomes so significant that it leads to the termination of the process [10]. Control strategies have been adopted to adjust the current, voltage, wire feed rate, and deposition velocity to control the forming characteristics of the arc-striking and arc-extinguishing points [15] but they presented a particular case with no provision to change the parameters.
Moreover, depending on the application, the components may contain multiple layers deposited with multiple passes or multiple layers deposited with a single pass in each layer. The former state is known as multilayer, multi-pass (MLMP), and the latter is known as a multilayer, single-pass (MLSP) state. The heat emission and heat input requirement for both types are different. Accordingly, MLSP is associated with smaller heat input to avoid molten pool overflow [10,16]. It has been observed that the current plays a vital role in the stability of pool flow, especially from the second to the fourth layers. Higher currents induce pool overflow, hence collapsing the forming appearance [17]. The parameters are stable in a single layer, become unstable for multiple layers in single passes. Thus, there is a need to present a strategy which gives the freedom to choose the parameters in different ranges, yet giving the same final result which in our case is height, to maximize the effective area and volume.
After the optimization of the parameters, very little work has been done in previous studies to check the resulting characteristics of the structure created by MLSP, gas metal arc welding additive manufacturing. Unique microstructures can be formed in this process due to variations in temperature gradients and pre- and post-heat effects [18,19].
In this research, a control strategy for MLSP is given based on a constant profile of welding linear energy so that different sets of parameters can be chosen to attain similar height throughout the weld bead. It combines the ideas of controlling parameters at the arc-striking and arc- extinguishing areas along with the control of current in subsequent layers, while maintaining a constant profile of welding linear energy of the three areas, i.e., arc-striking area, arc-extinguishing area, and steady stage. The aim is to stack as many layers as needed without termination of the process, while attaining a maximum effective area so that that the near-net shape can be obtained, ultimately resulting in final component having properties comparable to the existing materials. Moreover, a thorough discussion regarding mechanical and material properties of the resulting structure has been given.

2. Method and Experiment

A GMAW power source, KempArc SYN 500 (Kemppi Welding Technology, Beijing, China) was used for the welding process. The shielding gas used was pure Argon with a constant gas flow rate of 18 L/m. The distance between the GMAW nozzle and the top surface was maintained at 12 mm. The base metal was low-carbon steel with dimensions of 15 mm × 450 mm × 95 mm. It was placed vertically with the welding being performed on the 15 mm side. The base was kept static while the welding torch was mounted on a KUKA KR16 (KUKA Robotics, Beijing, China) robot with six degrees-of-freedom. The nozzle was tilted at pull or drag angles of 10°. The experimental setup and schematic of GMAW is shown in Figure 1.
The electrode wire used was a 1.2 mm AWS ER70S–6 copper-coated low-alloy steel electrode with various chemical compositions, as listed in Table 1.
Various samples were extracted from the thin wall structure based on important areas concerning variation in welding parameters as well as cooling conditions. The same samples were used for metallography and microhardness which were extracted from arc-striking, steady stage, and arc-extinguishing areas both before and after the equilibrium conditions were achieved. Each sample was extracted in a way that more than one layer could be analyzed along with the transition between the layers. All the specimens were extracted using an electric discharge wire cut machine.
Samples for metallography were mechanically polished and etched using 4% Nital. Optical microscopy was carried out using an OLYMPUS GX-71 (Olympus corporation, Tokyo, Japan) and a LEICA DMI300M (Leica Microsystems GmbH, Wetzlar, Germany). Scanning electron microscopy was conducted using a TESCAN VEGA (Oxford Instruments Technology, Beijing, China) and a ZEISS SUPRA (Oxford Instruments plc, Abingdon, UK) using a secondary electron detector [21]. The same samples were then used for microhardness testing using a LECO AMH43 (LECO corporation, Michigan, USA) and KAIRDA THV-1MD (Teshi Precision Instruments corporation, Shanghai, China) with a test load of 200 g and dwell time of 10 s following the guidelines of ASTM E384 [22]. Tensile testing was carried out on an INSTRON 3382 (Instron, Norwood, Massachusetts, USA) device using a sub-size sample according to the standard ASTM E8 [23] as shown in Figure 2.

3. Results and Discussion

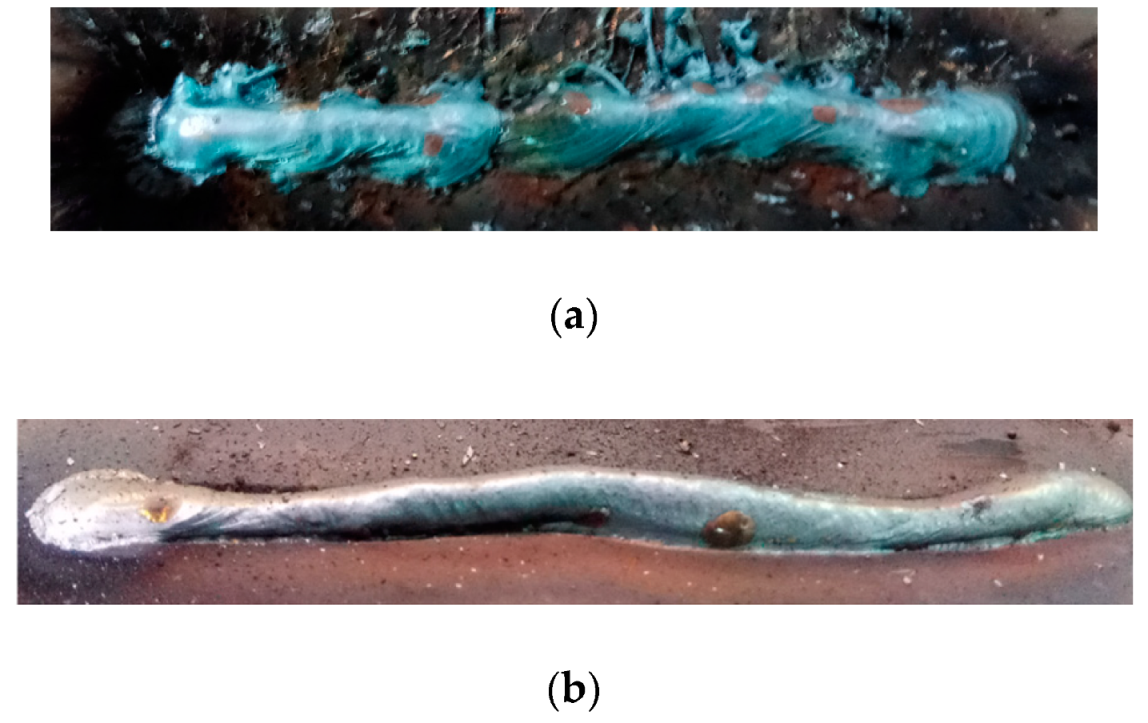
3.1. Single-Layer, Single-Pass

Single-layer, single-pass is the basic unit of multi-layer single-pass manufacturing; thus, its geometry needs to be studied before proceeding to the final shape. If the parameters are not controlled, the arc-striking portion of the deposited layer has a higher height than the steady stage part, while the arc-extinguishing area has a negative slope towards the end of the layer as depicted in Figure 3.
While the voltage of the KempArc SYN 500 GMAW power source can be controlled, the values of current and wire feed speed (WFS) are interchangeably controlled, i.e., either the current or WFS can be selected to be controlled at any given time [24]. The welding machine maintains a particular ratio between the current and WFS at different values of current, as depicted in Figure 4.
As mentioned earlier, in the arc-striking area, the height is greater than at the steady stage because of the excellent heat dissipation in this area, which results in fast solidification of the molten pool. With the movement of the welding torch away from the arc-striking point, liquid metal flows toward the previously solidified metal, thus resulting in increased height in this area [15].
To control this height difference, various techniques were used to attain a uniform height. Parameters were changed individually and in combinations to check the effect on the resulting weld bead, and then they were altered gradually shifting from the arc-striking zone to the steady stage region. The extreme cases with the distorted bead include an increase of current with decreased travel speed resulting in the zigzag formation of the bead while increased travel speed with decreased current produced spatter, as shown in Figure 5a,b
After finding the appropriate combinations of parameters in the weld bead, parameters were changed corresponding to the movement of the arc from the onset point to the steady stage. Changing current means changing the wire feed speed, so there was a clear difference in the volume of wire melted in the arc-striking region and steady stage region with no significant change in the bulging profile. Voltage variation resulted in a minute difference in height, but the bulging of the onset part remained the same. The most effective parameter for achieving uniform height and width was travel speed. The current and voltage were kept constant and the travel speed was reduced gradually to attain the same height in the arc-striking region as in the steady stage region, as shown in Figure 5c. One instance of such a set of parameters is shown in Figure 6. In this way, the heat input is minimized at the starting point, which gradually increases as the steady stage is reached.
For the arc-extinguishing area, the molten pool, which is already in an inclined shape, solidifies quickly owing to the abrupt decrease of the heat input. Heat input could be increased by decreasing the travel speed. However, the decrease in travel speed only resulted in pool flow owing to higher current with lower travel speed. Thus, current and voltage were also gradually decreased to attain a uniform height in the arc-extinguishing region. One of the instances with all three parameters reduced gradually to solve this problem is shown in Figure 7. Although the values of the current and voltage were reduced, the reduction in travel speed increased the heat input.

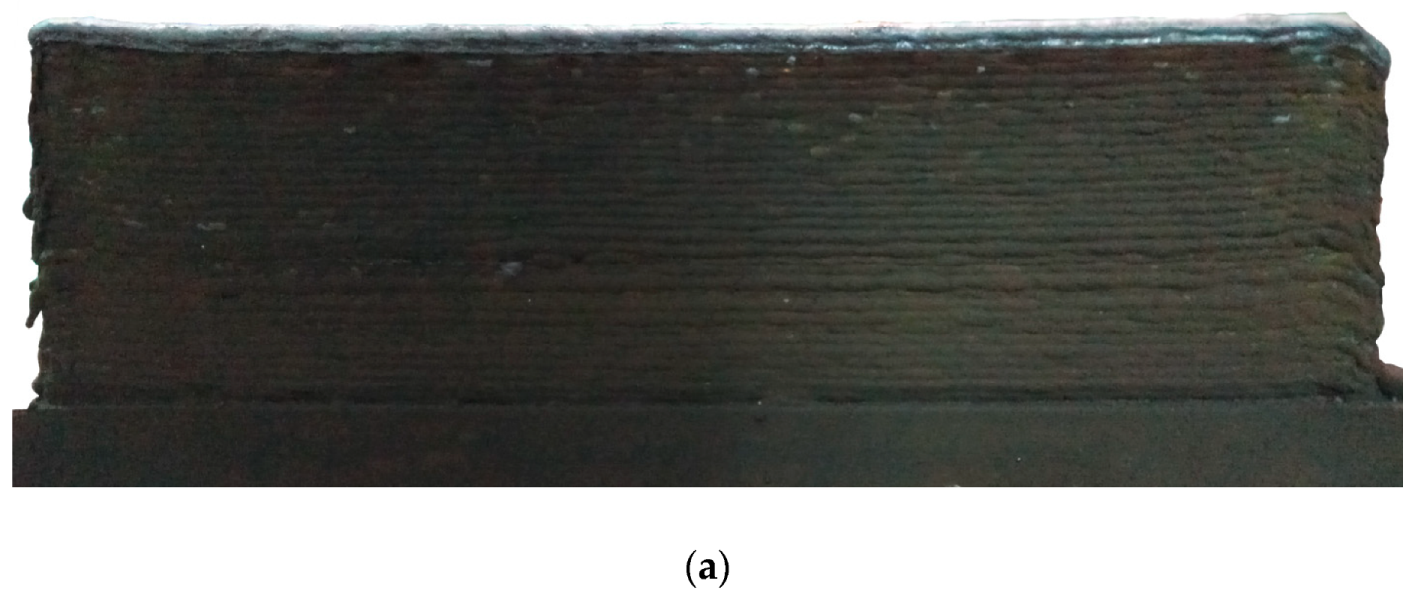
3.2. Multilayer, Single-pass

The next step was the MLSP step, which used the same set of variables in its respective parts, including arc striking, steady stage, and arc extinguishing. However, the MLSP is different and complicated owing to the use of repeated heating for layer deposition. The previous layer preheats the next layer, while each new layer post-heats the previous layer [17]. The subsequent layers were deposited using the same profile of current, voltage, and travel speed, as explained earlier with the arc-striking currents of 190 A and 170 A, but this resulted in pool flow particularly at the arc- extinguishing region, as shown in Figure 8. Thus, the process had to be terminated.
To cater to this problem, the current needed to be reduced in subsequent layers, while the same profile of deposition parameters was maintained in the arc-striking region, steady stage, and arc-extinguishing region. Therefore, welding linear energy (EW) was calculated for each region as:
EW = (I × U)/ST
where I (A) is the welding arc current, U (V) is the voltage, and ST (mm/s) is the travel speed. The values of all three variables were extrapolated on both sides to obtain a set of variables for each layer so that each subsequent layer could be deposited with a lesser current value than the previous one. The current was kept below 200 A to maintain a short-circuit metal transfer. Higher current with globular or spray transfer results in a higher speed and a stronger impact, thus inducing pool instability. As the value of the current is reduced in each layer, an appropriate value of the corresponding voltage should be selected from the range given in the welding machine instruction manual. Thus, the travel speed at each position can be calculated using the welding energy profile given in Figure 9. The reduced travel speed compensates for the reduction of height that might have been caused due to a reduction in current. The different sets used in the first six layers are listed in Table 2 while the deposition for next layers is discussed later.
A stable pool with a consistent increase in height was observed in each layer. The heights attained in the first few layers were different owing to various factors, as explained below. After equilibrium was achieved, the subsequent layers were deposited using the last set of variables, as defined in layer six in Table 2. The first layer had an average height of 3.2 mm because of rapid cooling owing to the cooler base metal and better heat dissipation. The subsequent layers had lower heights because of the preheated first layer, but the current was reduced in each subsequent layer. The change in height per layer attained an equilibrium state after the first few layers.
After the first 14 layers, a CAD file was used to define the path for each layer and a resting position with a two-minute delay before depositing the next layer to prevent the process from collapsing [25], as shown in Figure 10. It is important to notice that if the distance of the nozzle to the top surface of the bead in any region exceeds a certain limit during this movement, the arc cannot be generated, hence resulting in the termination of the process. The results show that throughout the experiment, the distance of the nozzle to the top surface was within the required limits for maintaining the arc.

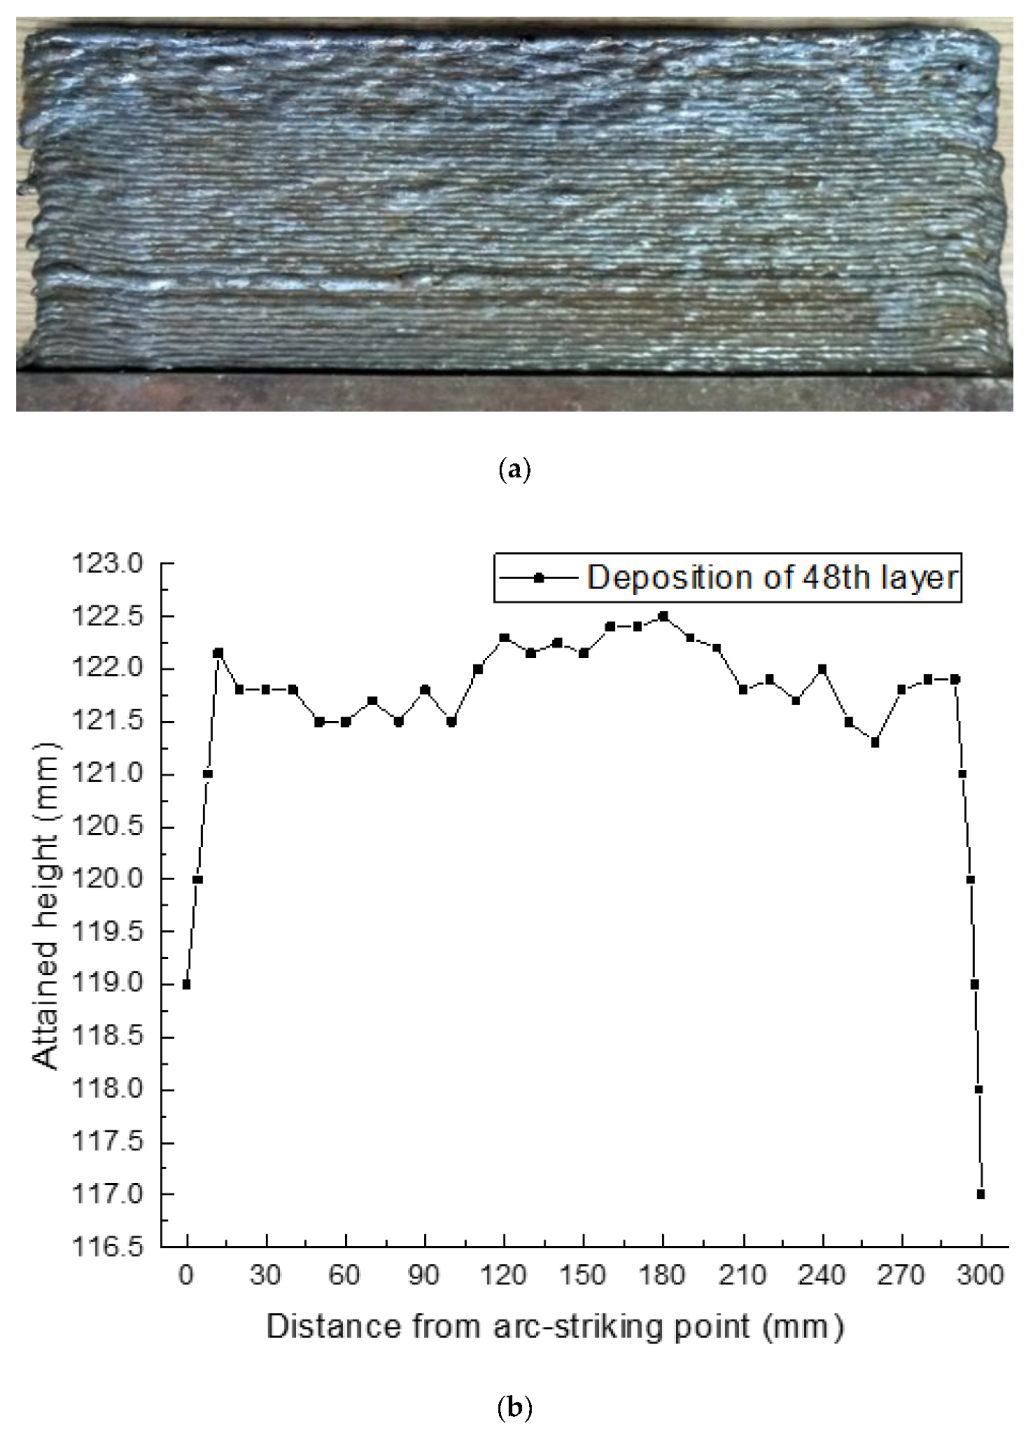
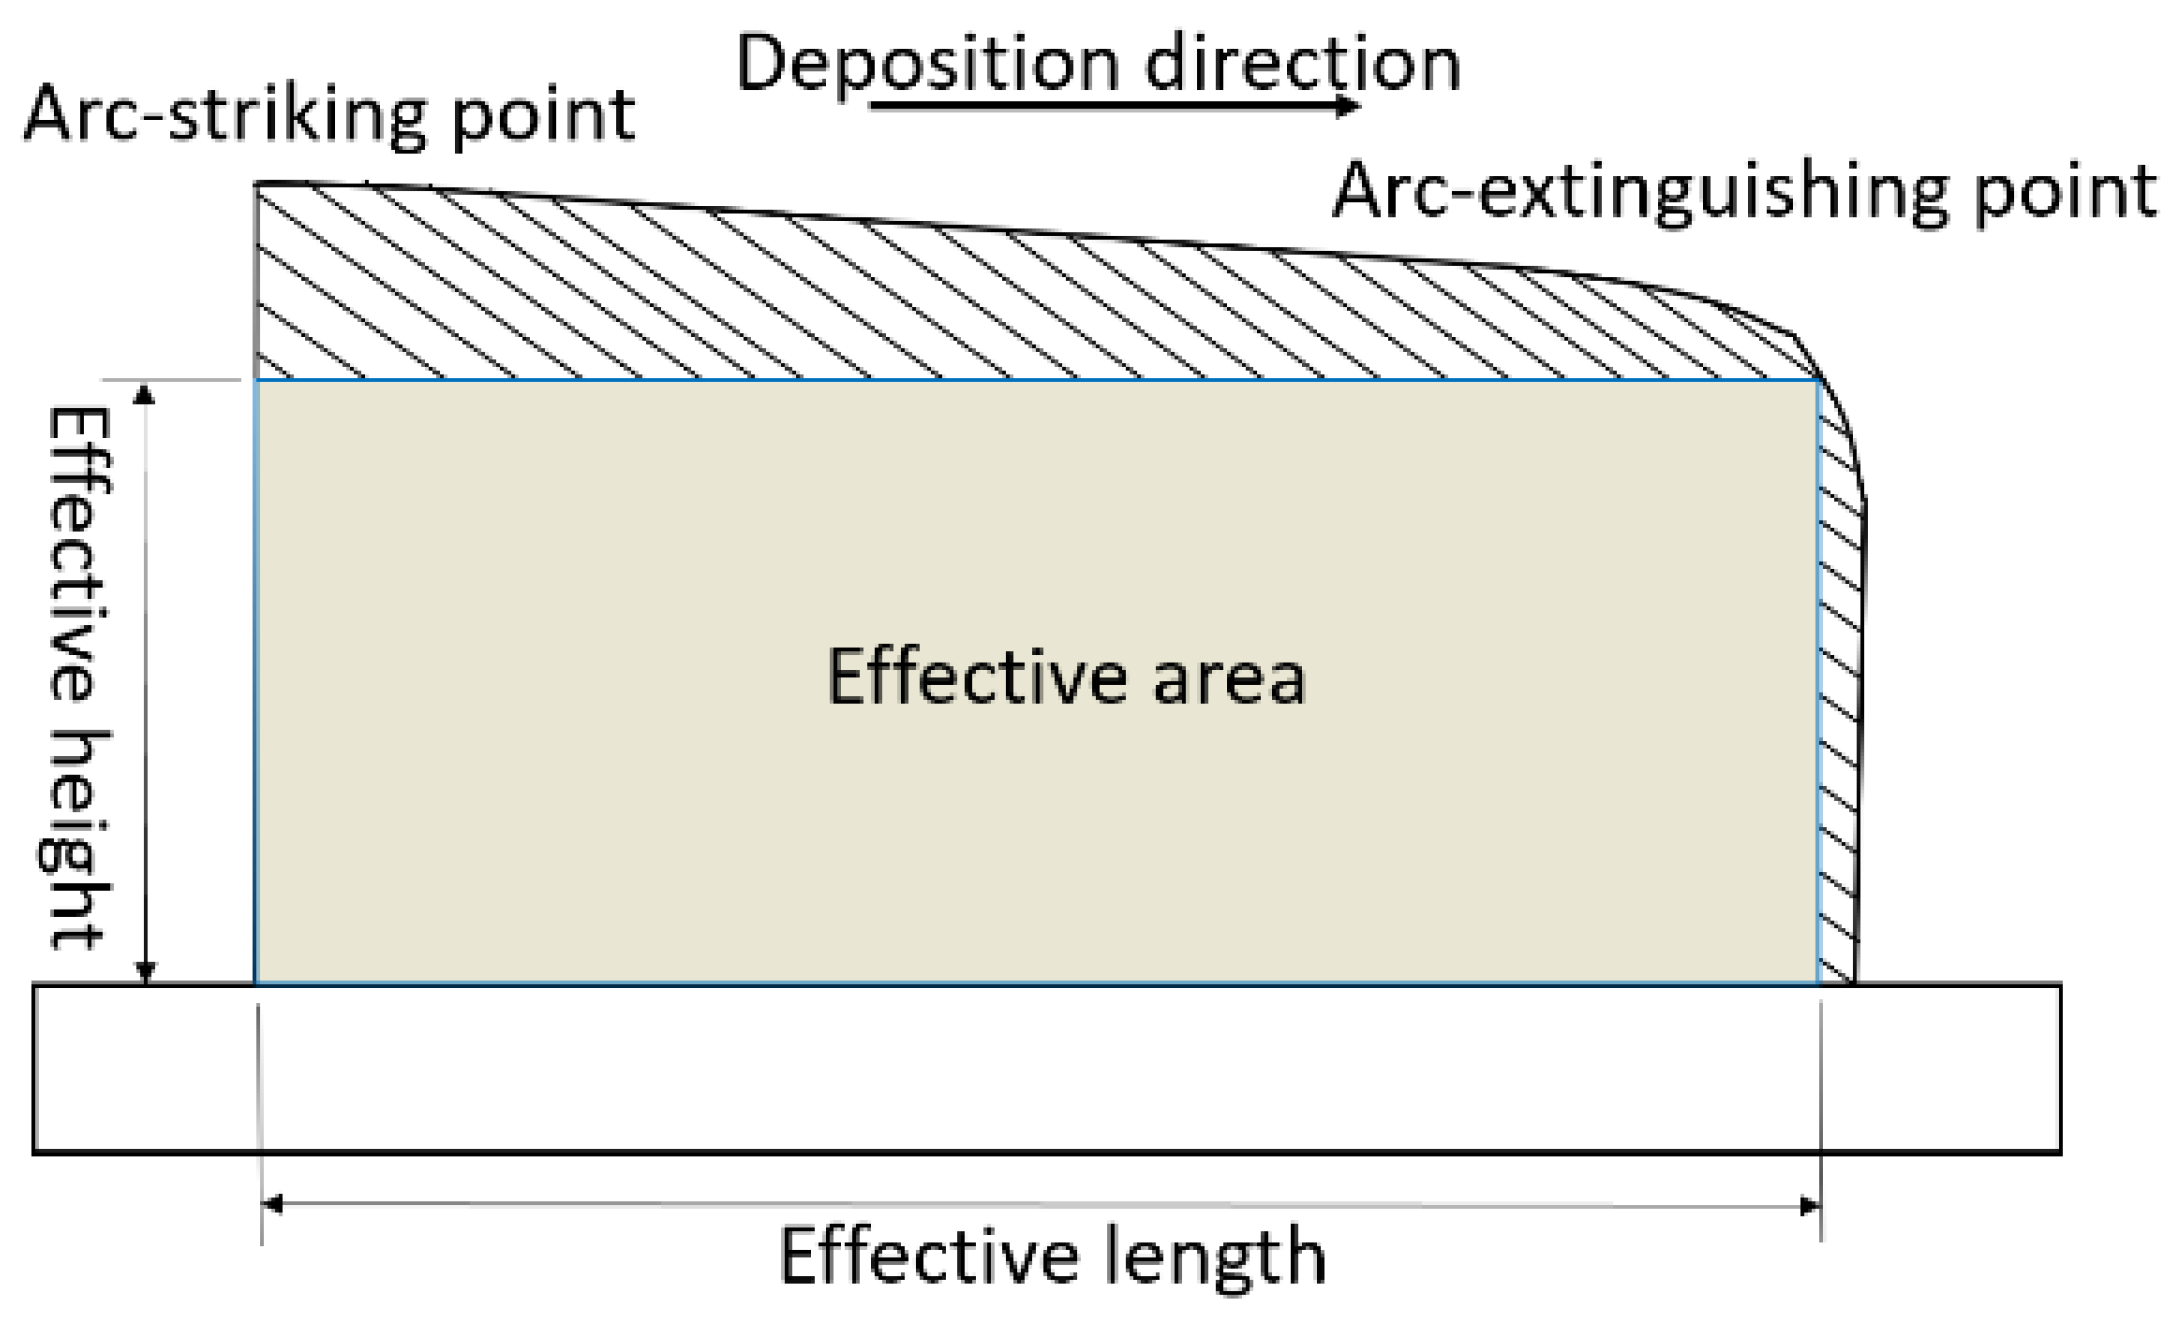
3.3. Forming Appearance and Effective Area

The process is analyzed for its height and surface smoothness at different levels. After eight layers, there was no substantial difference in heights in different regions. The arc-striking area has approximately the same height as the steady stage area with a minimal increase in height as the arc-extinguishing area is reached.
In the arc-extinguishing area, as the speed is reduced in conjunction with a reduction in current and voltage, a slight drop in height is observed, as shown in Figure 11. The variation in height in the steady stage region was approximately 0.5 mm with an average height of 20 mm. The average width was 8.1 mm, ranging from 7.8 to 8.4 mm. The height at the arc-striking region was approximately 2 mm less than the average height of the steady stage in a horizontal span of 7–8 mm from the onset point. The arc-extinguishing region exhibited a reduction of approximately 3 mm in height in the last 9– 10 mm of the horizontal span.
After the first batch of automated welding deposition processes were completed using CAD file generated from the computer-aided manufacturing software, 17 additional layers were deposited amounting to a total of 31 layers. The results at this stage were very encouraging regarding the suitability of the process for additive manufacturing. The stacking of layers was very consistent and smooth with uniform height throughout the bead with a slight decrease at the end of the arc-extinguishing area, as shown in Figure 12. The variation in the height of the steady stage region was approximately 0.3 mm with an average height of 78.5 mm. The average height for each layer was 2.5 mm while the average width was 8.2 mm, ranging from 8.0 to 8.4 mm. The height at the arc-striking region was approximately 2 mm smaller than the average height of the steady stage in a horizontal span of 8–10 mm from the start point. The arc-extinguishing region exhibited a reduction of approximately 5 mm in height in the last 10–12 mm of the horizontal span.
A total of 48 layers were deposited to attain an average height of 122 mm. The average height for each layer was 2.5 mm while the average width was 8.2 mm ranging from 8.0 to 8.4 mm. The variation of the height in the steady stage region was approximately 1 mm. The height at the arc-striking region was approximately 3 mm smaller than the average height of the steady stage within the horizontal span of 8 to 10 mm from the start point. The arc-extinguishing region exhibited a 5 mm reduction in height approximately in the last 9–10 mm of the horizontal span. The reduction in the height at the arc-striking and arc-extinguishing areas shown in Figure 13, resulted in a reduction of the effective area. The effective area is the largest rectangle in the final shape attained, as shown in Figure 14.
The effective area and effective width are used to calculate the effective volume to attain the deposition efficiency, which is the ratio of the effective volume to the total volume [26]. Table 3 gives the calculated values for the final deposited shape with controlled deposition parameters.
The effective area is 96.8% of the total area while the deposition efficiency is 92.1%. These are better results compared to those in the literature [15,26], even without the use of the bypass-current technique. The total volume of the structure was calculated by measuring the area under the curve in Figure 13b and multiplying it with the average width. Effective volume was calculated by the product of effective area and the minimum width. It is noticeable that the value of the minimum width of the structure after reaching equilibrium is more than the minimum width used to calculate the effective volume, which shows higher deposition efficiency once equilibrium is attained.
An empirical model was developed to assess the effect of each variable to attain a particular height. A linear regression approach has been used to obtain the solution [27]. Equation (2) is the multiple linear regression, which is formulated as:
a0 + a1I + a2U + a3ST = H
where the input variables are the current (I), voltage (U), and travel speed (ST), whereas the height (H) is the output variable. MATLAB was used to find the solution based on the use of the values listed in Table 2 for the input variables, while the average value of H was kept constant at 2.5 mm. The solution is expressed as:
−0.03I + 0.12U−2.2ST = H
The solution indicates that both current and travel speed is inversely related to the attained height, but the contribution of the current is too small as compared to the travel speed. Although the voltage is directly related to the height, the effect of the voltage is still smaller compared to that of travel speed. The other variables should be chosen in accordance with the earlier descriptions by maintaining small current values to achieve a short-circuit mode of metal transfer. A better model would have considered width as the output variable too. This model is given just to check the effect of the parameters. To attain a uniform height, different sets of parameters can be calculated by referencing the welding energy profile. The profile was checked to reproduce the results with a variation in parameters resulting in uniform height throughout the weld bead.

3.4. Material and Mechanical Properties

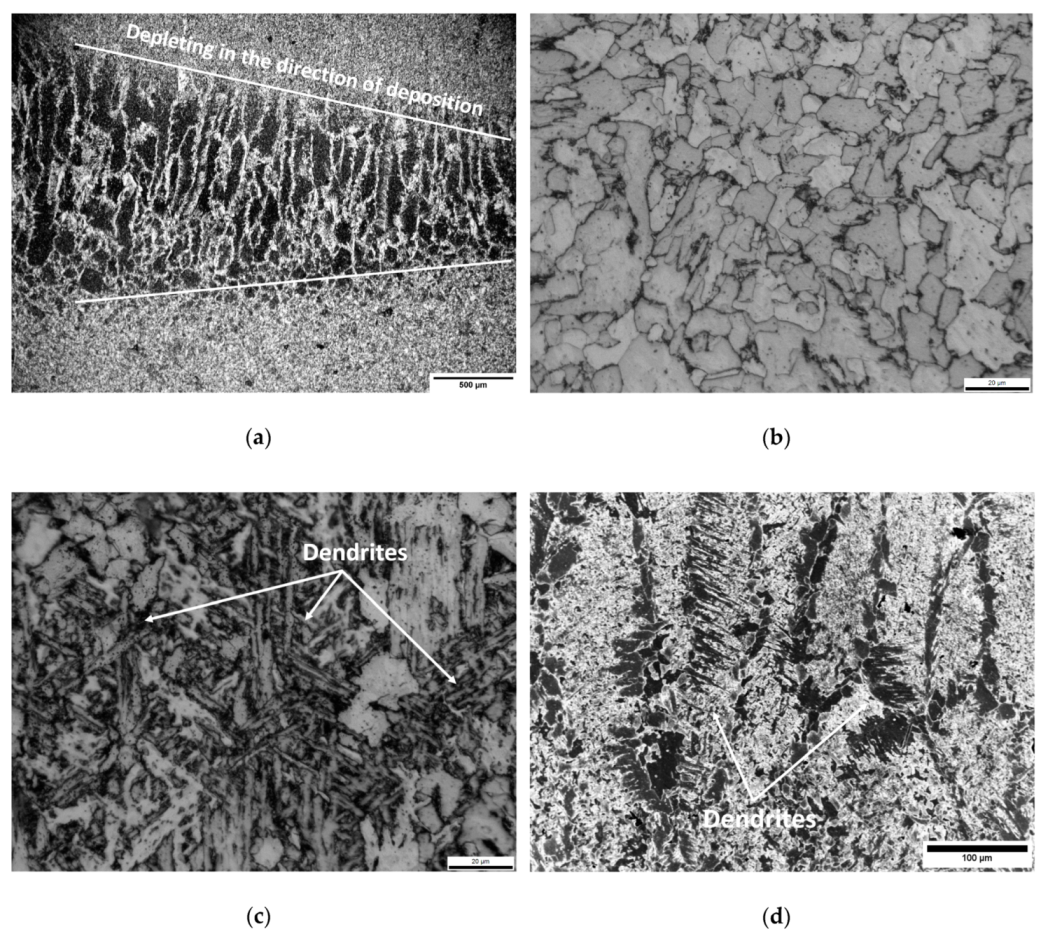
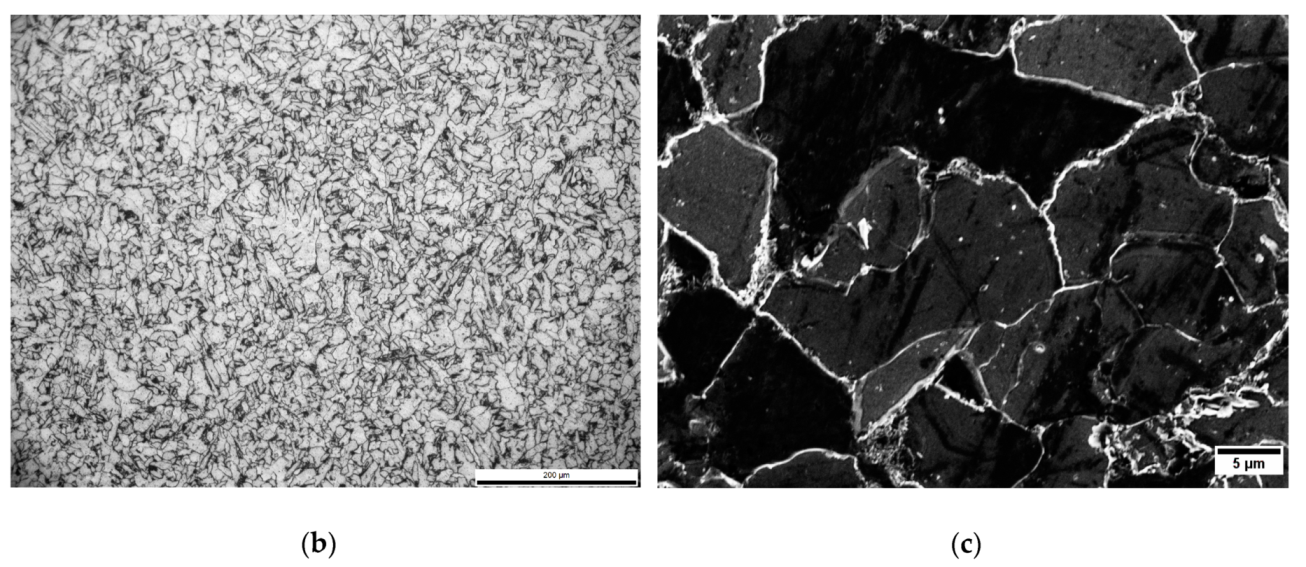
3.4.1. Metallography

Sample no. 1 is taken from the arc-striking region of the first few deposited layers. The travel speed in this part of the bead is fastest to overcome the creation of bulging bead due to faster cooling. Moreover, in the first few beads, the base metal is the main source for heat dissipation until equilibrium is achieved, resulting in quicker cooling of this part of the bead. This results in the dendritic microstructure at the onset of the bead, which depletes gradually as the travel velocity decreases towards the steady stage region, as shown in Figure 15. When the next layer is deposited, it recrystallizes part of the dendritic structure to create equiaxed grains. As the number of layers increases, the width of the dendritic part decreases owing to the heat cycles of the layers deposited above it.
As the number of layers increases, the process reaches an equilibrium with heat dissipating mostly through the thin wall created. For the arc-striking region of these layers, no dendritic structure was found. The grains for samples 2 and 3 were equiaxed with some variation in grain size, as shown in Figure 16a,b. This variation is again due to recrystallization of grains owing to the post-heat effects of subsequent layers. The average grain size number varies from 9.5 to 11, measured according to ASTM E112 [28].
As the welding proceeds towards the steady stage region, the base metal is already preheated due to the heat conduction from the arc-striking region and the process of heat dissipation is not sudden as the welding is not yet terminated. A similar phenomenon happens for the layers as we go up in the direction perpendicular to the deposition direction. However, the heat dissipation is different until equilibrium is achieved. Sample number 4 shows a layer boundary with almost no difference in grain structure or grain size. Welding defects were rarely found in the resulting structure, including a few burn holes, as shown in Figure 17.
In the direction perpendicular to the deposition direction, equilibrium is achieved as we go up above the first few layers. Sample number 5–7 have been taken from the part of thin wall structure with the same welding parameters and uniform heat dissipation conditions. The microstructure is uniform with almost equal grain size throughout the observed area having equiaxed grains, as shown in Figure 18. The average grain size number was around 10 to 10.5.
Sample 8 is taken from the arc-extinguishing area of the first few layers. As the arc approaches the arc-extinguishing point, the welding linear energy is higher because of lower travel velocity. However, as soon as the process is terminated, the metal cools down with a rapid cooling for the first few layers as the heat is dissipated through the base metal. The dendritic structure width increases towards the end of the weld bead while it depletes for next layers in the direction perpendicular to the deposition direction. Some inclusions were precipitated, as shown in the EDS of dendritic microstructure having trace elements which correspond to the composition as mentioned in Table 1. Different regions of the microstructure are given in Figure 19.
As the subsequent layers are deposited, the value of current drops until the equilibrium is achieved. Sample 9 and 10 are taken from the part of the thin wall after equilibrium was achieved. The heat is being dissipated through the thin wall itself. Moreover, preheat and post-heat effects of previous and subsequent layers make the grains equiaxed, as shown in Figure 20, but they were less uniform as compared to the equilibrium area in the mid-section of the thin wall. The reason might be the higher amount of heat input due to slower travel speed and different heat dissipation conditions as it is the end of the bead with no sink or heat source on the right. Precipitation of inclusions was observed, including copper.

3.4.2. Microhardness

Figure 21 shows the microhardness of samples at multiple points, while Table 4 gives the average microhardness for each sample. Sample 1 and 8 have dendritic structure and have higher values of average microhardness owing to the presence of copper in dendrites as reported in the previous section [29]. After equilibrium was attained, the average value of microhardness was approximately 170 HV. This value is higher than the available steel with similar carbon content [30,31]. It has been elucidated in the microstructure section that the heat cycles during the welding result in the grain refinement. Grain refinement has a direct effect on the microhardness of the resulting structure, mainly because of the grain boundaries acting as dislocation barriers [32,33,34]. A few higher values in the sample from arc-extinguishing area also correspond with the observation of inclusion precipitations in the microstructure study.

3.4.3. Tensile Strength

Tensile results from different regions of the thin wall structure are given in Table 5. The average yield strength for all areas except the arc-extinguishing area was approximately 330 MPa. This might be due to the inclusion precipitation observed on the grain boundaries near the end of the weld bead. On the other hand, the same precipitated inclusions could be the reason for strain hardening creating hindrance in the location of dislocation movement, resulting in higher ultimate strength. Samples from the steady stage region after equilibrium have the highest values of yield and ultimate strength except for T8, where a welding defect (blowhole) was found. The values are quite higher than the rolled available for industrial use with similar carbon content [30,31].
In the start of each weld bead, the cooling rate is fast, not only because of the start of the arc but also due to the travel speed being quicker than the other regions. This results in lesser ductility in the arc-striking sample T1 than the arc-extinguishing sample T2, the latter being given more heat input due to very slow travel speed at the end of each weld bead [35]. T3 and T4 are taken from the initial layers where most of the heat dissipation is through the base. As T3 is near the arc-striking region and T4 is near the arc-extinguishing region, same phenomenon can be observed with higher cooling rate for T3 than T4 resulting in higher ductility for T4. The samples T5, T6, and T7 give the best results with higher tensile strength as well as ductility.
Figure 22 shows that type of fracture is shear lip with a fibrous region and an irregular surface. Fractography with higher magnification reveals ductile fracture with the dimpled surface [36]. Despite having a fine microstructure, the structure shows ductile behavior due to thermal cycles [37].

4. Conclusions

The main focus of the research study was the maximization of the effective area of the final form attained by controlling the deposition parameters of GMAW, especially in the arc-striking and arc-extinguishing areas, and then observing the material and mechanical properties of the resulting material. The following conclusions were observed:
  • An optimum profile of welding linear energy was presented to calculate the values of the deposition parameters so that (a) a uniform height could be obtained in the arc-striking and arc-extinguishing areas, and (b) many layers could be stacked as required without termination of the process. This showed that the process was suitable for additive manufacturing.
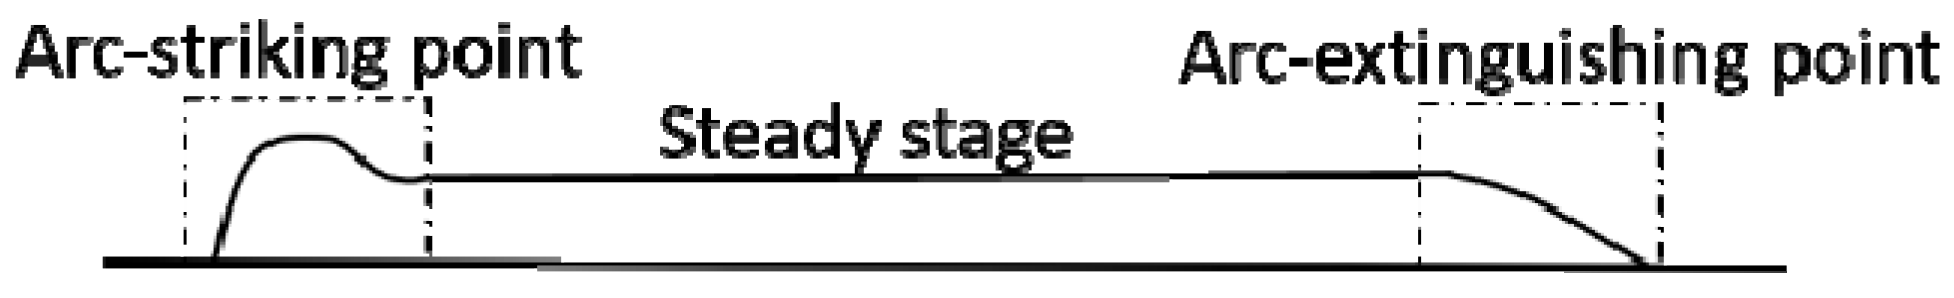
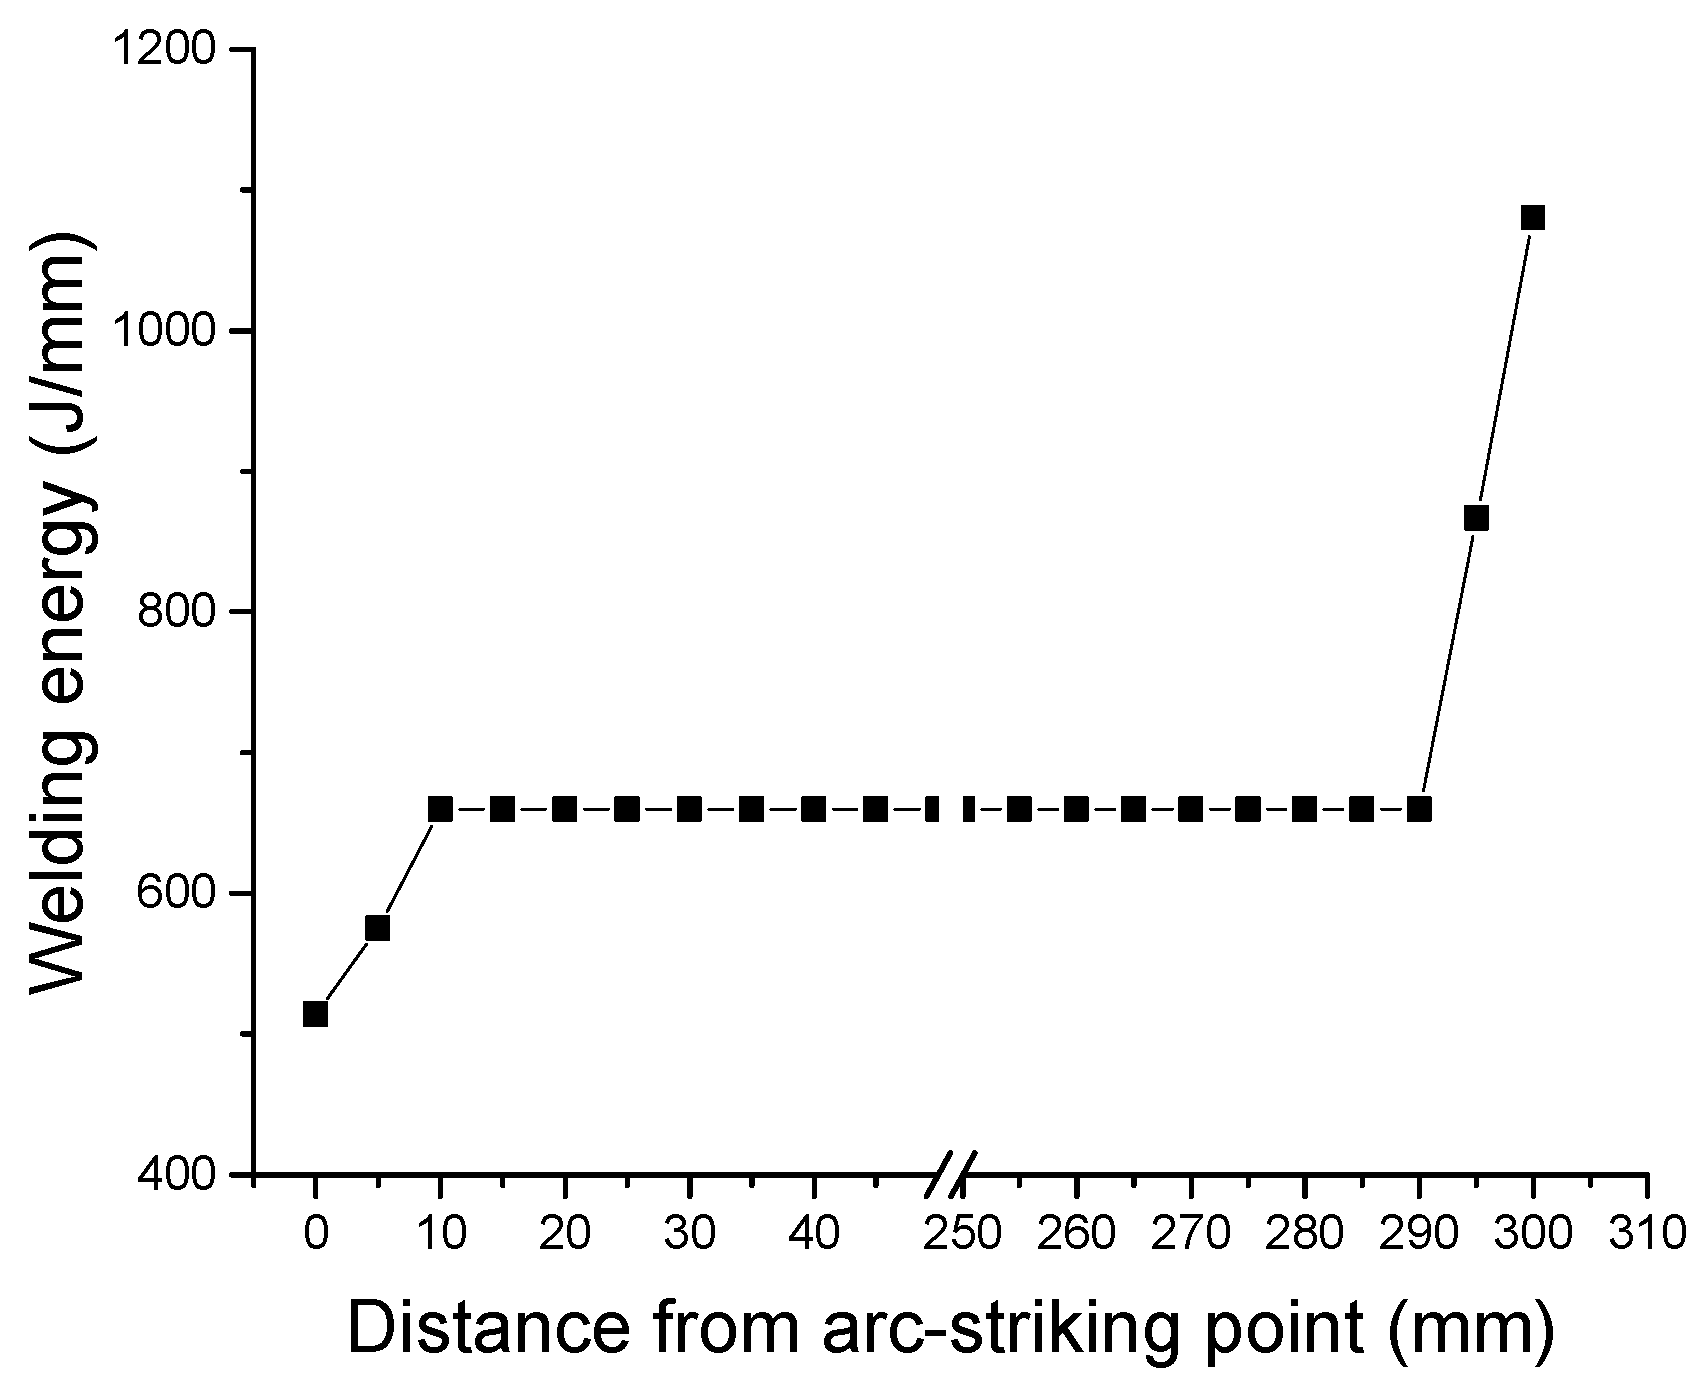
  • A stable pool was attained with current intensities smaller than 170 A with short-circuit modes of molten metal transfer. Different combinations of parameters can be chosen according to the welding linear energy profile. Welding linear energy had a lower value in the arc-striking region than that at the steady stage, while in the arc-extinguishing region its value increased even though the current was reduced.
  • The change in the height per layer was controlled based on the adjustment of the current in the first few layers until equilibrium was attained, leading to the production of a uniform height and a smooth bead. The change in current in subsequent layers was compensated by a change in travel speed.
  • The travel speed was one of the most important and influential factors of the resulting height in extreme positions of the weld bead followed by voltage and current.
  • The dendritic microstructure was observed in the initial layers in arc-striking and arc-extinguishing areas which depletes to be equiaxed in most of the steady stage area. After the equilibrium conditions were achieved, most of the microstructure in all three regions was equiaxed with some inclusion precipitations observed in arc-extinguishing parts.
  • Microhardness and tensile results show better properties than the rolled steel available in industry with similar carbon content. The fracture for tensile specimens was of a ductile fracture type with an obvious dimpled structure.

Author Contributions

Conceptualization: J.X.; data curation: A.W.; formal analysis: A.W.; funding acquisition: X.Q.; investigation: A.W.; methodology: A.W. and J.X.; project administration: C.Z. and H.W.; resources: X.Q. and C.Z.; software: H.W.; supervision: X.Q., J.X., C.Z., and H.W.; writing—original draft: A.W.

Funding

This research was financially supported by the Key Industrial Innovation Chain Project in Industrial Domain, grant number 2016KTZDGY4-03.

Conflicts of Interest

The authors declare no conflict of interest.

References

  1. Baufeld, B.; Van Der Biest, O.; Gault, R. Additive manufacturing of Ti–6Al–4V components by shaped metal deposition: Microstructure and mechanical properties. Mater. Des. 2010, 31, S106–S111. [Google Scholar] [CrossRef]
  2. Hoefer, K.; Haelsig, A.; Mayr, P. Arc-based additive manufacturing of steel components—Comparison of wire-and powder-based variants. Weld. World 2018, 62, 243–247. [Google Scholar] [CrossRef]
  3. Busachi, A.; Erkoyuncu, J.; Colegrove, P.; Martina, F.; Watts, C.; Drake, R. A review of Additive Manufacturing technology and Cost Estimation techniques for the defence sector. CIRP J. Manuf. Sci. Technol. 2017, 19, 117–128. [Google Scholar] [CrossRef] [Green Version]
  4. Yin, Z.Q.; Zhang, G.J.; Zhao, H.H.; Wu, L. Rapid Manufacturing and Remanufacturing System Based on Robotic GMAW. Adv. Mater. Res. 2010, 156, 1626–1629. [Google Scholar] [CrossRef]
  5. Thompson, S.M.; Bian, L.; Shamsaei, N.; Yadollahi, A. An overview of Direct Laser Deposition for additive manufacturing; Part I: Transport phenomena, modeling and diagnostics. Addit. Manuf. 2015, 8, 36–62. [Google Scholar] [CrossRef]
  6. Frazier, W.E. Metal Additive Manufacturing: A Review. J. Mater. Eng. Perform. 2014, 23, 1917–1928. [Google Scholar] [CrossRef]
  7. Ding, J.; Colegrove, P.; Mehnen, J.; Ganguly, S.; Almeida, P.S.; Wang, F.; Williams, S. Thermo-mechanical analysis of Wire and Arc Additive Layer Manufacturing process on large multi-layer parts. Comput. Mater. Sci. 2011, 50, 3315–3322. [Google Scholar] [CrossRef] [Green Version]
  8. Mughal, M.P.; Fawad, H.; Mufti, R.A. Three-Dimensional Finite-Element Modelling of Deformation in Weld-Based Rapid Prototyping. Proc. Inst. Mech. Eng. Part C J. Mech. Eng. Sci. 2006, 220, 875–885. [Google Scholar] [CrossRef]
  9. Dickens, P.M.; Wykes, C.M.; Spencer, J.D. Rapid prototyping of metal parts by three-dimensional welding. Proc. Inst. Mech. Eng. Part B J. Eng. Manuf. 1998, 212, 175–182. [Google Scholar]
  10. Zhang, Y.; Chen, Y.; Li, P.; Male, A.T. Weld deposition-based rapid prototyping: A preliminary study. J. Mater. Process. Technol. 2003, 135, 347–357. [Google Scholar] [CrossRef]
  11. Hu, Z.; Qin, X.; Shao, T.; Liu, H. Understanding and overcoming of abnormity at start and end of the weld bead in additive manufacturing with GMAW. Int. J. Adv. Manuf. Technol. 2017, 95, 2357–2368. [Google Scholar] [CrossRef]
  12. Geng, H.; Li, J.; Xiong, J.; Lin, X.; Zhang, F. Optimization of wire feed for GTAW based additive manufacturing. J. Mater. Process. Technol. 2017, 243, 40–47. [Google Scholar] [CrossRef]
  13. Ríos, S.; Colegrove, P.; Martina, F.; Williams, S. Analytical Process Model for Wire + Arc Additive Manufacture. Addit. Manuf. 2018, 21, 651–657. [Google Scholar] [CrossRef]
  14. Xiong, J.; Zhang, G. Adaptive control of deposited height in GMAW-based layer additive manufacturing. J. Mater. Process. Technol. 2014, 214, 962–968. [Google Scholar] [CrossRef]
  15. Xiong, J.; Yin, Z.; Zhang, W. Forming appearance control of arc striking and extinguishing area in multi-layer single-pass GMAW-based additive manufacturing. Int. J. Adv. Manuf. Technol. 2016, 87, 579–586. [Google Scholar] [CrossRef]
  16. Venturini, G.; Montevecchi, F.; Bandini, F.; Scippa, A.; Campatelli, G. Feature based three axes computer aided manufacturing software for wire arc additive manufacturing dedicated to thin walled components. Addit. Manuf. 2018, 22, 643–657. [Google Scholar] [CrossRef]
  17. Xiong, J.; Zhang, G.; Zhang, W. Forming appearance analysis in multi-layer single-pass GMAW-based additive manufacturing. Int. J. Adv. Manuf. Technol. 2015, 80, 1767–1776. [Google Scholar] [CrossRef]
  18. Zhao, H.; Zhang, G.; Yin, Z.; Wu, L. A 3D dynamic analysis of thermal behavior during single-pass multi-layer weld-based rapid prototyping. J. Mater. Process. Technol. 2011, 211, 488–495. [Google Scholar] [CrossRef]
  19. Fachinotti, V.D.; Cardona, A.; Baufeld, B.; Van Der Biest, O. Finite-element modelling of heat transfer in shaped metal deposition and experimental validation. Acta Mater. 2012, 60, 6621–6630. [Google Scholar] [CrossRef]
  20. Available online: http://www.kobelco.co.jp/english/welding/handbook/index.html (accessed on 30 April 2017).
  21. Zhang, X.; Cen, X.; Ravichandran, R.; Hughes, L.A.; Van Benthem, K. Simultaneous Scanning Electron Microscope Imaging of Topographical and Chemical Contrast Using In-Lens, In-Column, and Everhart–Thornley Detector Systems. Microsc. Microanal. 2016, 22, 565–575. [Google Scholar] [CrossRef]
  22. ASTM, E. 384-08a, Standard Test Method for Microindentation Hardness of Materials; ASTM International: West Conshohocken, PA, USA, 2008. [Google Scholar]
  23. ASTM, E. Standard test methods for tension testing of metallic materials. In Annual Book of ASTM Standards; ASTM: West Conshohocken, PA, USA, 2001. [Google Scholar]
  24. Prado-Cerqueira, J.; Diéguez, J.; Camacho, A. Preliminary development of a Wire and Arc Additive Manufacturing system (WAAM). Procedia Manuf. 2017, 13, 895–902. [Google Scholar] [CrossRef]
  25. Montevecchi, F.; Venturini, G.; Grossi, N.; Scippa, A.; Campatelli, G. Idle time selection for wire-arc additive manufacturing: A finite element-based technique. Addit. Manuf. 2018, 21, 479–486. [Google Scholar] [CrossRef]
  26. Yang, D.; He, C.; Zhang, G. Forming characteristics of thin-wall steel parts by double electrode GMAW based additive manufacturing. J. Mater. Process. Technol. 2016, 227, 153–160. [Google Scholar] [CrossRef]
  27. Thamilarasi, P.; Ragunathan, S.; Mohankumar, E. Development of empirical models for prediction of weld bead geometry in robotic-GMAW. J. Achiev. Mater. Manuf. Eng. 2014, 67, 72–85. [Google Scholar]
  28. ASTM, E. Standard Test Methods for Determining Average Grain Size; ASTM International: West Conshohocken, PA, USA, 2004. [Google Scholar]
  29. Brito, C.; Reinhart, G.; Nguyen-Thi, H.; Mangelinck-Noël, N.; Cheung, N.; Spinelli, J.E.; Garcia, A. High cooling rate cells, dendrites, microstructural spacings and microhardness in a directionally solidified Al–Mg–Si alloy. J. Alloy. Compd. 2015, 636, 145–149. [Google Scholar] [CrossRef]
  30. Committee, A.I.H. ASM Handbook: Materials Selection and Design; CRC Press: Boca Raton, FL, USA, 1997. [Google Scholar]
  31. Bramfitt, B.L. Structure/Property Relationships in Irons and Steels; ASM International: Materials Park, OH, USA, 1998; pp. 153–173. [Google Scholar]
  32. Grosdidier, T.; Zou, J.; Stein, N.; Boulanger, C.; Hao, S.; Dong, C. Texture modification, grain refinement and improved hardness/corrosion balance of a FeAl alloy by pulsed electron beam surface treatment in the “heating mode”. Scr. Mater. 2008, 58, 1058–1061. [Google Scholar] [CrossRef]
  33. Wang, Q.; Liu, Z. Microhardness Prediction Based on a Microstructure-Sensitive Flow Stress Model During High Speed Machining Ti-6Al-4V. J. Manuf. Sci. Eng. 2018, 140, 091003. [Google Scholar] [CrossRef]
  34. Gao, M.; Zeng, X.; Yan, J.; Hu, Q. Microstructure characteristics of laser–MIG hybrid welded mild steel. Appl. Surf. Sci. 2008, 254, 5715–5721. [Google Scholar] [CrossRef]
  35. Abushosha, R.; Ayyad, S.; Mintz, B. Influence of cooling rate on hot ductility of C-Mn-AI and C-Mn-Nb-AL steels. Mater. Sci. Technol. 1998, 14, 346–351. [Google Scholar] [CrossRef]
  36. Chen, X.; Li, J.; Cheng, X.; He, B.; Wang, H.; Huang, Z. Microstructure and mechanical properties of the austenitic stainless steel 316L fabricated by gas metal arc additive manufacturing. Mater. Sci. Eng. A 2017, 703, 567–577. [Google Scholar] [CrossRef]
  37. Mazilkin, A.A.; Straumal, B.B.; Protasova, S.G.; Dobatkin, S.V.; Baretzky, B. Structure, phase composition, and microhardness of carbon steels after high-pressure torsion. J. Mater. Sci. 2008, 43, 3800–3805. [Google Scholar] [CrossRef] [Green Version]
Figure 1. (a) Experimental setup (b) Schematic of GMAW, whereby the position of the torch, arc-striking, and arc-extinguishing areas are represented.
Metals 09 00775 g001
Figure 2. (a) Various locations for samples extracted from thin wall structure. (b) Dimensions of the sub-size sample for tensile testing.
Metals 09 00775 g002
Figure 3. Arc-striking, steady stage, and arc-extinguishing regions.
Metals 09 00775 g003
Figure 4. Relationship between the current and wire feed speed (WFS) maintained by the welding machine.
Metals 09 00775 g004
Figure 5. (a) Spatter and (b) zigzag formation of the bead. (c) Arc-striking region controlled by adjusting travel speed (deposition direction from right to left).
Metals 09 00775 g005aMetals 09 00775 g005b
Figure 6. Deposition parameters in the arc-striking region and the onset of the steady stage.
Metals 09 00775 g006
Figure 7. Deposition parameters at the end of steady stage and arc-extinguishing region.
Metals 09 00775 g007
Figure 8. Pool flows with the same profile of deposition parameters in each layer with arc-striking currents of (a) 190 A and (b) 170 A.
Metals 09 00775 g008
Figure 9. Welding energy profile.
Metals 09 00775 g009
Figure 10. Movement of the robot during welding.
Metals 09 00775 g010
Figure 11. (a) Forming appearance of the thin wall with controlled parameter deposition at the 8th layer. (b) Variation of attained height as a function of distance from the arc-striking point.
Metals 09 00775 g011aMetals 09 00775 g011b
Figure 12. (a) Forming appearance of the thin wall with controlled parameter deposition at the 31st layer. (b) Variation of attained height as a function of distance from the arc-striking point.
Metals 09 00775 g012aMetals 09 00775 g012b
Figure 13. (a) Forming appearance of the thin wall with controlled parameter deposition. (b) Final attained height with variation in arc-striking and arc-extinguishing regions.
Metals 09 00775 g013
Figure 14. Effective area schematic.
Metals 09 00775 g014
Figure 15. The microstructure of Sample number 1. (a) Depleting dendritic structure in the direction of deposition (b) enlarged view of equiaxed grains; (c) enlarged view of dendritic structure; and (d) a SEM image of dendritic structure.
Metals 09 00775 g015
Figure 16. The microstructure of Sample number 2 and 3. (a) Uniform microstructure with equiaxed grains for sample number 2; and (b) the variation in grain size for sample number 3 due to recrystallization.
Metals 09 00775 g016
Figure 17. Microstructure of Sample number 4. (a) A layer boundary is observed with a burn hole nearby; (b) enlarged view of equiaxed grains; and (c) a SEM image of equiaxed grains.
Metals 09 00775 g017aMetals 09 00775 g017b
Figure 18. Microstructure of Samples in equilibrium region. (a) Uniform inter-layer microstructure for sample number 5; (b) enlarged view of equiaxed grains for sample number 6; and (c) a SEM image of equiaxed grains for sample number 7.
Metals 09 00775 g018aMetals 09 00775 g018b
Figure 19. The microstructure of Sample number 8. (a) Dendritic structure increasing towards the termination of weld bead; (b) enlarged view of equiaxed grains; (c) enlarged view of dendritic structure; (d) SEM image of dendritic structure; and (e) the EDS spectrum from the dendritic structure.
Metals 09 00775 g019aMetals 09 00775 g019b
Figure 20. The microstructure of Samples 9 and 10. (a) Microstructure for sample 9 showing some inclusion precipitation on grain boundaries; (b) SEM image for sample number 10 microstructure; (c) SEM image of equiaxed grains for sample number 9; and (d) the EDS spectrum from the image in (c).
Metals 09 00775 g020
Figure 21. Microhardness for sample 1 to 10.
Metals 09 00775 g021
Figure 22. Fractography by SEM for tensile specimen. (a) Shear lip fraction and fibrous region of sample T6; (b) shear lip fraction and fibrous region of sample T2; (c) dimples showing ductile fracture for sample T2; and (d) Dimples showing ductile fracture for sample T7.
Metals 09 00775 g022aMetals 09 00775 g022b
Table 1. Chemical composition for electrode wire ER70S–6 (weight percentage) [20].
ElementsCMnSiSPNiCrMoVCuFe
Standard0.06 to 0.151.4 to 1.850.8 to 1.150.035 (max)0.025 (max)0.15 (max)0.15 (max)0.15 (max)0.03 (max)0.5 (max)Bal.
Typical0.11.560.880.0120.0110.010.02<0.01<0.010.24Bal.
Table 2. Deposition parameters in first six layers.
ParametersCurrent (I)Voltage (U)Welding Energy (EW)Travel Speed (ST)
Units(A)(V)(J/mm)(mm/s)
Layer 1
Arc-striking 170245158.0
170245757.1
Steady stage170246606.2
Arc-extinguishing150228653.8
1302010802.4
Layer 2
Arc-striking 160235157.2
160235756.5
Steady stage160236605.6
Arc-extinguishing140218653.4
1201910802.1
Layer 3
Arc-striking 150225156.5
150225755.8
Steady stage150226605.0
Arc-extinguishing130208653.0
1001810801.7
Layer 4
Arc-striking 140215155.8
140215755.2
Steady stage140216604.5
Arc-extinguishing120198652.6
901710801.4
Layer 5
Arc-striking 130205155.1
130205754.5
Steady stage130206603.9
Arc-extinguishing110188652.3
801610801.2
Layer 6
Arc-striking 120195154.5
120195754.0
Steady stage120196603.5
Arc-extinguishing100178652.0
701510801.0
Table 3. Deposition efficiency with effective area and effective volume.
Total area (mm2)36,558.2
Effective area (mm2)35,402.5
Total volume (mm3)299,777.2
Effective volume (mm3)276,139.5
Deposition efficiency (%)92.1
Table 4. The average microhardness of samples given in HV.
Sample number12345678910
Microhardness (HV)222162164180170168169238189177
Table 5. Tensile properties.
Sample NumberYield Strength (MPa)Ultimate Strength (MPa)Percentage Area Reduction (%)Percentage Elongation (%)
T13164324014
T21695496330
T33244424416
T43765775928
T53415796229
T63285837334
T73215237433
T83294844316

