Analysis of Sheet Metal Forming (Stamping Process): A Study of the Variable Friction Coefficient on 5052 Aluminum Alloy

1
College of Mechanical and Electrical Engineering, Nanjing University of Aeronautics and Astronautics, Nanjing 210016, China
2
School of Mechanical Engineering, Yancheng Institute of Technology, Yancheng 224051, China
*
Author to whom correspondence should be addressed.
Metals 2019, 9(8), 853; https://doi.org/10.3390/met9080853
Submission received: 2 July 2019
/
Revised: 31 July 2019
/
Accepted: 1 August 2019
/
Published: 3 August 2019
(This article belongs to the Special Issue Computational Methods in Manufacturing Processes)
Abstract
:Under a boundary lubrication regime, the effect of sliding velocity and normal loads on the friction coefficient in the sheet metal stamping process was investigated using a pin-on-disk sliding wear test. Software was used to analyze both the data generated and the friction coefficient; in addition, a variable friction model based on different velocities and normal loads was also initiated. Under different experimental conditions and numerous influences, both the analysis and microtopography examination of sheet metal helped to obtain the mechanism influence on the friction coefficient. Through further analysis of the microtopography of sheet metal, the law of the surface roughness of sheet metal after grinding with stamping die was established. The model was established to simulate the thickness distribution and spring-back of U-bend parts using ABAQUS software. The results show that the friction coefficient values between the sheet metal and the stamping die generally decrease with increasing sliding velocity and normal loads, and the decreasing tendency slows down under a higher sliding velocity and normal load. Furrow wear and abrasive wear are the main wear mechanisms, with slight sticking wear under the boundary lubrication; the surface roughness after grinding with stamping die generally increases with increasing normal loads and decreasing sliding velocity. The predicted results of thickness distribution with a constant friction coefficient of 0.1 and with the variable friction coefficient model are more consistent with the actual measured values, but the predicted accuracy of spring-back in the variable friction coefficient model is higher than that of the constant friction coefficient model.
1. Introduction
Sheet metals are widely applied in the automotive, ship-building and aerospace industries, and have high potential for energy conservation, emission reduction, and safety improvement, but also comes with many new problems. In many cases, due to their poor plasticity at room temperature, defects are easily created in the forming process, such as wrinkling, cracking, poor forming accuracy, and spring-back [1]. At present, regarding the optimal way of forming steel plates to solve these problems, the optimization method for the forming process cannot be effective because of the different properties of the sheet metal, which lead to a longer life cycle and a higher product cost. Studies have shown that material properties, processing techniques, and friction are the main factors which affect the formability and the quality of the parts. The effect of the processing techniques on the formability of the sheet is achieved mainly through changing the friction between the sheet metal and the stamping die. Friction mainly affects the formability of the sheet by changing the stress distribution in the forming process [2]. There is the possibility of improving the formability by optimizing the processing techniques in the forming process.
In addition, due to the outstanding performance of numerical simulation technology in shortening the product design cycle and saving production costs, it has been widely used in the optimization design of sheet metal forming [3]. The accuracy of the simulation results depends on the correct contact model, where the friction model occupies a decisive role. In the numerical simulation of sheet metal forming, classical Coulomb’s law is commonly used to describe the friction characteristics [4]. Coulomb’s law assumes that the friction coefficient is a constant value and that the friction force is proportional to the positive pressure [5]. Theoretically, Coulomb’s friction model is effective when the normal load is less than the yield limit of the material and the sheet metal is elastically deformed. The actual sheet metal forming process is usually accompanied by plastic deformation. Therefore, based on Coulomb’s friction model, the friction characteristics of the sheet metal forming process are inconsistent with the actual working conditions. Therefore, the accuracy of numerical simulation needs to be improved.
In recent years, domestic and overseas scholars have carried out a lot of research work on the friction characteristics of the sheet metal forming process. Ramezani et al. [6] conducted an in-depth analysis of the mechanism of friction in the sheet forming process and proposed that the forming speed and normal load are the main factors affecting the friction coefficient. Figueiredo et al. [7] studied the effects of die roughness, normal load, sliding velocity, and lubrication condition on the friction coefficient between DP600 high-strength steel and 1100 aluminum alloy, and found that sliding velocity and normal load are the key factors affecting the friction coefficient. Ramezani et al. [8] studied the friction characteristics of AZ80 and ZE10 magnesium alloys under lubrication conditions using a method combining experiment and theory, and pointed out that the normal load and sliding velocity have a significant influence on the friction coefficient, and the constant friction coefficient model is not suitable for numerical simulation of sheet metal forming. Tamai et al. [9] studied the effect of normal loads, sliding velocity and punch stroke on the friction coefficient using a plate sliding friction experiment. It was found that the friction coefficient decreases with increasing normal loads and sliding velocity, and slightly increases with the increasing of the stroke. Wang et al. [10] studied the friction characteristics of an alloyed hot-dip galvanized steel plate by a plate sliding friction experiment and found that the friction coefficient decreases with increasing normal loads and sliding velocity. Wang et al. [11] studied the friction law between DP780 high-strength steel and DC53 die steel by using a pin-disc friction experiment and established a variable friction coefficient model based on different normal loads. The variable friction coefficient model and Coulomb’s friction model, which were then used to simulate the spring-back of U-shape bending, showed that the precision of the spring-back prediction using the variable friction model was greatly improved [12].
At present, sheet metals include aluminum alloys, titanium alloys, and magnesium alloys. Among them, aluminum alloys are the most widely used in the automotive, ship-building, aerospace and other mechanical industries due to their low cost and good formability [13]. However, research on the friction characteristics of the plastic forming process mainly focuses on materials such as high-strength steel and galvanized sheets. Few studies have been conducted on the friction characteristics of the aluminum alloy sheet forming process. The influence of the forming speed, normal load, and lubrication condition on the friction coefficient of the aluminum alloy sheet metal forming process is still unclear, and a friction model that can accurately describe the friction characteristics of the aluminum alloy sheet metal forming process has not yet been established [14]. Due to the slightly poor formability of aluminum alloys compared with steel plates at room temperature, research on the friction properties of aluminum alloys is mainly focused on warm forming and hot forming [15]. Studies have shown that the annealed state of 5-series aluminum alloys has good forming properties at room temperature. Therefore, it is of great significance to deeply and systematically study the influence of various process parameters on the friction coefficient and mechanism of 5-series aluminum alloys in the cold forming process.
In this paper, the effect of sliding velocity and normal loads on the friction coefficient between 5052 aluminum alloy and SKD11 steel under boundary lubrication was studied by using an MPX-2000 disc-pin friction tester. Microtopography observations and analysis on the 5052 aluminum alloy specimens under different experimental conditions were performed to obtain the mechanism of the influence of various factors on the friction coefficient. Using MATLAB software to analyze the experimental data and obtain the law of the friction coefficient, a variable friction model based on different sliding velocities and normal loads was established. The model was then used to simulate the thickness distribution and spring-back of typical parts. At the same time, the actual thickness distribution and spring-back of the typical parts were measured. The predicted results obtained by (i) a variable friction model based on different sliding velocities and normal loads, and (ii) a constant friction model, were compared with the result of the actual measurement, which indicated the validity of the variable friction coefficient model based on experimental data.
2. Materials and Methods
A 5052 aluminum alloy rod with a diameter of 5 mm was used as a friction specimen. The yield strength was 70 MPa, the tensile strength was 220 MPa, and the elongation was 20%. SKD11 die steel was used as a friction pair. The chemical composition is shown in Table 1.
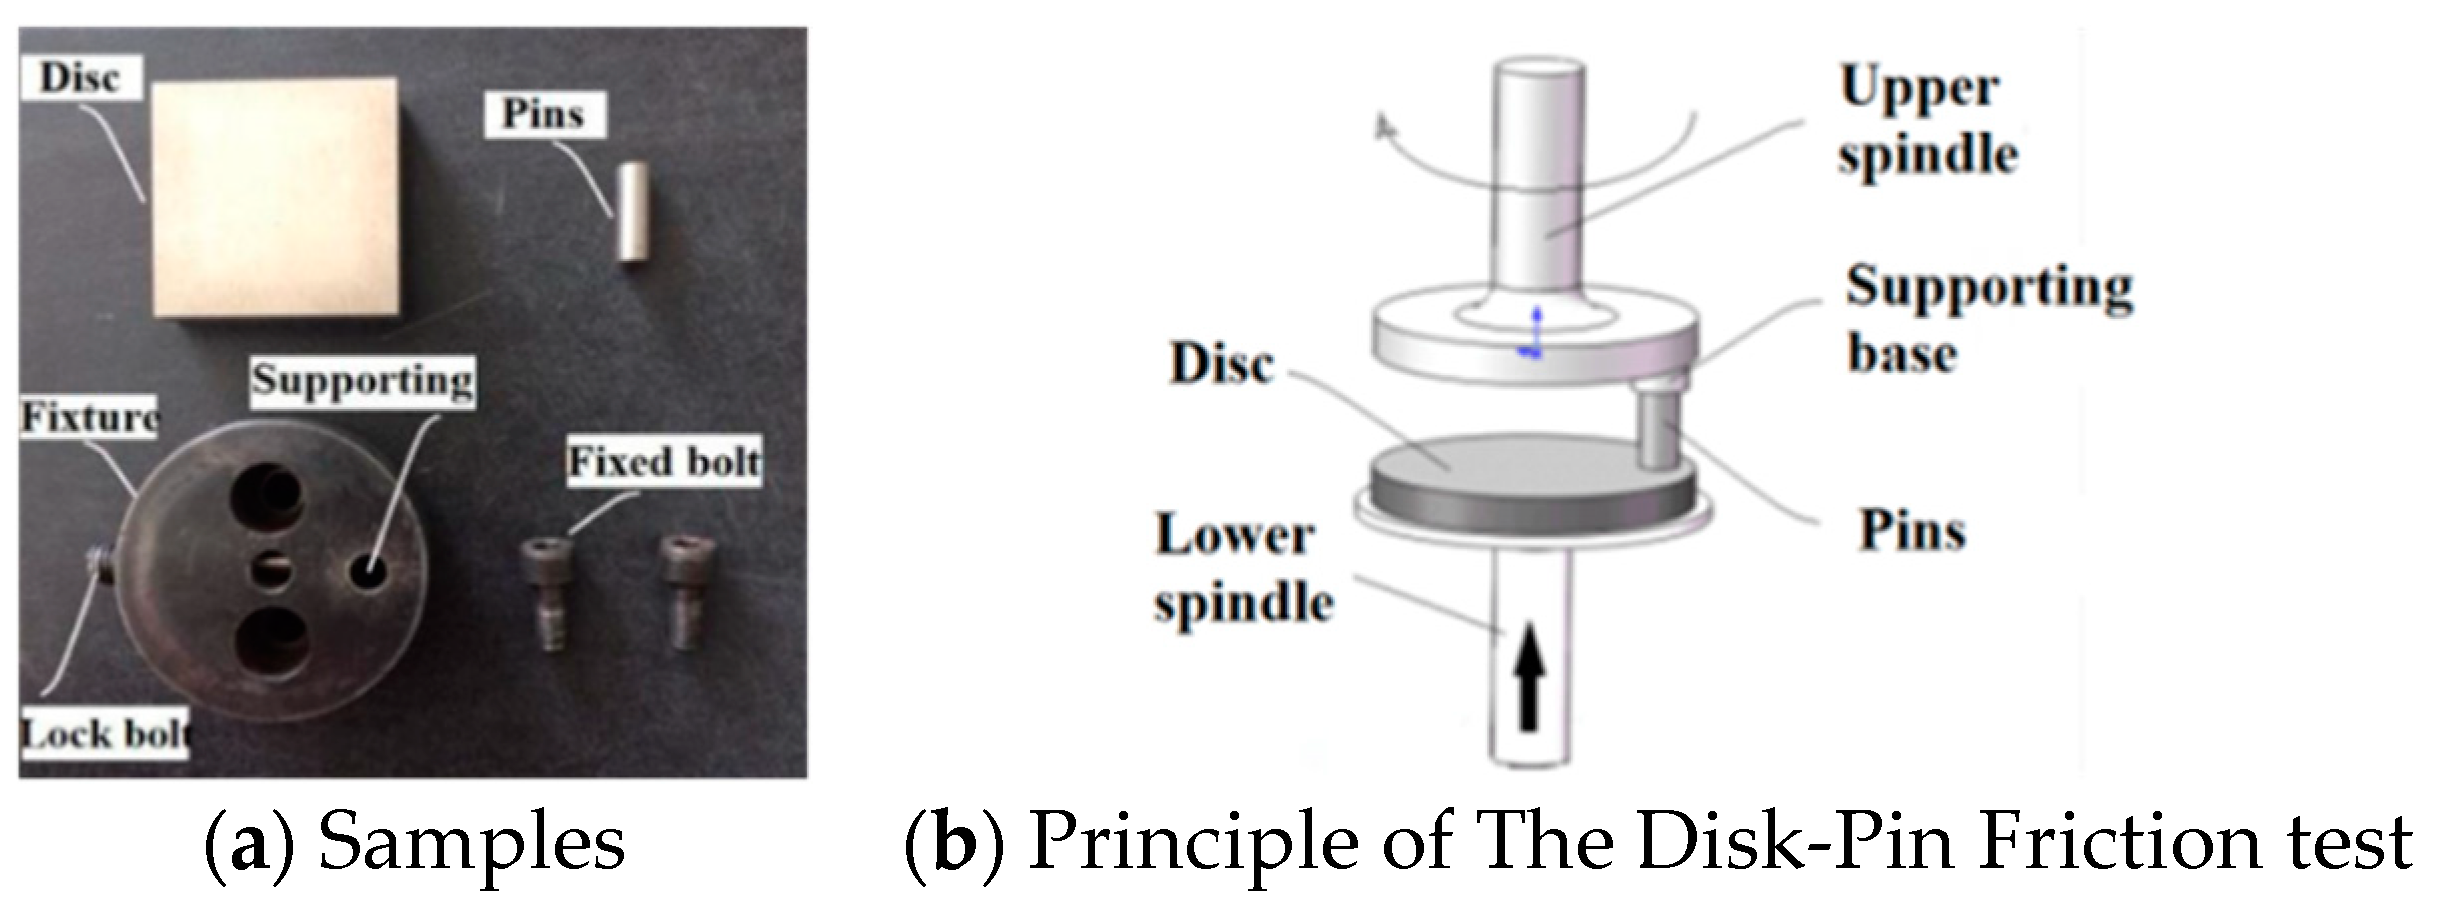
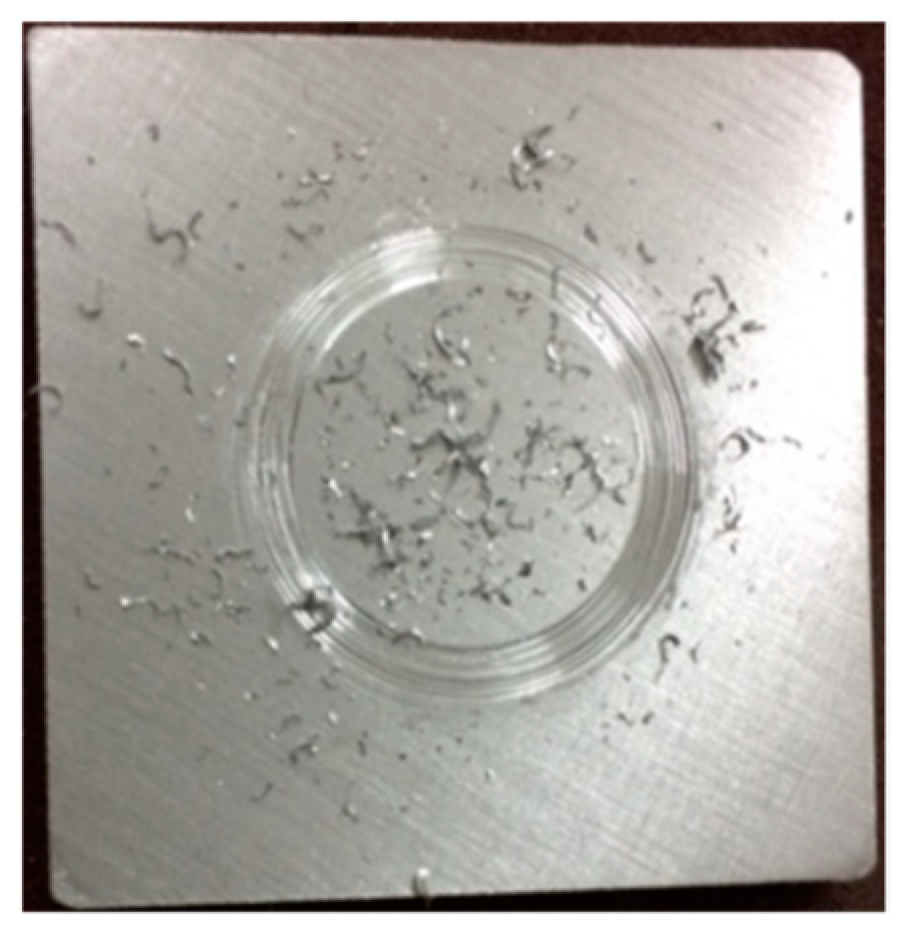
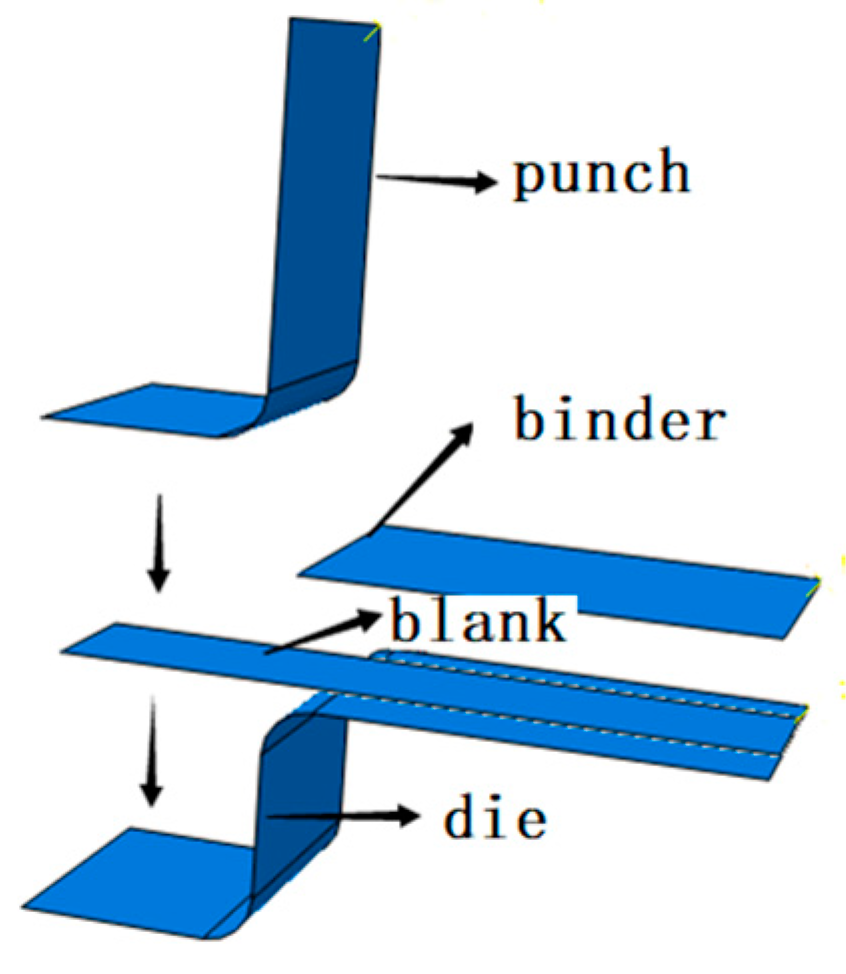
The pin specimen and pin specimen fixture are shown in Figure 1a. The principle of the disk-pin friction test is shown in Figure 1b. Because the hardness of 5052 aluminum alloy is lower than that of SKD11 die steel, in order to avoid the ploughing failure of the plate specimen shown in Figure 2 and the distortion of the measurement data, the pin sample was prepared with a 5052 aluminum alloy rod with low hardness. The sample was made of SKD11 die steel with higher hardness through wire cutting. The hardness of the disk specimen after heat treatment was 62 HRC. The disk and pin face was processed to accurately simulate the interface state of the actual stamping process. The integrated surface roughness values (Ra) of the disc and pin samples measured by a light microscope were 0.2–0.5 and 0.8–1.2, respectively.
The spindle speed of the improved MPX-2000 disk-pin friction tester (Xuanhua Kehua Test Machine Manufacturing Co., Ltd, Zhangjiakou, China) was reduced to 1/8 of the original rotational speed. According to reference [12], sliding speeds of 30.62 mm/s, 40.82 mm/s, 51.03 mm/s, 61.23 mm/s, and 71.42 mm/s, and positive pressures of 10 N, 20 N, 30 N, 40 N, and 50 N, corresponding to an interface load of 0.51 MPa–2.55 MPa at the contact interface, were individually chosen to apply on the MPX-2000 disk-pin friction tester. The disk-pin frictional diameter was 26 mm, and the experimental termination condition was set to three turns. After each experiment, the pin sample was changed. The lubricant used was oil-based stamping oil. The sample was cleaned with acetone and dried before the experiment. The lubricant was sprayed on the steel plate of the SKD11 die, according to the standard of 80–90 g/m2, by a robot nozzle.
There were five groups of loads (0.510 MPa, 1.019 MPa, 1.530 MPa, 2.038 MPa and 2.550 MPa) and five groups of speeds (30.62 mm/s, 40.82 mm/s, 51.03 mm/s, 61.23 mm/s and 71.42 mm/s) tested on the MPX-2000 disk-pin friction tester. The experiment for each group was repeated three times, and the pin was replaced after each experiment.
3. Results
3.1. Friction Coefficient Measurement
Taking the average value of friction test results as the effective friction coefficient, the effective friction coefficients under different loads and speeds are shown in Table 2.
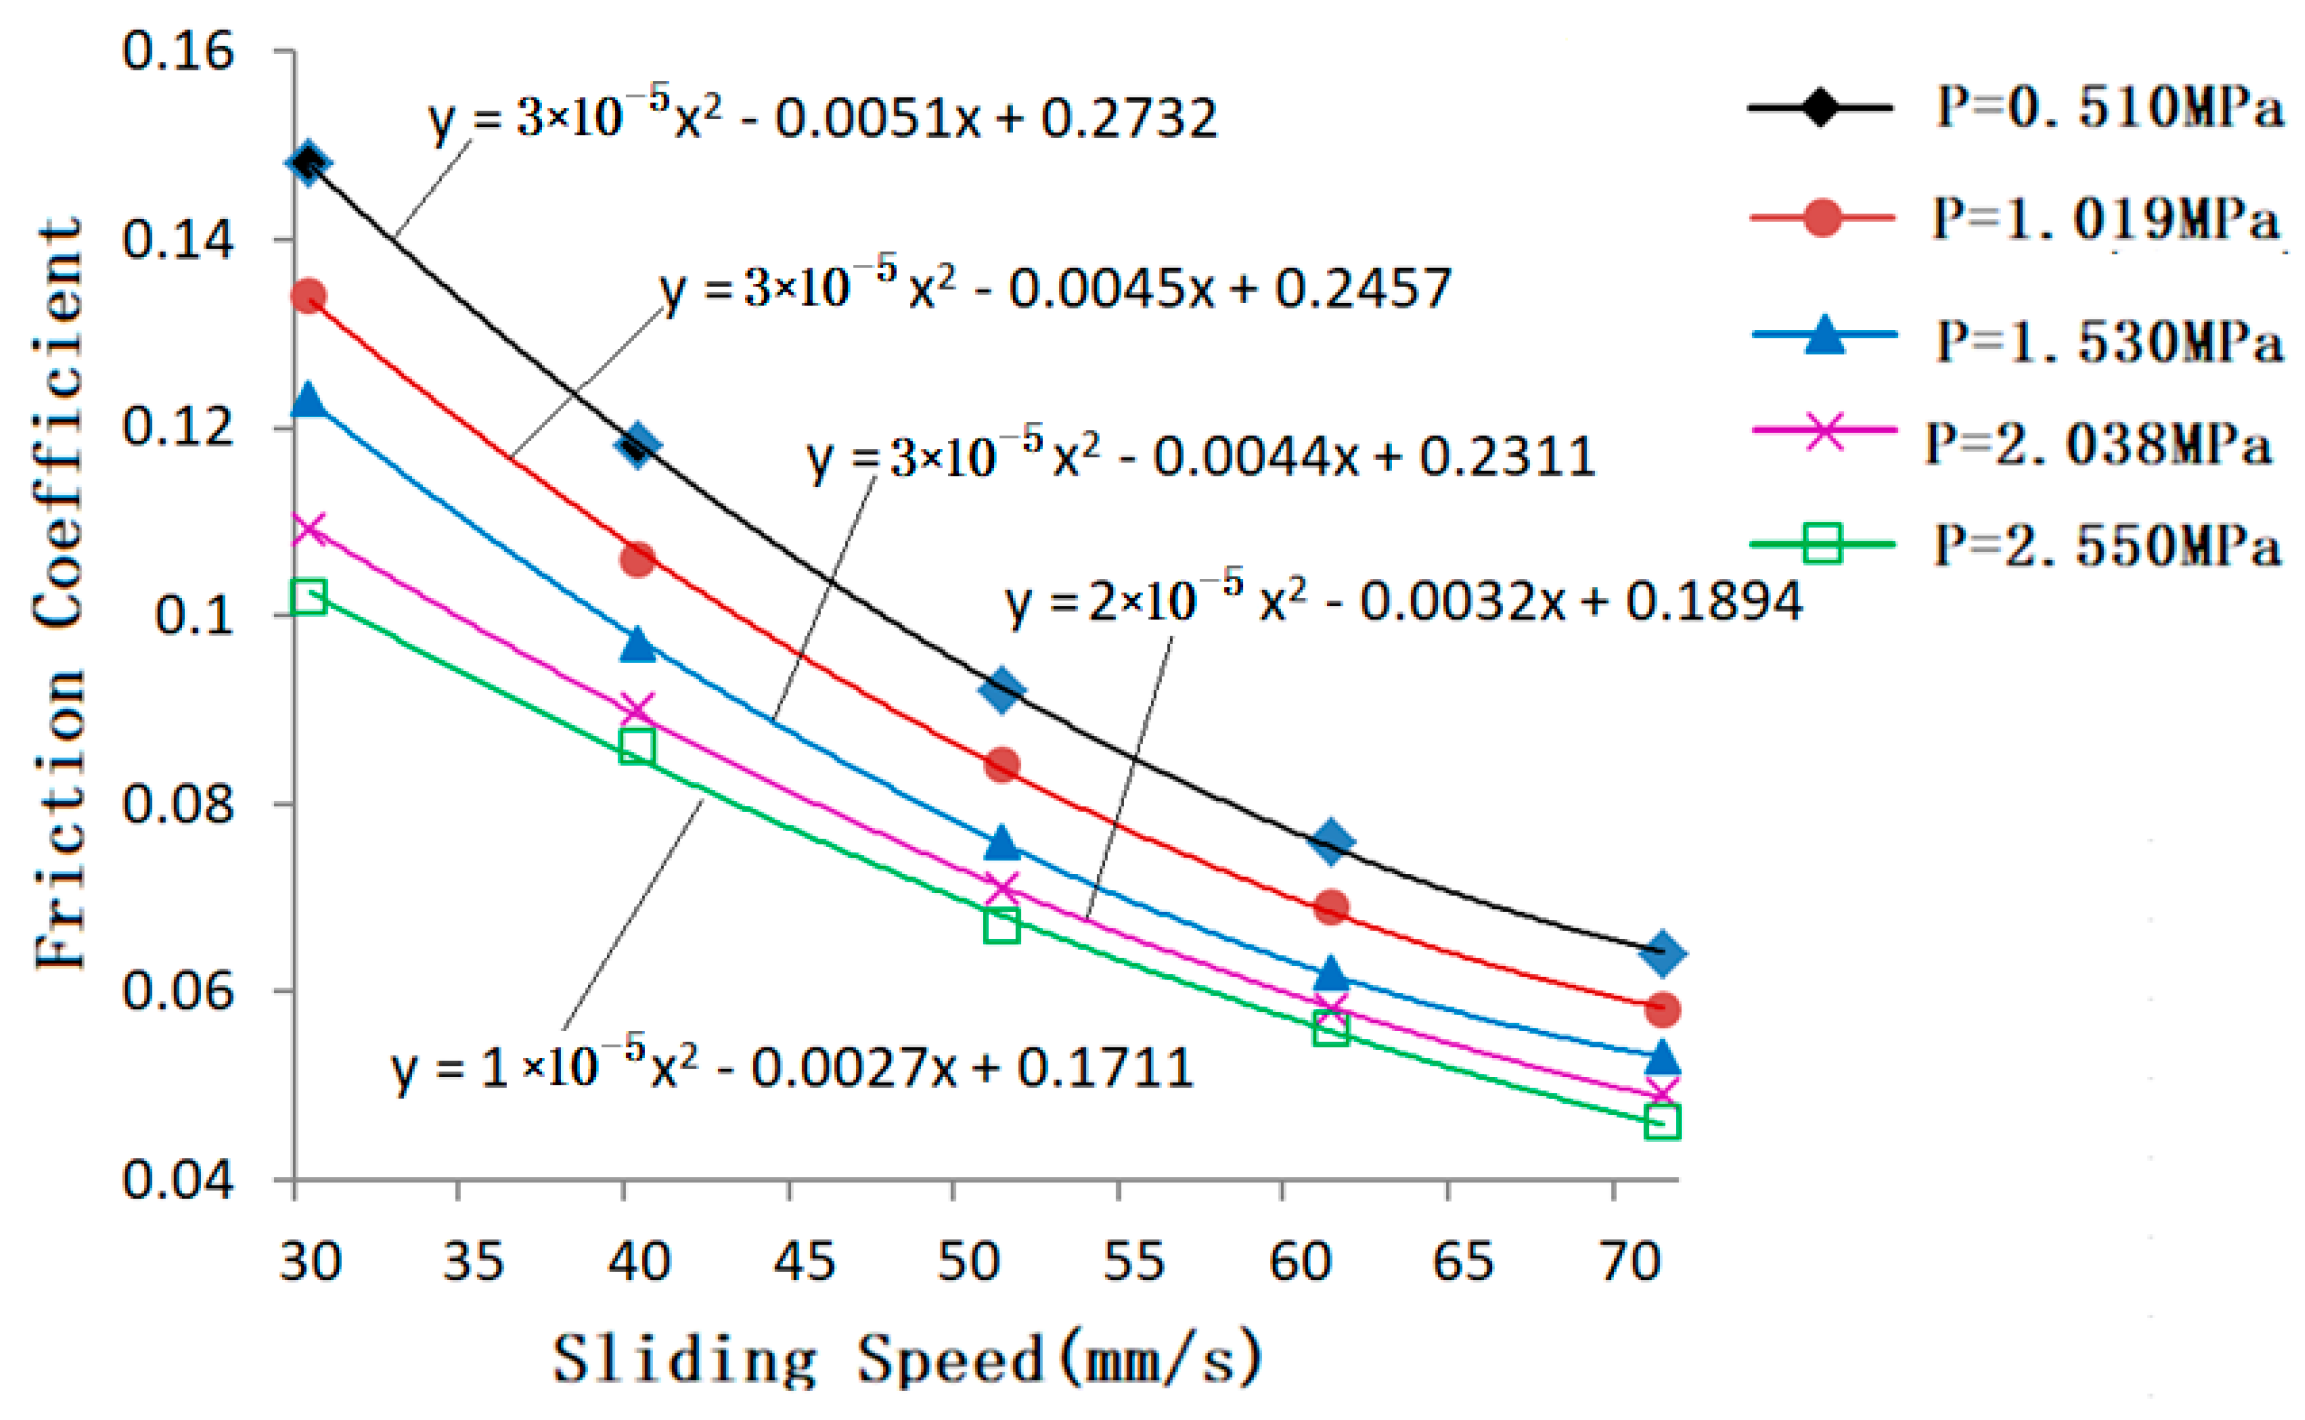
By analyzing the experimental data with MATLAB software (MATLAB 2018b, MathWorks, Natick, MA, USA), the quadratic polynomial fitting curve of friction coefficients with sliding speed between 5052 aluminum alloy and SKD11 die steel under constant load were drawn, as shown in Figure 3. When the sliding velocity is between 30.62 mm/s and 71.42 mm/s, the friction coefficient decreases gradually with increasing sliding velocity, and the decreasing tendency slows down in the higher sliding velocity range. According to the principle of tribology, under the boundary lubrication condition, the friction coefficient is mainly composed of fluid friction coefficient, fL, and solid friction coefficient, fS [13]. As the lubricant and positive pressure remain constant, the number of Sommerfeld in the Stribeck function [14] is directly proportional to the sliding velocity. With increasing sliding velocity, the area of solid friction decreases gradually and leads to a decrease in the coefficient of solid friction, fS. The local heating effect of the friction at the peak causes the viscosity of the lubricant to decrease and leads the coefficient of fluid friction, fL, to decrease. As a result, the friction coefficient decreases with increasing sliding speed.
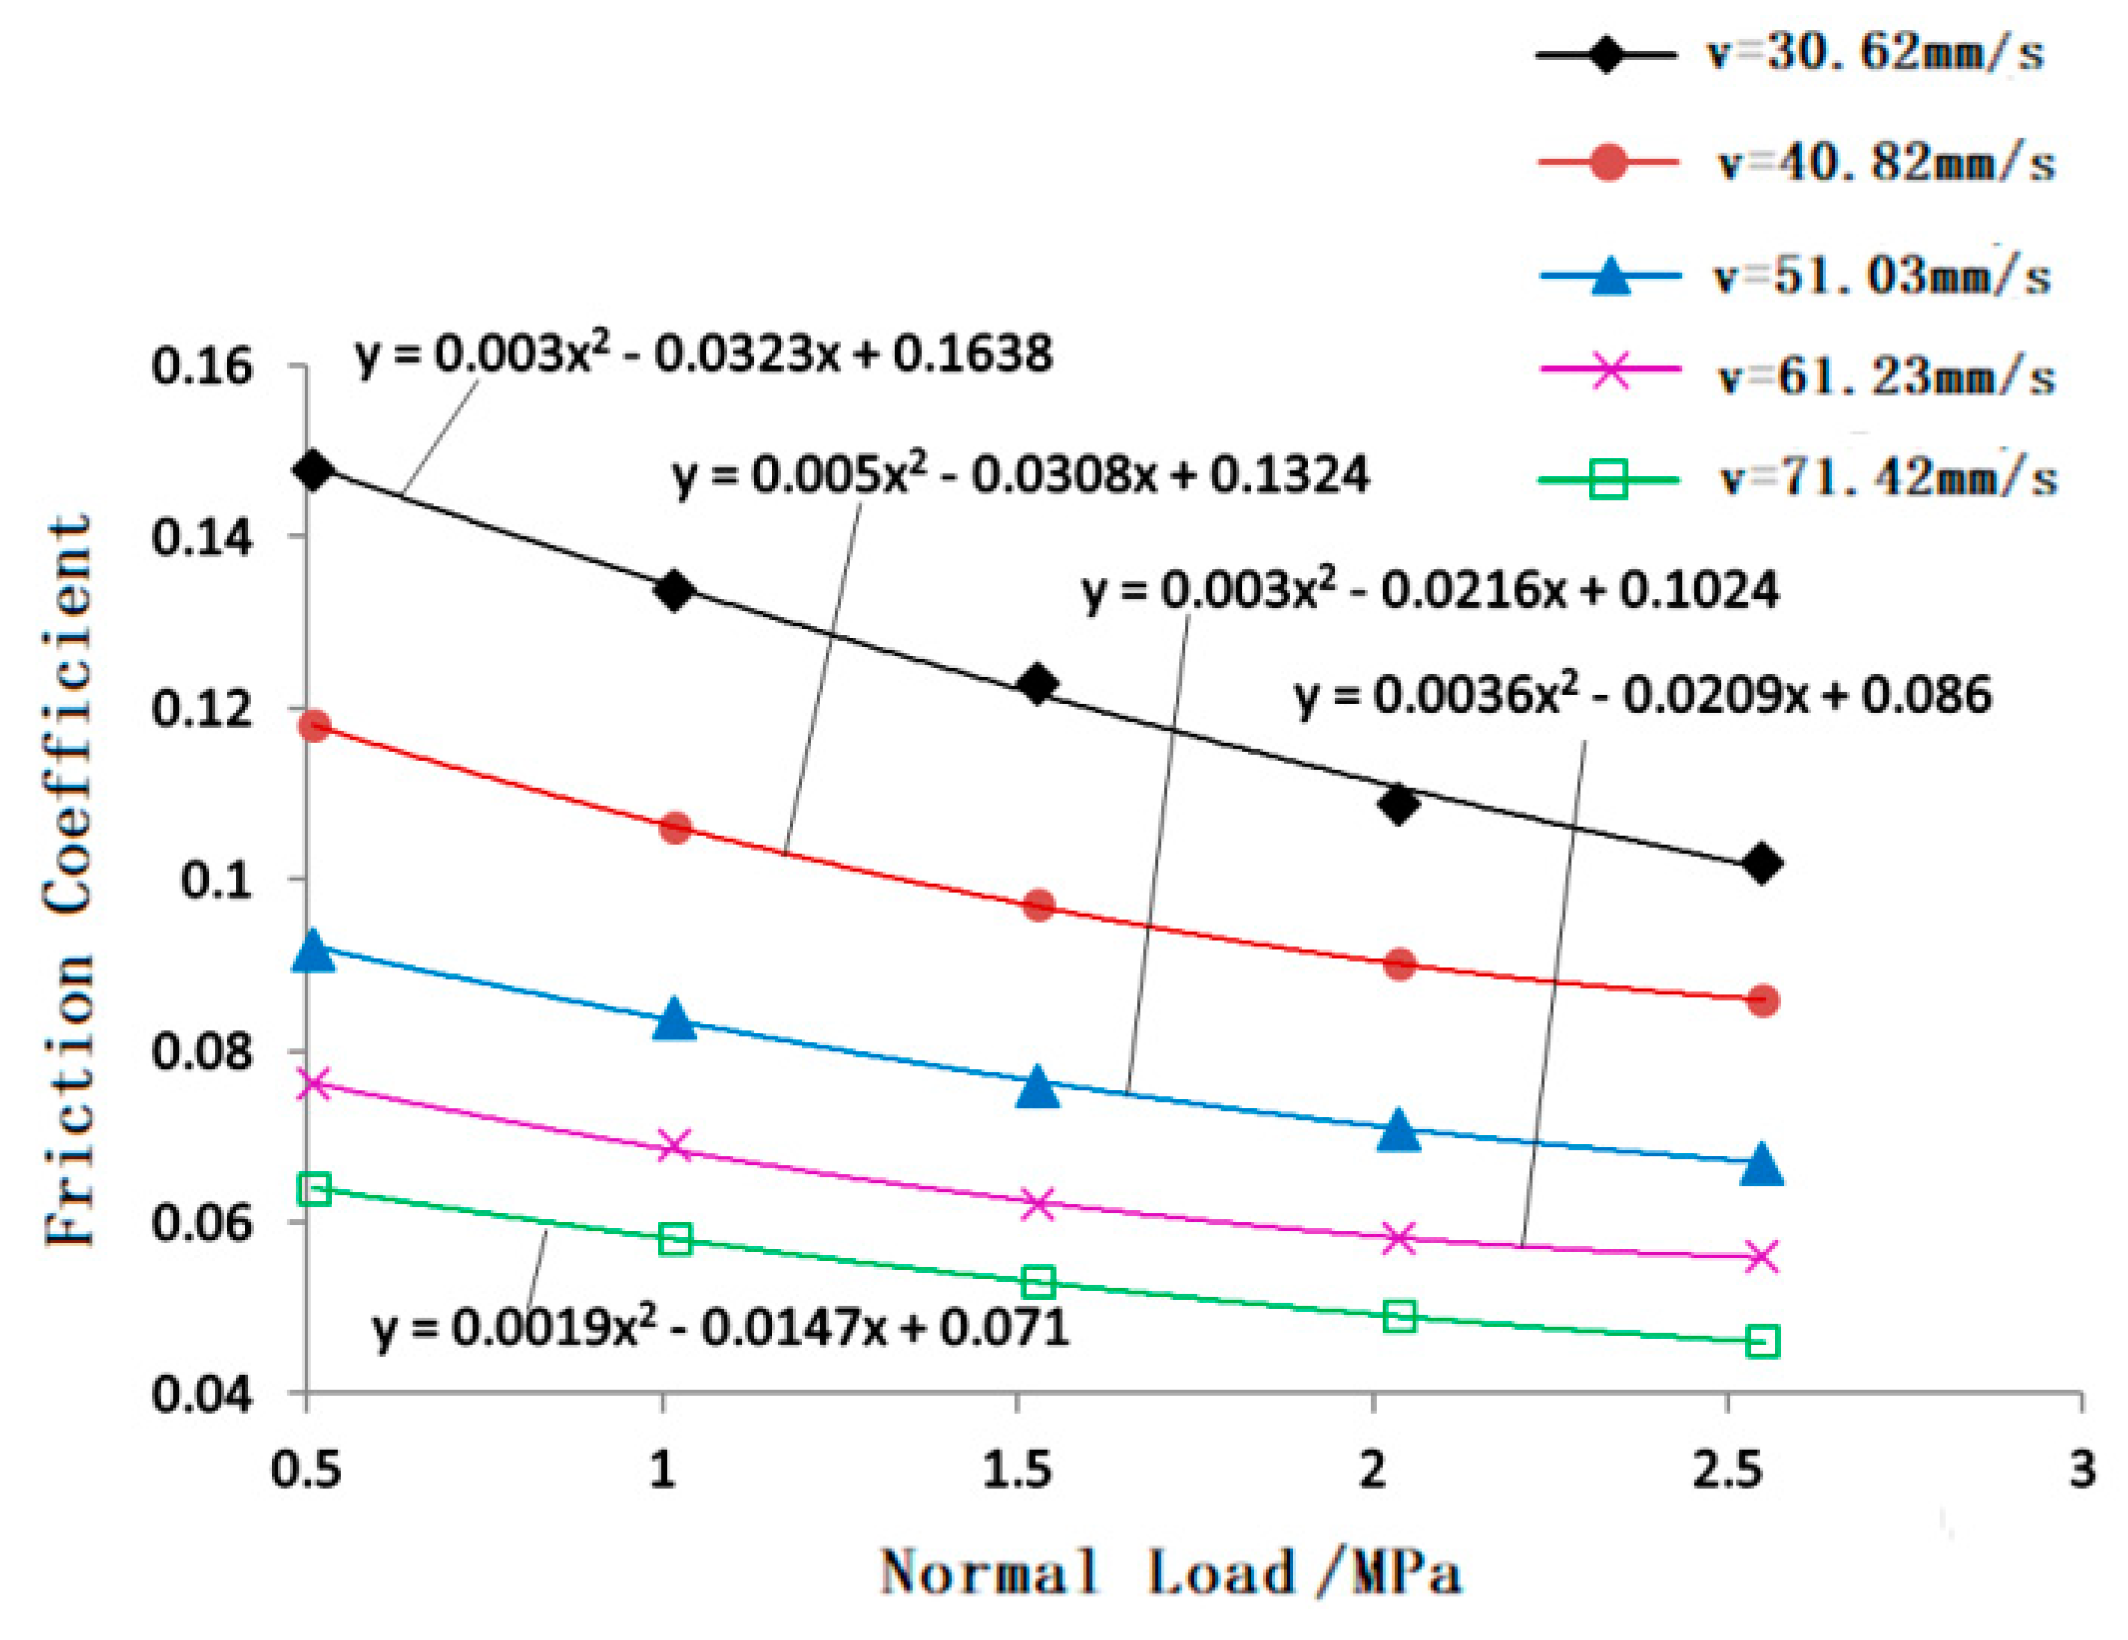
The quadratic polynomial fitting curve of the friction coefficient with constant speed conditions is shown in Figure 4. Under the normal load between 0.51 MPa and 2.55 MPa, the friction coefficient decreases with increasing normal load. The influence of normal load on the friction coefficient gradually weakened with the gradually increasing sliding speed. It is known from the tribological principle that the actual contact area of solid friction increases with increasing normal load. Since the magnitude of the increase in friction force is smaller than the increase in the normal load, the friction coefficient decreases with increasing normal load.
Comparing Figure 3 and Figure 4, the sliding speed increased by 2.33 times from 30.62 mm/s to 71.42 mm/s with constant load, so the coefficient of friction decreased by a maximum of 0.084; the normal loads increased by five times from 0.51 MPa to 2.55 MPa with constant speed, so the coefficient of friction decreased by a maximum of 0.046. It can be seen that when the sliding speed is between 30.62 mm/s and 71.42 mm/s, the normal load is between 0.51 MPa and 2.55 MPa, the maximum average decrease in the friction coefficient is 0.036 with a doubling of the sliding speed, and the maximum average decrease in the friction coefficient is 0.0092 with a doubling of the normal load. That is to say, the friction coefficient between 5052 aluminum alloy and SKD11 die steel is affected by sliding velocity nearly four times as much as it is affected by normal load.
3.2. Surface Morphology of the 5052 Aluminum Alloy
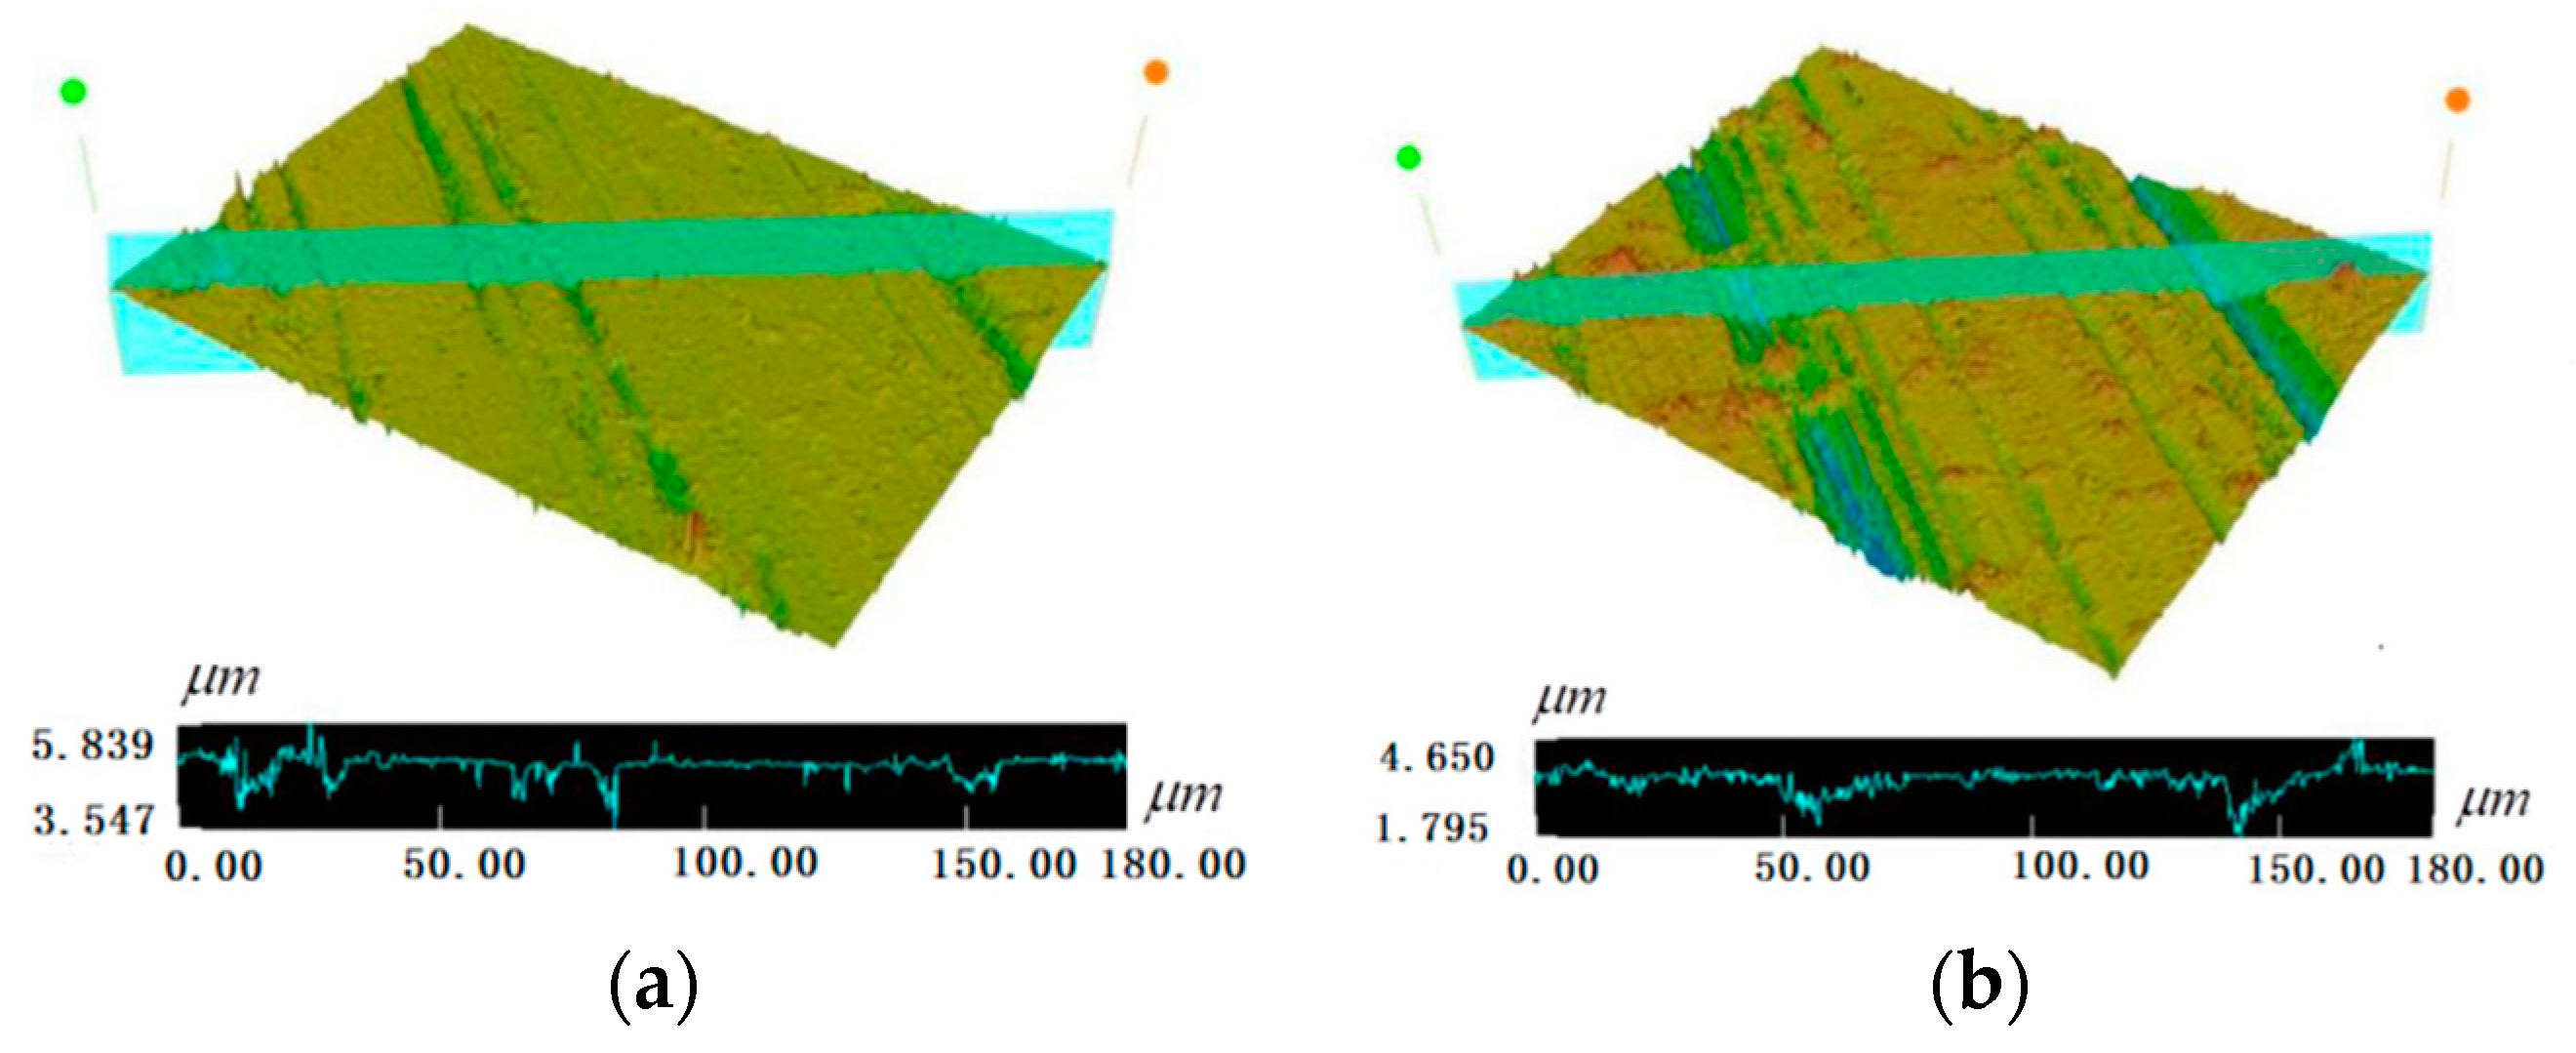
Under the boundary lubrication condition, the surface morphology of 5052 aluminum alloy after grinding with SKD11 die steel, at a sliding speed of 40.82 mm/s and normal loads of 0.51 MPa and 2.55 MPa, is shown in Figure 5. The maximum valley depth of the 5052 aluminum alloy surface is 3.547 µm, the maximum peak height is 5.839 µm, and the height of all points around 5.0 µm. When the surface is smooth, a small number of scratches appear, and a large number of fine abrasive particles as well as slight abrasions can be observed. It is shown that the friction mechanism is mainly ploughing wear and abrasive wear, under lower normal load. The maximum valley depth of the 5052 aluminum alloy surface is 1.795 µm, the maximum peak of height is 4.650 µm, and the height of all points around 3.338 µm, as shown in Figure 5b. There is a marked increase in scratches on the surface, marked adhesion marks, and an increase in the depth of the ploughing. It is shown that the friction mechanism is mainly ploughing wear with slight adhesive wear, under higher normal load. In summary, with constant speed conditions, the scratches on the surface of the 5052 aluminum alloy gradually increase; the depth of the furrow gradually increases with increasing normal load. The actual contact area between the 5052 aluminum alloy and SKD11 gradually increases. The lubrication oil flowing into the groove enhances the lubrication effect, making the increasing trend of the friction force slow down. The increase rate of friction is less than the increase rate of normal load, and the friction coefficient gradually decreases, which is consistent with the above conclusion of the friction characteristic study.
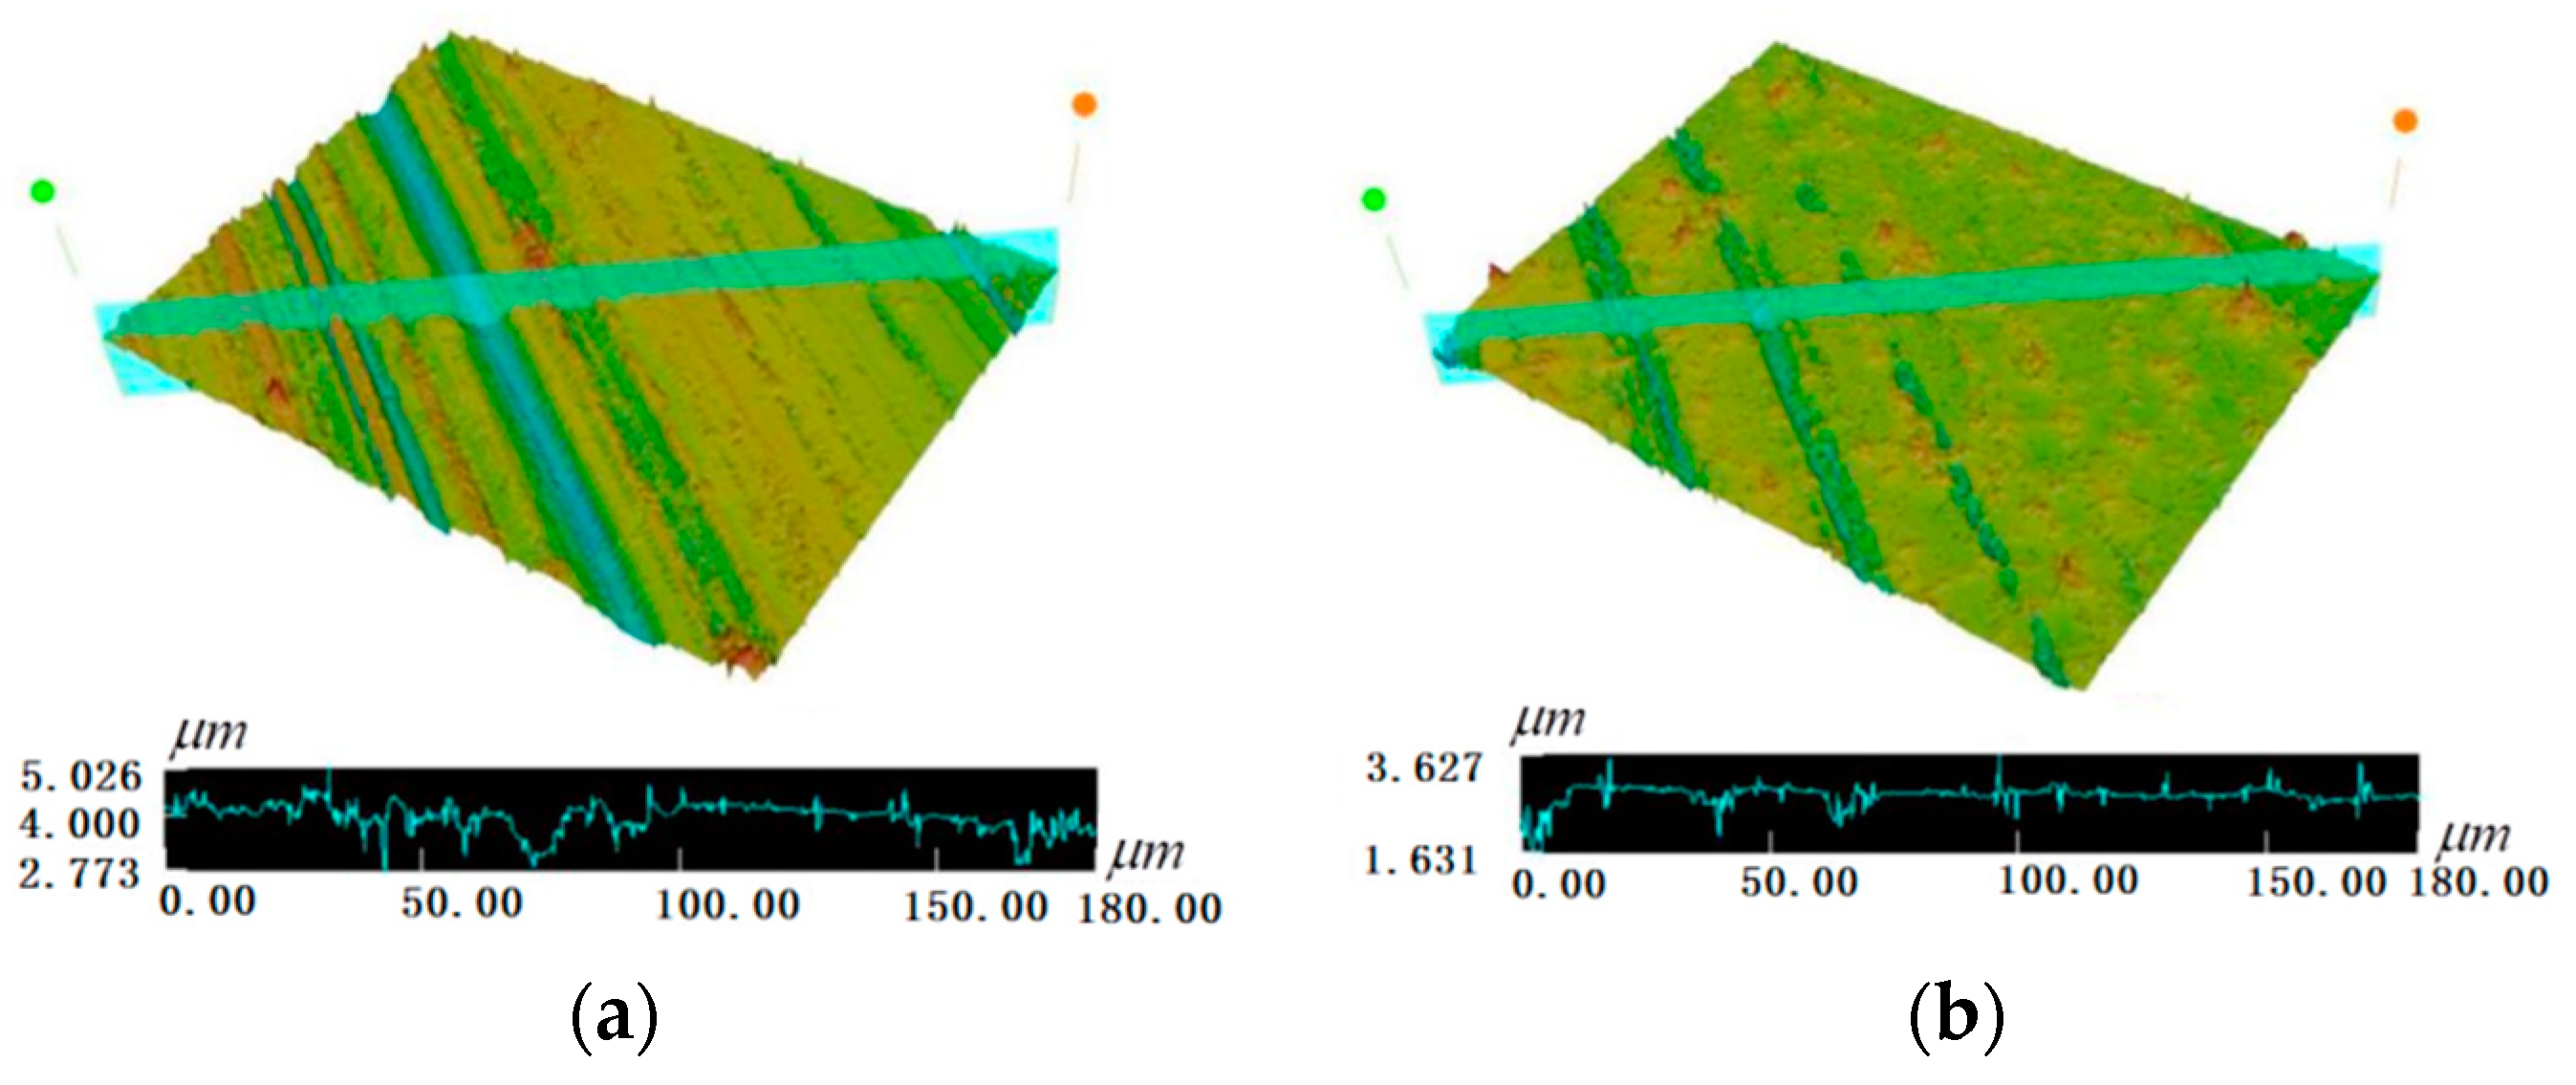
The surface morphology of the 5052 aluminum alloy after grinding with SKD11 at a normal load of 1.02 MPa, with speeds of 30.62 mm/s and 71.42 mm/s, is shown in Figure 6. The maximum valley is 2.773 µm, the maximum peak height is 5.026 µm, and the height of all points is around 4.0 µm. There are a lot of deep scratches on the surface. The friction mechanism is mainly ploughing wear and abrasive wear, under lower sliding speed. As shown in Figure 6b, the surface morphology of two sliding speeds, the maximum valley depth of the 5052 aluminum alloy surface is 1.631 µm, the maximum peak height is 3.627 µm, and the height of all points is about 3.0 µm. The scratches on the surface are significantly reduced and smooth, and a small amount of adhesion marks can be observed. In summary, if the load conditions are constant, the scratches on the surface of the 5052 aluminum alloy gradually decrease, and the furrow depth gradually becomes shallower with increasing speed. The actual contact areas between the 5052 aluminum alloy and the SKD11 die steel gradually decrease. With increasing speed, the temperature between the friction contact points increases gradually, which causes the viscosity of the lubricant to decrease and leads the coefficient of friction to decrease noticeably. The friction coefficient decreases gradually with increasing speed; the velocity decreases, with the increase in velocity being larger than the increase in load.
As can be seen from Figure 5 and Figure 6, the surface morphology of the 5052 aluminum alloy after grinding with the SKD11 mold steel greatly varies with different process parameters. The process parameters must have a significant influence on the surface roughness of the 5052 aluminum alloy. Six roughness parameters, namely Ra, Rp, Rv, Rz, Rc and Rq, as shown in Table 3, are used to illustrate the boundary lubrication condition.
The surface roughness values of 5052 aluminum alloy after grinding with SKD11 die steel under four different process parameters, with a sliding stroke of 245 mm, are shown in Table 4. With the constant speed condition and the increase of normal loads from 0.51 to 2.55 MPa, all six surface roughness values increased. The contour arithmetic mean deviation Ra increased from 0.148 µm to 0.241 µm. With the increase in sliding speed from 30.62 to 71.42 mm/s, all six surface roughness values decreased. The contour arithmetic mean deviation Ra decreased from 0.229 to 0.125 µm. This is consistent with the conclusion that the friction coefficient decreases with increasing sliding speed.
3.3. Variable Friction Modeling
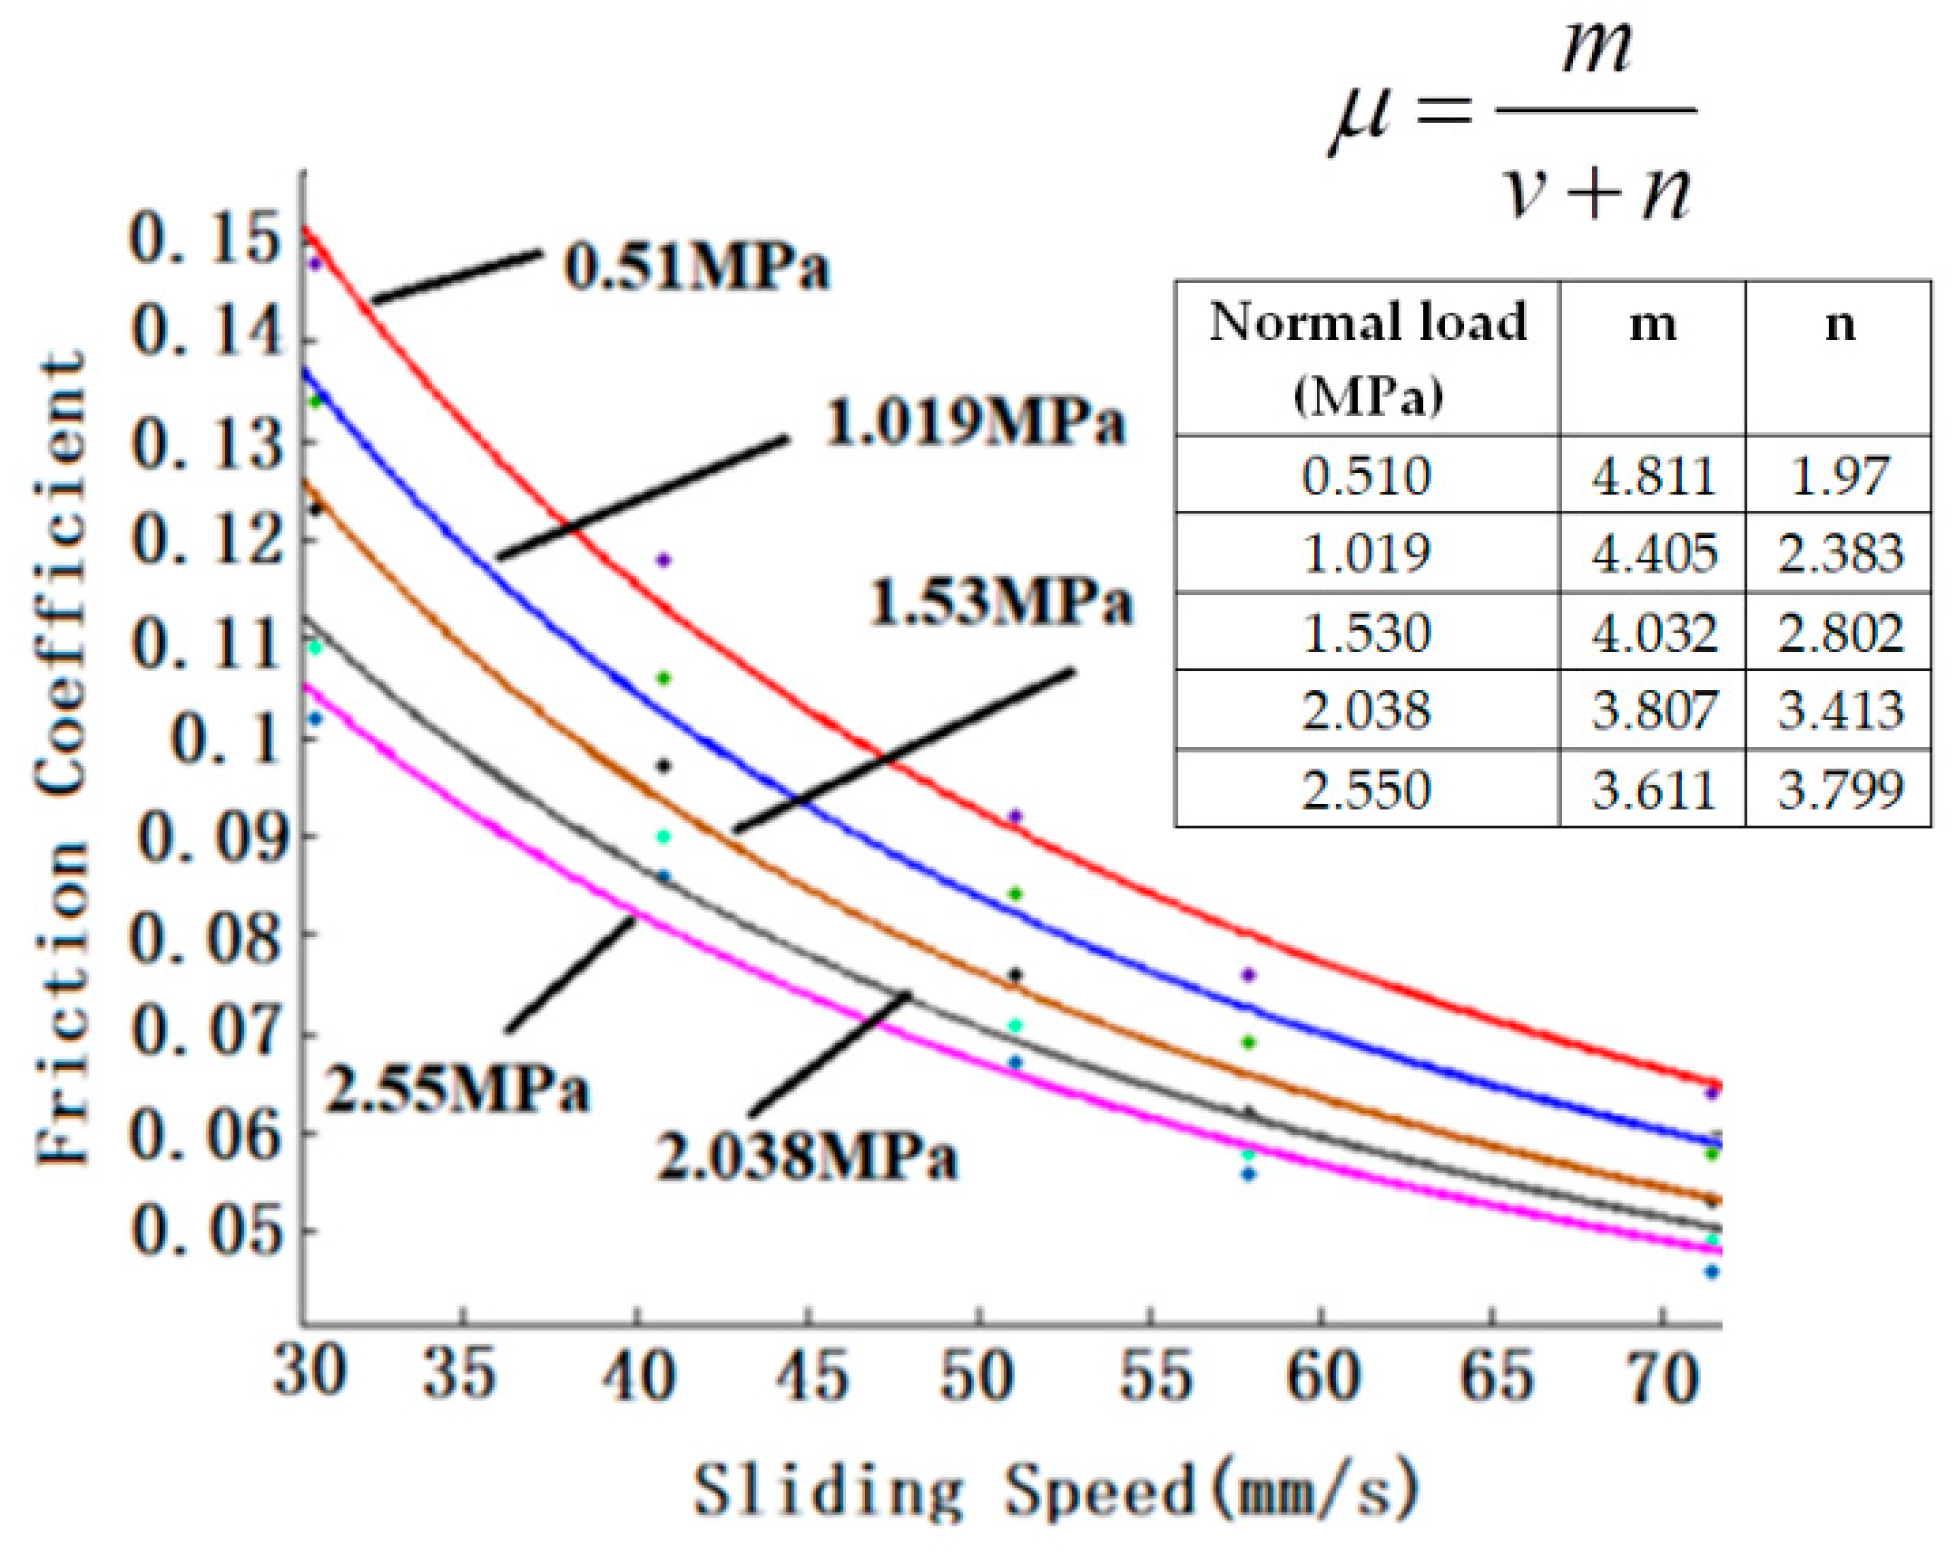
As can be seen from Figure 3 and Figure 4, the friction behavior between 5052 aluminum alloy and SKD11 die steel is obviously affected by sliding speed and normal load. Therefore, the simulation analysis of 5052 aluminum alloy sheet forming with the constant friction coefficient model is not consistent with the actual working condition, and the prediction error is large. To accurately describe the friction characteristics in the forming process of 5052 aluminum alloy, and to improve the precision of the forming simulation and roughcast outline of complex sheet metal parts, it is particularly important to establish a variable friction coefficient model that comprehensively considers the sliding speed and the normal load. To quickly establish a real friction model that can accurately describe the friction characteristics between 5052 aluminum alloy and SKD11 die steel, with the fitting function of MATLAB software, the friction coefficient and sliding speed under five normal loads were, respectively, fitted by an inverse function curve. The inverse function fitting curve between friction coefficient and sliding velocity is shown in Figure 7.
As shown in Figure 7, the variation law of the friction coefficient with the sliding speed and the five kinds of normal load conditions is in accordance with the inverse function, which is as follows:
where m and n are constants related to normal loads, v is the sliding speed, and µ is the friction coefficient.
The experimental data to fit the values of m and n with the five normal load conditions are shown in Table 5, based on the analysis of MATLAB software.
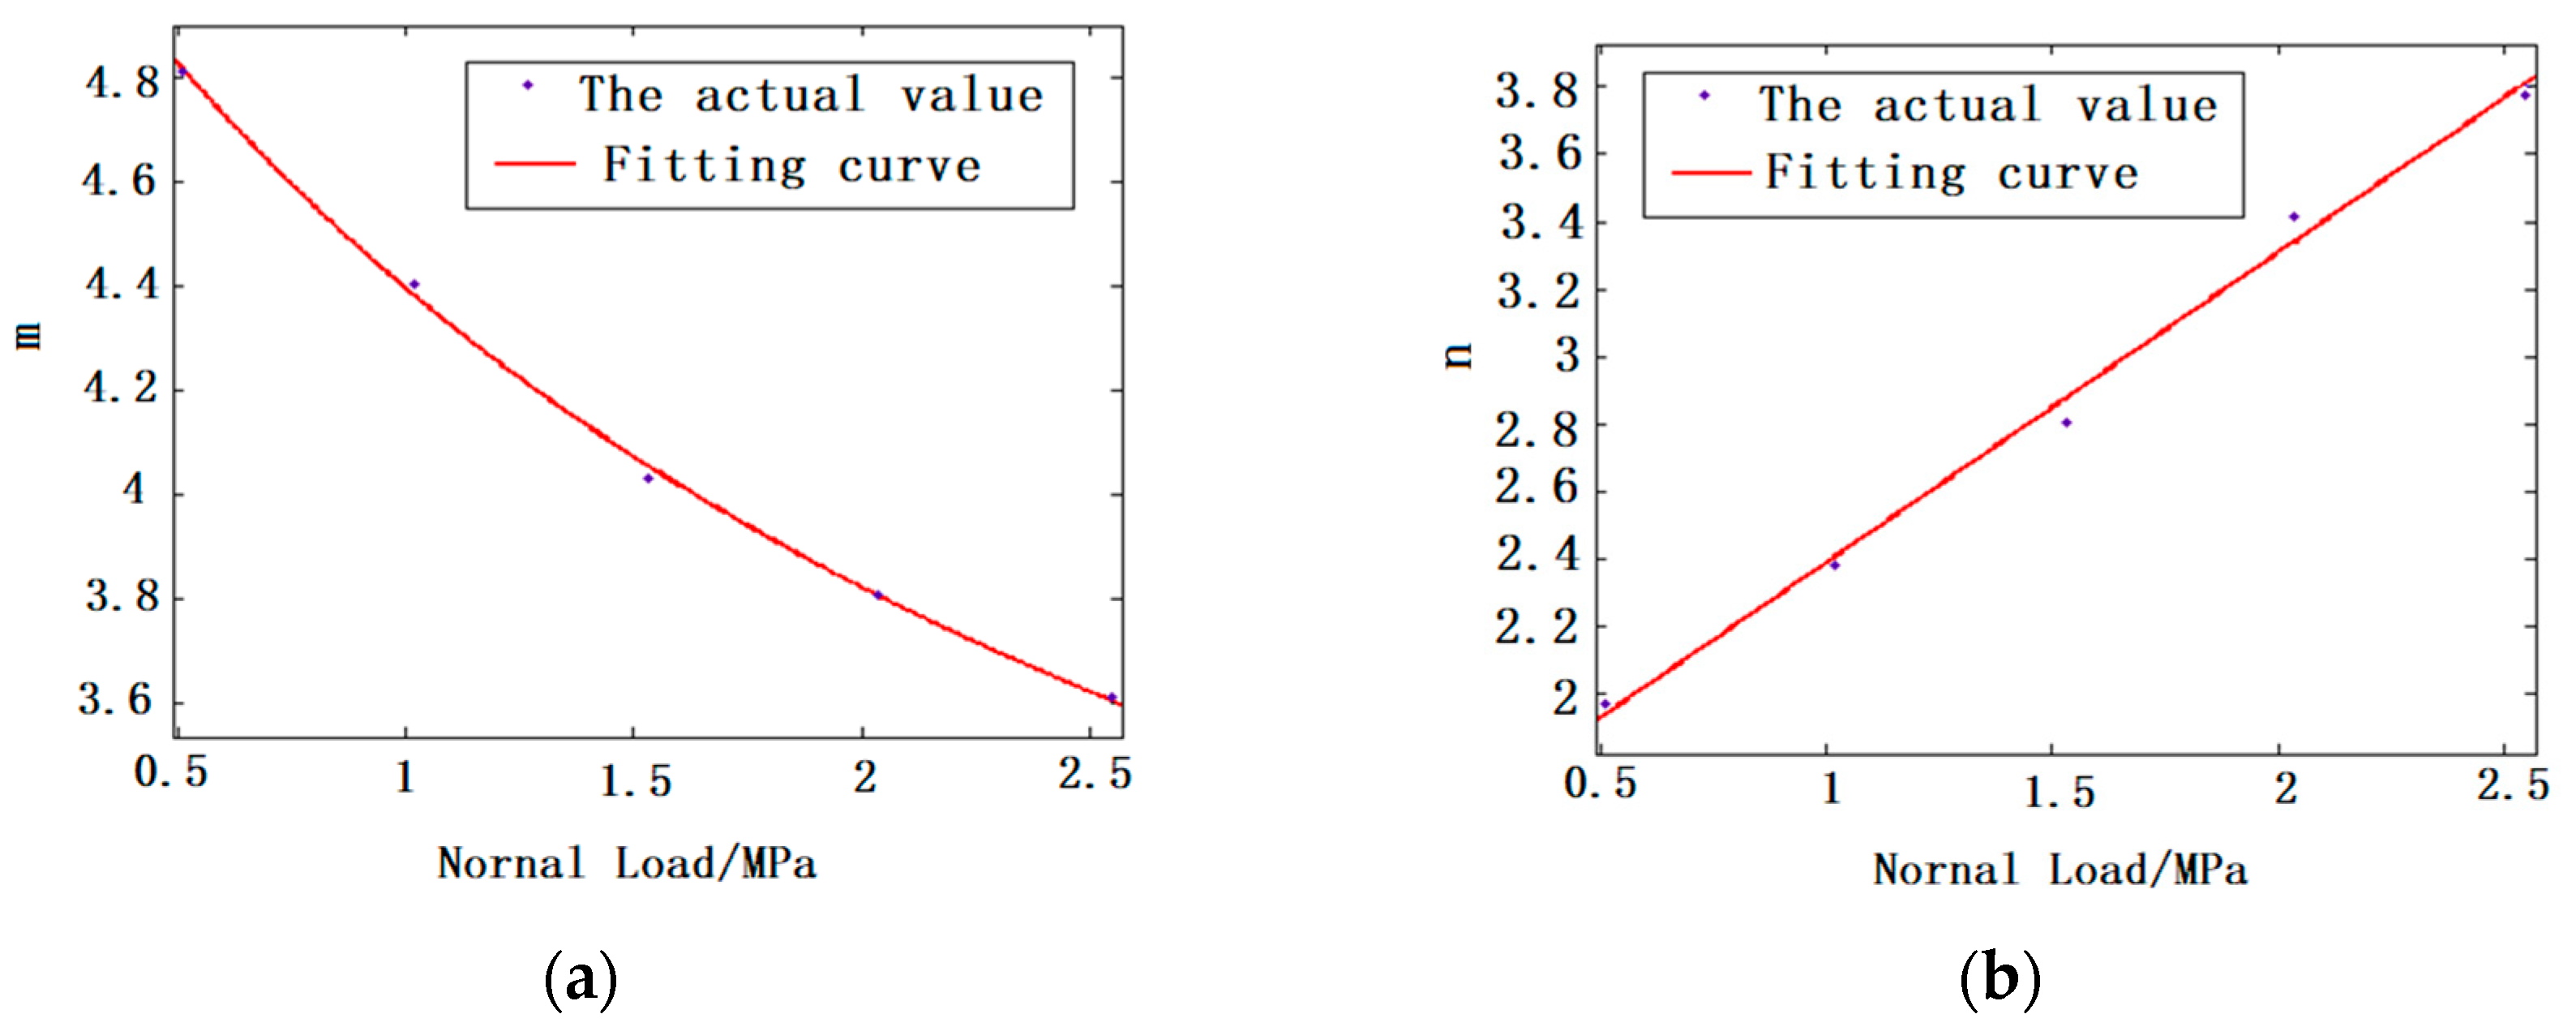
As shown in Table 5, the goodness of fit between the inverse function and the real value is more than 0.95, so it can be concluded that the fitted values of m and n are effective. For verification of the correlation between normal load and m and n, the first column values of m and n were analyzed separately. From Table 5, it can be seen that m decreases with increasing normal load, but n increases with increasing normal load. To find a functional relationship between m, n and normal load, the relationship curve between the normal load and m and n was obtained by fitting, as shown in Figure 8. According to the fitting results, the relationship between the normal load and m is as follows:
where a, b and c are constants, the values of a, b and c are 1.849, 13.3 and 2.446, respectively, and the goodness of fit is 0.9974. It can be seen that the goodness of fit between the function and the actual value is better, and the values of a, b and c obtained by fitting are valid. The functional relationship between m and the normal load is as follows:
The relationship between the normal load and n was in accordance with the following functional relationship:
where a and b are constants, and the values of a and b, obtained from the fitting results, are 0.9193 and 1.467, respectively. The goodness of fit was 0.9927. It can be seen that the goodness of fit between the function and the actual value is better, and the values of a and b obtained by fitting are valid. The functional relationship between n and the normal load is as follows:
The functional relationship of friction coefficient, sliding speed and normal load was obtained by combining Equations (1), (3) and (5):
where P is the normal load, v is the sliding speed, and µ is the friction coefficient.
3.4. Verification Parameters of the Variable Friction Model
To verify the validity of the above variable friction model based on different sliding speeds and normal loads, five groups of normal loads and sliding speed values were substituted, respectively, and the ratios of the predicted values to the actual measured values are shown in Table 6. The error between the prediction results of the variable friction model and the actual measured values was less than 7%, which preliminarily verified the validity of the model.
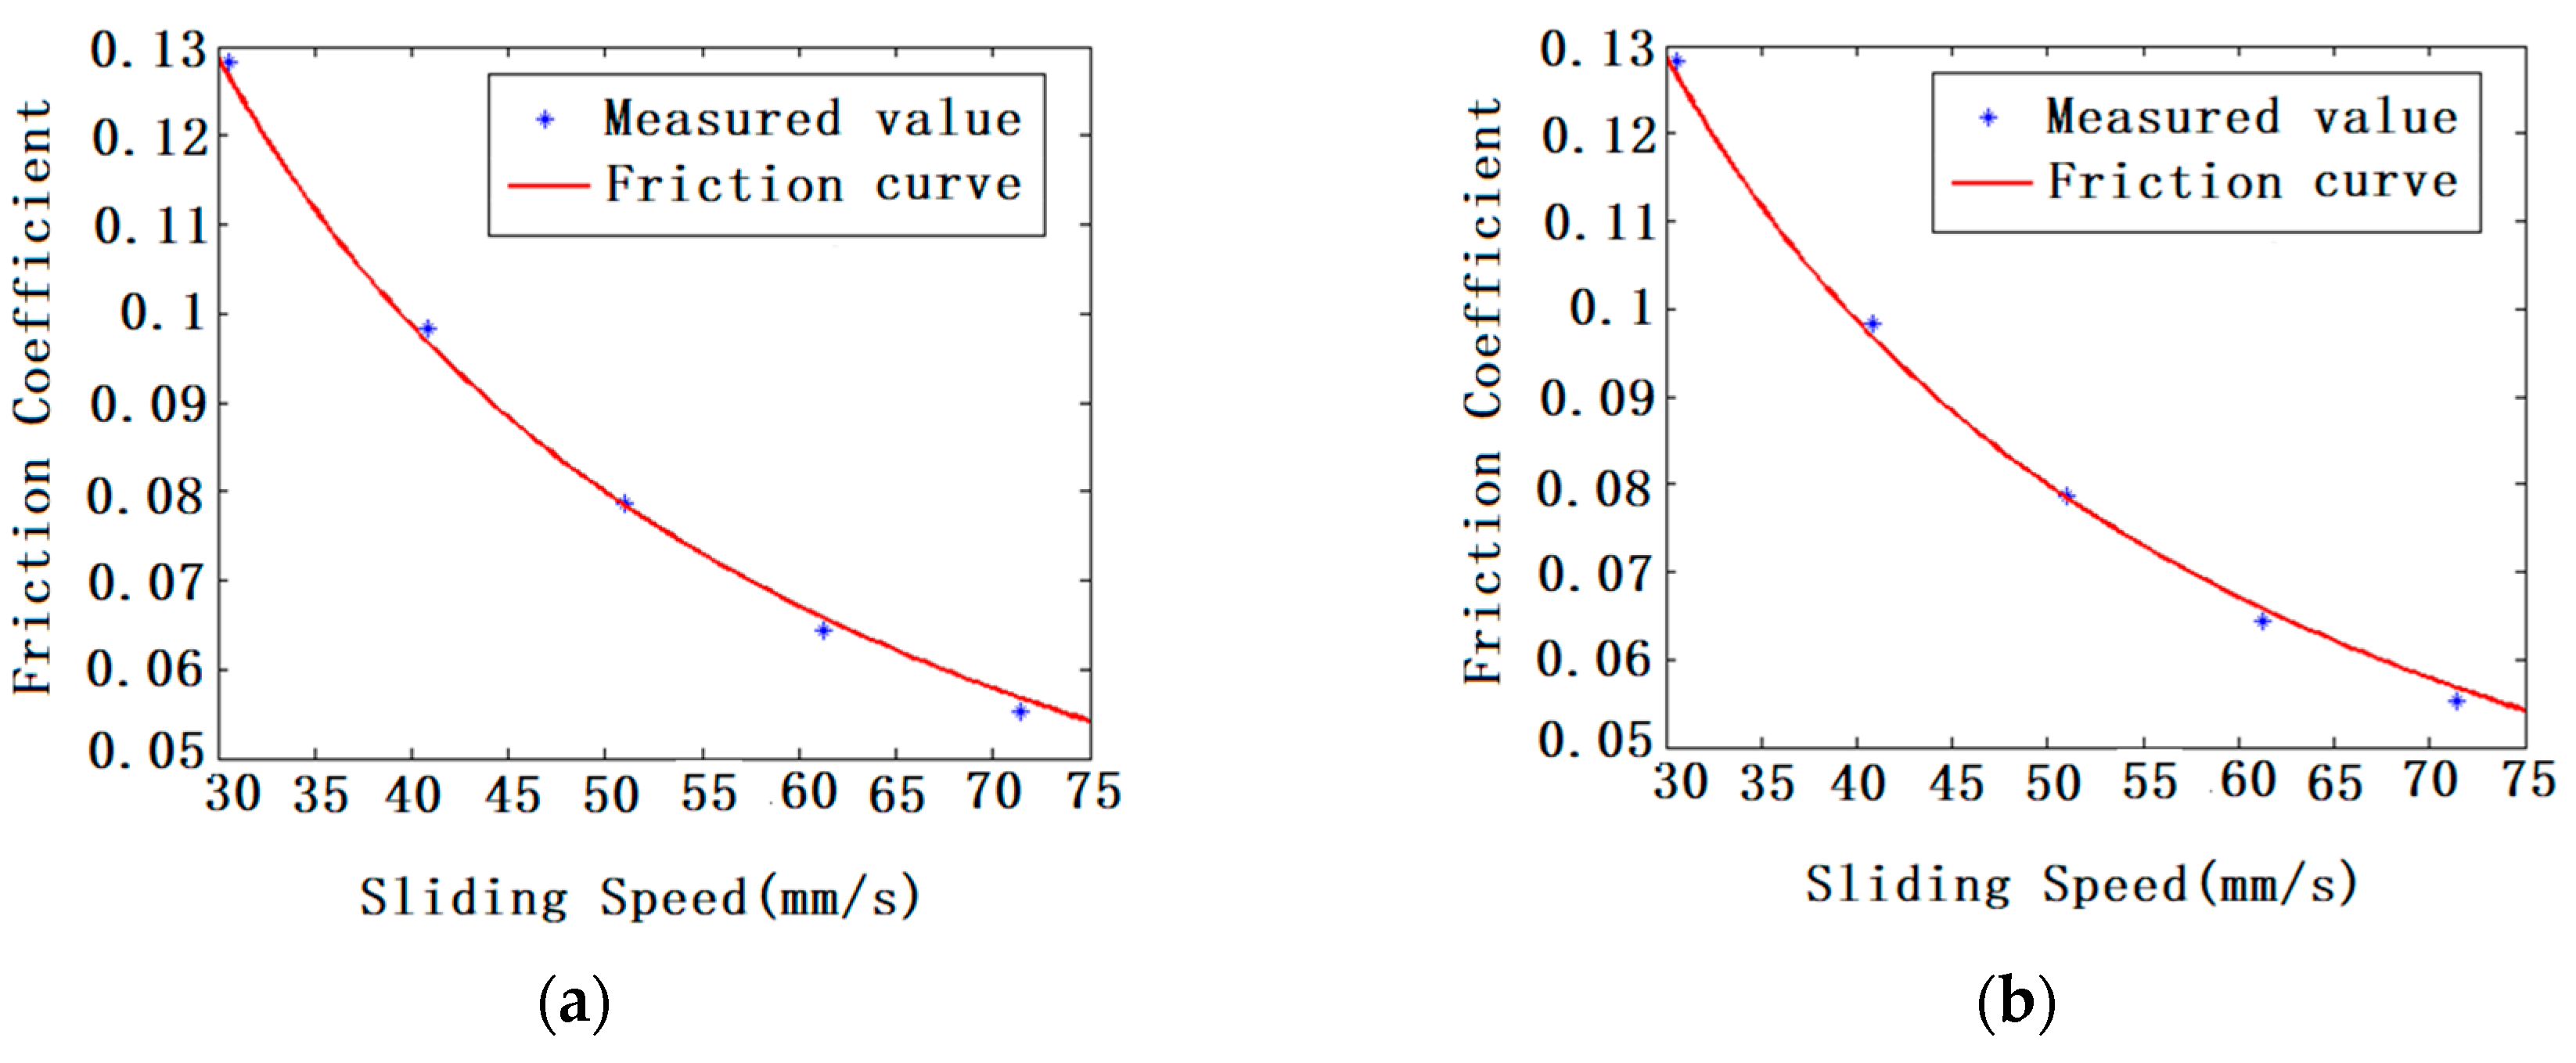
To further verify the accuracy of the variable friction model based on the different sliding speeds and normal loads established in this paper, under the condition of a constant load of 1.28 MPa, five groups of speeds, namely 30.62 mm/s, 40.82 mm/s, 51.03 mm/s, 61.23 mm/s and 71.42 mm/s, were individually chosen to be applied on the MPX-2000 disk-pin friction tester, and the obtained friction coefficients were 0.128, 0.098, 0.0787, 0.0645 and 0.0552, respectively. With the condition of a constant speed of 44.22 mm/s, five groups of loads (0.510 MPa, 1.019 MPa, 1.530 MPa, 2.038 MPa and 2.550 MPa) were individually chosen to be applied on the MPX-2000 disk-pin friction tester, and the obtained friction coefficients were 0.106, 0.095, 0.086, 0.0799 and 0.07386. The measured values and the predicted results are shown in Figure 9 and Table 7 and Table 8. The error between the predicted results and the measured values is less than 5%, which verifies the validity of the variable friction model established in this paper to describe the friction characteristics in sheet metal forming with 5052 aluminum alloy.
4. Discussion
4.1. Simulation of Sheet Metal Forming
To test the effectiveness of the variable friction model, based on different normal loads and sliding speeds, in predicting the numerical simulation of sheet metal forming, the model established in this paper was used to simulate the thickness distribution and spring-back of U-bend parts, based on ABAQUS software.
The three-dimensional models, including punch, die, binder and blank, were modeled using NX software, and then exported in IGS format (General conversion format of three-dimensional software) to ABAQUS software. The punch, die and binder were defined as discrete rigid bodies, and the blank was defined as a deformable body. The material of the blank was 5052 aluminum alloy, of which the physical parameters are shown in Table 9.
To make the simulation structure more consistent with the actual working conditions, the punch, die and holder were defined as non-deformable solid structures, and the sheet was defined as a deformable shell structure. The numerical model of ABAQUS U-bend parts forming the simulation is shown in Figure 10.
In mesh generation, the blank element type was explicit and shell element SR4, and the punch, die and binder were explicit and discrete rigid body element R3D4.
From the comparison of the predicted results, we drew the following conclusions: (i) the variable friction model based on different sliding velocities and normal loads; and (ii) three groups of constant friction coefficients, and the measured value of the actual parts to verify the validity of the variable friction model established in this paper.
4.2. Thickness Distribution Result
ABAQUS/Explicit was used to simulate the thickness distribution of U-bend parts. To ensure the effectiveness of the comparison between the results of the thickness distribution simulation and the actual measured values, the constant friction coefficient model and the variable friction coefficient model established in this paper were used to simulate the thickness distribution of the Box-shape parts. The lubrication conditions of the sliding friction in the forming process were divided into dry friction (µ > 0.3), boundary lubrication (0.1 < µ < 0.3), mixed lubrication (0.03 < µ < 0.1) and hydrodynamic lubrication (µ ≤ 0.03), according to the friction coefficient [16]. Dry friction usually occurs when the area between the sliding surfaces has a complete absence of lubricant. As the friction test and sheet metal stamping were carried out under lubricant conditions, the lubrication condition of sheet metal forming cannot be classified as dry friction. Generally, hydrodynamic lubrication does not occur in the sheet metal forming process. After analysis of the friction test data in Table 2, the friction condition was either boundary lubrication or mixed lubrication condition.
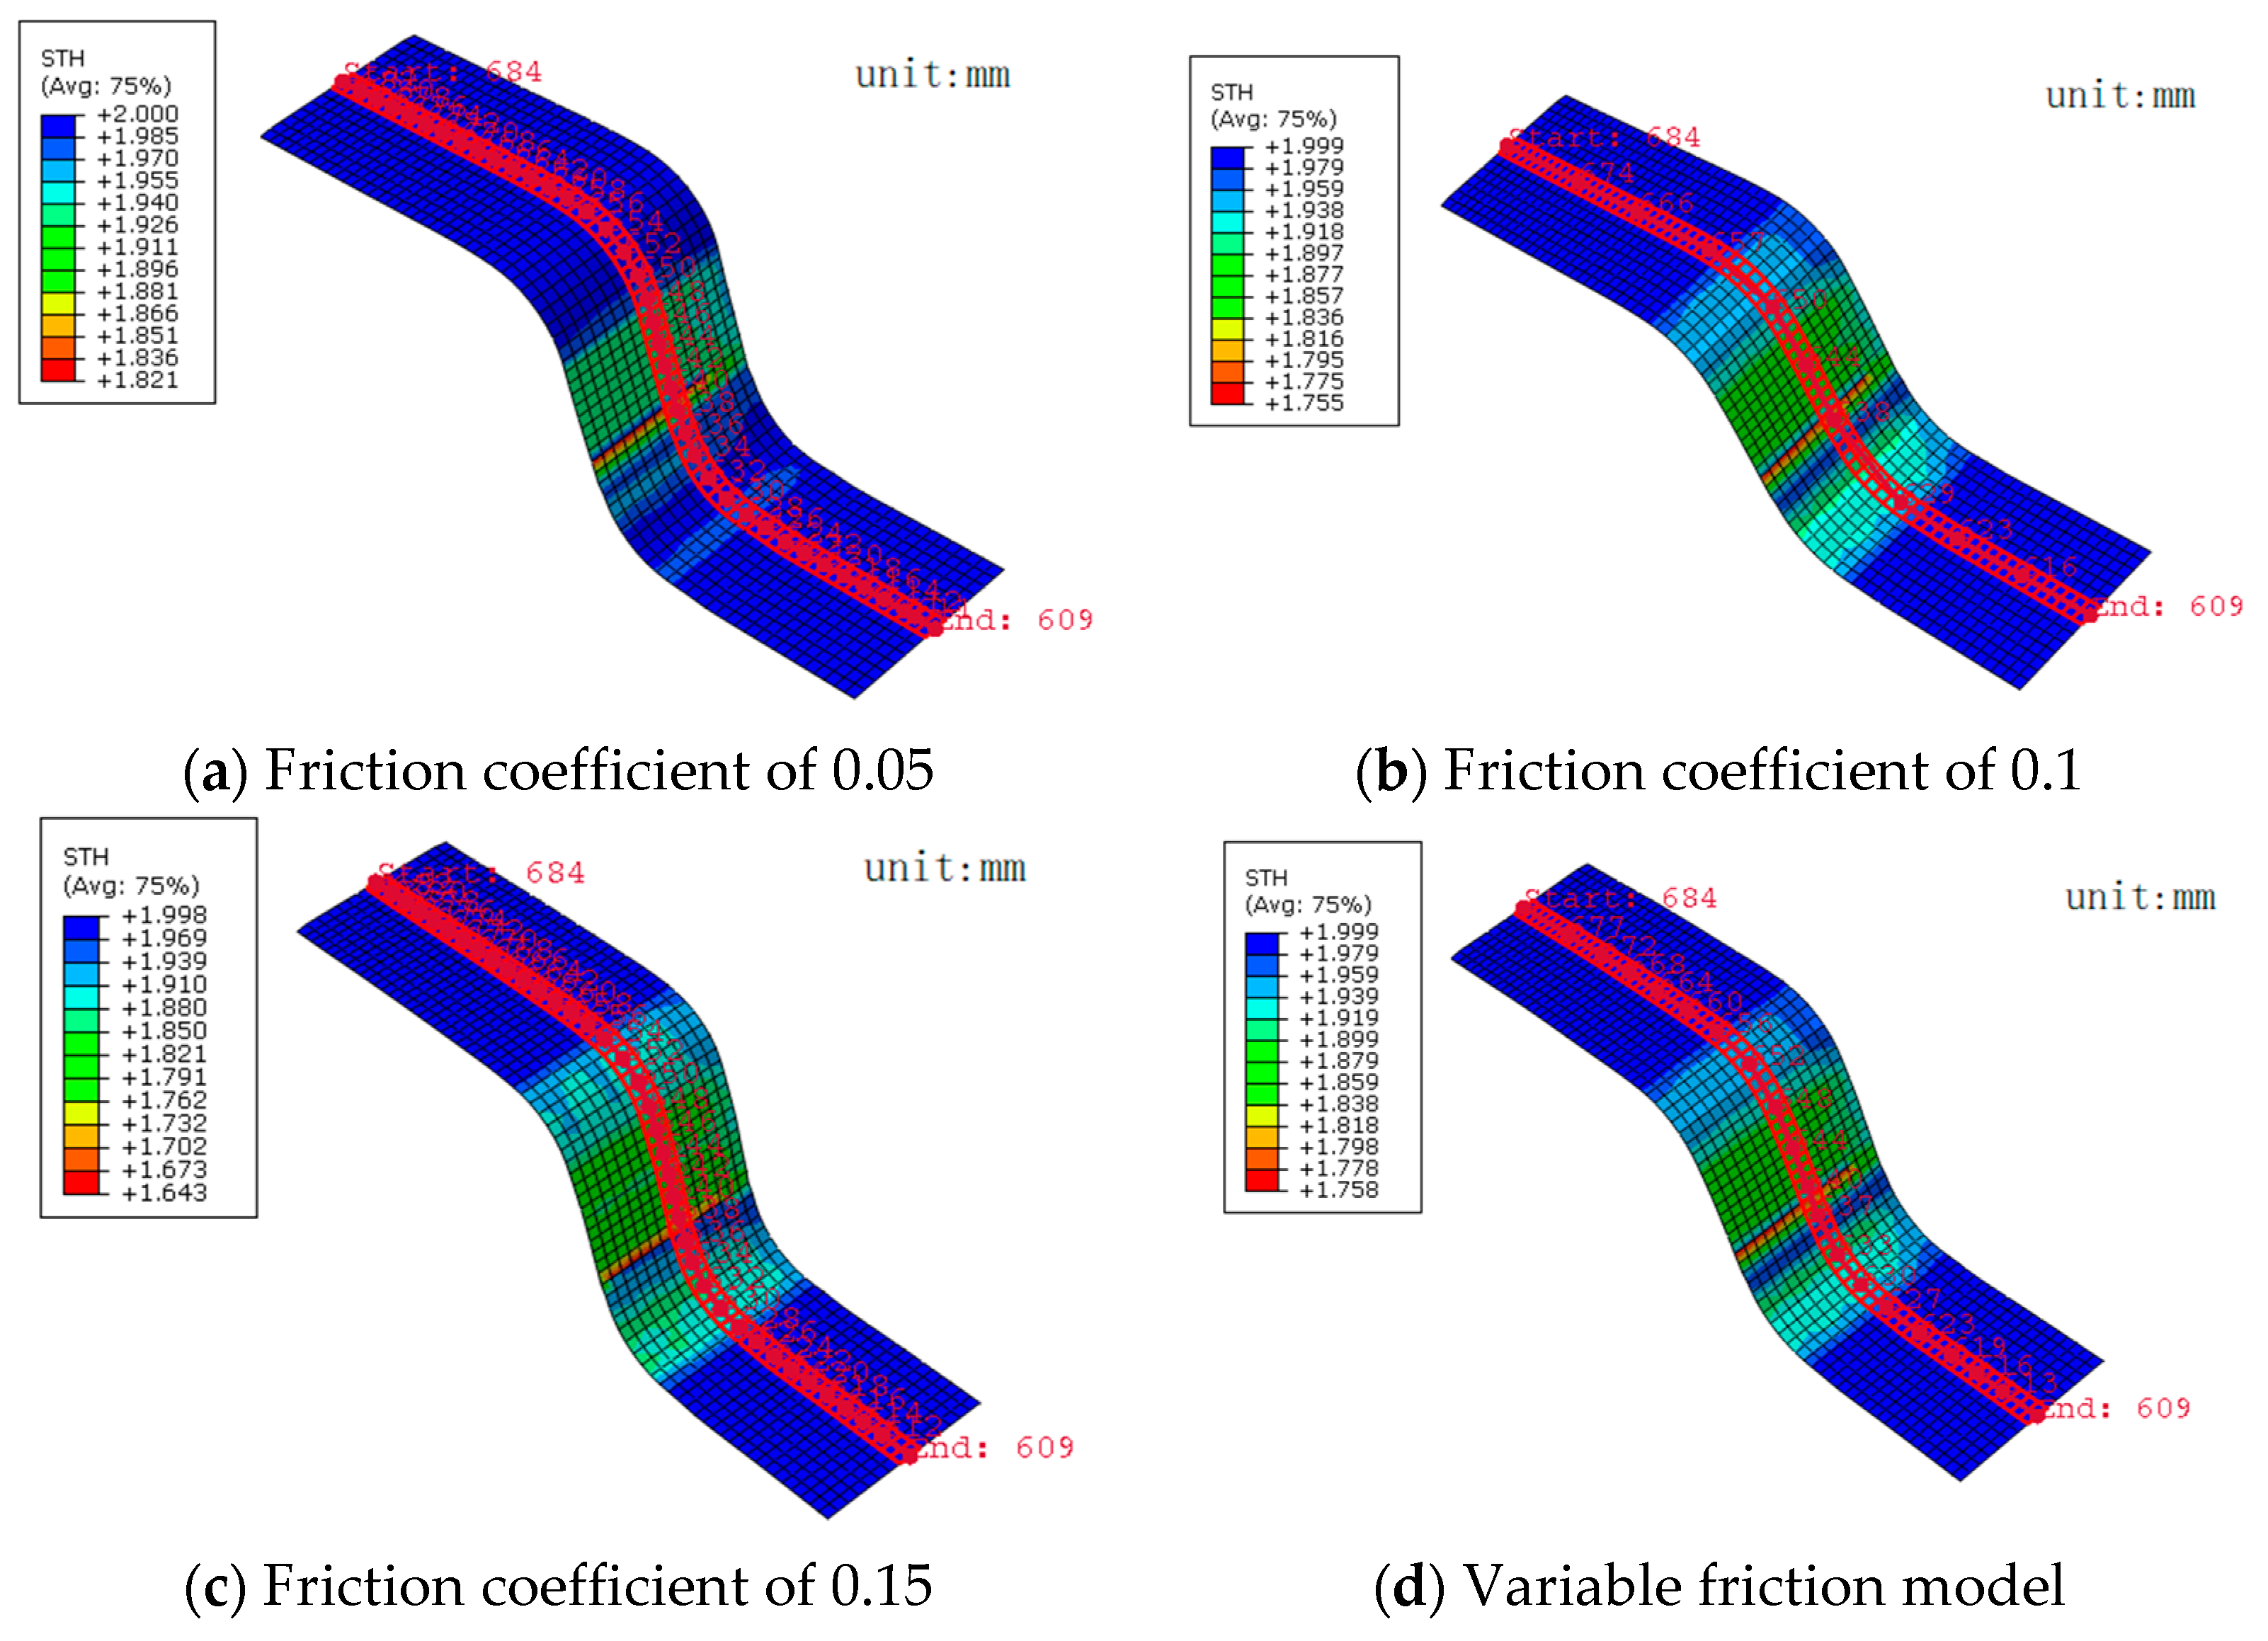
Therefore, the three groups of constant friction coefficients selected to simulate the thickness distribution of the Box-shape parts were 0.05, 0.1 and 0.15. The comparison of the predicted results involved: (i) the variable friction model based on different sliding velocities and normal loads; and (ii) three groups of constant friction coefficient, and the measured values of the actual parts. In the simulation, the size of the numerical model of the mold was consistent with the actual size. The model of the sheet material was selected as Young’s modulus E = 69.9 GPa, the Poisson’s ratio v = 0.33, and the stress-strain curve according to reference [17]. The sheet thickness (STH) of constant friction coefficients and the variable friction model are shown in Figure 11 [18,19].
It can be seen from the STH distribution prediction results that the most severe thinning occurred in the vicinity of the punch fillet. Therefore, the deep drawing forming process had the highest risk of crack failure near the punch fillet. Although the thickness distribution prediction simulations were conducted under the same forming speed and blank holder pressure conditions, the predicted results of thickness distribution for the friction coefficients 0.05, 0.1 and 0.15 were obviously different. It can be seen that the thinning was more serious with the increasing of the friction coefficient. This was mainly due to a larger friction coefficient resulting in greater friction between the sheet and the mold; thus, there was a greater force to prevent the sheet metal flowing into the cavity of the die. Under the same forming speed conditions, it was necessary to apply a greater force to the punch to bring the sheet material to flow into the cavity of the die to complete the forming of the sheet metal, which then produced more normal load and friction force at the corner of the punch and the dies. Therefore, the sheet flowing became increasingly difficult, and the thinning of the sheet metal was not fully supplemented. Eventually, with increasing friction coefficient, the thinning of sheet metal becomes increasingly serious. At the same time, it can be seen that the friction conditions and normal loads of the sheet metal forming process were relatively complicated. Therefore, the constant friction coefficient model was not suitable for a numerical simulation of sheet metal forming. The variable friction model based on sliding speed and normal load was more suitable for describing the friction characteristics of the sheet metal forming process.
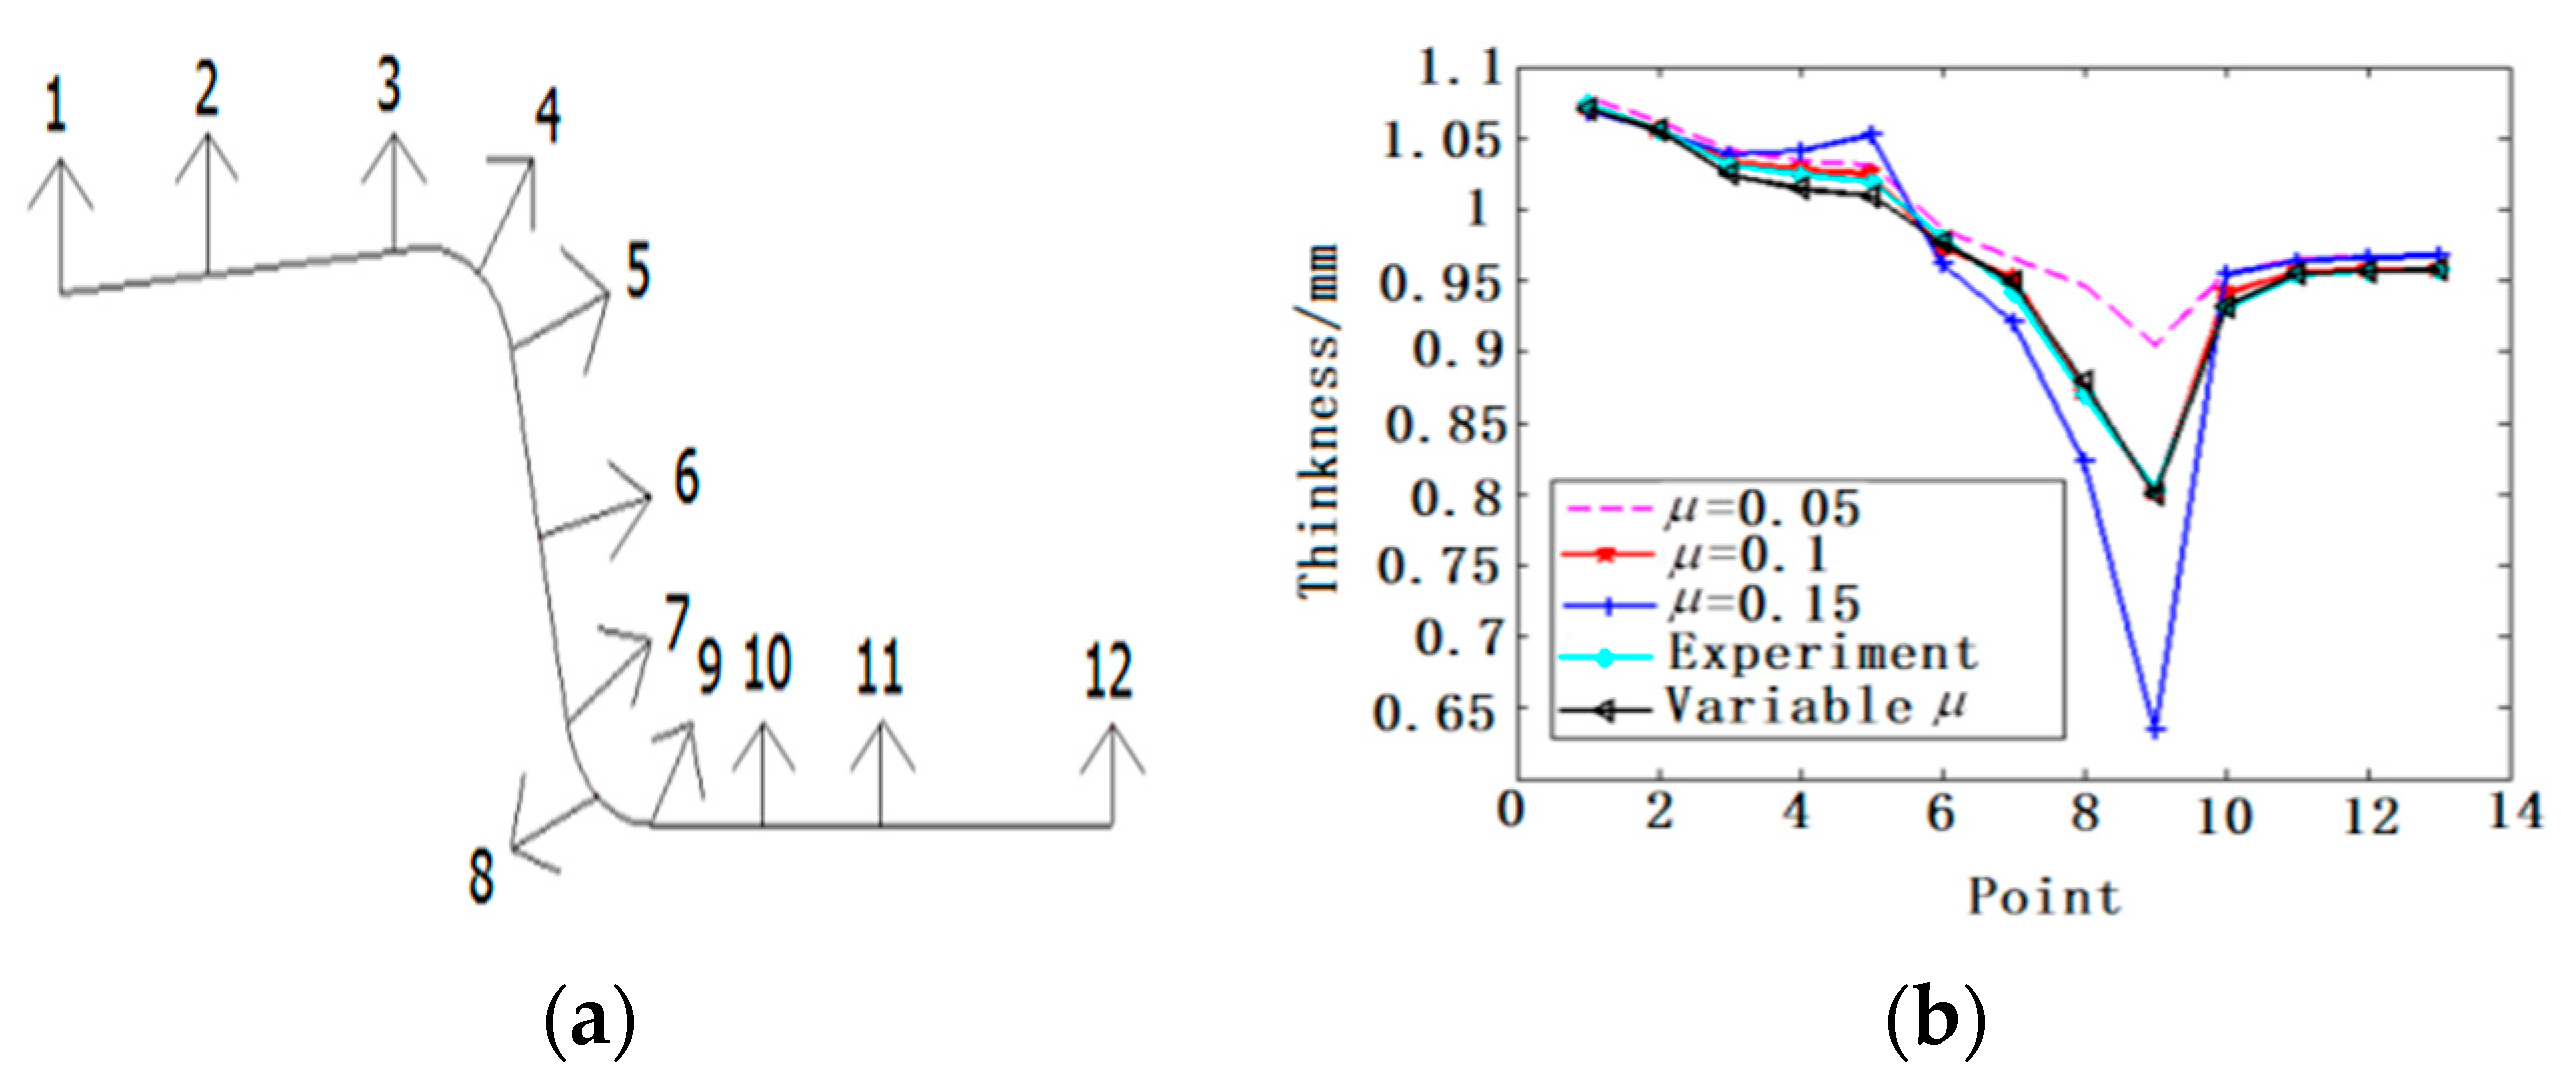
The thickness measuring point is shown in Figure 11a. The thickness value was measured by the ultrasonic thickness measuring instrument, and the thickness simulation prediction result was measured at the red node using software, as shown in Figure 12. The thickness comparison between the numerical result and actual measurements is shown in Figure 11b. From the thickness distribution comparison chart, it can be seen that the actual measured thickness and simulated prediction values were most severely thinned at measurement point 9. The maximum thinning rate of the measured values, for a constant friction coefficient of 0.1 and for the variable friction model, was about 15%. The maximum thinning rate with a constant friction coefficient of 0.05 was about 7%, and with a constant friction coefficient of 0.15 it was about 35%. Therefore, it can be preliminarily considered that the variable friction model and the constant friction coefficient of 0.1 were more suitable for describing the friction characteristics of the sheet metal forming process.
4.3. Spring-Back Distribution
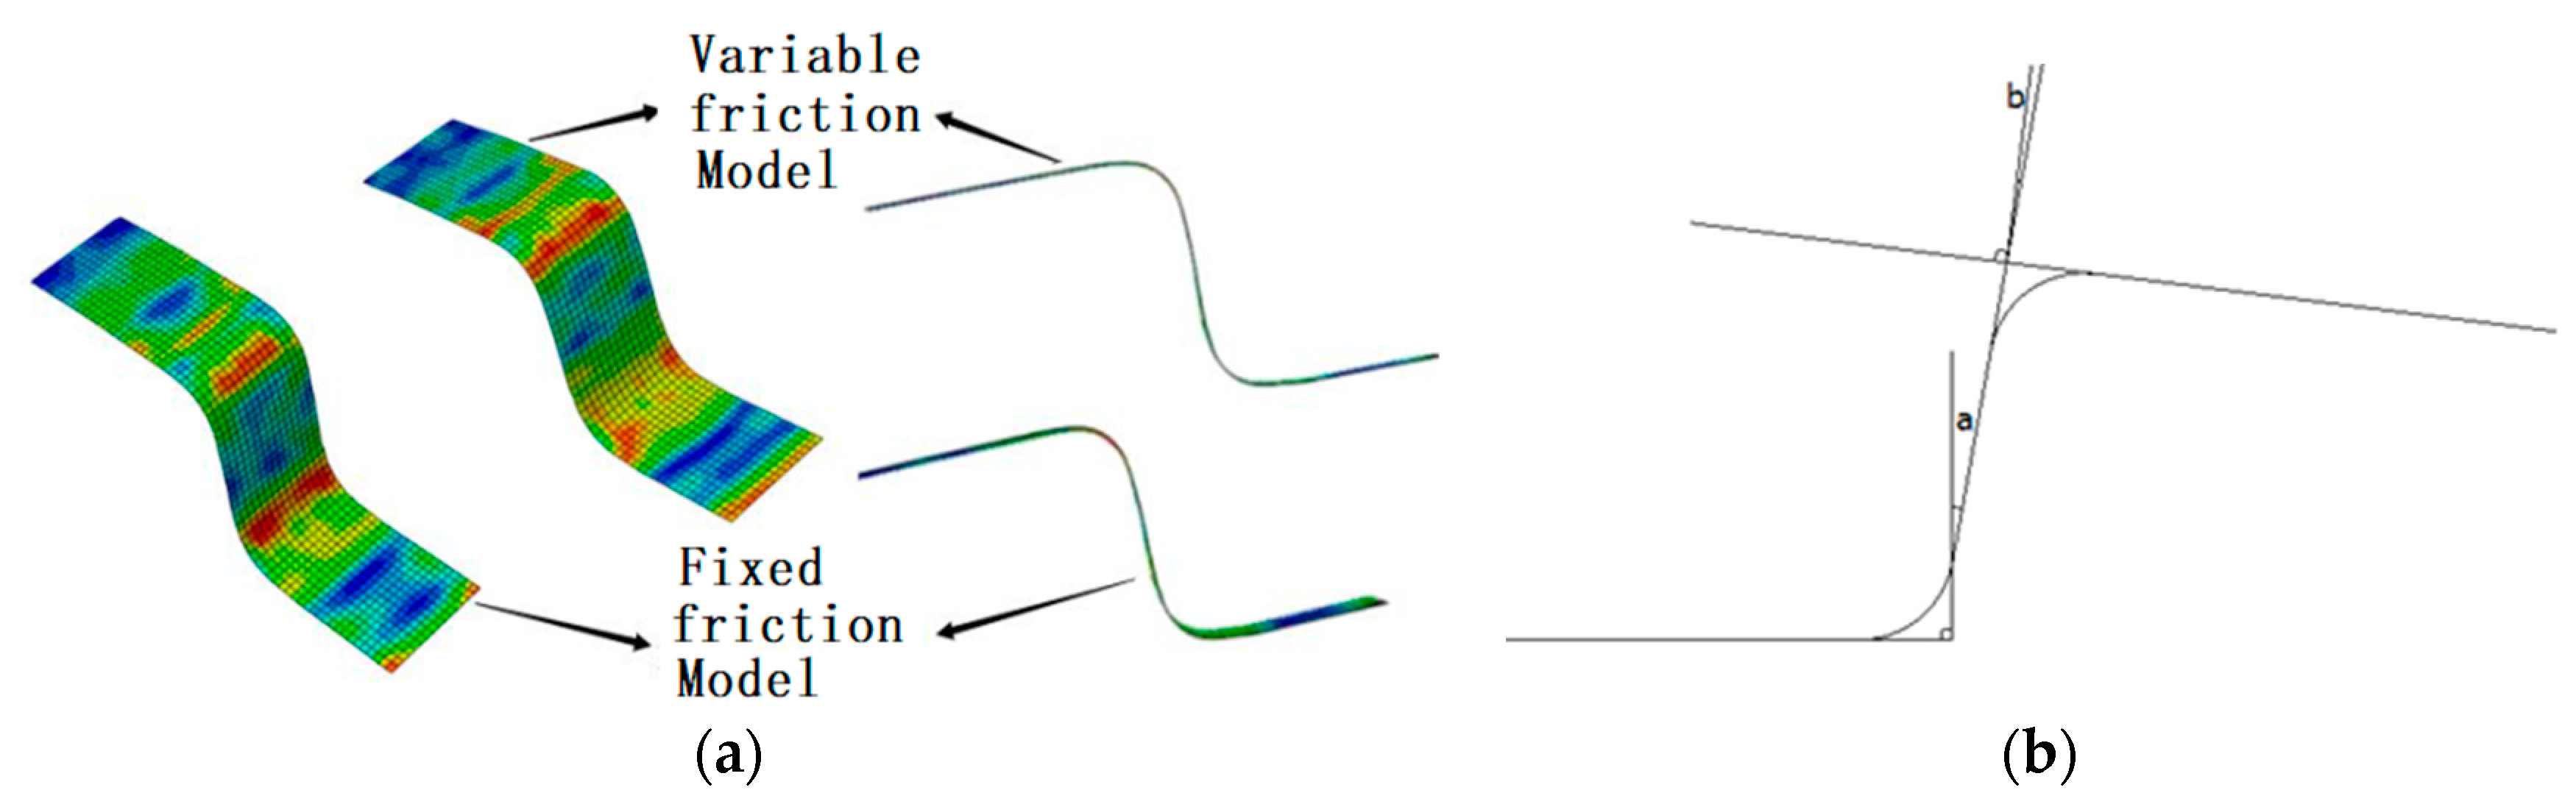
According to the simulation results of thickness distribution, this section selects a fixed friction coefficient of 0.1 and the modified friction model to predict spring-back in sheet metal forming. The average values of the two stamping tests were a = 11.2 and b = 7.8. The spring-back angle represents the amount of spring-back.
To ensure the accuracy of spring-back prediction results, an analytical step was set to remove punches, concave dies and blank holder rings after the simulation of forming with two friction coefficients. This step was taken in order to avoid the effect of force upon sheet metal affecting spring-back prediction accuracy. Figure 13 shows a comparison of the spring-back prediction results from the two friction coefficient models. The spring-back angles a1 = 8.4 and b1 = 6.3, obtained by the fixed friction coefficient model, are −25% and −19.2%, respectively, compared with the spring-back values of the actual stamping tests. The spring-back angles a2 = 12.1 and b2 = 8.3, obtained by the modified friction model, are 8% and 6.4%, respectively, compared with the actual spring-back of the stamping test. The comparison results of spring-back are shown in Table 10.
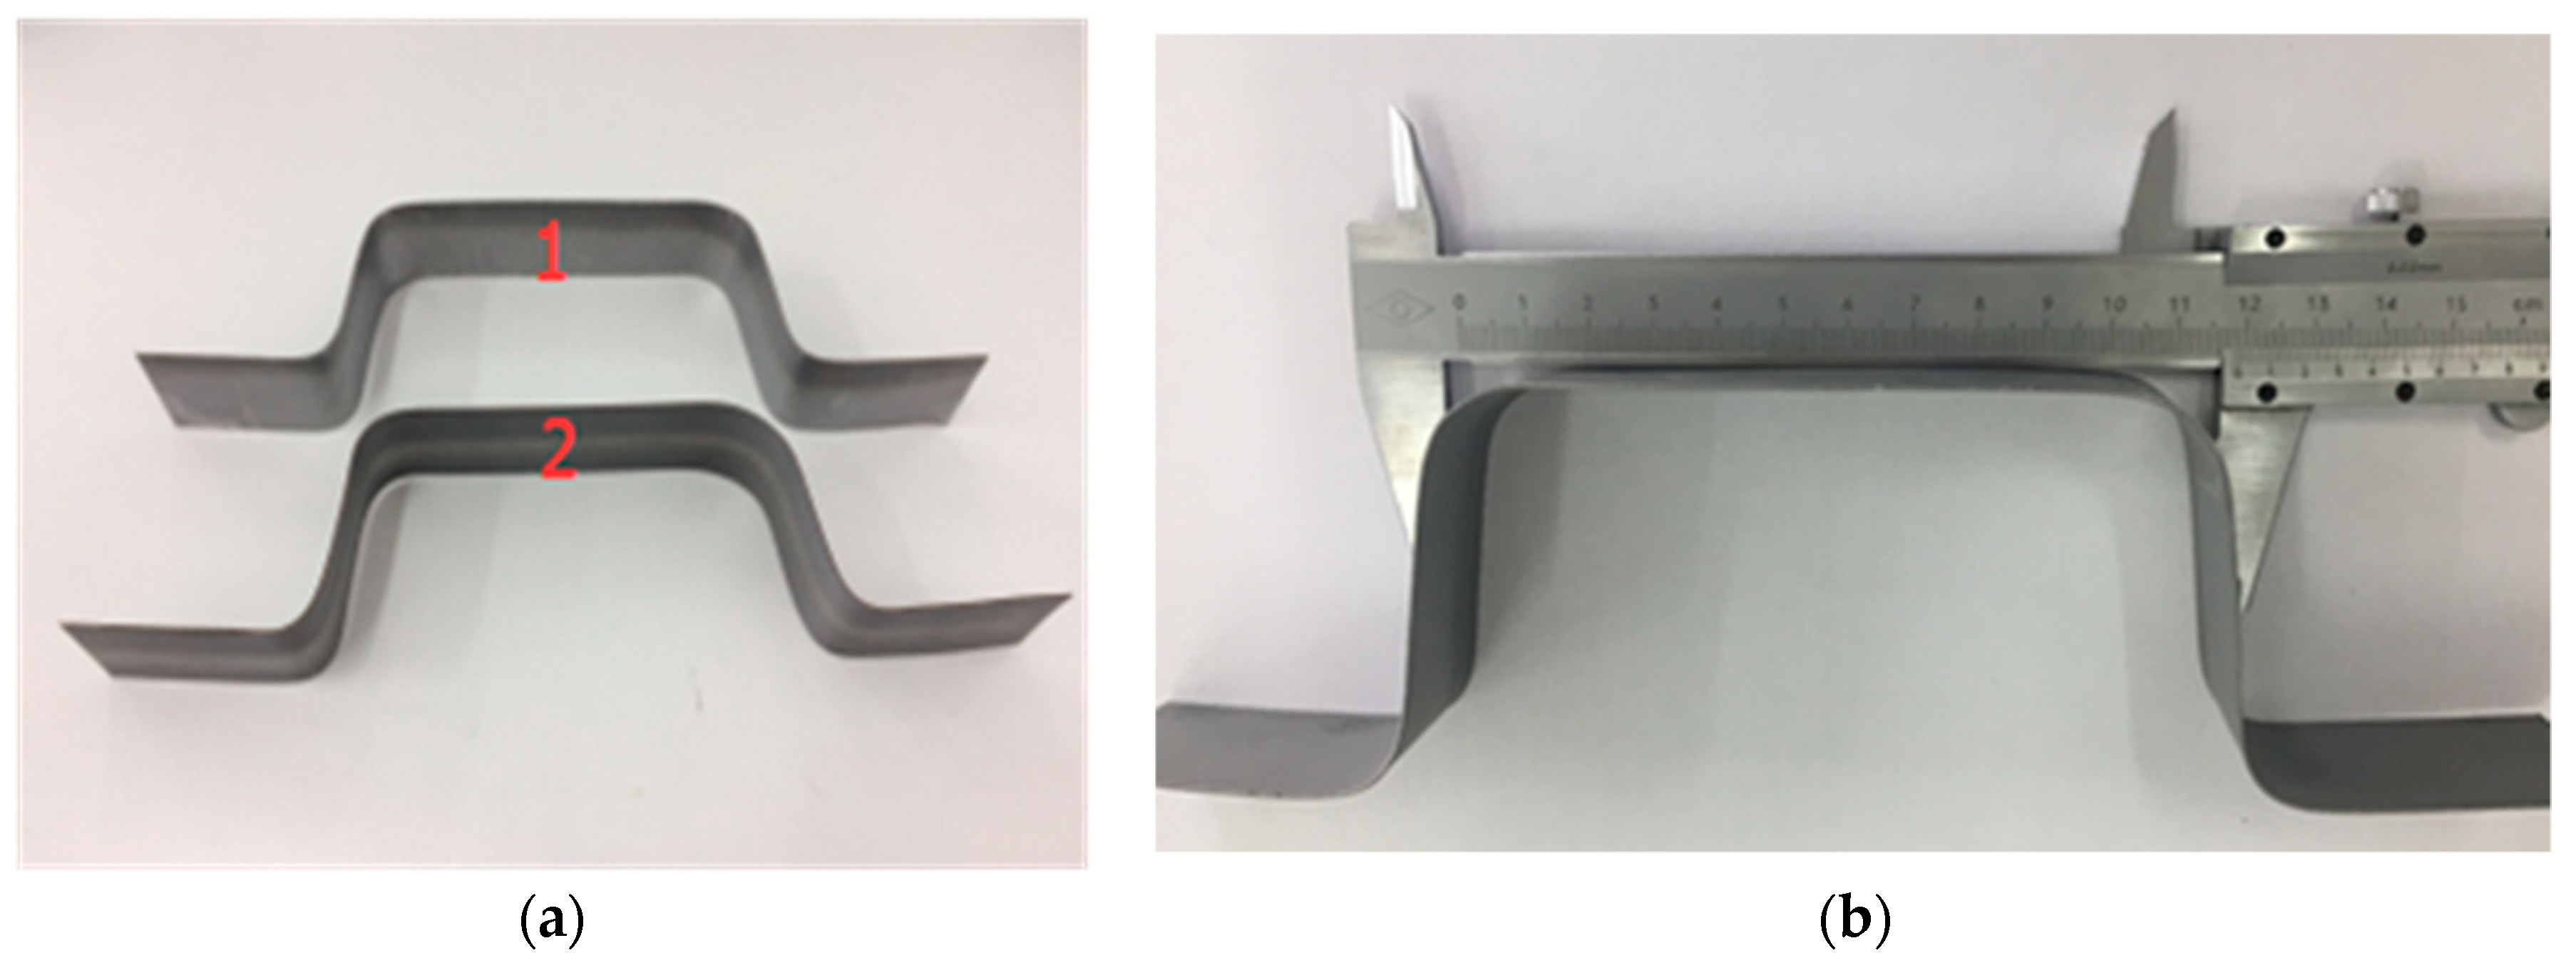
The experimental results show that the spring-back error of the model with variable friction coefficient is smaller than that of the model with constant friction coefficient, which improves the simulation accuracy. The experimental verification results are shown in Figure 14.
5. Conclusions
In this paper, the effects of the sliding velocity and normal loads on the friction characteristics between sheet metal and stamping die under the boundary lubrication condition were studied by using an MPX-2000 disc-pin friction tester. Then, the results of the friction test were used to simulate the thickness distribution and spring-back of U-bend parts. Using MATLAB software to analyze the experimental data, a variable friction model based on different sliding velocities and normal loads was established, which was more suitable for describing the friction characteristics of the sheet metal forming process. Then, the model established in this paper and three groups of constant friction coefficient were used to simulate the thickness and spring-back distribution of U-bend parts. The results allow us to draw the following conclusions:
(1) Under the boundary lubrication condition, when the sliding velocity is between 30.62 mm/s and 71.42 mm/s, the friction coefficient decreases gradually with increasing sliding velocity, and the decreasing tendency slows down in the higher sliding velocity range. When the normal load is between 0.51 MPa and 2.55 MPa, the friction coefficient decreases with an increase in the normal load. The influence of normal load on the friction coefficient gradually weakened with a gradual increase in the sliding speed.
(2) Under the boundary lubrication condition, the friction mechanism between sheet metal and stamping die is mainly ploughing wear and abrasive wear, with slight adhesive wear. The surface roughness of the sheet metal after grinding with stamping die generally increases with increasing normal load and decreasing sliding velocity.
(3) The thickness distribution and spring-back of U-bend parts, with the variable friction model and three groups of constant friction coefficient, were simulated by using ABAQUS. The thickness distribution prediction results showed the most severe thinning in the vicinity of the punch fillet. With an increasing friction coefficient, the thinning of sheet metal in the vicinity of the punch fillet becomes increasingly serious. When the thinning of the sheet metal was not fully supplemented, there was the highest risk of crack failure near the punch fillet. The thickness distribution predicted results with a constant friction coefficient of 0.1 and with the variable friction model results were more consistent with the measured values. The spring-back predicted result from the variable friction model was more accurate than that obtained when using a constant friction coefficient of 0.1. The effectiveness of the variable friction model based on sliding speed and normal load was verified.
Author Contributions
Conceptualization, J.X. and S.D.; methodology, S.D.; software, S.D.; formal analysis, J.X.; Data curation, S.D.; writing—original draft preparation, S.D.; writing—review and editing, S.D.; funding acquisition, J.X.
Funding
This research was funded by the National Natural Science Foundation of China, grant number 51505408.
Conflicts of Interest
The authors declare no conflict of interest.
References
- Isik, K.; Silva, M.B.; Tekkaya, A.E.; Martins, P. Formability limits by fracture in sheet metal forming. J. Mater. Process. Technol. 2014, 214, 1557–1565. [Google Scholar] [CrossRef]
- Ramezani, M.; Ripin, Z.M. Analysis of deep drawing of sheet metal using the Marform process. Int. J. Adv. Manuf. Technol. 2012, 59, 491–505. [Google Scholar] [CrossRef]
- Klocke, F.; Trauth, D.; Shirobokov, A.; Mattfeld, P. FE-analysis and in situ visualization of pressure slip rate and temperature dependent coefficient of friction for advanced sheet metal forming: development of a novel coupled user subroutine for shell and continuum discretization. Int. J. Adv. Manuf. Technol. 2015, 81, 397–410. [Google Scholar] [CrossRef]
- Hol, J.; Cid Alfaro, M.V.; De Rooij, M.B.; Meinders, T. Advanced friction modeling for sheet metal forming. Wear 2012, 286, 66–78. [Google Scholar] [CrossRef]
- Zhao, Y.Z.; Wang, K.; Wang, W.R. A variable friction model in sheet metal forming with advanced high strength steels DP780. J. Shanghai Jiaotong Univ. 2015, 10, 1446–1451. [Google Scholar]
- Ramezani, M.; Ripin, Z.M.; Ahmad, R. Modelling of kinetic friction in V-bending of ultra high strength steel sheets. Int. J. Adv. Manuf. Technol. 2010, 46, 101–111. [Google Scholar] [CrossRef]
- Figueiredo, L.; Ramalho, A.; Oliveira, M.C.; Menezes, L.F. Experimental study of friction in sheet metal forming. Wear 2011, 271, 1651–1657. [Google Scholar] [CrossRef]
- Ramezani, M.; Thomas, N.; Pasang, T.; Selles, M.A. Characterization of friction behaviour of AZ80 and ZE10 magnesium alloys under lubricated contact condition by strip draw and bend test. Int. J. Mach. Tools Manuf. 2014, 85, 70–78. [Google Scholar] [CrossRef]
- Tamai, Y.; Inazumi, T.; Manabe, K. FE forming analysis with nonlinear friction coefficient model considering contact pressure, sliding velocity and sliding length. J. Mater. Process. Technol. 2016, 227, 161–168. [Google Scholar] [CrossRef]
- Wang, L.G.; Zhou, J.F.; Xu, Y.T. Study on friction characteristics of galvanized sheet by strip drawing test. J. Plast. Eng. 2016, 2, 87–91. [Google Scholar]
- Wang, W.; Zhao, Y.Z.; Wang, Z. A study on variable friction model in sheet metal forming with advanced high strength steels. Tribol. Int. 2016, 93, 17–28. [Google Scholar] [CrossRef]
- Wang, P.J.; Cheng, H. Handbook of Stamping Die Designers; China Machine Press: Beijing, China, 2008; pp. 120–189. [Google Scholar]
- Wen, S.Z.; Huang, P. Tribology Principle; Tsinghua University Press: Beijing, China, 2002; pp. 35–67. [Google Scholar]
- Akbarzadeh, S.; Khonsari, M.M. Study on friction characteristics of galvanized sheet by strip drawing test. Tribol. Lett. 2010, 37, 477–486. [Google Scholar] [CrossRef]
- Varun Kumar. Summary of Surface Finish Parameters. Available online: https://www.scribd.com/document/255993260/Summary-of-Surface-Finish-Parameters (accessed on 8 May 2019).
- Gerke, S.; Zistl, M.; Bhardwaj, A.; Brünig, M. Experiments with the X0-specimen on the effect of non-proportional loading paths on damage and fracture mechanisms in aluminum alloys. Int. J. Solids Struct. 2019, 163, 157–169. [Google Scholar] [CrossRef]
- Boyer, H.E. Atlas of Stress-Strain Curves; ASM International: Metal Park, OH, USA, 2002; pp. 235–270. [Google Scholar]
- Schey, J. Tribology in Metalworking: Lubrication, Friction and Wear; American Society for Metal: Metal Park, OH, USA, 1983; pp. 125–150. [Google Scholar]
- ISO 12004-2:2008. Metallic Materials—Sheet and Strip—Determination of Forming-Limit Curves—Part 2: Determination of Forming-Limit Curves in the Laboratory; ICS: Geneva, Switzerland, 2008. [Google Scholar]
Figure 1.
Experimental device: (a) samples; (b) principle of the Disk-Pin friction test.

Figure 2.
The severe plough defect.

Figure 3.
Friction coefficient curve with different sliding velocities, with five loads.

Figure 4.
Friction coefficient curve with different loads, with five sliding velocities.

Figure 5.
Surface morphology with different loads: (a) 40.82 mm/s, 0.51 MPa; and (b) 40.82 mm/s, 2.55 MPa.
Figure 5.
Surface morphology with different loads: (a) 40.82 mm/s, 0.51 MPa; and (b) 40.82 mm/s, 2.55 MPa.

Figure 6.
Surface morphology with different velocities: (a) 1.02 MPa, 30.62 mm/s; and (b) 1.02 MPa, 71.42 mm/s.
Figure 6.
Surface morphology with different velocities: (a) 1.02 MPa, 30.62 mm/s; and (b) 1.02 MPa, 71.42 mm/s.

Figure 7.
Inverse function fitting curve.

Figure 8.
Fitting curves between m and n and the normal load: (a) fitting curve between m and the normal load; and (b) Fitting curve between n and the normal load.
Figure 8.
Fitting curves between m and n and the normal load: (a) fitting curve between m and the normal load; and (b) Fitting curve between n and the normal load.

Figure 9.
Experimental values and predicted values with (a) a constant load of 1.28 MPa and (b) a constant speed of 44.22 mm/s.
Figure 9.
Experimental values and predicted values with (a) a constant load of 1.28 MPa and (b) a constant speed of 44.22 mm/s.

Figure 10.
Numerical modeling of stamping.

Figure 11.
Sheet thickness (STH) under different friction coefficients: (a) friction coefficient of 0.05, (b) friction coefficient of 0.1, (c) friction coefficient of 0.15 and (d) variable friction model.
Figure 11.
Sheet thickness (STH) under different friction coefficients: (a) friction coefficient of 0.05, (b) friction coefficient of 0.1, (c) friction coefficient of 0.15 and (d) variable friction model.

Figure 12.
Thickness measuring points and comparison: (a) thickness measuring points; (b) thickness comparison between numerical result and actual measurements.
Figure 12.
Thickness measuring points and comparison: (a) thickness measuring points; (b) thickness comparison between numerical result and actual measurements.

Figure 13.
Comparison of spring-back with variable friction and the fixed friction model. (a) Finite Element Analysis measurement of parts; (b) measuring angle.
Figure 13.
Comparison of spring-back with variable friction and the fixed friction model. (a) Finite Element Analysis measurement of parts; (b) measuring angle.

Figure 14.
Comparison of roughcast outline: (a) actual bending parts; (b) part measurement.


Table 1.
Chemical composition of SKD11 (wt%).
| Fe | C | Si | Mn | Cr | Mo | V |
|---|---|---|---|---|---|---|
| 84.2 | 1.50 | 0.40 | 0.50 | 12.0 | 1.0 | 0.30 |
Table 2.
Average friction coefficient with different loads and sliding velocities.
| Speed (mm/s) | 30.62 | 40.82 | 51.03 | 61.23 | 71.42 | |
|---|---|---|---|---|---|---|
| Load (MPa) | ||||||
| 0.510 | 0.148 | 0.118 | 0.092 | 0.076 | 0.064 | |
| 1.019 | 0.134 | 0.106 | 0.084 | 0.069 | 0.058 | |
| 1.530 | 0.123 | 0.097 | 0.076 | 0.062 | 0.053 | |
| 2.038 | 0.109 | 0.090 | 0.071 | 0.058 | 0.049 | |
| 2.550 | 0.102 | 0.086 | 0.067 | 0.056 | 0.046 | |
| Parameter | Description | Calculation Formula |
|---|---|---|
| Ra | Average roughness = area between surface trace and average. Measured by adding or integrating absolute values of height, z (see Figure 1). | |
| Rq | Root-Mean-Square roughness ≅ 1.1 × Ra. | |
| Rp | Peak roughness = amplitude of the highest peak within the scan length. | |
| Rv | Valley roughness = amplitude of the deepest valley within the scan length. | |
| Rz | Total roughness = height difference between the highest peak and lowest valley within the scan length. |
Table 4.
Surface roughness value under boundary lubrication with different parameters.
| Process Parameters | Surface Roughness Parameters, µm | |||||
|---|---|---|---|---|---|---|
| 40.82 mm/s, 0.51 MPa | 0.148 | 0.904 | 1.388 | 2.292 | 1.349 | 0.223 |
| 40.82 mm/s, 2.55 MPa | 0.241 | 1.183 | 1.672 | 2.855 | 1.504 | 0.342 |
| 1.02 MPa, 30.62 mm/s | 0.229 | 1.060 | 1.193 | 2.253 | 1.600 | 0.310 |
| 1.02 MPa, 71.42 mm/s | 0.125 | 0.826 | 1.170 | 1.996 | 1.201 | 0.201 |
Table 5.
Results for m, n and goodness of fit with different loads.
| Normal Load (MPa) | m | n | Goodness of Fit |
|---|---|---|---|
| 0.510 | 4.811 | 1.97 | 0.9772 |
| 1.019 | 4.405 | 2.383 | 0.9752 |
| 1.530 | 4.032 | 2.802 | 0.9658 |
| 2.038 | 3.807 | 3.413 | 0.9575 |
| 2.550 | 3.611 | 3.799 | 0.9503 |
Table 6.
Ratio and error between function prediction and measured value.
| Speed (mm/s) | 30.62 | 40.82 | 51.03 | 61.23 | 71.42 | ||||||
|---|---|---|---|---|---|---|---|---|---|---|---|
| Load (MPa) | Ratio Value | Error (%) | Ratio Value | Error (%) | Ratio Value | Error (%) | Ratio value | Error (%) | Ratio Value | Error (%) | |
| 0.510 | 1.0000 | 0.00 | 0.9550 | −4.50 | 0.9888 | −1.12 | 1.0037 | 0.37 | 1.0198 | 1.98 | |
| 1.019 | 0.9903 | −0.97 | 0.9563 | −4.37 | 0.9763 | −2.37 | 0.9980 | −0.20 | 1.0235 | 2.35 | |
| 1.530 | 0.9847 | −1.53 | 0.9571 | −4.29 | 0.9902 | −0.98 | 1.0207 | 2.07 | 1.0302 | 3.02 | |
| 2.038 | 1.0283 | 2.83 | 0.9577 | −4.23 | 0.9861 | −1.39 | 1.0164 | 1.64 | 1.0391 | 3.91 | |
| 2.550 | 1.0267 | 2.67 | 0.9394 | −6.06 | 0.9814 | −1.86 | 1.0387 | 3.87 | 1.0420 | 4.20 | |
Table 7.
Ratio between function prediction and measured value, when loading (P) = 1.28 MPa.
| Velocity (mm/s) | Friction Coefficient (Measured Value) | Friction Coefficient (Function Prediction) | Error (%) |
|---|---|---|---|
| 30.62 | 0.1280 | 0.1264 | −1.25 |
| 40.82 | 0.0980 | 0.0967 | −1.33 |
| 51.03 | 0.0787 | 0.0783 | −0.51 |
| 61.23 | 0.0645 | 0.0658 | 2.20 |
| 71.42 | 0.0552 | 0.0568 | 2.90 |
Table 8.
Ratio between function prediction and measured value, when velocity (v) = 44.22 mm/s.
| Loading (MPa) | Friction Coefficient (Measured Value) | Friction Coefficient (Function Prediction) | Error (%) |
|---|---|---|---|
| 0.510 | 0.1060 | 0.1044 | −1.51 |
| 1.019 | 0.095 | 0.0940 | −1.05 |
| 1.530 | 0.0860 | 0.0861 | 0.12 |
| 2.038 | 0.0799 | 0.0800 | 0.13 |
| 2.550 | 0.0739 | 0.0751 | 1.62 |
Table 9.
Physical properties of materials.
| Density (g/cm3) | Young’s Modulus (GPa) | Poisson Ratio |
|---|---|---|
| 2.72 | E = 69.9 | v = 0.33 |
Table 10.
Comparison of experimental and simulated results.
| Spring-Back Value | a (mm) | b (mm) |
|---|---|---|
| Experimental data | 11.2 | 7.8 |
| Fixed friction model data (0.1) | 8.4 | 6.3 |
| Variable friction model | 12.1 | 8.3 |
© 2019 by the authors. Licensee MDPI, Basel, Switzerland. This article is an open access article distributed under the terms and conditions of the Creative Commons Attribution (CC BY) license (http://creativecommons.org/licenses/by/4.0/).
Share and Cite
MDPI and ACS Style
Dou, S.; Xia, J. Analysis of Sheet Metal Forming (Stamping Process): A Study of the Variable Friction Coefficient on 5052 Aluminum Alloy. Metals 2019, 9, 853. https://doi.org/10.3390/met9080853
AMA Style
Dou S, Xia J. Analysis of Sheet Metal Forming (Stamping Process): A Study of the Variable Friction Coefficient on 5052 Aluminum Alloy. Metals. 2019; 9(8):853. https://doi.org/10.3390/met9080853
Chicago/Turabian StyleDou, Shasha, and Jiansheng Xia. 2019. "Analysis of Sheet Metal Forming (Stamping Process): A Study of the Variable Friction Coefficient on 5052 Aluminum Alloy" Metals 9, no. 8: 853. https://doi.org/10.3390/met9080853
Note that from the first issue of 2016, this journal uses article numbers instead of page numbers. See further details here.