A new Dynamic Plasticity and Failure Model for Metals

CAS Key Laboratory for Mechanical Behavior and Design of Materials, University of Science and Technology of China, Hefei 230027, China
*
Author to whom correspondence should be addressed.
Metals 2019, 9(8), 905; https://doi.org/10.3390/met9080905
Submission received: 28 July 2019
/
Revised: 15 August 2019
/
Accepted: 16 August 2019
/
Published: 18 August 2019
Abstract
:A new plasticity and failure model is developed herein for metallic materials subjected to dynamic loadings on the basis of the analysis of some available material test data and previous work. The new model consists of two parts: a strength model and a failure criterion. The strength model takes into consideration both tension and shear stress-strain relationships, as well as the effect of Lode angle, while the failure criterion takes into account both the effects of stress triaxiality and Lode angle. Furthermore, the effects of strain rate and temperature are also catered for in the model. In particular, new non-linear functions are suggested for the effects of strain rate and temperature in the strength model in order to describe accurately the mechanical behavior of metallic materials at very high loading rates and temperature. The new model is compared with available material test data for 2024-T351 aluminum alloy, 6061-T6 aluminum alloy, oxygen free high conductivity (OFHC) copper, 4340 steel, Ti-6Al-4V alloys, and Q235 mild steel in terms of stress–strain curves in both tension and shear, strain rate effect, temperature effect and fracture under different loading conditions. The new model is also compared with the JC constitutive model with the respective JC and BW fracture criteria by conducting numerical simulations of quasi-static smooth and notched bar tensile tests and ballistic perforation tests on 2024-T351 aluminum alloy in terms of cup and cone failure pattern, ballistic limit, residual velocity and failure mode. It transpires that the new plasticity and failure model can be used to predict the response and failure of metallic materials and structures under different loading conditions. It also transpires that the new model is advantageous over the existing models.
1. Introduction
Numerical simulations have been increasingly widely used in the study of the response of metallic structures under projectile impact or explosive loadings due to rapid advancement in both computers and computing technologies. Hence, it is essential to develop a dynamic plasticity (constitutive) and failure model for metallic materials. The model must satisfy the following three criteria: firstly, it must be able to accurately describe the dynamic behaviors of materials under different loading conditions in terms of true stress-true strain relationships at different strain rates and temperatures; secondly, it must be capable of predicting failure patterns of samples and structures both under quasi-static and impact loadings such as cup and cone pattern observed in smooth bar tension tests, as well as shear plugging and petalling failure in ballistic tests; and finally, it must be predictive, rather than postdictive, which means that the values of all the parameters in the model should be determined by laboratory material tests before it is employed in numerical simulations.
The Johnson-Cook (JC) constitutive model [1] and failure criterion [2] have been widely used in numerical simulations due to their relatively simple forms. The JC constitutive model [1] can describe the effects of strain hardening, strain rate and temperature softening. On one hand, the term of strain rate effect in the model takes a linear function of the logarithm of strain rate which may not be adequate to describe the strain rate sensitivity of metals as noted by Borvik et al. [3,4] and others [5,6]. Borvik et al. [3,4] proposed a version of the JC constitutive model by modifying the term of strain rate effects, as it approaches negative infinity when strain rate gets very small. Khan and coworkers [5,6] also proposed a more complicated version of the JC constitutive model on the basis of the discussion of some test data for 2024-T351 aluminum alloy and Ti-6Al-4V alloy. On the other hand, the thermal term in the JC constitutive model is expressed by a power law function and many other researchers tried to modify it in order to get more satisfactory results as compared to test data for metals at elevated temperatures [7,8]. Meyers et al. [7] suggested an exponential function to replace the thermal softening term while Guo et al. [8] modified it slightly by putting a coefficient before the dimensionless temperature in the JC constitutive model.
The JC failure criterion [2] is a function of hydrostatic pressure (stress triaxiality), strain rate and temperature which shows that the material ductility decreases with increasing stress triaxiality. However, Bao and Wierzbicki [9] found in their experiments that material ductility does not always decrease with increasing stress triaxiality. Subsequently, Wierzbicki and coworkers [10,11,12] assessed the effectiveness and accuracy of seven fracture criteria for metallic materials and suggested fracture criteria in various forms which considered the effects of Lode angle as well as stress triaxiality. Many other authors [13,14,15] have also studied the problem of ductile fracture of metals. Clausen et al. [13] proposed a plasticity and failure model by adding the third deviatoric invariant both in the JC constitutive model and failure criterion, while Erice and Gálvez [14] furthered the investigation by proposing a constitutive model coupled with the elastoplastic–failure law and a Lode angle-dependent failure criterion. Zhou and Wen [15] proposed a new approach that caters for the effects of both stress triaxiality and Lode parameter to predict the failure of metallic materials. Only two laboratory tests, the smooth bar tension test and the pure shear test, are needed to calibrate the failure criterion. It transpires that the failure criterion is in good agreement with the test data for various metals under different loading conditions.
More recently, Zhou et al. [16] carried out a critical assessment on the accuracy of the JC constitutive model and failure criterion by comparing them with the test data for various metals such as 2024-T351 aluminum alloy, 6061-T6 aluminum alloy, OFHC copper, 4340 steel, Ti-6Al-4V alloys and Q235 mild steel. It was found that the JC constitutive model was suitable for Mises materials at quasi-static to intermediate strain rates and low to moderate temperatures; and that the agreement between the model predictions and the test results are poor for non-Mises materials in terms of shear stress-shear strain curve and fracture strain. It was also found that the accuracy of the JC constitutive model decreases with increasing strain rate, temperature and, above all, it fails to produce consistent results at high strain rates when the experimentally obtained dynamic increase factors (DIF) are employed in the calculations implying the form of the model’s equation (namely, quasi-static stress-strain curve multiplied by DIF) may be inadequate at least for the scenarios where high strain rates are involved.
All the models discussed above are phenomenological in nature. Langer et al. [17,18,19,20] studied the mechanical behavior of metals such as Aluminum, Fe-30% Ni austenitic alloy, Cu and HY-100 steel alloy at different strain rates and temperatures by using statistical-thermodynamic dislocation theory. It was shown that the statistical-thermodynamic dislocation model correlates well the experimentally obtained stress-strain curves and that adiabatic shear phenomenon in HY-100 steel leads to abrupt stress drops indicating thermal softening effects are important. Later on, Le and Piao [21,22,23,24] further developed the thermodynamic dislocation theory for non-uniform plastic deformations. It was found that the theoretical predictions are in good agreement with the experimental data for various dynamic tension/compression, torsion, and simple shear tests for aluminum.
The objective of this paper is to develop a new plasticity and failure model for metallic materials subjected to impact loadings on the basis of the analysis of some available material test data and the previous work. The model, which is phenomenological in nature, is composed of a strength model and a failure criterion and the strength model takes into account the effects of strain hardening, Lode angle, strain rate and temperature while the failure criterion caters for the effects of stress triaxiality, Lode angle, strain rate and temperature. In particular, new non-linear functions are proposed for the effects of strain rate and temperature in the strength model in order to describe accurately the mechanical behavior of metallic materials at very high loading rates and temperature. Firstly, the details of the construction of the new plasticity and failure model are presented; secondly, the newly developed plasticity and failure model are compared with some available test data for 2024-T351 aluminum alloy, 6061-T6 aluminum alloy, OFHC copper, 4340 steel, Ti-6Al-4V alloys and Q235 mild steel. Thirdly, the new model is further verified by a single element simulation approach and validated against the experimental results for 2024-T351 aluminum alloy smooth and notched tension bar tests, as well as the ballistic tests. Fourthly, comparisons are made between the newly developed plasticity and failure model and the existing models (JC constitutive model together with JC failure criterion or BW fracture criterion) by employing 2024-T351 aluminum alloy smooth and notched tension bar tests in terms of failure pattern (cup and cone), as well as ballistic tests in terms of residual velocity and failure mode.
2. Development of a New Dynamic Plasticity and Failure Model
The new plasticity and failure model consists of a strength model and a failure criterion, which will be formulated in Section 2.1 and Section 2.2, respectively. The main new contributions of the present plasticity and damage model lie in the following areas: (i) a modified version of the dynamic increase factor (DIF) will be suggested to describe the strain rate effects for metals that cover a wide range of strain rates; (ii) the strain rate effects for metals at different plastic strains are different, although they have not been differentiated previously by researchers, and this problem will be tackled by introducing a new equation that shows that the strain rate effects for metals at different plastic strains are related to each other, namely, that the DIF describing the strain rate effect at one plastic strain can be determined by the DIFx representing the strain rate effect at another plastic strain (); (iii) a new term for the temperature effect in the strength model will be proposed, which can accurately describe the thermal softening of metals especially at relatively high temperatures; (iv) new forms of constitutive equation and failure criterion will be suggested which can describe the constitutive behavior and rupture of metals under different loading conditions.
2.1. Strength Model
On the basis of the analysis of some material test data and previous work, a strength model is developed in this section which takes into consideration the effects of strain hardening, Lode angle, strain rate and temperature. Firstly, a quasi-static constitutive relation for metallic materials under different loading conditions at room (ambient) temperature is presented which defines equivalent stress as a function of equivalent plastic strain and Lode parameter . Secondly, a dynamic constitutive equation is formulated through the modification of the quasi-static relation by considering the effect of strain rate which is described by a new function of dynamic increase factor (DIF). Thus, the equivalent stress will be a function of strain rate as well as equivalent plastic strain and Lode parameter Thirdly, the dynamic constitutive equation is further modified by taking into account the effect of temperature which is represented by an exponential function of dimensionless temperature () with , being current temperature and reference temperature (usually taken as melting temperature), respectively. Hence, a strength model can be constructed, and the details of its construction are given in the following.
2.1.1. Quasi-Static True Stress-True Strain Relationship
It was observed experimentally [16] that the quasi-static true stress–true strain curves, both in tension and shear for 2024-T351 aluminum alloy [25], 6061-T6 aluminum alloy [26,27], OFHC copper [28,29,30,31], 4340 steel [1], Ti-6Al-4V alloys [6,32,33] and Q235 mild steel [8,34], are not identical, implying that the mechanical behavior of these six materials does not obey the von Mises flow rule and its associated flow rule. In other words, the mechanical behavior of these examined metals is sensitive to the state of stress. Based on the previous studies [13,15], a constitutive relation is suggested for metallic materials under quasi-static loading conditions at room (ambient) temperature, viz.
where and are defined as equivalent stress, equivalent plastic strain and Lode parameter, respectively. are constants to be determined from the quasi-static true stress–true strain curve in tension. is the ratio of the equivalent stress in shear () to that in tension (), which is defined as follows:
where are constants to be determined from the quasi-static true stress-true strain curve in pure shear.
The Lode parameter represents the normalized third invariant that can be expressed as [10,13,15]
where are the second and third invariants of the deviatoric stress tensor that can be defined as and , and are mean and equivalent stresses that can be expressed as and , respectively with , and being principal stresses. The Lode parameter is related to the Lode angle on the π plane through and the range of the Lode angle is . Hence, takes values of .
As can be seen from Equation (1), the constitutive relation can describe the mechanical behavior of metals under different loading conditions (stress states). For uniaxial tensile test (namely, or ), Equation (1) reduces to and for the pure shear test (namely, or ), Equation (1) reduces to .
2.1.2. Strain Rate Effect
Strain rate effects play an important role in the construction of a constitutive model, and dynamic increase factor (DIF) can be employed to characterize the rate sensitive behavior of materials.
As noted by Zhou and Wen [16], there are two essential points concerning the strain rate effects of metals which are either not seriously considered or ignored completely by researchers when they formulate a constitutive model for metals. The first point is that the dynamic increase factor (DIF) is a linear function of for low to intermediate strain rates (usually less than ) and for higher strain rates (usually greater than ) the DIF increases rapidly with increasing strain rate as observed experimentally [16]; the second point is that the test data for the DIF (dynamic stress) have often been taken at different plastic strains by different researchers. For example, DIF at a plastic strain of 0.075 for 2024-T351 [25], DIF at a plastic strain corresponding to UTS for 6061-T6 [27,35], DIF at a plastic strain of 0.05 both for 4340 steel [1] and Ti-6Al-4V alloy [6,33], DIF at a plastic strain of 0.15 for OFHC copper [1,28,29,30,36] and DIF at yield stress for Q235 mild steel [8]. Generally speaking, the strain rate effects in terms of DIF for a particular material at different plastic strains are different, as observed experimentally by Campbell and Cooper [37] and highlighted by Jones [38] for mild steel and by Chen et al. [39] for 45 steel. In other words, the experimentally determined dynamic increase factors (DIF) according to different plastic strains can lead to different results. Hence, the choice of DIF at different plastic strains may add further uncertainty to the accuracy of the constitutive models for metals such as the JC model as pointed out by Zhou and Wen [16].
To account for the strain rate effect, a new form of the dynamic constitutive equation is proposed which can be written in the following form
where DIF in Equation (4) is the dynamic increase factor at zero plastic strain and DIF can be derived from that (DIFx) at a specific plastic strain () (for the details of its derivation and discussion, see Appendix A), namely
in which DIFx can be estimated by the following expression which is a slightly modified version of that given in references [40,41,42,43,44,45,46]
where and are material constants to be determined from material dynamic tests; is the reference strain rate, usually taken to be ; is the strain rate used in the quasi-static material tensile or compressive tests which is usually less than .
2.1.3. Temperature Effect
Temperature effect is also very important in the situations where high strain rates, large plastic strains are involved which can lead to temperature rise due to (quasi) adiabatic conditions. On the basis of the analysis of available test data for different metals [16] and previous work [7], an exponential function of the dimensionless temperature () is suggested to cater for the effect of temperature. Hence, Equation (4) can be rewritten as
after the temperature effect is taken into consideration. In Equation (7), is dimensionless temperature with ; is the current temperature, is the ambient (room) temperature and is the reference temperature, usually taken as the melting temperature; and are two constants to be determined from material tests at elevated temperatures.
In summary, Equation (7) is the new strength model, which takes into account the effects of strain hardening, Lode angle, strain rate and temperature.
2.2. Failure Criterion
A new failure criterion for metallic materials that caters for the effects of stress triaxiality and Lode parameter has been proposed recently by the authors [15] and, due to the limitation of space, its derivation will not be repeated here and interested readers are referred to reference [15] for more details. The new failure criterion can be expressed as [15]
where is failure strain, is stress triaxiality which can be defined as , is Lode parameter, are constants to be determined from laboratory material tests such as smooth bar tension test and pure shear test. For the smooth bar tension test, the Lode parameter and the experimentally obtained true fracture strain is and its corresponding stress triaxiality is . Substituting these values into Equation (8) and rearranging gives . Similarly, for pure shear test, the Lode parameter and the experimentally obtained critical shear strain is , and its corresponding stress triaxiality can be approximated as . Substituting these values into Equation (8) and rearranging gives .
The effects of strain rate and temperature also play a very important part in the fracture of metallic materials and they must be taken into consideration [2,3,13]. Combining Equation (8) and the terms for the effects of strain rate and temperature by Johnson and Cook [2], one obtains
where are constants to be determined from material tests. It can be seen from Equation (9) that the failure strain of a metallic material is an explicit function of stress triaxiality, Lode angle, strain rate and temperature.
2.3. Determination of the Values of Various Parameters
Values of various parameters of the present new dynamic plasticity and failure model for metals developed in Section 2.1 and Section 2.2 can be determined through the following various material tests.
- (1)
- Quasi-static smooth bar tension tests at ambient (room) temperature are conducted to determine the values of the parameters in the strength model (Equation (1) and Equation (7)); pure (tubular torsion) shear tests at ambient (room) temperature are performed to determine the values of the parameters in Equation (2), and hence the value of the parameter in the strength model (Equation (7)); the values of the parameters in the failure criterion (Equation (9)) can also be determined from the quasi-static tension and shear tests.
- (2)
- Quasi-static (smooth bar) tension/compression, SHTB/SHPB and plate impact tests are performed to determine the values of the parameters and in Equation (6) for the strain rate effects in the strength model (Equation (7)) and the value of the parameter in the failure criterion (Equation (9)).
- (3)
- Quasi-static (smooth bar) tension/compression tests at different temperatures are carried out to determine the values of the parameters and in the strength model (Equation (7)) and the value of the parameter in the failure criterion (Equation (9)).
3. Verification of the New Dynamic Plasticity and Failure Model
The usefulness and accuracy of the new plasticity and failure model developed in Section 2 will be demonstrated in the following ways: first, by comparing the present model predictions with some available test data; second, by employing it in the numerical simulations of the material behavior in terms of stress-strain relationship and fracture pattern (i.e., cup and cone), as well as ballistic perforation in terms of residual velocity and perforation mode (namely, shear plugging and petalling).
3.1. Comparison with Some Available Material Test Data
To verify the present model comparisons are made between the model predictions and the test data for 2024–T351 aluminum alloy [10,25], 6061–T6 aluminum alloy [26,27,35,47], OFHC copper [1,28,29,30,31,36], 4340 steel [1,2,48], Ti-6Al-4V alloys [6,32,33,49] and Q235 mild steel [8,34,50] in terms of true stress–true strain relationships, strain rate effects, temperature effects and failure. The reasons for selecting these six materials are two-fold: their material test results are more complete, and they are widely used in various industries. The values of various parameters in the new model are listed in Table 1.
3.1.1. Quasi-Static True Stress-True Strain Curves
Figure 1 shows the quasi-static true stress–true strain curves both in tension and shear for 2024-T351 aluminum alloy [25], 6061-T6 aluminum alloy [26,27], OFHC copper [28,29,30,31], 4340 steel [1], Ti-6Al-4V alloys [6,32,33] and Q235 mild steel [8,34]. The values of and are listed in Table 1. It is clear from Figure 1 that the theoretically predicted true stress-true strain curves both in tension and shear for these six materials are in good agreement with the experimental results. It is also clear from Figure 1 that the true stress-true strain curves both in tension and shear for these six materials are not identical implying that they are non-Mises materials. It should be mentioned here that JC constitutive model has failed to capture this phenomenon as it does not take into consideration the effects of Lode angle as noted in references [13,16].
3.1.2. Strain Rate Effects
Figure 2, Figure 3, Figure 4, Figure 5, Figure 6 and Figure 7 show comparisons of the present model predictions (Equations (6) and (7)) with the test data for 2024–T351 aluminum alloy [25], 6061-T6 aluminum alloy [27,35], OFHC copper [1,28,29,30,36], 4340 steel [1,48], Ti-6Al-4V alloys [6,33] and Q235 mild steel [8]. The values of and are given in Table 1. It is evident from Figure 2a, Figure 3a, Figure 4a, Figure 5a, Figure 6a and Figure 7a that the theoretically predicted relationships between the dynamic increase factor (DIF) and the strain rate for these six materials are in good agreement with the experimental results; that the DIF curve in the present model consists of three stages, namely, the first slowly increasing stage for quasi-static to intermediate strain rates, the second rapidly ascending stage and the final slowly increasing stage for very high strain rates. It is also evident from Figure 2a, Figure 3a, Figure 4a, Figure 5a, Figure 6a and Figure 7a that the dynamic increase factor (DIF) is a nearly linear function of strain when strain rate is less than approximately , which forms the basis of the strain rate term in most of the existing constitutive models for metals, such as the JC constitutive model.
It is also evident from Figure 2b,c and Figure 3b, Figure 4b, Figure 5b, Figure 6b and Figure 7b that the theoretically predicted true stress-true strain relationships correlate well with the experimental observations for these six materials at different strain rates. It should be mentioned here that the JC constitutive model cannot predict correctly the true stress–true strain curves for metals at very high strain rates, as it is incapable of describing the rapid ascending stage as discussed above and noted by Zhou et al. in reference [16].
3.1.3. Temperature Effects
Figure 8, Figure 9, Figure 10, Figure 11, Figure 12 and Figure 13 show comparisons of the present model predictions (Equation (7)) with the test data for 2024-T351 aluminum alloy [25], 6061-T6 aluminum alloy [27], OFHC copper [28,30], 4340 steel [1], Ti-6Al-4V alloys [6] and Q235 mild steel [8]. The values of and are given in Table 1. In this paper, ratio of (yield) stress at elevated temperature to that at ambient (room) temperature () is normally employed to characterize the effect of temperature on the behavior of metallic materials. It can be seen from Figure 8a, Figure 9a, Figure 10a, Figure 11a, Figure 12a and Figure 13a that the theoretically predicted relationship between the value of and the dimensionless temperature for these six materials are in good agreement with the experimental results. It can also be seen from Figure 8b, Figure 9b, Figure 10b, Figure 11b, Figure 12b and Figure 13b that the theoretically predicted true stress-true strain relationships for these six materials at different temperatures are in good agreement with the experimental results. It is noteworthy that the JC constitutive model describes well the true stress-true strain curves for these six materials at low and intermediate temperatures (i.e., less than 0.5 approximately) and fails to do so for these materials (namely, 2024-T351 aluminum alloy, 6061-T6 aluminum alloy, OFHC copper and Q235 steel) at higher temperatures [16].
3.1.4. Failure Criterion
Figure 14 shows comparisons of the present model predictions (Equation (9)) with the test data for the rupture of 2024-T351 aluminum alloy [10], 6061-T6 aluminum alloy [47], OFHC copper [2], 4340 steel [2], Ti-6Al-4V alloys [49] and Q235 mild steel [50]. The values of and are given in Table 1. The solid and broken lines represent Lode parameters of (axisymmetric stress state) and (plane strain state) respectively, the chain–dotted lines indicate the fracture loci for the plane stress state describing by the expression [10,11,12]. It is apparent from Figure 14 that the present model predictions are in good agreement with the experimental results. It is also apparent from Figure 14 the fracture strain generally does not decrease monotonically with increasing stress triaxiality for various metals as it is a function of both stress triaxiality and Lode parameter. Furthermore, as can be seen from Figure 14 that the shear fracture strain is lower than the tension fracture strain for 2024-T351 aluminum alloy, 6061-T6 aluminum alloy, 4340 steel, Ti-6Al-4V alloys and Q235 mild steel while the shear fracture strain is larger than the tension fracture strain for OFHC copper. In other words, metallic materials can be divided into two categories [15], namely, metals with and metals with , here and are the two parameters defined as the true strains at stress triaxiality of for Lode parameters of (axisymmetric stress state) and (plane strain state), respectively.
3.2. Numerical Results
To further verify the new plasticity and failure model developed in Section 2, the new model was implemented in the commercial hydrocode LS-DYNA, and numerical simulations/tests were carried out using a single element simulation approach (uniaxial tension and pure shear) and the finite element method (smooth and notched tension bar tests, as well as ballistic tests) by comparing the numerical results with the experimental observations for 2024-T351 aluminum alloy in terms of true stress-true strain relationship, failure pattern (cup and cone), residual velocity and perforation mode. Moreover, comparisons are also made between the newly developed plasticity and failure model and the existing models (JC constitutive model together with JC failure criterion or BW fracture criterion) with regard to failure pattern (cup and cone), residual velocity and perforation mode (shear plugging and petalling).
3.2.1. Single Element Approach
To demonstrate the quasi-static behavior of the present constitutive model and failure criterion, numerical tests were conducted to evaluate the true stress-true strain relationships for metals under different loading conditions. The numerical tests were carried out using a single element simulation approach. These loading conditions include uniaxial tensile and pure shear. Numerical results using the present plasticity and failure model for metals were compared with the test data for 2024-T351 aluminum alloy [25]. Figure 15 shows the comparison of the present model predictions with the experimentally obtained true stress–true strain curves for 2024-T351 aluminum alloy in tension and pure shear tests. As can be seen from Figure 15, good agreement was found between the present model predictions and the test results.
3.2.2. Smooth and Notched Bar Tension Tests
To further verify the accuracy of the new plasticity and failure model, numerical simulations were performed for 2024-T351 aluminum alloy smooth and R12 notched round bar quasi-static tensile tests at room temperature, with an emphasis being placed upon failure pattern (cup and cone). Comparisons were made between the present model predictions, the numerical results from some existing models (namely, JC constitutive model together with JC failure criterion or BW fracture criterion), and the experimental observations [51,52]. The diameter and length of the gauge section in the smooth round specimens were 9 mm and 25.4 mm, respectively. The diameter of the minimum cross section in the notched specimens was 8 mm and the radius of the notch was 12 mm. Figure 16 shows the finite element model, and the element mesh sizes of the smooth and R12 notched round bar specimens were 0.12 mm × 0.12 mm × 0.2 mm and 0.16 mm × 0.16 mm × 0.24 mm, respectively. Due to symmetry boundary conditions in the X–Z plane and Y–Z plane, only a quarter of the bar specimen is modeled, to save computing time. The values of various parameters employed in the JC constitutive model and the JC failure criterion and BW fracture model were obtained by Rodriguez-Millan et al. [53] for 2024-T351 aluminum. The values of various parameters used in the present plasticity and failure model for 2024-T351 aluminum are listed in Table 1.
Figure 17 shows comparisons of the numerically predicted true stress-true strain curves with the experimentally obtained curve for the 2024-T351 aluminum alloy smooth round bar tensile test at room temperature [52]. It is clear from Figure 17 that the present model and the JC constitutive model, together with either the JC failure criterion or the BW fracture criterion, produce similar results, which are found to be in good agreement with the experimental data.
Figure 18 shows comparisons between the numerically predicted failure patterns and the experimental observation for the 2024–T351 aluminum alloy smooth round bar tensile test at room temperature [52]. It is evident from Figure 18a that the present model predictions are in good agreement with the experimentally observed cup and cone failure pattern as shown in Figure 18b [52]. It is also evident from Figure 18c that the JC constitutive model together with the JC failure criterion fails to capture the experimentally observed cup and cone failure pattern, and its fracture surface is almost flat, while the JC constitutive model together with the BW fracture criterion gives reasonably good predictions, as can be seen from Figure 18d.
Figure 19 shows comparisons between the numerically predicted load-displacement curves and the experimental data for the 2024-T351 aluminum alloy R12 notched round bar tensile test at room temperature as the test results for true stress–true strain curve are not available [52]. It is evident from Figure 19 that the present model and the JC constitutive model together with either the JC failure criterion or the BW fracture criterion also produce similar results. It is also evident from Figure 19 that the model predictions are little bit greater than the test results for displacement less than 0.6 mm and for displacement larger than 0.6 mm the model predictions are in good agreement with the experimental data.
Figure 20 shows comparisons of the model predictions with the experimental observation for the 2024-T351 aluminum alloy R12 notched round bar tensile test at room temperature [52]. It is clear from Figure 20a that the failure patterns predicted by the present model are in good agreement with the experimentally observed cup and cone failure, as shown in Figure 20b [52]. It is also clear from Figure 20c that the JC constitutive model with the JC failure criterion again fails to predict the cup and cone failure pattern (its fracture surface is nearly flat), whereas the predictions from the JC constitutive model with the BW fracture criterion are in reasonable agreement with the experimentally observed failure pattern as can be seen from Figure 20d.
In summary, the present plasticity and failure model and the JC constitutive model with either the JC failure criterion or the BW fracture criterion produce similar results and the model predictions are in good agreement with the test data for the 2024-T351 aluminum alloy smooth or notched round bar tensile specimens under quasi-static loading at room temperature. However, the present model successfully reproduced the cup and cone failure pattern as observed experimentally in 2024-T351 aluminum alloy round bar tensile specimens under quasi-static loading at room temperature, while the JC constitutive model with the JC failure criterion failed to do so, and the JC constitutive model with the BW fracture criterion partly reproduced the experimental results. The reason for this is simply the fact that the present plasticity (constitutive) model considers the effect of Lode angle, while the JC constitutive model does not cater for it; that both the present failure criterion and the BW fracture criterion have taken into account the effects of stress triaxiality, as well as Lode angle, whereas the JC failure criterion takes into consideration the effect of stress triaxiality only. It should be mentioned here that both the present failure criterion (Equation (8)) and the BW fracture model [11] produce more or less similar results for stress triaxiality greater than zero approximately while for stress triaxiality less than zero the difference between these two model predictions increases with decreasing stress triaxiality. Furthermore, there are only two parameters which are needed to be determined in the present failure criterion as compared to six (asymmetric) and four (symmetric) parameters which are required to be estimated in the BW fracture criterion.
3.2.3. Ballistic Perforation Tests
The usefulness and the accuracy of the present new plasticity and failure model are also verified against the test data for the perforation of 2024-T351 aluminum alloy plates struck transversely by flat-ended and spherical projectiles, as examined by Rodriguez-Millan et al. [53]. For the sake of comparison, the numerical results with the JC constitutive model together with the JC failure criterion or the BW fracture criterion as reported by Rodriguez-Millan et al. [53] are also presented and discussed.
Due to symmetry boundary conditions, only a 1/2 finite element model was built, to save computing time. To further improve computational efficiency, the region around the impact point (about 1.8 times the projectile radius) was finely meshed (i.e., 0.1 mm × 0.1 mm × 0.1mm), and outside the region, the mesh coarsens radially towards the edge of the plate. In the numerical simulations, no friction is considered, and the projectile is assumed to remain rigid. The plate and the steel projectile are modeled with Lagrangian mesh and ERODING_SURFACE_TO_SURFACE is applied between them.
(1) Flat-ended projectile
The diameter of the flat-ended cylindrical projectile was 5.5 mm and its length 7 mm. The maraging steel projectile had a mass of 1.1 g and the 4 mm thick 2024-T351 aluminum alloy plates were fully clamped with a square window of 100 mm × 100 mm. Figure 21 shows the finite element model used in the numerical simulations.
Figure 22 shows the comparison of the numerically predicted residual velocities with the experimental data for the perforation of the 2024-T351 aluminum alloys plates struck by the flat-faced projectile at normal incidence [53]. It is clear from Figure 22 that that residual velocities predicted by the present model are generally in good agreement with the test data. It is also clear from Figure 22 that the predictions from the JC constitutive model together with the JC failure criterion or the BW fracture criterion are not consistent with the experimental results. When the impact velocity was lower than 433 m/s, the residual velocities predicted by these two models were higher than the experimental values, and when the impact velocities were greater than 433 m/s, the residual velocities predicted by these two models were lower than the test values. Moreover, the ballistic limit velocity predicted by the present model is in good agreement with the experimental observation (300 m/s) while the ballistic limit velocities predicted from the JC constitutive model together with the JC failure criterion or the BW fracture criterion are much lower than the experimental value as can be seen from Figure 22.
Figure 23 shows the comparison of the numerically predicted perforation mode with the experimental observation for the 4 mm thick 2024-T351 aluminum plate struck by the flat-ended projectile. It is clear from Figure 23a that the final perforation pattern predicted by the present model is in good agreement with the experimentally observed shear plug failure as shown in Figure 23b [53]. The radius of the plug sheared out from the plate is virtually the same as that of the projectile. It is also clear from Figure 23c,d that the predictions by the JC constitutive model with the JC failure criterion or the BW fracture criterion are also in reasonable agreement with the experimentally observed plugging mode.
(2) Spherical projectile
The diameter of the spherical projectile is 7.5 mm, and the thicknesses of the plates are 1 mm and 4 mm, respectively. The maraging steel projectile had a mass of 1.7 g and the 2024-T351 aluminum alloy plates were fully clamped with a square window of 100 mm × 100 mm. Figure 24 shows the finite element model used in the numerical simulations.
Figure 25a,b shows the comparison of the numerically predicted residual velocities with the test results for the perforation of the 1 mm and 4 mm thick 2024-T351 aluminum alloys plates struck by the spherical projectile, respectively. It is evident from Figure 25a that the present model slightly over-predicts the residual velocity test data for the 1-mm-thick plates, while the JC constitutive model with the JC failure criterion under-predicts slightly, and the JC constitutive model with the BW fracture criterion under-predicts considerably, when compared to the test results. It is also evident from Figure 25b that both the present model and the JC constitutive model with the JC fracture criterion produce similar results while the numerical results from the JC constitutive model with the BW fracture criterion are considerably lower as compared to the experimental data. It should be mentioned here that the ballistic limit velocity predicted by the present model for the 1-mm plate is slightly lower than the test result while that from the present model for the 4-mm plate is a little bit greater than the experimental value, and the opposite is true for the JC constitutive model with the JC failure criterion or the BW fracture criterion, as can be seen from Figure 25b.
Figure 26 shows a comparison of the numerically predicted perforation mode with the experimental observation for the 1-mm-thick 2024-T351 aluminum plates struck by the spherical projectile. It is clear from Figure 26a that the final perforation pattern predicted by the present model is in good agreement with the experimentally observed petalling failure as shown in Figure 26b [53]. It is also clear from Figure 26c,d that the predictions by the JC constitutive model with the JC failure criterion or the BW fracture criterion have failed to reproduce the petalling perforation pattern observed experimentally.
3.3. Discussion
The new model developed in Section 2 was validated both by the material test data for six different metals under different loading conditions and the ballistic test results with flat-nosed and spherical projectiles. It has to be mentioned here that apart from the material tests specified in Section 2.3, no extra material tests are required to calibrate the new model even though there are additional constants.
As a matter of fact, many fewer material tests are required to determine the constants of various parameters in the new model than those in the existing models such as the JC constitutive model with the respective JC and BW fracture criteria, as no notched tensile tests are needed in the new model as outlined in Section 2.3 of the paper. It is noteworthy that only 4 constants of the failure criterion in the new model need to be determined from material tests as compared to 5 of the JC facture criterion and 6–8 of the BW fracture criterion including effects of strain rate and temperature.
It has been proven that the new model is advantageous over the existing models, such as the JC constitutive model with the respective JC and BW fracture criteria by producing much more consistent and much more accurate results than them as compared to materials test data and ballistic test results in terms of stress–strain curves, facture pattern (cup and cone), ballistic limit, residual velocity and perforation modes (shear plugging and petalling).
4. Conclusions
A new dynamic plasticity and failure model for metals has been developed in the present paper on the basis of the analysis of some available material test data and the previous work. The main conclusions are as follows:
- (1)
- A new dynamic plasticity and failure model for metals, which includes a strength model and a failure criterion, has been developed. The new model takes into account the effects of stress triaxiality, Lode angle, strain rate and temperature.
- (2)
- A new non-linear relationship between the dynamic increase factor (DIF) and the strain rate has been suggested and, in particular, the DIF at zero plastic strain, which can be determined from that at a specific plastic strain, has been used in the formulation of the new strength model.
- (3)
- The new model has been verified against the available test data for 2024-T351 aluminum alloy, 6061-T6 aluminum alloy, OFHC copper, 4340 steel, Ti-6Al-4V alloys and Q235 mild steel under different loading conditions in terms of stress–strain curve, strain rate effect, temperature effect and fracture.
- (4)
- The new model has been further verified against the corresponding experimental results for 2024-T351 aluminum alloy by employing it in the numerical simulations of the material behavior in terms of stress-strain relationship and fracture pattern (i.e., cup and cone), as well as ballistic perforation in terms of residual velocity and perforation mode (namely, shear plugging and petalling).
- (5)
- The new model has been proven to be advantageous over the existing models such as the JC constitutive model with the JC failure criterion or the BW fracture criterion. This section may be divided by subheadings. It should provide a concise and precise description of the experimental results, their interpretation as well as the experimental conclusions that can be drawn.
Author Contributions
L.Z. and H.W. collected and analyzed the experiment data, proposed the constitutive model and facture criterion, verified of the new dynamic plasticity and failure model, developed the numerical simulations and wrote the paper.
Funding
This research received no external funding.
Acknowledgments
The authors would like to thank CAS Key Laboratory for Mechanical Behavior and Design of Materials for support.
Conflicts of Interest
The authors declare no conflict of interest.
Appendix A
Based on the experimental observations, it is assumed that the dynamic stress increments at different plastic strains at the same strain rate are the same. Thus, one obtains
where are the dynamic increase factors corresponding to different plastic strains (), respectively. Rearranging Equation (A1) yields the following expression
Equation (A2) means that the dynamic increase factor () at one plastic strain () can be determined from that () at another plastic strain (). Let , then one obtains the dynamic increase factor at zero plastic strain (), namely
In which can be estimated by the following expression which is a slightly modified version of that given in references [40,41,42,43,44,45,46]
where and are materials constants to be determined from material dynamic tests; is the reference strain rate, usually taken to be ; is the strain rate used in the quasi-static material tensile or compressive tests which is usually less than .
As noted previously, the test data for the DIF (or dynamic stress) were usually taken at different plastic strains by different researchers and the values of DIF at the different plastic strains are different for a metal, which can lead to further uncertainty to the accuracy of constitutive models for metals. To solve this problem, Equation (A2) is proposed and its accuracy is supported by the experimentally determined dynamic increase factors (DIF) at different plastic strains for some metals as reported in the literature.
Figure A1a shows the comparison of Equation (A2) with the test data for the DIF at different plastic strains for Q235 mild steel [8]. The blue circle represents the DIF at yield strength (plastic strain of 0.002) and the red square indicates the DIF at plastic strain of 0.05. In the present case, the values of various parameters for the DIF at yield strength (Equation (A4)) are first determined to be by curve-fitting technique as designated by blue solid line and then Equation (A2) is used to predict the DIF at plastic strain of 0.05 as indicated by red broken line. It can be seen from Figure A1a that the DIF at plastic strain of 0.05 predicted by Equation (A2) is in good agreement with the experimental results. Also, Figure A1b shows comparison of the new model predictions with experimentally observed true stress–true strain curves at different strain rates [8], and good agreement is obtained.
Figure A1.
Comparison of the present model with the test data for Q235 mild steel. (a) DIF at different plastic strains versus strain rate at room temperature; and (b) true tress-true strain curves in compression.
Figure A1.
Comparison of the present model with the test data for Q235 mild steel. (a) DIF at different plastic strains versus strain rate at room temperature; and (b) true tress-true strain curves in compression.

Figure A2a shows comparison of Equation (A2) with the test results for the DIF at different plastic strains for 45 steel [39]. The material parameters of 45 steel need to be determined by the quasi-static true stress–true strain curve at room temperature, and they are estimated at . The blue circle and red square represent the DIF at plastic strains of 0.05 and the DIF at yield strength (plastic strain of 0.002), respectively. The values of various parameters for the DIF at plastic strain of 0.05 (Equation (A4)) are first determined to be by curve-fitting technique as indicated by blue solid line and then Equation (A2) is employed to predict the DIF at yield strength (plastic strain of 0.002) as indicated by red broken line. It is clear from Figure A2a that the DIF at yield strength (plastic strain of 0.002) predicted by Equation (A2) is in good agreement with the experimental data. Also, Figure A2b shows comparison of the new model predictions with experimentally obtained true stress–true strain curves at different strain rates [39], and good agreement is obtained.
Figure A2.
Comparison of the present model with the test data for 45 steel. (a) DIF at different plastic strain versus strain rates at room temperature; and (b) true stress–true strain curves in compression.
Figure A2.
Comparison of the present model with the test data for 45 steel. (a) DIF at different plastic strain versus strain rates at room temperature; and (b) true stress–true strain curves in compression.

Figure A3a shows comparison of Equation (A2) with the test results for the DIF at different plastic strains for 35 Ni Cr Mo V 109 high-strength steel [54]. The material parameters of 35 Ni Cr Mo V 109 high-strength steel are needed to be estimated by the quasi-static true stress–true strain curve at room temperature and they are determined to be . The red circle, blue cross and black triangle indicate the DIFs corresponding to the different plastic strains in dynamic tensile test (0.002), Taylor cylinder impact test (0.0035) and plate impact test (0.0085) [54]. The values of various parameters for the DIF at yield strength (plastic strain of 0.002) (Equation (A4)) are first determined to be by curve–fitting technique as designated by blue solid line, and then Equation (A2) is employed to predict the DIFs at plastic strains of 0.0035 and 0.0085 as indicated by red and black broken lines, respectively. It can be seen from Figure A3a that the DIFs at plastic strains of 0.0035 and 0.0085 predicted by Equation (A2) are in good agreement with the limited test data. Also, Figure A3b shows comparison of the new model predictions with experimentally obtained true stress–true strain curves at different strain rates [54] and good agreement is obtained.
Figure A3.
Comparison of the present model with the test data for 35 Ni Cr Mo V 109 high-strength steel. (a) DIF at different plastic strains versus strain rate at room temperature; and (b) true tress-true strain curves in tension.
Figure A3.
Comparison of the present model with the test data for 35 Ni Cr Mo V 109 high-strength steel. (a) DIF at different plastic strains versus strain rate at room temperature; and (b) true tress-true strain curves in tension.

Figure A4a shows comparison of Equation (A2) with the test data for the DIF at different plastic strains for Q235B mild steel [55]. The material parameters of Q235B mild steel are needed to be estimated by the quasi-static true stress–true strain curve at room temperature and they are determined to be . The blue circle indicates the DIF at yield strength (plastic strain of 0.002) and the red square designates the DIF at plastic strain of 0.05. The values of various parameters for the DIF at yield strength (Equation (A4)) are first determined to be by curve-fitting technique as represented by the blue solid line and then Equation (A2) is used to predict the DIF at plastic strain of 0.05 as indicated by the red broken line. It is evident from Figure A4a that the DIF at a plastic strain of 0.05 predicted by Equation (A2) is in good agreement with the experimental data. Also, Figure A4b shows the comparison of the new model predictions with the experimentally observed true stress–true strain curves at different strain rates [55], and good agreement is obtained.
Figure A4.
Comparison of the present model with the test data for Q235B mild steel. (a) DIF at different plastic strains versus strain rate at room temperature; and (b) true tress-true strain curves in compression.
Figure A4.
Comparison of the present model with the test data for Q235B mild steel. (a) DIF at different plastic strains versus strain rate at room temperature; and (b) true tress-true strain curves in compression.

It should be pointed out here that Equation (A4) levels out at very high strain rate. The reason to choose the six different materials (2024-T351 aluminum alloy, 6061-T6 aluminum alloy, OFHC copper, 4340 steel, Ti-6Al-4V alloys and Q235 mild steel) examined in the main text of the present paper is simply because the material test data for these six materials are more complete in terms of true stress-true strain relationships, strain rate effects, temperature effects and failure. It happens to be the case that there are no material test data available for these materials at very high strain rates. However, this does not mean that the mathematical form of the dynamic increase factor (DIF) or the strain rate dependence of plasticity are not right. Indeed, additional material test data presented above lends further support to the accuracy of the new model. Moreover, it has been shown that the slightly different form of the DIF (from which the present form (Equation (A4)) was derived) has been successfully applied to other material systems such as concrete-like materials [40,41,42,43,44] and fiber-reinforced plastic laminates [45,46], which also shows that it levels out at very high strain rates. Indeed, it has been experimentally demonstrated that the form of DIF for concrete does level out at very high strain rates (for more details, see reference [44]).
As a matter of fact, the DIF for other metals such as tungsten alloy does show the same trend. Figure A5 shows comparison of the new model (Equation (A4)) with the material test data for 93W tungsten alloy [56,57]. The values of various parameters for the DIF at yield strength (Equation (A4)) are determined to be by curve-fitting technique. It is clear from Figure A5 that the present model predictions are in good agreement with the experimental data. It is also clear from the figure that the form of the dynamic increase factor (DIF) describing the strain rate dependence of plasticity does level out at very high strain rates.
Figure A5.
Comparison of the new model (Equation (A4)) with the DIF test data for 93W tungsten alloy.
Figure A5.
Comparison of the new model (Equation (A4)) with the DIF test data for 93W tungsten alloy.

References
- Johnson, G.R.; Cook, W.H. A constitutive model and data for metals subjected to large strains, high strain rates and high temperatures. In Proceedings of the 7th International Symposium on Ballistics, The Hague, The Netherlands, 19–21 April 1983; pp. 541–547. [Google Scholar]
- Johnson, G.R.; Cook, W.H. Fracture characteristics of three metals subjected to various strains, strain rates, temperatures and pressures. Eng. Fract. Mech. 1985, 21, 31–48. [Google Scholar] [CrossRef]
- Borvik, T.; Hopperstad, O.S.; Berstad, T.; Langseth, M. A computational model of viscoplasticity and ductile failure for impact and penetration. Eur. J. Mech. A Solids 2001, 20, 685–712. [Google Scholar] [CrossRef]
- Clausen, A.H.; Borvik, T.; Hopperstad, O.S.; Benallal, A. Flow and fracture characteristics of aluminum alloy AA5083-H116 as function of strain rate, temperature and triaxiality. J. Mater. Sci. Eng. A 2004, 364, 260–272. [Google Scholar] [CrossRef]
- Khan, A.S.; Liu, H. Variable strain rate sensitivity in an aluminum alloy: Response and constitutive modeling. Int. J. Plast. 2012, 36, 1–14. [Google Scholar] [CrossRef]
- Khan, A.S.; Suh, Y.S.; Kazmi, R. Quasi-static and dynamic loading responses and constitutive modeling of titanium alloys. Int. J. Plast. 2004, 20, 2233–2248. [Google Scholar] [CrossRef]
- Meyers, M.A.; Chen, Y.J.; Marquis, F.D.S.; Kim, D.S. High-strain, high-strain-rate behavior of tantalum. Metall. Mater. Trans. A 1995, 26, 2493–2501. [Google Scholar] [CrossRef]
- Guo, Z.T.; Gao, B.; Guo, Z.; Zhang, W. Dynamic constitutive relation based on J-C model of Q235 steel. Explos. Shock Waves 2018, 38, 804–810. (In Chinese) [Google Scholar]
- Bao, Y.; Wierzbicki, T. On fracture locus in the equivalent strain and stress triaxiality space. Int. J. Mech. Sci. 2004, 46, 81–98. [Google Scholar] [CrossRef]
- Wierzbicki, T.; Bao, Y.; Lee, Y.W.; Bai, Y. Calibration and evaluation of seven fracture models. Int. J. Mech. Sci. 2005, 47, 719–743. [Google Scholar] [CrossRef]
- Bai, Y.; Wierzbicki, T. A new model of metal plasticity and fracture with pressure and Lode dependence. Int. J. Plast. 2008, 24, 1071–1096. [Google Scholar] [CrossRef]
- Bai, Y.; Wierzbicki, T. Application of extended Mohr-Coulomb criterion to ductile fracture. Int. J. Fract. 2010, 161, 1–20. [Google Scholar] [CrossRef]
- Chocron, S.; Erice, B.; Anderson, C.E. A new plasticity and failure model for ballistic application. Int. J. Impact Eng. 2011, 38, 755–764. [Google Scholar] [CrossRef]
- Erice, B.; Gálvez, F. A coupled elastoplastic-failure constitutive model with Lode angle dependent failure criterion. Int. J. Solids Struct. 2014, 51, 93–110. [Google Scholar] [CrossRef]
- Zhou, L.; Wen, H.M. A new approach for the failure of metallic materials. Chin. J. High Pressure Phys. 2019, 33, 014103-1. [Google Scholar]
- Zhou, L.; Wang, Z.H.; Wen, H.M. On the accuracy of the Johnson-Cook constitutive model for metals. Chin. J. High Pressure Phys. 2019, 33, 1–14. [Google Scholar]
- Langer, J.S.; Bouchbinder, E.; Lookman, T. Thermodynamic theory of dislocation-mediated plasticity. Acta Mater. 2010, 58, 3718–3732. [Google Scholar] [CrossRef] [Green Version]
- Langer, J.S. Thermal effects in dislocation theory. Phys. Rev. E 2016, 94, 063004. [Google Scholar] [CrossRef] [Green Version]
- Le, K.C.; Tran, T.M.; Langer, J.S. Thermodynamic dislocation theory of high-temperature deformation in aluminum and steel. Phys. Rev. E 2017, 96, 013004. [Google Scholar] [CrossRef] [Green Version]
- Le, K.C.; Tran, T.M.; Langer, J.S. Thermodynamic dislocation theory of adiabatic shear banding in steel. Scr. Mater. 2017, 149, 62–65. [Google Scholar] [CrossRef]
- Le, K.C. Thermodynamic dislocation theory for non-uniform plastic deformations. J. Mech. Phys. Solids 2018, 111, 157–169. [Google Scholar] [CrossRef] [Green Version]
- Le, K.C.; Piao, Y.; Tran, T.M. Thermodynamic dislocation theory: Torsion of bars. Phys. Rev. E 2018, 98, 063006. [Google Scholar] [CrossRef] [Green Version]
- Le, K.C.; Piao, Y. Thermodynamic dislocation theory: Size effect in torsion. Int. J. Plast. 2019, 115, 56–70. [Google Scholar] [CrossRef]
- Le, K.C.; Piao, Y. Thermal softening during high-temperature torsional deformation of aluminum bars. Int. J. Eng. Sci. 2019, 137, 1–7. [Google Scholar] [CrossRef] [Green Version]
- Seidt, J.D.; Gilat, A. Plastic deformation of 2024-T351 Aluminum plate over a wide range of loading conditions. Int. J. Solids Struct. 2013, 50, 1781–1790. [Google Scholar] [CrossRef]
- Wilkins, M.L.; Streit, R.D.; Reaugh, J.E. Cumulative-Strain-Failure Model of Ductile Fracture: Simulation and Prediction of Engineering Fracture Tests; Technical Report UCRL-53058; Lawrence Livermore National Laboratories: Livermore, CA, USA, 1980.
- Scapina, M.; Manes, A. Behaviour of Al6061-T6 alloy at different temperatures and strain-rates: Experimental characterization and material modeling. J. Mater. Sci. Eng. A 2018, 734, 318–328. [Google Scholar] [CrossRef]
- Baig, M.; Khan, A.S.; Choi, S.H.; Jeong, A. Shear and multiaxial responses of oxygen free high conductivity (OFHC) copper over wide range of strain-rates and temperatures and constitutive modeling. Int. J. Plast. 2013, 40, 65–80. [Google Scholar] [CrossRef]
- Nemat-Nasser, S.; Li, Y. Flow stress of FCC polycrystals with application to OFHC Cu. Acta Mater. 1998, 46, 565–577. [Google Scholar] [CrossRef]
- Guo, W.G. Flow stress and constitutive model of OFHC Cu for large deformation, different temperatures and different strain rates. Explos. Shock Waves 2005, 25, 244–250. (In Chinese) [Google Scholar]
- Anand, L.; Kalidindi, S.R. The process of shear band formation in plane strain compression of fcc metals: Effects of crystallographic texture. Mech. Mater. 1994, 17, 223–243. [Google Scholar] [CrossRef]
- Mirone, G.; Barbagallo, R.; Corallo, D. A new yield criteria including the effect of lode angle and stress triaxiality. Procedia Struct. Integrity 2016, 2, 3684–3696. [Google Scholar] [CrossRef] [Green Version]
- Nemat-Nasser, S.; Guo, W.G.; Nesterenko, V.F.; Indrakanti, S.S.; Gu, Y.B. Dynamic response of conventional and hot isostatically pressed Ti-6Al-4V alloys: Experiments and modeling. Mech. Mater. 2001, 33, 425–439. [Google Scholar] [CrossRef]
- Lin, L.; Zhi, X.D.; Fan, F.; Meng, S.J.; Su, J.J. Determination of parameters of Johnson-Cook models of Q235B steel. J. Vib. Shock 2014, 33, 153–158. (In Chinese) [Google Scholar]
- Lesuer, D.R.; Kay, G.J.; Leblanc, M.M. Modeling Large-Strain, High-Rate Deformation in Metals; Technical report UCRL-JC-134118; Lawrence Livermore National Laboratory: Livermore, CA, USA, 2001.
- Follansbee, P.S.; Kocks, U.F. A constitutive description of the deformation of copper based on the use of the mechanical threshold stress as an internal state variable. Acta Metall. 1988, 36, 81–93. [Google Scholar] [CrossRef] [Green Version]
- Campbell, J.D.; Cooper, R.H. Yield and flow of low-carbon steel at medium strain rates. In Proceedings of the Conference on the Physical Basis of Yield and Fracture; Institute of Physics and Physical Society: London, UK, 1966; pp. 77–87. [Google Scholar]
- Jones, N. Structural Impact, 2nd ed.; Cambridge University Press: Cambridge, UK, 2012. [Google Scholar]
- Chen, G.; Chen, Z.F.; Tao, J.L.; Niu, W.; Zhang, Q.P.; Huang, X. Investigation and validation on plastic constitutive parameters of 45 steel. Explos. Shock Waves 2005, 25, 451–456. (In Chinese) [Google Scholar]
- Xu, H.; Wen, H.M. A computational constitutive model for concrete subjected to dynamic loadings. Int. J. Impact Eng. 2016, 91, 116–125. [Google Scholar] [CrossRef]
- Xu, H.; Wen, H.M. Semi-empirical equations for the dynamic strength enhancement of concrete-like materials. Int. J. Impact Eng. 2013, 60, 76–81. [Google Scholar] [CrossRef]
- Xu, P.B.; Xu, H.; Wen, H.M. 3D meso-mechanical modelling of concrete spall tests. Int. J. Impact Eng. 2016, 97, 46–56. [Google Scholar] [CrossRef]
- Zhao, F.Q.; Wen, H.M. Effect of free water content on the penetration of concrete. Int. J. Impact Eng. 2018, 121, 180–190. [Google Scholar] [CrossRef]
- Zhao, F.Q.; Wen, H.M. A comment on the maximum dynamic tensile strength of a concrete-like material. Int. J. Impact Eng. 2018, 115, 32–35. [Google Scholar] [CrossRef]
- Xin, S.H.; Wen, H.M. A progressive failure model for fiber reinforced plastic composites subjected to impact loading. Int. J. Impact Eng. 2015, 75, 40–52. [Google Scholar] [CrossRef]
- Xin, S.H.; Wen, H.M. Numerical study on the perforation of fiber reinforced plastic laminates struck by high velocity projectiles. J. Strain Anal. Eng. Des. 2012, 47, 513–523. [Google Scholar] [CrossRef]
- Gilioli, A.; Manes, A.; Giglio, M.; Wierzbicki, T. Predicting ballistic impact failure of aluminum 6061-T6 with the rate-independent Bao-Wierzbicki fracture model. Int. J. Impact Eng. 2015, 76, 207–220. [Google Scholar] [CrossRef]
- Banerjee, B. The Mechanical Threshold Stress model for various tempers of AISI 4340 steel. Int. J. Solids Struct. 2007, 44, 834–859. [Google Scholar] [CrossRef] [Green Version]
- Giglio, M.; Manes, A.; Viganò, F. Ductile fracture locus of Ti-6Al-4V titanium alloy. Int. J. Mech. Sci. 2012, 54, 121–135. [Google Scholar] [CrossRef]
- Guo, Z.T.; Shu, K.O.; Gao, B.; Zhang, W. J-C model based failure criterion and verification of Q235 steel. Explos. Shock Waves 2018, 38, 1325–1332. (In Chinese) [Google Scholar]
- Bao, Y. Prediction of Ductile Crack Formation in Uncracked Bodies. Ph.D. Thesis, Massachusetts Institute of Technology, Cambridge, MA, USA, 2003. [Google Scholar]
- Teng, X. Numerical prediction of slant fracture with continuum failure mechanics. Eng. Fract. Mech. 2008, 75, 2020–2041. [Google Scholar] [CrossRef]
- Rodriguez-Millan, M.; Garcia-Gonzalez, D.; Rusinek, A.; Arias, A. Influence of Stress State on the Mechanical Impact and Deformation Behaviors of Aluminum Alloys. Metals 2018, 8, 520. [Google Scholar] [CrossRef]
- Rohr, I.; Nahme, H.; Thoma, K. Material characterization and constitutive modeling of ductile high strength steel for a wide range of strain rates. Int. J. Impact Eng. 2005, 31, 401–433. [Google Scholar] [CrossRef]
- Chen, J.L.; Shu, W.Y.; Li, J.W. Experimental study on dynamic mechanical property of Q235 steel at different strain rates. J. Tongji Univ. (Natural Sci.) 2015, 44, 1071–1075. (In Chinese) [Google Scholar]
- Chen, Q.S.; Miao, Y.G.; Guo, Y.Z.; Li, Y.L. Comparative analysis of 3 constitutive models for 93 tungsten alloy. Chin. J. High Pressure Phys. 2017, 31, 753–760. (In Chinese) [Google Scholar]
- Wang, Z.H.; Zheng, H.; Wen, H.M. Determination of the mechanical properties of metals at very high strain rates. Chin. J. High Pressure Phys. 2019. in press (In Chinese) [Google Scholar]
Figure 1.
Comparison of the present model with the true stress-true strain curves obtained from tension and torsion tests. (a) 2024-T351 Al; (b) 6061-T6 Al; (c) OFHC copper; (d) 4340 steel; (e) Ti-6Al-4V alloys; (f) Q235 mild steel.
Figure 1.
Comparison of the present model with the true stress-true strain curves obtained from tension and torsion tests. (a) 2024-T351 Al; (b) 6061-T6 Al; (c) OFHC copper; (d) 4340 steel; (e) Ti-6Al-4V alloys; (f) Q235 mild steel.

Figure 2.
Comparison of the present model with the test data for 2024-T351 aluminum alloy at room temperature. (a) DIF versus strain rate at a plastic strain of 0.075; (b) true stress–true strain curves in tension and (c) true stress-true strain curves in compression.
Figure 2.
Comparison of the present model with the test data for 2024-T351 aluminum alloy at room temperature. (a) DIF versus strain rate at a plastic strain of 0.075; (b) true stress–true strain curves in tension and (c) true stress-true strain curves in compression.

Figure 3.
Comparison of the present model with the test data for 6061-T6 aluminum alloy. (a) DIF versus strain rate at a plastic strain corresponding to the ultimate tensile strength (UTS) in tension tests at room temperature; and (b) true tress-true strain curves in tension.
Figure 3.
Comparison of the present model with the test data for 6061-T6 aluminum alloy. (a) DIF versus strain rate at a plastic strain corresponding to the ultimate tensile strength (UTS) in tension tests at room temperature; and (b) true tress-true strain curves in tension.

Figure 4.
Comparison of the present model with the test data for OFHC copper. (a) DIF versus strain rate at a plastic strain of 0.15 in tension and compression at room temperature; and (b) true tress-true strain curves in compression.
Figure 4.
Comparison of the present model with the test data for OFHC copper. (a) DIF versus strain rate at a plastic strain of 0.15 in tension and compression at room temperature; and (b) true tress-true strain curves in compression.
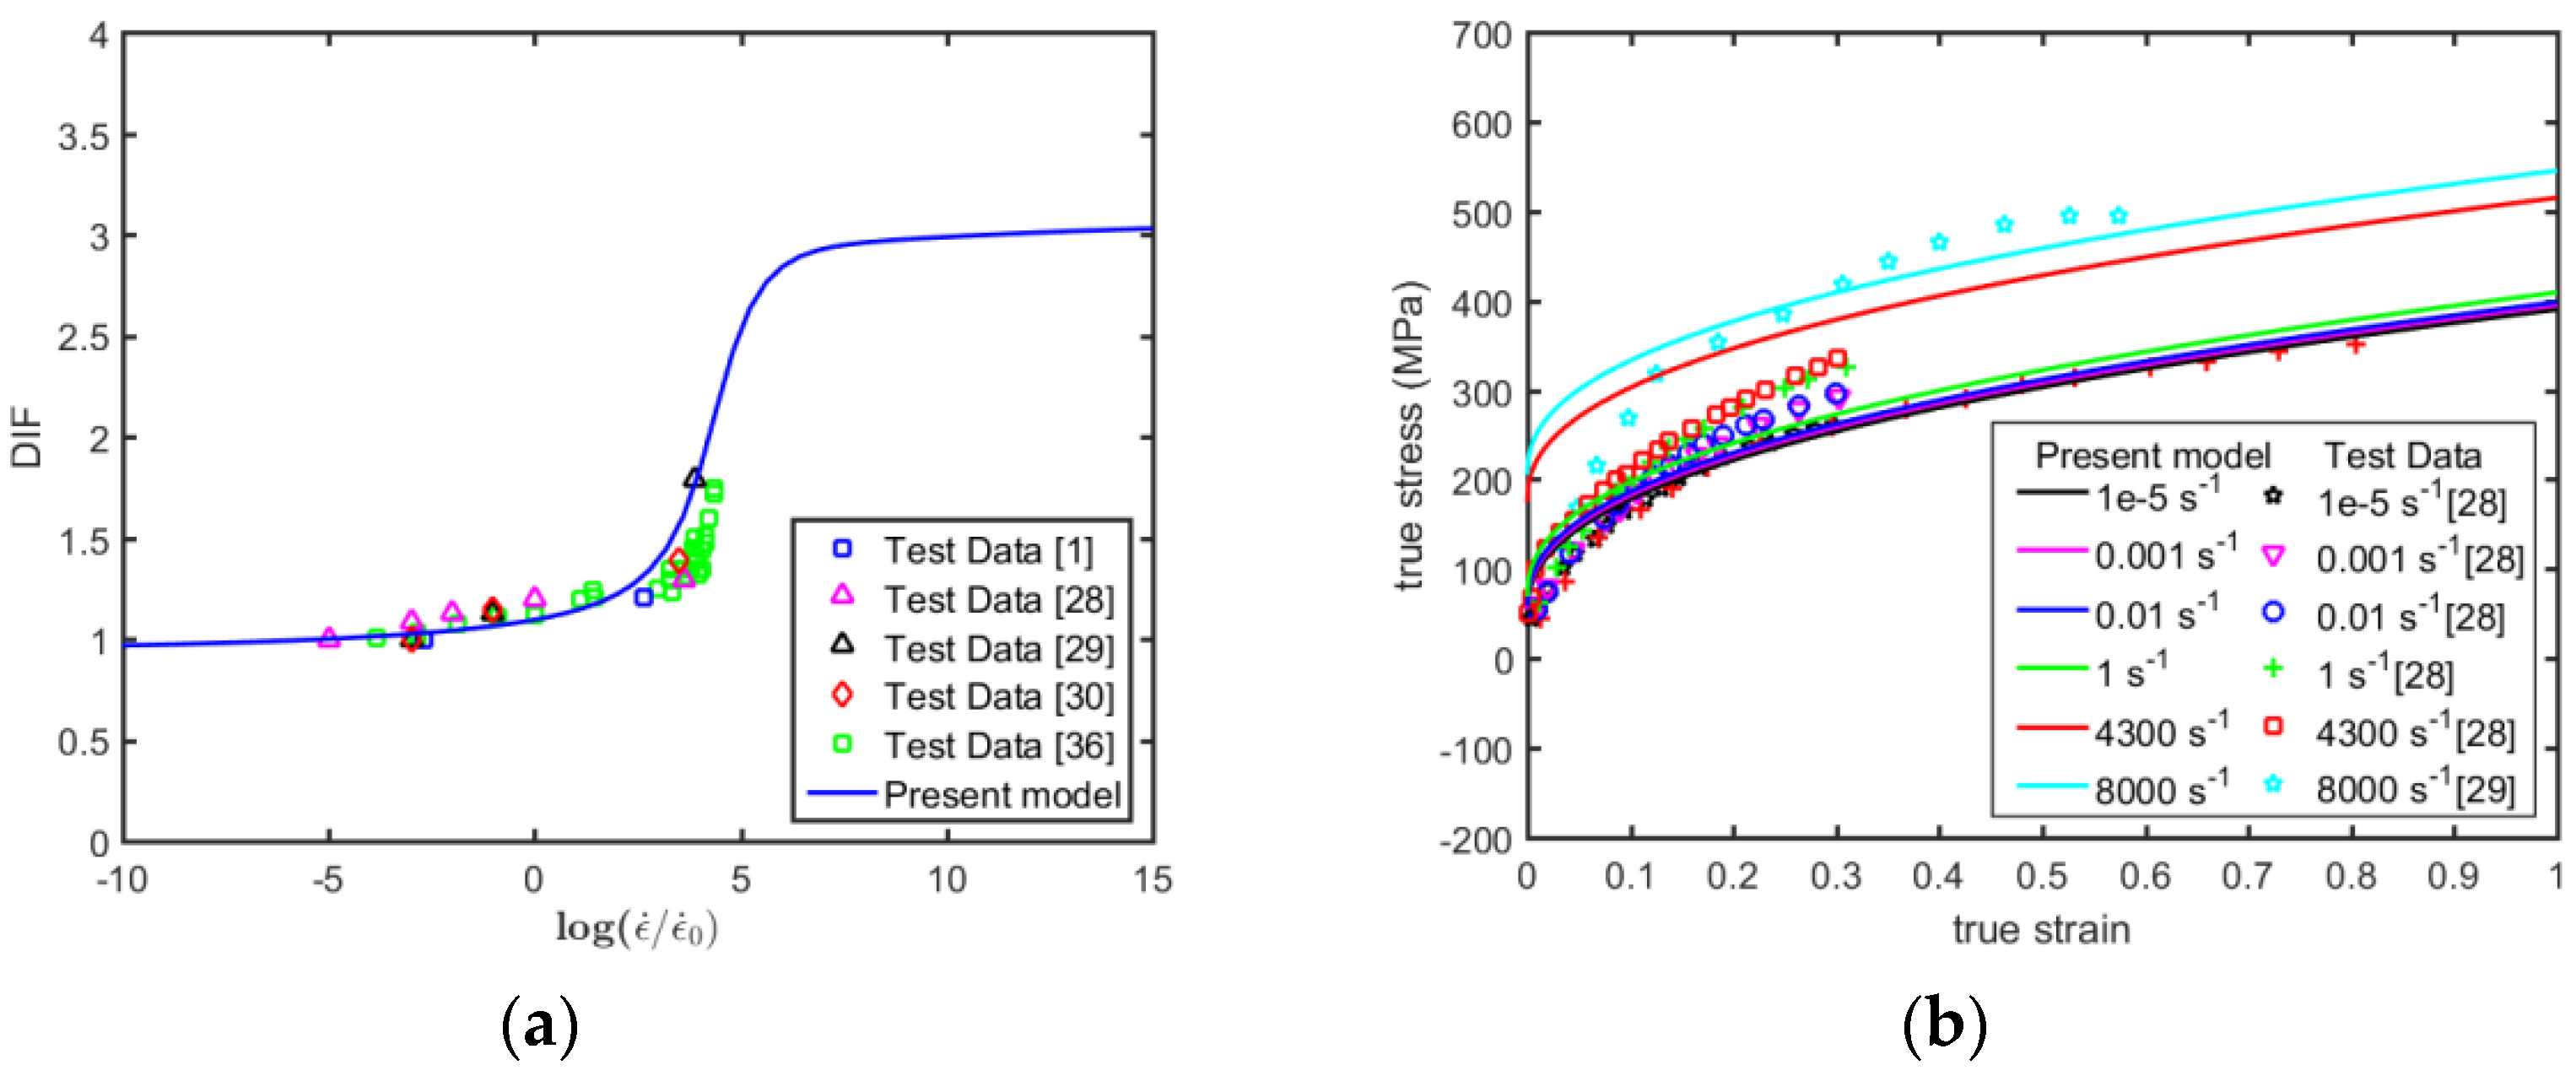
Figure 5.
Comparison of the present model with the test data for 4340 steel. (a) DIF versus strain rate at a plastic strain of 0.05 in tension and compression at room temperature; and (b) true tress-true strain curves in tension.
Figure 5.
Comparison of the present model with the test data for 4340 steel. (a) DIF versus strain rate at a plastic strain of 0.05 in tension and compression at room temperature; and (b) true tress-true strain curves in tension.

Figure 6.
Comparison of the present model with the test data for Ti-6Al-4V alloys. (a) DIF versus strain rate at a plastic strain of 0.05 in compression at room temperature; and (b) true tress-true strain curves in compression.
Figure 6.
Comparison of the present model with the test data for Ti-6Al-4V alloys. (a) DIF versus strain rate at a plastic strain of 0.05 in compression at room temperature; and (b) true tress-true strain curves in compression.

Figure 7.
Comparison of the present model with the test data for Q235 mild steel. (a) DIF versus strain rate at yield stress in tension and compression at room temperature; and (b) true tress-true strain curves in compression.
Figure 7.
Comparison of the present model with the test data for Q235 mild steel. (a) DIF versus strain rate at yield stress in tension and compression at room temperature; and (b) true tress-true strain curves in compression.
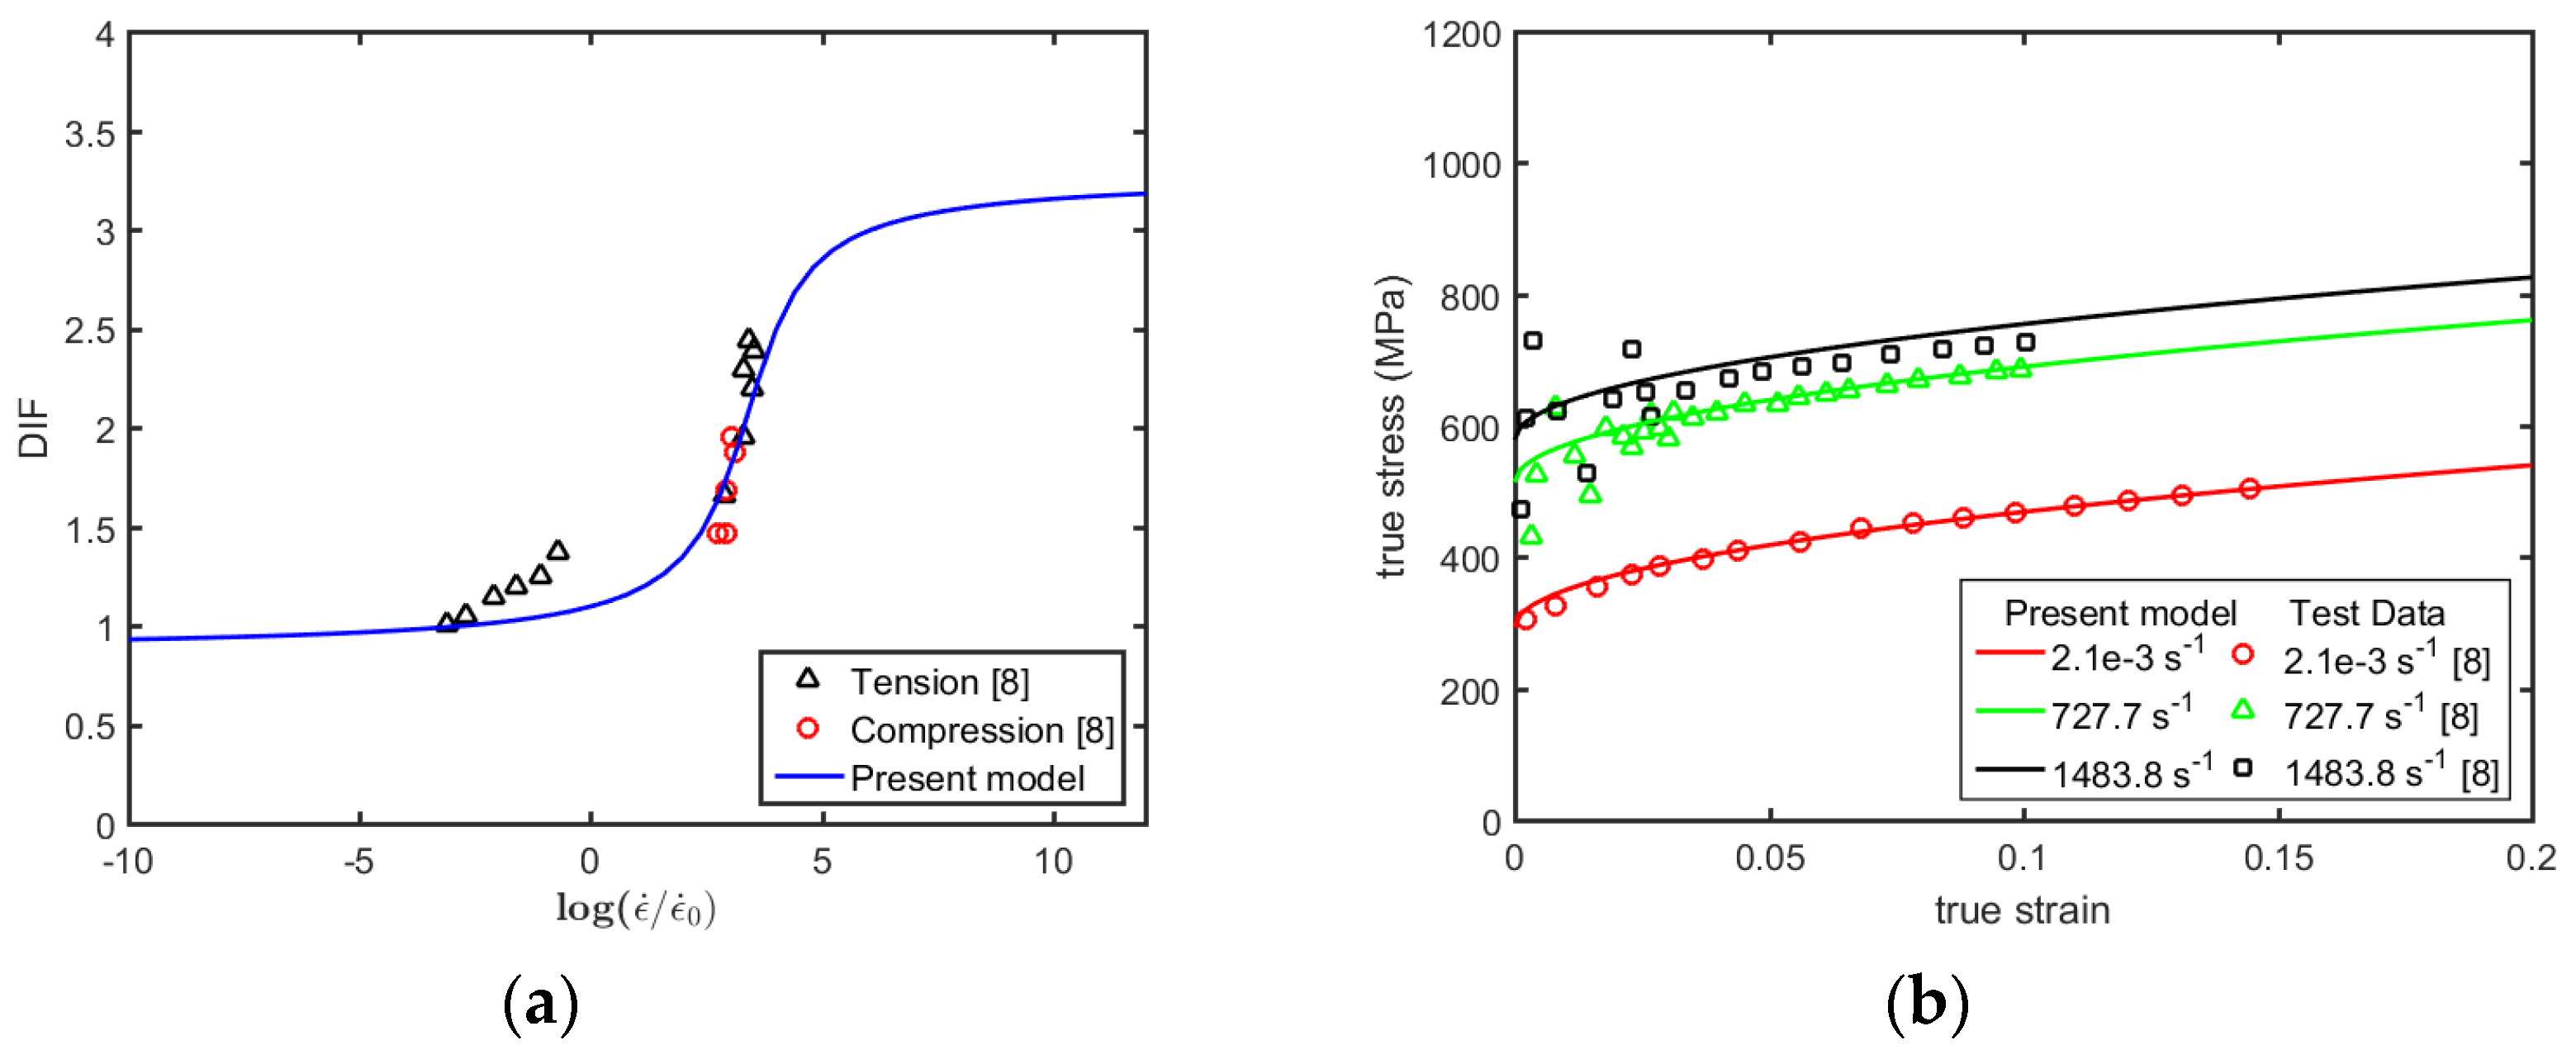
Figure 8.
Comparison of the present model predictions with the tensile test data for 2024-T351 aluminum alloy. (a) σ0 T/σ0 Ta versus T * at a plastic strain of 0.075 under strain rate of 1 s−1; and (b) true stress-true strain curves at elevated temperatures.
Figure 8.
Comparison of the present model predictions with the tensile test data for 2024-T351 aluminum alloy. (a) σ0 T/σ0 Ta versus T * at a plastic strain of 0.075 under strain rate of 1 s−1; and (b) true stress-true strain curves at elevated temperatures.

Figure 9.
Comparison of the present model predictions with the tensile test data for 6061-T6 aluminum alloy. (a) σ0 T/σ0 Ta versus T * at a plastic strain of 0.04 under different strain rates; (b) true stress-true strain curves at 0.001 s−1; and (c) true stress-true strain curves at 1000 s−1.
Figure 9.
Comparison of the present model predictions with the tensile test data for 6061-T6 aluminum alloy. (a) σ0 T/σ0 Ta versus T * at a plastic strain of 0.04 under different strain rates; (b) true stress-true strain curves at 0.001 s−1; and (c) true stress-true strain curves at 1000 s−1.

Figure 10.
Comparison of the present model predictions with the compression test data for OFHC copper. (a) σ0 T/σ0 Ta versus T * at a plastic strain of 0.15 under strain rate of 0.001 s−1; and (b) true stress-true strain curves at elevated temperatures.
Figure 10.
Comparison of the present model predictions with the compression test data for OFHC copper. (a) σ0 T/σ0 Ta versus T * at a plastic strain of 0.15 under strain rate of 0.001 s−1; and (b) true stress-true strain curves at elevated temperatures.

Figure 11.
Comparison of the present model predictions with the tensile test data for 4340 steel. (a) σ0 T/σ0 Ta versus T * at a plastic strain of 0.05 under strain rate of 0.002 s−1; and (b) true stress-true strain curves at elevated temperatures.
Figure 11.
Comparison of the present model predictions with the tensile test data for 4340 steel. (a) σ0 T/σ0 Ta versus T * at a plastic strain of 0.05 under strain rate of 0.002 s−1; and (b) true stress-true strain curves at elevated temperatures.

Figure 12.
Comparison of the present model predictions with the compression test data for Ti-6Al-4V. (a) σ0 T/σ0 Ta versus T * at a plastic strain of 0.05 under strain rate of 0.001 s−1; and (b) true stress-true strain curves at elevated temperatures.
Figure 12.
Comparison of the present model predictions with the compression test data for Ti-6Al-4V. (a) σ0 T/σ0 Ta versus T * at a plastic strain of 0.05 under strain rate of 0.001 s−1; and (b) true stress-true strain curves at elevated temperatures.

Figure 13.
Comparison of the present model predictions with the compression test data for Q235 mild steel. (a) σ0 T/σ0 Ta versus T * at a plastic strain of yield stress under strain rate of 0.0021 s−1; and (b) true stress-true strain curves at elevated temperatures.
Figure 13.
Comparison of the present model predictions with the compression test data for Q235 mild steel. (a) σ0 T/σ0 Ta versus T * at a plastic strain of yield stress under strain rate of 0.0021 s−1; and (b) true stress-true strain curves at elevated temperatures.
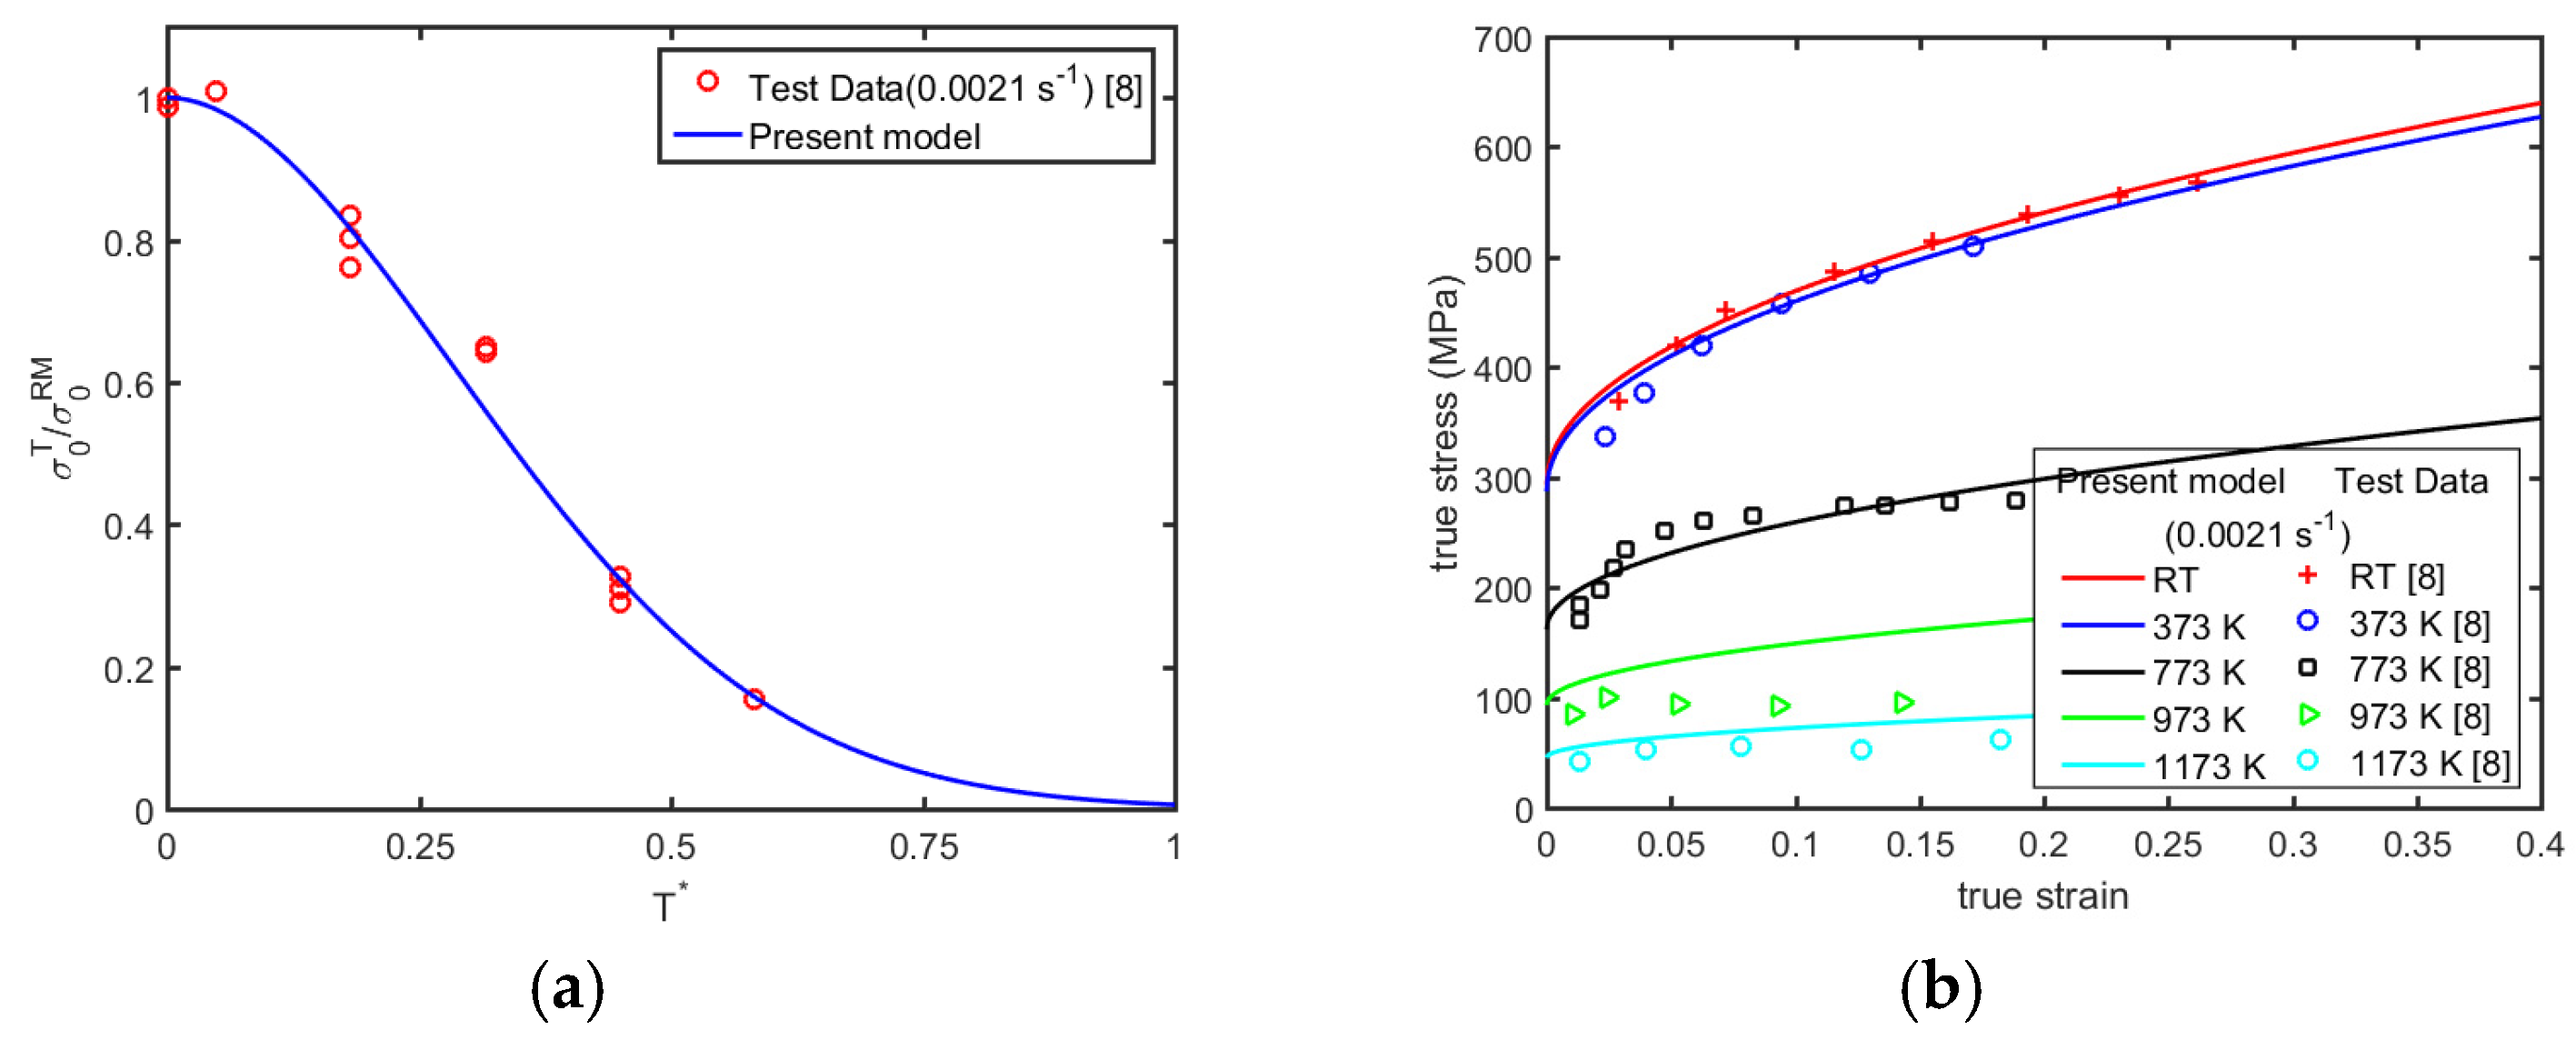
Figure 14.
Dependence of the equivalent strain to fracture on the stress triaxiality on some metals: (a) 2024-T351 Al; (b) 6061-T6 Al; (c) OFHC copper; (d) 4340 steel; (e) Ti-6Al-4V alloys; and (f) Q235 mild steel.
Figure 14.
Dependence of the equivalent strain to fracture on the stress triaxiality on some metals: (a) 2024-T351 Al; (b) 6061-T6 Al; (c) OFHC copper; (d) 4340 steel; (e) Ti-6Al-4V alloys; and (f) Q235 mild steel.

Figure 15.
Comparison of the true stress-true strain curves between the present model predictions and test data for 2024-T351 aluminum alloy in tension and pure shear at room temperature.
Figure 15.
Comparison of the true stress-true strain curves between the present model predictions and test data for 2024-T351 aluminum alloy in tension and pure shear at room temperature.

Figure 16.
The finite element models for 2024-T351 aluminum alloy tension specimens. (a) Smooth round bar; and (b) R12 notched round bar.
Figure 16.
The finite element models for 2024-T351 aluminum alloy tension specimens. (a) Smooth round bar; and (b) R12 notched round bar.

Figure 17.
Comparison between the model predictions and the test data for true stress-true strain curve for 2024-T351 aluminum alloy smooth round bar tension test.
Figure 17.
Comparison between the model predictions and the test data for true stress-true strain curve for 2024-T351 aluminum alloy smooth round bar tension test.

Figure 18.
Comparisons of the model predictions with the experimentally observed failure pattern (cup and cone) of the 2024-T351 aluminum alloy smooth round bar specimen in tension at room temperature. (a) The present model; (b) the experimental observation adapted from [52] with permission from Elsevier, 2008; (c) the JC constitutive model with the JC failure criterion; and (d) the JC constitutive model with the BW fracture criterion.
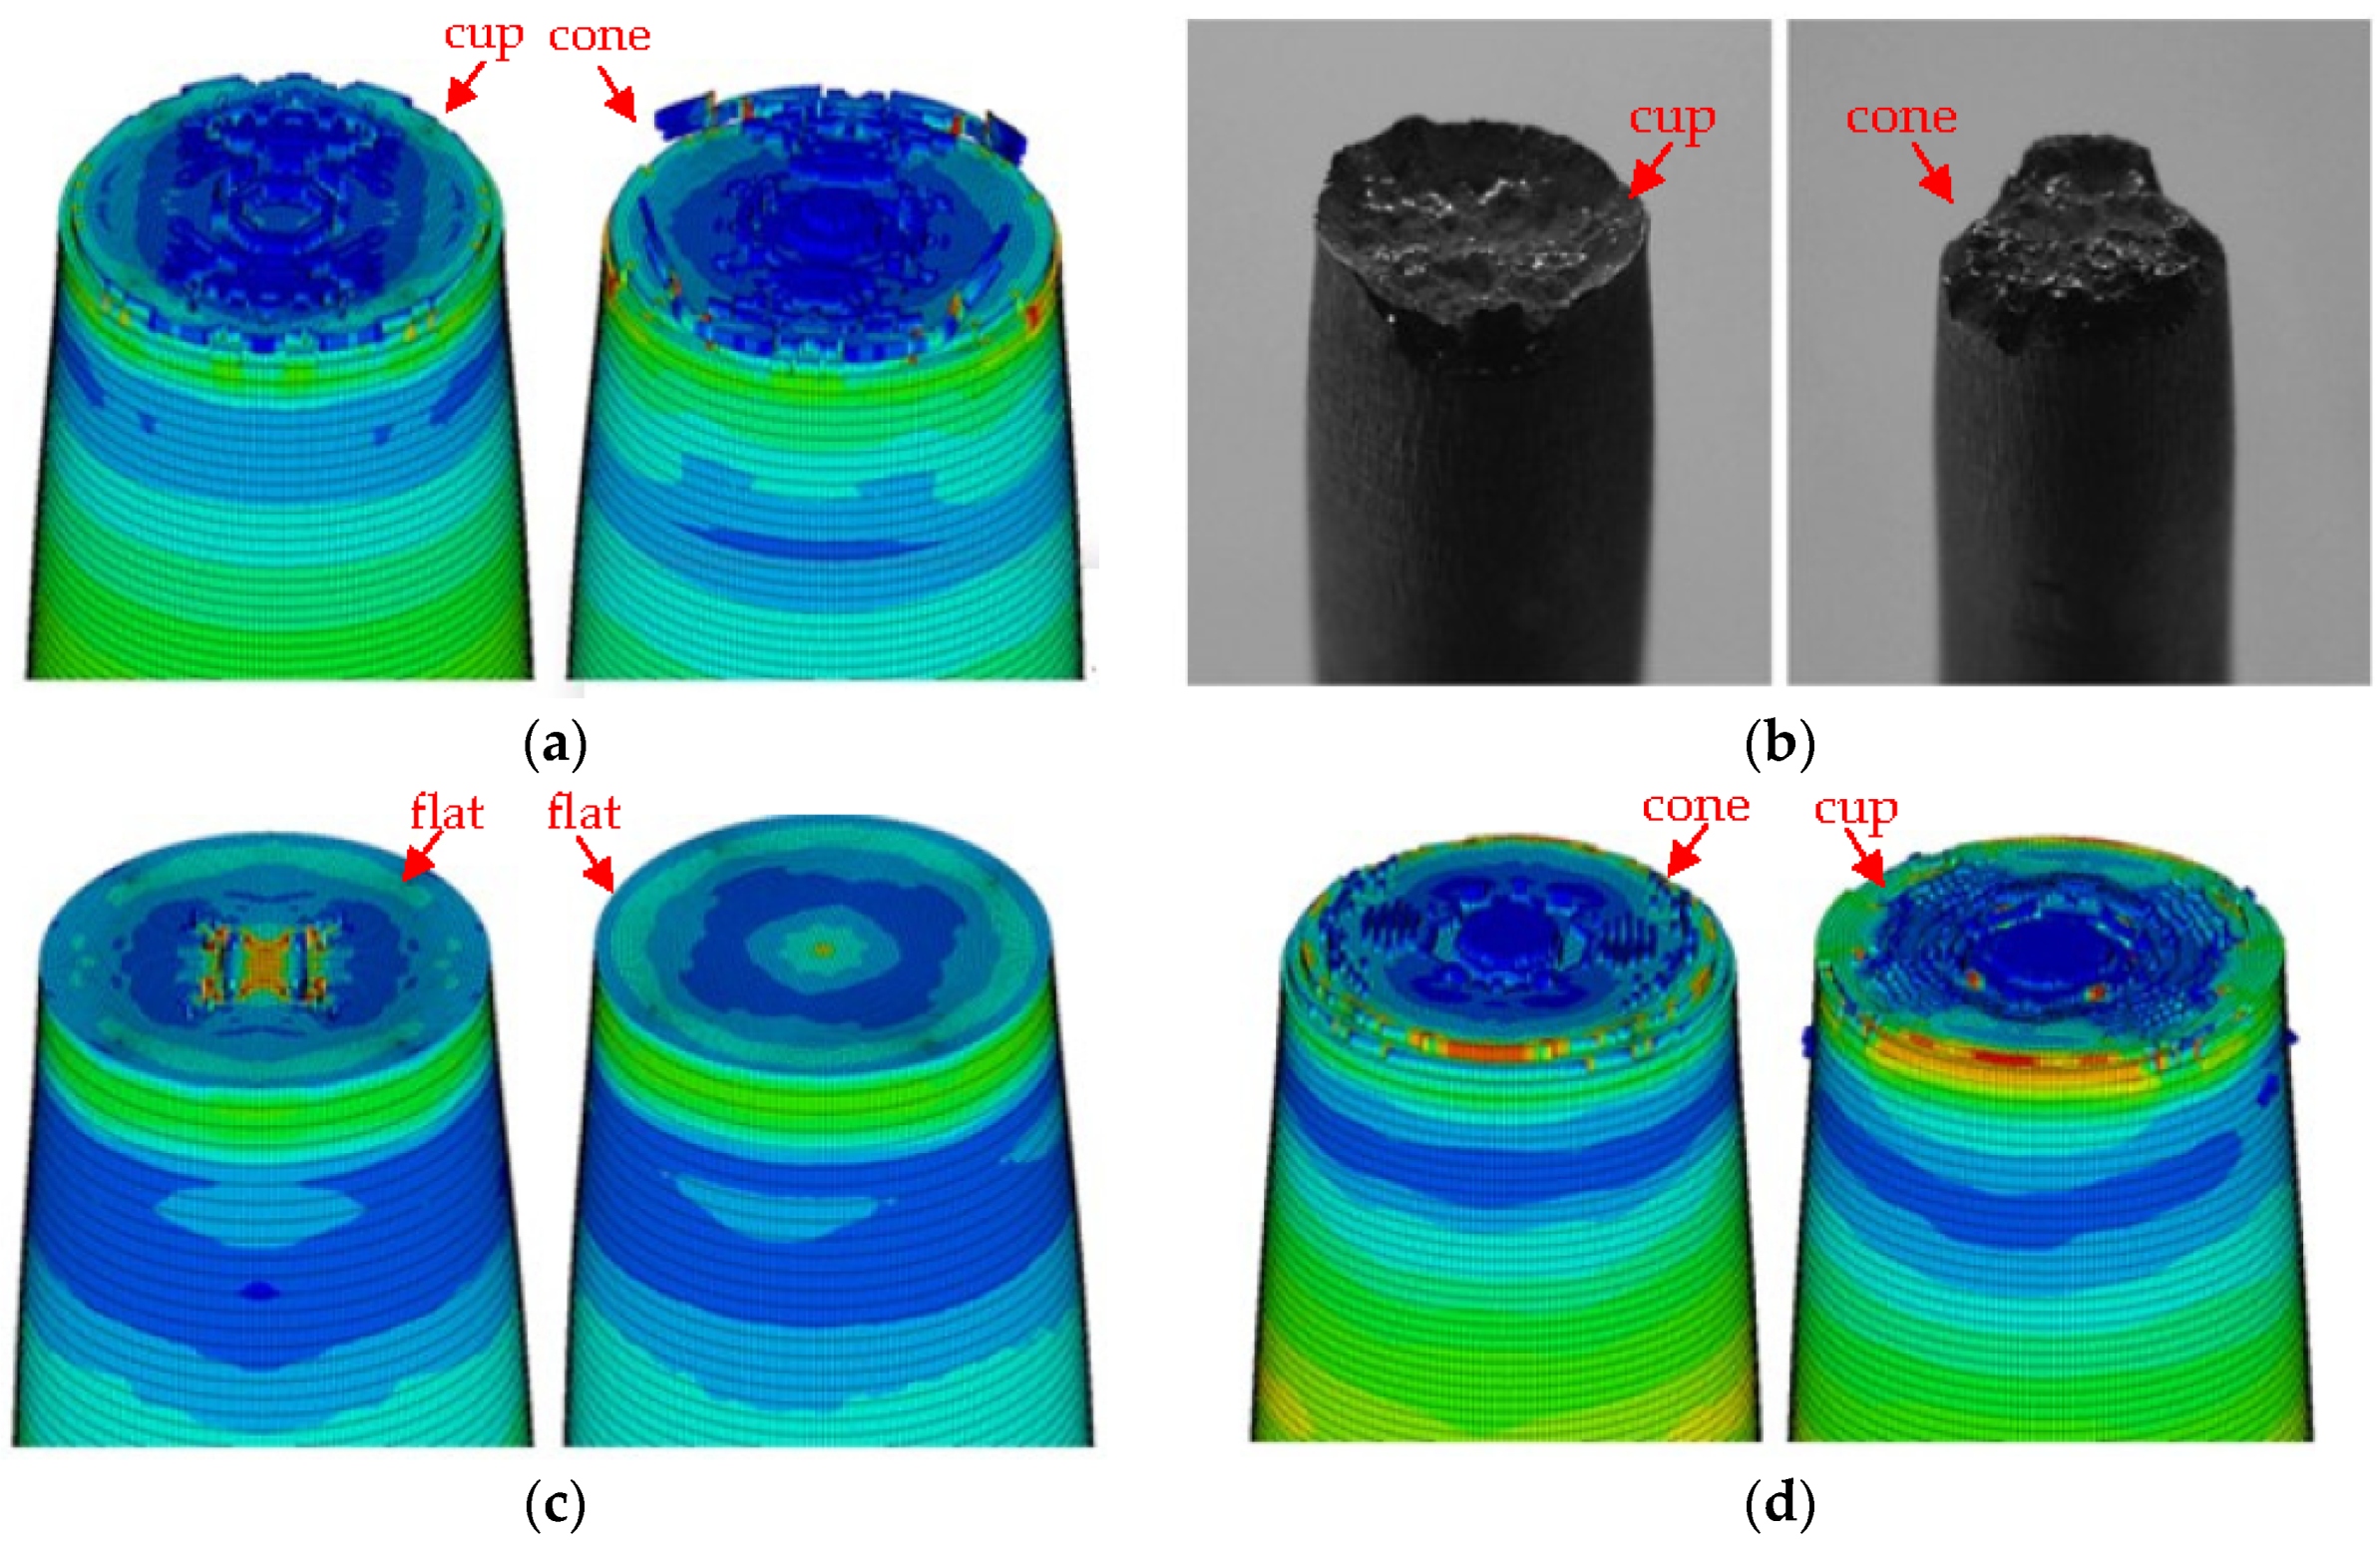
Figure 19.
Comparisons between the model predictions and the experimental data for load-displacement curve for 2024-T351 aluminum alloy R12 notched round bar tension test.
Figure 19.
Comparisons between the model predictions and the experimental data for load-displacement curve for 2024-T351 aluminum alloy R12 notched round bar tension test.

Figure 20.
Comparisons of the model predictions with the experimentally observed failure pattern (cup and cone) of the 2024-T351 aluminum alloy R12 notched round bar specimen in tension at room temperature. (a) The present model; (b) the experimental observation adapted from [52] with permission from Elsevier, 2008; (c) the JC constitutive model with the JC failure criterion; and (d) the JC constitutive model with the BW fracture criterion.

Figure 21.
Finite element model used in the numerical simulations.
Figure 22.
Comparison of the numerically predicted residual velocities with the test results for the perforation of the 4-mm-thick 2024-T351 aluminum alloy plates struck normally by the 5.5-mm-diameter flat-ended projectile.
Figure 22.
Comparison of the numerically predicted residual velocities with the test results for the perforation of the 4-mm-thick 2024-T351 aluminum alloy plates struck normally by the 5.5-mm-diameter flat-ended projectile.

Figure 23.
Comparisons of the numerically predicted perforation modes with the experimental observation for the perforation of the 4 mm thick 2024–T351 aluminum alloy plate struck transversely by the 5.5-mm-diameter flat-ended projectile. (a) The present model; (b) the experimental observation [53]; (c) the JC constitutive model with the JC failure criterion [53]; and (d) the JC constitutive model with the BW fracture criterion [53]. Adapted from [53] with permission from MDPI, 2018.

Figure 24.
Finite element model used in the numerical simulations.

Figure 25.
Comparisons of the numerically predicted residual velocities with the test results for the perforation of 2024-T351 aluminum alloy plates struck normally by the 7.5-mm-diameter spherical projectile. (a) 1-mm plate; (b) 4-mm plate.
Figure 25.
Comparisons of the numerically predicted residual velocities with the test results for the perforation of 2024-T351 aluminum alloy plates struck normally by the 7.5-mm-diameter spherical projectile. (a) 1-mm plate; (b) 4-mm plate.
Figure 26.
Comparisons of the model predictions with experimental observation for the perforation of 4-mm-thick 2024-T351 aluminum alloy-plated struck transversely by a 7.5-mm-diameter spherical projectile. (a) The present model; (b) the experimental observation [53]; (c) the JC constitutive model with the JC failure criterion [53]; and (d) the JC constitutive model with the BW fracture criterion [53]. Adapted from [53], with permission from MDPI, 2018.


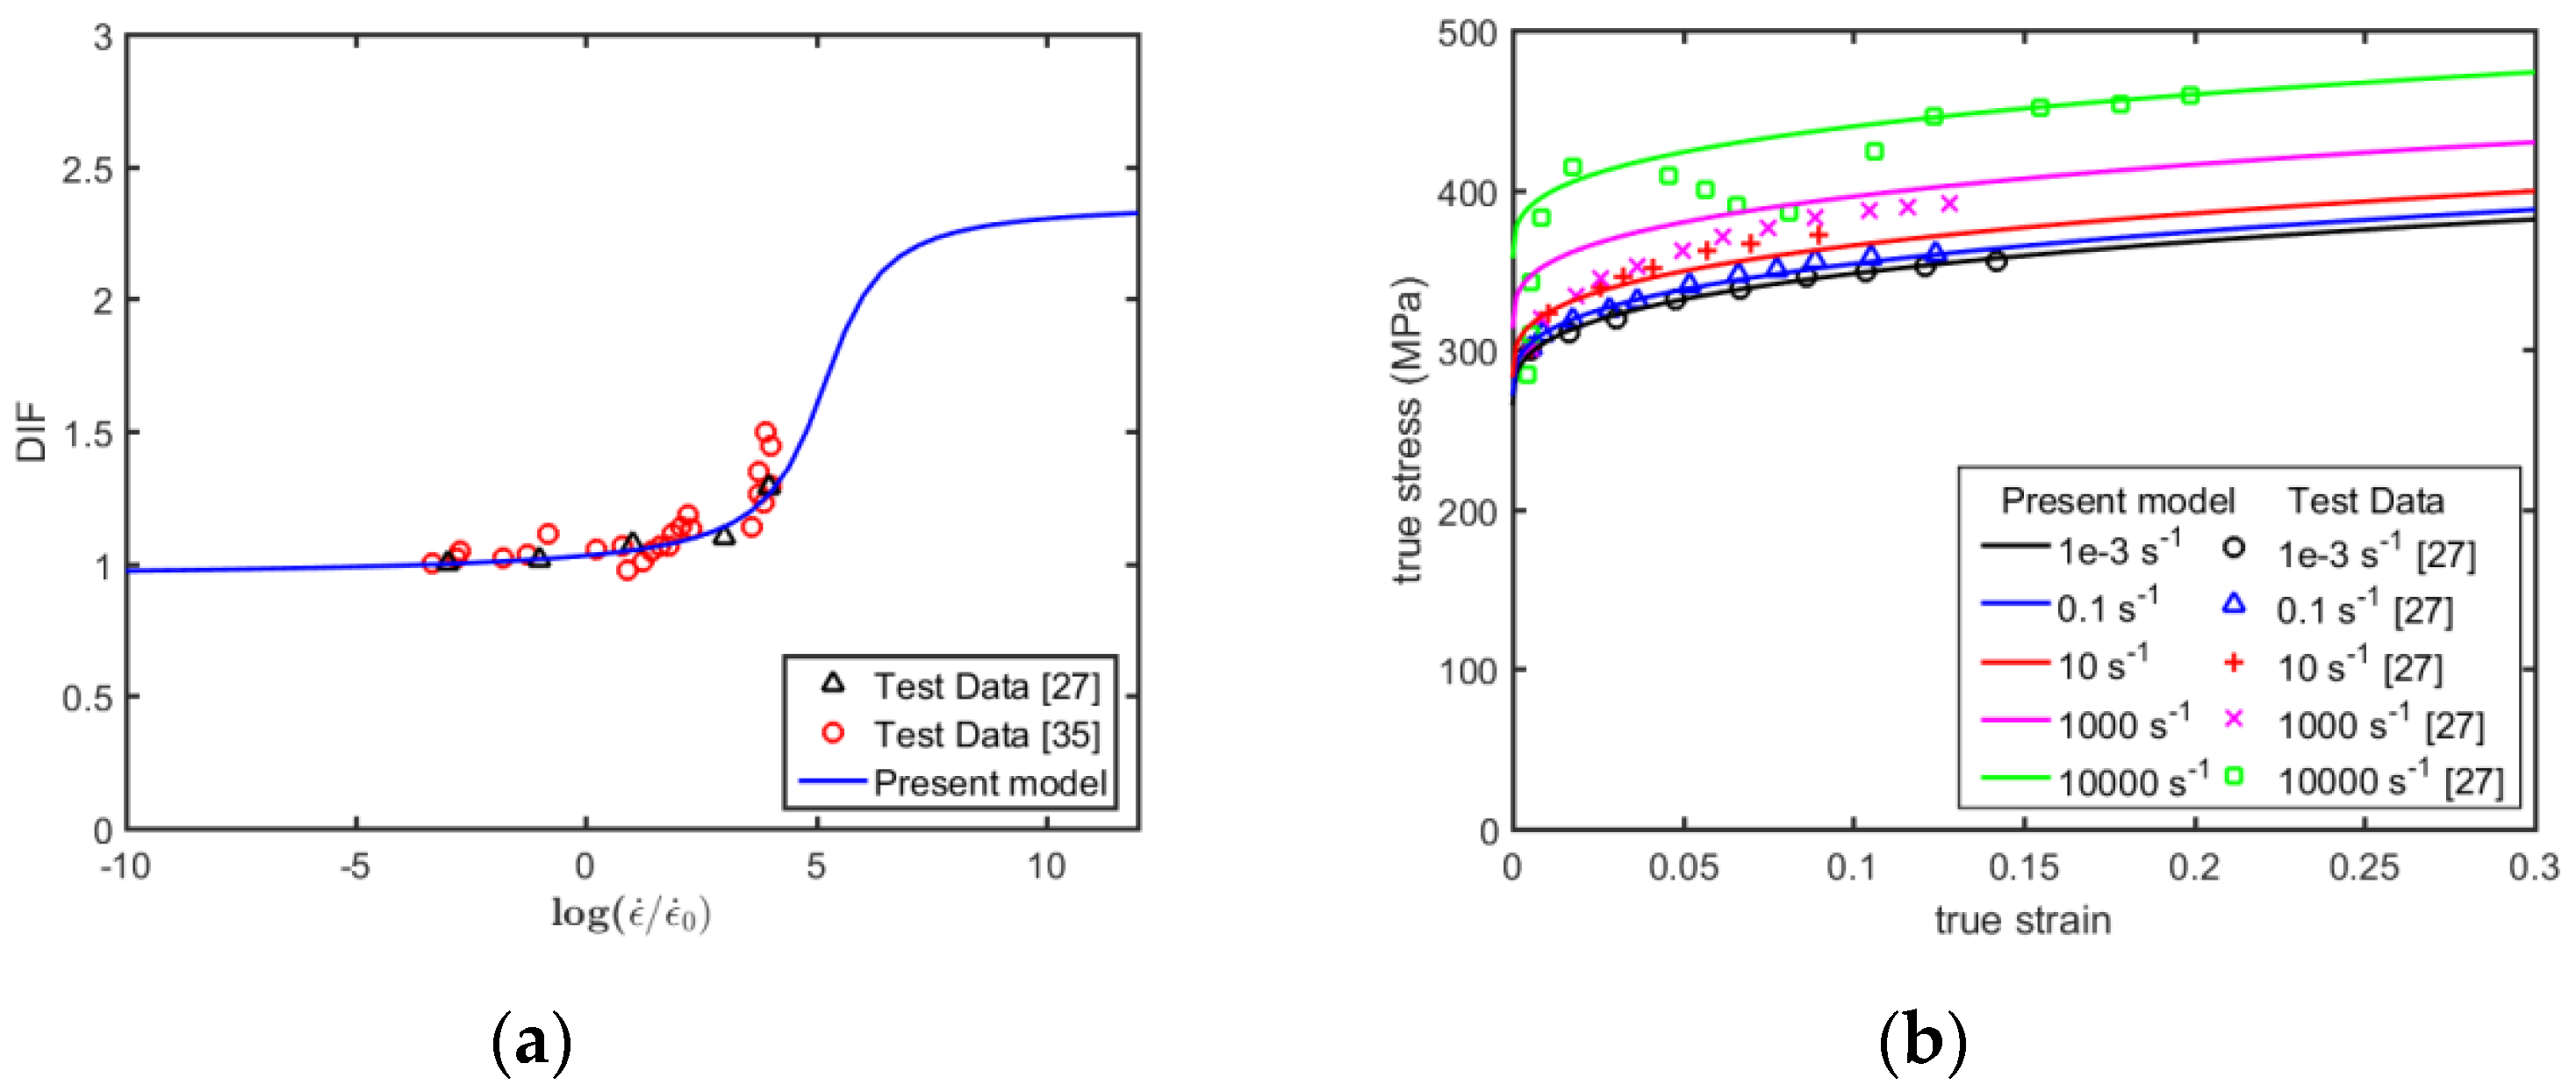
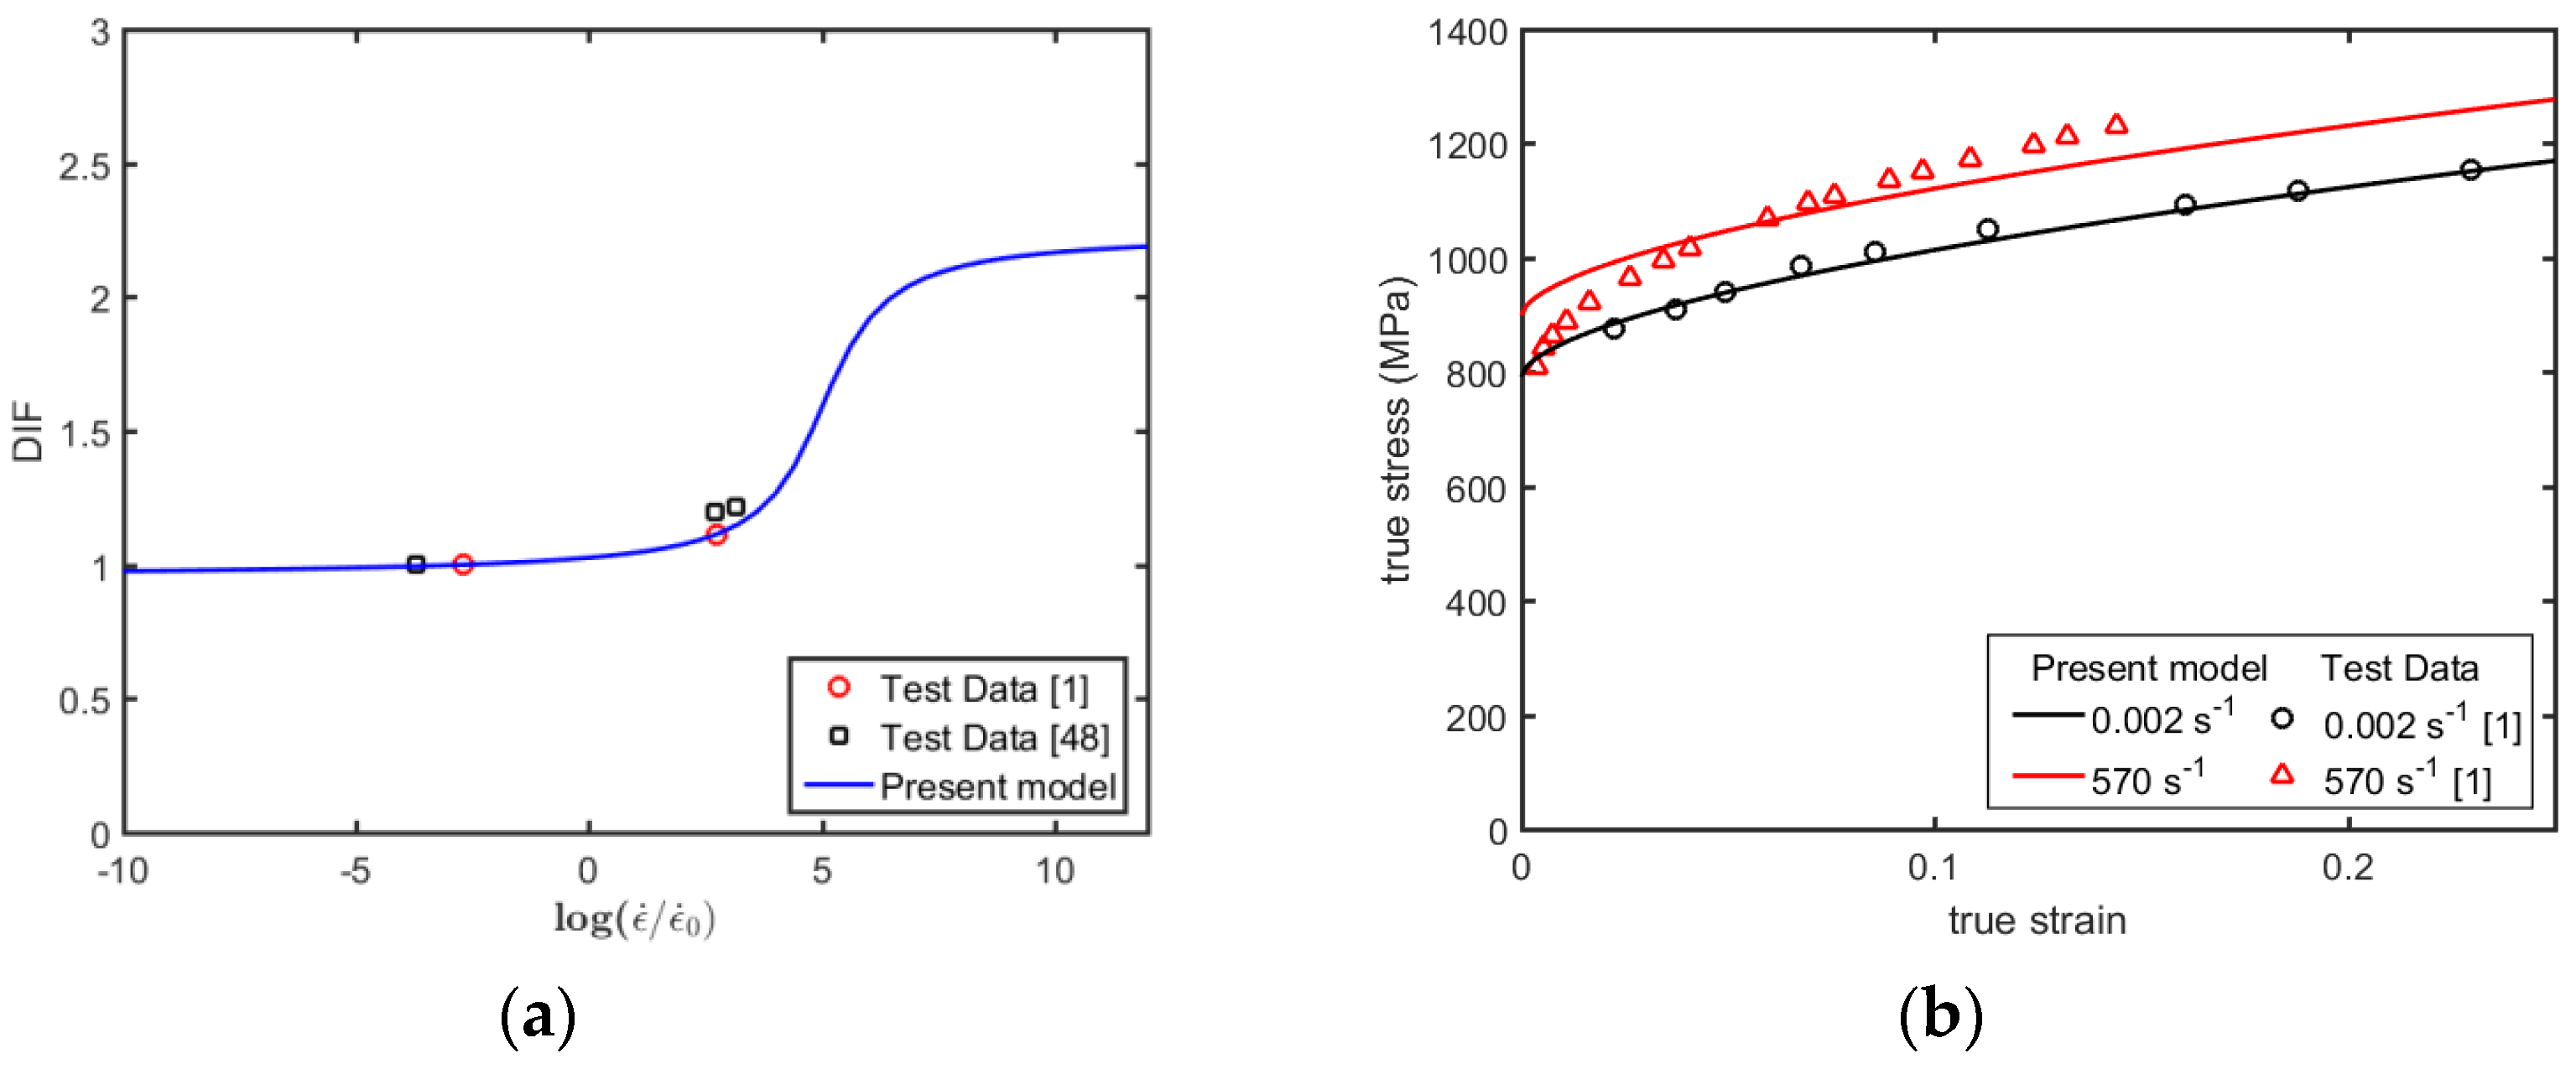
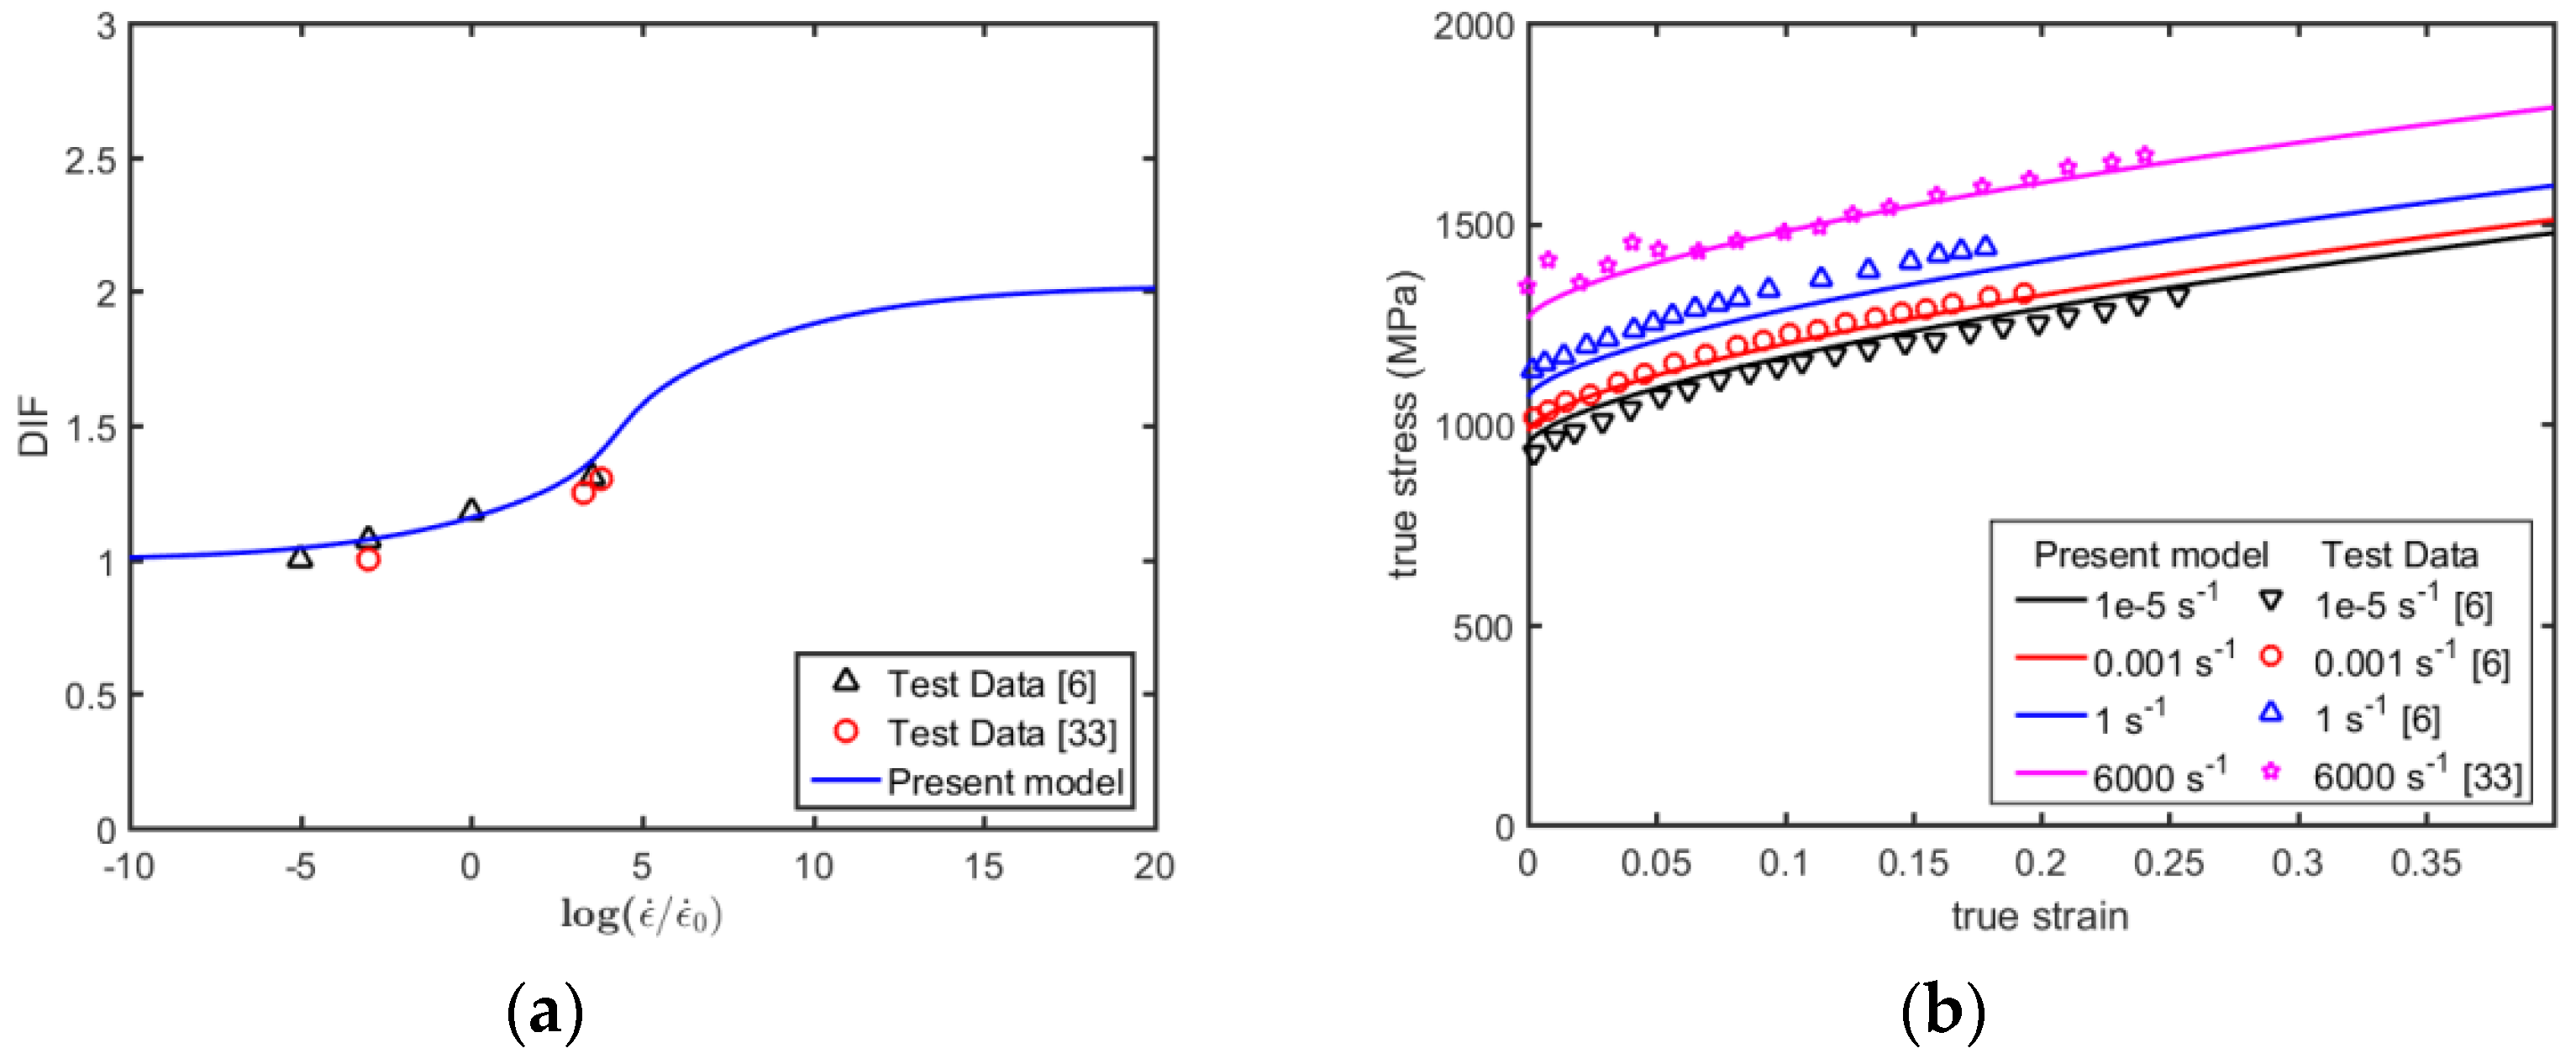
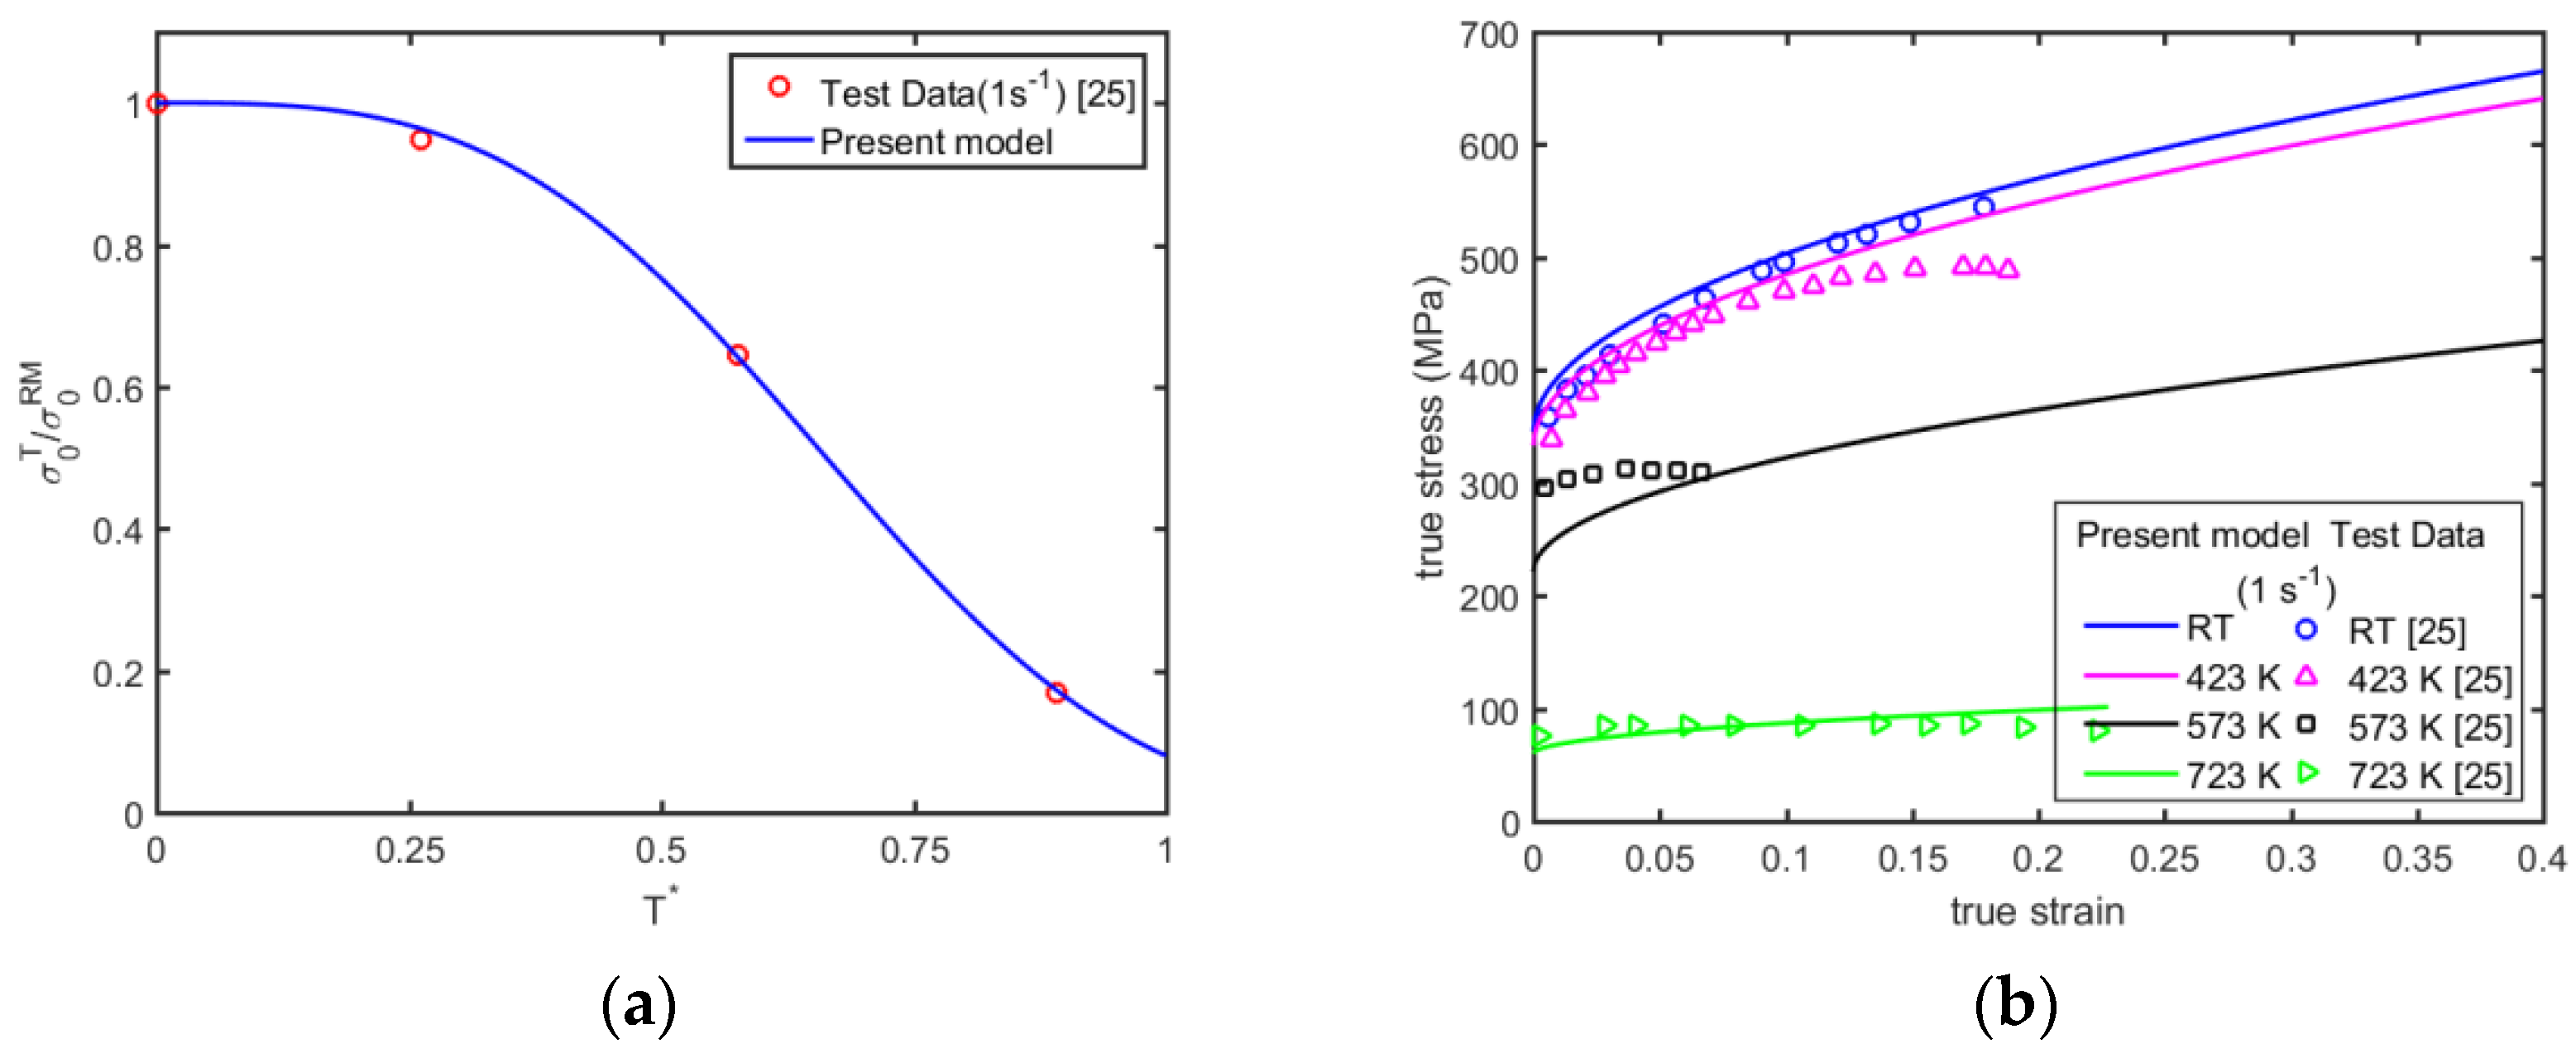
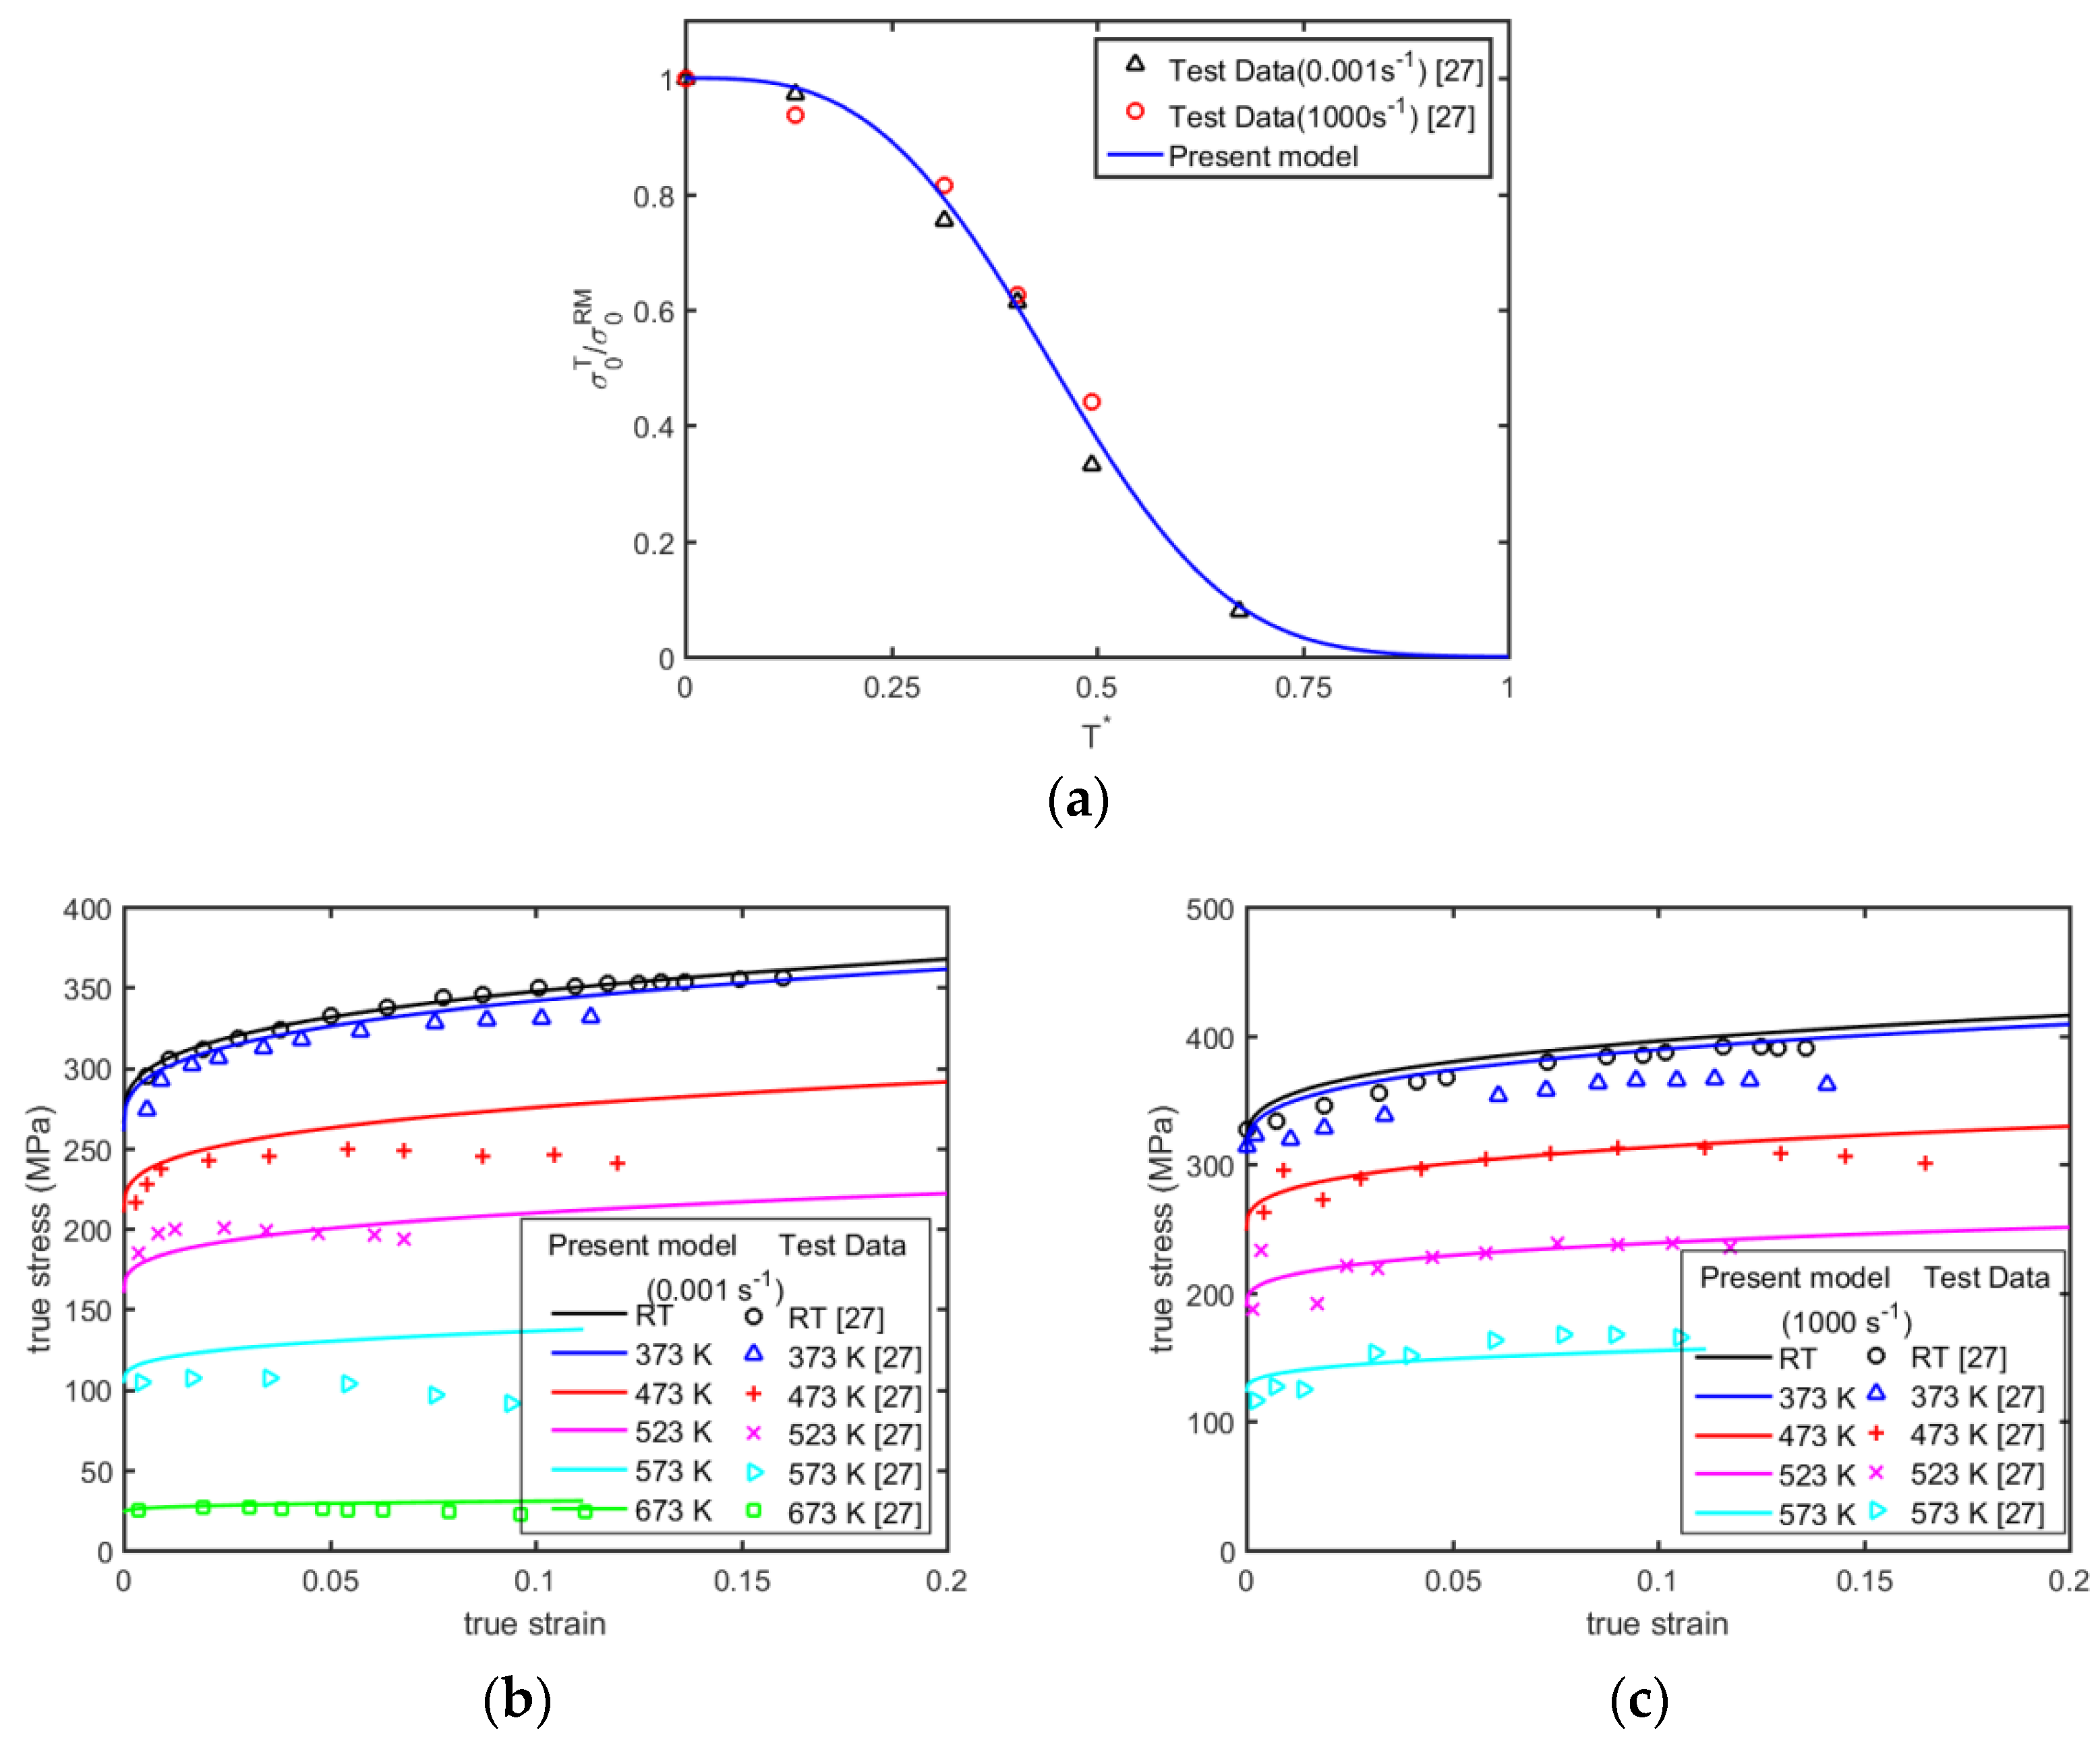
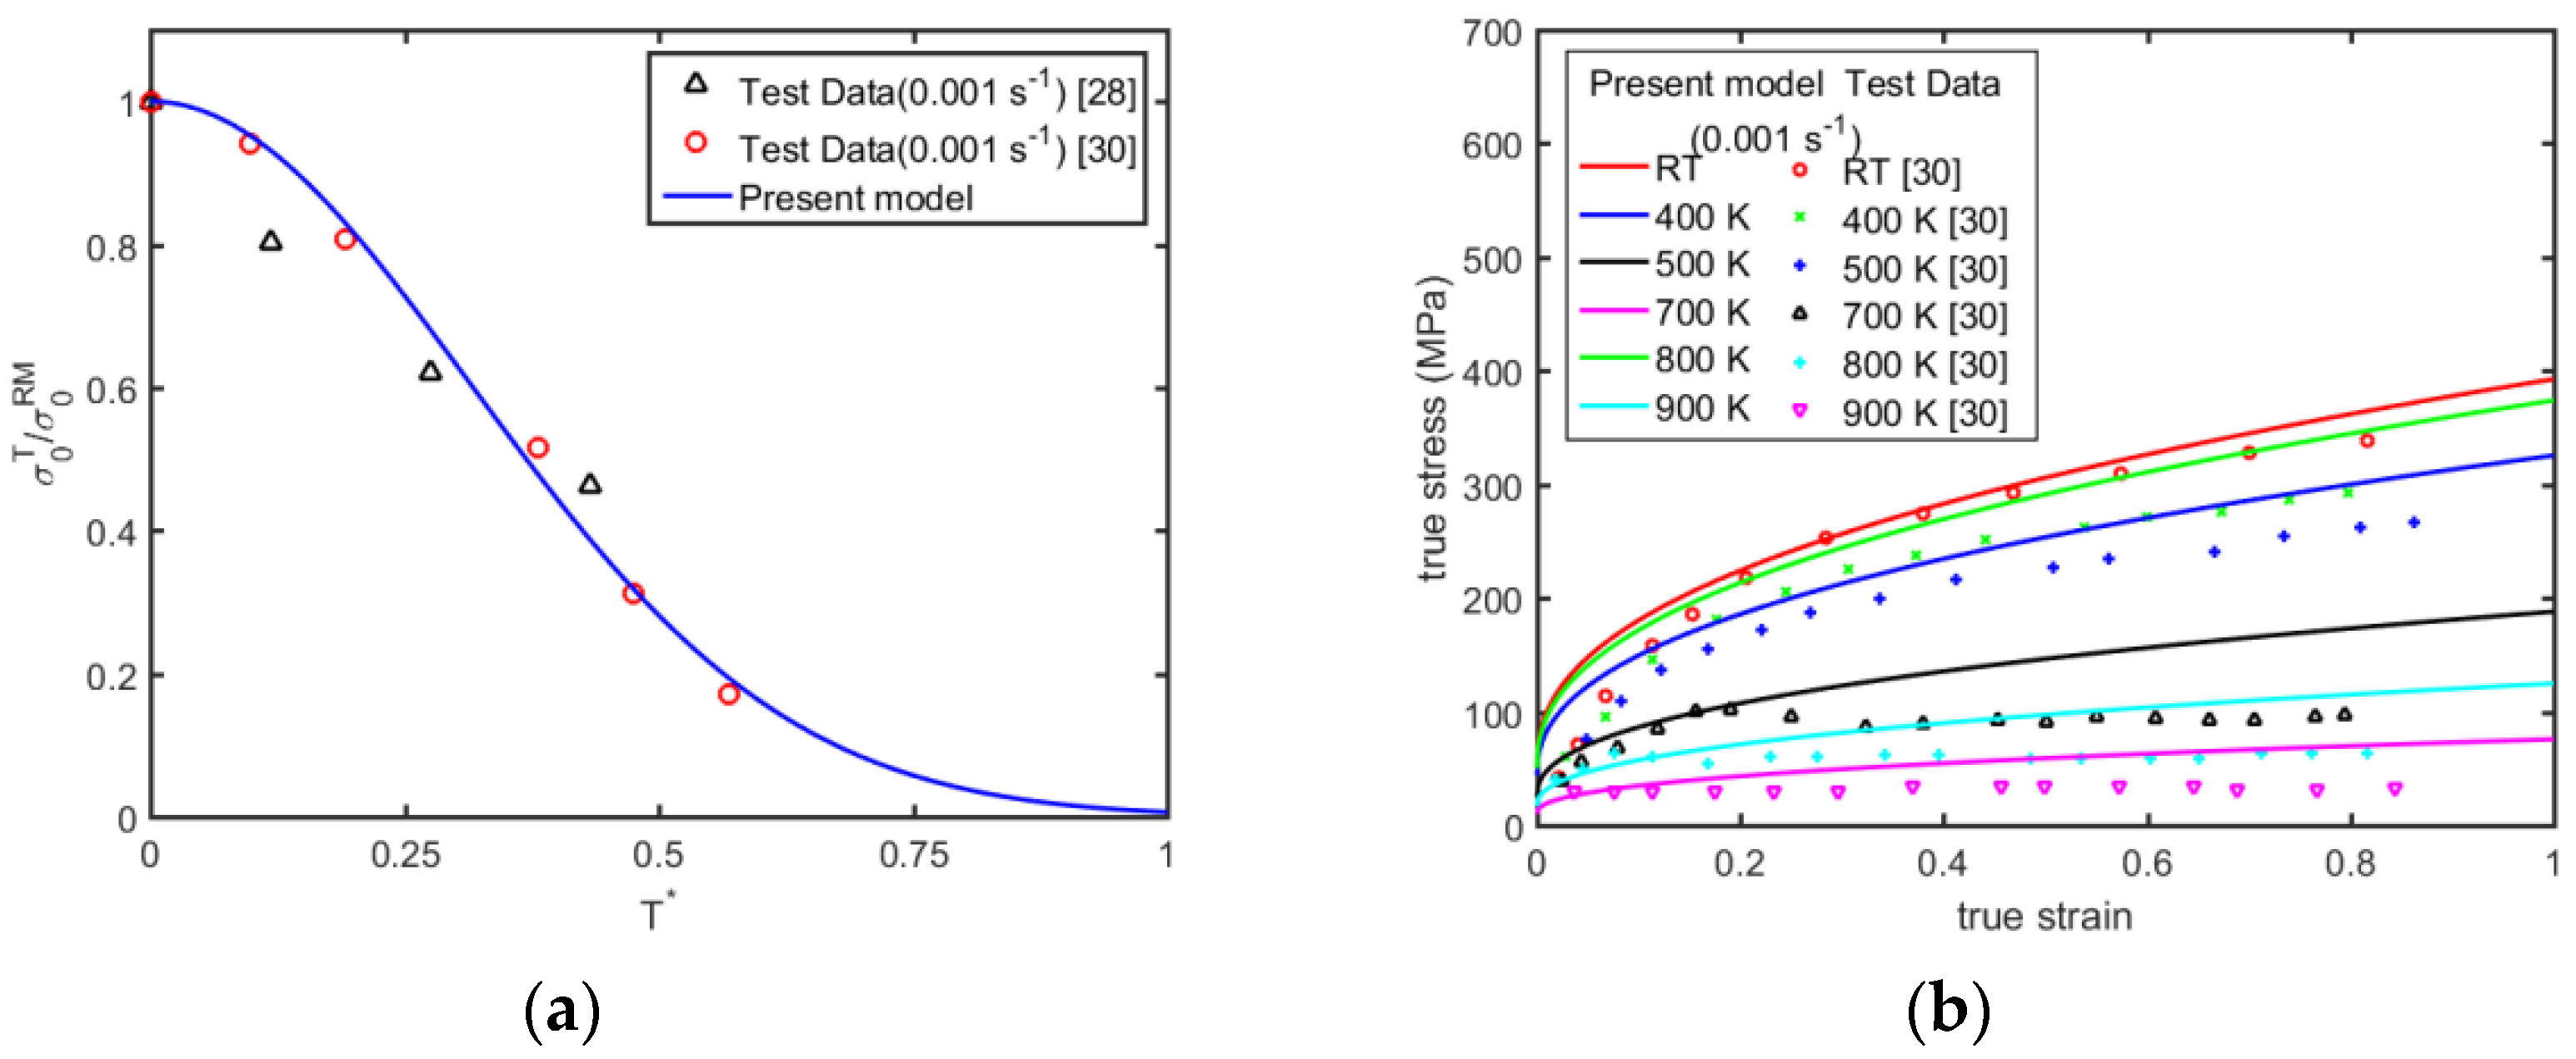
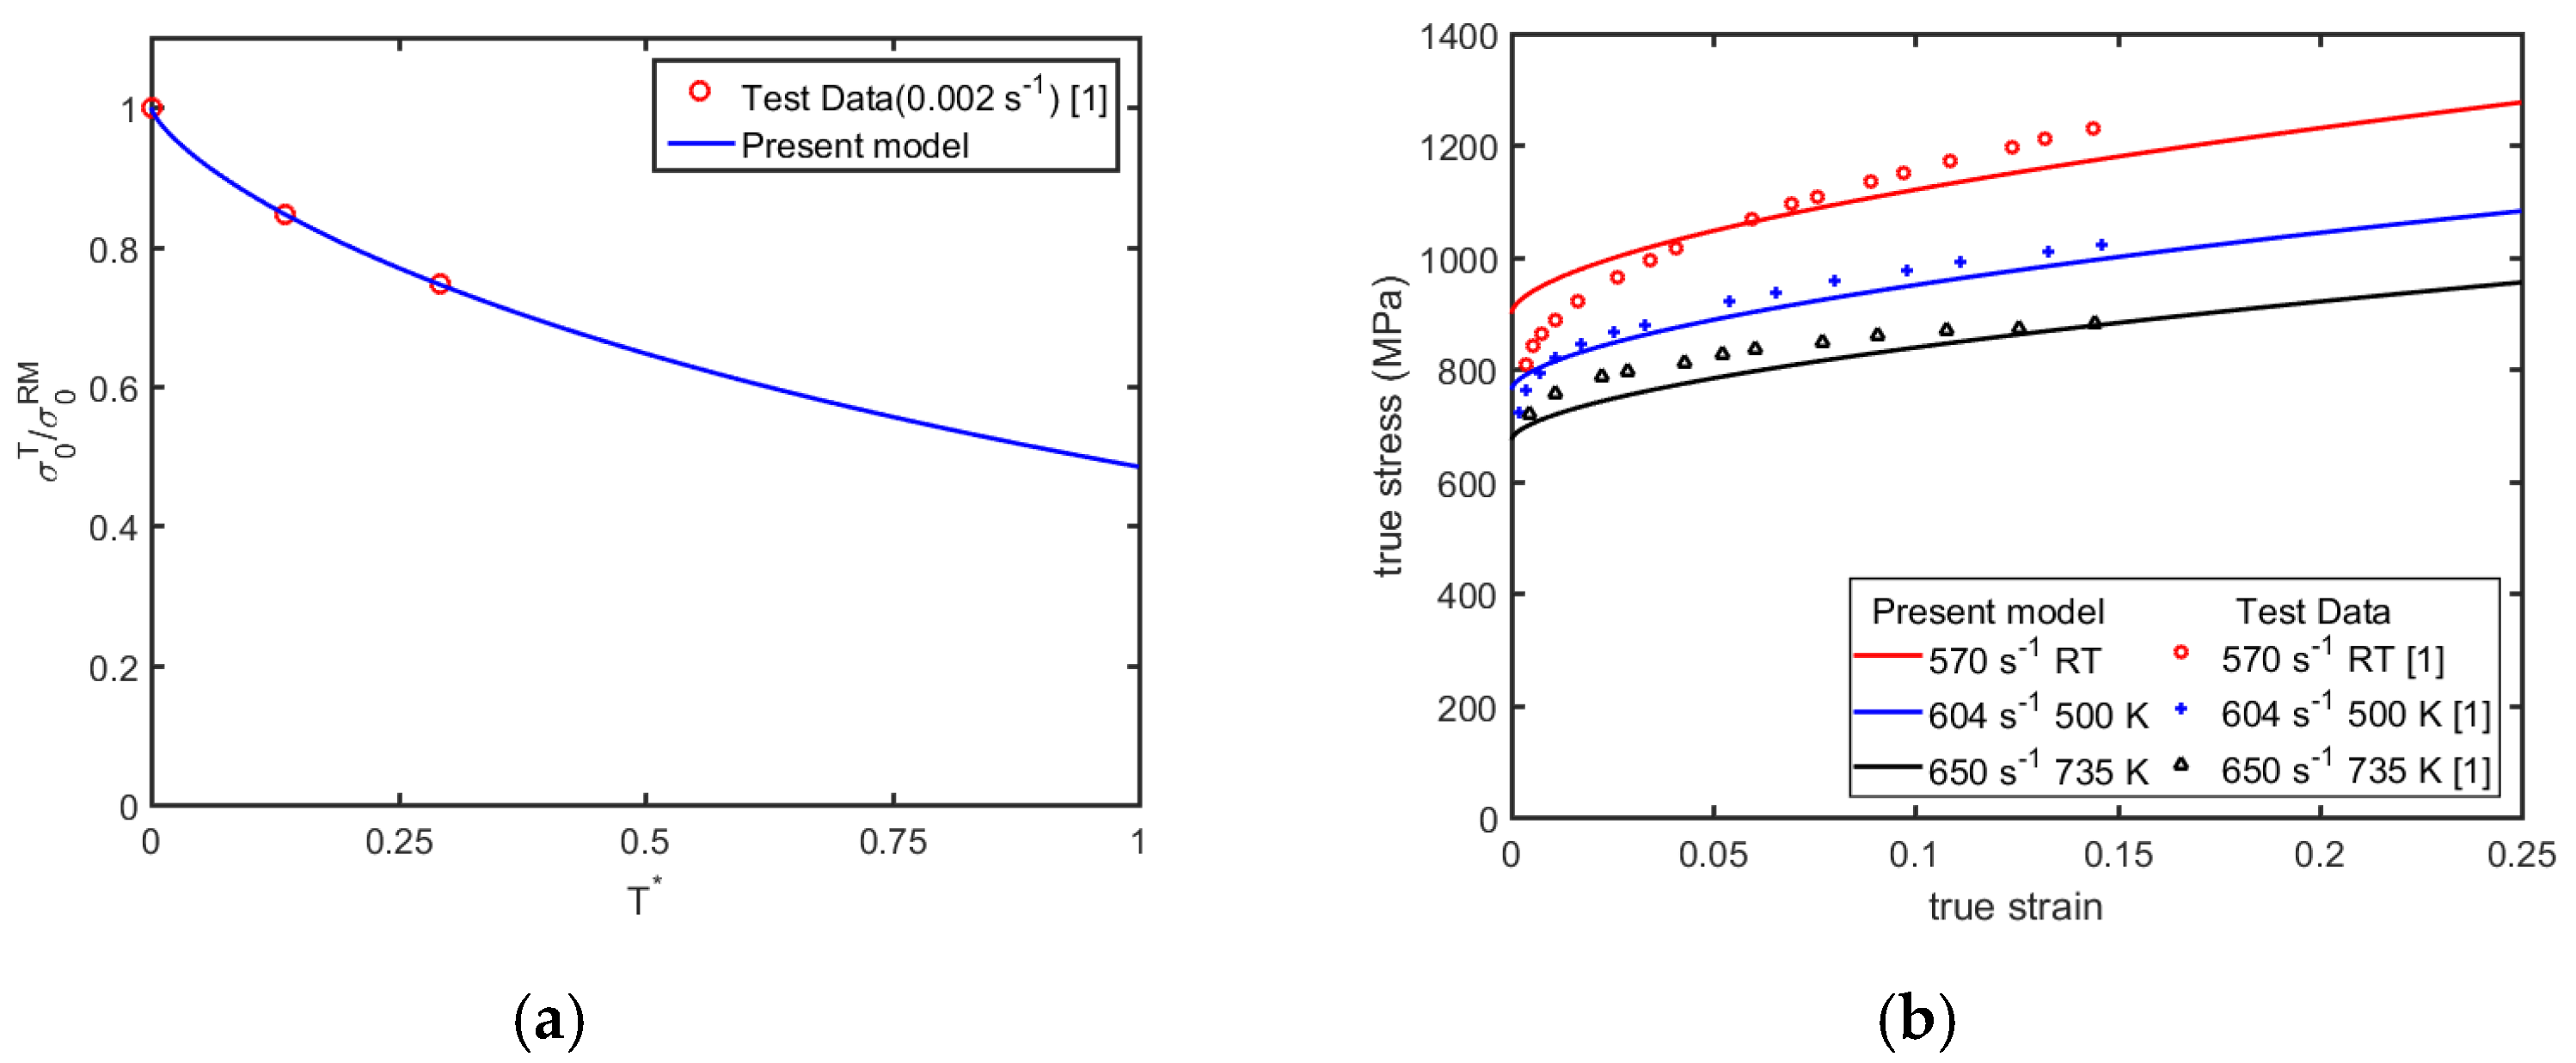
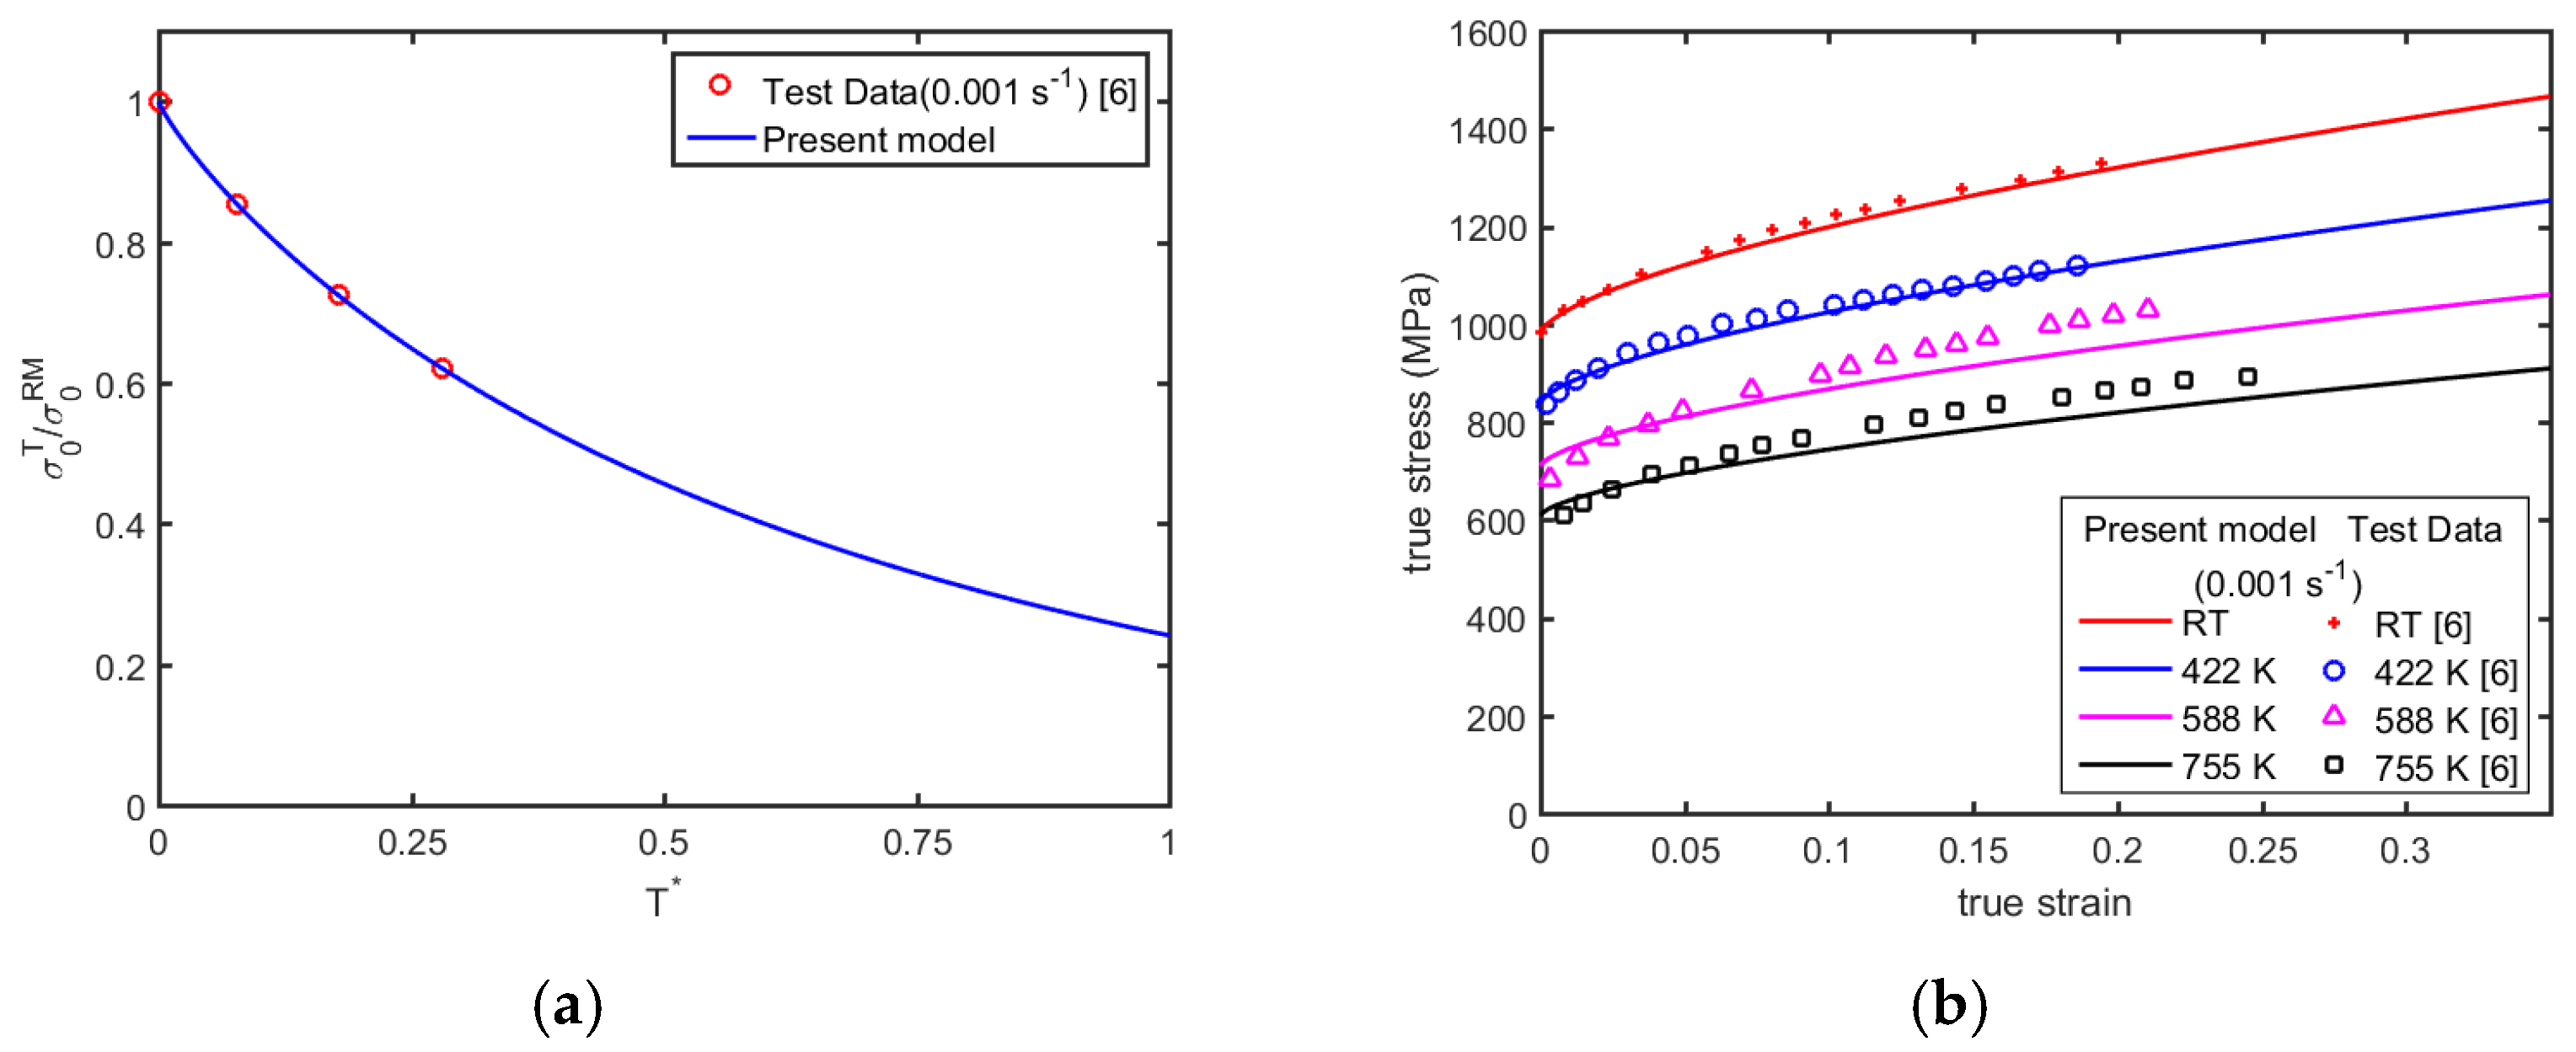
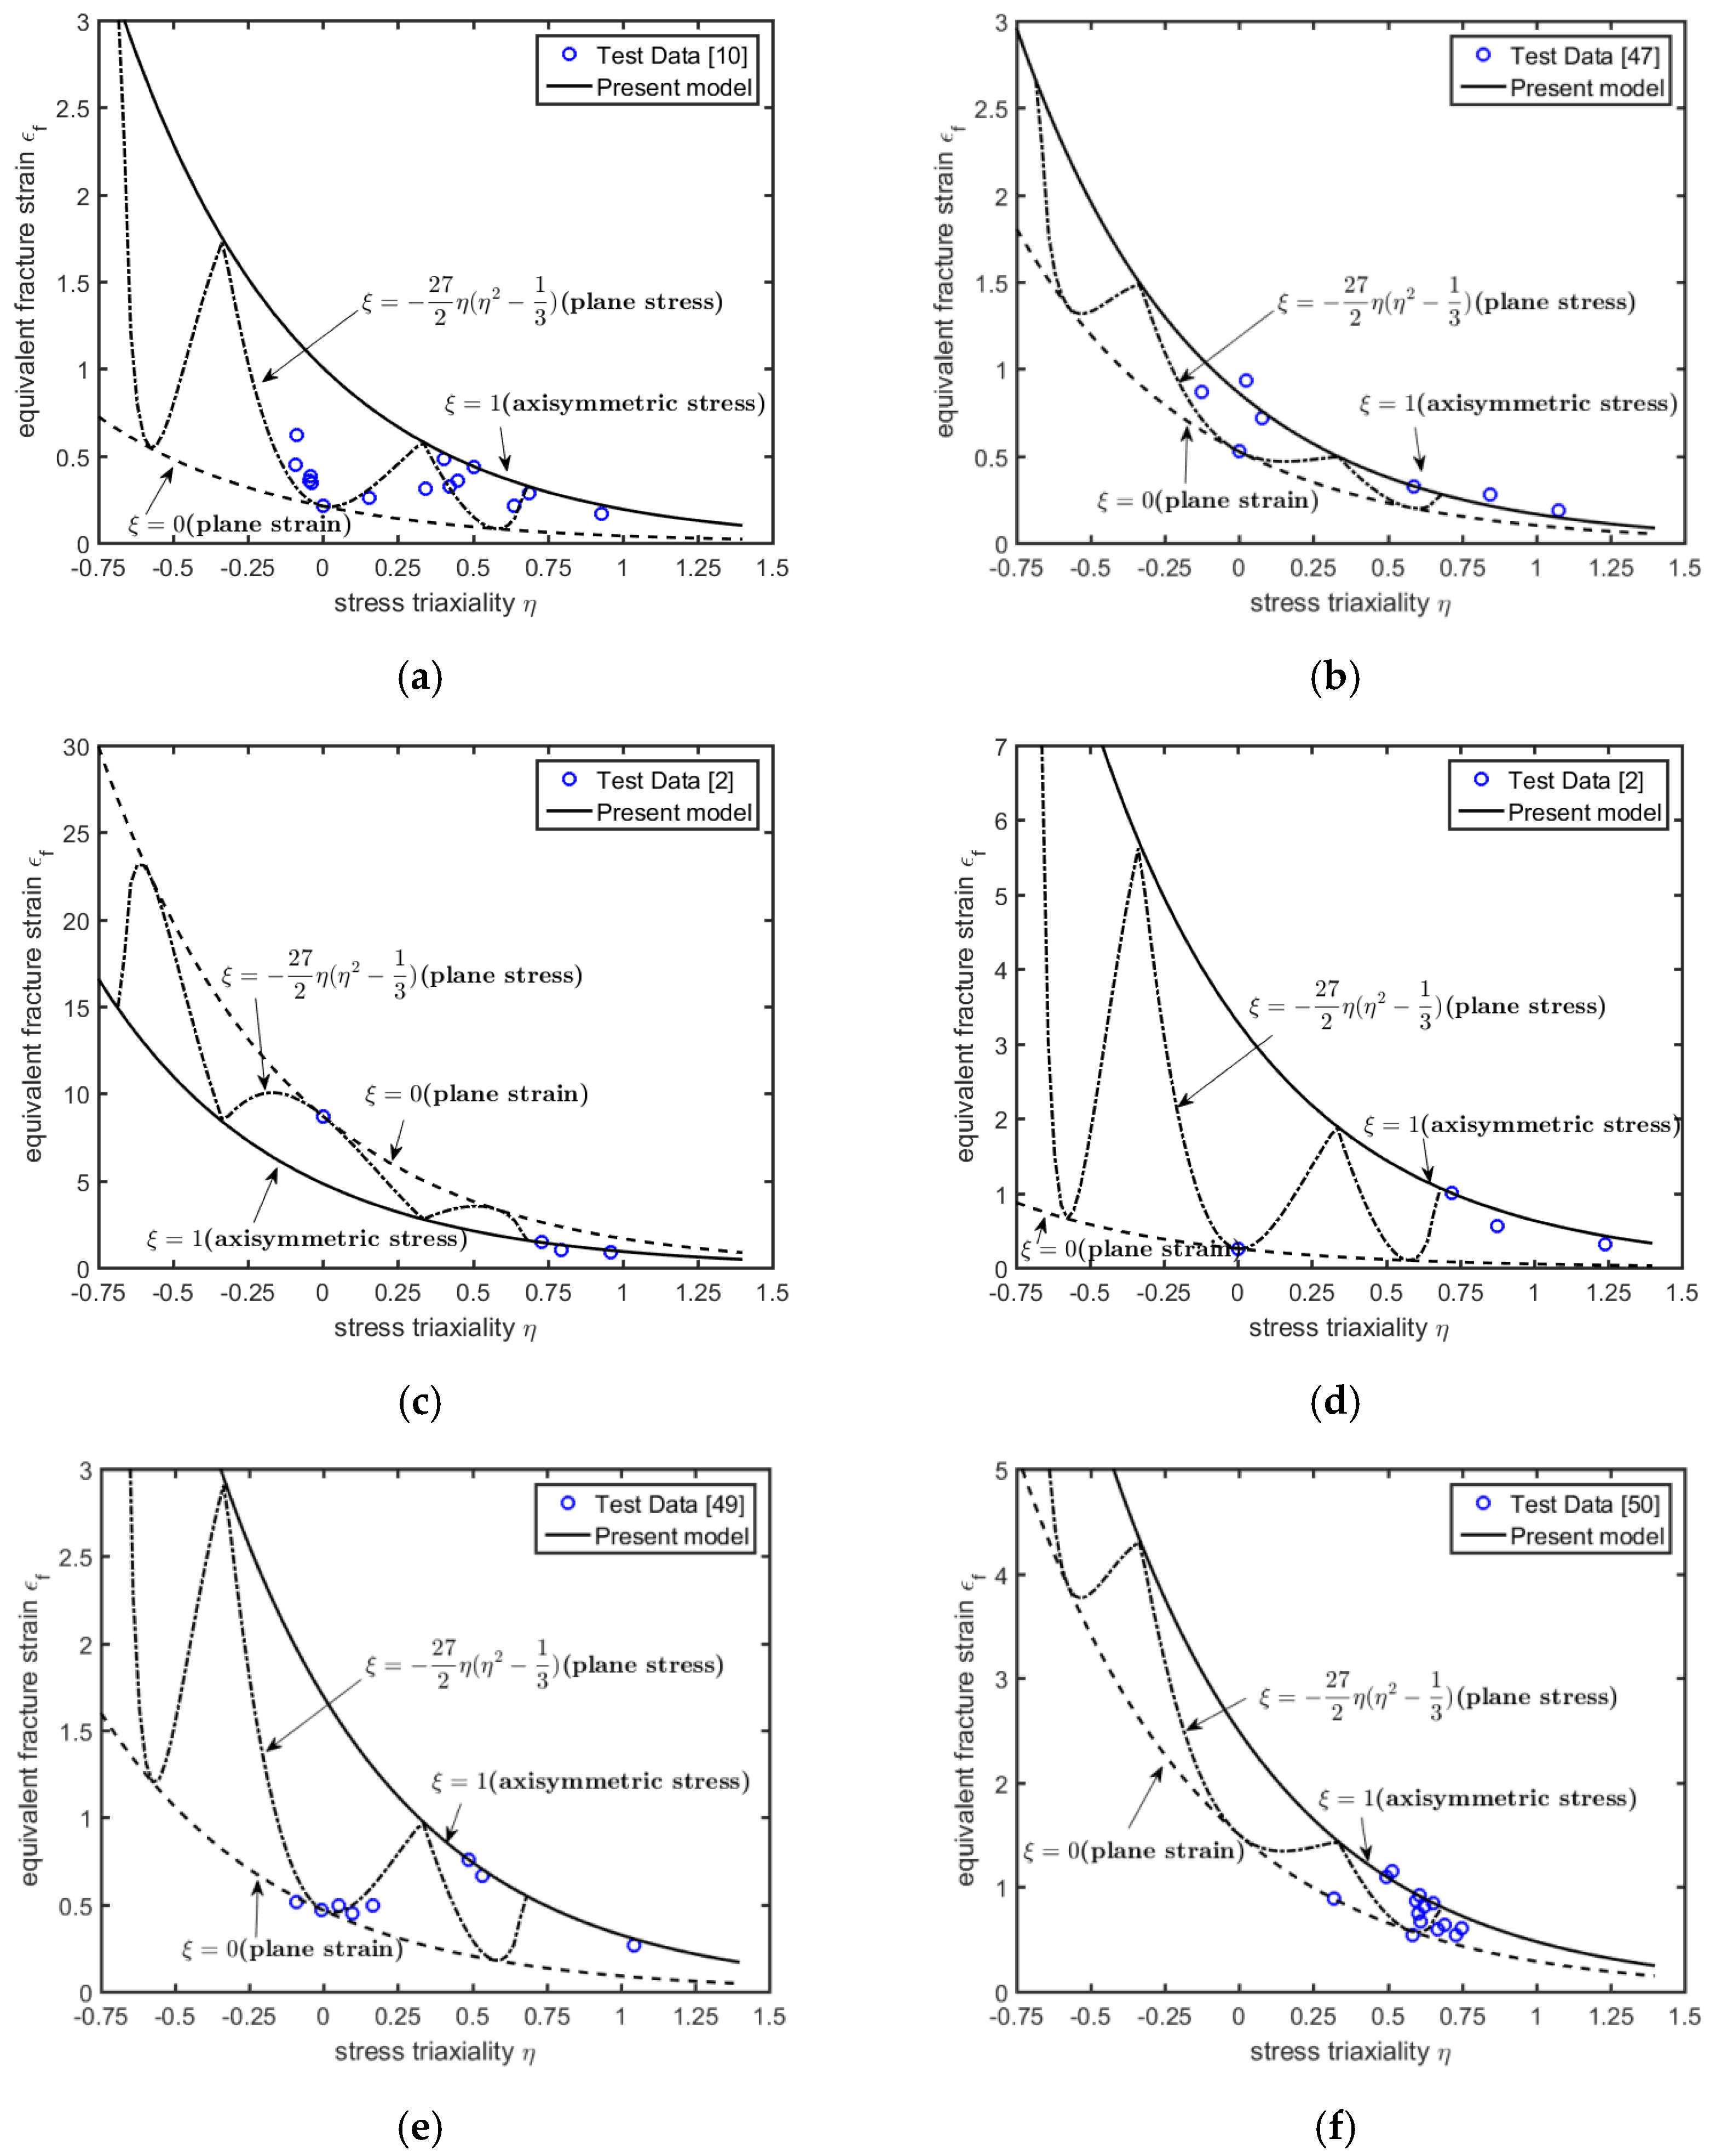
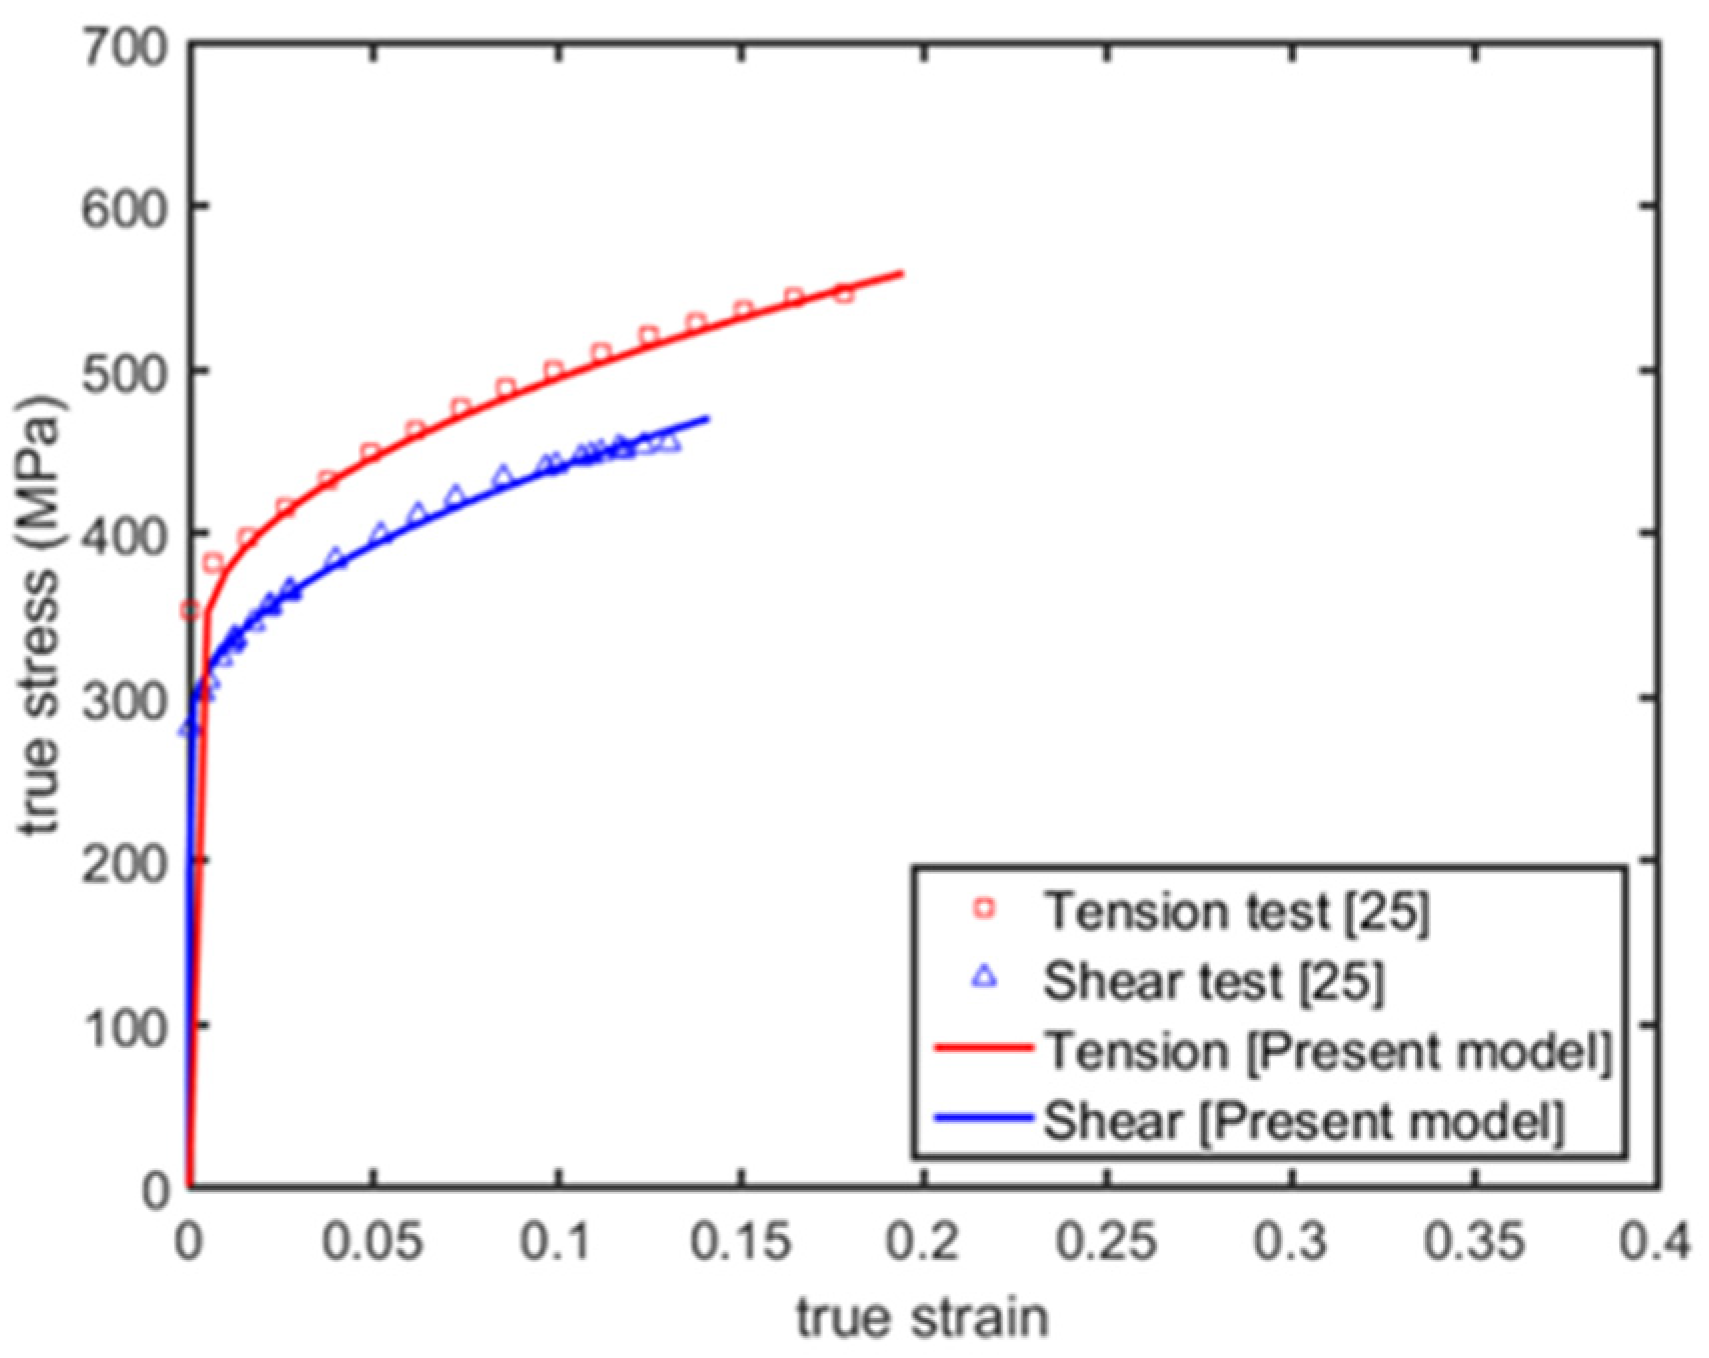
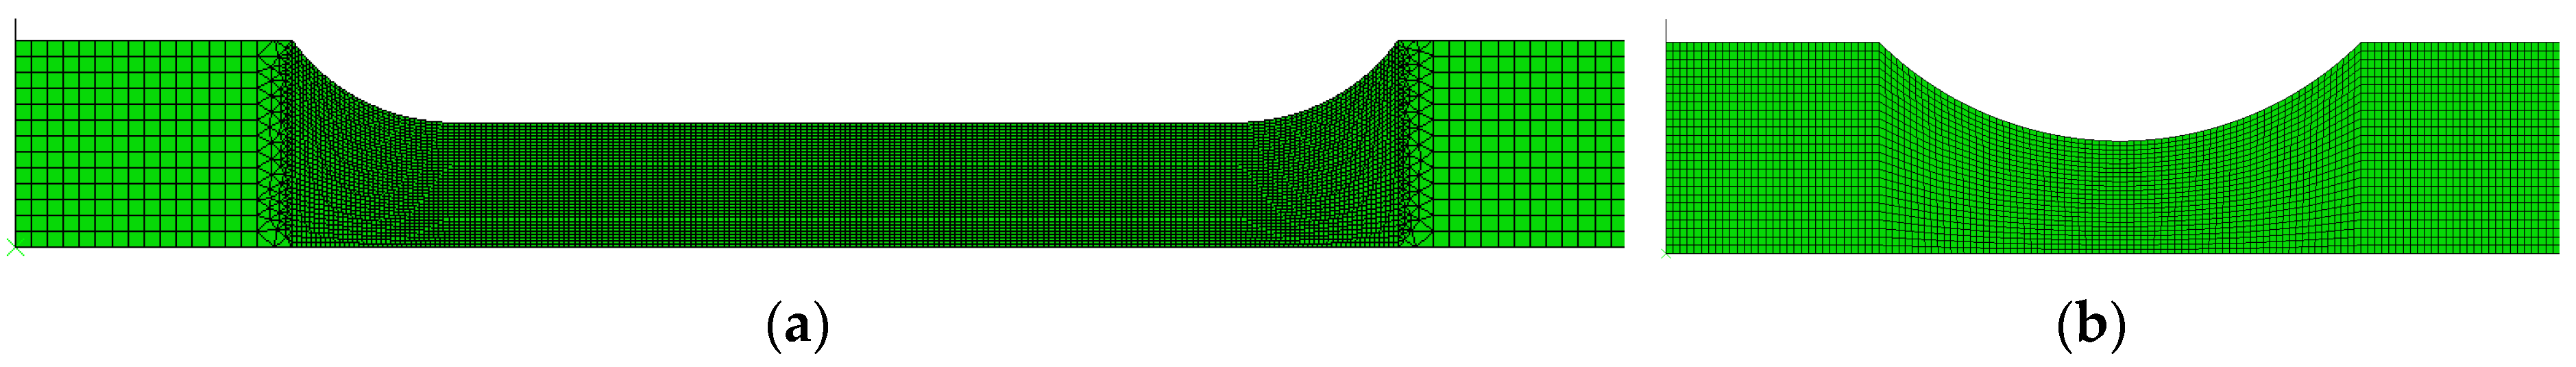
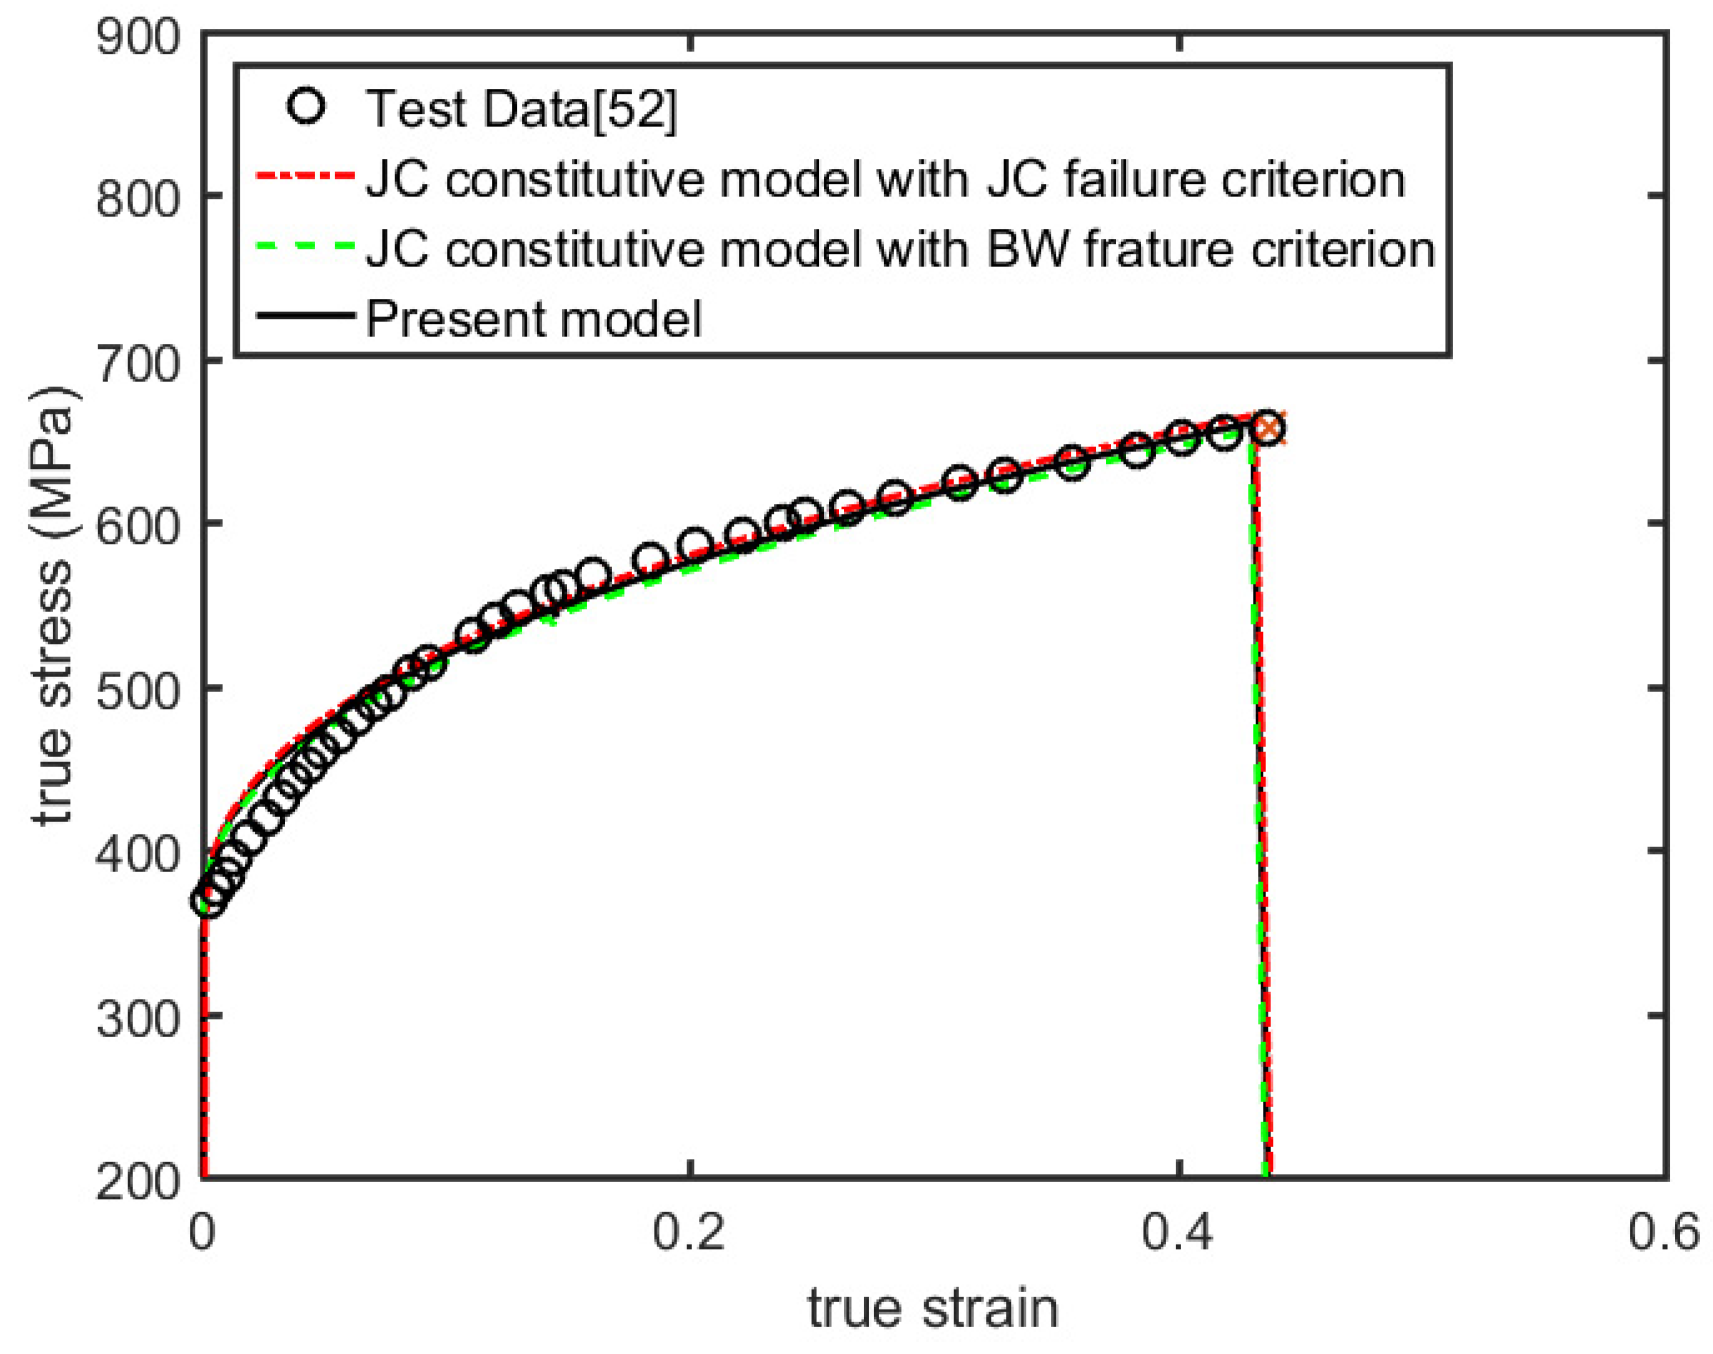
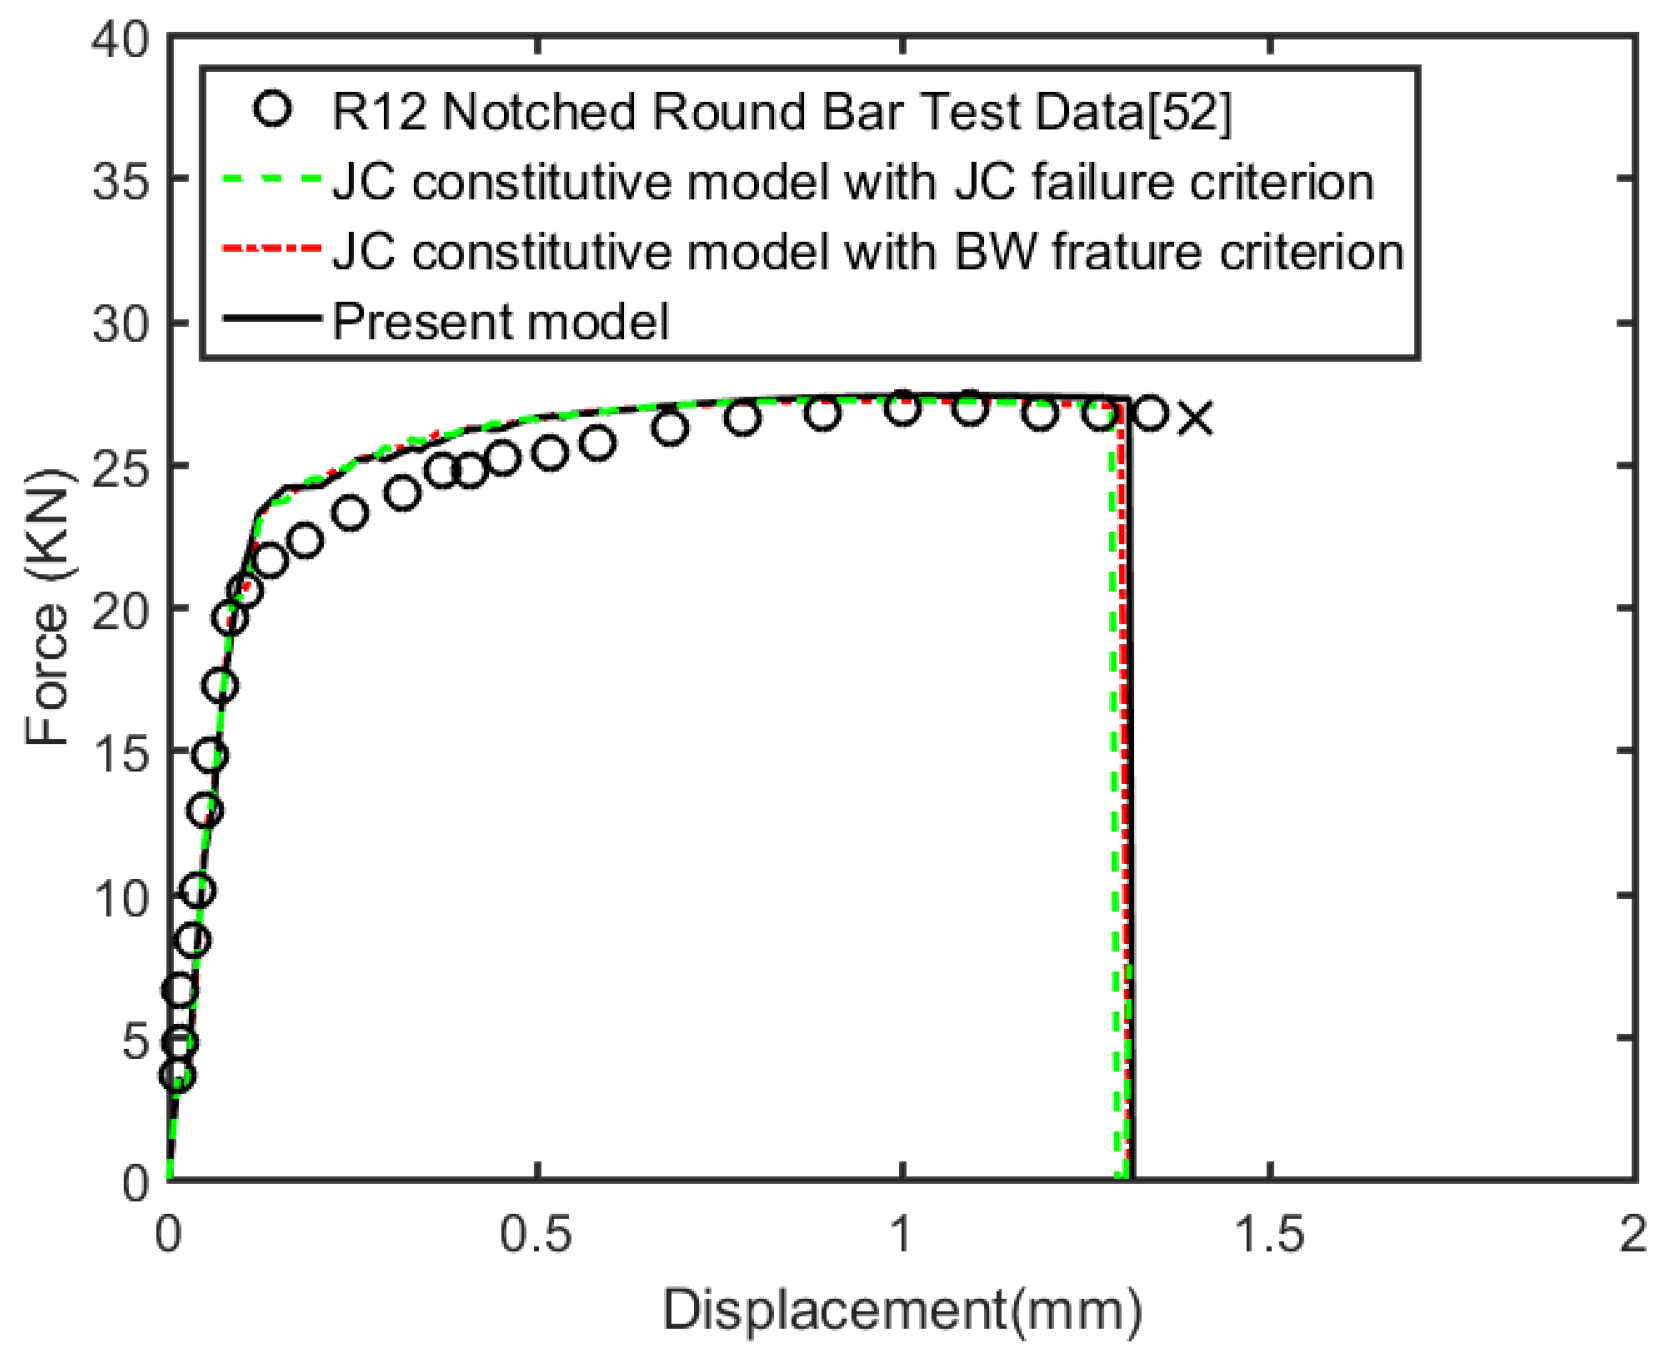
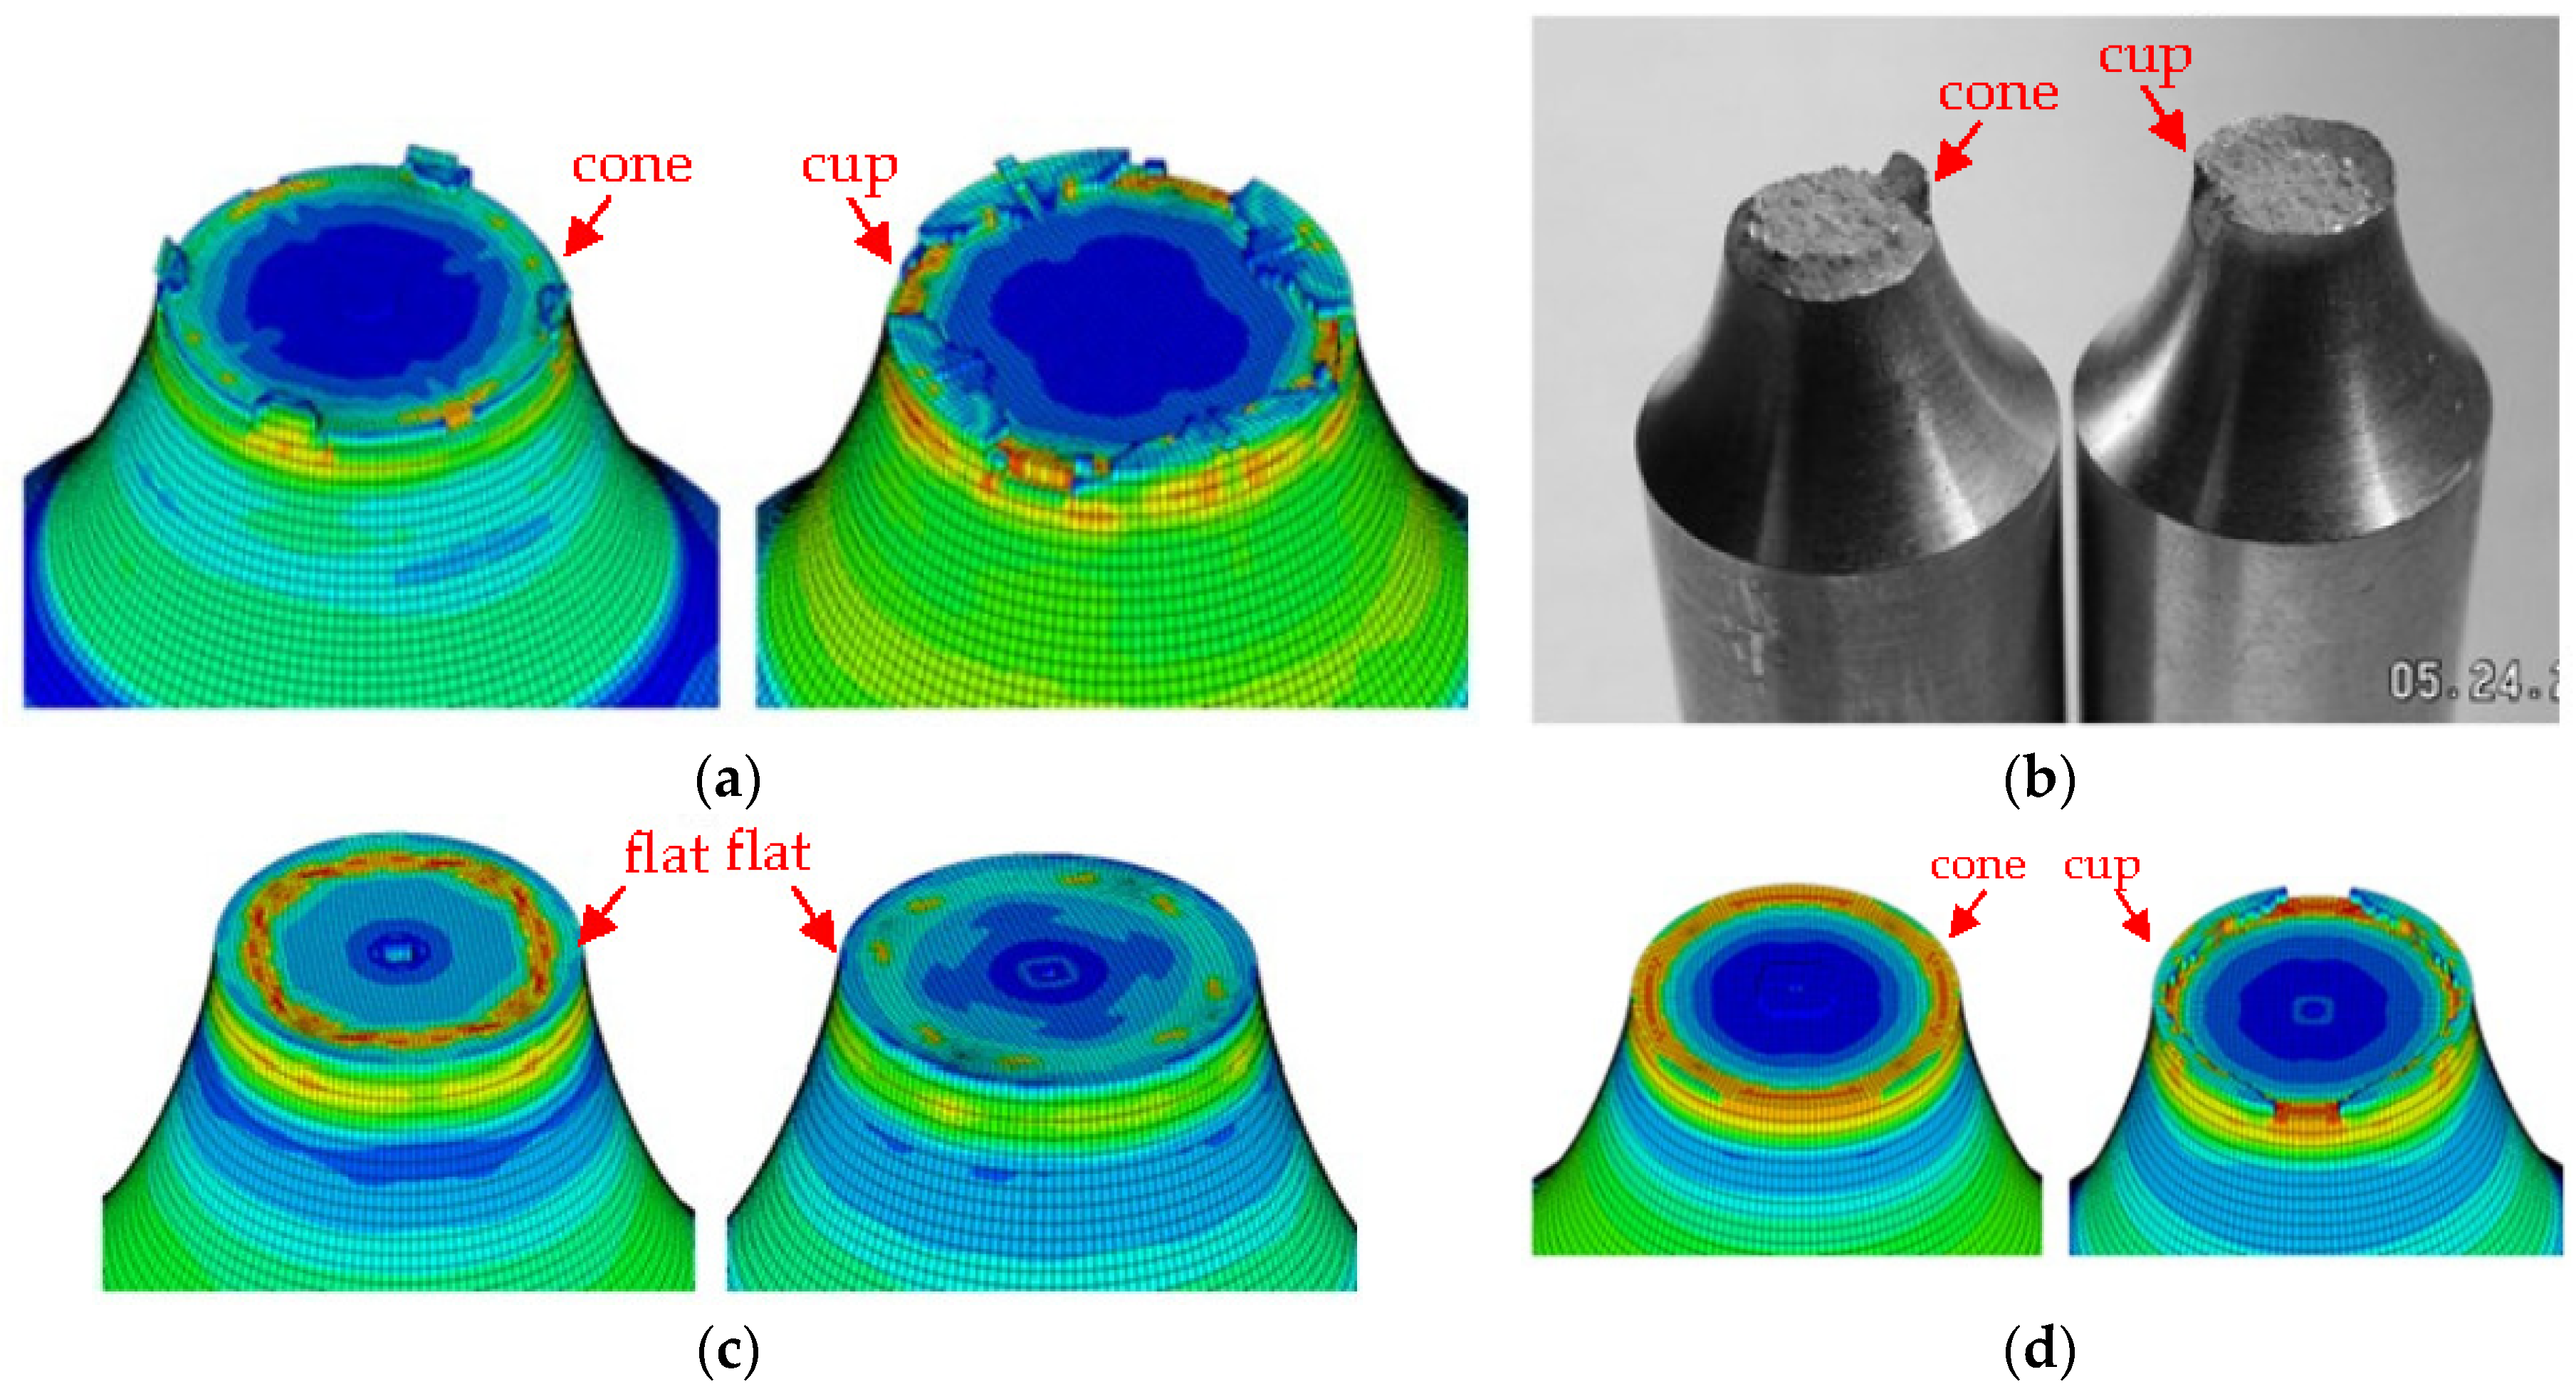
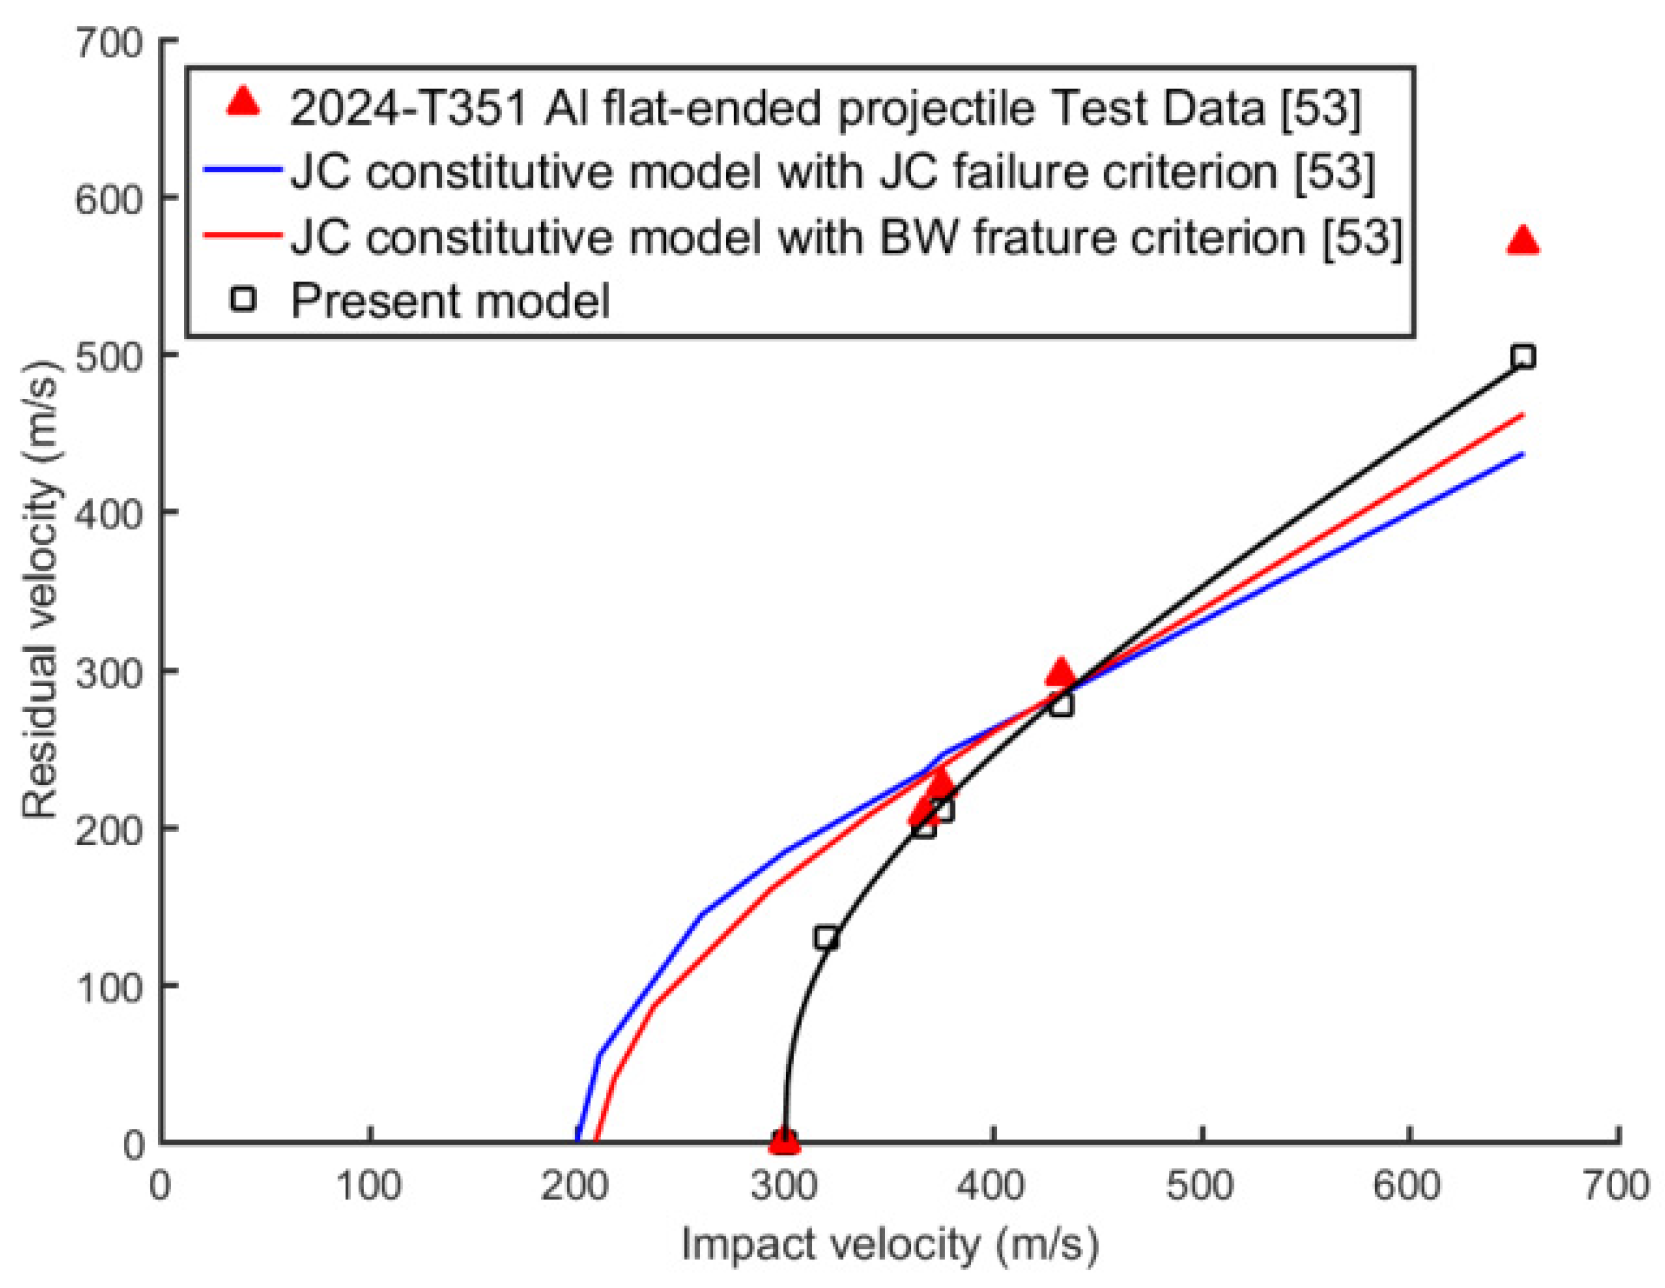
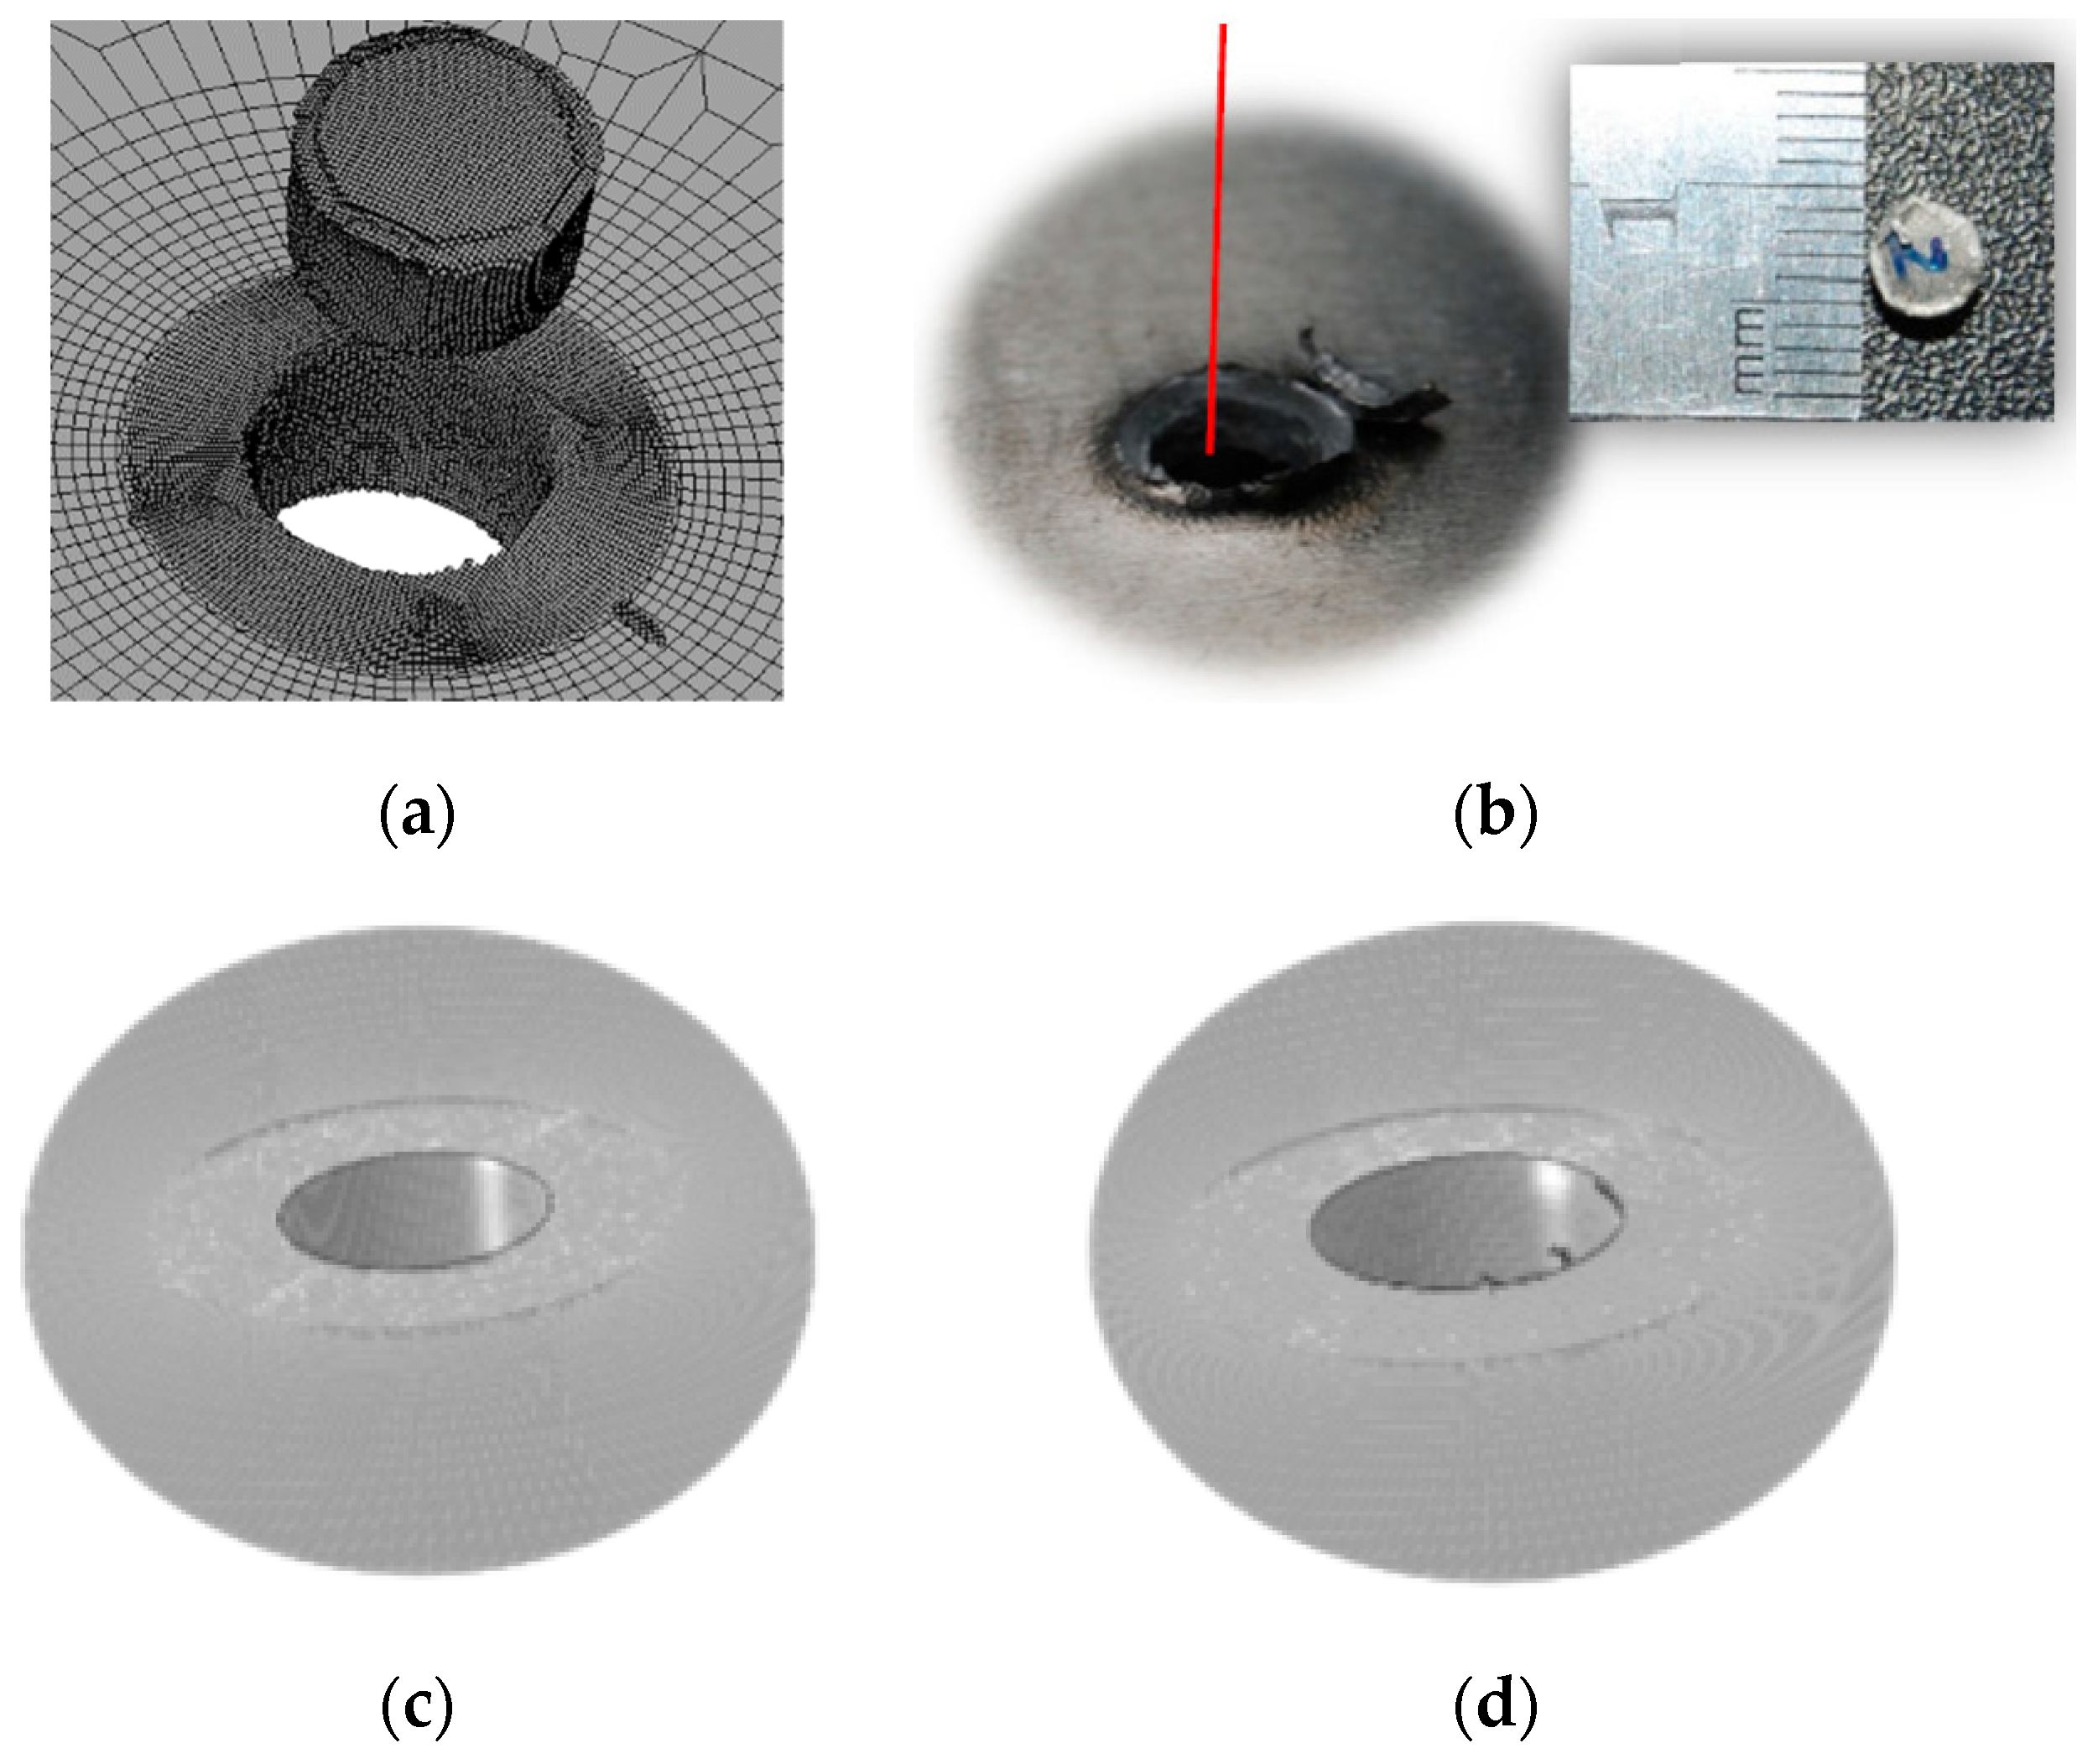
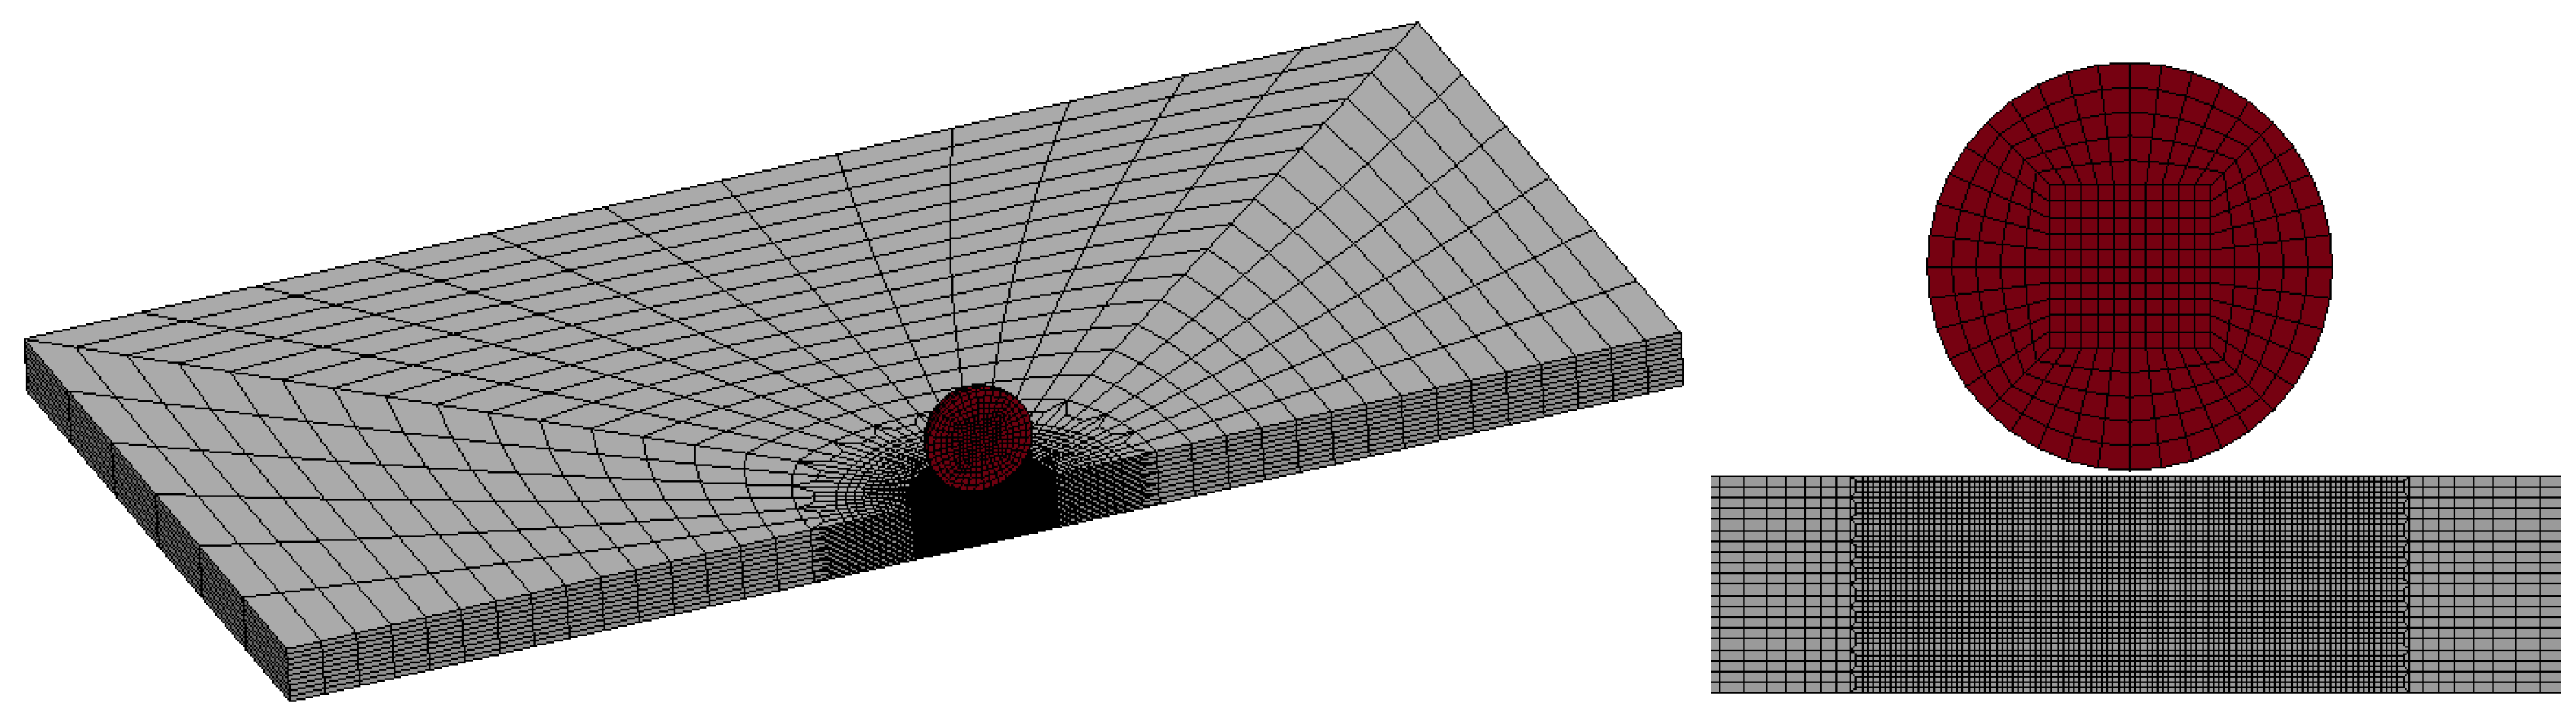
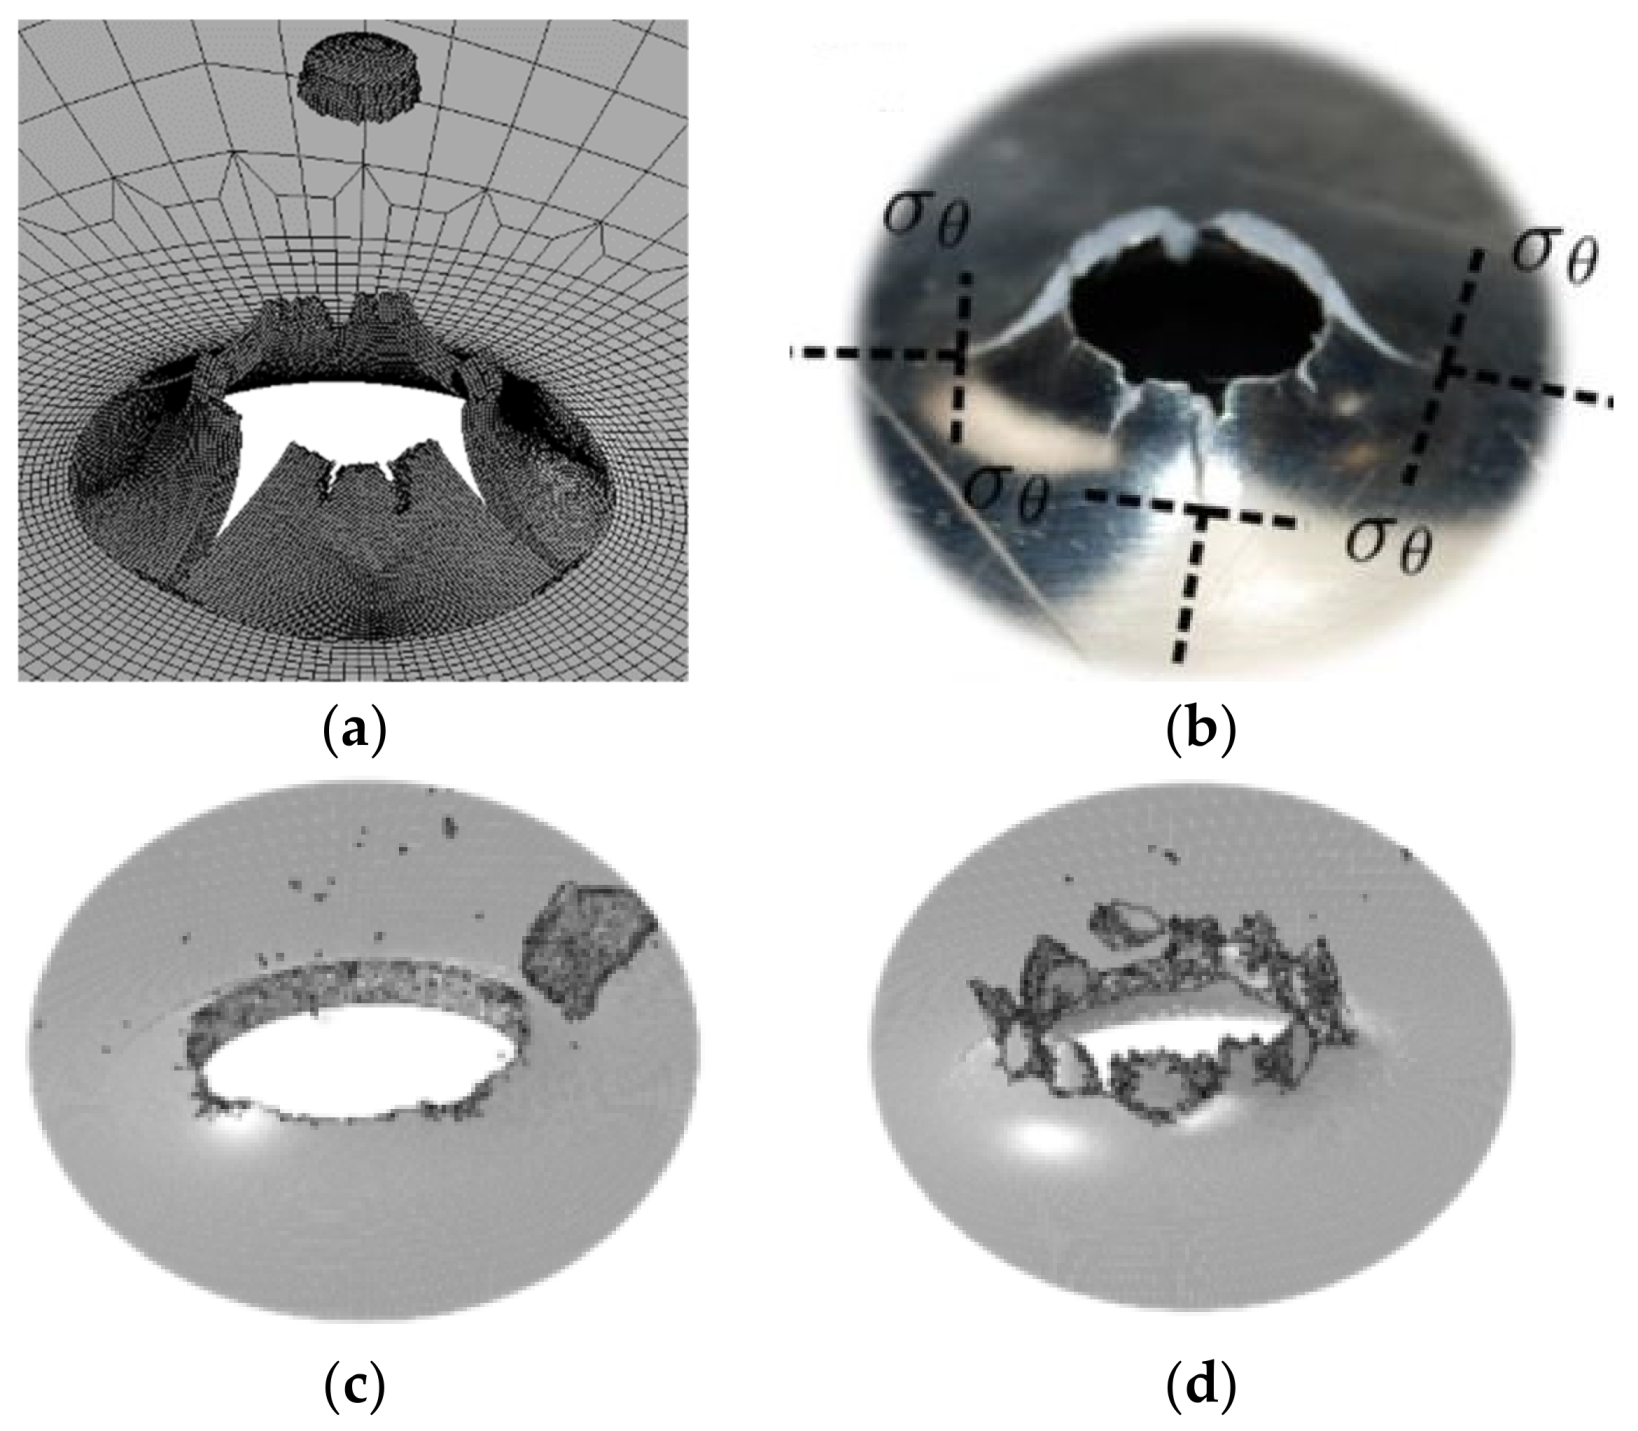
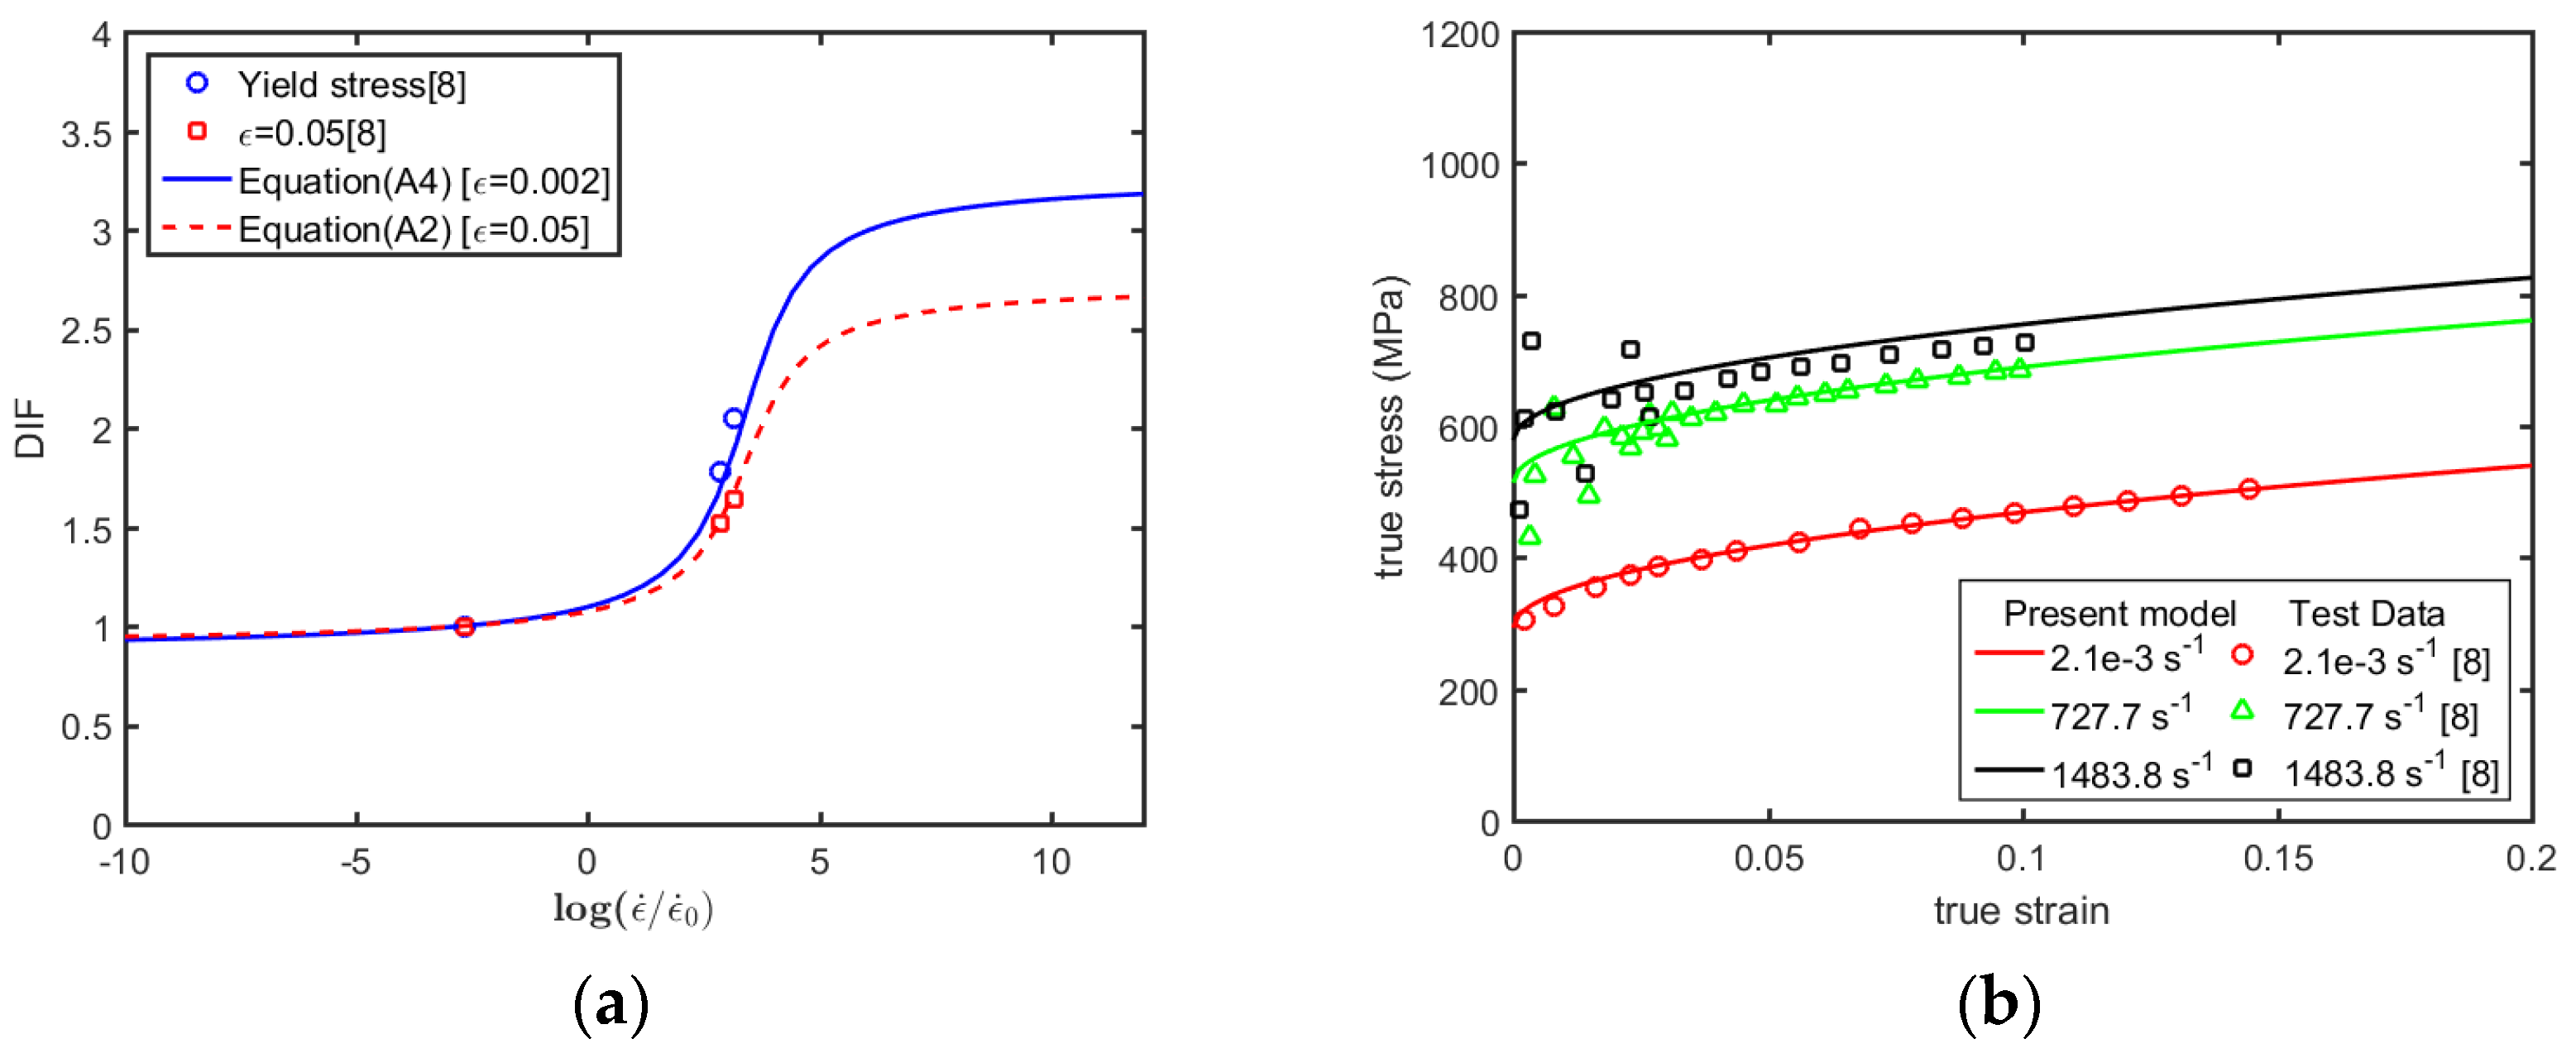
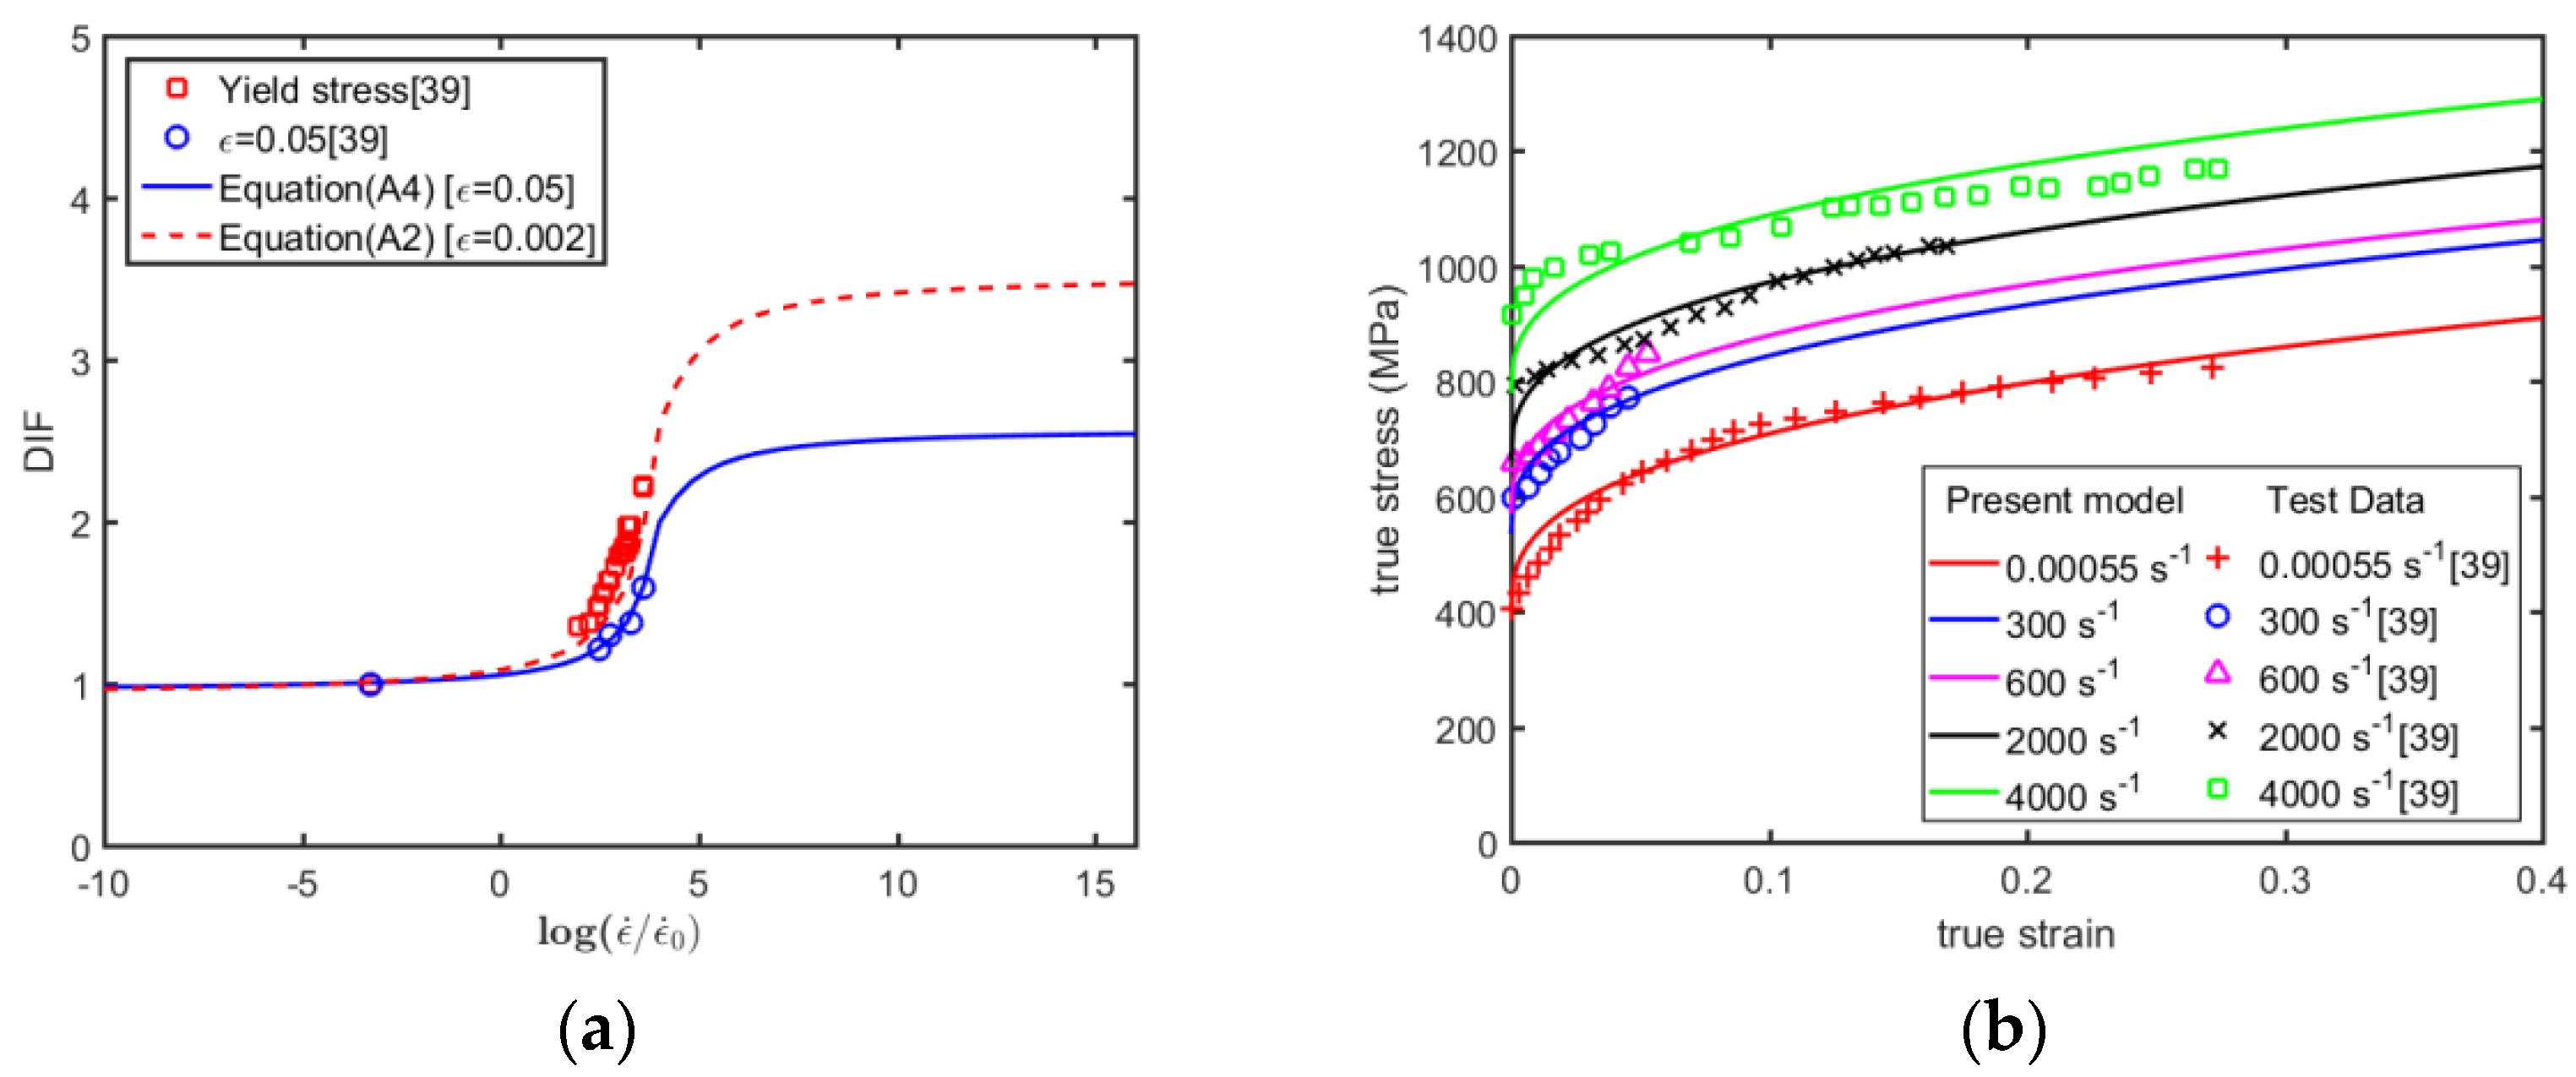
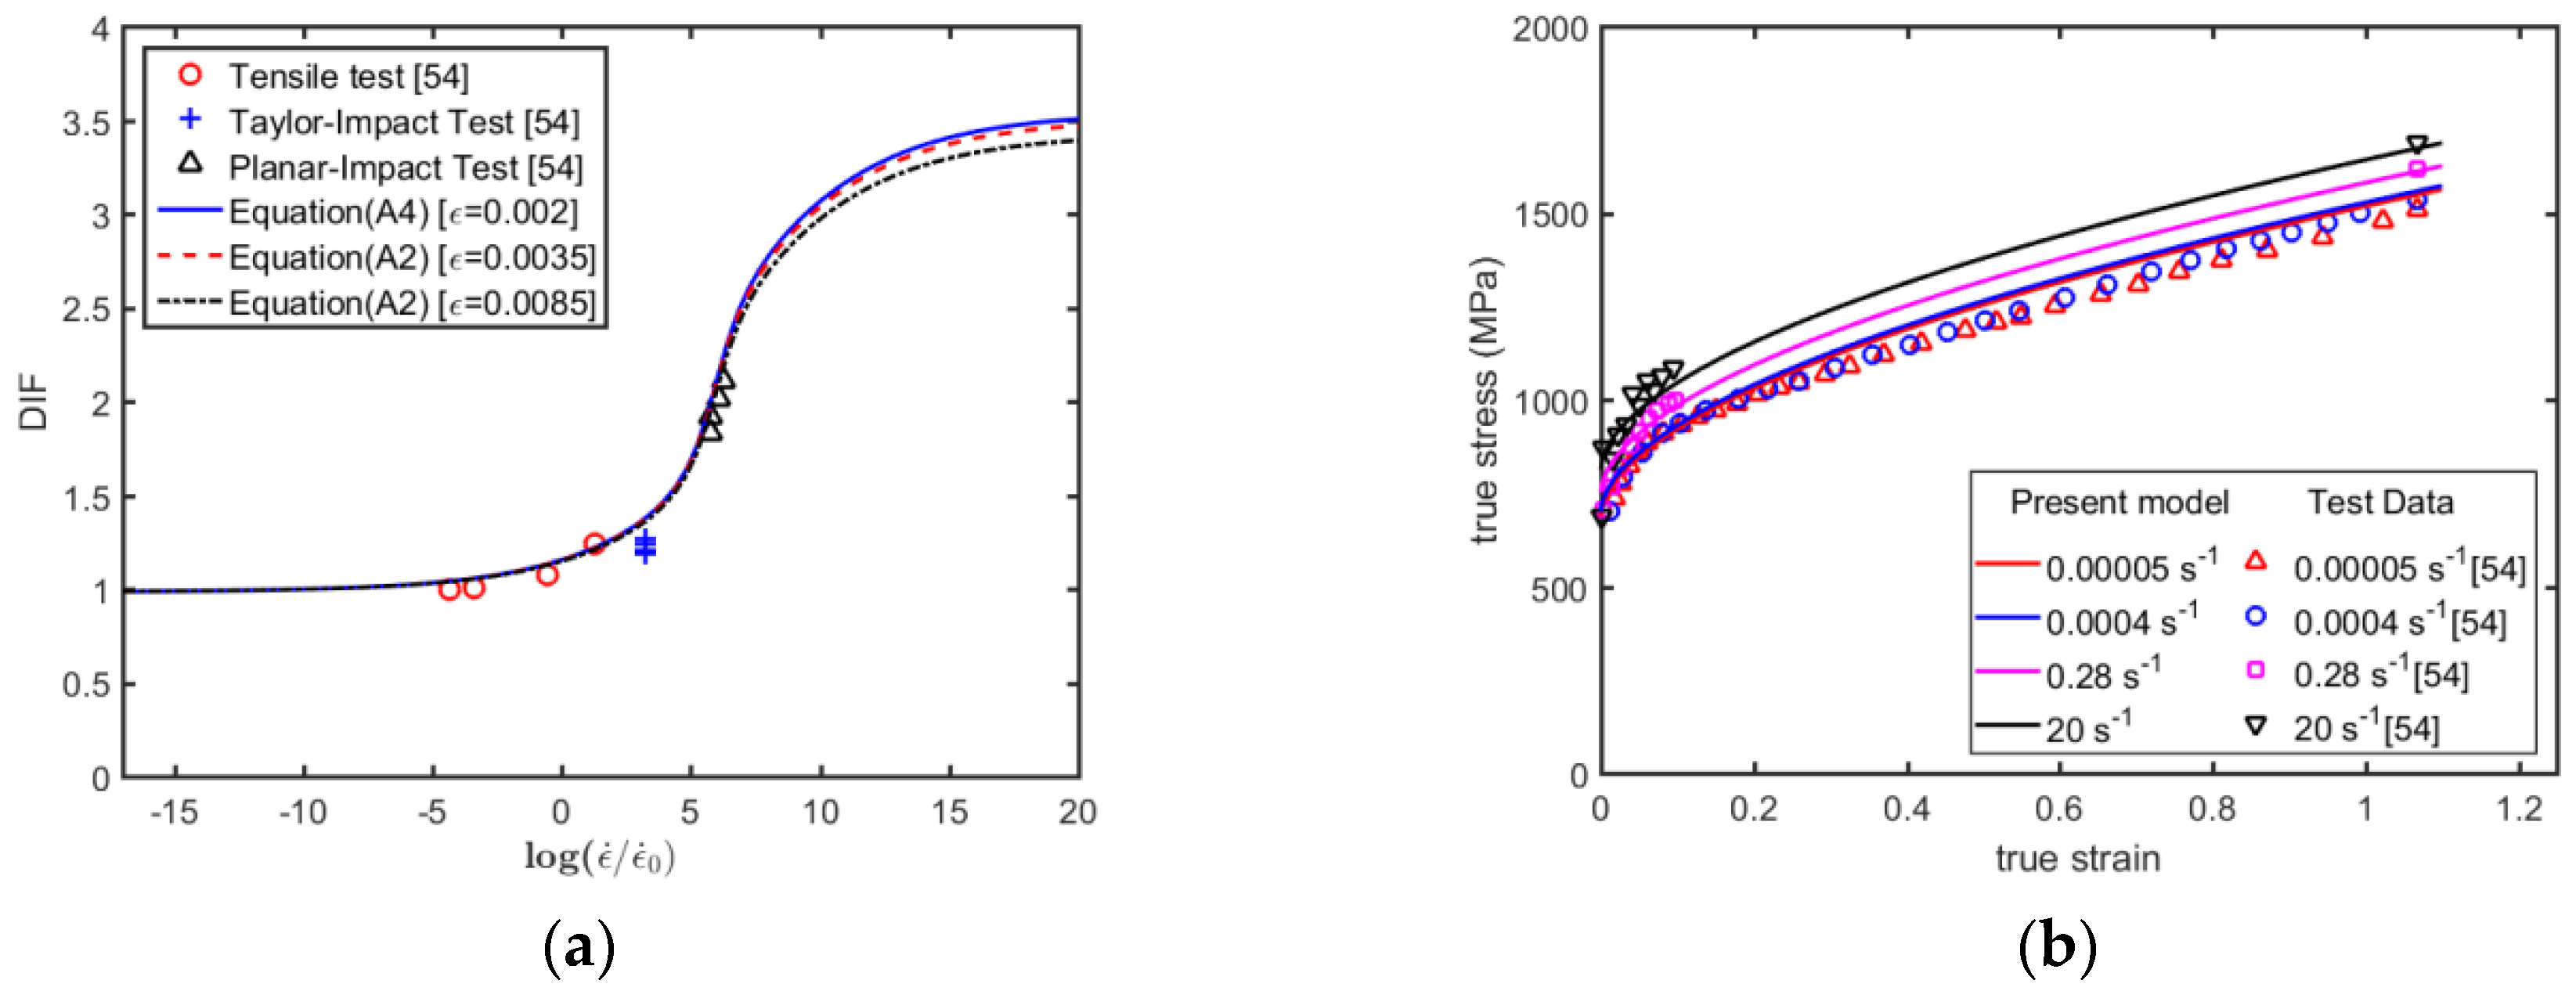
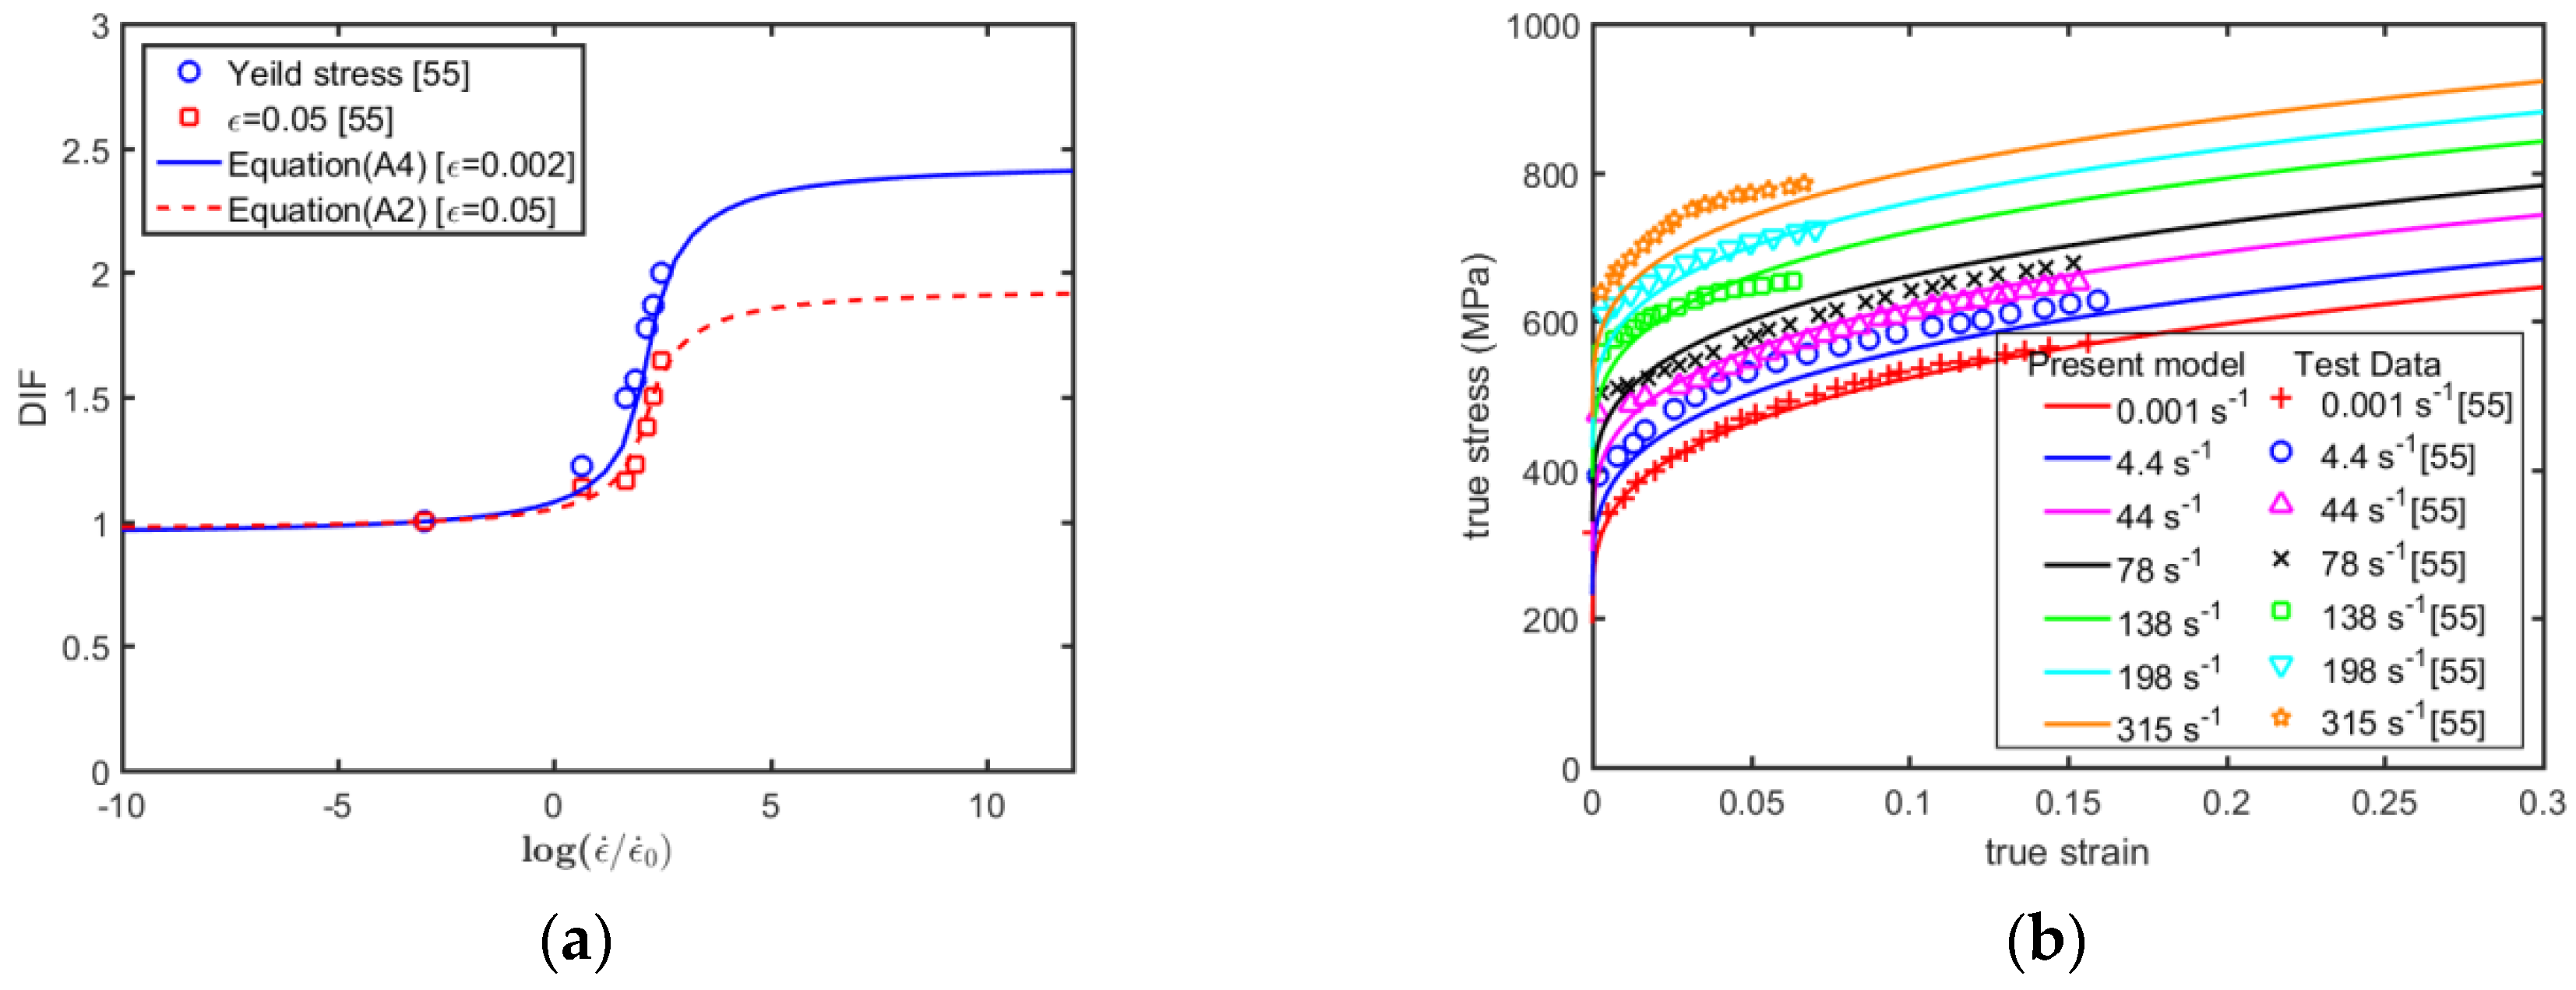
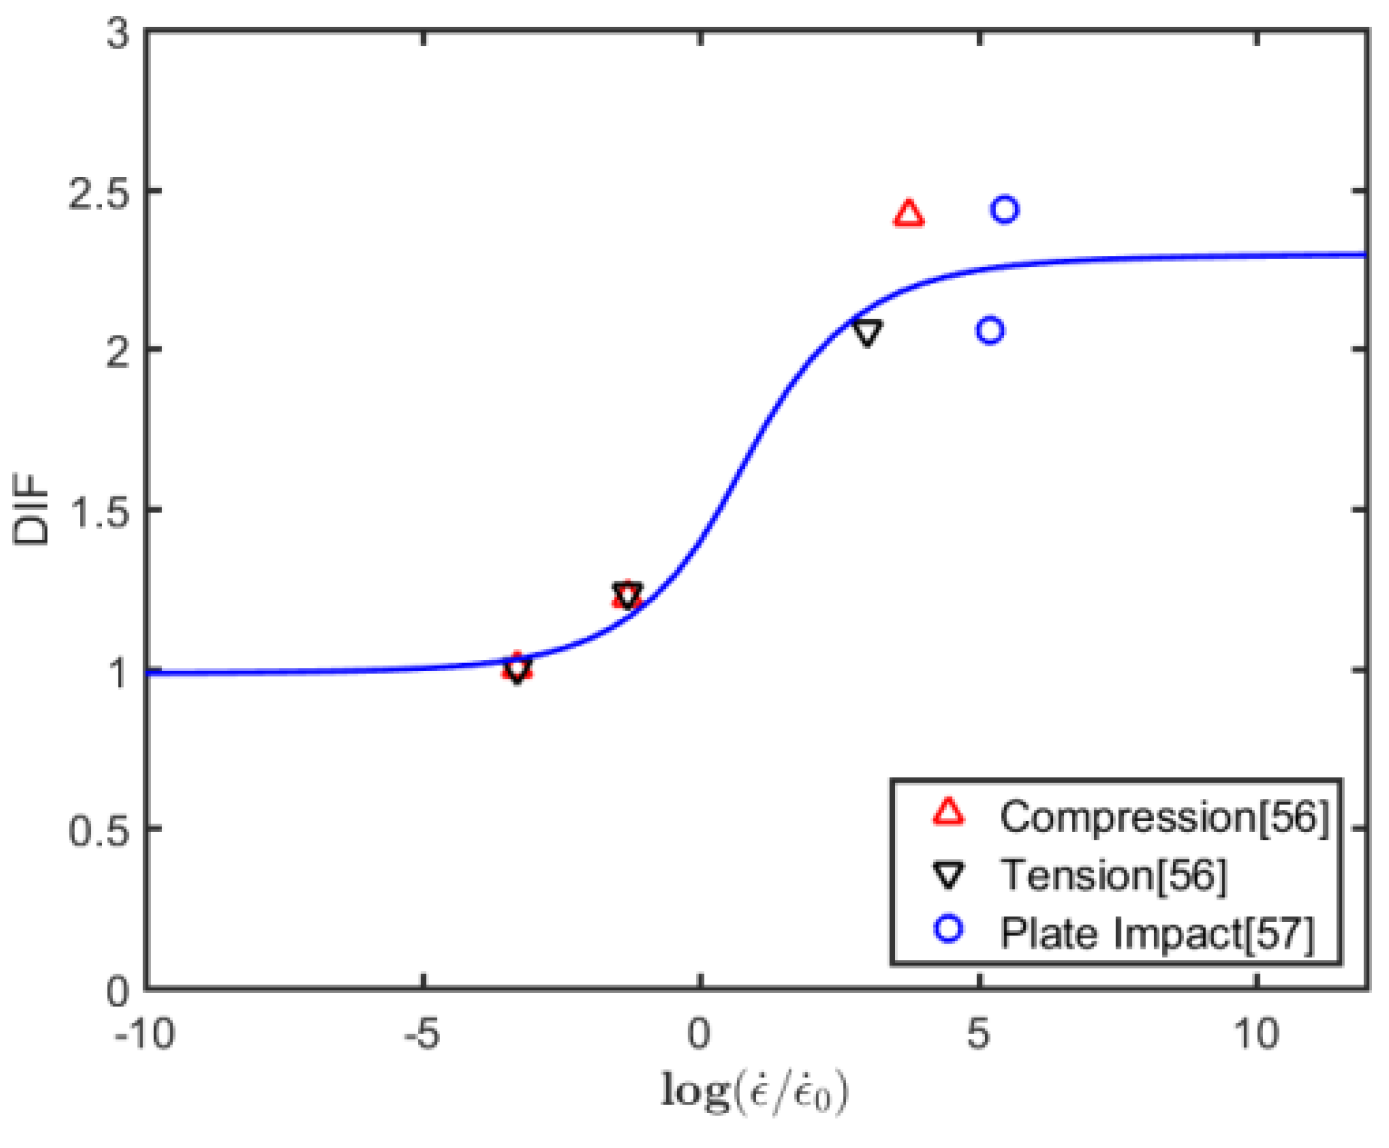
Table 1.
Values of constants in the new constitutive model and new fracture criterion.
| Materials Parameters | 2024-T351 Al | 6061-T6 Al | OFHC Copper | 4340 Steel | Ti-6Al-4V Alloy | Q235 Mild Steel |
|---|---|---|---|---|---|---|
| (MPa) | 340 | 265 | 50 | 792 | 938 | 293 |
| (MPa) | 510 | 170 | 340 | 846 | 947 | 543 |
| 0.5100 | 0.3140 | 0.4250 | 0.5820 | 0.6360 | 0.4890 | |
| (MPa) | 280 | 255 | 40 | 760 | 850 | 223 |
| (MPa) | 510 | 98 | 274 | 417 | 509 | 440 |
| 0.5060 | 0.2830 | 0.4230 | 0.3120 | 0.3235 | 0.4226 | |
| 4.1550 | 5.2006 | 4.4020 | 5 | 4.2470 | 3.4300 | |
| 100 | 2 | 1.1000 | 2.6000 | 12 | 1.2500 | |
| 1.3481 | 0.9757 | 0.8120 | 1.0200 | 1.3100 | 0.9833 | |
| 2.0922 | 0.2286 | 0.3000 | 0.6000 | 0.1400 | 0.4584 | |
| 9.0 × 10⁻⁵ | 1.0 × 10⁻³ | 1.0 × 10⁻⁵ | 2.0 × 10⁻³ | 1.0 × 10⁻⁵ | 2.1 × 10⁻³ | |
| 0.075 | 0.1000 | 0.1500 | 0.0500 | 0.0500 | 0.0020 | |
| −2.5240 | −8.2350 | −5.0690 | −0.7248 | −1.4230 | −5.1330 | |
| 3.1500 | 3.0800 | 2 | 0.7354 | 0.8594 | 1.8920 | |
| 1.0055 | 0.8600 | 4.8220 | 3.2864 | 1.6934 | 2.4893 | |
| 0.2107 | 0.5250 | 8.7000 | 0.2536 | 0.4651 | 1.5000 |
© 2019 by the authors. Licensee MDPI, Basel, Switzerland. This article is an open access article distributed under the terms and conditions of the Creative Commons Attribution (CC BY) license (http://creativecommons.org/licenses/by/4.0/).
Share and Cite
MDPI and ACS Style
Zhou, L.; Wen, H. A new Dynamic Plasticity and Failure Model for Metals. Metals 2019, 9, 905. https://doi.org/10.3390/met9080905
AMA Style
Zhou L, Wen H. A new Dynamic Plasticity and Failure Model for Metals. Metals. 2019; 9(8):905. https://doi.org/10.3390/met9080905
Chicago/Turabian StyleZhou, Lin, and Heming Wen. 2019. "A new Dynamic Plasticity and Failure Model for Metals" Metals 9, no. 8: 905. https://doi.org/10.3390/met9080905
Note that from the first issue of 2016, this journal uses article numbers instead of page numbers. See further details here.