
Evaluation of Zero-Energy Building and Use of Renewable Energy in Renovated Buildings: A Case Study in Japan

1
Department of Architectural Design and Engineering, Yamaguchi University, 2-16-1 Tokiwa-dai, Ube 755-8611, Japan
2
Sanken Setsubi Kogyo Co., Ltd., 1-17-21 Shinkawa, Chuo-ku, Tokyo 104-0033, Japan
*
Author to whom correspondence should be addressed.
Buildings 2022, 12(5), 561; https://doi.org/10.3390/buildings12050561
Submission received: 30 March 2022
/
Revised: 25 April 2022
/
Accepted: 26 April 2022
/
Published: 27 April 2022
(This article belongs to the Section Building Energy, Physics, Environment, and Systems)
Abstract
:Following the Paris Agreement in 2015, the worldwide focus on global warming countermeasures has intensified. The Japanese government has declared its aim at achieving carbon neutrality by 2050. The concept of zero-energy buildings (ZEBs) is based on measures to reduce energy consumption in buildings, the prospects of which are gradually increasing. This study investigated the annual primary energy consumption; as well as evaluated, renewed, and renovated buildings that had a solar power generation system, and utilized solar and geothermal heat. It further examines the prospects of hydrogen production from on-site surplus electricity and the use of hydrogen fuel cells. A considerable difference was observed between the actual energy consumption (213 MJ/m2), and the energy consumption estimated using an energy simulation program (386 MJ/m2). Considerable savings of energy were achieved when evaluated based on the actual annual primary energy consumption of a building. The building attained a near net zero-energy consumption considering the power generated from the photovoltaic system. The study showed potential energy savings in the building by producing hydrogen, using surplus electricity from on-site power generation, and introducing hydrogen fuel cells. It is projected that a building’s energy consumption will be lowered by employing the electricity generated by the hydrogen fuel cell for standby power, water heating, and regenerating heat from the desiccant system.
1. Introduction
Following the Paris Agreement in 2015, global warming countermeasures have been adopted globally [1,2]. The Japanese government has declared that it aims at achieving carbon neutrality by 2050 [3]. It has been stated that the role of the energy sector, which is responsible for 93% CO2 and 85% of other greenhouse gases, is critical for the realization of carbon neutrality [4]. Japan’s energy reduction policy aims at providing a stable energy supply, by increasing the use of renewable energy, and expanding nuclear energy policy with safety as a top priority [5].
National energy supply is classified into industrial, consumer, and transportation sectors. The consumer sector is managed by the construction sector (homes and office buildings). Based on energy demands in 2019, 14% of Japan’s CO2 was emitted from the household sector, and 17% from the business sector [6]; therefore, energy in the consumer sector needs to be reduced to achieve carbon neutrality. This trend is common in many countries [7,8,9]. The total energy consumption of buildings accounts for 30% of the world’s energy consumption [10]; fossil fuels and electricity account for 30% of global energy consumption, whereas the contribution of renewable energy is significantly lower (3%) [10]. It has been reported that global energy-related CO2 emissions of buildings are 26% [10].
Zero-energy buildings (ZEBs) are gaining attention for improving the energy performance of new, renewed and/or renovated buildings [7,11,12,13]. There are passive and active methods to save energy in buildings. During the planning stage of a building, the airtightness and insulation of the building and the design and insulation of windows affect the cooling and heating loads in the room, which relate to reducing the energy consumption of air-conditioning equipment [14,15,16,17]. Therefore, reducing the cooling and heating loads in the building planning stage is an important factor to reduce the amount of energy consumed in the building. Therefore, to achieve ZEB, the use of high-efficiency equipment and renewable energy is essential. Commonly used renewable energies in buildings include geothermal energy (well water, groundwater, river water utilization, etc.), solar heat, and solar power [18,19,20,21,22].
However, there are many difficulties in using renewable energy sources in buildings. It has been reported that the energy consumption of such buildings fluctuates depending on the season, and the energy supply using natural energy is unreliable. In particular, the energy supply of solar power generation is difficult to predict depending on weather conditions and the time of day [23]. Therefore, renewable energy must be planned in connection with the amount of electricity in a building or area; and new storage systems must be expanded for surplus electricity. Batteries, hot water storage tanks, and phase-change materials are widely used as energy storage devices in buildings [24,25].
Recently, hydrogen production using surplus electric power has been achieved. Although there are various hydrogen production techniques, the thermal decomposition of methane and the electrolysis of pure water are particularly interesting [26,27,28]. However, if the energy used for hydrogen production is renewable, the environmental load can be further reduced. Renewable energy sources which include wind power, solar energy, biomass, hydropower, and geothermal power [29], have the potential to exceed the global energy needs [30]. However, hydrogen production and utilization are difficult, owing to geographical, social, and technical constraints [31]. Regardless, it is necessary to actively attempt the production of hydrogen using surplus power and the use of hydrogen in buildings or areas.
This study investigated the energy consumption of a renovated building and the sur-plus electricity generated through renewable energy. Additionally, we tried to understand how hydrogen production using surplus electricity affects the reduction rate of the energy consumption of this building.
2. Outline of Research
2.1. Overview of ZEB in Japan
Figure 1 shows the structure of a ZEB in Japan. We evaluated the energy consumption patterns in office buildings, in accordance with Japan’s “2016 Energy Conservation Standards” [32]. According to this standard, the annual primary energy consumption of a building (office building) is 1686 MJ/m2. The energy consumption of a ZEB and a near ZEB must be reduced by at least 50% and 75% or more, respectively, to meet this standard value. A ZEB is a building in which energy consumption is reduced to zero or less by using not only high heat insulation and high airtightness, but also a highly efficient mechanical system and renewable energy.
2.2. Building Overview
Figure 2 and Table 1 show the photographs and outlines of the target building, respectively. The building, having an area of 1101.53 m2, total floor area of 2258.65 m2, and height of 13.7 m, was built as a research facility in 1992 in Ibaraki Prefecture, Japan. The standard floor height of the building was 4.0 m, and it was a reinforced concrete structure with three floors above the ground. During 2009–2010, a system was implemented in the building that used solar and geothermal heat (underground heat utilization system) as an air-conditioning and heat source to reduce the energy consumed. In addition, a solar power generation system was installed. The details of the equipment system are presented in Section 2.3.
2.3. Equipment Overview
Table 2 and Table 3 show the outline of the equipment and the heat source equipment, respectively. The heat source consisted of a water heat pump (30 kW) and an air-cooled heat pump (85 kW). Hot water (50 °C) generated by a solar heat collector (25 kW) was used as the heat source during winter. Geothermal heat directly uses groundwater (approximately 16 °C) when the building is cooled in the summer. It was also used for the regeneration of the desiccant system in the summer.
In summer, groundwater, at approximately 16 °C, was used for the radiation panel. However, if the cooling capacity is insufficient, the water heat pump would operate. Furthermore, if the cooling capacity remains insufficient, an air-cooled heat pump is used. In winter, hot water (approximately 50 °C) obtained from a solar heat collector was used for the radiant panel in the room. When the heating capacity was insufficient, the water heat pump was operated.
In addition, a solar power generation system was installed on the roof of the building. The power generation capacity of the photovoltaic system was 42 kW. A first-class ventilation system was installed in the office space, and a third-class ventilation system was installed in the bathroom. Light-emitting diodes (LEDs) were used for lighting. Figure 3 shows a diagram of an air-conditioning system that uses renewable energy. Figure 4 shows an image of the energy utilization system of the building.
3. Evaluation of Energy Consumption Using the Building Energy Simulation Tool (BEST)
3.1. Outline of BEST Program
The BEST was used to simulate the energy consumption of a building [33]. The BEST calculates the energy consumption of equipment, air-conditioning, ventilation, lighting, hot water supply, elevators, etc., and can predict the total energy consumption of a building. It is imperative to study ZEB for a carbon-free society in order to increase renewable energy such as solar power generation and solar heat utilization, which are essential for smart energy infrastructure, and to reduce peak power via cogeneration and heat storage. This is a “comprehensive energy simulation tool for buildings”, that allows for a comprehensive examination of building technologies. This program is useful to researchers, equipment designers, builders, building equipment manufacturers, maintenance managers, building designers, urban building planners, and building owners at various stages.
3.2. Outline of Simulation
The simulation conditions are listed in Table 4. The meteorological data used were the Automated Meteorological Data Acquisition System (AMeDAS), provided by the Japan Meteorological Agency [34]. The cooling period was from July to September and the heating period was from November to March. Considering the actual office occupancy rate, working hours were set from 08:30 to 18:00 on weekdays. This study used 100% internal heat generation, air conditioning, ventilation, and lighting during working hours. For conference rooms with short usage times, the system utilization rate was set to 20%.
3.3. Simulation Results
Figure 5 shows the breakdown of the energy consumption of the building in each month, and Figure 6 shows the simulation results of the annual primary energy consumption by the BEST program. The primary energy consumption per unit area during the winter heating period is 42–47 MJ/m2. January exhibits the highest primary energy consumption during the heating period. The primary energy consumption per unit area during the cooling period was 26–33 MJ/m2, and the primary energy consumption for heating was higher than that for cooling. The lowest primary energy consumption of the year was observed in mid-April and May (21 MJ/m2).
There were no monthly differences in the primary energy consumption for ventilation, lighting, hot water supply, elevators, and outlets. However, the gas consumption of the main body of an air-conditioning heat source was widely used during the heating period. The power consumption of the air-conditioning heat source was high during both the cooling and heating periods. The power consumption was highest in August (9.7 MJ/m2), while being the lowest in April (1.0 MJ/m2). The simulation result of the annual primary energy consumption using BEST was 386 MJ/m2·year, which was 77% less than the standard value (1686 MJ/m2·year) for office buildings. From this result, it can be inferred that the building can nearly achieve ZEB status at the renewal planning stage.
3.4. Actual Measurement Results of Annual Primary Energy Consumption in the Target Building
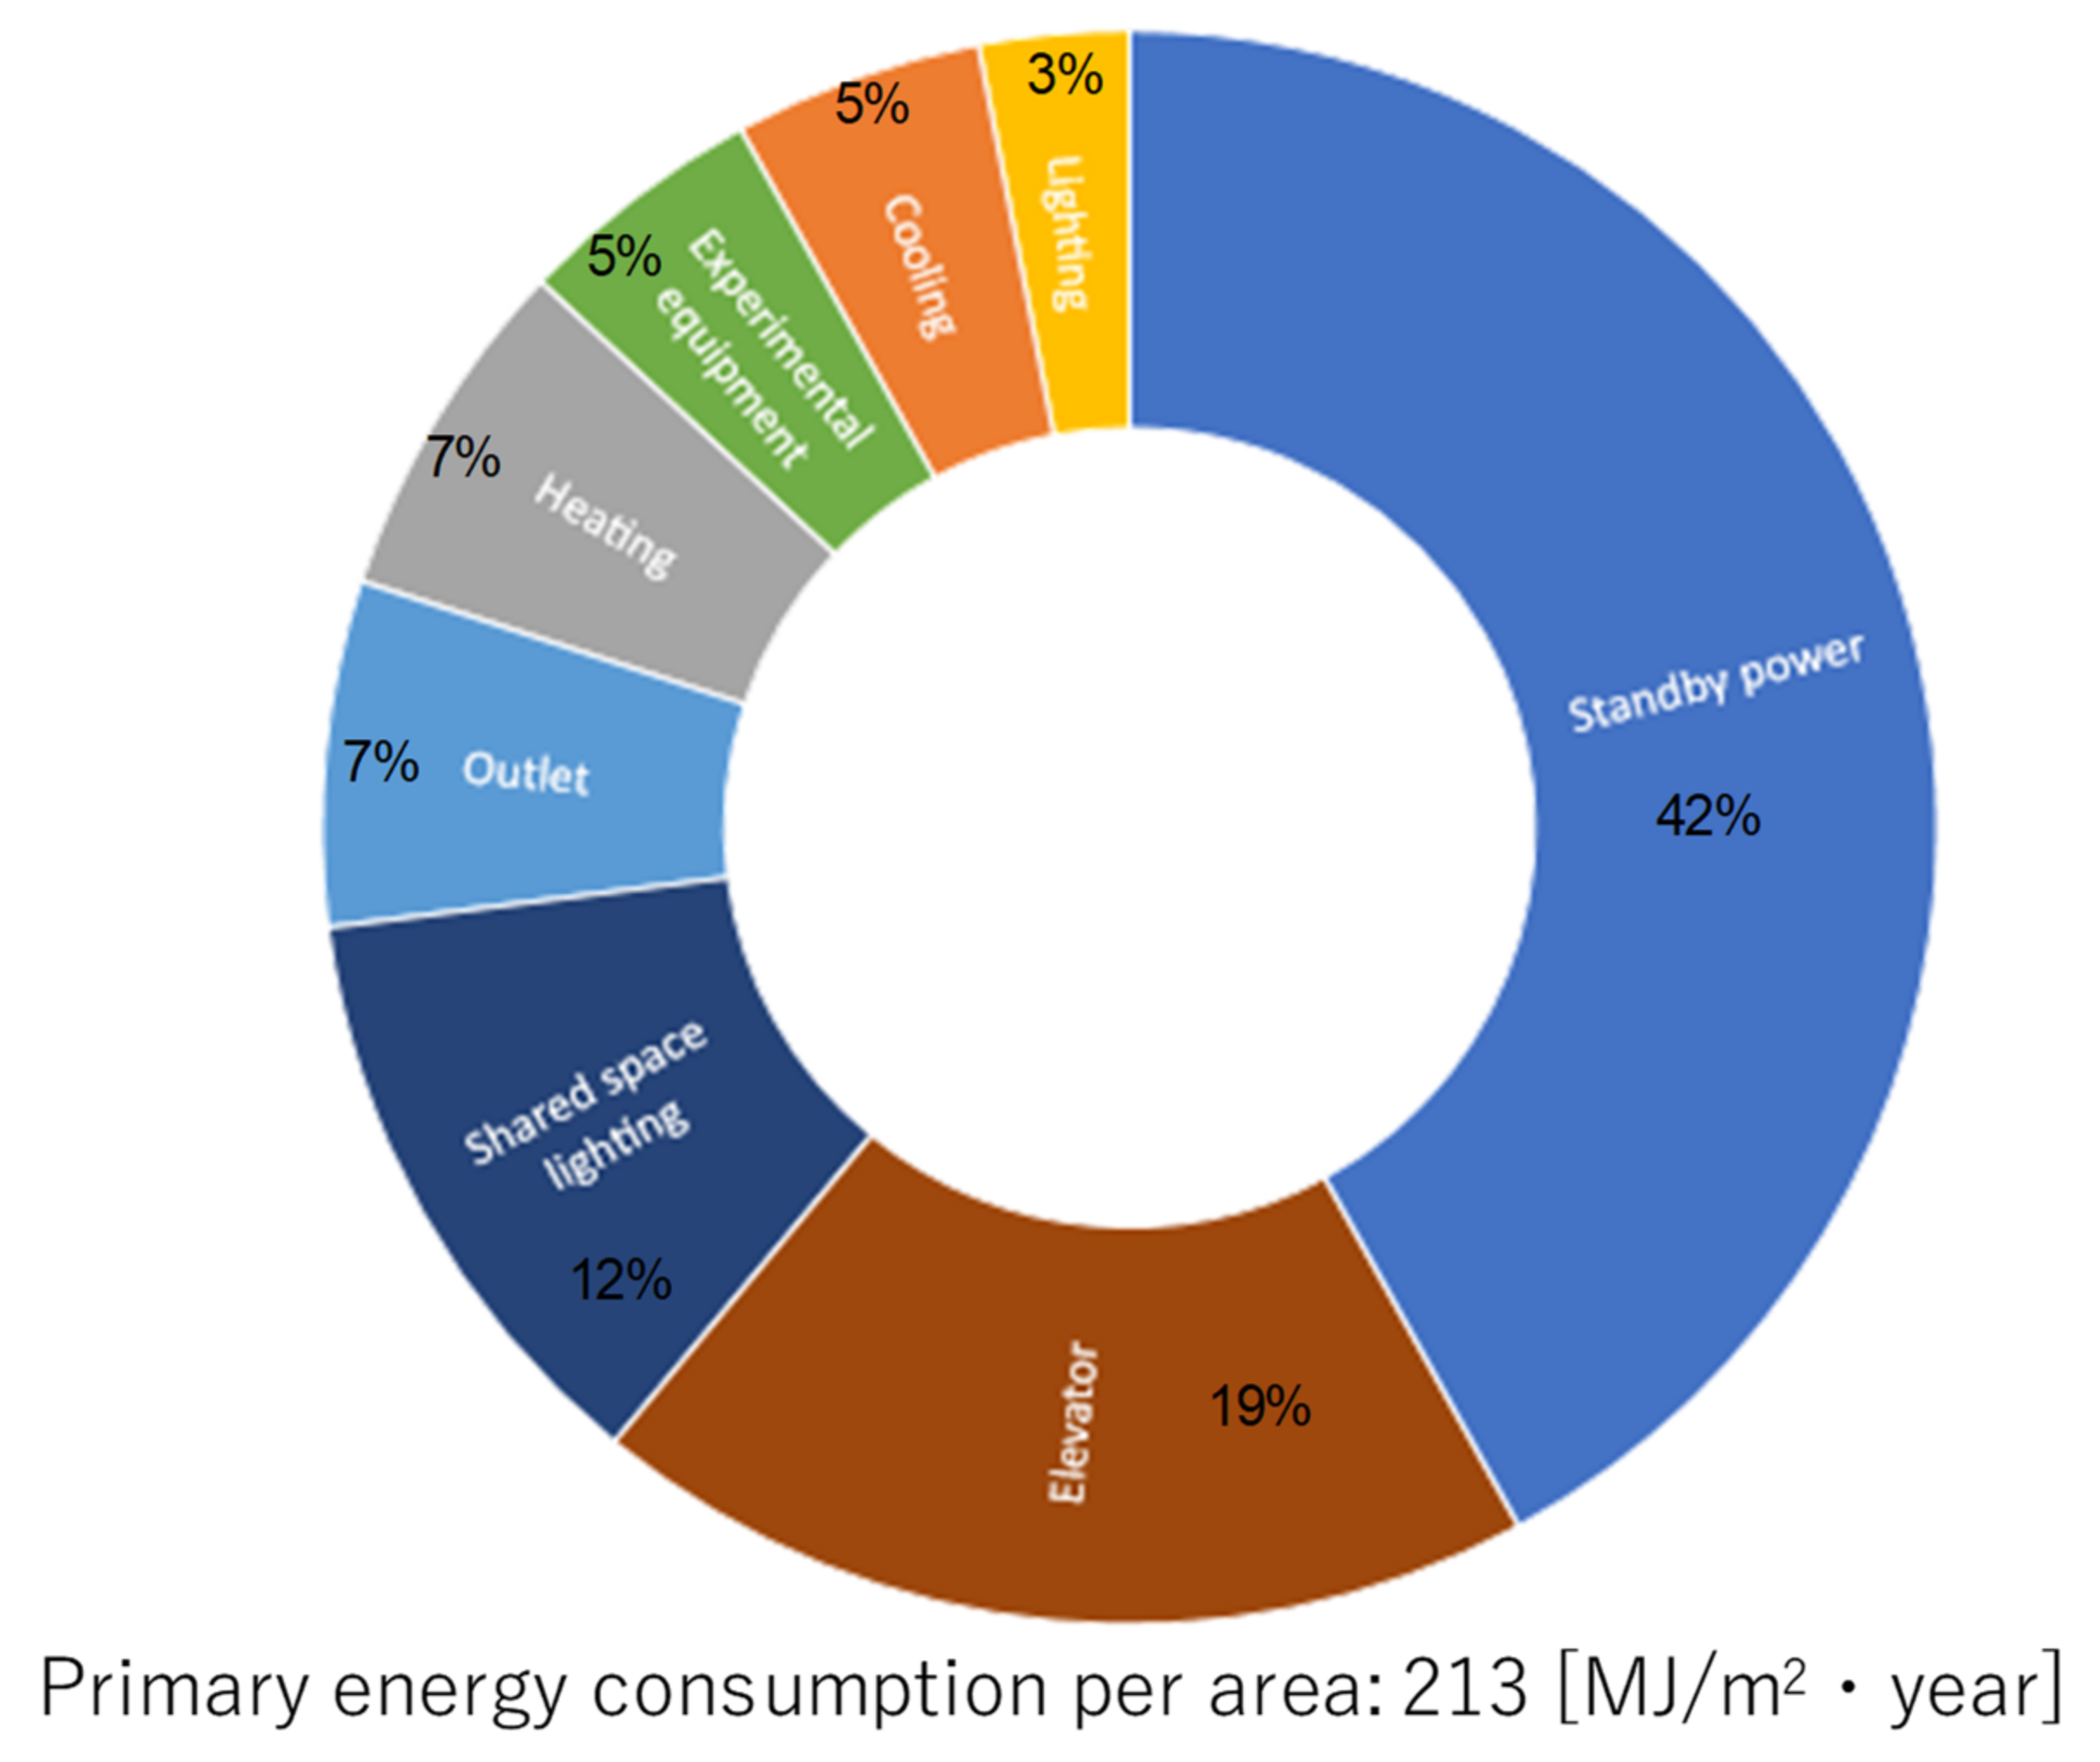
This building was completed in 1992, and it was renovated in 2009–2010 to install renewable energy systems. In 2011 and 2012, the optimum operating conditions for air-conditioning equipment were adjusted according to the indoor environment (temperature, relative humidity, and indoor air quality) to reduce the energy consumption of the building. Figure 7 shows the ratio of energy consumption to the primary energy consumption per annual area for each item (2013). The energy consumption for each item was obtained from the energy management system installed in the building. The calculation period for the energy consumption was from April 2013 to March 2014. It was observed that standby power consumed the most power, accounting for 42% (20,235.6 kWh/year) of the total power consumption. The ratio used in the elevator was 19% (9154 kWh/year), and the lighting in the common space was 12% (5781.6 kWh/year). The cooling rate was 5% (2409 kWh/year), while the heating rate was 7% (3372.6 kWh/year), and the energy used for air conditioning was 12% (5781.6 kWh/year). The energy consumption of the outlet was 7% (3372.6 kWh/year), and that of lighting and other energy sources was 3854.4 kWh/year. The total power consumption of this building was 48,180 kWh in 2013, and the annual primary energy consumption per floor area was 213 MJ/m2·year. It was found that compared with the standard value of annual primary energy consumption (1686 MJ/m2), energy consumption could be reduced by approximately 87%, and a near ZEB could be achieved.
However, this primary energy consumption is not calculated/does not consider the amount of power generated by solar power generation. The total amount of solar power generated in 2013 was 55,450 kWh/yr. The amount of primary energy power generation per annual area was 245 MJ/m2·year after converting the total amount of power generation. We achieved a value of −32 MJ/m2·year when the primary energy consumption per annual floor area of the building was subtracted from the amount of power generated by solar power generation, which can be considered as the accomplishment of ZEBs.
Figure 8 shows the monthly average, and average surplus power generated by the solar power system in the building during the period 2013–2017. Over a period of five years, the month of May showed the highest average power generation potential (5403 kWh), whereas November showed the lowest power generation potential (3422 kWh). The average annual total power generation and the surplus power of the building were 51,816 kWh and 29,269 kWh, respectively. Surplus electricity accounted for approximately 56% of the total power generation, and this surplus electricity reverse-flowed to local electric power companies.
The Japanese government has supported subsidies for renewable energy systems to promote their use. Renewable-energy-based power can be used directly in a building, but surplus power must be sent back to the power company as per the government subsidy policy. However, it has been pointed out that the electricity generated by solar and wind power might result in overvoltage or voltage shortages, lowering the overall efficiency of the system. Therefore, it is highly recommended to use surplus energy onsite.
3.5. Investigation on Use of Surplus Electricity On-Site
Figure 9 shows the hydrogen production system using surplus electricity and the direction of its use. We believe that the surplus electricity used depends on the energy-usage strategy of the building. Since this building has a large standby power and requires hot water for heating and regenerating the heat of the desiccant system, this study examined a method using hydrogen to achieve the same result. Pure water was electrolyzed using surplus electricity to produce hydrogen, which was then stored in a hydrogen tank. It was assumed that the stored hydrogen could be reused as an energy source for buildings by producing hot water and electricity using hydrogen fuel cells.
Figure 10 shows the monthly production of hydrogen using surplus electricity. Figure 11 and Figure 12 show the power generation and calorific value of a hydrogen fuel cell (Figure 8 may be referred to as surplus power). It has been reported that the power required to electrolyze pure water to produce hydrogen is 3–3.54 kWh/Nm3 [35]. According to the Ministry of Economy, Trade and Industry of Japan, electrolytic hydrogen production requires 5 kWh/Nm3 [36]. Therefore, the hydrogen production shown in Figure 10 was calculated to be 5 kWh/Nm3. The chemical formula for the amount of power generation and calorific value of a pure hydrogen fuel cell is H2 + 1/2O2 = H2O + 286 kJ, and an energy of 286 kJ (25 °C) can be obtained from 1 mol of hydrogen [37]. The amounts of power and heat generation were calculated assuming that the power generation and heat generation efficiency of the hydrogen fuel cell were 50% and 40%, respectively. The calculation formula is as follows [38]:
Energy (kJ) = Hydrogen (Nm3) × 44.6 (mol/Nm3) × 286 (kJ/mol)
Power generation (kWh) = energy (kJ) × 0.000278 (kWh/kJ) × 0.5
Heat generation (kWh) = energy (kJ) × 0.000278 (kWh/kJ) × 0.4
Heat generation (MJ) = heat generation (kWh) × 3600/1000
The annual hydrogen produced from surplus electricity was 5853.8 Nm3 with a month-wise variation. The month of May showed the highest hydrogen production (654.2 Nm3), and the month with the lowest hydrogen production was September (390 Nm3). The amount of power generated through the use of hydrogen fuel cells was 10,378.9 kWh/year and if this amount of power was used as standby power for this building, the current standby power could be reduced by 51%. The calorific value of a hydrogen fuel cell is approximately 29,895 MJ/y. The source of this amount of heat was assumed to be hot water at a temperature of 60 °C. In this building, hot water is used to heat and regenerate the desiccant system. Since the amount of hot water used for heating in winter, and of that used for the desiccant system in summer was unknown, it was difficult to determine the exact reduction in energy consumption. However, hot water made from hydrogen fuel cells would lead to energy reduction in the building.
4. Discussion
Various measures have been implemented globally to reduce greenhouse gas emissions. Countries worldwide are focusing on developing indicators for evaluating the environmental performance of buildings. This is done to implement energy-saving strategies and for the comprehensive environmental evaluation of buildings. Typical environmental assessment indicators for buildings include the Leadership in Energy and Environmental Design (LEED) [39] in the United States, and the Building Research Establishment Environmental Assessment Method (BREEAM) in the United Kingdom [40,41]. Japan also has a building environment evaluation index, the Comprehensive Assessment System for Built Environment Efficiency (CASBEE) [42]. It is important to evaluate the environmental performance of a building to predict its energy consumption at the design stage or before renovation.
Recently, to reduce energy consumption in the consumer sector, there have been ZEHs, ZEBs, and ECO-School as energy-saving strategies for housing, office buildings, educational facilities, public facilities, and hospitals, etc. [43,44,45]. However, the method of applying energy-saving technology differs depending on the purpose of the building [46]. The energy consumption of a building was evaluated from the design stage. EnergyPlus and eQuest were used as simulation programs of choice [47,48]. BEST and web programs are frequently used in Japan [33,49].
In this study, the energy consumption of a building was calculated using BEST, developed in Japan. In this energy simulation program, the thermal insulation performance of building walls, ceilings, windows, etc. and the amount of heat generated by the human body and lighting can be entered numerically. In addition, a dynamic energy consumption analysis is possible through the input of local weather data and the schedule for the operation of the air conditioning system. However, there was a large difference between the energy consumption estimated using BEST (386 MJ/m2) and the actual energy consumption (213 MJ/m2). The simulation results calculated the amount of gas used to create hot water for air conditioning during the winter heating period. However, when operating the air conditioner, almost no gas is used. The energy calculation simulation confirmed that the energy consumption during the use of hot water by the solar heat collector was not accurately estimated. Although we achieved high accuracy during the load calculation of the building using simulation, the quantitative determination of the annual energy consumption using renewable energy is difficult. In addition, the solar power generation system installed on the roof of the building generated electricity and used it directly for the building. However, the surplus electricity was circulated back to the local electric power company. The total annual surplus electricity is 29,269 kWh, accounting for 56% of the total power generation. On-site surplus electricity would undoubtedly contribute to a low-carbon society by replacing fossil fuel-based electricity [43]. Even so, it should be noted that on-site power generation can be over- or under-voltage, adversely affecting the quality of the grid [50]. Therefore, to make good use of this surplus electricity, it is important to cooperate with the energy consumption of villages and regions and to secure an energy storage system.
There are various energy storage systems, but hydrogen production using photovoltaic power generation has recently attracted attention [51]. In France, a hydrogen-based energy storage system, the Greenergy Box, was developed and installed in a public building. The Greenergy Box is an integrated modular system with a storage capacity of 0.2–2 MWh and can provide 50–500 kW of electricity, reporting that it can guarantee the energy autonomy of buildings [52]. In addition, the hydrogen fuel cell used in the building, produces electricity and heat and is evaluated to have high energy independence [51]. In particular, it was reported that the combined use of renewable energy in buildings and heat pumps for hydrogen production would increase the efficiency of energy use [51]. Hydrogen production using renewable energy is the greenest energy source when compared to other energy sources, and it can contribute to energy strategies for global decarbonization [53].
This study examined the prospects of hydrogen production, and the use of hydrogen fuel cells with surplus electricity to achieve a ZEB. This building uses a large amount of standby power; the hot water used for heating and regenerating the desiccant external controller is mostly consumed. Hydrogen fuel cells can use electric power and generate heat. The annual power generation by hydrogen is expected to be 10,378.9 kWh. This power will reduce the standby power of the building by 51%. In addition, the calorific value of the hydrogen fuel cell is estimated to be approximately 29,895 MJ/year, and it can be used as hot water or to heat a building. The effect of the amount of hot water obtained from hydrogen fuel cells on the reduction of energy consumption in this building, however, cannot be determined. Therefore, it is necessary to investigate the amount of hot water used and the amount of water produced in this building, in the future.
Hydrogen is a source of energy that mitigates the effects of decarbonization and global warming. However, there are many hydrogen-production technologies, and understanding the most environmentally friendly pathway is time-consuming. In addition, using hydrogen as a national energy supply source will take a substantial amount of time to implement [54].
5. Conclusions
The world has become more interested in mitigating global warming since the Paris Agreement in 2015, prompting the Japanese government to proclaim that it would strive for carbon neutrality by 2050.
In this study, the near-zero-energy consumption of a building was evaluated using renewable energy supplementation, and the hydrogen production potential using surplus electricity was investigated. We also estimated the amount of primary energy that could be saved using hydrogen fuel cells and examined the prospects of using hydrogen energy in buildings in the future. To reduce the energy consumption of the building, it is necessary to introduce heat insulation in materials (walls, windows, etc.), airtightness, and high efficiency equipment from the building planning stage, and the use of renewable energy that is more effective in achieving a ZEB. Hydrogen production using renewable energy has attracted attention as an energy-storage method. Hydrogen fuel cells are able to secure electricity and hot water, and are considered more effective in buildings with a large amount of standby power and in areas that require a long heating period.
The use of hydrogen as a green energy source is expected to contribute to the development of a carbon-free society.
Author Contributions
Conceptualization, R.K. and H.K.; methodology, H.S., R.K. and H.K.; software, R.K. and H.K.; validation, H.S., R.K. and H.K.; formal analysis, H.S., R.K. and H.K.; investigation, R.K. and H.K.; resources, H.S., R.K. and H.K.; data curation, R.K. and H.K.; writing—original draft preparation, R.K. and H.K.; writing—review and editing, H.S., R.K. and H.K.; visualization, R.K. and H.K.; supervision, H.S., R.K. and H.K.; project administration, H.S., R.K. and H.K.; funding acquisition, H.S. All authors have read and agreed to the published version of the manuscript.
Funding
This research was funded by Sanken Setsubi Kogyo Co.
Institutional Review Board Statement
Not applicable.
Informed Consent Statement
Not applicable.
Acknowledgments
This research was carried out with the cooperation of Sanken Setusbi Kogyo Co., Ltd. We would like to thank Sanken Setusbi Kogyo Co., Ltd. for providing the various data needed to write this article.
Conflicts of Interest
The authors declare no conflict of interest.
References
- UNFCCC. The Paris Agreement. 2015. Available online: https://unfccc.int/files/essential_background/convention/application/pdf/english_paris_agreement.pdf (accessed on 3 June 2021).
- UNEP. Emissions Gap Report; United Nations Environment Programme: Nairobi, Kenya, 2019; Available online: https://wedocs.unep.org/bitstream/handle/20.500.11822/30797/EGR2019.pdf?sequence=1&isAllowed=y (accessed on 30 June 2020).
- Prime Minister’s Office, Japan. Available online: https://www.kantei.go.jp/jp/99_suga/statement/2020/1026shoshinhyomei.html (accessed on 3 June 2021).
- Ministry of the Environment, Japan: Basic Materials on the Paris Agreement. Available online: https://www.env.go.jp/earth/odanka/cop/shiryo.html#03 (accessed on 3 June 2021).
- Ministry of Economy. Trade and Industry: Summary of Press Conference, Japan. Available online: https://www.meti.go.jp/speeches/kaiken/2020/20201026001.html (accessed on 3 June 2021).
- Ministry of the Environment, Japan: Greenhouse Gas Emissions. Available online: https://www.env.go.jp/earth/ondanka/ghg.html (accessed on 3 June 2021).
- Alonso, M.J.; Liu, P.; Mathisen, H.M.; Ge, G.; Simonson, C. Review of heat/energy recovery exchangers for use in ZEBs in cold climate countries, Building and Environment. Build. Environ. 2015, 84, 228–237. [Google Scholar] [CrossRef]
- Building Energy data book. In The Buildings Technologies Program, Energy Efficiency and Renewable Energy US; EERE: Washington, DC, USA, 2008; p. 2009.
- Mavromatidisa, G.; Orehounigb, K.; Bollingerb, L.A.; Hohmannb, M.; Marquanta, J.F.; Miglania, S.; Morvaja, B.; Murraya, P.; Waibela, C.; Wanga, D.; et al. Ten questions concerning modeling of distributed multi-energy systems. Build. Environ. 2019, 165, 106372. [Google Scholar] [CrossRef]
- IEA. Energy Technology Perspectives 2017: Catalysing Energy Technology Transformations, International Energy Agency; Organisation for Economic Cooperation and Development: Typeset, France, 2017. [Google Scholar] [CrossRef] [Green Version]
- Cornaro, C.; Pierro, M.; Puggioni, V.A.; Roncarati, D. Outdoor Characterization of Phase Change Materials and Assessment of Their Energy Saving Potential to Reach NZEB. Buildings 2017, 7, 55. [Google Scholar] [CrossRef] [Green Version]
- Cellura, M.; Ciulla, G.; Guarino, F.; Longo, S. Redesign of a Rural Building in a Heritage Site in Italy: Towards the Net Zero Energy Target. Buildings 2017, 7, 68. [Google Scholar] [CrossRef] [Green Version]
- Asdrubalia, F.; Ballarinib, I.; Corradob, V.; Evangelistia, L.; Grazieschic, G.; Guattaria, C. Energy and environmental payback times for an NZEB retrofit. Build. Environ. 2019, 147, 461–472. [Google Scholar] [CrossRef]
- Ascione, F.; Bianco, N.; de Masi, R.F.; Mastellone, M.; Vanoli, G.P. Phase Change Materials for Reducing Cooling Energy Demand and Improving Indoor Comfort: A Step-by-Step Retrofit of a Mediterranean Educational Building. Energies 2019, 12, 3661. [Google Scholar] [CrossRef] [Green Version]
- Buratti, C.; Moretti, E.; Zinzi, M. High Energy-Efficient Windows with Silica Aerogel for Building Refurbishment: Experimental Characterization and Preliminary Simulations in Different Climate Conditions. Buildings 2017, 7, 8. [Google Scholar] [CrossRef] [Green Version]
- Danza, L.; Barozzi, B.; Bellazzi, A.; Belussi, L.; Devitofrancesco, A.; Ghellere, M.; Salamone, F.; Scamoni, F.; Scrosati, C. A weighting procedure to analyse the Indoor Environmental Quality of a Zero-Energy Building. Build. Environ. 2020, 183, 107155. [Google Scholar] [CrossRef]
- Panagiotidou, M.; Fuller, R.J. Progress in ZEBs—A review of definitions, policies and construction activity. Energy Policy 2013, 62, 196–206. [Google Scholar] [CrossRef]
- Zhang, W.; Huang, F.; Mao, K.; Lin, C.; Pan, Z. Evaluation of Photovoltaic Energy Saving Potential and Investment Value of Urban Buildings in China Based on GIS Technology. Buildings 2021, 11, 649. [Google Scholar] [CrossRef]
- Saarloos, B.A.; Quinn, J.C. Net-Zero Energy Districts and the Grid: An Energy-Economic Feasibility Case-Study of the National Western Center in Denver, CO, USA. Buildings 2021, 11, 638. [Google Scholar] [CrossRef]
- Wang, C.; Wang, Q.; Nourozi, B.; Piesk, H.; Ploski, A. Evaluating the cooling potential of a geothermal-assisted ventilation system for multi-family dwellings in the Scandinavian climate. Build. Environ. 2021, 204, 108114. [Google Scholar] [CrossRef]
- Liu, X.; Li, C.; Zhang, G.; Zhang, L.; Wei, B. Numerical Investigation on Energy Efficiency of Heat Pump with Tunnel Lining Ground Heat Exchangers under Building Cooling. Buildings 2021, 11, 611. [Google Scholar] [CrossRef]
- Liu, G.; Wang, Z.; Li, C.; Hu, S.; Chen, X.; Liang, P. Heat exchange character and thermal comfort of young people in the building with solar radiation in winter. Build. Environ. 2020, 179, 106937. [Google Scholar] [CrossRef]
- IRENA. Renewable Power Generation Costs in 2018; IRENA: PAbu Dhabi, United Arab Emirates, 2019; Available online: https://www.irena.org/publications/2020/Jun/Renewable-Power-Costs-in-2019 (accessed on 3 June 2021).
- Zhang, Y.; Vand, B.; Baldi, S. A Review of Mathematical Models of Building Physics and Energy Technologies for Environmentally Friendly Integrated Energy Management Systems. Buildings 2022, 12, 238. [Google Scholar] [CrossRef]
- Bland, A.; Khzouz, M.; Statheros, T.; Gkanas, E.I. PCMs for Residential Building Applications: A Short Review Focused on Disadvantages and Proposals for Future Development. Buildings 2017, 7, 78. [Google Scholar] [CrossRef] [Green Version]
- Weger, L.; Abánades, A.; Butler, T. Methane cracking as a bridge technology to the hydrogen economy. Int. J. Hydrogen Energy 2017, 42, 720–731. [Google Scholar] [CrossRef] [Green Version]
- Schneider, S.; Bajohr, S.; Graf, F.; Kolb, T. State of the Art of Hydrogen Production via Pyrolysis of Natural Gas. ChemBioEng Rev. 2020, 7, 150–158. [Google Scholar] [CrossRef]
- Muradov, N. Hydrogen via methane decomposition: An application for decarbonization of fossil fuels. Int. J. Hydrogen Energy 2001, 26, 1165–1175. [Google Scholar] [CrossRef]
- International Energy Agency. Net Zero by 2050: A Roadmap for the Global Energy Sector. 2021. Available online: https://www.iea.org/events/net-zero-by-2050-a-roadmap-for-the-global-energy-system (accessed on 3 July 2021).
- Jacobson, M.Z.; Delucchi, M.A. Providing all global energy with wind, water, and solar power, Part I: Technologies, energy resources, quantities and areas of infrastructure, and materials. Energy Policy 2011, 39, 1154–1169. [Google Scholar] [CrossRef]
- International Energy Agency. Getting Wind and Solar onto the Grid: A Manual for Policy Makers; International Energy Agency: Paris, France, 2017; Available online: https://www.iea.org/reports/getting-wind-and-solar-onto-the-grid (accessed on 10 July 2021).
- Ministry of the Environment, Japan. ZEB Definition. Available online: https://www.env.go.jp/earth/zeb/detail/01.html (accessed on 3 June 2020).
- Institute for Building Environment and Energy Conservation (IBEC). Building Energy Simulation Tool (BEST). Available online: https://www.ibec.or.jp/best/ (accessed on 3 June 2020).
- Japan Meteorological Agency. Automated Meteorological Data Acquisition System. Available online: https://www.jma.go.jp/jma/kishou/know/amedas/kaisetsu.html (accessed on 3 June 2020).
- Smolinka, T.; Günther, M.; Garche, J. Stand und Entwicklungspotential der Wasserelektrolyse zur Herstelliung von Wasserstoff aus regenerativen Energien: Kurzfassung und Abschlussbericht. 2011. Available online: https://www.now-gmbh.de/wp-content/uploads/2020/09/now-studie-wasserelektrolyse-2011.pdf (accessed on 10 July 2020).
- Ministry of Economy. Trade and Industry: Prospects and Challenges for Hydrogen Production. Available online: https://www.meti.go.jp/committee/kenkyukai/energy/suiso_nenryodenchi/co2free/pdf/002_04_00.pdf (accessed on 3 February 2022).
- Keenan, J.H. Steam Tables: Thermodynamic Properties of Water Including Vapor, Liquid and Solid Phases; English Units; Wiley: New York, NY, USA, 1969. [Google Scholar]
- Institute of Electrical Engineers of Japan. Open Symposium: Utilization of Renewable Energy and Grid Interconnection. Available online: http://denki.iee.jp/?page_id=14878 (accessed on 3 February 2022).
- Leadership in Energy and Environmental Design (LEED). Available online: https://www.usgbc.org/leed (accessed on 20 June 2021).
- Building Research Establishment Environmental Assessment Method (BREEAM). Available online: https://www.breeam.com/ (accessed on 20 June 2021).
- Suzer, O. Analyzing the compliance and correlation of LEED and BREEAM by conducting a criteria-based comparative analysis and evaluating dualcertified projects. Build. Environ. 2019, 147, 158–170. [Google Scholar] [CrossRef]
- Comprehensive Assessment System for Built Environment Efficiency (CASBEE). Available online: https://www.ibec.or.jp/CASBEE/english/ (accessed on 22 July 2021).
- Agency for Natural Resources and Energy, ZEH (Zero Energy House). Available online: https://www.enecho.meti.go.jp/category/saving_and_new/saving/general/housing/index03.html (accessed on 20 June 2021).
- Ecoschools. Available online: https://www.ecoschools.global/ (accessed on 20 June 2021).
- Díaz-López, C.; Serrano-Jiménez, A.; Lizana, J.; López-García, E.; López-García Engineer, E.; Molina-Huelva, M.; Barrios-Padura, A. Passive action strategies in schools: A scientific mapping towards eco-efficiency in educational buildings. J. Build. Eng. 2022, 45, 103598. [Google Scholar] [CrossRef]
- Vadiee, A.; Dodoo, A.; Jalilzadehazhari, E. Heat Supply Comparison in a Single-Family House with Radiator and Floor Heating Systems. Buildings 2020, 10, 5. [Google Scholar] [CrossRef] [Green Version]
- Energy Plus. Available online: https://www.energy.gov/eere/buildings/downloads/energyplus-0 (accessed on 20 June 2021).
- eQUEST. Available online: https://www.doe2.com/equest/ (accessed on 20 June 2021).
- Institute for Building Environment and Energy Conservation (IBEC). Web Program. Available online: https://www.kenken.go.jp/becc/ (accessed on 3 June 2020).
- Agency for Natural Resources and Energy. Renewable Energy and Stable Supply. Available online: https://www.enecho.meti.go.jp/about/special/johoteikyo/saiene_anteikyokyu.html (accessed on 5 June 2021).
- De Santoli, L.; Basso, G.L.; Nastasi, B. The Potential of Hydrogen Enriched Natural Gas deriving fromPower-to-Gas option in Building Energy Retrofitting. Energy Build. 2017, 149, 424–436. [Google Scholar] [CrossRef]
- Verbecke, F.; Vesy, B. Safety strategy for the first deployment of a hydrogen-based green public building in France. Int. J. Hydrogen Energy 2013, 38, 8053–8060. [Google Scholar] [CrossRef]
- The Research Centre on Zero Emission Neighborhoods. Available online: https://fmezen.no (accessed on 3 July 2021).
- Hermesmann, M.; Müller, T.E. Green, Turquoise, Blue, or Grey? Environmentally friendly Hydrogen Production in Transforming Energy Systems. Prog. Energy Combust. Sci. 2022, 90, 100996. [Google Scholar] [CrossRef]
Figure 1.
The structure of ZEB in Japan.

Figure 2.
Photo of the target building.
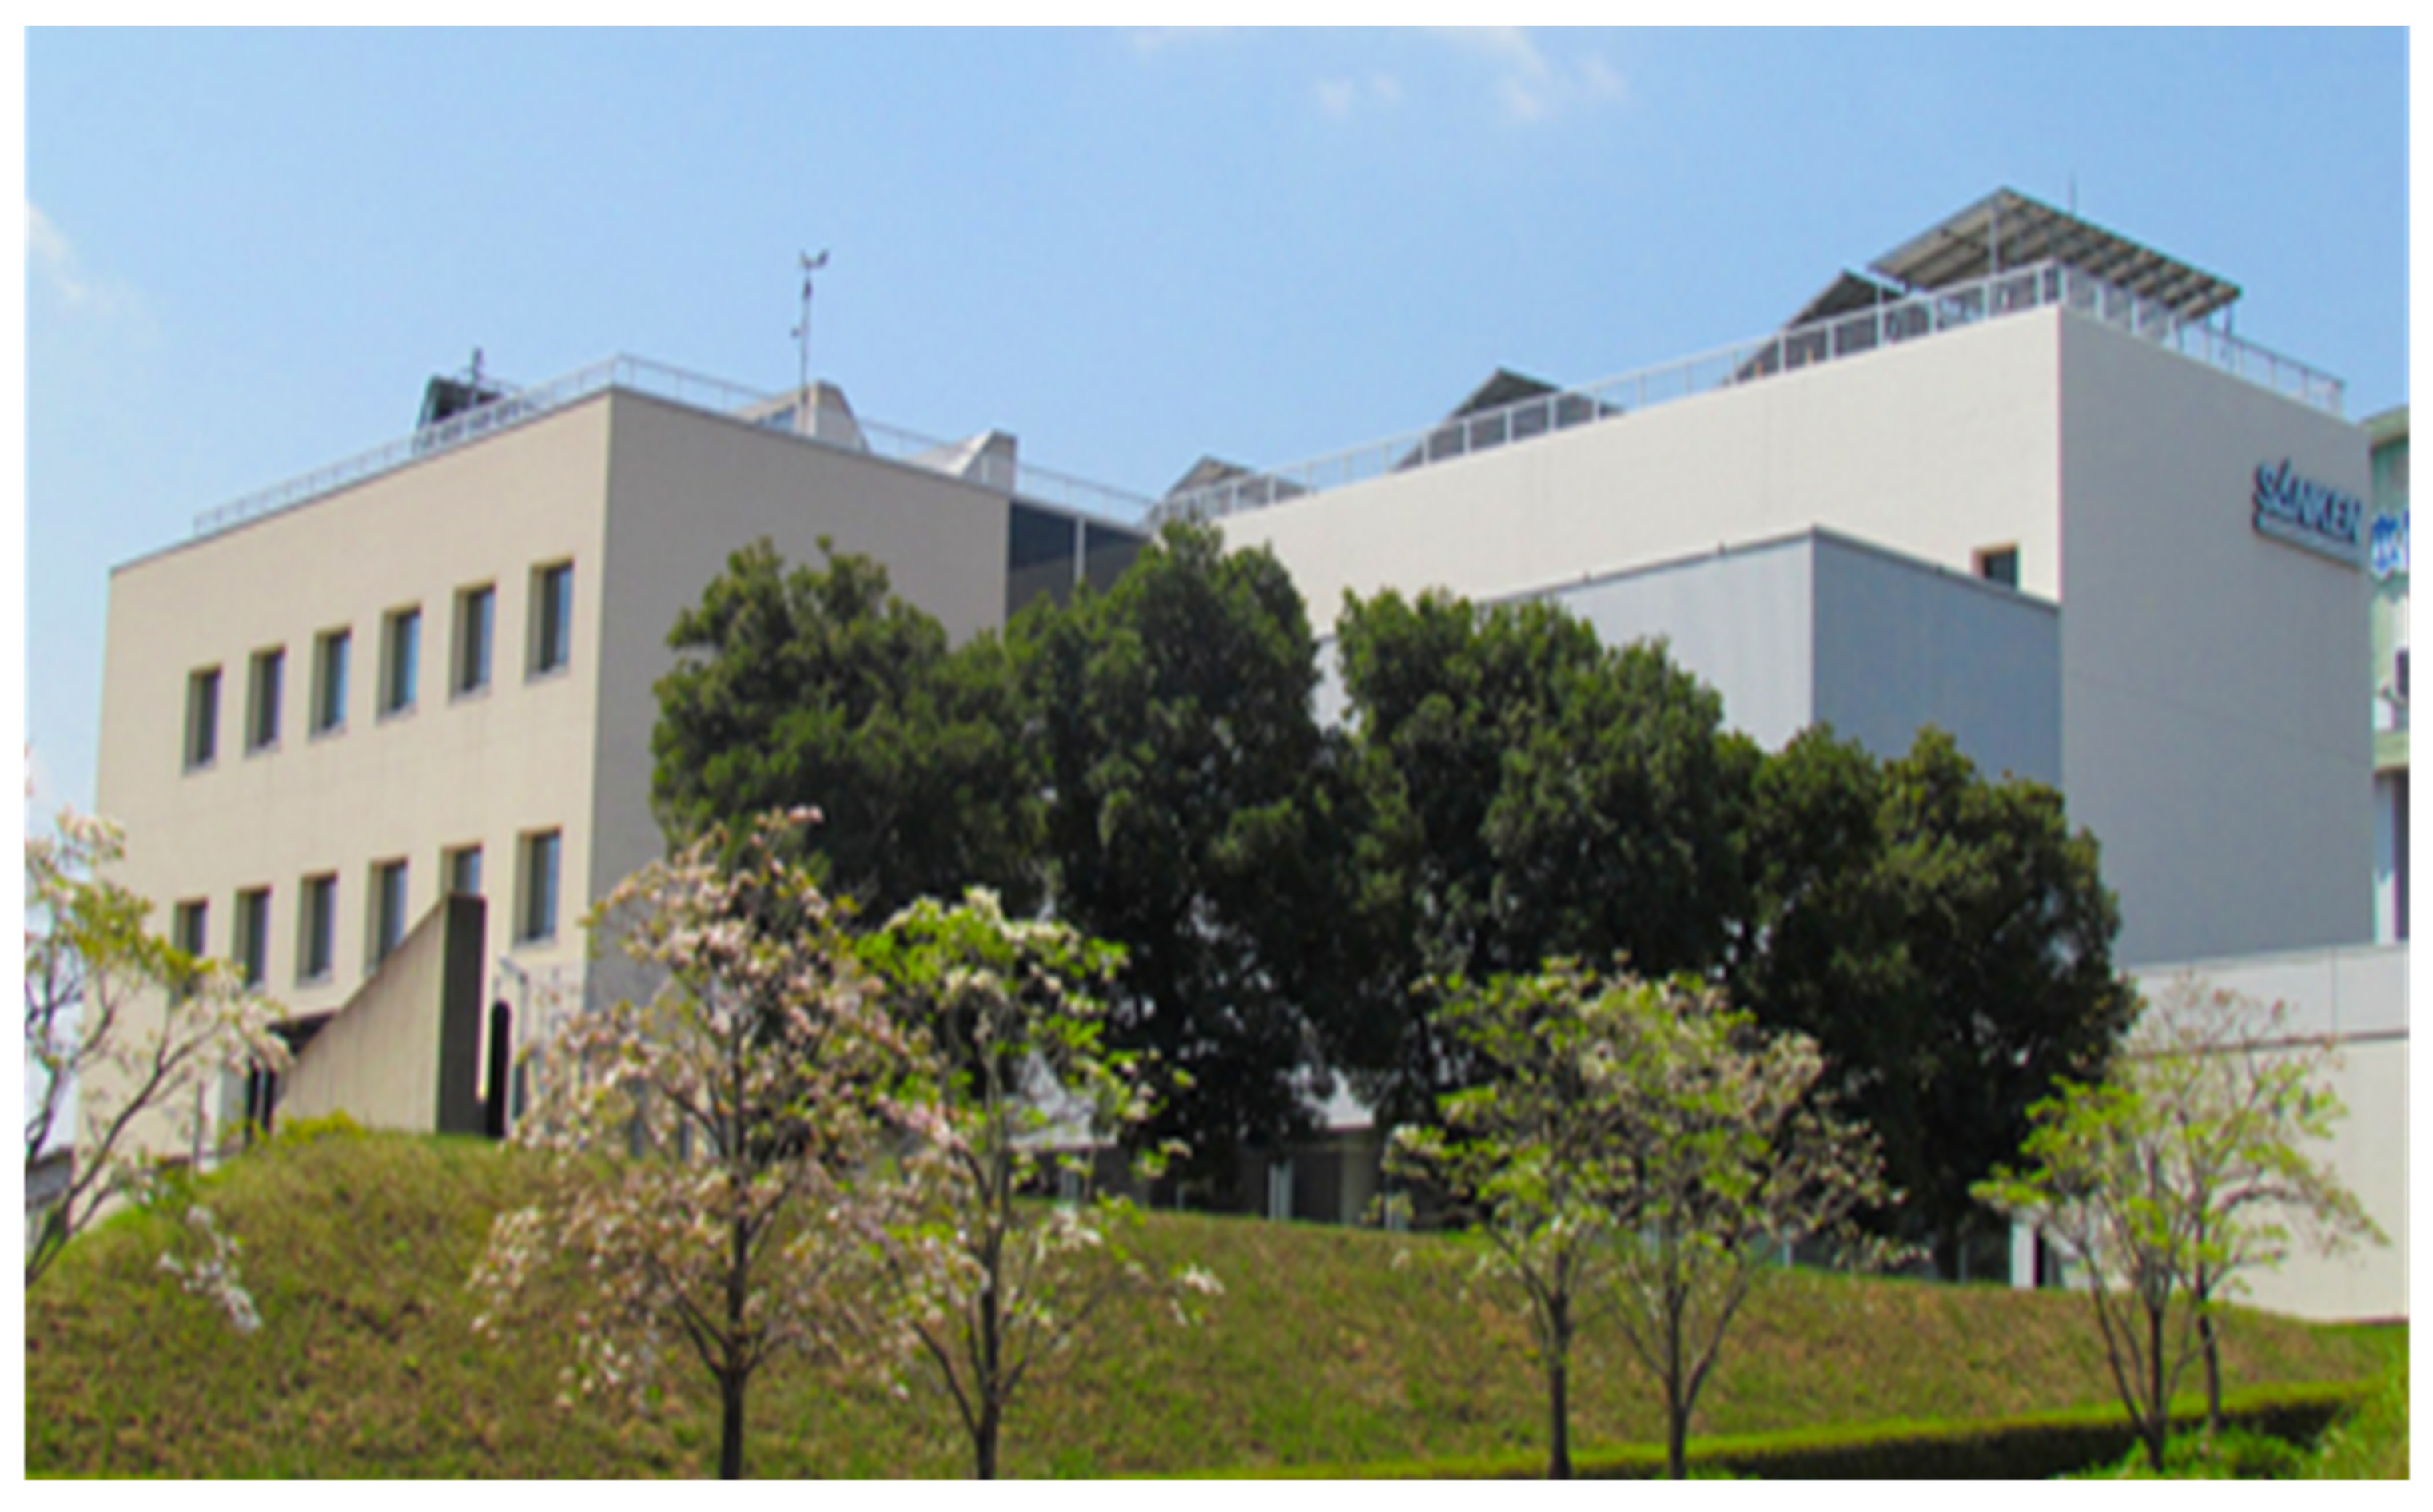
Figure 3.
Diagram of air conditioning system using renewable energy.

Figure 4.
Image of the energy utilization system of the building.
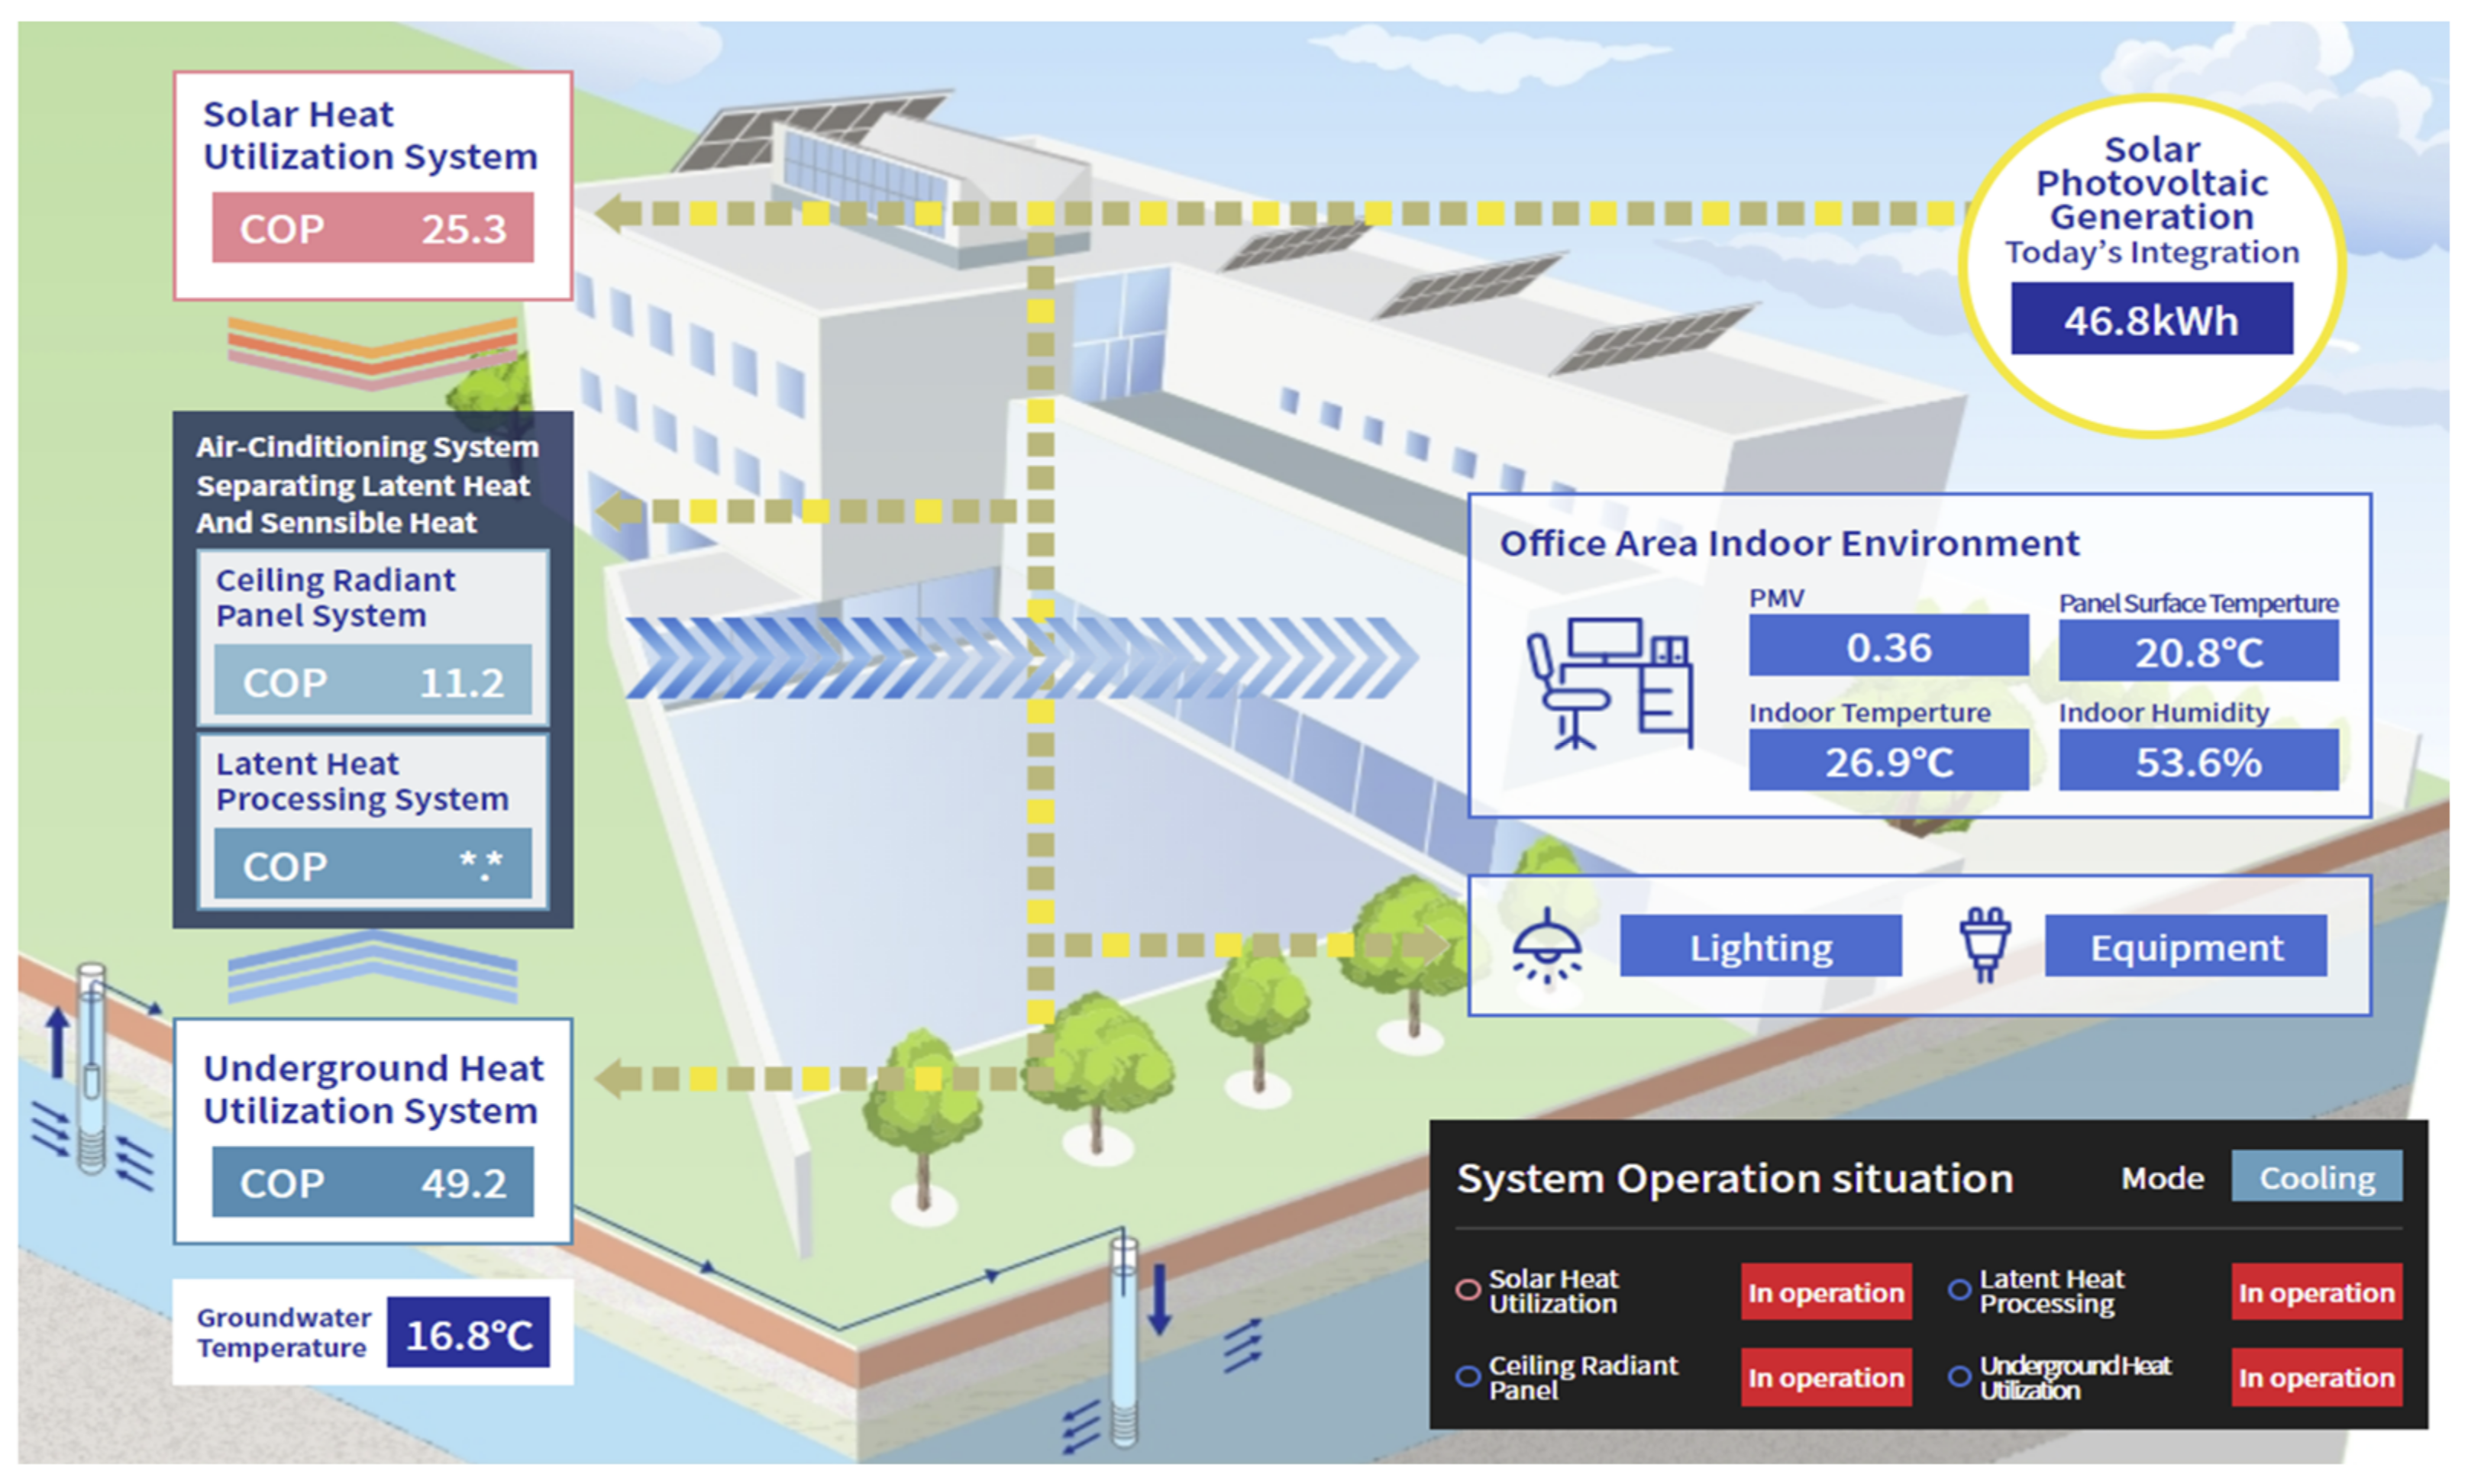
Figure 5.
Breakdown of energy consumption of the building in each month.
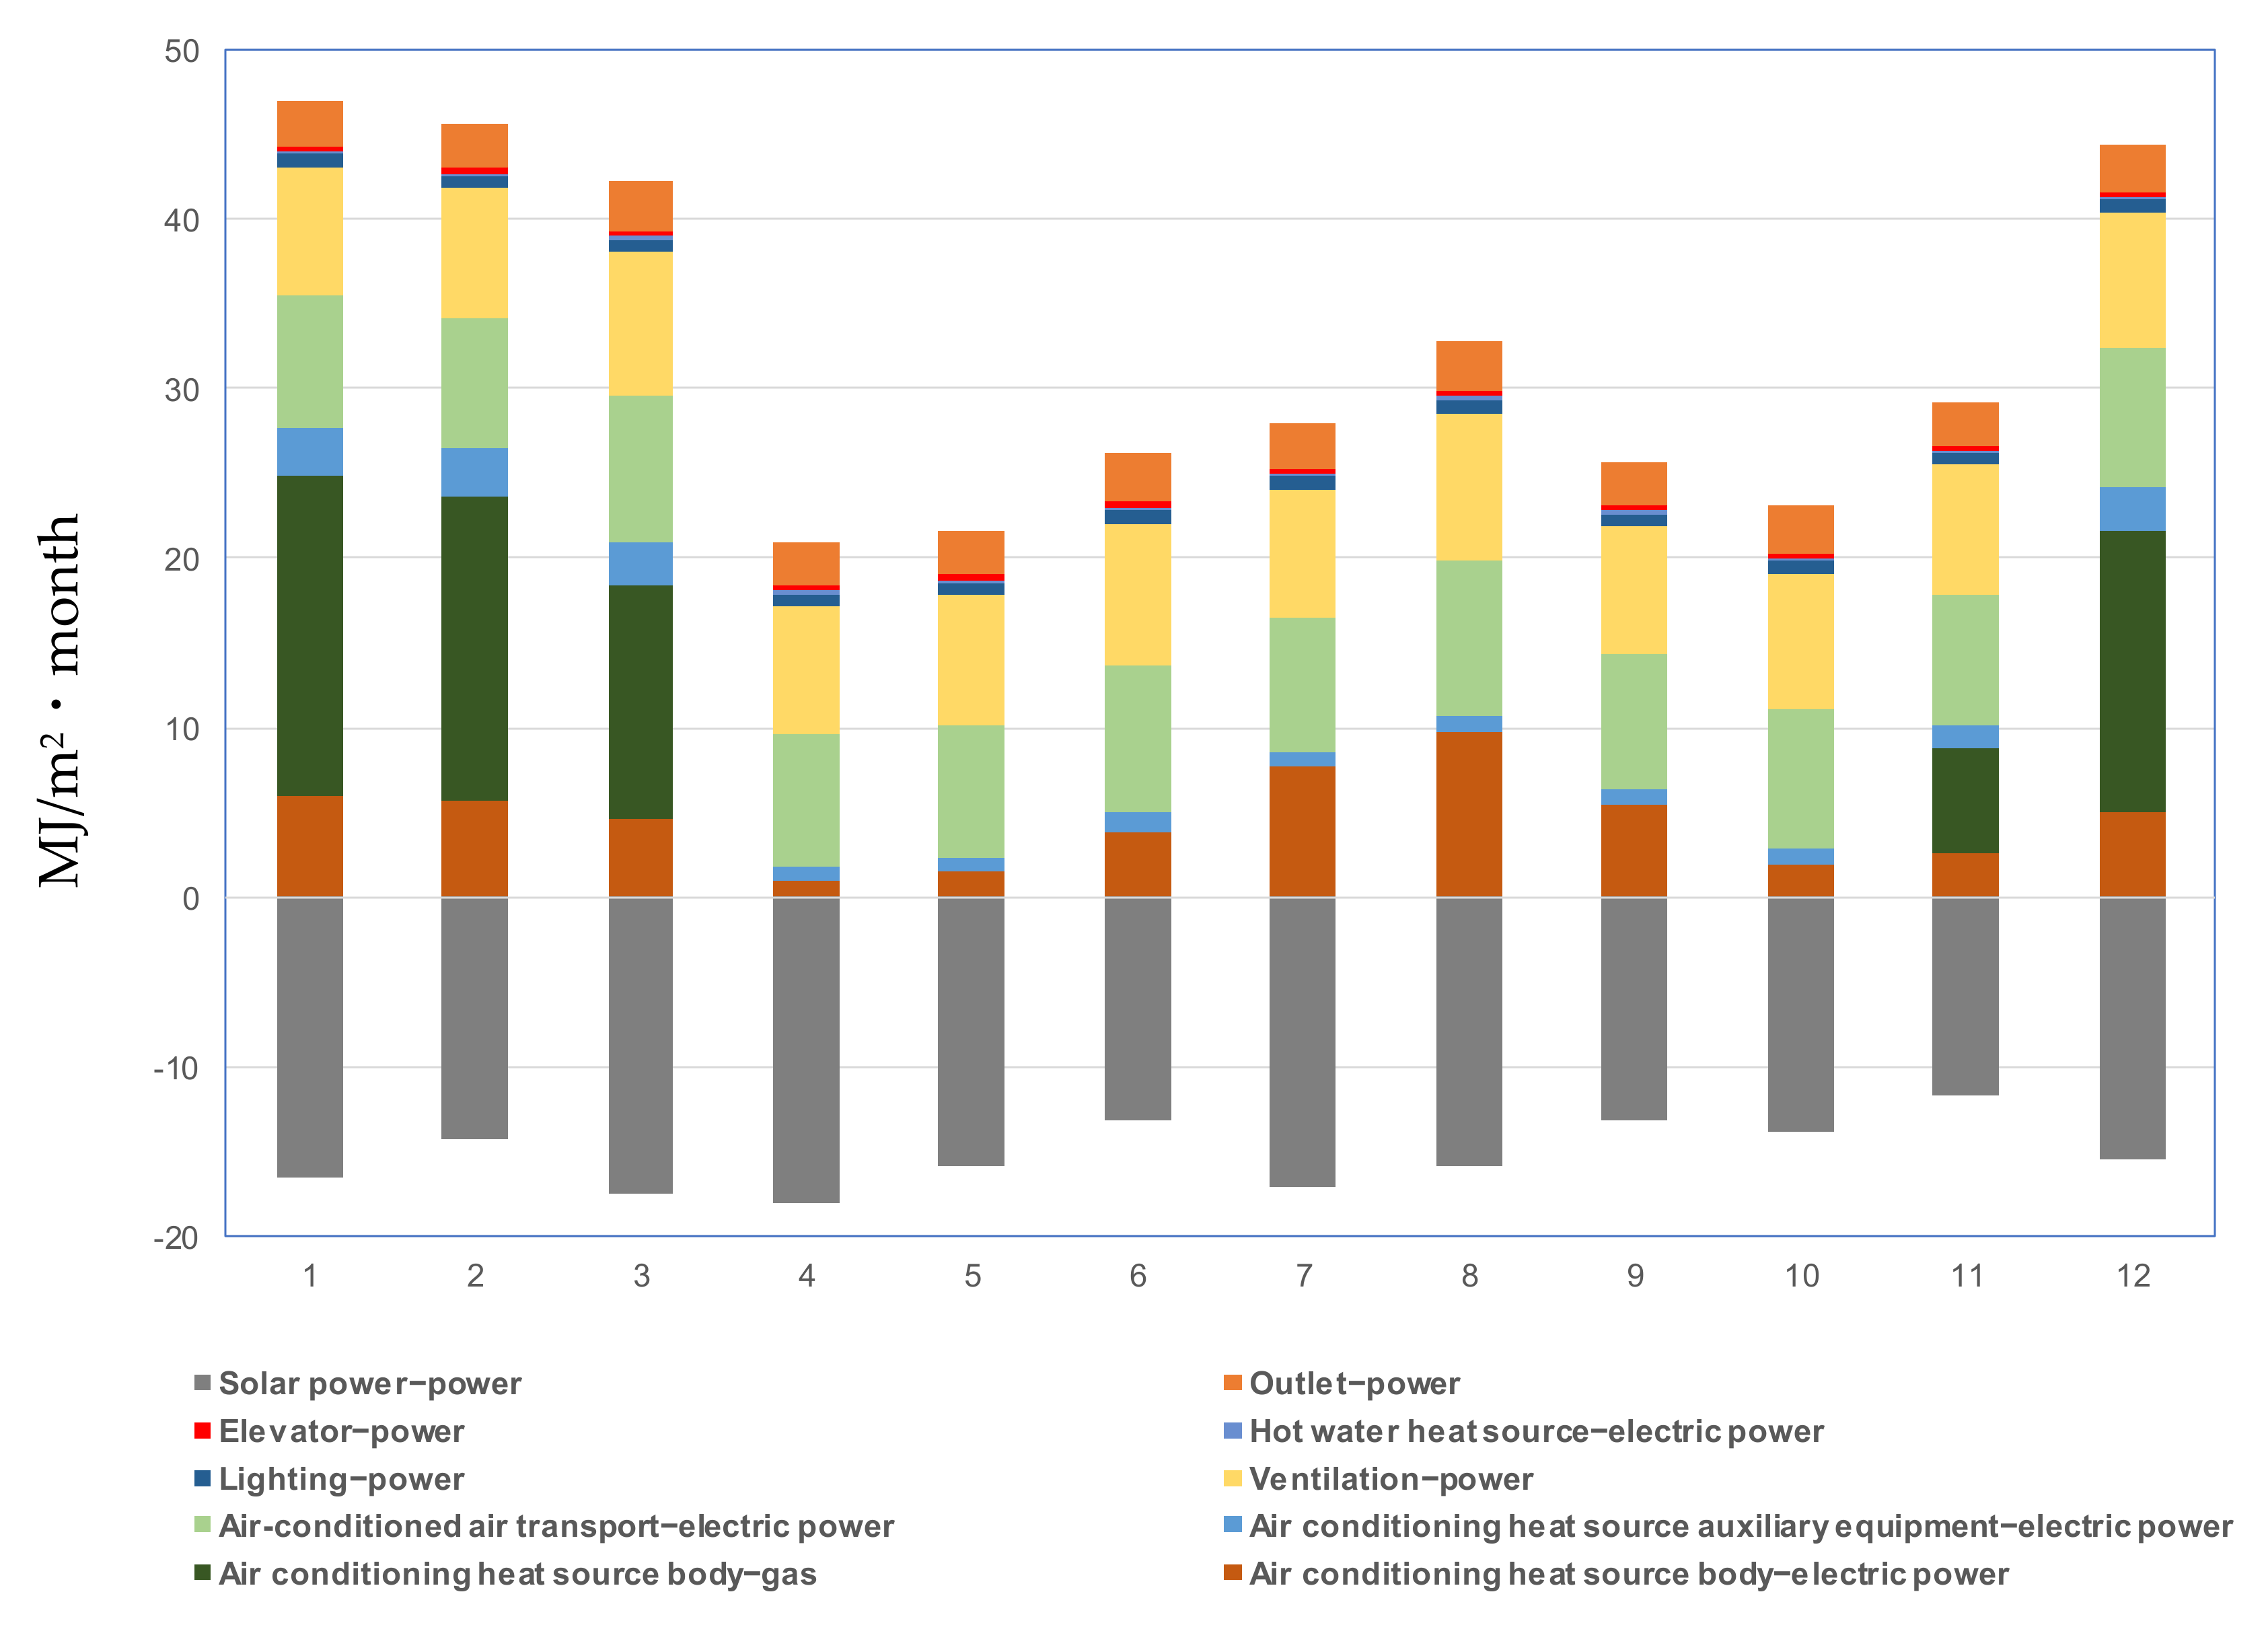
Figure 6.
The simulation results of the annual primary energy consumption by the BEST program.
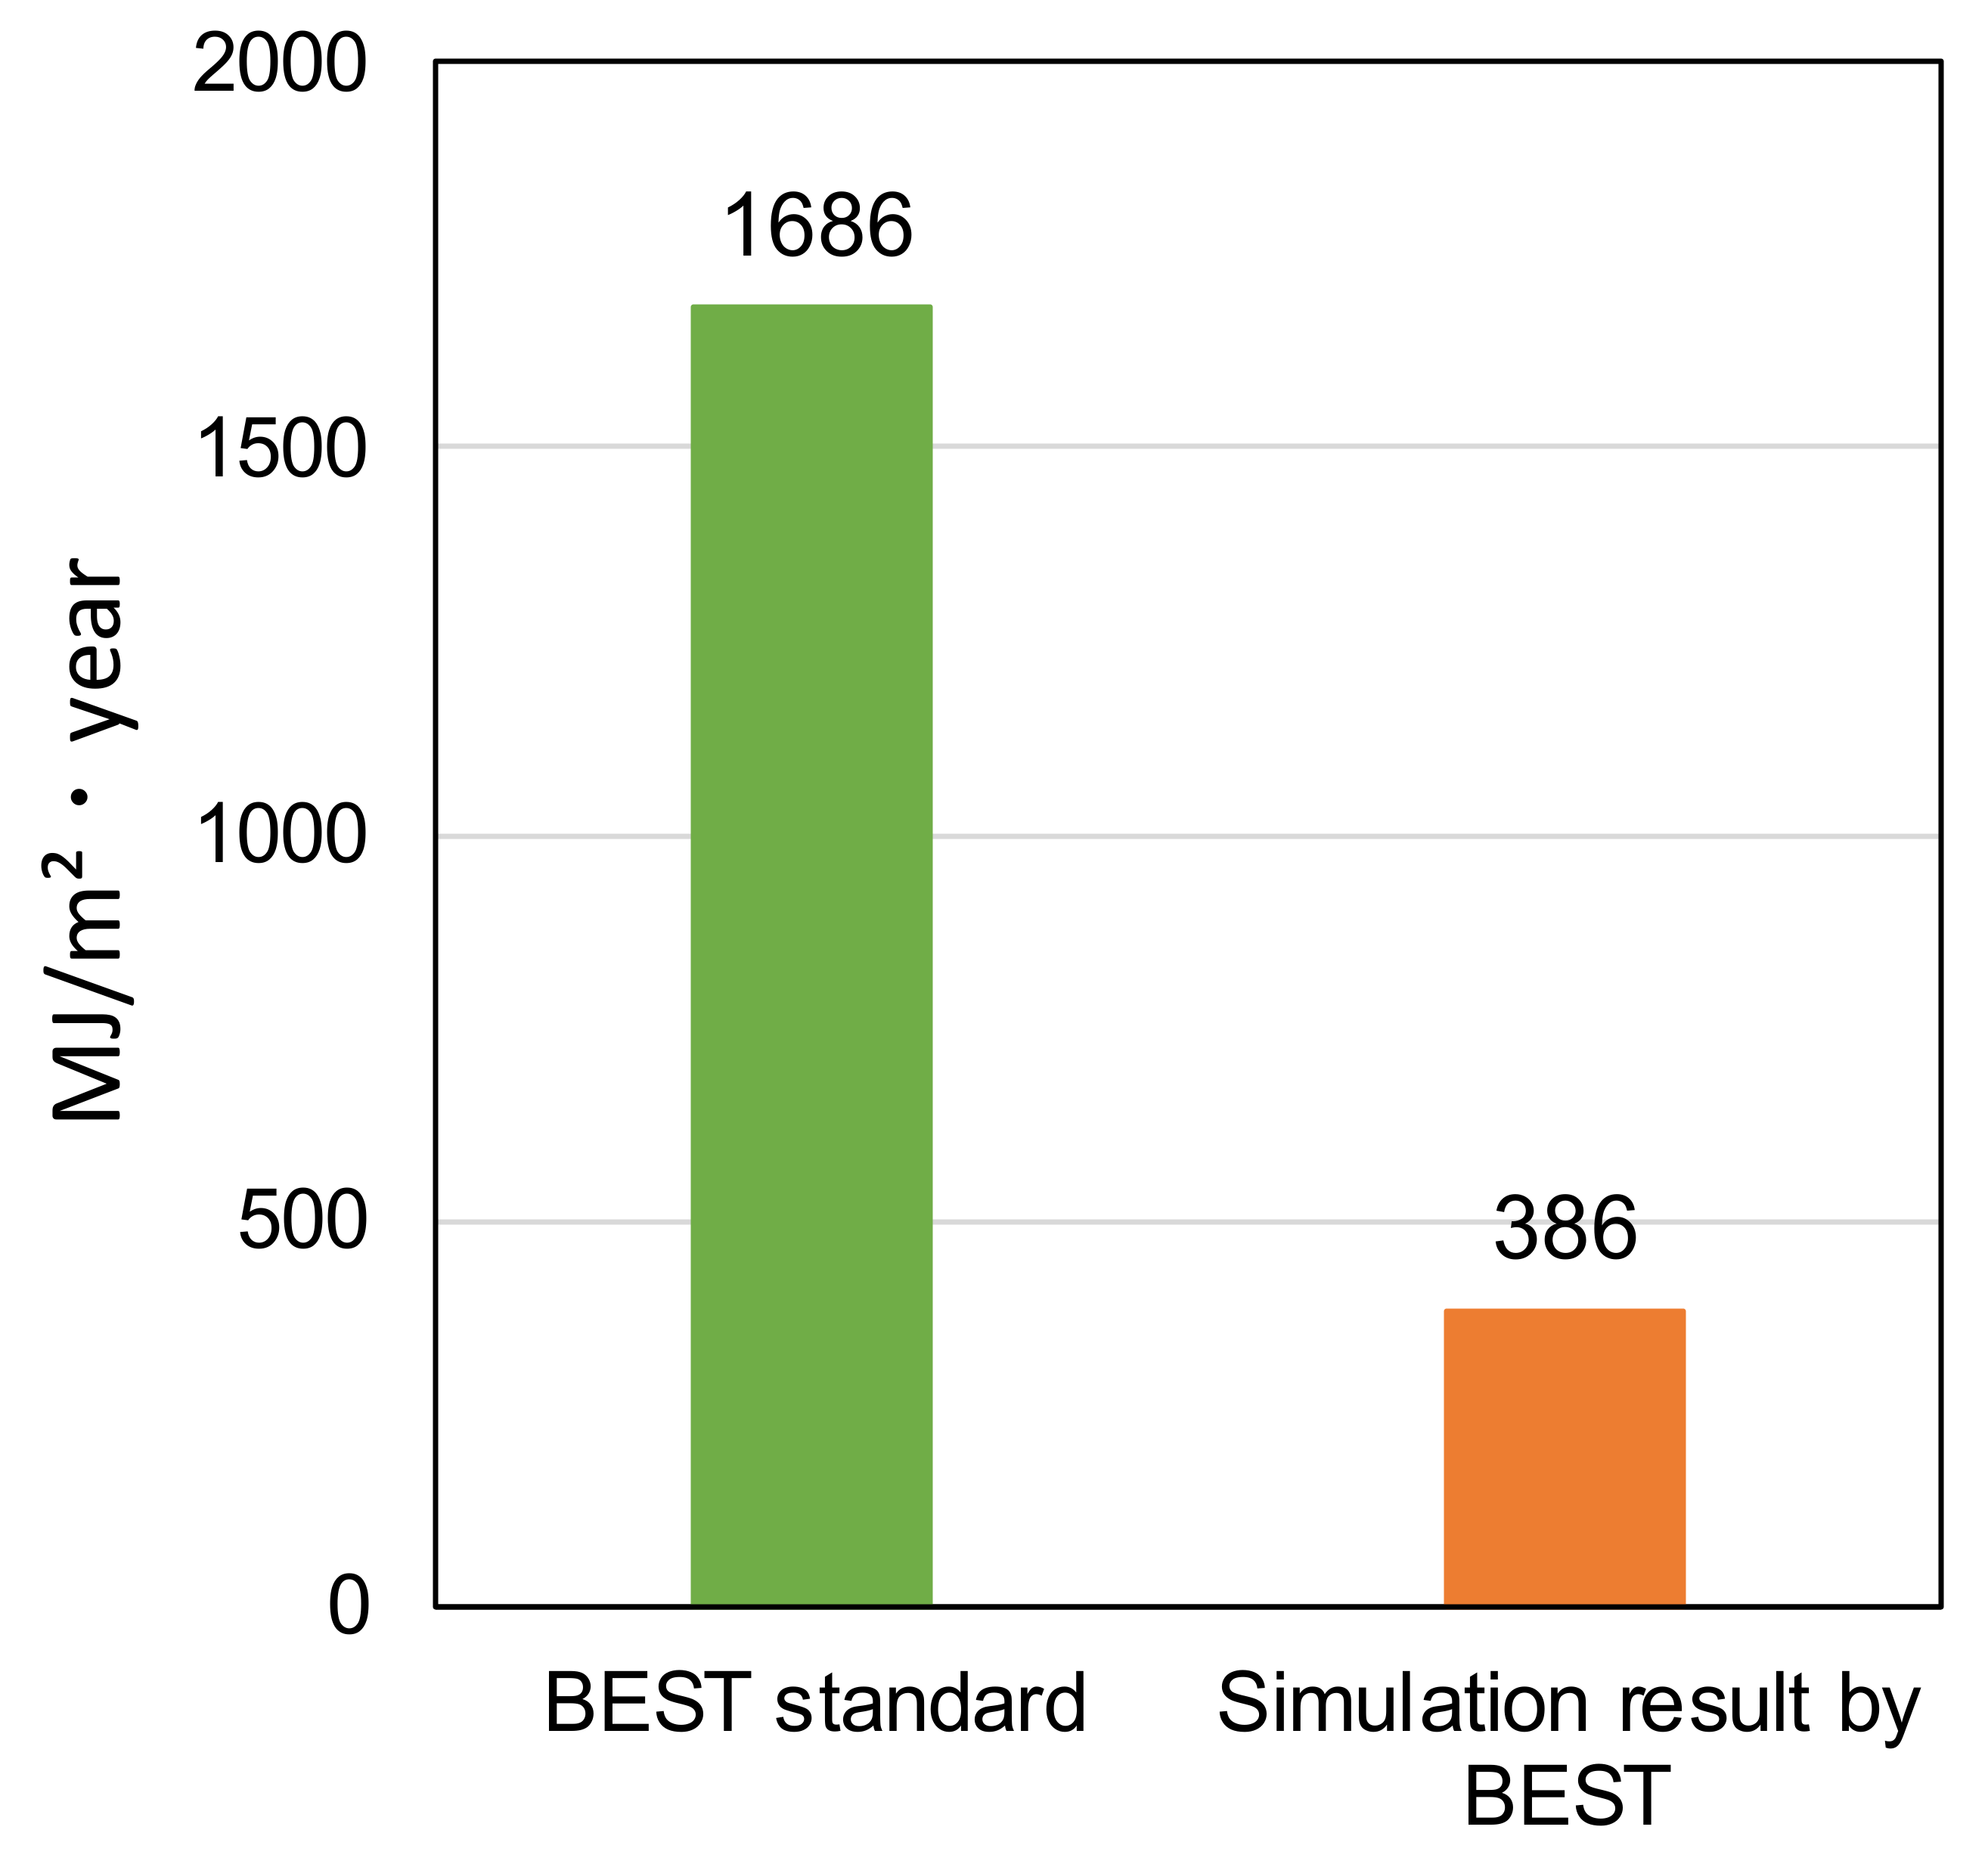
Figure 7.
The ratio of the energy consumption for each item to the primary energy consumption per annual area (2013).
Figure 7.
The ratio of the energy consumption for each item to the primary energy consumption per annual area (2013).

Figure 8.
The monthly average and average surplus power generated by the solar power system. in the building during 2013–2017.
Figure 8.
The monthly average and average surplus power generated by the solar power system. in the building during 2013–2017.

Figure 9.
The hydrogen production system using surplus electricity and the directions of its use.

Figure 10.
Hydrogen production using surplus electricity (monthly).

Figure 11.
Power generation by hydrogen fuel cell (monthly).
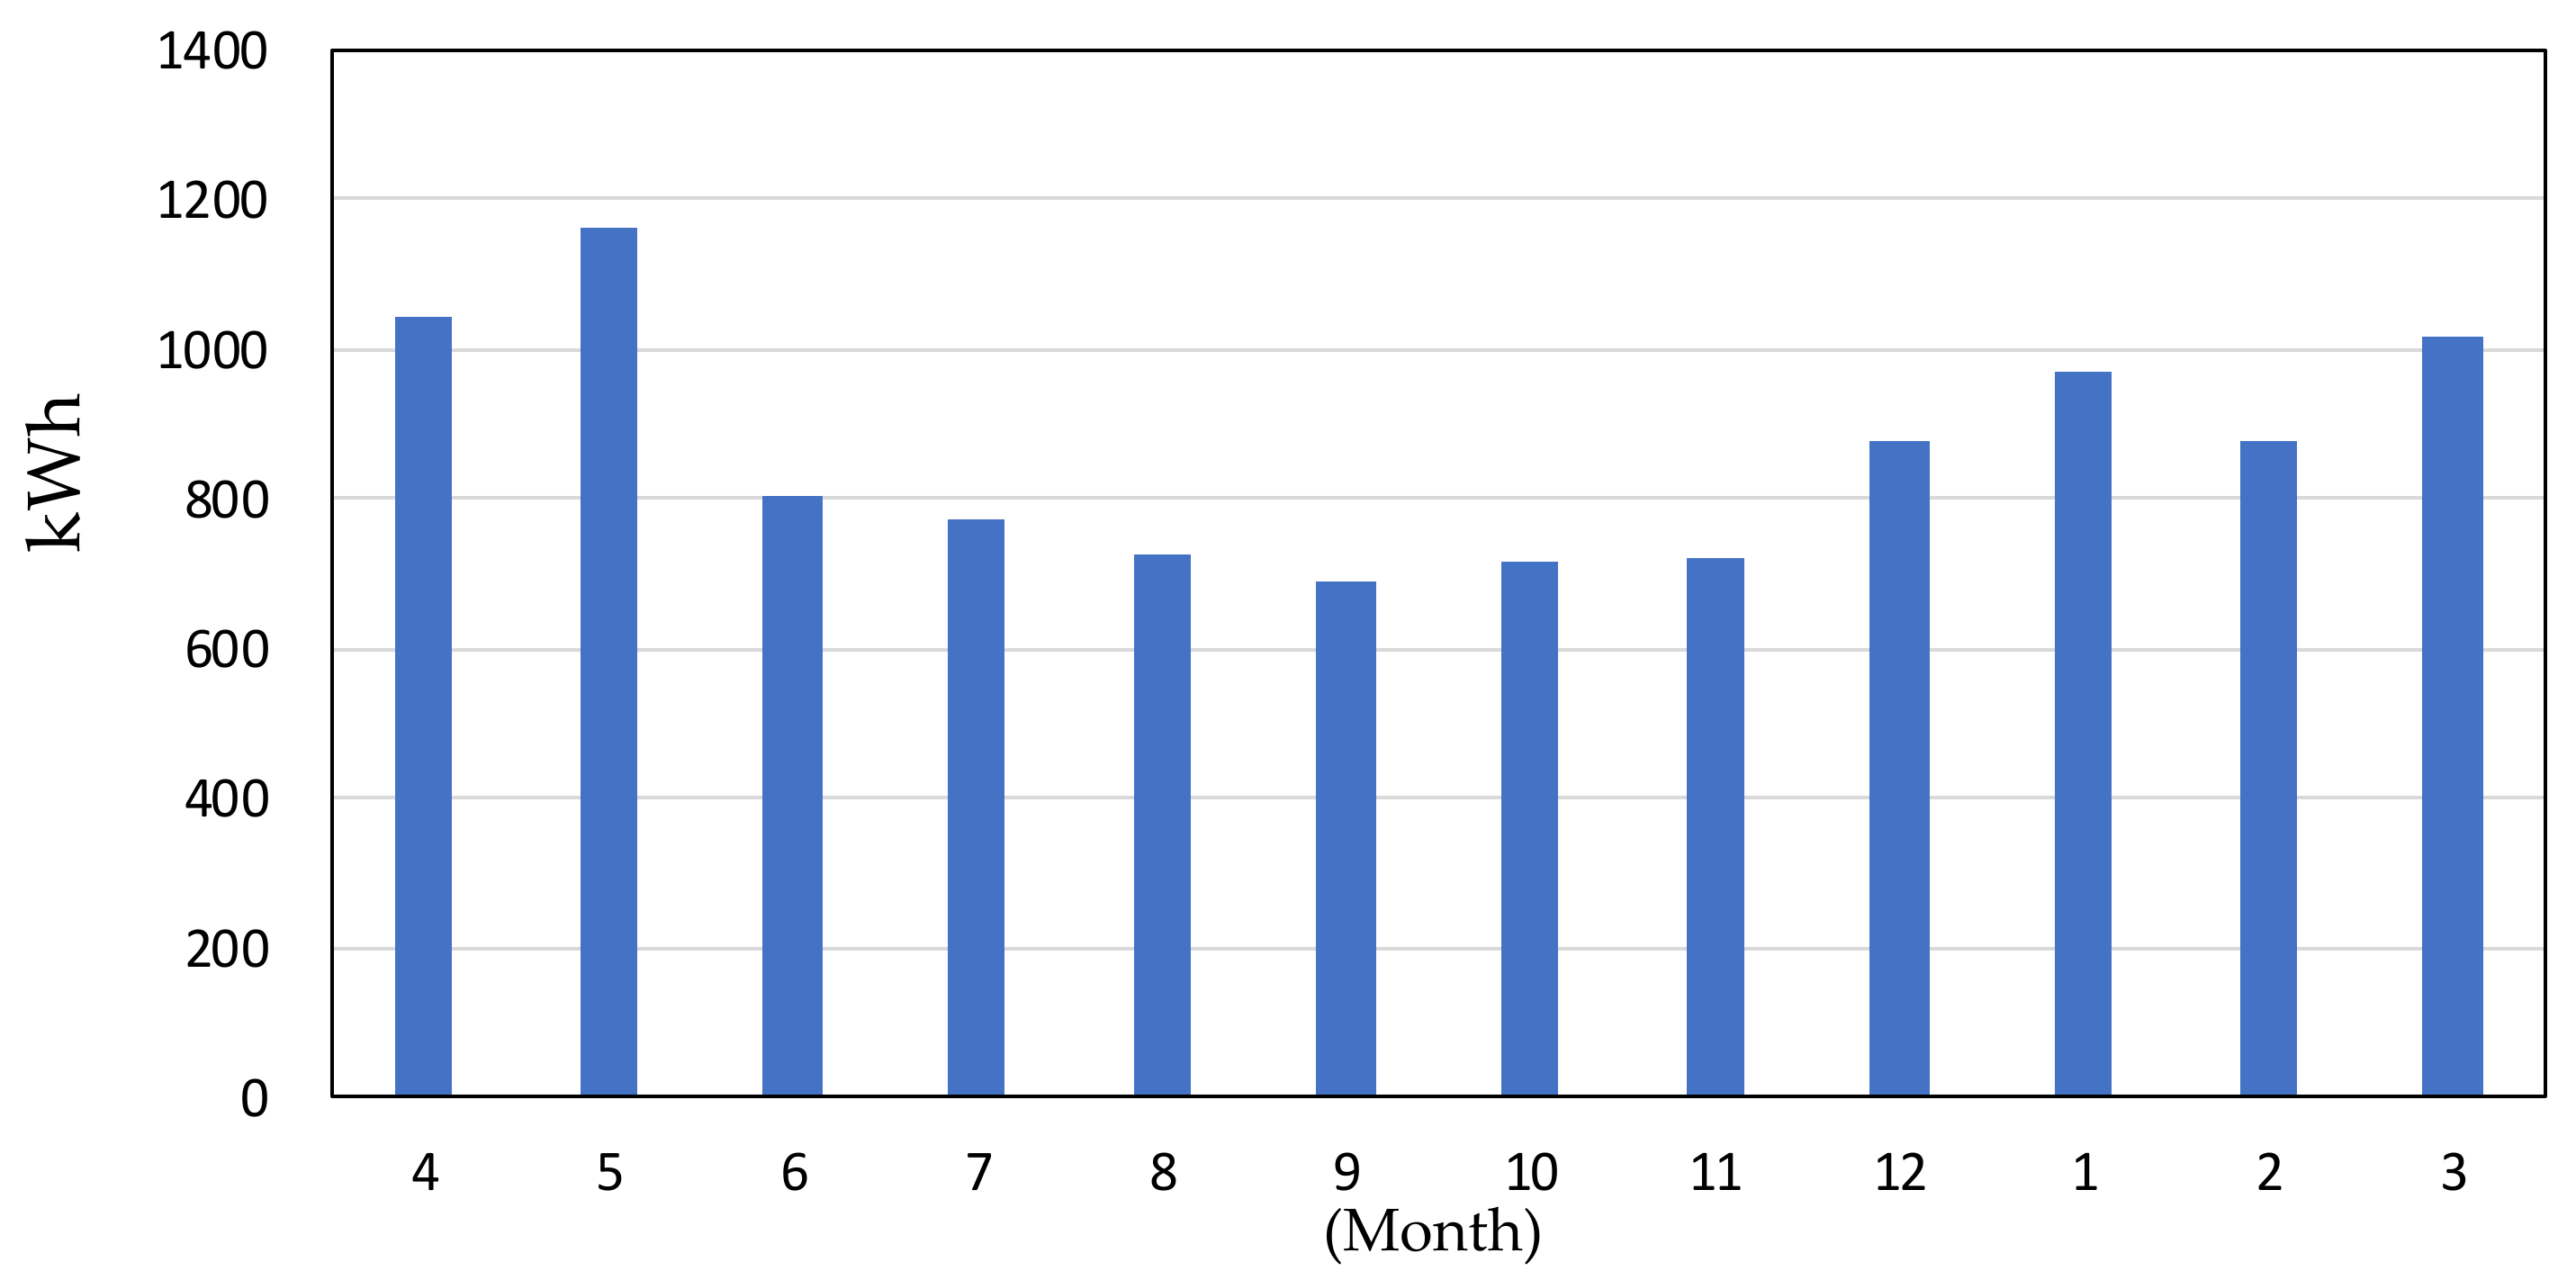
Figure 12.
Heat generation by hydrogen fuel cell (monthly).


Table 1.
Outline of the target building.
| Location | Ibaraki Prefecture |
| Building area | 1101.53 m2 |
| Total floor area | 2258.65 m2 |
| Height of the building | 13.7 m, Base floor height: 4.0 m |
| Construction | RC construction |
| Floor | 3 floors |
Table 2.
Outline of the equipment.
| Heat source | Use of geothermal heat Solar thermal panels Air-cooled heat pump Water source heat pump |
| Air conditioning | AHU + Single duct Packaged air conditioner (air heat source) |
| Ventilation | Living room area: No. 1 ventilation unit Restrooms: No. 3 ventilation unit |
| Lighting | LED Lights |
| Elevator | One hydraulic elevator |
Table 3.
Outline of the heat source.
| Air-cooled heat pump | Cooling capacity: 85 kW, Heating capacity: 85 kW Cold water volume: 244 L/min (usual) 12→7 °C Hot water volume: 244 L/min (usual) 40→45 °C |
| Water source heat pump | Cooling capacity: 20 kW, Heating capacity: 24 kW Cold water volume: 70 L/min (19.1→15.0 °C) Hot water volume: 60 L/min (30.0→36.0 °C) Cooling water volume: 70 L/min (22.0→27.0 °C) Heat source water volume: 395 L/min (12.0→7.0 °C) |
| Solar thermal panels | Heat collecting area: 2.0 m2, Circulating water volume: 3 L/min |
Table 4.
Simulation conditions.
| Meteorological data | Japan, The Automated Meteorological Data Acquisition System (AMeDAS) |
| Insulation performance | Urethane foam insulation (70 mm), Thermal conductivity:0.028 W/m·K |
| Window glass | Low-E Double glazing (Thermal transmission rate: 2.48 W/m2·K) |
| Air conditioning system | Air conditioning time 8:30~18:00 Cooling period July~September (28 °C, 60% RH) Heating period November~March (20 °C, 40% RH) |
| Internal heat generation | Personnel density 0.1 (person/m2) Lighting heat generation 16.3 (W/m2) Heat generation of electrical equipment 12 (W/m2) |
| Lighting | Light-emitting diode (LED) |
Publisher’s Note: MDPI stays neutral with regard to jurisdictional claims in published maps and institutional affiliations. |
© 2022 by the authors. Licensee MDPI, Basel, Switzerland. This article is an open access article distributed under the terms and conditions of the Creative Commons Attribution (CC BY) license (https://creativecommons.org/licenses/by/4.0/).
Share and Cite
MDPI and ACS Style
Kuwahara, R.; Kim, H.; Sato, H. Evaluation of Zero-Energy Building and Use of Renewable Energy in Renovated Buildings: A Case Study in Japan. Buildings 2022, 12, 561. https://doi.org/10.3390/buildings12050561
AMA Style
Kuwahara R, Kim H, Sato H. Evaluation of Zero-Energy Building and Use of Renewable Energy in Renovated Buildings: A Case Study in Japan. Buildings. 2022; 12(5):561. https://doi.org/10.3390/buildings12050561
Chicago/Turabian StyleKuwahara, Ryoichi, Hyuntae Kim, and Hideki Sato. 2022. "Evaluation of Zero-Energy Building and Use of Renewable Energy in Renovated Buildings: A Case Study in Japan" Buildings 12, no. 5: 561. https://doi.org/10.3390/buildings12050561
Note that from the first issue of 2016, this journal uses article numbers instead of page numbers. See further details here.