
Safety Risk Recognition Method Based on Abnormal Scenarios

1
School of Civil Engineering, Dalian University of Technology, Dalian 116024, China
2
School of Marine Technology and Environment, Dalian Ocean University, Dalian 116023, China
*
Author to whom correspondence should be addressed.
Buildings 2022, 12(5), 562; https://doi.org/10.3390/buildings12050562
Submission received: 24 March 2022
/
Revised: 19 April 2022
/
Accepted: 25 April 2022
/
Published: 27 April 2022
(This article belongs to the Topic Advances in Construction and Project Management)
Abstract
:Construction safety monitoring is a significant issue in practical engineering. Unfortunately, specific techniques in this field still heavily depend on artificial monitoring. To detect the abnormal scenarios during the construction process automatically, a method was proposed for the detection and localization of abnormal scenarios in time and space. The method consists of three components: (1) an I3D-AE video prediction model, which extracts the video features from multiple I3Ds and reconstructs the video by 3D deconvolution; (2) a spatial localization module AS-CAM, which determines the location of abnormal areas via back-propagating the I3D-AE; (3) a temporal parameter St, which can calculate the abnormal time period. The effectiveness of the method was verified with the use of a dataset, and the resulting data were plotted as ROC curves. The results indicated that the proposed method exceeded 0.9 on the frame-level test and 0.76 on the pixel-level test with the use of the AUC evaluation metric. Therefore, it can be used to assist the construction managers to improve the efficiency of construction safety management.
1. Introduction
Construction is a high-risk industry in many countries, and the risks inherent in the construction industry contribute to high worker fatalities. According to the US Bureau of Labor Statistics (US BUREAU OF LABOR STATISTICS), 3.1 out of every 100 full-time construction workers in the US were injured and sick, and according to the UK National Safety Executive (HSE), 262 workers were injured per 10,000 workers in the UK construction industry in 2017 [1].
Construction site monitoring is an essential procedure in construction safety control, to minimize construction safety risks, as well as to support project managers in making strategic decisions at critical times [2]. However, the construction site environment is complex [3], and with many targets [4], so it is difficult for construction managers to monitor the construction site in real time. Since there are numerous cameras on the construction site [5], it is convenient to introduce some vision-based technologies for continuously monitoring the activities of construction sites [6,7,8,9,10].
However, most of the existing studies have focused on the recognition and tracking of workers’ actions during the construction process. The hazards of the construction process do not arise only from workers’ actions, but also from the presence of some construction workers, construction machines, or construction materials in areas and times where they should not be. For example, falling from heights are the greatest risk of death for construction workers [11,12]; on the one hand, they are due to the construction workers not wearing safety belts as required when working at heights [13], while on the other hand, the illegal presence of construction workers in some overhead areas is an important reason [14]; in construction site fire accidents, flammable construction materials in areas with a considerable amount of welding work are the main cause of fires in the construction process [15,16,17]. To cope with these risks, researchers have proposed intelligent methods for identifying risk scenarios [18,19].
Although the current approach focuses on specific risk recognition, in the construction site, there are many types of risks, and they change with time, so if the risks are recognized in a directional way, it is easy to cause insufficient recognition of risks; a risk recognition method that can be used for a multi-scenario recognition is also lacking. Under a sound security management system, the occurrence of risk events is generally a small probability event, i.e., an abnormal event. Abnormal events are unpredictable, and if they are recognized for this characteristic of risk events, security risks can be effectively recognized while consuming a small amount of computation. Compared with previous methods, the greatest contribution of this paper is in its exploratory attempt to use the unpredictability of risk scenarios to identify risks; this is the first time that the idea of abnormal scenarios prediction is used to recognize the safety risks of the construction process, for which only a deep learning network is needed to avoid tedious database construction.
Based on the above analysis, we proposed a 3DCNN-based encoder model to detect abnormal frames by predicting future frames, which is an end-to-end deep learning framework trained on normal video samples. Specifically, we predicted a video based on the history of video clips; to this end, we first built a prediction model that can predict future videos, and we trained it with a normal video so that it can predict future videos. In the testing phase, if the error between the truth frame and the predicted frame was small, we decided that it was a normal video, and if the error was large, we considered this frame as an abnormal frame. An effective model to predict the video is key for the task, and therefore, we used an I3D-AE encoder as the video prediction model, which consists of two parts—an encoder and a decoder. In the encoder part, we used multiple I3D [20] networks to extract video features, which have good performance in extracting video features, and we used multiple 3D deconvolutional networks in the decoder. For the abnormal scenarios localization, we proposed a module AS-CAM for the spatial information localization and a parameter St for the temporal information localization.
2. Related Research
2.1. Abnormal Scenario Detection Methods
Sungmin and Junseok [21] proposed a novel system that detects abnormal events. Unlike conventional methods, they considered abnormal event detection as a variation matching problem. In the application of abnormal scenarios detection, deep learning plays an irreplaceable role. Wei et al. [22] proposed an abnormal scenario detection method for monitoring abnormal activities in public places. They exploited fully convolutional neural networks (FCNs), which have been proved to be powerful in image processing, to extract the features of videos. Zhang et al. [23] introduced a more effective algorithm for detecting abnormal behaviors in narrow areas with perspective distortion. The algorithm firstly uses the adaptive transformation mechanism to make up for the distorting effect in the region of interest extraction. Then, an improved pyramid L–K optical flow method with perspective weight and disorder coefficient was proposed to extract the abnormal behavior feature that occurred in historical moving images. Abid [24] proposed a two-stream architecture using two separate 3D CNNs to accept a video and an optical flow stream as input to enhance the prediction performance. He et al. [25] proposed an anomaly introduced learning (AL) method to detect abnormal events. A graph-based, multi-instance-learning (MIL) model was formed with both normal and abnormal video data. Sabokrou et al. [26] were the first to apply deep learning to the task of abnormal scenario detection; the researchers combined two detectors into a cascade classifier and achieved good detection results. Fully convolutional networks (FCNs) were used in a pretrained model [27], combining semantic information (inherited from existing CNN models) and low-level optical flow to measure local anomalies. One of the advantages of this method is that it does not require fine-tuning of the phase.
2.2. Construction Risk Scenario Detection Methods
Duan et al. [28] proposed a method to recognize and classify four different risk events by collecting specific acceleration and angular velocity patterns through built-in sensors of smartphones. The events were simulated with anterior handling and shoulder handling methods in the laboratory. After data segmentation and feature extraction, five different machine learning methods were used to recognize risk events, and the classification performances were compared. Jeongeun et al. [29] proposed a deep convolutional neural network that automatically recognizes possible material and human risk factors in the field regardless of individual management capabilities. The most suitable learning method and model for this study’s task and environment were experimentally identified, and visualization was performed to increase the interpretability of the model’s prediction results. Kim et al. [30] analyzed the step-by-step process required to automate construction site safety management based on Building Information Modeling (BIM) and evaluated a specific construction site hazard using a BIM-based example. Yang et al. [31] developed a fire identification model and a real-time construction fire detection (RCFD) system. Experiments were conducted to verify the applicability of the proposed system under different environmental conditions. Xiong et al. [32] developed an automated hazards identification system (AHIS) to evaluate operational instructions generated from field videos based on safety guidelines extracted from text files by construction safety ontology. Zhang et al. [1] proposed an automatic recognition method.
3. Proposed Method
We proposed an abnormal detection method during the construction process based on future frame prediction, consisting of a model for predicting future frames, which is called I3D-AE, and using past frames in video clips to predict future frames. We proposed a module AS-CAM to locate the spatial information of abnormal scenarios and used a parameter St to locate the temporal information of the abnormal scenarios. The key elements of the proposed method are shown in Figure 1.
3.1. I3D-AE Video Prediction Model
Unlike conventional autoencoders, our convolution is a 3D convolution, and multiple I3Ds were used in the encoder (two-stream inflated 3D ConvNets) [20]. One video clip was extracted from each I3D, and the video clips extracted from adjacent I3Ds were consecutive but not intersecting. The number of I3D modules can be used according to the actual situation; the number of modules used for the purposes of this paper was four. The 3DCNN is expanded from 2DCNN Inception-V1 and can use the parameters pretrained on ImageNet. The experimental results show that this model achieved the best results with this configuration on all standard datasets. The middle layer uses three fully connected layers, and the decoder has a 3D deconvolutional structure. We used a normal construction site video as the training video, as we can reconstruct the video well when the test video is a normal video, and the reconstruction error is large when the test video is an abnormal video. The model structure is shown in Figure 2.
At the beginning of the training, given an input video clip Vi and a future clip Vp, the autoencoder reconstructs the video using Iw(Fw (Dw (Vi))), where Iw is an I3D integrated network with the weight parameter ID, Fw is a fully connected layer with the parameter wF, and the decoder Dw is a 3D deconvolutional network with the weight parameter wD. To train this autoencoder, we used Euclidean loss as the loss function.
The first term of the objective function is the loss function, which was used to calculate the difference between the reconstructed frame and the video frame, and the second phase of the objective function is the L2 regularization, which was used to limit the complexity of the parameters in the autoencoder. In the encoder part, to reduce the model parameters, we read 64 frames of grayscale video instead of RGB video and used four I3D modules as feature extractors; the features extracted by the I3Ds were pooled in time and then entered into the fully connected layer. In the decoder part, we used four upsampling layers and three deconvolution layers, each of which contains a ReLU layer.
3.2. Spatial and Temporal Locating
3.2.1. Abnormal Scenario Spatial Localization
Since we trained normal clips as the dataset, abnormal scenarios cause a larger reconstruction error when they appear in the clips. The reason for the increased reconstruction error is due to the presence of abnormal scenarios in the clips. Therefore, it is crucial to find the pixels that cause the reconstruction error to increase, the locations of which indicate abnormal scenarios. Based on the above assumptions, we proposed an AS-CAM module to locate abnormal scenarios, which was developed based on Grad-CAM++ [33]. The flow of the AS-CAM is shown in Figure 3.
Grad-CAM++ is based on CAM [34] and Grad-CAM [35], the principle of which is to construct the weights of the action maps, and by solving for the weights, the contribution of different action maps to the reduction in the objective function is obtained; furthermore, by multiplying weights with the action maps, the heat maps are obtained to show which area contribute most to the reduction in the objective function. In our task, we needed to find out which areas contributed most to the increase in reconstruction error, which were the locations of irregular construction in the construction scenarios. The calculation formula for the abnormal location is as follows:
where Lij is the saliency map of abnormal scenarios of spatial location (i,j), and wk is the weight of the pixel Aij in the kth action map. The value of wk can be multiplied by the pixel weights and the loss gradient through the negative ReLU (NReLU) activation weighting.
where is the weighting coefficient of pixel (i,j) when wk is calculated; NReLU is the activation function. The calculation of is as follows:
where (i,j) and (a,b) are iterators over the same activation map. NReLU is designed to activate the negative gradients, so the expression of NReLU is as follows:
where is the reconstruction error, with the input of Vi. It can be calculated by backpropagation of the I3D-AE, and the equation is as follows:
Therefore, the saliency map of abnormal scenarios is calculated by Equation (7) as follows:
3.2.2. Abnormal Scenario Temporal Localization
For the temporal localization of abnormal scenarios, we calculated the reconstruction error for each frame by subtracting the pixel value of each frame from the pixel value of the corresponding frame of the reconstructed video.
where indicates the pixel value of a frame, indicates the pixel value of the reconstructed frame at that specific time; after normalizing the reconstruction error, we obtained the temporal information parameter as follows:
4. Experiments
4.1. Construction Site Dataset
A dataset was taken at a construction site in Chengdu with an iPhone 13. The intention of this section is to simulate a fire scenario in a construction site, hoping to detect fire scenarios in time and space. In construction sites, fires are generally prohibited, so in order to simulate the identification of fire scenarios, in this section, we use the image of steel welding as an alternative. Since fire and smoke are generated when steel welding is drawn and welded, the characteristics of fire can be well simulated. The video in which no firelight and smoke are generated was used as the regular screen for training I3D-AE in dataset species, and the welding screen containing firelight and smoke was tested as the abnormal screen. The dataset contained a total of 62 min of video in the regular frame and 3 min of video in the abnormal frame.
4.2. Evaluation Criteria
In order to evaluate the abnormal scenarios detection method, the receiver operating characteristic (ROC curve) was used as an evaluation metric, which is based on a series of different dichotomies, (cutoff values or decision thresholds), with the true-positive rate (TPR) representing the percentage of samples that are correctly judged as positive among all samples that are actually positive, and false-positive rate (FPR) representing the percentage of samples that are incorrectly judged as positive among all samples that are actually negative. The ROC curve represents the sensitivity of different thresholds to TPR and FPR, and the fuller the curve, the better the classification. TPR and FPR are calculated as follows:
where false negative is FN, false positive is FP, true negative is TN, and true positive is TP. As shown in Table 1, FN indicates a sample judged to be negative but is in fact positive, FP indicates a sample judged to be positive but is in fact negative, TN indicates a sample judged to be negative and is in fact negative, and TP indicates a sample judged to be positive and is in fact positive.
The effectiveness of the proposed method was evaluated from two perspectives—the pixel-level evaluation method and the frame-level evaluation method. Both methods use the area under the curve (AUC) as an evaluation metric, in addition to the ROC curve, which indicates the area enclosed by the ROC curve and the coordinate axes; the larger it is, the better the performance of the classifier.
- (1)
- Pixel level
The ROC curves at the pixel level were designed to provide the localization ability of the proposed method in space, for which the intersection-over-unio ratio was used as a predictor. Intersection-over-unio (IOU) ratio, a concept used in target detection, is the intersection ratio of the generated candidate frames to original marker frames, i.e., the ratio of their intersection to the merged set, and is calculated as shown in Equations (1)–(12). The intersection-to-merge ratio is ideally a complete overlap, i.e., a ratio of 1. If the intersection-to-merge ratio between the localized area and the true anomaly area is greater than a threshold, the localization result under that frame is defined as a positive sample, and if the intersection-to-merge ratio is less than the threshold, the localization result under that frame is defined as a negative sample.
- (2)
- Frame level
The ROC curves at the frame level were designed to provide the localization ability of the proposed method in time, for which the St value was used as a predictor.
4.3. Implementation Details
We adjusted all video clips to 224 × 224 and calculated the optical flow between each adjacent frame [36]. I3D-AE uses Adam [37] as the optimizer with a learning rate of 0.0001, a minimum batch size of 100, and an epoch setting of 200; our model was implemented on TensorFlow 1.14 and trained, with a 2080TiGPU. The model parameters are shown in Table 2.
5. Experimental Results
5.1. Visualization of Spatial Localization Results
Figure 4 shows the experimental results of the method proposed in this study on a construction site dataset. When workers perform welding, fire and smoke cause changes in the reconstruction errors, which are localized. When there is no smoke, the proposed method locates the flame more accurately, but when there is smoke, the smoke causes an increase in the reconstruction error and the size of the localized area is larger than the real area.
5.2. Temporal Localization Results
Figure 5 shows variations in St values in the construction site dataset and distinguishes normal and abnormal frames with background colors. It can be seen from the figure that, in the normal frame, the value of St is small, and the curve is flat, while in the abnormal frame, the value of St is more prominent, and the two cases can be clearly distinguished. In both scenarios, there is an elevated value of St in the normal frame, but in the abnormal frame, St does not appear flat, indicating that the method had a mild over-recognition in recognizing abnormal scenarios. As shown in Figure 6, a ROC of 0.901 on the frame-level ROC curve indicates that St can distinguish between normal and abnormal frames in time well.
5.3. Ablation Experiments
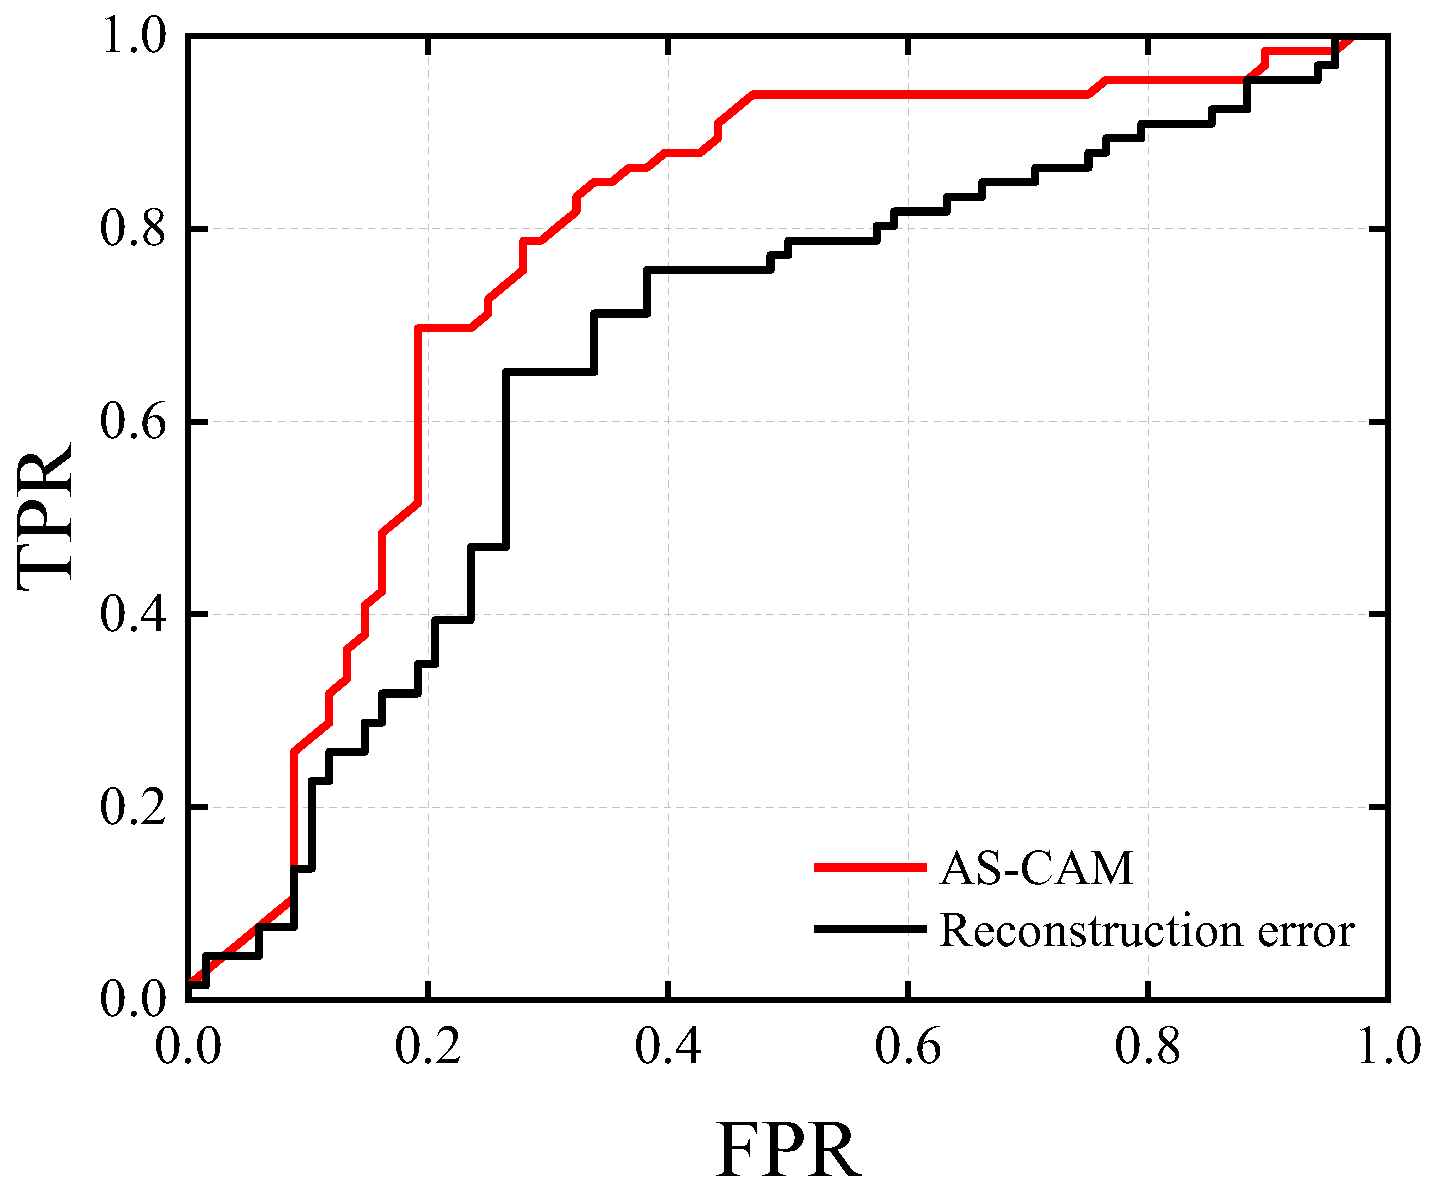
In this section, the effectiveness of each module of the proposed method is tested through a set of ablation experiments. The experiments are divided into two groups. In Experiment 1, the four I3D modules in the I3D-AE module were replaced with C3D models, i.e., the commonly used 3DCNN video feature extraction networks, and then the module was trained and tested with the replaced network and the construction site dataset. This experiment tested the feature extraction effectiveness of the proposed I3D-AE. In Experiment 2, AS-CAM was replaced with the reconstruction error-based localization method, i.e., the reconstruction error was used as the activation map to achieve the localization of anomalous areas, and then the replaced network and the construction site dataset were used for training and testing; this experiment tested the localization effect of the proposed AS-CAM. The ROC curves and AUC values were used to show the localization ability of the network used in the experiment.
As seen in Figure 7, the ROC curves of the proposed method are fuller than those of the C3D-based method, indicating that the proposed method outperformed the C3D-based method in locating anomalous areas. The reason for this is that the C3D-based method is weaker than I3D in video feature extraction, and I3D has the advantage of pretraining; therefore, it can capture more details in the video through multiple I3D modules in series, making it a stable and fast video feature extraction method.
From Figure 8, it can be seen that AS-CAM has a better localization effect based on the area surrounded by curves and axes, and the reconstruction error-based method has a larger gap than the proposed method. The reason is that, in video prediction, although a reconstruction error can represent an anomalous area, it is also affected by network depth—when the network layers are deep, the anomalous pixel area causes the error not necessarily in the mapped anomalous area; therefore, this type of method is more suitable for shallow encoder networks.
6. Discussion
- (a)
- In this study, automatic recognition for potential safety risks at construction sites was investigated. The principle is to use the unpredictability that risk scenes have; thus, a video prediction model was used, and when the prediction model demonstrated anomalies, the scene was considered to have the possibility of risk.
- (b)
- Compared with the traditional human safety risk recognition method, the proposed method is an intelligent recognition technique. Compared with the existing techniques based on intelligent algorithms, the proposed method omits the database construction of risk scenes and is a lightweight method.
- (c)
- The proposed method provides a new way of thinking in terms of risk scenario detection. It is not necessary to detect only specific security risks; undirected detection can still be effective for risk recognition.
7. Conclusions
Construction safety has always been an important problem in the construction industry, and currently, it mainly relies on manual inspection to detect the risk of construction sites. In this paper, deep learning methods were applied to the process of construction risk detection, providing a new perspective for intelligent monitoring of construction sites as follows:
- A new abnormal scenarios detection method for construction sites was proposed, which contains a video prediction model, I3D-AE, a spatial information module, AS-CAM, and a temporal information parameter, St;
- By locating abnormal areas by replacing the reconstruction error with a weighted saliency map, this method can achieve a good localization effect when faced with a complex image;
- Our method was validated with a dataset, and the results show that our method can reach an advanced level at construction sites;
- The proposed approach allows for the recognition of multiple unknown risks, rather than specific risk scenarios, avoids building a database, and saves computing resources.
Author Contributions
Conceptualization, Z.L. and D.L.; methodology, Z.L.; software, Z.L.; validation, Z.L., B.S. and D.L.; formal analysis, B.S.; investigation, D.L.; resources, D.L.; data curation, B.S.; writing—original draft preparation, Z.L.; writing—review and editing, Z.L.; visualization, B.S.; supervision, D.L.; project administration, D.L.; funding acquisition, D.L. All authors have read and agreed to the published version of the manuscript.
Funding
The authors are grateful for the financial support from the National Natural Science Foundation of China (NSFC), under Grant Nos. 51778104, and the Fundamental Research Funds for the Central Universities (Project No. DUT19LAB26).
Conflicts of Interest
The authors declare no conflict of interest.
References
- Zhang, M.; Zhu, M.; Zhao, X. Recognition of High-Risk Scenarios in Building Construction Based on Image Semantics. J. Comput. Civ. Eng. 2020, 34, 04020019. [Google Scholar] [CrossRef]
- Leung, S.-W.; Mak, S.; Lee, B.L. Using a real-time integrated communication system to monitor the progress and quality of construction works. Autom. Constr. 2008, 17, 749–757. [Google Scholar] [CrossRef]
- Park, J.W.; Kim, K.; Cho, Y.K. Framework of Automated Construction-Safety Monitoring Using Cloud-Enabled BIM and BLE Mobile Tracking Sensors. J. Constr. Eng. Manag. 2017, 143, 05016019. [Google Scholar] [CrossRef]
- Kim, S.S. Opportunities for construction site monitoring by adopting first personal view (FPV) of a drone. Smart Struct. Syst. 2018, 21, 139–149. [Google Scholar]
- Shin, J.M.; Kim, S.Y.; Kim, G.H.; Jung, M.G.; Shin, D.W. Ubiquitous Sensor Network for Construction Site Monitoring. Adv. Mater. Res. 2014, 919–921, 388–391. [Google Scholar] [CrossRef]
- Luo, X.; Li, H.; Yu, Y.; Zhou, C.; Cao, D. Combining deep features and activity context to improve recognition of activities of workers in groups. Comput. Civ. Infrastruct. Eng. 2020, 35, 965–978. [Google Scholar] [CrossRef]
- Luo, X.; Li, H.; Yang, X.; Yu, Y.; Cao, D. Capturing and understanding workers’ activities in far-field surveillance videos with deep action recognition and bayesian nonparametric learning. Comput. Civ. Infrastruct. Eng. 2018, 34, 333–351. [Google Scholar] [CrossRef]
- Luo, X.; Li, H.; Cao, D.; Yu, Y.; Yang, X.; Huang, T. Towards efficient and objective work sampling: Recognizing workers’ activities in site surveillance videos with two-stream convolutional networks. Autom. Constr. 2018, 94, 360–370. [Google Scholar] [CrossRef]
- Yang, J.; Shi, Z.; Wu, Z. Vision-Based Action Recognition of Construction Workers Using Dense Trajectories; Elsevier Science Publishers B. V.: Amsterdam, The Netherlands, 2016. [Google Scholar]
- Yang, J.; Park, M.-W.; Vela, P.A.; Golparvar-Fard, M. Construction performance monitoring via still images, time-lapse photos, and video streams: Now, tomorrow, and the future. Adv. Eng. Inform. 2015, 29, 211–224. [Google Scholar] [CrossRef]
- Kaskutas, V.; Dale, A.M.; Nolan, J.; Patterson, D.; Lipscomb, H.J.; Evanoff, B.A. Fall hazard control observed on residential construction sites. Am. J. Ind. Med. 2009, 52, 491–499. [Google Scholar] [CrossRef] [Green Version]
- Missliwetz, J. Fatal Impalement Injuries after Falls at Construction Sites. Am. J. Forensic Med. Pathol. 1995, 16, 81–83. [Google Scholar] [CrossRef] [PubMed]
- Kaskutas, V.K.; Dale, A.M.; Lipscomb, H.J.; Evanoff, B.A. Development of the St. Louis audit of fall risks at residential construction sites. Int. J. Occup. Environ. Health 2008, 14, 243–249. [Google Scholar] [CrossRef] [PubMed]
- Wang, J.; Pradhananga, N.; Teizer, J. Automatic Fall Risk Identification Using Point Cloud Data in Construction Excavation. Int. Conf. Comput. Civ. Build. Eng. 2014, 2014, 981–988. [Google Scholar] [CrossRef] [Green Version]
- Liu, H.; Wang, Y.; Sun, S.; Sun, B. Study on Safety Assessment of Fire Hazard for the Construction Site. In International Symposium on Safety Science and Engineering; ISSSE: Beijing, China, 2012; Volume 43, pp. 369–373. [Google Scholar]
- Tao, K.I. Destech Publicat. The Analysis of Fire Case for Construction Sites and Its Safety Measures. In Proceedings of the International Conference on Social Science, Management and Economics (SSME 2015), Guangzhou, China, 9–10 May 2015. [Google Scholar]
- Tsai, M.-K. Improving efficiency in emergency response for construction site fires: An exploratory case study. J. Civ. Eng. Manag. 2015, 22, 322–332. [Google Scholar] [CrossRef] [Green Version]
- Li, M.; Yu, H.; Liu, P. An automated safety risk recognition mechanism for underground construction at the pre-construction stage based on BIM. Autom. Constr. 2018, 91, 284–292. [Google Scholar] [CrossRef]
- Perlman, A.; Sacks, R.; Barak, R. Hazard recognition and risk perception in construction. Saf. Sci. 2014, 64, 22–31. [Google Scholar] [CrossRef]
- Carreira, J.; Zisserman, A. Quo Vadis, Action Recognition? A New Model and the Kinetics Dataset. In Proceedings of the 2017 IEEE Conference on Computer Vision and Pattern Recognition (CVPR), Honolulu, HI, USA, 21–26 July 2017; pp. 4724–4733. [Google Scholar]
- Cho, S.; Kwon, J. Abnormal event detection by variation matching. Mach. Vis. Appl. 2021, 32, 80. [Google Scholar] [CrossRef]
- Wei, H.; Xiao, Y.; Li, R.; Liu, X. IEEE Crowd abnormal detection using two-stream Fully Convolutional Neural Networks. In Proceedings of the 10th International Conference on Measuring Technology and Mechatronics Automation (ICMTMA), Changsha, China, 10–11 February 2018; pp. 332–336. [Google Scholar]
- Zhang, J.; Wu, C.; Wang, Y.; Wang, P. Detection of abnormal behavior in narrow scene with perspective distortion. Mach. Vis. Appl. 2018, 30, 987–998. [Google Scholar] [CrossRef]
- Mehmood, A. Abnormal Behavior Detection in Uncrowded Videos with Two-Stream 3D Convolutional Neural Networks. Appl. Sci. 2021, 11, 3523. [Google Scholar] [CrossRef]
- He, C.; Shao, J.; Sun, J. An anomaly-introduced learning method for abnormal event detection. Multimed. Tools Appl. 2017, 77, 29573–29588. [Google Scholar] [CrossRef]
- Sabokrou, M.; Fathy, M.; Hoseini, M. Video anomaly detection and localisation based on the sparsity and reconstruction error of auto-encoder. Electron. Lett. 2016, 52, 1122–1124. [Google Scholar] [CrossRef]
- Ravanbakhsh, M.; Nabi, M.; Mousavi, H.; Sangineto, E.; Sebe, N. Plug-and-play cnn for crowd motion analysis: An application in abnormal event detection. In Proceedings of the 2018 IEEE Winter Conference on Applications of Computer Vision (WACV), Lake Tahoe, NV, USA, 12–15 March 2018; pp. 1689–1698. [Google Scholar]
- Duan, P.; Zhou, J.; Tao, S. Risk events recognition using smartphone and machine learning in construction workers’ material handling tasks. Eng. Constr. Arch. Manag. 2022. [Google Scholar] [CrossRef]
- Park, J.; Lee, H.; Kim, H.Y. Risk Factor Recognition for Automatic Safety Management in Construction Sites Using Fast Deep Convolutional Neural Networks. Appl. Sci. 2022, 12, 694. [Google Scholar] [CrossRef]
- Kim, I.; Lee, Y.; Choi, J. BIM-based hazard recognition and evaluation methodology for automating construction site risk assessment. Appl. Sci. 2020, 10, 2335. [Google Scholar] [CrossRef] [Green Version]
- Su, Y.; Mao, C.; Jiang, R.; Liu, G.; Wang, J. Data-Driven Fire Safety Management at Building Construction Sites: Leveraging CNN. J. Manag. Eng. 2021, 37, 04020108. [Google Scholar] [CrossRef]
- Xiong, R.; Song, Y.; Li, H.; Wang, Y. Onsite video mining for construction hazards identification with visual relationships. Adv. Eng. Inform. 2019, 42, 100966. [Google Scholar] [CrossRef]
- Chattopadhay, A.; Sarkar, A.; Howlader, P.; Balasubramanian, V.N. Grad-cam++: Generalized gradient-based visual explanations for deep convolutional networks. In Proceedings of the 2018 IEEE Winter Conference on Applications of Computer Vision (WACV), Lake Tahoe, NV, USA, 12–15 March 2018; pp. 839–847. [Google Scholar]
- Zhou, B.; Khosla, A.; Lapedriza, A.; Oliva, A.; Torralba, A. Learning deep features for discriminative localization. In Proceedings of the IEEE Conference on Computer Vision and Pattern Recognition, Las Vegas, NV, USA, 27–30 June 2016; pp. 2921–2929. [Google Scholar]
- Selvaraju, R.R.; Cogswell, M.; Das, A.; Vedantam, R.; Parikh, D.; Batra, D. Grad-CAM: Visual Explanations from Deep Networks via Gradient-Based Localization. In Proceedings of the 2017 IEEE International Conference on Computer Vision (ICCV), Venice, Italy, 22–29 October 2017; pp. 618–626. [Google Scholar] [CrossRef] [Green Version]
- Brox, T.; Bruhn, A.; Papenberg, N.; Weickert, J. High Accuracy Optical Flow Estimation Based on a Theory for Warping, European Conference on Computer Vision; Springer: Berlin/Heidelberg, Germany, 2004; pp. 25–36. [Google Scholar]
- Jia, Y.; Shelhamer, E.; Donahue, J.; Karayev, S.; Long, J.; Girshick, R.; Guadarrama, S.; Darrell, T. Caffe: Convolutional architecture for fast feature embedding. In Proceedings of the 22nd ACM international conference on Multimedia, Orlando, FL, USA, 3–7 November 2014; pp. 675–678. [Google Scholar]
Figure 1.
Key elements of proposed method.
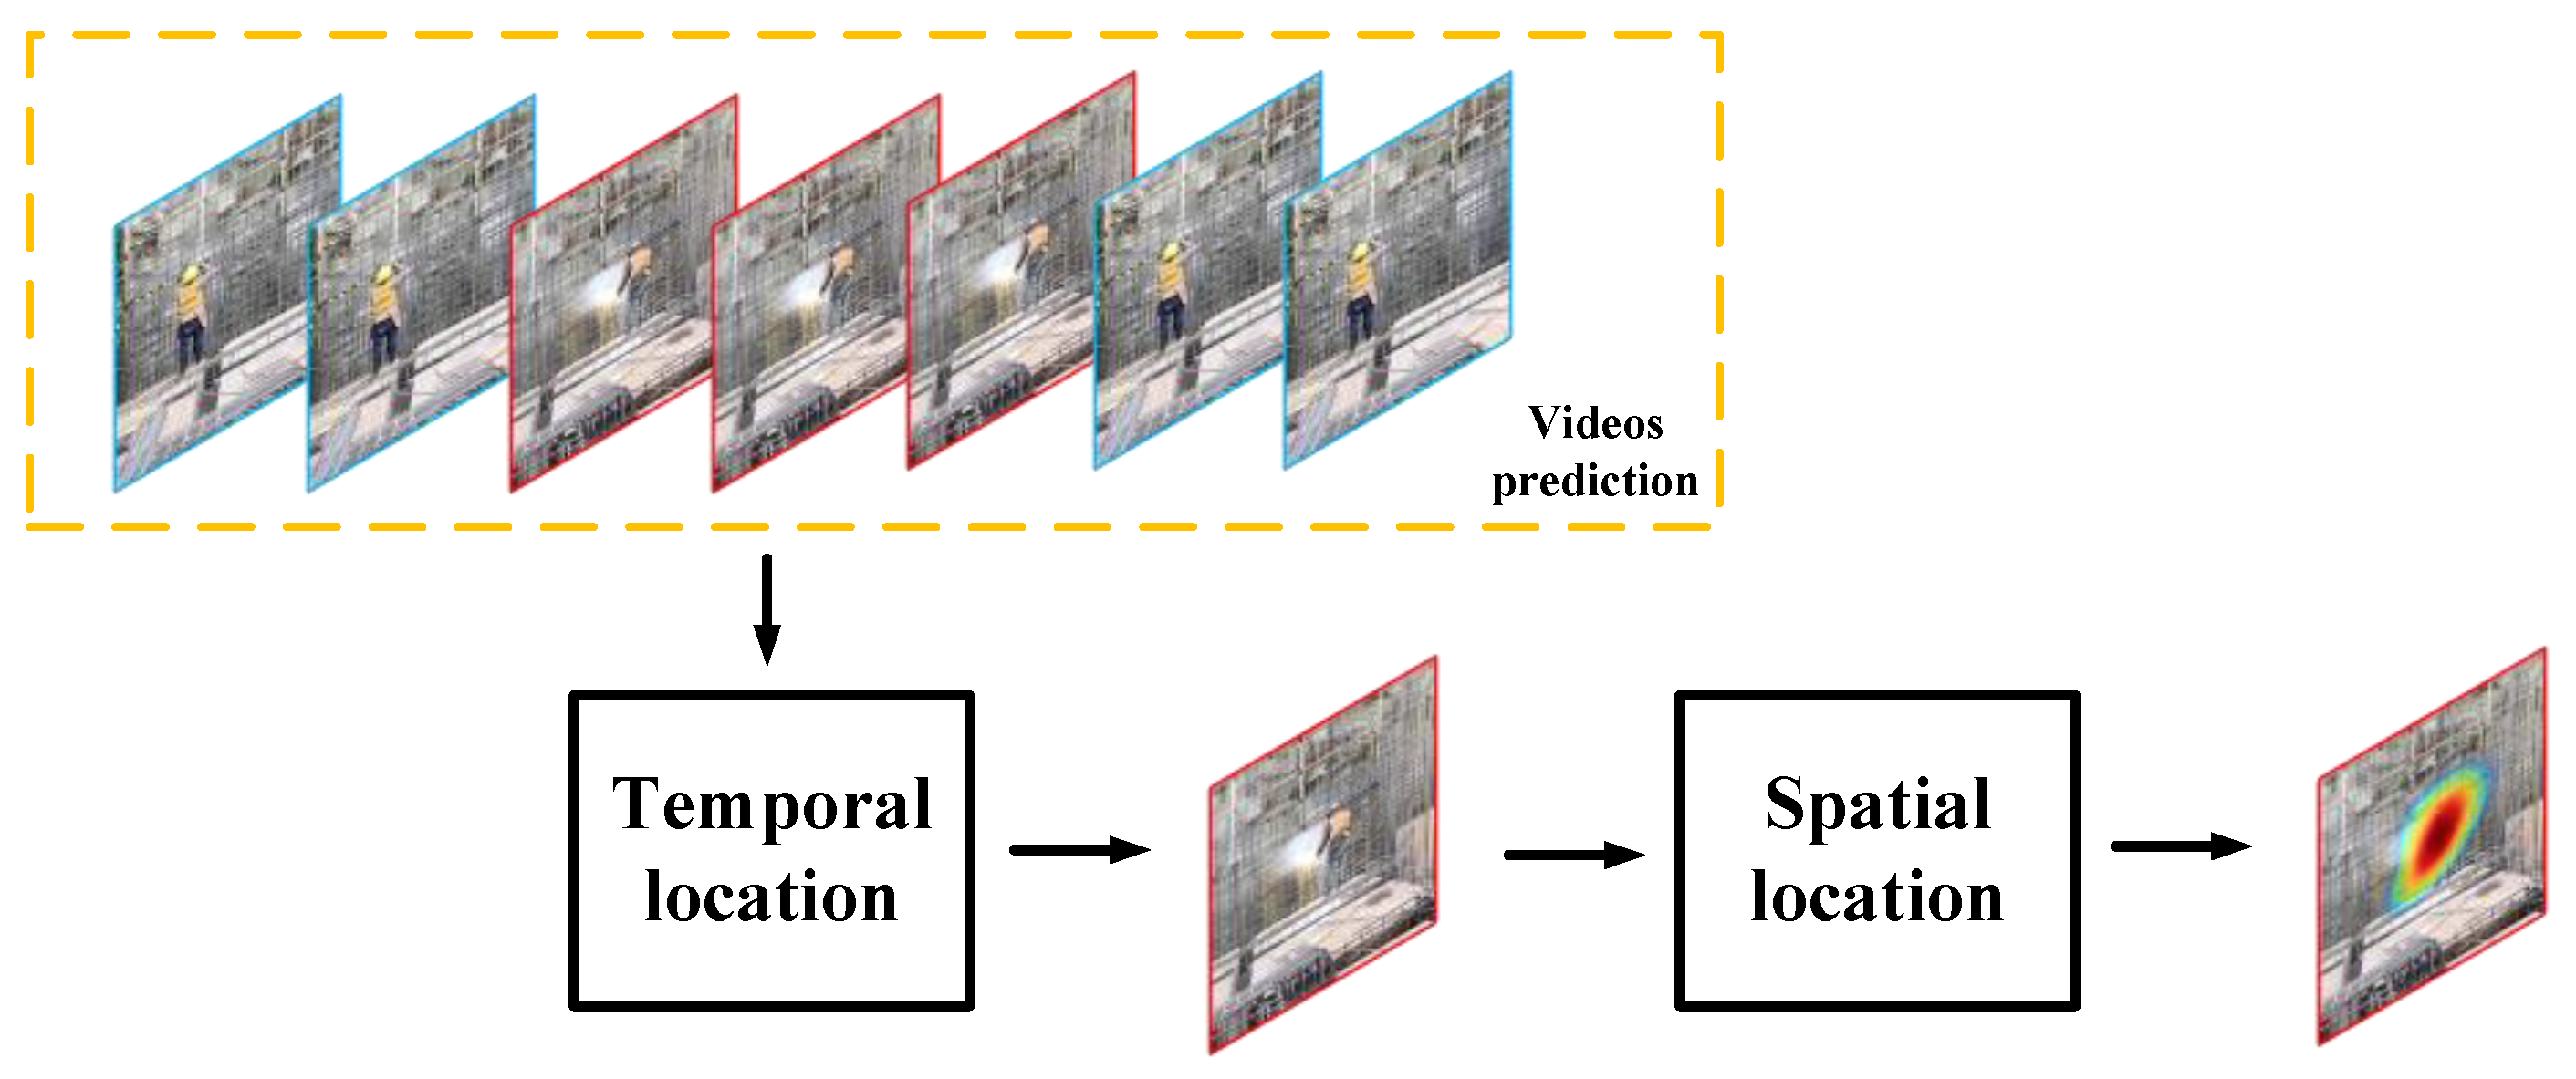
Figure 2.
Structure chart of our I3D-AE.
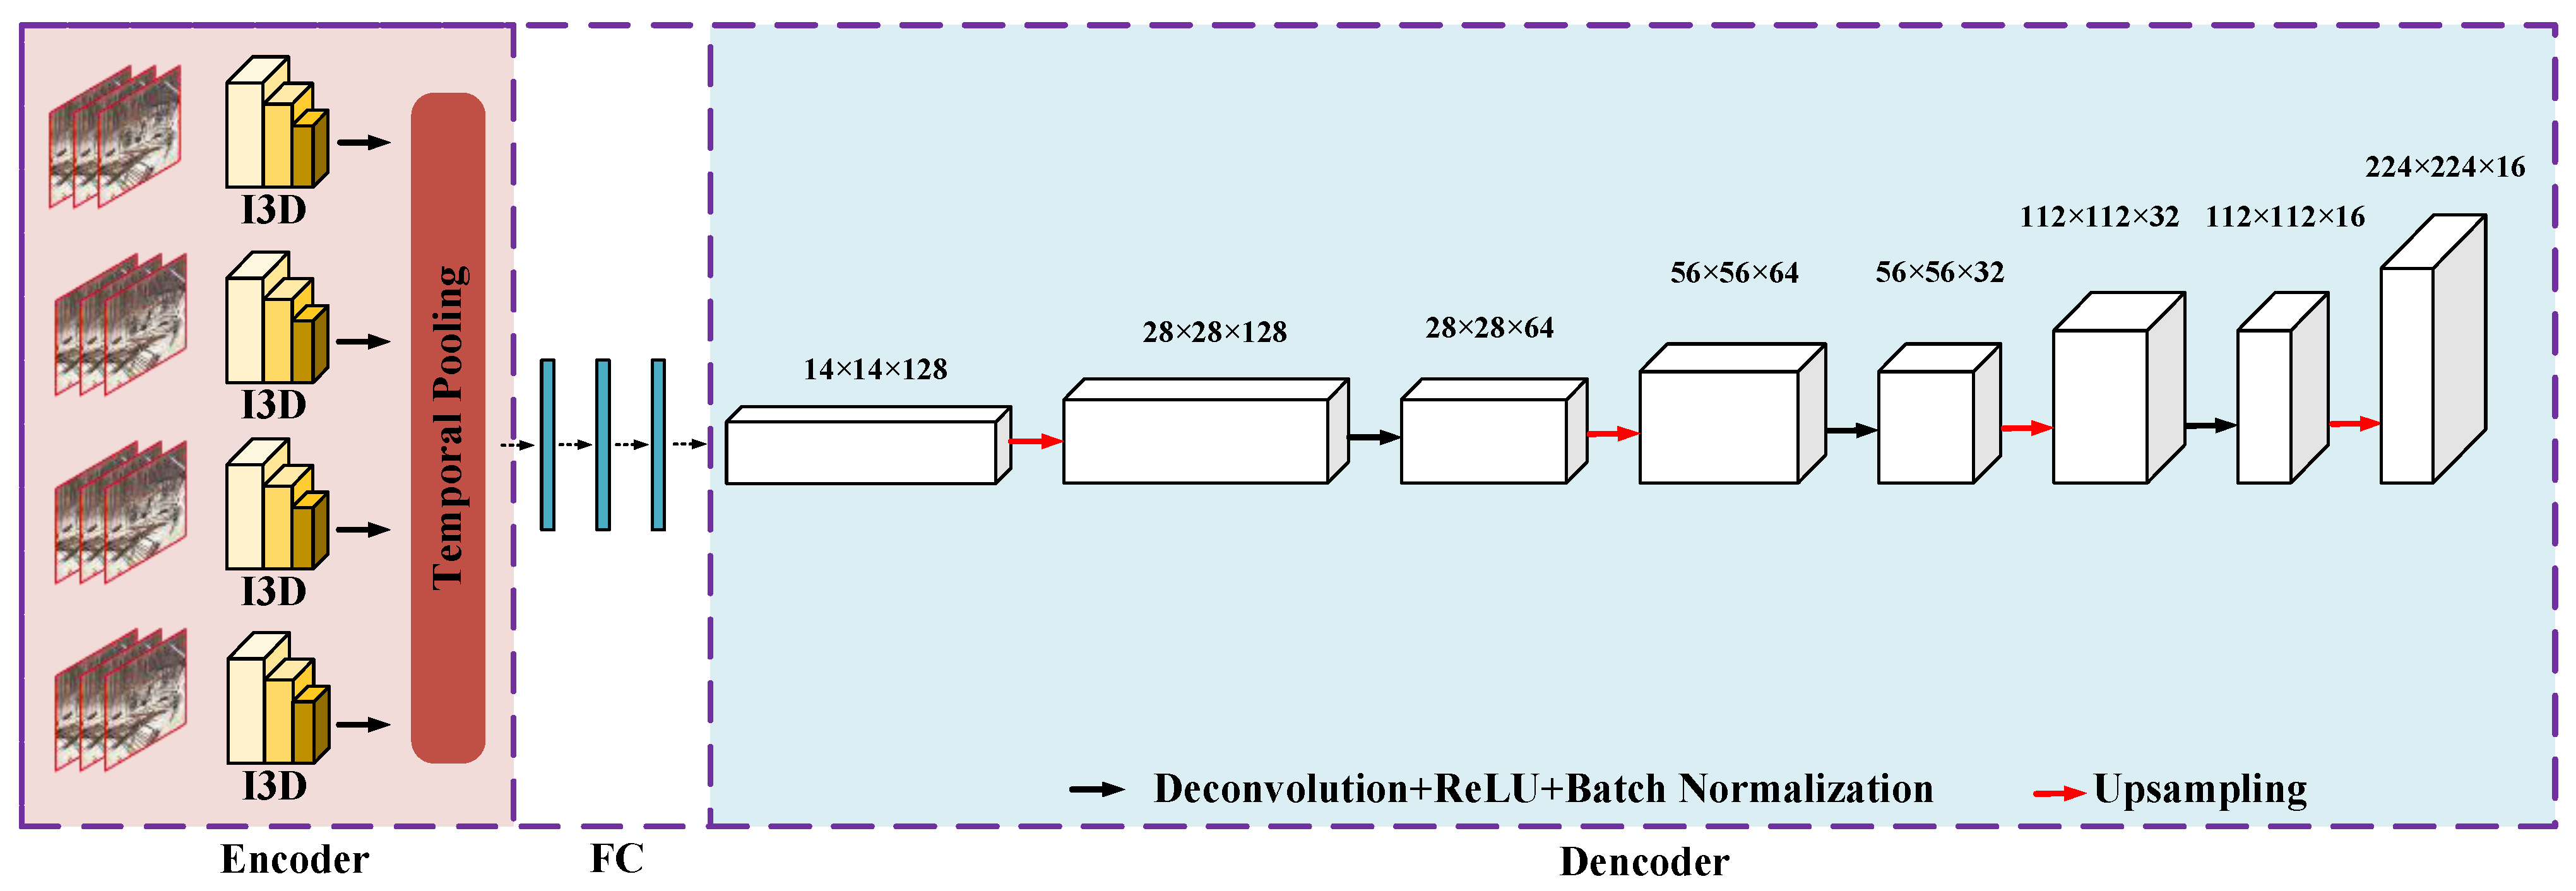
Figure 3.
Flowchart of AS-CAM.

Figure 4.
Experimental results of the construction site dataset.

Figure 5.
The St curves of a clip in the construction site dataset.
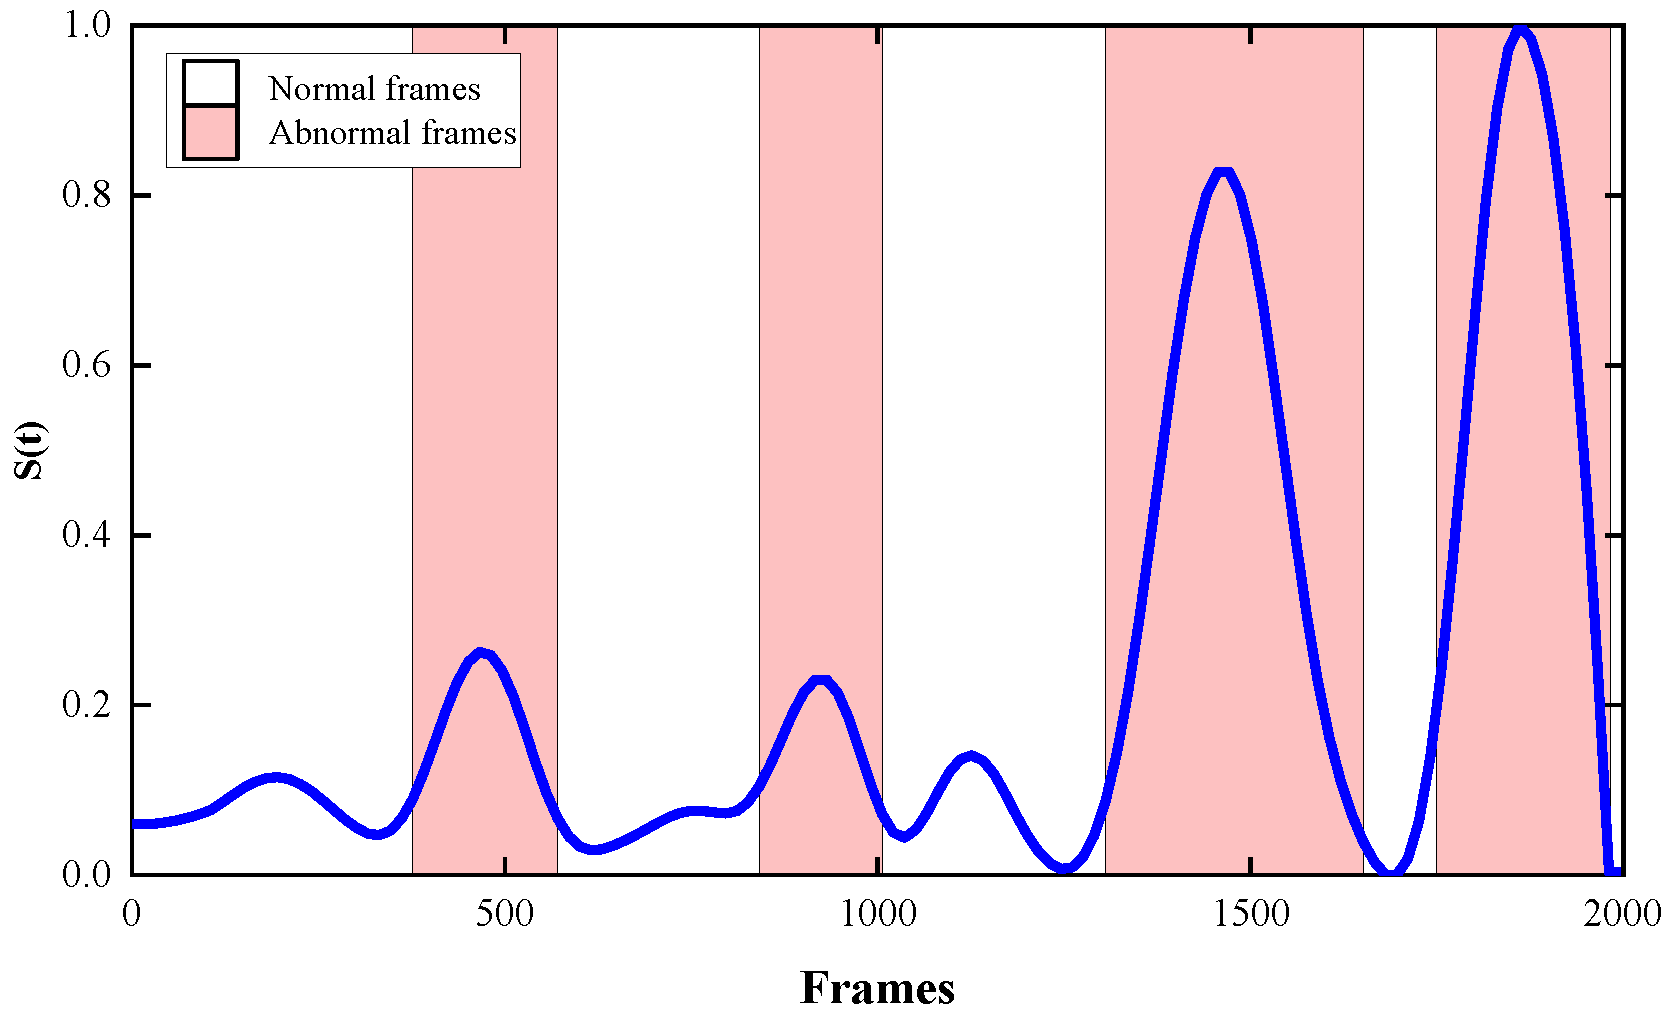
Figure 6.
ROC curve at frame level.
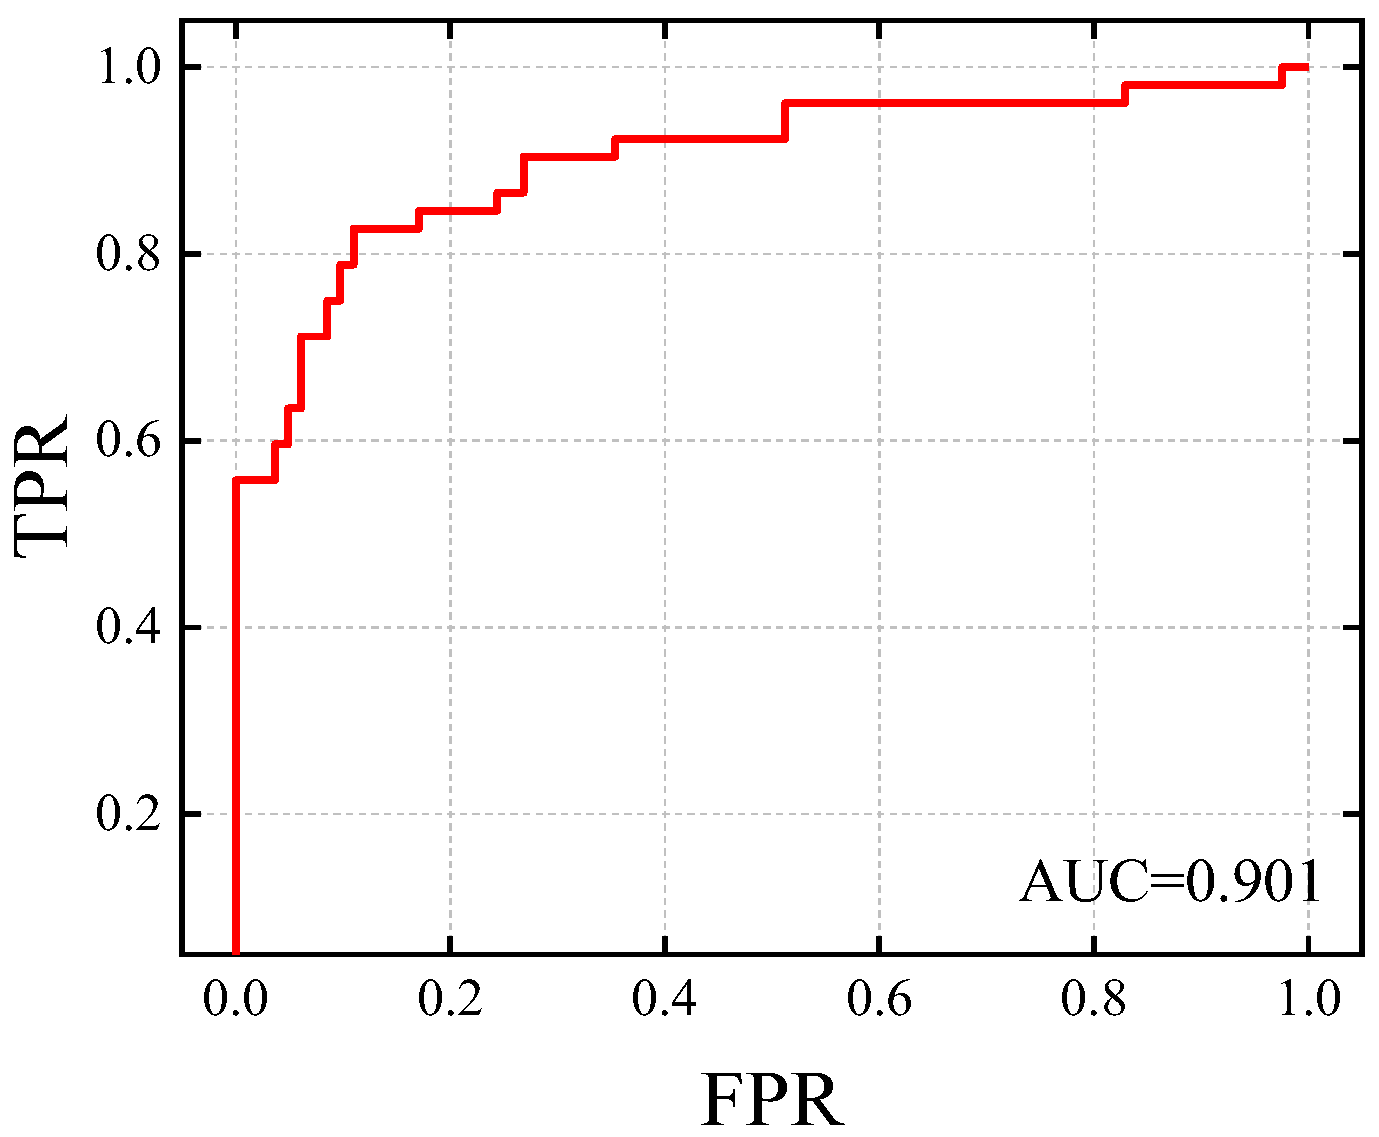
Figure 7.
Pixel-level ROC curves with video feature extraction method changes.
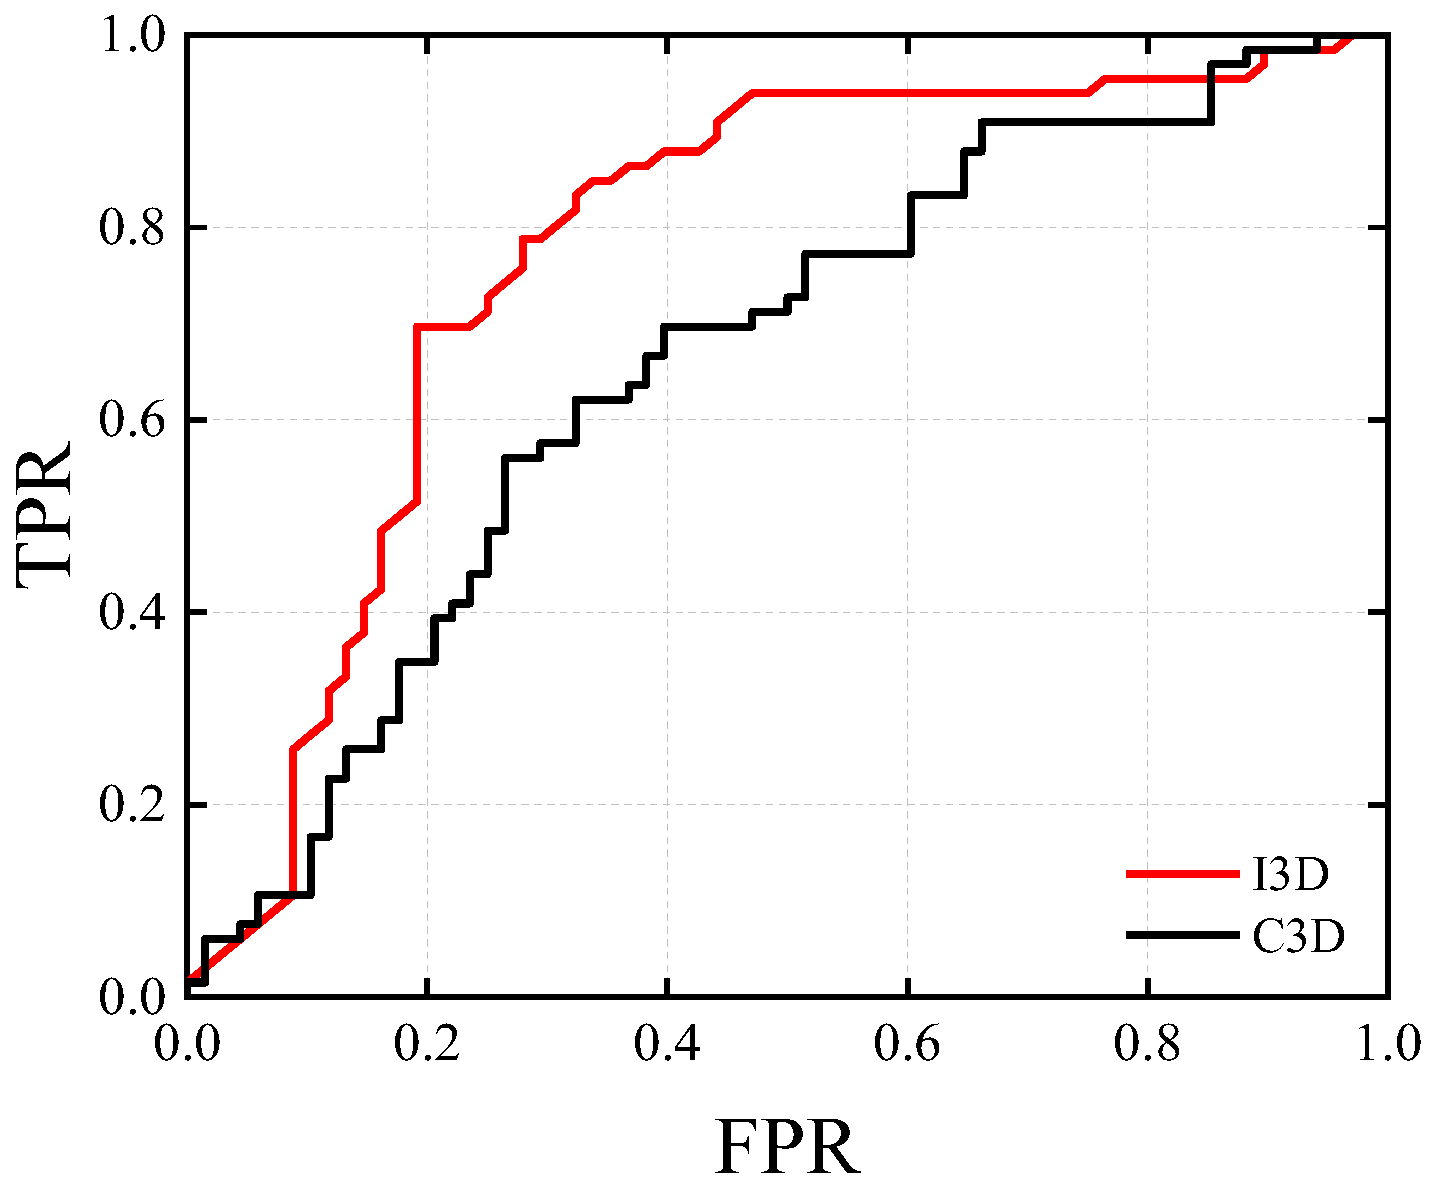
Figure 8.
Pixel-level ROC curves with changes in localization method.

Table 1.
Meaning of TP, TN, FP, and FN.
| Actual Positive Samples | Actual Negative Samples | |
|---|---|---|
| Predicted to be positive samples | TP | FN |
| Predicted to be negative samples | FP | TN |
Table 2.
I3D-AE; the main parameters of the model.
| Layer | Output Size | Kernel Size | Stride | Pad |
|---|---|---|---|---|
| FC | 14 × 14 × 128 | |||
| Upsampling 1 | 28 × 28 × 128 | |||
| DeConv 1 | 28 × 28 × 64 | 3 × 3 × 3 | 2 | 1 |
| Upsampling 2 | 56 × 56 × 64 | |||
| DeConv 2 | 56 × 56 × 32 | 3 × 3 × 3 | 2 | 1 |
| Upsampling 3 | 112 × 112 × 32 | |||
| DeConv 3 | 112 × 112 × 16 | 3 × 3 × 3 | 2 | 1 |
| Upsampling 4 | 224 × 224 × 16 |
Publisher’s Note: MDPI stays neutral with regard to jurisdictional claims in published maps and institutional affiliations. |
© 2022 by the authors. Licensee MDPI, Basel, Switzerland. This article is an open access article distributed under the terms and conditions of the Creative Commons Attribution (CC BY) license (https://creativecommons.org/licenses/by/4.0/).
Share and Cite
MDPI and ACS Style
Li, Z.; Song, B.; Li, D. Safety Risk Recognition Method Based on Abnormal Scenarios. Buildings 2022, 12, 562. https://doi.org/10.3390/buildings12050562
AMA Style
Li Z, Song B, Li D. Safety Risk Recognition Method Based on Abnormal Scenarios. Buildings. 2022; 12(5):562. https://doi.org/10.3390/buildings12050562
Chicago/Turabian StyleLi, Ziqi, Bo Song, and Dongsheng Li. 2022. "Safety Risk Recognition Method Based on Abnormal Scenarios" Buildings 12, no. 5: 562. https://doi.org/10.3390/buildings12050562
Note that from the first issue of 2016, this journal uses article numbers instead of page numbers. See further details here.