Article

Enhancing Indoor Environmental Quality and Sustainability in Post-Pandemic Office Settings: A Study on Displacement Ventilation Feasibility

by
Jingchun Shen
1,*,
Yang Chen
2 and
Karthik Hejamadi Rajagopal
1
1
Department of Energy, Forest, and Built Environment, Högskolan Dalarna, 781 70 Borlänge, Sweden
2
Energy Management East, ÅF-Infrastructure AB, 169 99 Stockholm, Sweden
*
Author to whom correspondence should be addressed.
Buildings 2023, 13(12), 3110; https://doi.org/10.3390/buildings13123110
Submission received: 17 November 2023 / Revised: 4 December 2023 / Accepted: 7 December 2023 / Published: 14 December 2023

Abstract

:
The COVID-19 pandemic has catalyzed global efforts toward transitioning to a sustainable society, driving rapid innovation in building technologies, working practices, building design, and whole life cycle environmental impact consideration. In this pursuit, this study explores the enduring impact of these on an alternative ventilation approach for both existing building renovations and new building implementations. Comparing displacement ventilation to mixed-mode ventilation in a Finnish office building with varying occupancy densities, this study examines indoor air quality (IAQ), thermal comfort, total building energy performance, and embodied carbon. The findings reveal that the basic case of mixed ventilation has a specified system primary energy value of 38.83 kWh/m2 (with 28 occupants) and 39.00 kWh/m2 (with 24 occupants), respectively. With the displacement ventilation alternative, it reduces this by 0.3% and 0.1%, enhancing thermal comfort and decreasing turbulence as well as having a marginal decrease in embodied carbon. In general, the study offers three-fold contributions: insights into post-pandemic office mechanical ventilation design with an emphasis on sustainability and ecological footprint considerations, a concrete case study addressing climate action and human-centric IAQ design, and a multifaceted analysis using the Environmental, Social, and Governance (ESG) paradigm, contributing to the groundwork for associated future research and policy progress.

1. Introduction

The response to the pandemic has influenced various aspects of our lives, including the way we live and work. This influence has a gradual effect on office environment development, where the implementation of office layout design and hygiene measures have become crucial during either building renovation or new building design. However, alongside these measures, there is a growing recognition of the significance of indoor air quality (IAQ) in combating the transmission of viruses and enhancing overall well-being [1,2,3,4,5]. Furthermore, it has the possibilities of negative impacts on staff in a working environment, due to it adversely affecting cognitive function and productivity, leading to decreased performance and increased absenteeism among occupants [6,7,8].
To ensure good IAQ in office buildings, correct mechanical ventilation system design is more important after the lesson we learnt from the pandemic. In comparison to various types of conventional mechanical ventilation systems, it is critical to consider the most effective mode of ventilation for reducing the transmission of infections in the context of a healthy working environment. In response to the ongoing pandemic, the American Society of Heating, Refrigerating, and Air-Conditioning Engineers (ASHRAE) recently proposed a new standard, 241P [9], which focuses on the control of infectious aerosols in indoor environments.
Another practical concern from engineering practices is how to maintain the goal of minimal carbon footprint and economic cost. Understanding lifetime impacts from life cycle assessment (LCA) is critical to achieving carbon neutrality. Even though it has gotten popular in construction material selection, LCA is at its starting phase in the field of heating ventilation and air conditioning (HVAC). On the contrary, it has paramount importance in reducing the carbon emission in the supply-and-installation phase and is also influential in the building’s operation and end-of-life phases [10,11,12].
Bringing these two main focuses, the use of the displacement ventilation (DV) technique is proposed as an effective alternative by flushing away the concentration of infectious aerosols in the breathing zone of occupants. The consideration behind it is to utilize the mechanical ventilation technique, which involves replacing the warmer, polluted air at the floor level with cooler, cleaner air supplied at a low velocity from the ceiling level. This can lead to a ventilation system that is more effective and efficient, improving IAQ and lowering the risk of illness. Along with the potential improvements to IAQ, it may also provide opportunities for sustainability through reduced energy use and embodied carbon.
The purpose of this work is to undertake a feasibility study for an office space ventilation system, paying close attention to the type of air distribution whether it can improve a healthier working environment. The emphasis includes essential variables like thermal comfort indicators, heating/cooling loads, operational energy consumptions, and embodied carbon values, as opposed to how well it performs with the conventional mixing-mode ventilation during the supply-and-installation and operation phases. The main objectives of this study include the following:
(1)
Provide schematic carbon design options with two occupancy densities and two mechanical ventilation approaches’ comparison in a landscape office setting.
(2)
Evaluate the overall effectiveness of the two mechanical ventilation approaches regarding energy consumption, and indoor environment performance using the IDA ICE Climate stratification model, and embodied carbon calculation using regional generic data using the One-click LCA tool.
(3)
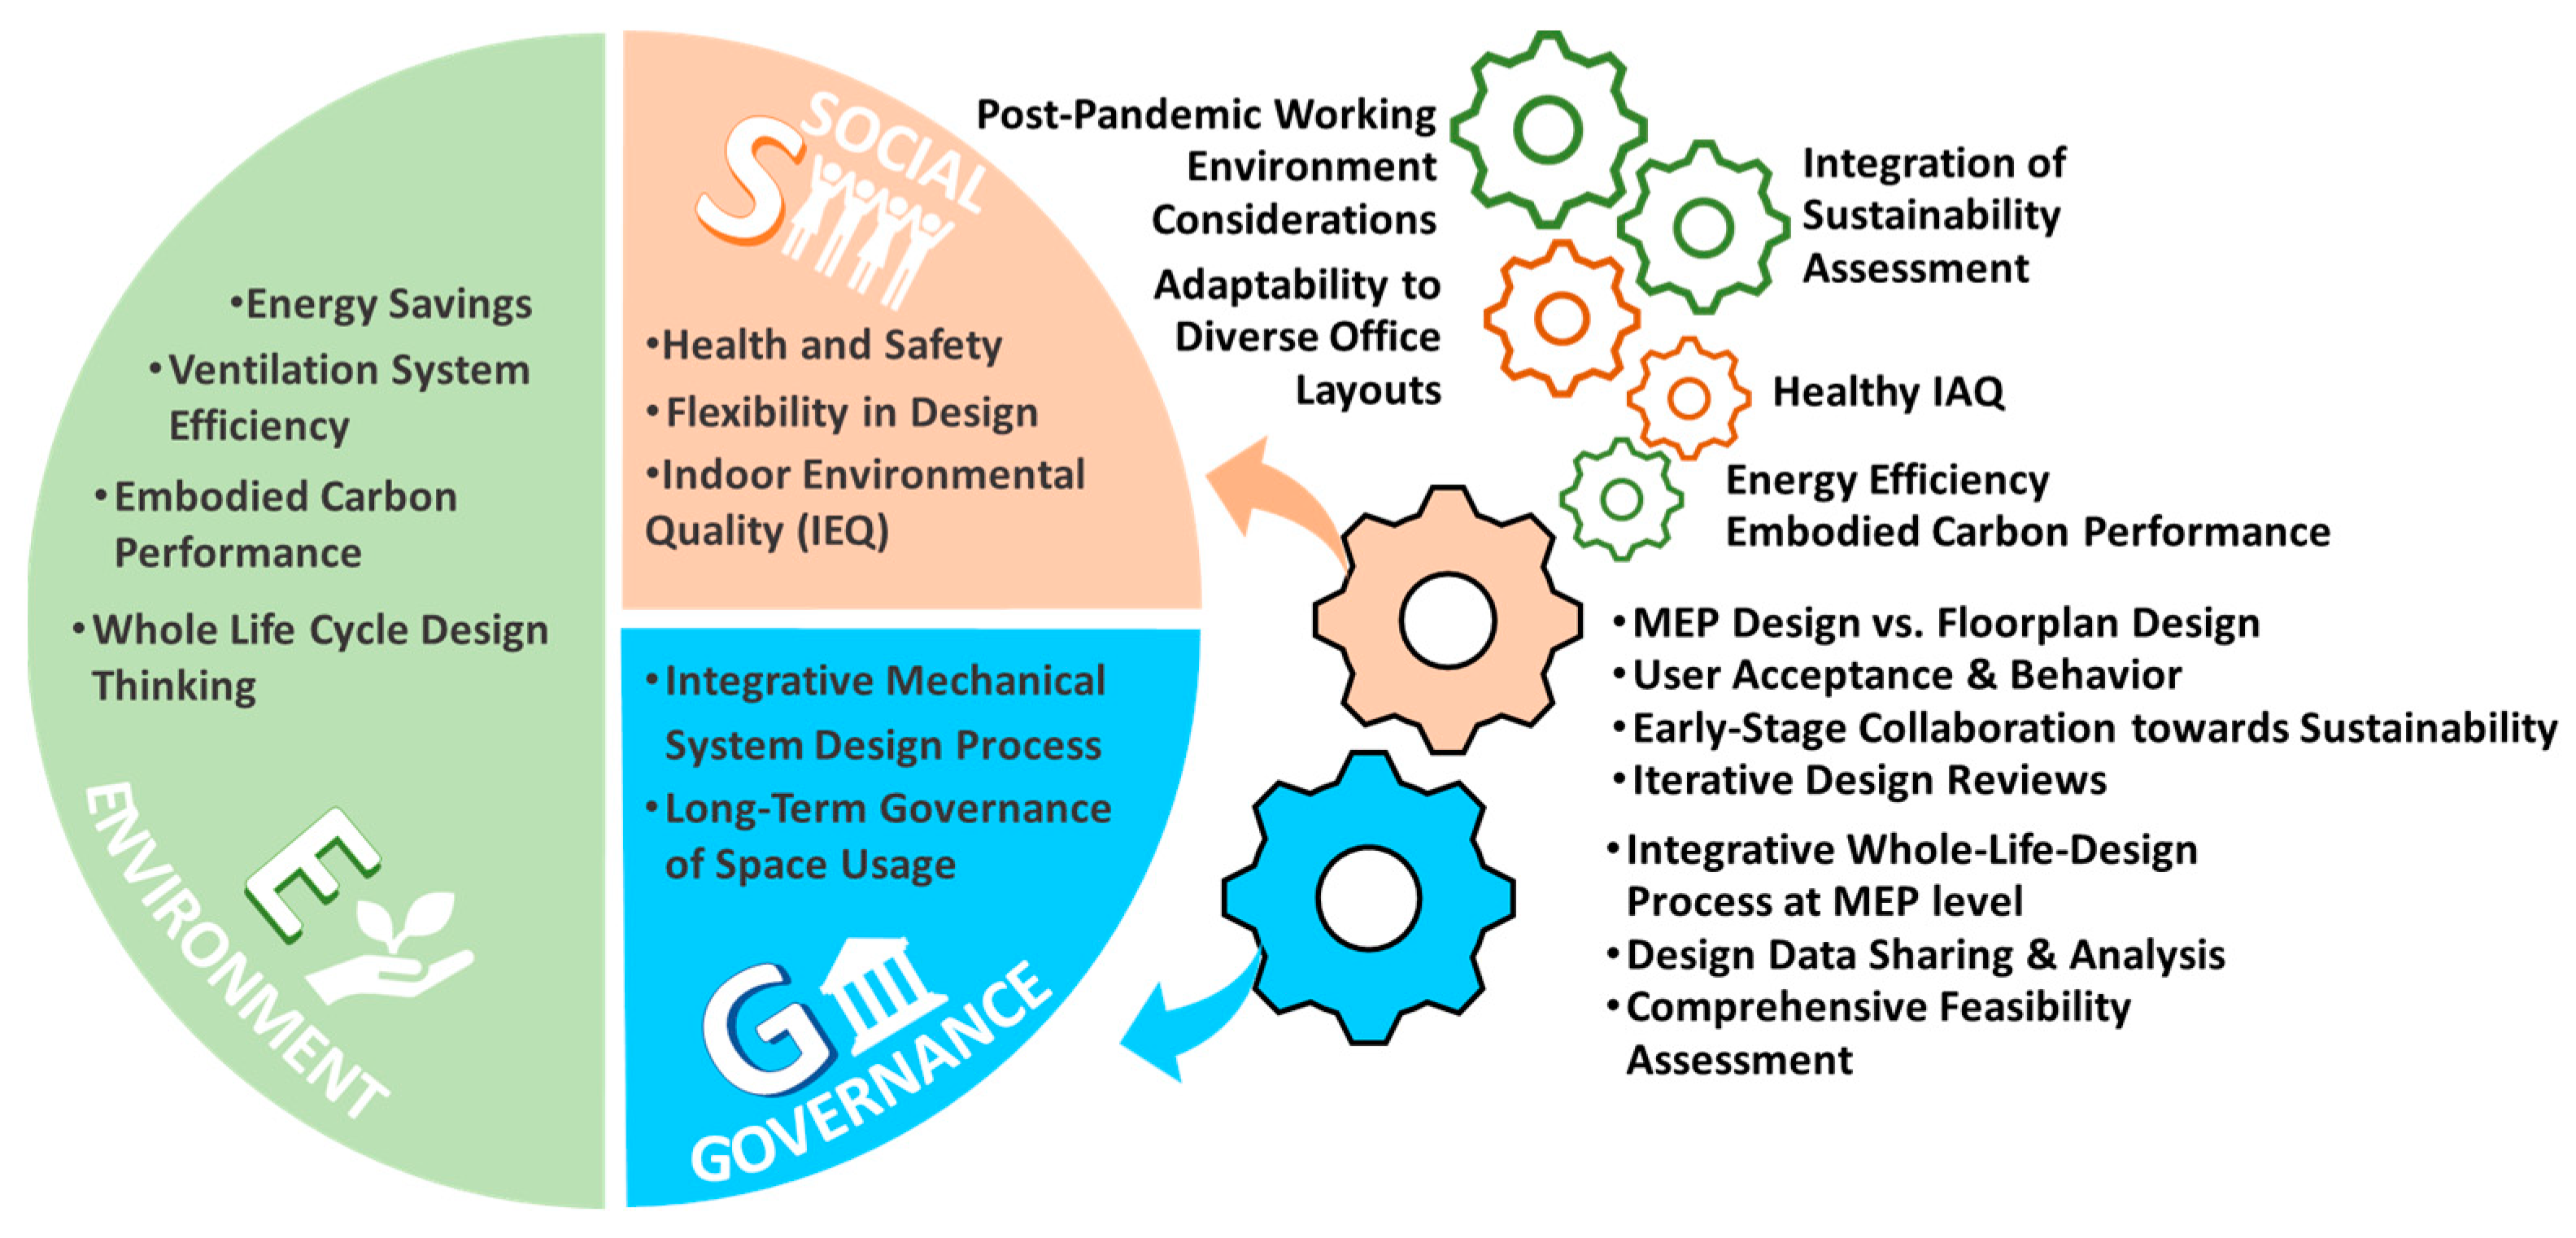
From a mechanical system design point of view, it discusses the collaboration opportunity among researchers, mechanical engineers, and architects in addressing whole-life carbon (WLC).
This article aims to introduce novel dimensions to the topic on IAQ and sustainability in post-pandemic office settings with two novelties. Firstly, an exploration of the impact of varying working densities on the effectiveness of ventilation strategies, and secondly, a comprehensive comparative analysis on two studied ventilation strategies. The findings are expected to contribute valuable perspectives that extend beyond immediate feasibility concerns, encouraging critical thinking on complex dynamics impacting the environmentally friendly design of ventilation systems in modern office buildings toward the 2030 carbon neutral goals.

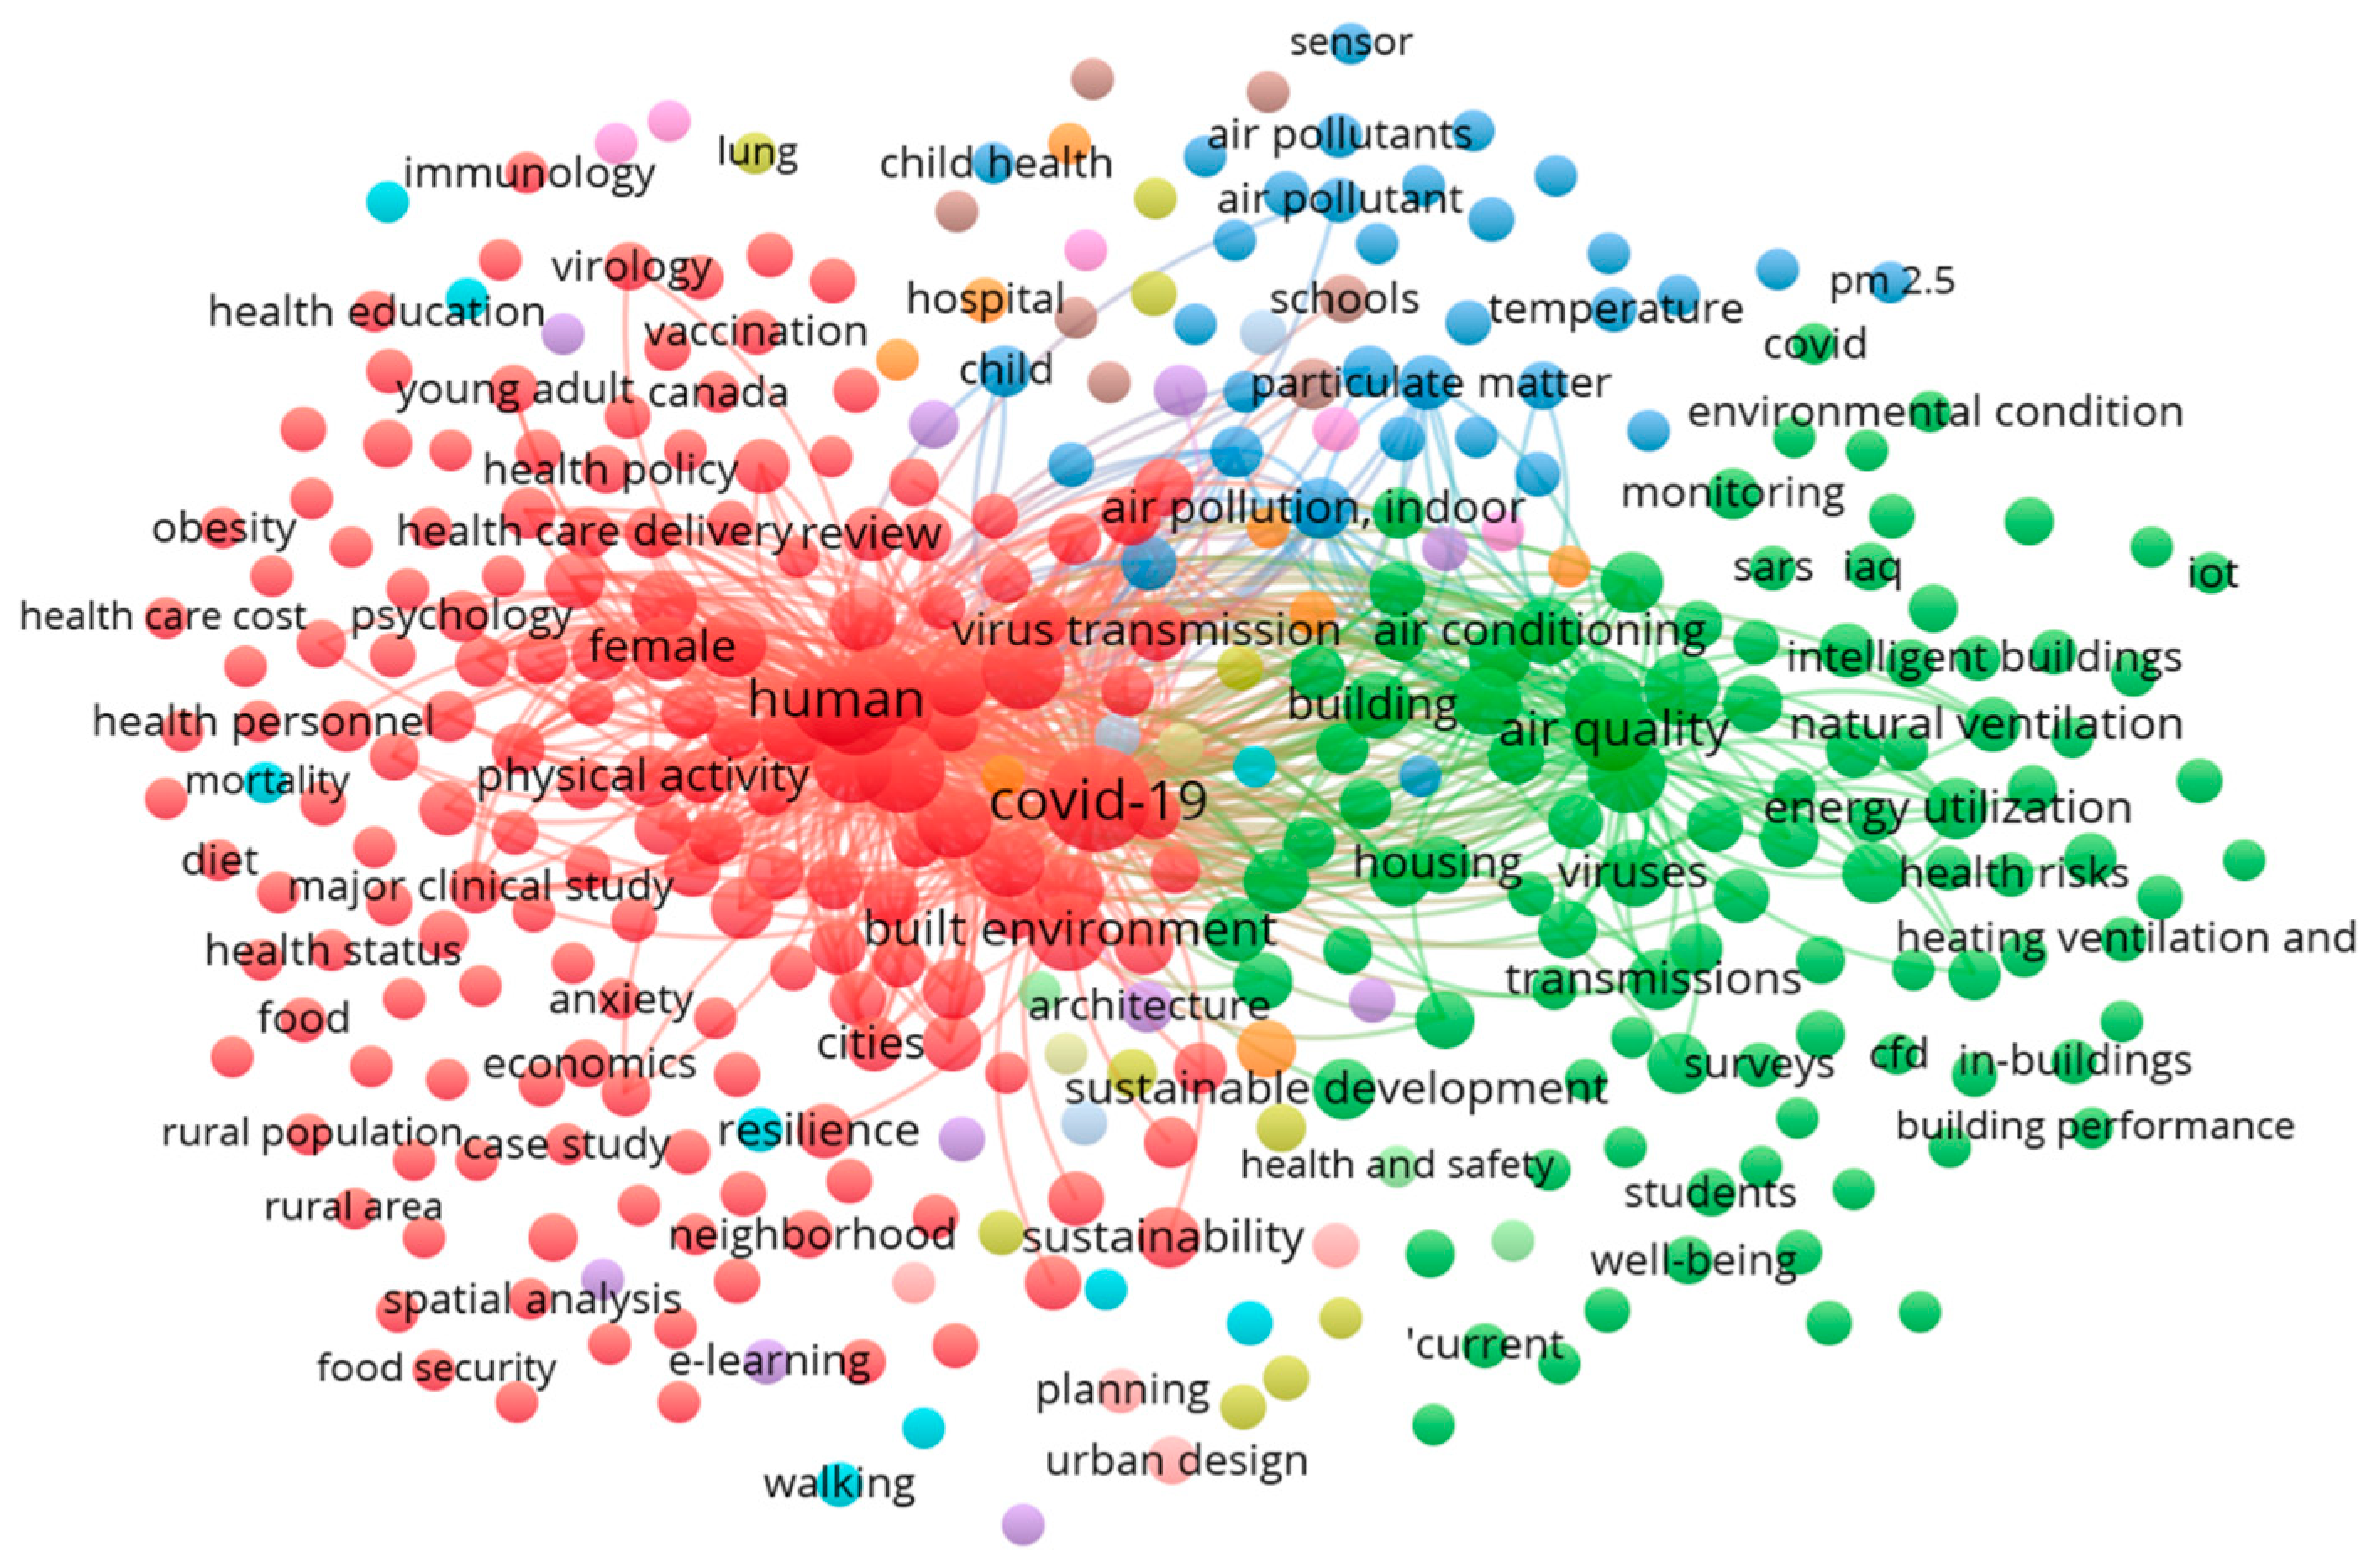
2. General Pictures from Bibliometric Analysis

In the context of our study, we conducted a bibliometric analysis to provide a comprehensive overview of the existing literature related to sustainability within the construction industry, particularly focusing on the indoor built environment. Nowadays, sustainability within the construction industry has been given more missions [13], not only negative impact mitigation, but also environmental, economic, and social aspect coherence in both short- and long-term periods. Other than the negative long-term setbacks caused by the pandemic crisis, Economic Co-operation and Development (OECE) addressed that a recovery must have climate action and human-centric health design as an imperative focus, especially in the public areas [14].
The bibliometric analysis in this study utilized the Web of Science and Scopus databases, which are the 2010s’ historical proprietary infrastructures for citation data, and were selected to gain a general picture firstly, while the starting searching strings can be found in Table 1. By employing statistical methods, this exploration served as a foundational step in our study, helping us:
  • Identify specific research questions and gaps in the existing literature.
  • Define inclusion and exclusion criteria for our study.
  • Guide our evidence search by identifying key keywords and trends.
There is a total of 5536 articles found from Web of Science, while 531 filled in the building scope. The main research clusters illustrated in Figure 1 are “mental health”, “education behavior”, “Indoor Air Quality (IAQ) control”, and “medical measure”. In addition, there is a total of 478 articles found from Scopus, while 153 filled in the indoor built environment scope. The main research clusters illustrated in Figure 2 are “mind movement”, “building design”, “Optimization of HVAC, BMS and IAQ” and “monitoring IAQ thresholds”.

2.1. Learned Lessons from the Aspect of Micro-Climate-Associated Control Post Pandemic Era

Megahed et al. holistically reviewed possible challenges and solutions in the field of an antivirus-built environment. The mentioned possible opportunities to reset and reshape the built environment are from both the natura aspect and advanced technology aspect. In the scope of the advanced technology aspect, some possible solutions are discussed over modular construction, lightweight and adaptable structures, hygienic building materials, artificial intelligence, and touchless technologies [15]. Morawaska et al. believed the existing evidence was strong enough to warrant engineering controls targeting airborne transmission as part of a comprehensive strategy to reduce infection risk indoors [2]. The key ventilation-associated recommendations are through (1) addressing the effectiveness of engineering controls in ventilation operating; (2) increasing the existing ventilation rates and ventilation effectiveness; (3) eliminating any air recirculation within the ventilation system; (4) supplementing existing ventilation with portable air cleaners; and (5) avoiding over-crowding [2]. Another review paper systematically scrutinized the relativity of air quality and COVID-19 and IAQ improvising techniques. It is believed that employing preventive measures between air pollutants and COVID-19 contagions can kill two birds with one stone [16]. Furthermore, Elsaid et al. revealed insight into the design of existing combined air conditioners on their suitability and their impact on the spread of the hybrid coronavirus epidemic and reviewed efforts in obtaining a highly efficient air filter to get rid of super-sized particles for protection against epidemic infection [17].

2.2. Learned Lessons from the Aspect of Simulation and Modeling

In the study of Guo et al. [18], a quantitative human, behavior-based, infection risk-energy consumption model for different indoor environments was developed. An optimal balance point for each indoor environment was finally obtained using the anti-problem method [18]. Niu et al. investigated a new operation and maintenance method for fresh air systems that was proposed for regular epidemic prevention and control to ensure the normal operation of the office building and the health of indoor personnel [19]. Dai and Zhao developed a novelty research method involving predictive equation regression, similarity analysis, CFD approach, and multiple linear regression (MLR) approach. The proposed comprehensive model aimed to estimate the airborne infection risk of COVID-19 so that timely guidelines can be offered for precautions against the prolonged COVID-19 pandemic and common infectious respiratory diseases [20]. Another study reasonably introduced two new indices, the distance index Pd and the ventilation index Ez. The associated projections illustrated that (1) increasing social distance can significantly reduce the infection rate (20–40%) during the first 30 min even under current ventilation practices; (2) the minimum ventilation or fresh air requirement should vary with the distancing condition, exposure time, and effectiveness of air distribution systems [21]. Following this way, Faulkner et al. raised new metrics to evaluate improvement in IAQ relative to costs/emissions. Using dynamic building simulation, the trade-offs’ comparisons in a medium office building system model in different climates in USA were accounted for regarding four different operation strategies among IAQ, financial costs, and CO2 emissions [22].

2.3. Learned Lessons from the Aspect of Measurement and Monitoring

Wargocki et al. observed the relations between the outdoor air supply and the perceived air quality sick building syndrome (SBS) symptoms and productivity in an office. The results showed the benefits for health, comfort, and productivity of ventilation at rates well above the minimum levels prescribed in existing standards and guidelines [23]. Similarly, a larger-scale questionnaire survey and environment measurements were conducted with 916 workers in 22 offices across 2 weeks in November–December in Japan by Umishio et al. [24]. Rozman et al. developed a multidimensional model using a closed-type questionnaire with four constructs (occupational stress, job satisfaction, work engagement, and work productivity among employees) and analyzed the differences in the strength of their effects on the model across two intersectional times: before the pandemic and during the pandemic [25]. Using the same research method, Ortiz et al. clustered office workers working at home based on their self-reported preferences for IEQ and psychosocial comfort so as to identify these preferences and needs during the pandemic. The resulting clusters within IEQ were variables about sounds and smells, the presence of windows, localized temperature, and building systems, while within psychosocial preferences, differing variables were about the personalization of the place, the ergonomics and hygiene, and the size of the space [26].
Alonso et al. carried out a group of on-site air measurements and further predictions with these predictor variables in 21 offices in Norway. Their findings suggested that RH and air temperature significantly predict formaldehyde, TVOC, and CO2 indoor concentration due to the changes in ventilation [27]. Meanwhile, controlling the concentration of CO2 may not be sufficient to provide for healthy indoor air quality as occurrences of high TVOC or formaldehyde happen simultaneously with concentrations of CO2 below 1000 ppm [14]. Yüksel et al. studied the effect of pandemic measures such as restriction of access to mosques, reduced occupancy, opening windows, and restricted use of mechanical ventilation and air conditioning on energy consumption, thermal comfort, and IAQ [28]. It showed that it is difficult to create excellent conditions without air conditioning, even with open windows and night working activity in Turkey [28]. Similarly, another study focused on both indoor and outdoor environments using VOCs and semi-VOCs [29]. Through monitoring campaigns to determine the presence of the target compounds in the gas phase of indoor and outdoor environments that were conducted between April and June 2021, Ninya et al. pointed out the cleaning products and hydroalcoholic gel used against the pandemic were the main solvent source for the indoor environment [29]. Rozman et al. developed a multidimensional model for older employees with the research purposes of determining its impact on their work engagement during the pandemic era. Statistically analyzing from the structural equation modelling, the results showed that workplace health promotion, entrepreneurial working conditions, and leadership lead to better well-being of older employees, giving us a new angle from the Environmental, Social, and Governance (ESG) point of view [30].

2.4. Learned Lessons from the Aspect of Sustainability in MEP

Along the close step toward the carbon reduction goal in 2030 in the EU, embodied carbon gets more and more significant concerns in the construction industry, and there are Prosperity studies around the embodied carbon impact of architectural building materials [31,32,33,34]. However, the building service system/MEP was seldom covered, due to the lack of embodied carbon data and the complexity of system configuration [35]. And the detection of existing research coverage relevant to studies on both indoor environmental optimization and embodied carbon design comparisons is a challenging problem. With the launch of the MEP 2040 Challenge in 2021, the general situation gets better with growing leaders from MEP manufacturers responding to the challenge and collectively establishing a commitment of net zero carbon in their projects: operational carbon by 2030 and embodied carbon by 2040 [36]. Meanwhile, CIBSE launched two applicable methodologies for the calculation of embodied carbon in building service engineering nationally and internally in 2021 and 2022, respectively [35,37]. In accordance with the authors’ latest study of environmental product declaration (EPD) using one of the most prevalent life cycle assessment (LCA) tools, One click LCA, the EPD inventories have made significant progress specially in the fields of mechanical, electrical, and public health (MEP), heating ventilation and air conditioning (HVAC), and building service technology, which are growing. It has grown from 19 MEP manufacturers in 2021 [35] to 192 manufactures by the end of October, 2023. From the diagram in Figure 3, authors briefly checked environmental performance within the six associated reference groups. The present indices of both the average and median only consider manufacturing impacts without local compensation in the benchmarking. The progress can be further found with great contributions from four main involved EPD program operators: IBU from Germany, I-EPD, International, PEP ecopassport from France, and UL Environment from USA.
From another aspect, relevant policies and standards additionally show the upcoming further involvement requirement of HVAC, MEP, and building services in Denmark, Germany, Finland, Sweden, Norway, the United Kingdom, the Netherlands, and international sustainability rating schemes such as BREEAM and LEED from 2023 gradually [38,39].
According to the LETI study, MEP services account for 15% of the total carbon contained in new commercial offices in the UK, while ongoing maintenance and replacement account for 45%. Construction, maintenance, and replacement comprise two-thirds of a building’s lifespan carbon as they grow more energy efficient [40]. As a result, when it comes to research direction, authors believe that it is the right time for researchers, mechanical engineers, and architects to collaborate on measures to address whole-life carbon (WLC) at the building level, which addresses the carbon issue raised by the MEP and HVAC systems’ significant weight, metal material dominance, and high replacement frequency.

3. Materials and Methods

This study takes a stand-alone office building as a reference case to explore the feasibility of the displacement ventilation approach from the aspects of indoor air quality (IAQ), thermal comfort, overall building energy performance, and embodied carbon.

3.1. General Reference Case Description

In the initial phase, the investigated reference office is a stand-alone one-floor building with a total floor area of 225 square meters in Helsinki, Finland. The original total occupant number is 28 with a sitting distance of 1.5 m. The whole working environment is conditioned with floor-mounted water radiators and ceiling-installed chill beams. Meanwhile, mechanical ventilation is traditional mixing-mode ventilation with a fresh airflow supply of 7.5 L/s per person so as to satisfy the minimum requirement of air exchange, the Finnish Work Environment Authorities regulation.
To assess indoor air quality (IAQ), thermal comfort, overall building energy performance, and embodied carbon feasibility, we utilized the simulation tool IDA ICE. It is a commercial building simulation tool renowned for its comprehensiveness and proficiency in designing and optimizing HVAC systems, evaluating energy efficiency measures, and gauging the environmental impact of buildings. It adheres to international standards such as ISO 13790 and ISO 52016, ensuring consistency and reliability in its evaluations [41]. This tool functions as a comprehensive and sturdy simulation platform [41].
The simulation methodology in this study involves a sequential process as follows:
  • Conduct both heating and cooling load calculations using simplified design day data specific to Helsinki, Finland, within the IDA ICE energy model.
  • Formulate a schematic design for the mechanical ventilation system in MagicCAD based on the outcomes of the heating and cooling load calculations.
  • Reintegrate the schematic design parameters linked to the mechanical ventilation system back into the IDA ICE climate stratification model.
  • Execute an annual energy simulation to assess the holistic performance of the building environment and analyze energy consumption patterns.
  • Export both the bill of construction materials and energy-related outcomes to One click LCA for comprehensive life cycle assessment.
To be mentioned is the newly developed climate stratification from EQUA that is used to carry out comprehensive investigation on the performance of the building environment, including the following [41]:
(1)
The discretized zone divided into horizontal layers, followed by the numerically solved balancing equations for the flow of multiple quantities across the layers.
(2)
This 1D vertical finite difference model includes more thoroughly researched features, such as jets, plumes, and wall currents—explicit disturbances.
(3)
Walton’s view factor technique is used to account for non-convex geometry and obstacles, improving the prediction of longwave radiation between walls.

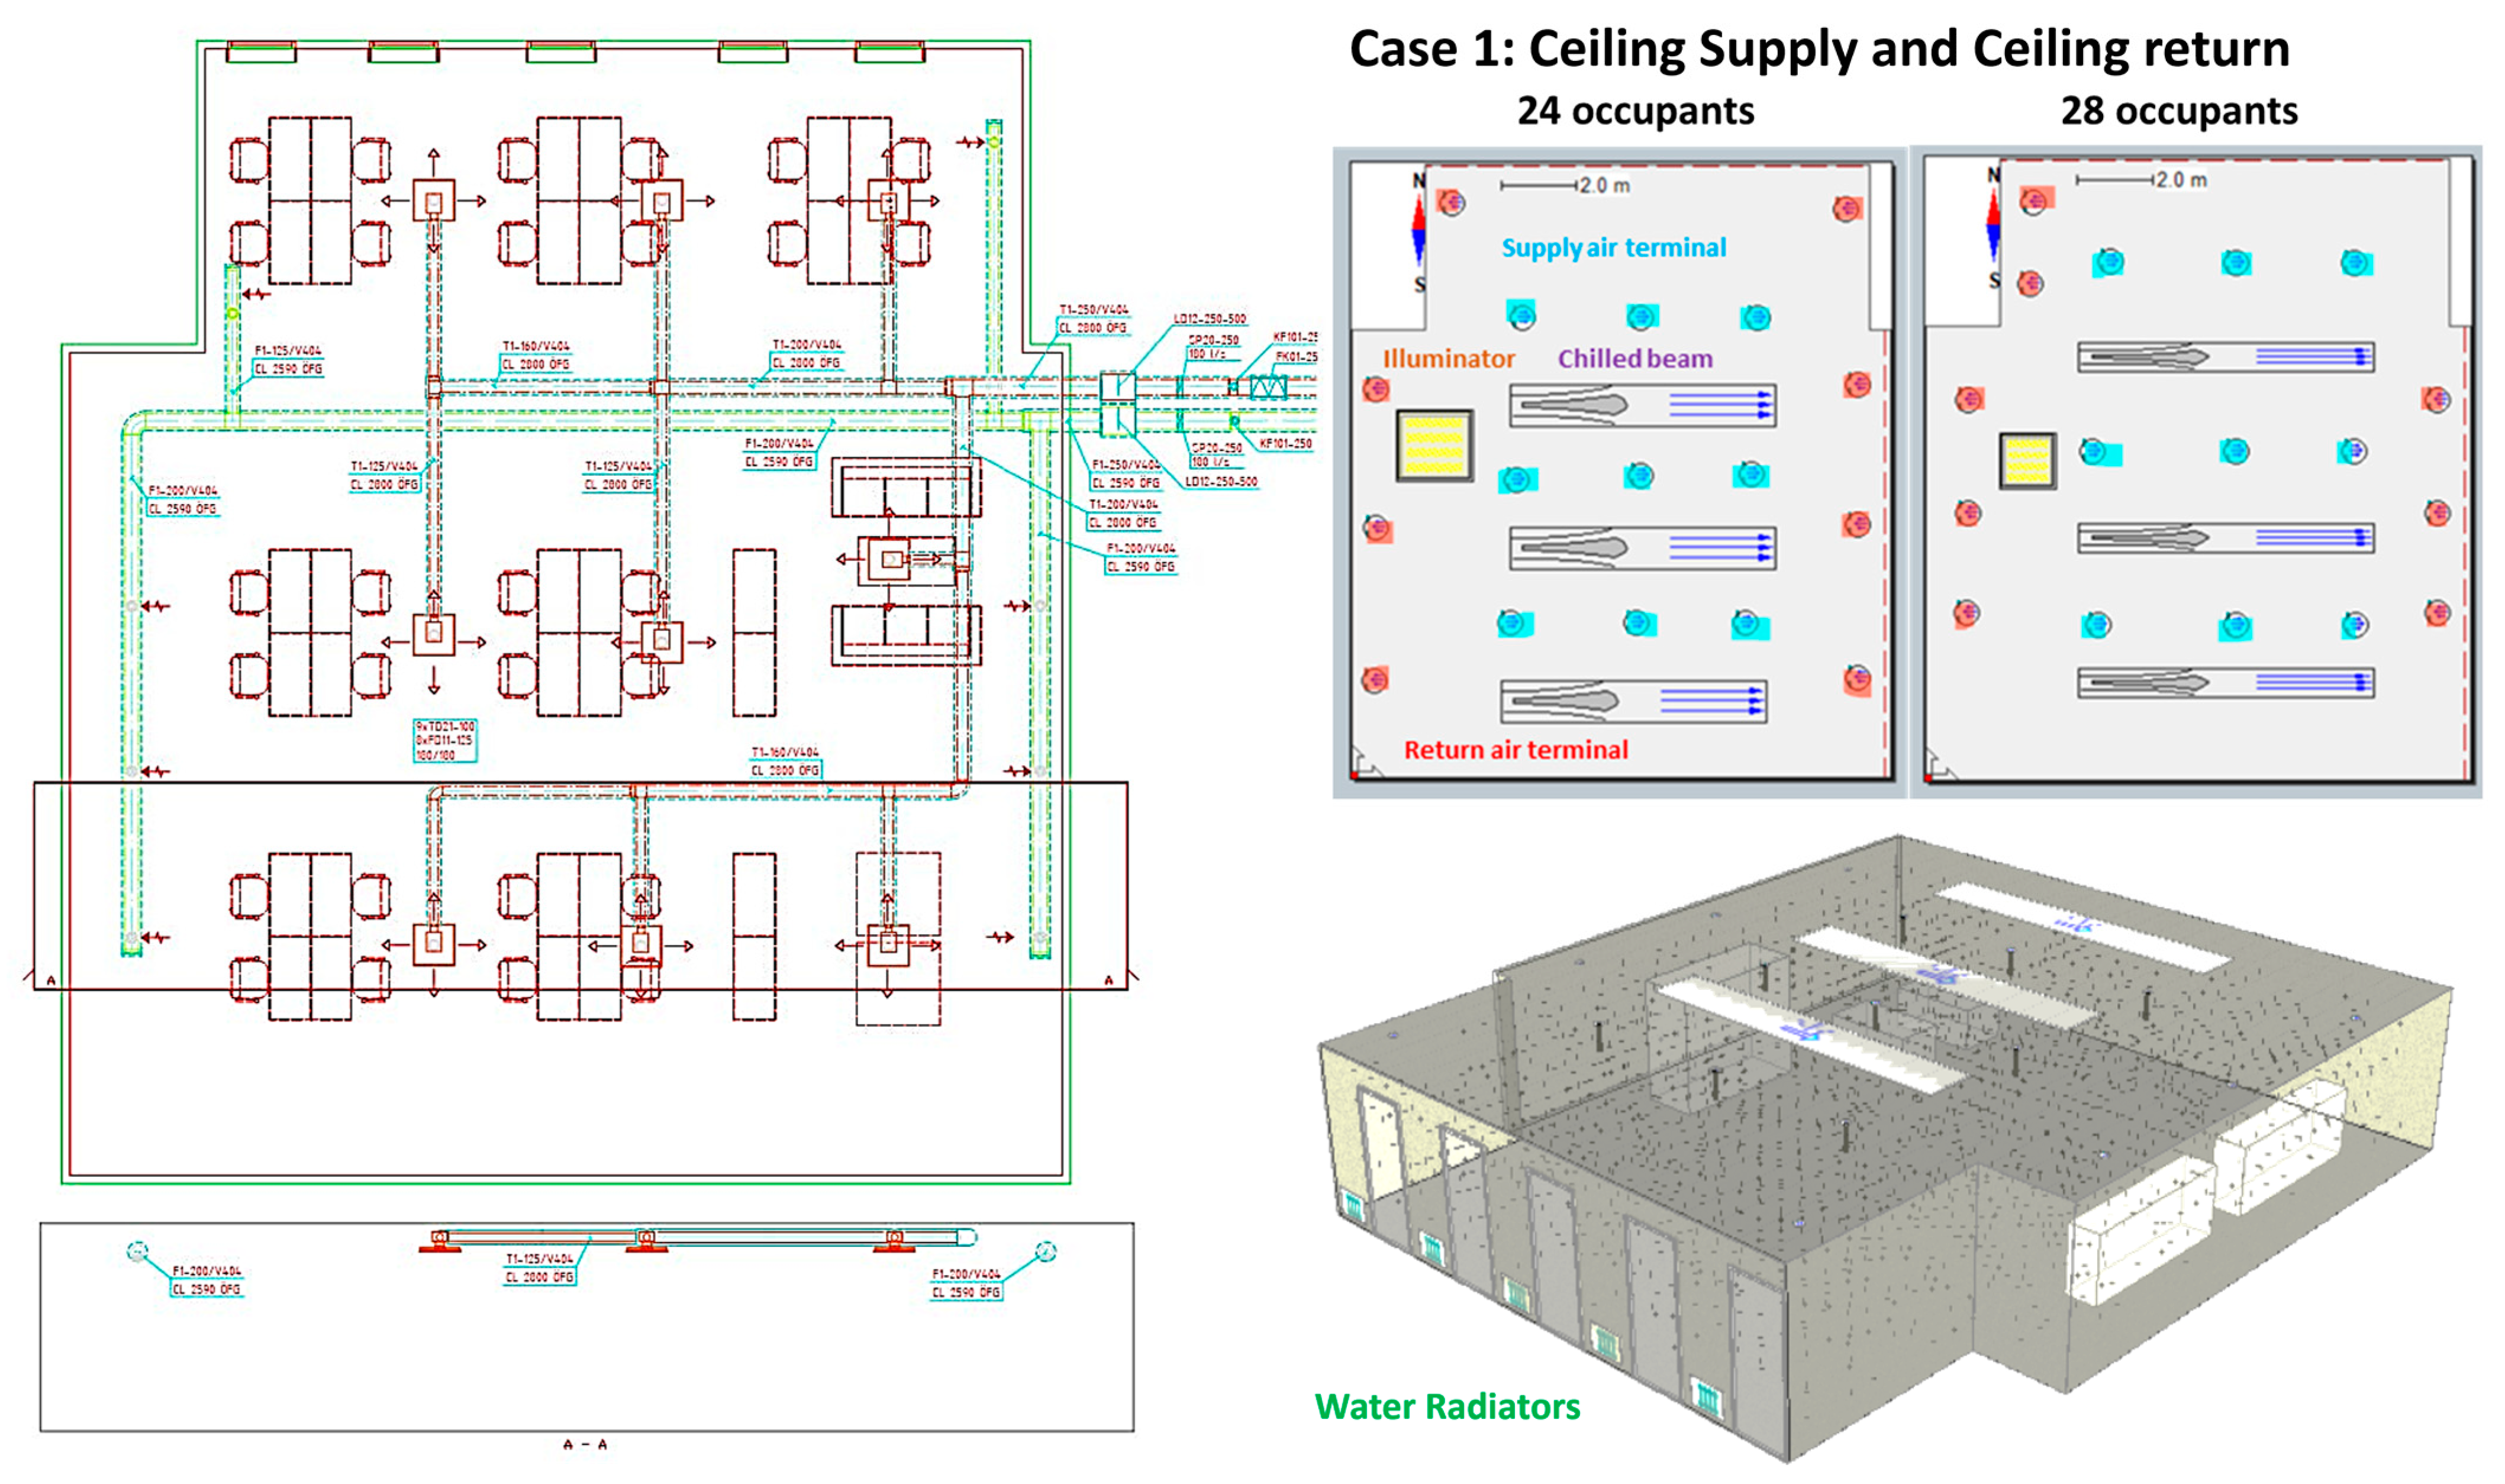
3.2. Office Layout Considerations

The COVID-19 pandemic has had a significant impact on office density. Many employees and employers are reconsidering the use of office space [42,43,44,45]. There is a shift in workspace design, with more employers rapidly changing how they respond to health risks [44], while other factors, advances in technology, shifting demographics, and novel work structures, etc., all make architects alter their designs correspondingly. From an architectural point of view, this study considers two working densities with occupants’ social distance from 2 m to 1.5 m, which yielded outcomes of 24 (each occupant density per 9.38 m2, marked with case (a)) and 28 (each occupant density per 8.04 m2, marked with case (b)) individuals accordingly. Appropriately, the building model has been designed to accommodate two distinct occupant scenarios with corresponding office furniture layout changes (green boxes) in IDA ICE, as depicted in Figure 4.

3.3. Proposed Mechanical Ventilation Approach in Office Context

In a typical office building in the Nordic country, it is conventional to have a mixing ventilation configuration, which has both supply and return air terminals installed on the ceiling level, depicted in Figure 5. However, the coanda effect would increase the risk of infection spreading due to turbulent airflow, potentially picking up infected droplets at different altitudes. To improve the ascension of the return air stemming from its inherent characteristic of low density, the method of the displacement of supply air at a low velocity near the floor level (later referred to as displacement ventilation) is proposed. The supply of air from the air terminal placed at the ceiling level with the lowest possible air velocity is then collected and extracted from the exhaust air terminal at the closest possible location to the floor back to the ventilation air handling unit. In contrast to a traditional mixed-mode system, the expectations of displacement ventilation implementation are to maintain a clear segregation between fresh, uncontaminated air and exhaust air that has been polluted, depicted in Figure 6. Therefore, a few factors like the velocity and temperature of air and the placement of the supply and return air terminals are taken into consideration during the investigation with the IDA ICE climate stratification model [46], which processes the fidelity of the stratified zonal model that takes extra consideration of jets from mechanical ventilation terminals, and plumes arise from internal heat sources and wall currents of both wall attachment and dispatchment. In addition, the latest measuring volume instead of the 1D model and flow elements can contribute to better understanding the air distribution in a landscape office environment.
Because the study concerns more than IAQ, thermal comfort, and annual energy performance, the central constituents of the system shall constitute a fully equipped air handling unit that comprises fans, pre-filters, fine filters, a cooling coil, heating coils, and an energy recovery mechanism. Additionally, the system features supply and return air ducts with insulation complemented by diffusers and associated sound attenuators for the purpose of embodied carbon calculation.

3.4. Feasibility Studies

When considering the implementation of the displacement ventilation approach compared to the conventional mixing ventilation approach in improving indoor environmental quality and sustainability in an office context, a feasibility study is regarded as necessary in identifying
(1)
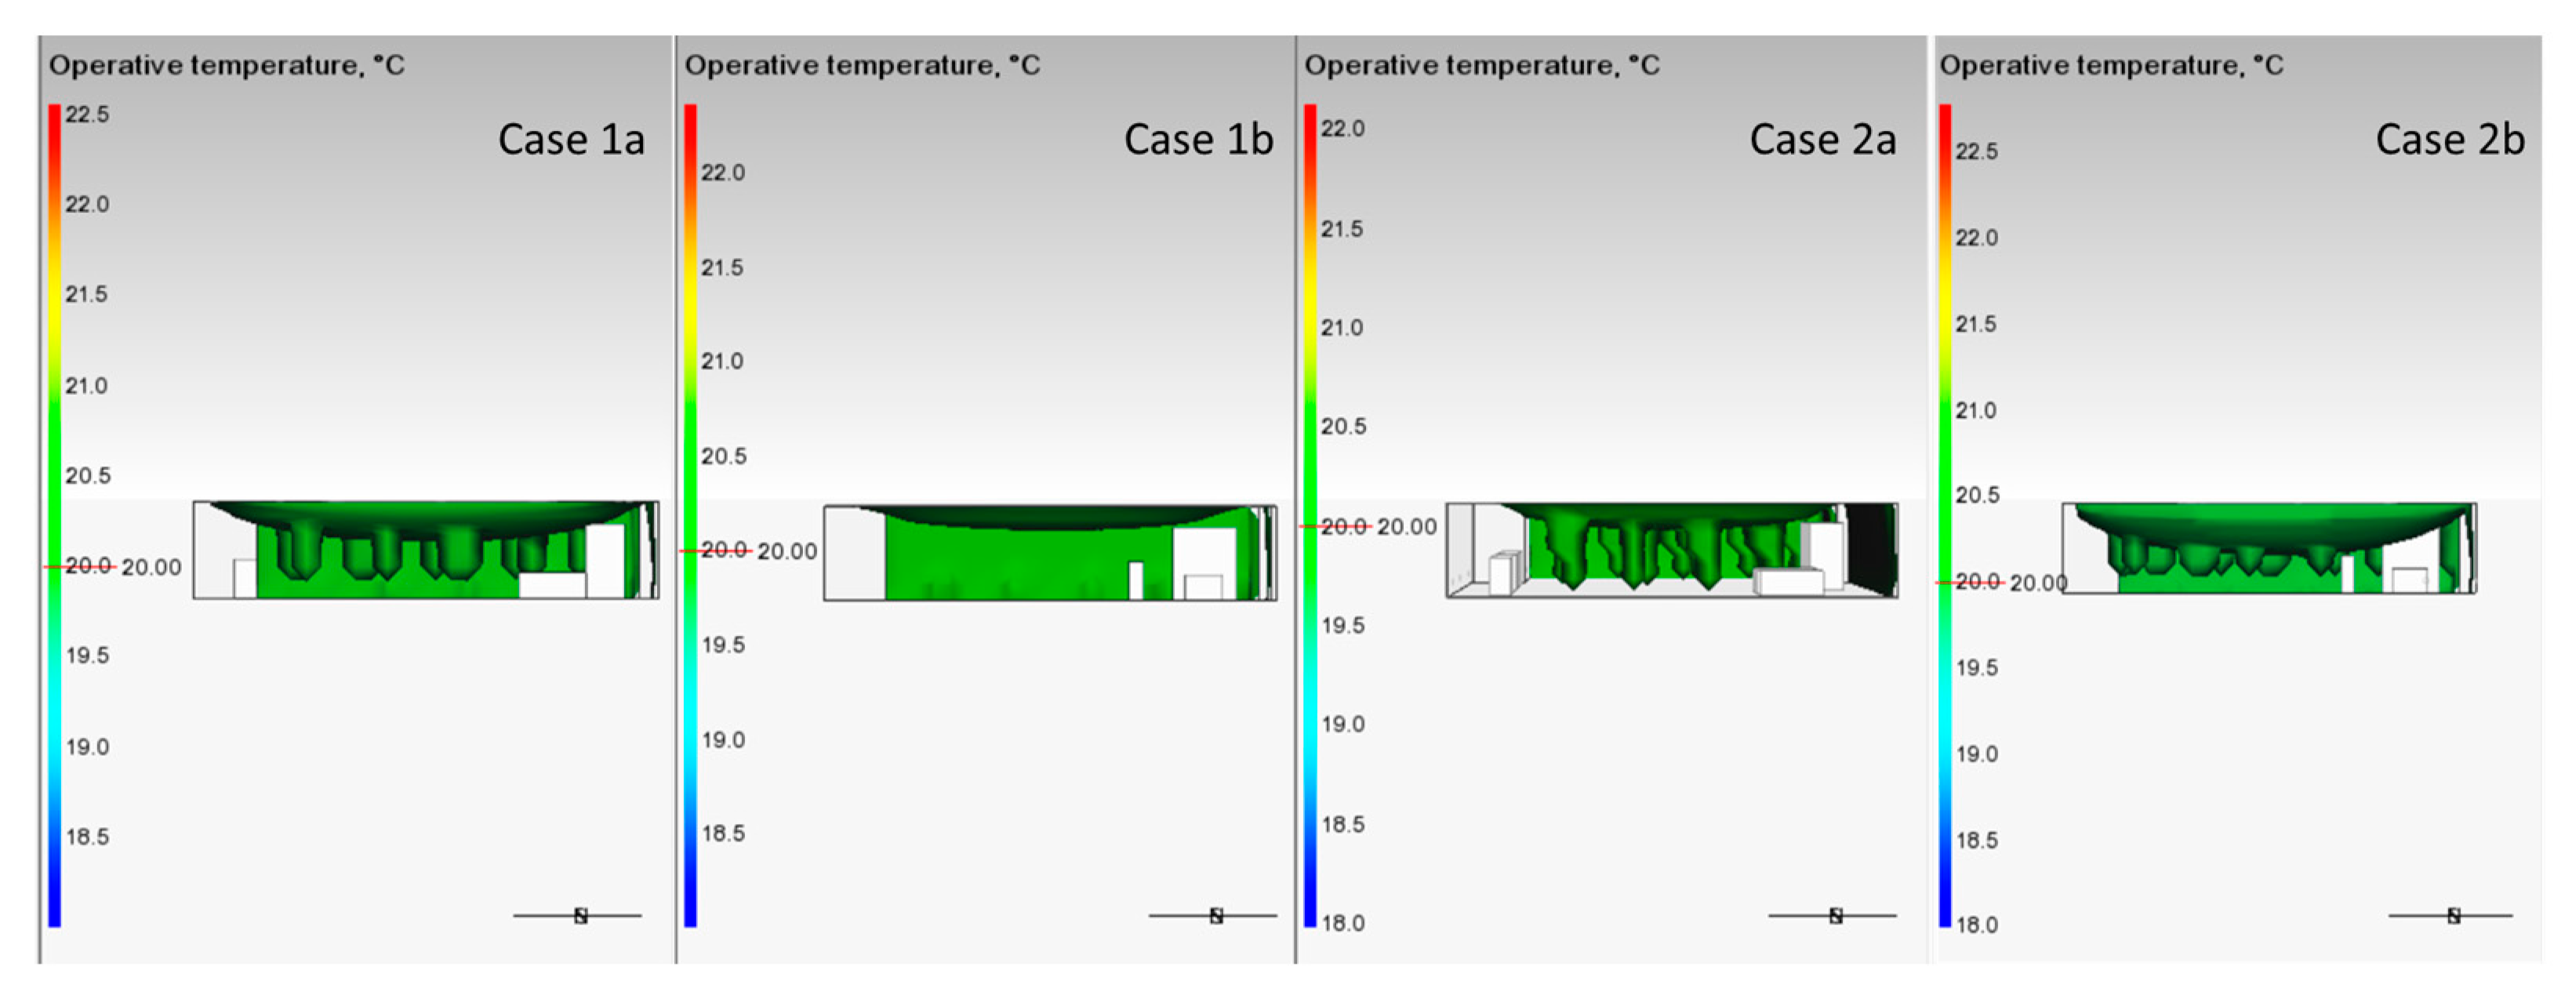
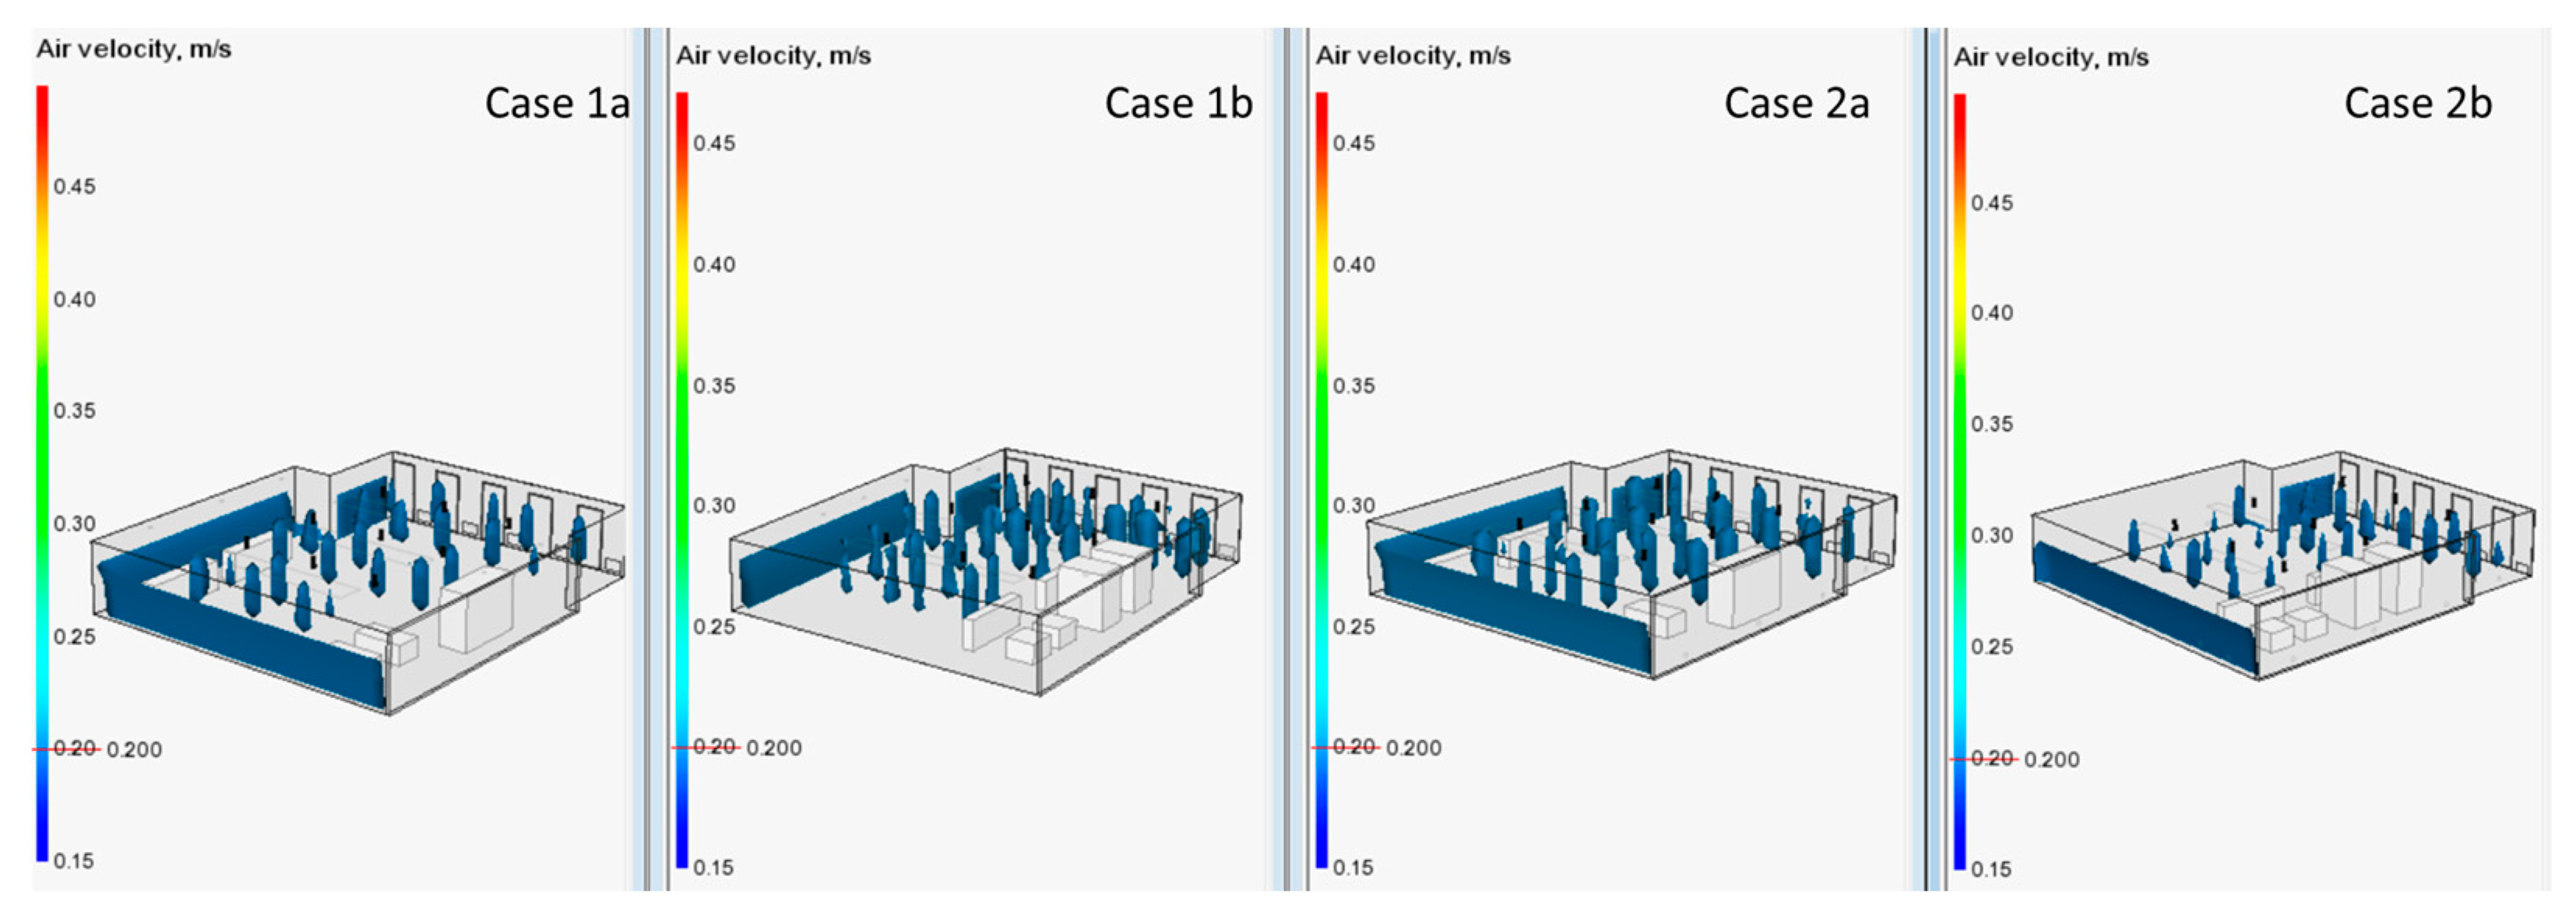
Associated indoor air quality and thermal comfort impacts in terms of CO2 contents, operative temperature, air velocity, PMV and PPD, and draught percentage of the dissatisfied.
(2)
Associated energy efficiency performance, and its possible impact on sustainability.

3.4.1. Overall Building Performance Study

IDA ICE 5 was used to create simulation models for typical summer and winter conditions, encompassing the respective periods of 1 July to 31 July and 1 February to 28 February, respectively, to examine the associated indoor air quality and thermal comfort consequences with 8 cases in total.
The component selection of the mechanical ventilation system was based on the calculation in Table 2, which considers the heat from light fixtures, electrical equipment (computers), outdoor air, and number of occupants. In addition, the default landscape office model fidelity settings were employed to ascertain the cooling and heating requirements for the designated landscape office setting with fixed design parameters: (1) supply airflow rate: 7.5 L/s/person; (2) supply air setpoint temperature: 18/20 °C (using summer/winter schedules); (3) room setpoint temperature: 21/24 °C; (4) target occupied zone achieving at least thermal comfort level II (according to SS-EN16798-1 [47]); (5) maximum occupied zone air velocity of 0.15 m/s.
The study uses the ideal heater and ideal cooler as the base case when calculating the heating and cooling load, using district heating as the energy carrier and electrical cooling (with an assumed COP of 3). The floor-mounted radiators and the chilled beams erected in the ceiling are later replaced as actual zone components in more precise placements. As depicted in Figure 5 and Figure 6, the climate model explicitly includes both the occupants and these zone components. Accordingly, supply air and return air terminals are positioned based on the coverage area of chosen diffusers in accordance with the air volumes, chilled beam, and luminaire.

3.4.2. Embodied Carbon Calculation of Mechanical Ventilation System

Life cycle assessments (LCAs) are widely adopted across the building industry to assess the environmental impact of buildings. With the launch of SS-EN15978:2011 [48] in 2011 by the European Committee for Standardisation (CEN), it attracts great attention to evaluate the environmental sustainability of buildings particularly in terms of the embodied energy of buildings. Other than the relatively simple building structure and fabric, the built environment is always a more complex and dynamic system that significantly impacts energy consumption and occupants’ comfort and health. Building services represent a significant proportion of the materials used in a building. Typical central plants and building service equipment use a high proportion of steel, aluminum, plastics, and copper in their construction and use rare earth elements for key components such as permanent magnets in motors and phosphors for lamps [49]. Along with more further involvement requirements of HVAC, MEP, and building services in national policies and standards in Denmark, Germany, Finland, Sweden, Norway, the United Kingdom, the Netherlands, and international sustainability rating schemes such as BREEAM and LEED from 2023 [38,39], it is necessary to include building services/MEP design as a part of the whole-life-carbon building design process to inform best practices in early project stages. This studied building element group is only the mechanical ventilation system following the methodological framework in EN15978:2011. The covered system boundary for the studied mechanical ventilation system is WLC (cradle to grave), including the product stage, construction stage, in-use stage, and end-of-life stage. Regarding the temporal boundary for the assessment, the reference study period (RSP) is 50 years, which can make a significant but ambiguous difference in comparisons within Swedish reporting [39].
The raw material in this part constitutes three main parts. The first part is the bills of material that are specified in schematic system designs (from mechanical engineer’s drawing carried out with Magicad). Another part is the global warming potential of specific materials, which is taken as a reference from the building technology input category inside One click LCA. The assumed selection rules are (1) the closest technical performance; (2) the nearest manufacturing location. The last part is the associated operational energy simulated from IDA ICE, which also takes into account the carbon factor of both district heating and electricity that is from the latest Finland average value in 2021.

4. Results and Discussion

4.1. Overall Performance Results

Table 2 provides a comprehensive overview of the simulated results in three principal aspects from the energy model, in which the case of 1b is regarded as the base case. From the aspect of system energy, it breaks down into the waterborne heating/cooling energy and the airborne heating/cooling energy. Case 2b shows total primary energy savings of 0.25% compared to the base case, which mainly comes from the waterborne heating/cooling energy. There is a similar situation when comparing the cases with 24 total occupants. Due to less useful heat gains from occupants and the weighting factors, there is only around 0.4% of the waterborne heating/cooling energy saving (in Case 2a) compared to that in Case 1a.
From the aspect of thermal comfort (EN16798-1 with cooling), the main changes caused by two ventilation approaches are the difference in comfort hours in both thermal comfort category I (−3 h/+3 h) and II (−22 h/−7 h) to category III in the occupant scenarios of 28 and 24, respectively. With the aspect of IAQ, there are two studied metrics. Duration is the total occupied working hours when the mean air age of the space is above 2h, which means the air change rate is below 0.5 ACH, while the CO2 is the total carbon dioxide fraction in the space. From Table 3, it is hard to identify the changes between the two ventilation approaches. Only occupant number has slight impacts on both duration and CO2 content because the designated supply/return airflow rates are dependent on the occupant number.

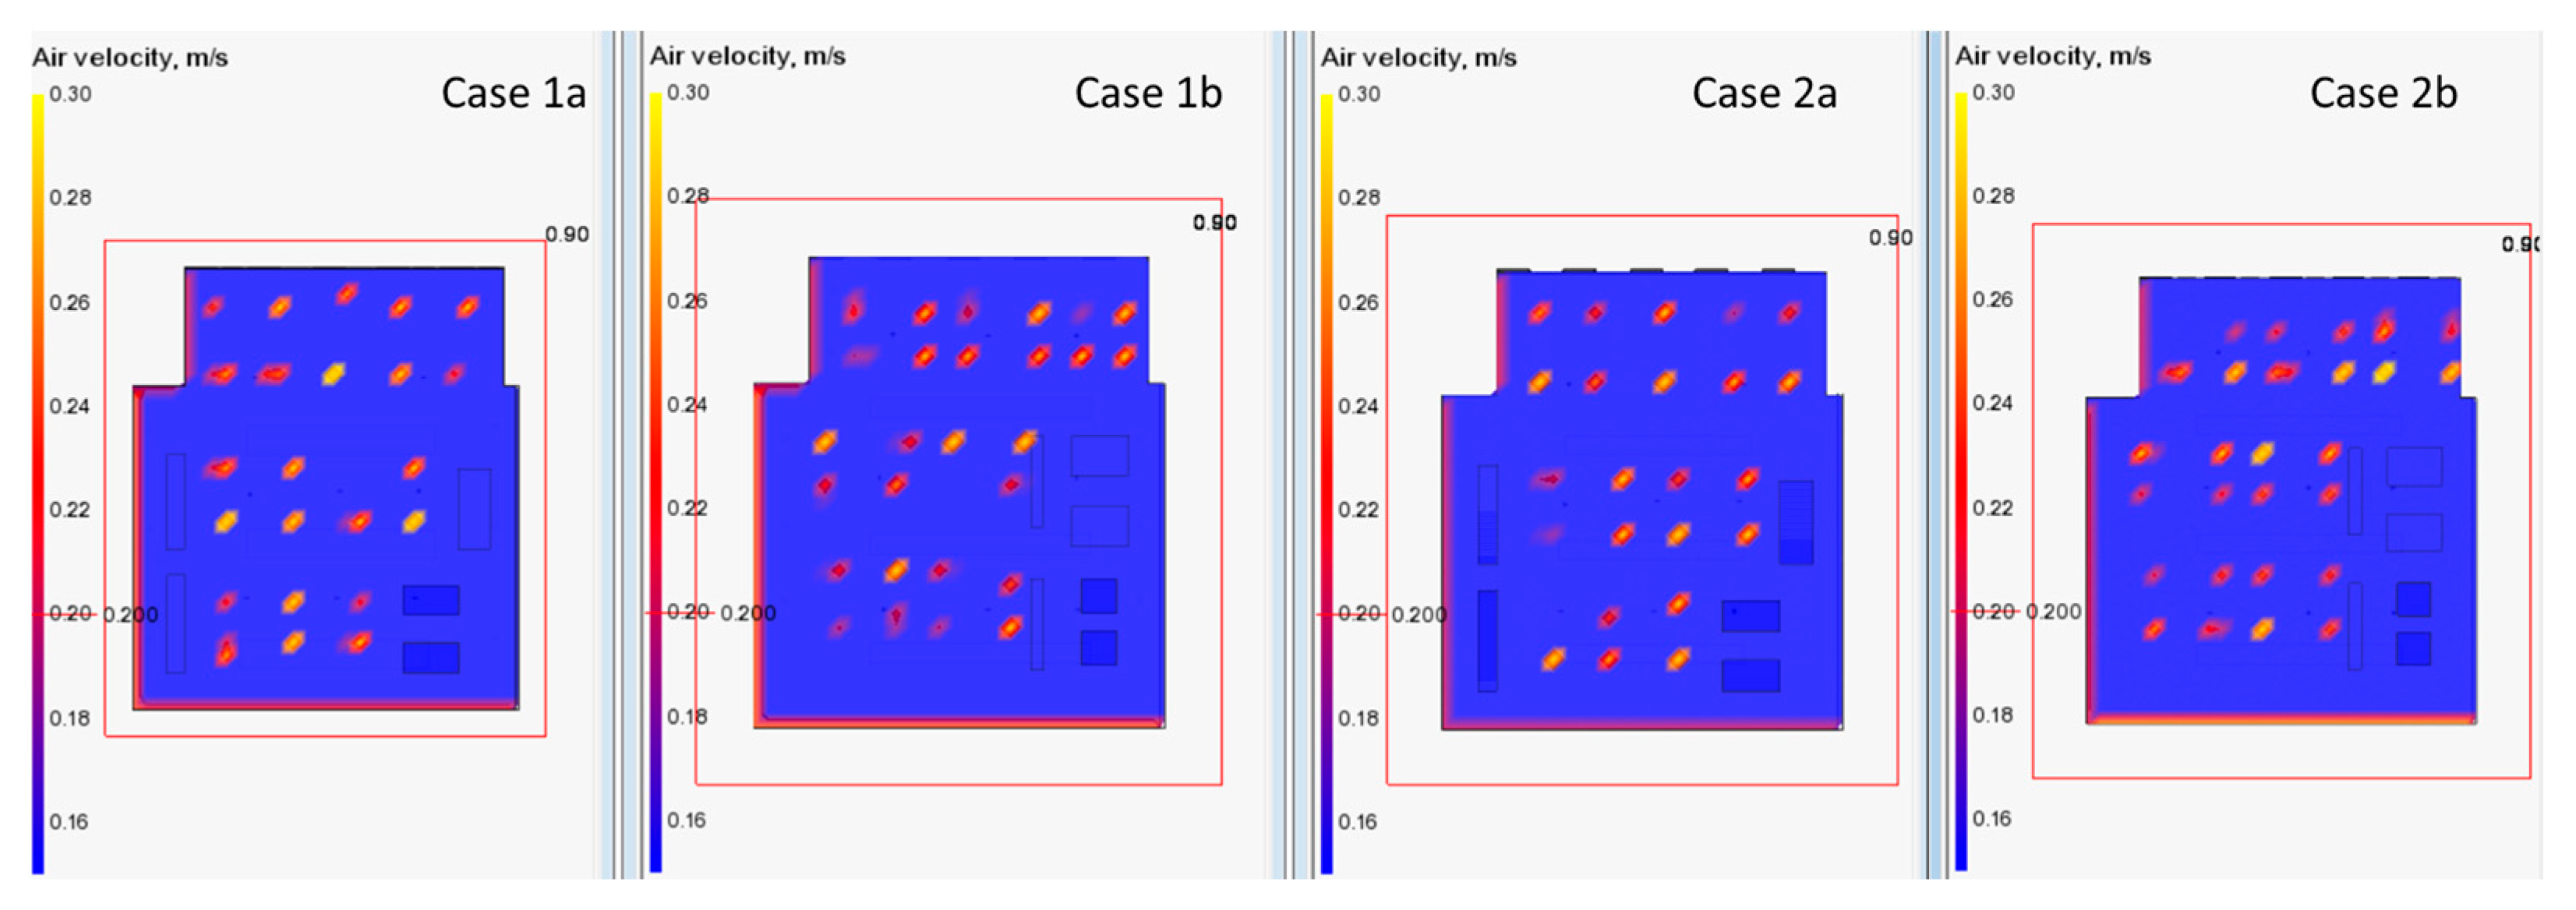
4.2. Performance on Specific Positions

Thermal comfort performance depends on several variables and a comprehensive thermal comfort study requires more information about the simultaneous magnitude of these quantities, which is hardly predicted with a well-mixed zone model. In order to detect the pitfalls of thermal performance between two mechanical ventilation approaches, a follow-up study has been carried out using the climate with stratification zone model in IDA ICE [50]. Compared to its traditional alternative, a computational fluid dynamic (CFD) study, it has less limitations on exorbitant computational time and required appropriate turbulence models. Moreover, it offers a series of time predictions satisfying the longer period thermal comfort evaluation requirements. Accordingly, three representative occupant positions, “close to window”, “central”, and “backend”, were selected for detailed observation over air temperature, PPD, PMV, and CO2 fraction (highlighted occupant positions in Figure 7).
In the same settings as the mixed ventilation strategy, Table 4 shows that the displacement ventilation approach generally has a relatively cooler performance in the 24-occupant scenario and warmer performance in the 28-occupant scenario. In terms of specific occupant thermal perception, values reveal identical thermal comfort outcomes in both Predicted Percentage Dissatisfied (PPD) at 6% and Predicted Mean Vote (PMV) at 0.2 during the summer, which falls under thermal comfort category I [51].
However, the main challenge of thermal dissatisfaction occurs during the wintertime in all studied cases. In the 24-occupant scenario, the occupants that sit under the displacement ventilation have higher PPD values. As the occupant number increases, so do the overall supply airflow rates in the office, which worsens PPD values in Case 1b, but improves PPD values in Case 2b. Because the heating/cooling design parameters are identical in both cases, the only changing factors are the air temperature and air velocity induced by the two ventilation approaches. Furthermore, the zoomed-in pictures in Figure 8 and Figure 9 indicate that different airflow patterns are the primary cause of draughts and temperature gradients.
Figure 8 presents the common challenge in all cases during the heating season that is the air stagnant zone at the operative temperature of 20 °C. More occupants would worsen the problem by increasing the temperature stratification between the head position and the foot position in the conventional ventilation mode, particularly in Cases 1a and 1b. However, the cases with displacement ventilation exhibit more uniform operative temperature airflow patterns. With the same operative temperature of 20 °C, Case 2a features inverted-cone-shaped airflow patterns that are comparable to those in Case 1a but have a warmer temperature layer deeper at the foot level. And the ventilation system in Case 2b successfully pushes down the air stagnant zone to the chair height around 0.55 m.
Figure 9 depicts the air velocity distribution with the threshold of 0.2 m/s, which belongs to the unnoticeable light airspeed range. Case 2a offers occupants with a greater radius of supply air cylinders, which is the reason for greater PPD values in Table 3. From a healthy ventilation point of view, it does help in pushing away particles from surfaces and respiratory systems compared to Case 1a. Because of the side return air terminals that were installed at the height of 0.4 m on the side walls in the displacement ventilation approach, it makes the air velocity distribution under each supply air terminal transform from a cylinder shape in Case 1b to a shorter spindle shape in Case 2b. When checking the airspeed pattern at the desk height (0.9 m) in Figure 10, the cases with displacement ventilation present more evenly distributed airspeed of 0.2 m/s than those in both Case 1a and Case 1b. The bottom height of the air velocity distributions in Case 1b ends at the height of 0.09 m, while it is 0.63m for those in Case 2b. The further infers three issues: (1) unnecessary energy inefficient ventilation below the chair height; (2) unwelcome turbulence near the floor level, which can mix up dust, debris, and other particles on the floor; and (3) uneven distributed flush-away air velocity in the breathing zone of occupants.
Finally, regarding IAQ, Table 3 gives further basic information of CO2 contents measured at two different height levels. Similar to Table 2’s results, there is not an obvious distinction between CO2 contents in two ventilation approaches, although increasing supply and return airflow directly lowers CO2 contents a bit.

4.3. Embodied Carbon Results

In the context of mechanical ventilation LCAs, the studied system boundary constitutes the product stage, the construction stage, the operational stage, and the end-of-life stage. By importing both materials from the mechanical ventilation system installation and the associated operational energy consumption (annual energy simulation results from IDA ICE) into one click LCA, Table 5 provides a concise overview of their whole-life-carbon performance in terms of material and energy usage. To be mentioned are the selected materials from mechanical ventilation system installation that all follow the localization rule from its environmental performance declaration database, which is based in or close to Finland. The present findings indicate a marked reduction in GWP results of 1.42% with the utilization of displacement ventilation technology in Case 2a, while a marginal decrease of 0.91% is ascertained in Case 2b.
Although the major GWP results are saved in the operational stage, potential carbon savings exist from ductworks if using the building fabric (e.g., pressured floor voids, ceiling voids, and atria) in place of supply or extract ductwork [49]. From a breakdown analysis of the used materials in the mechanical ventilation system installation in Table 6, there are slight differences in the list of materials in studied cases that Cases 1a and 1b share the same material list as Cases 2a and 2b do. The possible reasons are as follows: (1) lacking resource effective integration of the ductwork at the early stages; (2) the use of empirical safety factors [52,53], which is frequently taken into account during the design of HVAC systems. It helps to permit less variance in the use of materials and greater acceptance of modifications to the design scenario. However, diverse ventilation approaches have different material demands, especially in ducting materials and associated insulation materials.
In addition to the consideration of the embodied carbon during the upfront stage, it is necessary for mechanical engineers to pay attention to other relevant information on the transportation, service life duration, and end-of-life measure (EOL). They all function together with upfront carbon in this mechanical ventilation design example accounting for about 6.1% of the total carbon portion.

5. Conclusions and Recommendations

The COVID-19 pandemic has led to a heightened global focus on transitioning to not only a sustainable society but also a sustainable indoor environment. With rapid innovation in building technologies, hygiene/working practices, and building design, the mechanical engineering industry encounters more challenges in terms of reducing negative effects on climate action and environmental, economic, and social coherence. And these elements accordingly influence how a sustainable indoor environment is designed throughout the building’s lifecycle.
Different to the conventional mixing-mode ventilation, the concept of displacement ventilation was introduced as an effective option for improving indoor environmental quality and sustainability in post-pandemic office settings. In response to the focus on human-centered design and climate action for a sustainable indoor environment, both the overall building performance study and the LCA are recognized as two important methodologies in this study. They offer systematically assessing not only the thermal comfort and energy performance but also its environmental impact; so, this can better inform decision making for stakeholders. However, due to a lack of relevant EPD or associated carbon data, the adoption and implementation of the combined methodologies for mechanical ventilation systems vary significantly from the widely implemented constructure material elements.
Therefore, this study proposed a feasibility study for an office space ventilation system, considering essential variables like thermal comfort indicators, heating/cooling loads, operational energy consumptions, and embodied carbon values. The main objectives include (1) providing schematic carbon design options with two occupant densities and two mechanical ventilation approaches’ comparison in a landscape office setting in a heating-dominated climate, (2) evaluating the overall effectiveness of the two mechanical ventilation approaches in terms of energy consumption and indoor environment performance using the IDA ICE climate stratification model, and (3) examining collaboration opportunities for researchers, mechanical engineers, and architects in addressing whole-life carbon (WLC) in an open office setting.
In terms of overall performance results, the comprehensive overview of the simulated results in three principal aspects from the energy model shows that the basic case of mixed ventilation with 28 occupants has a specified system primary energy value of 38.8 kWh/m2. If the office occupancy density was reduced directly, the specific system primary energy would have increased by 0.4% to 39 kWh/m2. Based on the identical mechanical ventilation design parameters in the alternative displacement ventilation approach, the scenario with 28 occupants might have a specific system primary energy of 38.7 kWh/m2, saving 0.3% as compared to the same office occupancy density. With 24 people, the specific system primary energy may be 39 kWh/m2, saving 0.1% when compared to the same office occupancy density.
In terms of indoor air quality and thermal comfort results, a climate (with stratification) model works as an effective alternative to CFD to detect pitfalls between two mechanical ventilation approaches. In most cases, the displacement ventilation strategy successfully pushes down the air stagnant zone at ceiling height to chair height, resulting in a greater thermal comfort performance. Its airflow with more uniform operative temperatures and air velocity patterns has other advantages of (1) avoiding unnecessary energy-inefficient ventilation below the chair height; (2) reducing unwelcome turbulence near the floor level, which can mix up dust, debris, and other particles on the floor; and (3) offering even distributed flush-away air velocity in the breathing zone of occupants.
In terms of GWP results, the present findings indicate the displacement ventilation strategy has a marginal reduction in embodied carbon (1.42% savings in the case of displacement ventilation with 24 occupants and 0.91% savings in the case of displacement ventilation with 28 occupants compared to the base scenario), primarily due to operational energy savings. In addition to the consideration of the embodied carbon during the upfront stage, it is necessary for mechanical engineers to pay attention to other relevant information on the transportation, service life duration, and end-of-life measure (EOL). In this mechanical ventilation design example, the material selection accounts for approximately 6.1% of the total carbon portion.
However, this study has some limitations. First, the study only looked at a simple mechanical ventilation system in a heating-dominated environment; therefore, the findings may not be applicable to other sophisticated HVAC settings. Second, the chosen climate (with stratification) model provides just a few IAQ metrics. Third, an embedded carbon analysis has several limitations due to the assumed material selection procedures and the lack of any cost-related consideration. Future work should focus on addressing these limitations and further exploring the benefits and drawbacks of displacement ventilation in different contexts.
Despite these limitations, the general contributions of this study are three-fold. First, it provides valuable insights into the mechanical ventilation design in post-pandemic office settings, especially from the newly added sustainability dimension. Second, it gives a concrete case study of how to address climate action and human-centric indoor environment design in a landscape office setting. Different to an investigation into performance metrics, it focuses more attention on the ecological footprint, which further extends considerations beyond the aspect of the environment boundary.
By using the framework of Environmental, Social, and Governance (ESG), it enables us to conduct a multifaceted analysis in Figure 11. It is believed that it can serve as a foundation for future research endeavors, bringing Environmental, Social, and Governance concerns into harmony in the changing post-pandemic working environment. By examining the social dimensions, it is imperative to emphasize the important role of MEP design compared to floorplan design. From this study, it was found that even little changes in ventilation approaches result in a significant impact on IAQ performance and occupants’ acceptability. It is necessary to have a more sophisticated understanding of building service systems’ impact on occupants’ experience. To urge the inclusion of the human dimension in sustainable workplace design, we advocate for early-stage collaboration among multiple stakeholders, fostering iterative design reviews for continual improvement. Turning to the governance aspects, it is vital to systematically break down sustainability objectives of MEP design, rendering them operationally feasible within the designated scope. For instance, we encourage an integrative whole-life-design process. Through a digitalized MEP design coupling with a generic ecological footprint analysis, it is helpful to anchor it with a suitable empirical safety factor for a ventilation system design at the concept design phase. In addition, the associated ecological footprint data sharing, and pilot case study with a focus on relevant benchmarking, emerge as governance strategies to promote transparency and accountability.

Author Contributions

Conceptualization, J.S. and Y.C.; methodology, J.S.; software, J.S. and K.H.R.; formal analysis, K.H.R. and J.S.; resources, Y.C.; writing—original draft preparation, J.S. and K.H.R.; writing—reviewing, J.S. and Y.C.; visualization, J.S.; supervision, J.S. All authors have read and agreed to the published version of the manuscript.

Funding

This research received no external funding.

Data Availability Statement

The data presented in this study are available on request from the corresponding author as AFRY holds the full rights to design resources in this industry thesis work.

Acknowledgments

The authors extend their sincere appreciation to Energy Management East, ÅF-Infrastructure AB Sweden, for generously supporting this industry thesis work and providing invaluable design resources, crucial to achieving the optimal outcome of this study. Special thanks are also given to both the EQUA team (IDA ICE 5.0 Beta) and OneClick LCA team (OneClick LCA) for offering the educational licenses as well as their instrumental roles in facilitating access to two tools during the thesis work period in 2023. Additionally, our gratitude is extended to WSP, Sweden, for providing access to the Magicad tool, which proved essential in the preparation of ventilation drawings. This comprehensive support was indispensable in realizing the overarching objectives of this analytical investigation.

Conflicts of Interest

Author Yang Chen was employed in Energy Management East, ÅF-Infrastructure AB Sweden. The remaining authors declare that the research was conducted in the absence of any commercial or financial relationships that could be construed as a potential conflict of interest.

References

  1. López, A.; Fuentes, E.; Yusà, V.; López-Labrador, F.X.; Camaró, M.; Peris-Martinez, C.; Llácer, M.; Ortolá, S.; Coscollà, C. Indoor Air Quality including Respiratory Viruses. Toxics 2021, 9, 274. [Google Scholar] [CrossRef] [PubMed]
  2. Morawska, L.; Tang, J.W.; Bahnfleth, W.; Bluyssen, P.M.; Boerstra, A.; Buonanno, G.; Cao, J.; Dancer, S.; Floto, A.; Franchimon, F.; et al. How can airborne transmission of COVID-19 indoors be minimised? Environ. Int. 2020, 142, 105832. [Google Scholar] [CrossRef]
  3. Occupational Safety and Health Administration U.S. Department of Labor. Indoor Air Quality in Commercial and Institutional Buildings; OSHA 3430-04 2011; Occupational Safety and Health Administration U.S. Department of Labor: Washington, DC, USA, 2011.
  4. Ahlawat, A.; Wiedensohler, A.; Mishra, S.K. An Overview on the Role of Relative Humidity in Airborne Transmission of SARS-CoV-2 in Indoor Environments. Aerosol. Air Qual. Res. 2020, 20, 1856–1861. [Google Scholar] [CrossRef]
  5. Nair, A.N.; Anand, P.; George, A.; Mondal, N. A review of strategies and their effectiveness in reducing indoor airborne transmission and improving indoor air quality. Environ. Res. 2022, 213, 113579. [Google Scholar] [CrossRef]
  6. Anders, C. ‘Poor Indoor Air Quality Negatively Affects Employee Health, Productivity’, Air Impurities Removal Systems. Available online: https://www.airsystems-inc.com/resources/blog/air-purifiers/poor-indoor-air-quality-negatively-affects-employee-health/ (accessed on 8 September 2023).
  7. Wyon, D.P. The effects of indoor air quality on performance and productivity. Indoor Air 2004, 14 (Suppl. S7), 92–101. [Google Scholar] [CrossRef] [PubMed]
  8. Office Air Quality May Affect Employees’ Cognition, Productivity. Available online: https://www.hsph.harvard.edu/news/press-releases/office-air-quality-may-affect-employees-cognition-productivity/ (accessed on 8 September 2023).
  9. ASHRAE Publishes Standard 241, Control of Infectious Aerosols. Available online: https://www.ashrae.org/about/news/2023/ashrae-publishes-standard-241-control-of-infectious-aerosols (accessed on 8 September 2023).
  10. Asim, N.; Badiei, M.; Mohammad, M.; Razali, H.; Rajabi, A.; Chin Haw, L.; Jameelah Ghazali, M. Sustainability of Heating, Ventilation and Air-Conditioning (HVAC) Systems in Buildings—An Overview. Int. J. Environ. Res. Public Health 2022, 19, 1016. [Google Scholar] [CrossRef]
  11. Fong, M.L.; Lin, Z.; Fong, K.F.; Hanby, V.; Greenough, R. Life cycle assessment for three ventilation methods. Build. Environ. 2017, 116, 73–88. [Google Scholar] [CrossRef]
  12. Kiamili, C.; Hollberg, A.; Habert, G. Detailed Assessment of Embodied Carbon of HVAC Systems for a New Office Building Based on BIM. Sustainability 2020, 12, 3372. [Google Scholar] [CrossRef]
  13. Kiani Mavi, R.; Gengatharen, D.; Kiani Mavi, N.; Hughes, R.; Campbell, A.; Yates, R. Sustainability in Construction Projects: A Systematic Literature Review. Sustainability 2021, 13, 1932. [Google Scholar] [CrossRef]
  14. OECD. Building Back Better: A Sustainable, Resilient Recovery after COVID-19. Available online: https://www.oecd.org/coronavirus/policy-responses/building-back-better-a-sustainable-resilient-recovery-after-covid-19-52b869f5/ (accessed on 8 September 2023).
  15. Megahed, N.A.; Ghoneim, E.M. Antivirus-built environment: Lessons learned from COVID-19 pandemic. Sustain. Cities Soc. 2020, 61, 102350. [Google Scholar] [CrossRef] [PubMed]
  16. Agarwal, N.; Meena, C.S.; Raj, B.P.; Saini, L.; Kumar, A.; Gopalakrishnan, N.; Kumar, A.; Balam, N.B.; Alam, T.; Kapoor, N.R.; et al. Indoor air quality improvement in COVID-19 pandemic: Review. Sustain. Cities Soc. 2021, 70, 102942. [Google Scholar] [CrossRef] [PubMed]
  17. Elsaid, A.M.; Ahmed, M.S. Indoor Air Quality Strategies for Air-Conditioning and Ventilation Systems with the Spread of the Global Coronavirus (COVID-19) Epidemic: Improvements and Recommendations. Environ. Res. 2021, 199, 111314. [Google Scholar] [CrossRef] [PubMed]
  18. Guo, Y.; Zhang, N.; Hu, T.; Wang, Z.; Zhang, Y. Optimization of energy efficiency and COVID-19 pandemic control in different indoor environments. Energy Build. 2022, 261, 111954. [Google Scholar] [CrossRef]
  19. Niu, R.P.; Chen, X.; Liu, H. Analysis of the impact of a fresh air system on the indoor environment in office buildings. Sustain. Cities Soc. 2022, 83, 103934. [Google Scholar] [CrossRef] [PubMed]
  20. Dai, H.; Zhao, B. Reducing airborne infection risk of COVID-19 by locating air cleaners at proper positions indoor: Analysis with a simple model. Build. Environ. 2022, 213, 108864. [Google Scholar] [CrossRef]
  21. Sun, C.; Zhai, Z. The efficacy of social distance and ventilation effectiveness in preventing COVID-19 transmission. Sustain. Cities Soc. 2020, 62, 102390. [Google Scholar] [CrossRef]
  22. Faulkner, C.A.; Castellini, J.E.; Lou, Y.; Zuo, W.; Lorenzetti, D.M.; Sohn, M.D. Tradeoffs among indoor air quality, financial costs, and CO2 emissions for HVAC operation strategies to mitigate indoor virus in U.S. office buildings. Build. Environ. 2022, 221, 109282. [Google Scholar] [CrossRef]
  23. Wargocki, P.; Wyon, D.P.; Sundell, J.; Clausen, G.; Fanger, P.O. The effects of outdoor air supply rate in an office on perceived air quality, sick building syndrome (SBS) symptoms and productivity. Indoor Air 2000, 10, 222–236. [Google Scholar] [CrossRef]
  24. Umishio, W.; Kagi, N.; Asaoka, R.; Hayashi, M.; Sawachi, T.; Ueno, T. Work productivity in the office and at home during the COVID-19 pandemic: A cross-sectional analysis of office workers in Japan. Indoor Air 2022, 32, e12913. [Google Scholar] [CrossRef]
  25. Rožman, M.; Peša, A.; Rajko, M.; Štrukelj, T. Building Organisational Sustainability during the COVID-19 Pandemic with an Inspiring Work Environment. Sustainability 2021, 13, 11747. [Google Scholar] [CrossRef]
  26. Ortiz, M.A.; Bluyssen, P.M. Profiling office workers based on their self-reported preferences of indoor environmental quality and psychosocial comfort at their workplace during COVID-19. Build. Environ. 2022, 211, 108742. [Google Scholar] [CrossRef]
  27. Justo Alonso, M.; Moazami, T.N.; Liu, P.; Jørgensen, R.B.; Mathisen, H.M. Assessing the indoor air quality and their predictor variable in 21 home offices during the COVID-19 pandemic in Norway. Build. Env. 2022, 225, 109580. [Google Scholar] [CrossRef]
  28. Yüksel, A.; Arıcı, M.; Krajčík, M.; Civan, M.; Karabay, H. Energy consumption, thermal comfort, and indoor air quality in mosques: Impact of COVID-19 measures. J. Clean. Prod. 2022, 354, 131726. [Google Scholar] [CrossRef]
  29. Ninyà, N.; Vallecillos, L.; Marcé, R.M.; Borrull, F. Evaluation of air quality in indoor and outdoor environments: Impact of anti-COVID-19 measures. Sci. Total Environ. 2022, 836, 155611. [Google Scholar] [CrossRef] [PubMed]
  30. Rožman, M.; Tominc, P.; Crnogaj, K. Healthy and Entrepreneurial Work Environment for Older Employees and Its Impact on Work Engagement during the COVID-19 Pandemic. Sustainability 2022, 14, 4545. [Google Scholar] [CrossRef]
  31. Liu, K.; Leng, J. Quantitative research on embodied carbon emissions in the design stage: A case study from an educational building in China. J. Asian Archit. Build. Eng. 2022, 21, 1182–1192. [Google Scholar] [CrossRef]
  32. Akbarnezhad, A.; Xiao, J. Estimation and Minimization of Embodied Carbon of Buildings: A Review. Buildings 2017, 7, 5. [Google Scholar] [CrossRef]
  33. Ahmed, N.; Abdel-Hamid, M.; Abd El-Razik, M.M.; El-Dash, K.M. Impact of sustainable design in the construction sector on climate change. Ain. Shams. Eng. J. 2021, 12, 1375–1383. [Google Scholar] [CrossRef]
  34. Embodied Carbon in Construction Materials: A Framework for Quantifying Data Quality in EPDs—Buildings & Cities. Available online: https://journal-buildingscities.org/articles/10.5334/bc.31 (accessed on 11 October 2023).
  35. CIBSE. Embodied Carbon in Building Services: A Calculation Methodology (TM65). Available online: https://www.cibse.org/knowledge-research/knowledge-portal/embodied-carbon-in-building-services-a-calculation-methodology-tm65 (accessed on 12 October 2023).
  36. MEP 2040. Available online: https://www.mep2040.org (accessed on 11 October 2023).
  37. CIBSE. TM65LA: Using the TM65 Methodology Outside the UK (PDF) (2022). Available online: https://www.cibse.org/knowledge-research/knowledge-portal/tm65la-using-the-tm65-methodology-outside-the-uk-pdf-2022 (accessed on 12 October 2023).
  38. WorldGBC. EU Policy Whole Life Carbon Roadmap for Buildings; WorldGBC: London, UK, 2022; Available online: https://viewer.ipaper.io/worldgbc/eu-roadmap/ (accessed on 12 October 2023).
  39. Ramboll Group. Which Life Cycle Assessment? Available online: https://www.ramboll.com/insights/decarbonise-for-net-zero/which-life-cycle-assessment (accessed on 12 October 2023).
  40. Climate Emergency Design Guide, leti. Available online: https://www.leti.uk/cedg (accessed on 12 October 2023).
  41. EQUA. IDA ICE—Simulation Software. Available online: https://www.equa.se/en/ida-ice (accessed on 11 September 2023).
  42. Hensher, D.A.; Wei, E.; Beck, M.J. The impact of COVID-19 and working from home on the workspace retained at the main location office space and the future use of satellite offices. Transp. Policy 2023, 130, 184–195. [Google Scholar] [CrossRef] [PubMed]
  43. Dhue, S. ‘Hybrid Work Is the New Normal, as Companies Rethink Work Habits and Office and Retail Space’, CNBC. Available online: https://www.cnbc.com/2023/07/13/hybrid-work-is-new-normal-as-companies-rethink-work-habits-spaces.html (accessed on 12 October 2023).
  44. McKinsey. The Rebirth of Workspace Design. Available online: https://www.mckinsey.com/industries/real-estate/our-insights/the-rebirth-of-workspace-design-an-interview-with-gensler-co-ceo-diane-hoskins (accessed on 12 October 2023).
  45. Oladiran, O.; Hallam, P.; Elliott, L. The COVID-19 Pandemic and Office Space Demand Dynamics. Int. J. Strateg. Prop. Manag. 2023, 27, 35–49. [Google Scholar] [CrossRef]
  46. Cao, G.; Awbi, H.; Yao, R.; Fan, Y.; Sirén, K.; Kosonen, R.; Zhang, J. A review of the performance of different ventilation and airflow distribution systems in buildings. Build. Environ. 2014, 73, 171–186. [Google Scholar] [CrossRef]
  47. SS-EN 16798-1:2019; Energy Performance of Buildings—Ventilation for Buildings—Part 1: Input Parameters for Indoor Environment for Design and Determination of Energy Performance of Buildings Regarding Air Quality, Thermal Climate, Lighting and Acoustics—Module M1-6. Svenska Institutet för Standarder: Stockholm, Sweden, 2019.
  48. SS-EN 15978:2011; Sustainability of Construction Works—Assessment of Environmental Performance of Buildings—Calculation Method. Svenska Institutet för Standarder: Stockholm, Sweden, 2011.
  49. CIBSE. TM56: Resource Efficiency of Building Services. Available online: https://www.cibse.org/knowledge-research/knowledge-portal/tm56-resource-efficiency-of-building-services (accessed on 16 October 2023).
  50. Georges, L.; Thalfeldt, M.; Skreiberg, Ø.; Fornari, W. Validation of a transient zonal model to predict the detailed indoor thermal environment: Case of electric radiators and wood stoves. Build. Environ. 2019, 149, 169–181. [Google Scholar] [CrossRef]
  51. Vand, B. Influence of Demand Response Actions on Thermal Comfort and Electricity Cost for Residential Houses; Aalto University: Esbo, Finland, 2018; ISBN 978-952-60-8112-0. [Google Scholar]
  52. Djunaedy, E.; van den Wymelenberg, K.; Acker, B.; Thimmana, H. Oversizing of HVAC system: Signatures and penalties. Energy Build. 2011, 43, 468–475. [Google Scholar] [CrossRef]
  53. Sun, Y.; Gu, L.; Wu, C.F.J.; Augenbroe, G. Exploring HVAC system sizing under uncertainty. Energy Build. 2014, 81, 243–252. [Google Scholar] [CrossRef]
Figure 1. Bibliometric: Web of Science_COVID19_working environment.
Buildings 13 03110 g001
Figure 2. Bibliometric: Scopus_COVID19_building_indoor built environment.
Buildings 13 03110 g002
Figure 3. Brief benchmark overview in the field of MEP, HVAC, and building service system in One click LCA tool.
Buildings 13 03110 g003
Figure 4. Models of two occupancy densities in IDA ICE.
Buildings 13 03110 g004
Figure 5. Schematic design of the ceiling supply and ceiling return ventilation approach.
Buildings 13 03110 g005
Figure 6. Schematic design of the ceiling supply and floor return ventilation approach.
Buildings 13 03110 g006
Figure 7. Illustration of the three studied occupant positions in climate (with stratification) zone model.
Buildings 13 03110 g007
Figure 8. Operative temperature distribution comparison at a typical winder time (@09:26 2 Feb).
Buildings 13 03110 g008
Figure 9. Air velocity distribution comparison at a typical winder time (@09:26 2 Feb).
Buildings 13 03110 g009
Figure 10. Air velocity distribution comparison with the desk height cutting plan at a typical winder time (@09:26 2 Feb).
Buildings 13 03110 g010
Figure 11. Associated ESG analysis and its recommendations for Social and Governance excellence.
Buildings 13 03110 g011
Table 1. Searching strings in two main databases.
YearDatabaseSearch Strings
2019–2023Scopus
(All Fields)
Keyword no. 1: COVID/COVID19/COVID 19/covid
Keyword no. 2: healthy/ieq/built & environment/indoor AND air & quality
Web of
Science
(All Fields)
Keyword no. 3: public & space/building
Searching period: “>2017” and “<2023”
Table 2. Summary of inputs for zone energy and ventilation calculation.
Case No.1a1b2a2b
Area (m2)226226226226
No. of occupants a24282428
Lighting load10 Watt/m2 bWatts2260226022602260
Equipment load75 Watt/person bWatts1800210018002100
Fresh air7.5 L/s per person bL/s180210180210
Supply diffusersNo. of diffusers 9999
Airflow/diffuserL/s20232023
Specific supply airflow rateL/s per m20.80.930.80.93
Return diffusersNo. of diffusers 8888
Airflow/diffuserL/s23262326
All diffusersK factor17.617.617.617.6
Calculated heating load kW8.3228.7648.3228.764
RadiatorSelectedWatts5 × 18005 × 18005 × 18005 × 1800
Calculated cooling load kW2.3772.52.3772.5
Chilled beamSelectedWatts3 × 8003 × 8303 × 8003 × 830
Note: a Assumptions of occupant are 1.0 MET (corresponding to 58.2 W per m2 body surface), constant 0.85 ± 0.25 CLO (1 clo. equals a heating resistance of 0.155 m2 K/W); b input assumptions are made in accordance with SVEBY, Brukarindata bostäder, 2012.
Table 3. Summary of overall performance results.
Case No.1a 11b 22a 32b 4
System Energy (kWh)Zone heating15,597.415,207.515,580.715,164.0
Zone cooling35.541.135.441.0
AHU heating1035.71199.51035.71199.8
AHU cooling345.9402.5346.1402.6
Cooling381.4443.6381.5443.6
Primary energy of cooling 5457.7532.3457.8532.3
Heating16,633.116,407.016,616.416,363.8
Primary energy of heating 68316.68203.58308.28181.9
Thermal comfort EN16798-1 (h)I, high541.0598.0544.0595.0
II, medium1697.01790.01690.01768.0
III, moderate2004.02005.02004.02005.0
IV, low2008.02008.02008.02008.0
IAQDuration 7, h622.0475.0622.0475.0
CO2, ppm528.1519.7528.1519.7
Note—1: Mixed ventilation with 24 occupants; 2: Mixed ventilation with 28 occupants; 3: Displacement ventilation with 24 occupants; 4: Displacement ventilation with 28 occupants; 5: Weight factor of electricity is 1.2; 6: Weight factor of district heating is 0.5; 7: Duration of the occupied working time when the air age is above 2 h.
Table 4. Thermal comfort variables of representative occupants in a landscape office setting.
1a1b2a2b
Air tem. (°C)sum.1 m23.823.823.823.9
2.5 m24.124.124.024.2
win.1 m21.221.221.221.2
2.5 m21.421.421.421.5
PPD (%)sum.Occ. 15.55.3 2.85.4
Occ. 155.25.4 2.65.2
Occ. 24/285.15.32.75.2
win.Occ. 17.22.82.88.0
Occ. 156.62.62.67.7
Occ. 24/287.02.72.77.6
PMV (10−1)sum.Occ. 1−0.2−0.20.1−0.2
Occ. 15−0.2−0.20.1−0.2
Occ. 24/28−0.2−0.20.1−0.2
win.Occ. 1−0.30.10.1−0.4
Occ. 15−0.30.10.1−0.3
Occ. 24/28−0.30.10.1−0.3
CO2 fra. (PPD)sum.1 m93793914915
2.5 m952948926930
win.1 m938938917917
2.5 m947945925928
Table 5. Global Warming Potential (GWP) results for studied cases with regard to whole life cycle.
Case Embodied Carbon ComponentsDescriptionUnitQtyAmount (kg/kWh)Embedded Carbon Savings (kg-CO2)
1aConventional Mixed-Mode Ventilation SystemDuctwork, D: 315 mmm246723.73−1122.00
Insulation for ductsm248299.73
Supply air terminalsNo.933.30
Return air terminals No.829.60
Associated System
Energy
Heating energykWh 16,633.10
Cooling energykWh 381.40
Total GWP (kg CO2e)172,696−0.65%
1bConventional Mixed-Mode Ventilation SystemDuctworkm246723.73Baseline
Insulations for ductsm248299.73
Supply air terminalsNo.933.30
Return air terminals No.829.60
Associated System
Energy
Heating energykWh 16,407.00
Cooling energykWh 443.60
Total GWP (kg CO2e)173,818
2aDisplacement Ventilation SystemDuctworkm251.5810.27−2471.00
Insulations for ductsm253330.96
Supply air terminalsNo.933.30
Return air terminalsNo.829.60
Associated System
Energy
Heating energykWh 16,616.40
Cooling energykWh 381.50
Total GWP (kg CO2e)171,347−1.42%
2bDisplacement VentilationDuctworkm251.5810.27−1587.00
Insulations for ductsm253330.96
Supply air terminalsNo.933.30
Return air terminals No.829.60
Associated System
Energy
Heating energykWh 16,363.80
Cooling energykWh 443.60
Total GWP (kg CO2e)172,231−0.91%
Table 6. Comparative analysis of the materials used in mechanical ventilation systems with regard to upfront carbon.
CaseMaterialsQuantityGPW 1CommentTransportation (km)Service Life (yr)EOL
1a/1bVentilation ducting, per m linear, D: 315 mm723.70kg37.82 Galvanized steel sheet 70.00 2255
Air diffuser unit with active supply61.40kg6.81 Supply air70.00 2255
Circular duct fan R-3151.00un.16.5 70.00 2255
Circular airflow damper2.00kg4.43 70.00 2255
Rooftop exhaust fan, max flowrate: 1000 m3/h1.00un.169.23 70.00 2255
Hot-dip galvanized steel sheets, thickness range: 0.4–3.0 mm1.52 m2 × 0.5 mm2.78 Duct size of 160 mm to 250 mm110.00 3506
Hot-dip galvanized steel sheets, thickness range: 0.4–3.0 mm0.78 m2 × 0.55 mm2.78 Duct size of 315 mm110.00 3506
Glass wool insulation, aluminum-faced, L = 0.036 W/mK, R = 1.389 m2 K/W, 50 mm, 1.849 kg/m2 (1.716 kg of wool + 0.133 kg of aluminum)56.00m23.1 Duct insulation70.00 2507
Ventilation exhaust box, single flow, 6.25 kg/unit, 250 m3/h1.00un.34.29 Return air70.00 2255
Square ceiling diffuser, Ø125–400, 3.79 kg/unit17.00un.18.4 Both supply and return70.00 2255
Rock wool insulation for HVAC pipe sections and bends, unfaced, L = 0.033 W/mK, R = 1 m2 K/W, 33 mm, 1 kg/m2, 30.3 kg/m3 48 m2 × 40 mm1.34 70.00 4507
2a/2bVentilation ducting, per m linear, D: 315 mm810.30kg37.82 Galvanized steel sheet 70.00 2255
Air diffuser unit with active supply61.40kg6.81 Supply air70.00 2255
Circular duct fan R-3151.00un.16.5 70.00 2255
Circular airflow damper2.00kg4.43 70.00 2255
Rooftop exhaust fan, max flowrate: 1000 m3/h1.00un.169.23 70.00 2255
Hot-dip galvanized steel sheets, thickness range: 0.4–3.0 mm1.52 m2 × 0.5 mm2.78 Duct size of 160 mm to 250 mm110.00 3506
Hot-dip galvanized steel sheets, thickness range: 0.4–3.0 mm0.78 m2 × 0.55 mm2.78Duct size of 315 mm110.00 3506
Glass wool insulation, aluminum-faced, L = 0.036 W/mK, R = 1.389 m2 K/W, 50 mm, 1.849 kg/m2 (1.716 kg of wool + 0.133 kg of aluminum)56.00m23.1 Duct insulation70.00 4507
Ventilation exhaust box, single flow, 6.25 kg/unit, 250 m3/h1.00un.34.29Return air70.00 2255
Square ceiling diffuser, Ø125–400, 3.79 kg/unit17.00un.18.4 Both supply and return70.00 2255
Rock wool insulation for HVAC pipe sections and bends, unfaced, L = 0.033 W/mK, R = 1 m2 K/W, 33 mm, 1 kg/m2, 30.3 kg/m3 53 m2 × 40 mm1.34 70.00 4507
Note—1: GWP results (A1–A3) before local compensation in units of kg CO2e/m, kg CO2e/kg, or kg CO2e/unit; 2: Large delivery truck, 9-ton capacity; 3: Trailer combination, 40-ton capacity; 4: Large delivery truck, 40-ton capacity; 5: Metal-containing product recycling (90% metal); 6: Steel recycling; 7: Landfilling (for inert material).
Disclaimer/Publisher’s Note: The statements, opinions and data contained in all publications are solely those of the individual author(s) and contributor(s) and not of MDPI and/or the editor(s). MDPI and/or the editor(s) disclaim responsibility for any injury to people or property resulting from any ideas, methods, instructions or products referred to in the content.

