
Performance of Geopolymer Mortar Containing PVC Plastic Waste from Bottle Labels at Normal and Elevated Temperatures
 , and
, and
Abstract
:1. Introduction
2. Materials and Methods
2.1. Materials
2.2. Mix Proportion
2.3. Testing
2.3.1. Fresh Properties
2.3.2. Physical Properties
2.3.3. Mechanical Properties
2.3.4. Fire Resistivity
2.3.5. Scanning Electron Microscope (SEM)
3. Results and Discussion
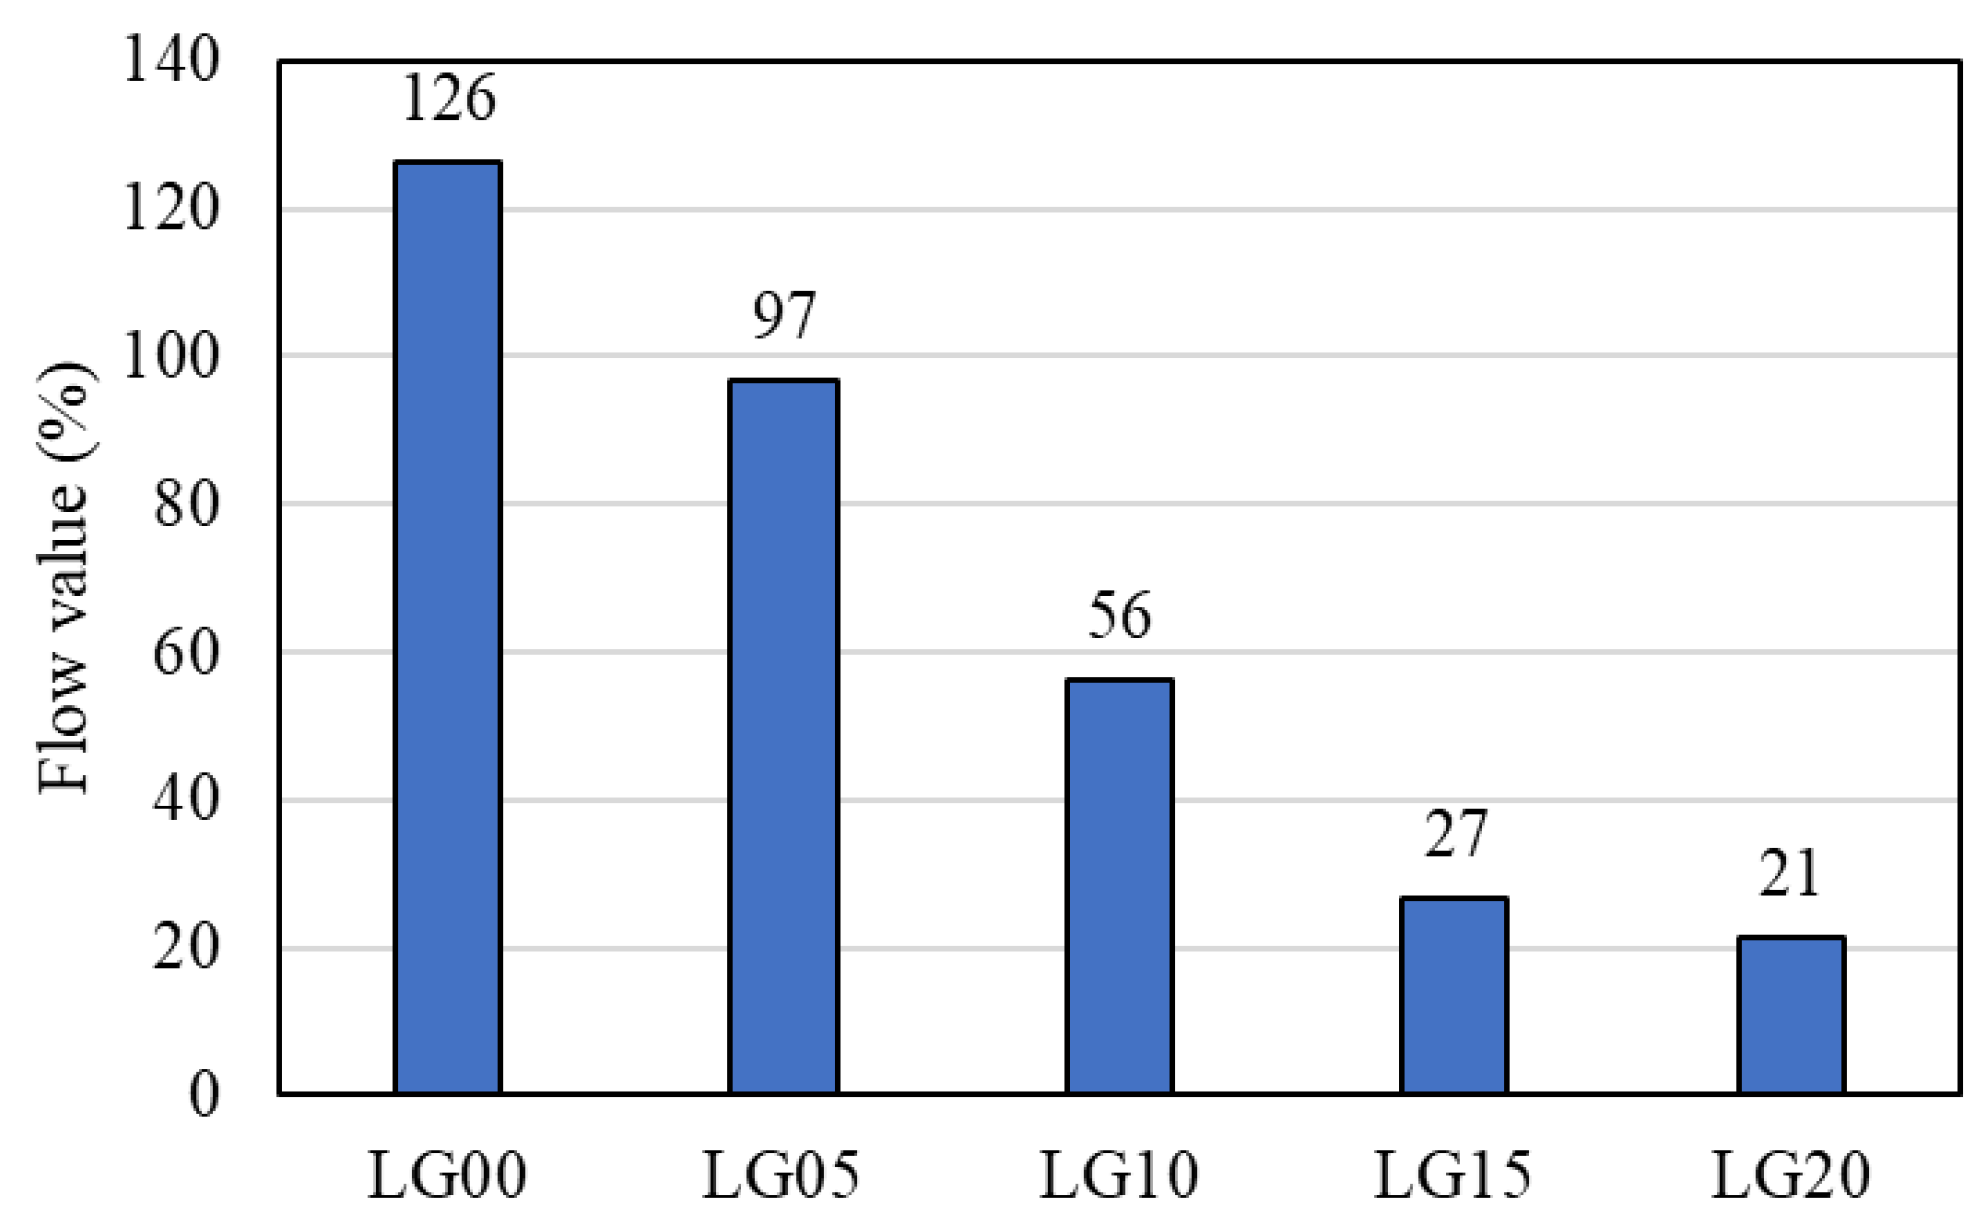
3.1. Flow Value
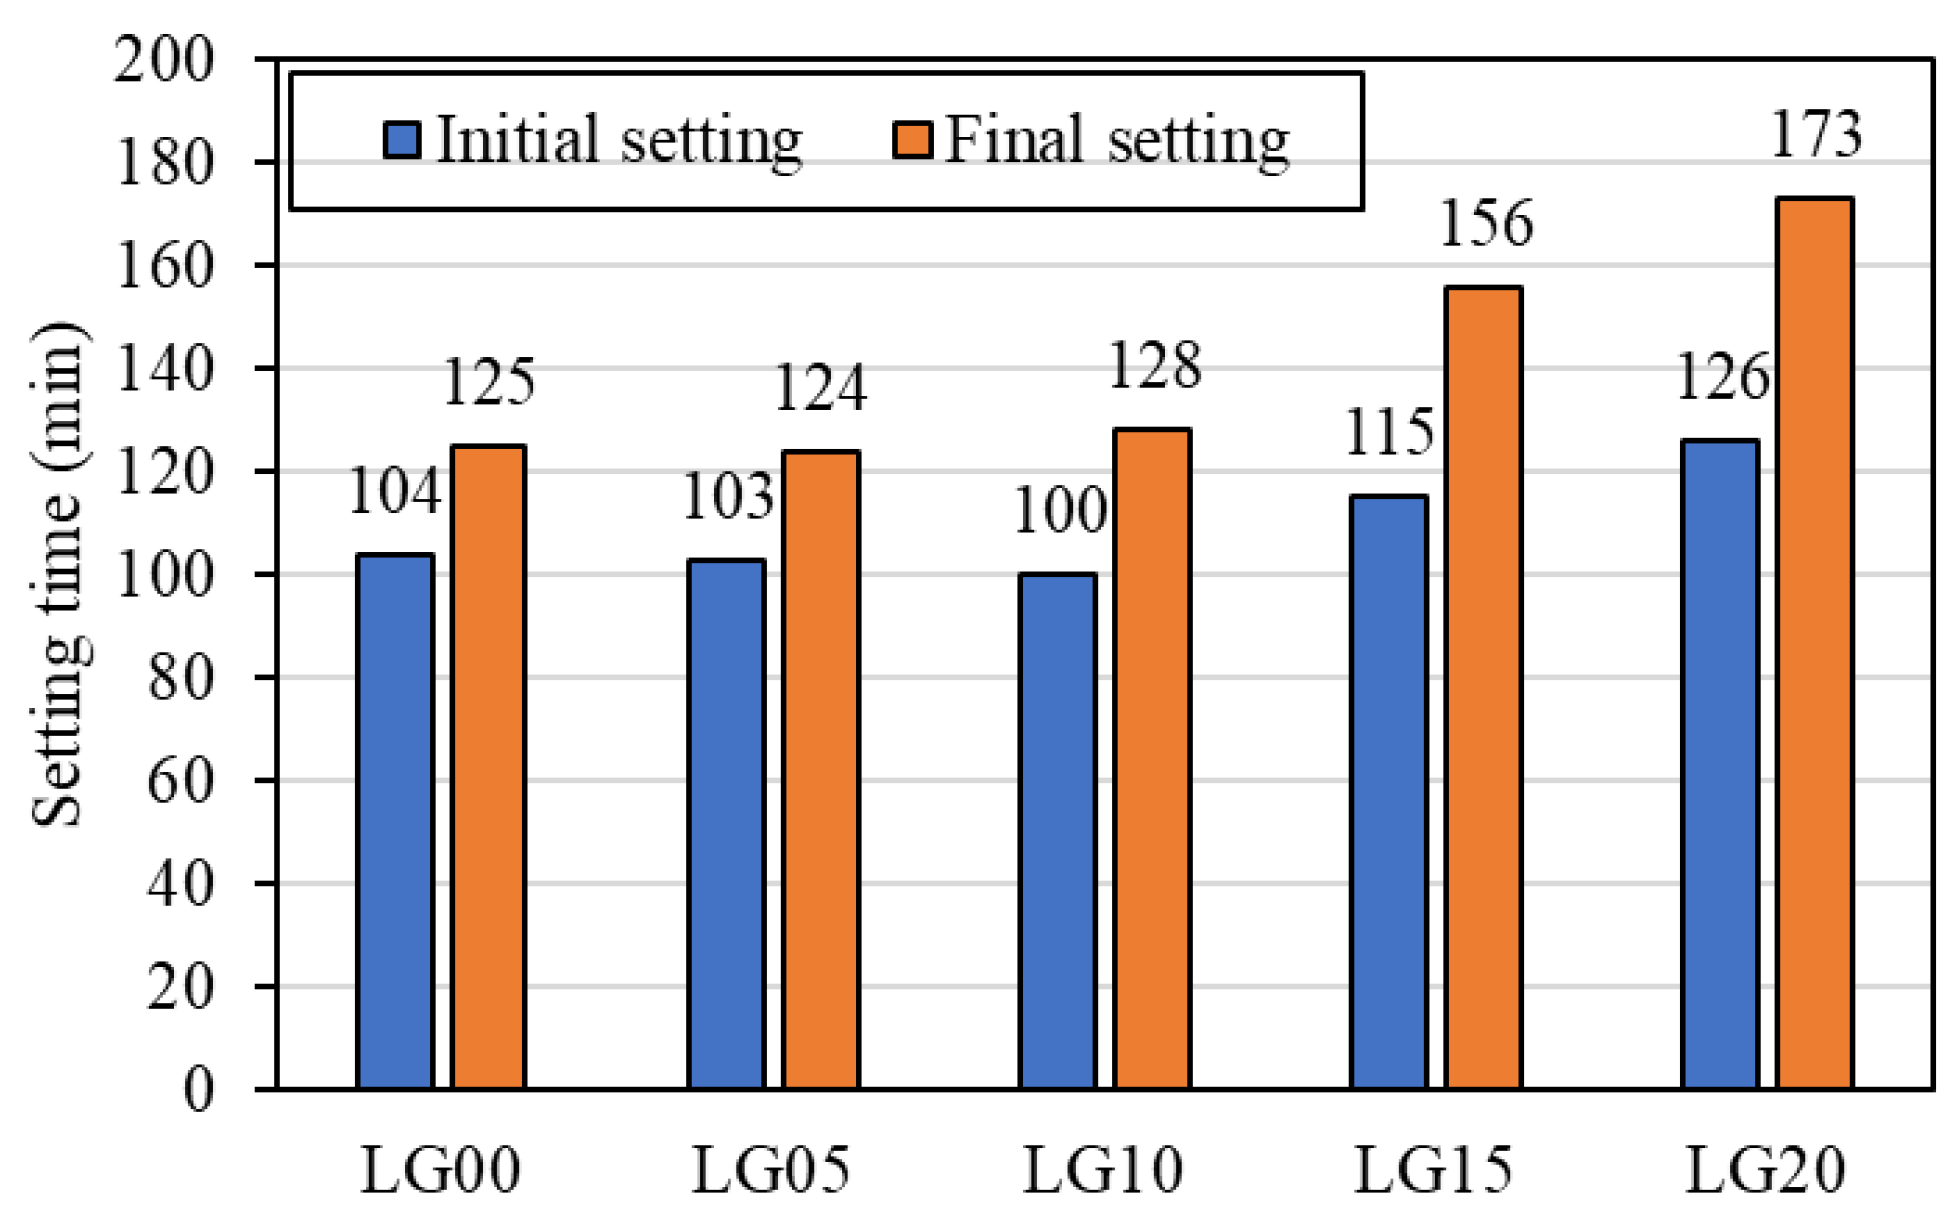
3.2. Setting Time
3.3. Dry Density, Porosity, Water Absorption, and Ultrasonic Pulse Velocity
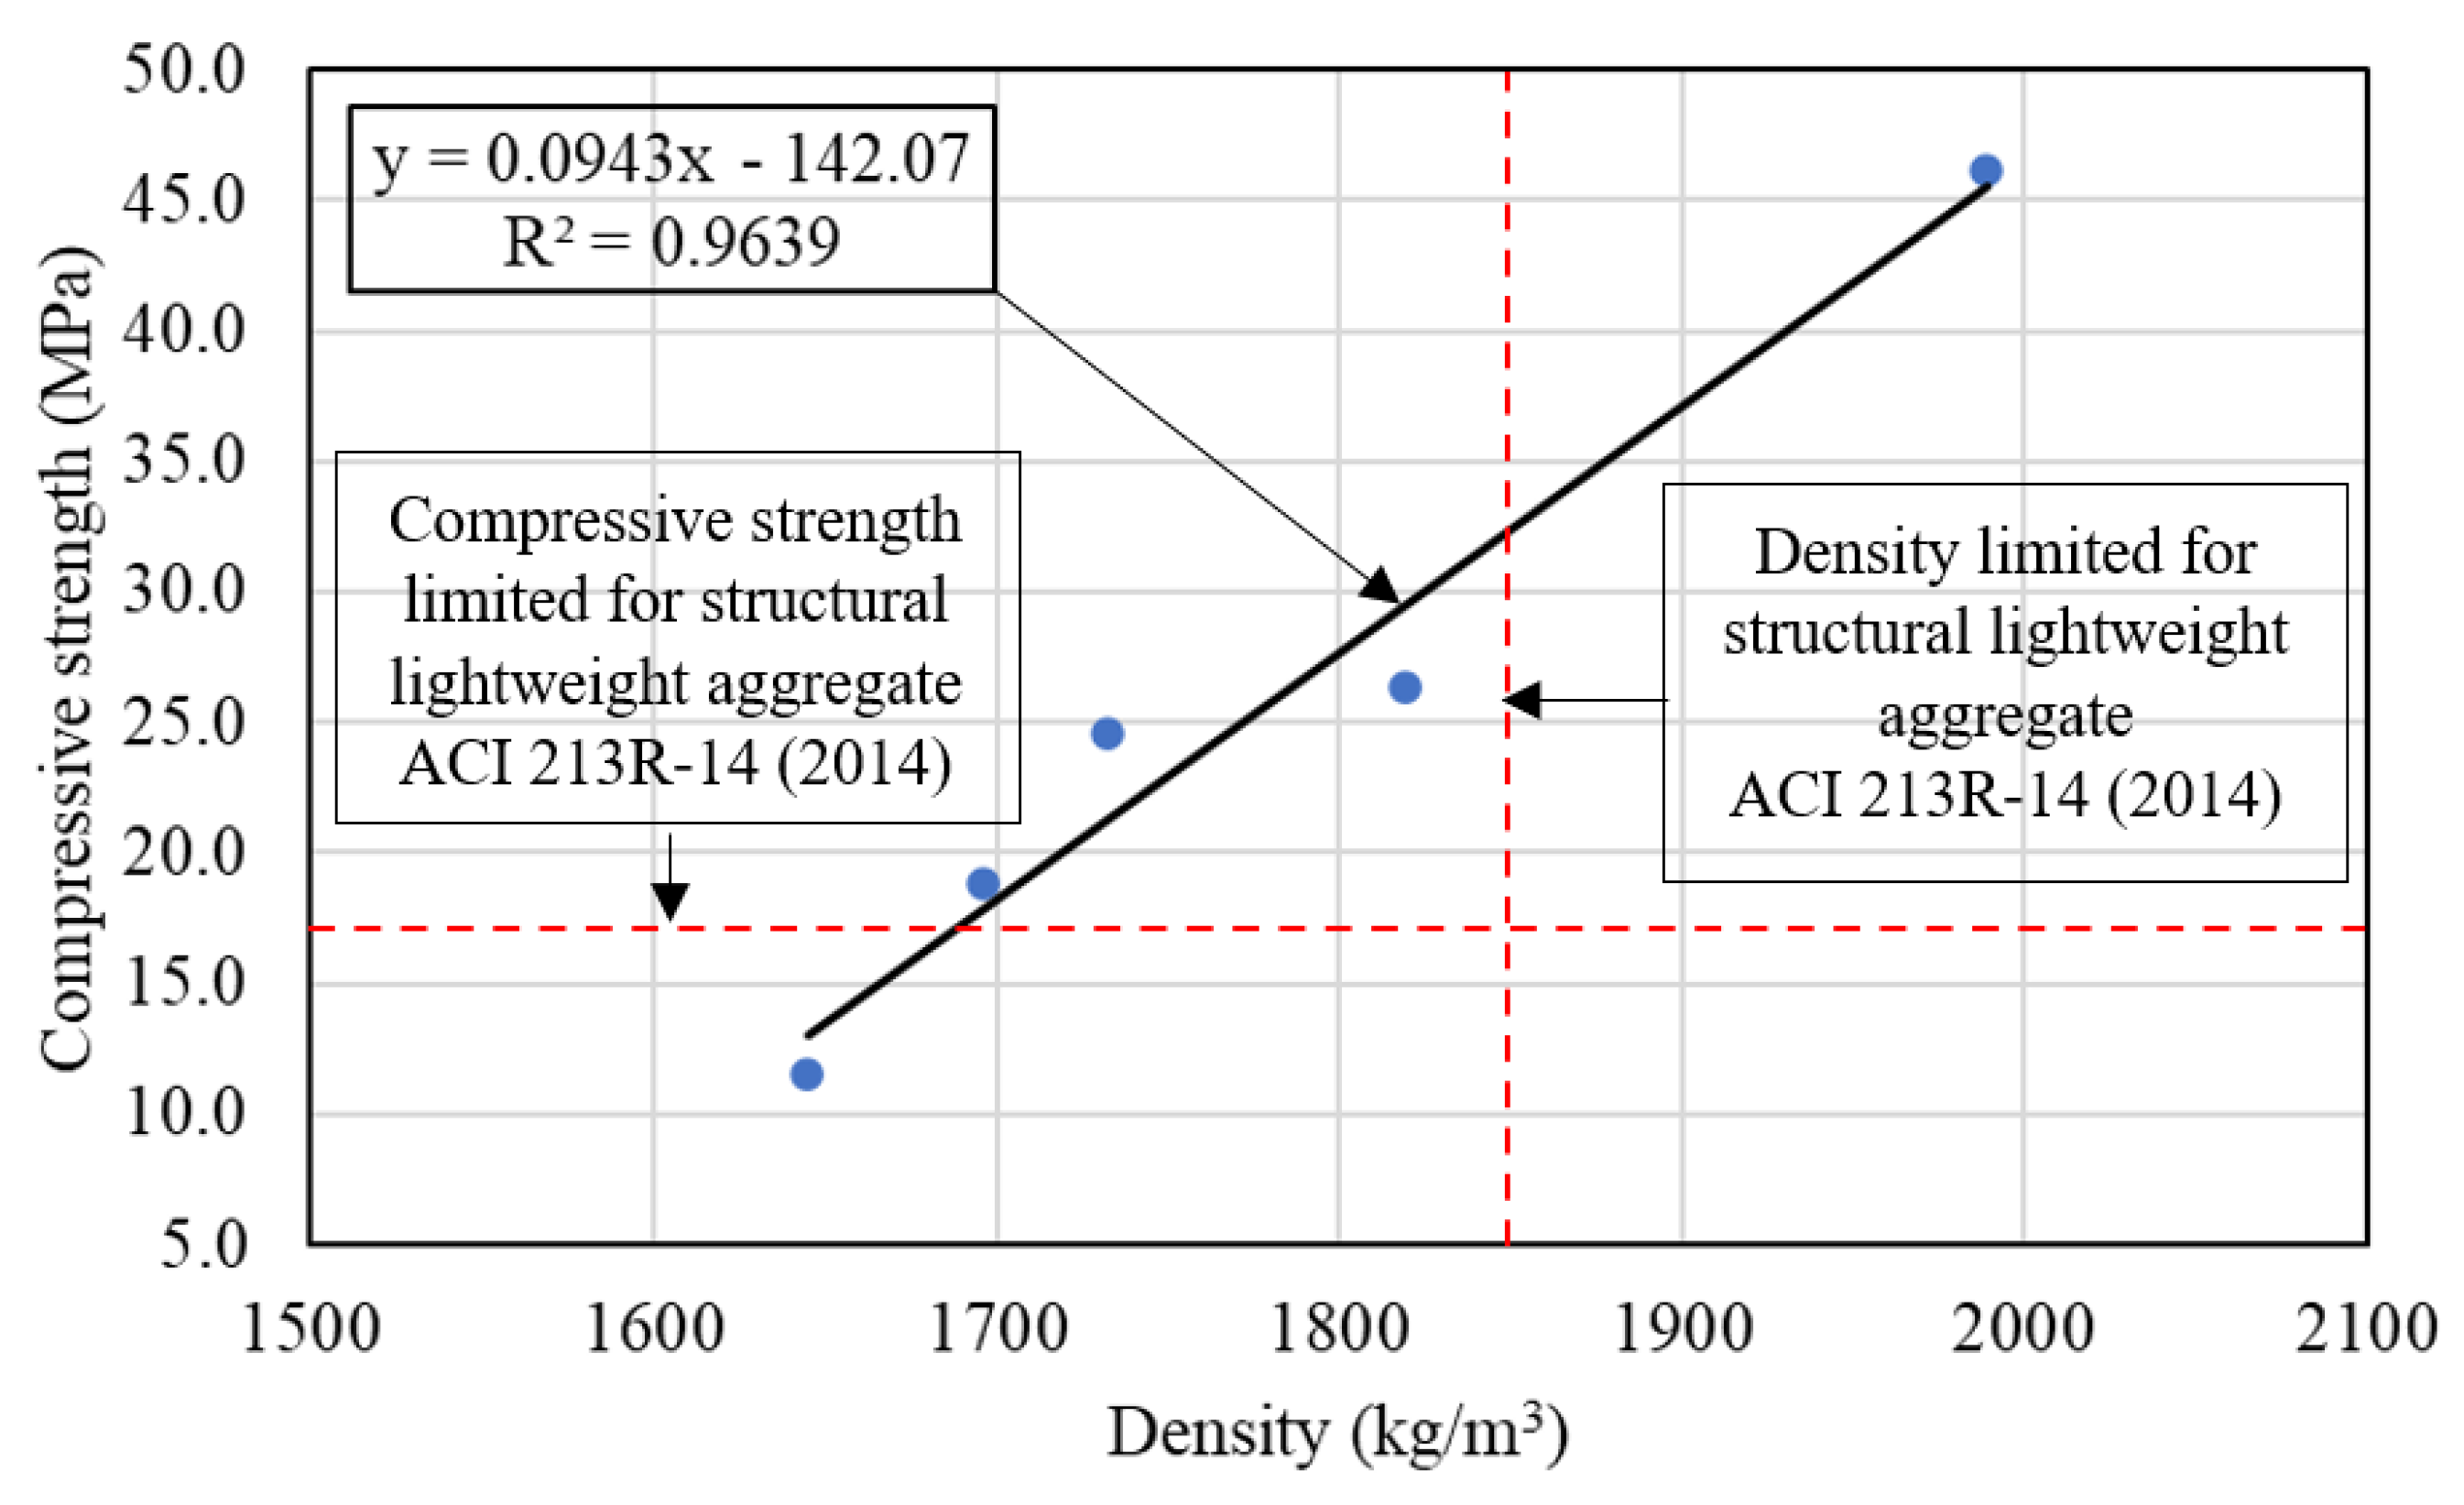
3.4. Compressive, Flexural, and Splitting Tensile Strengths
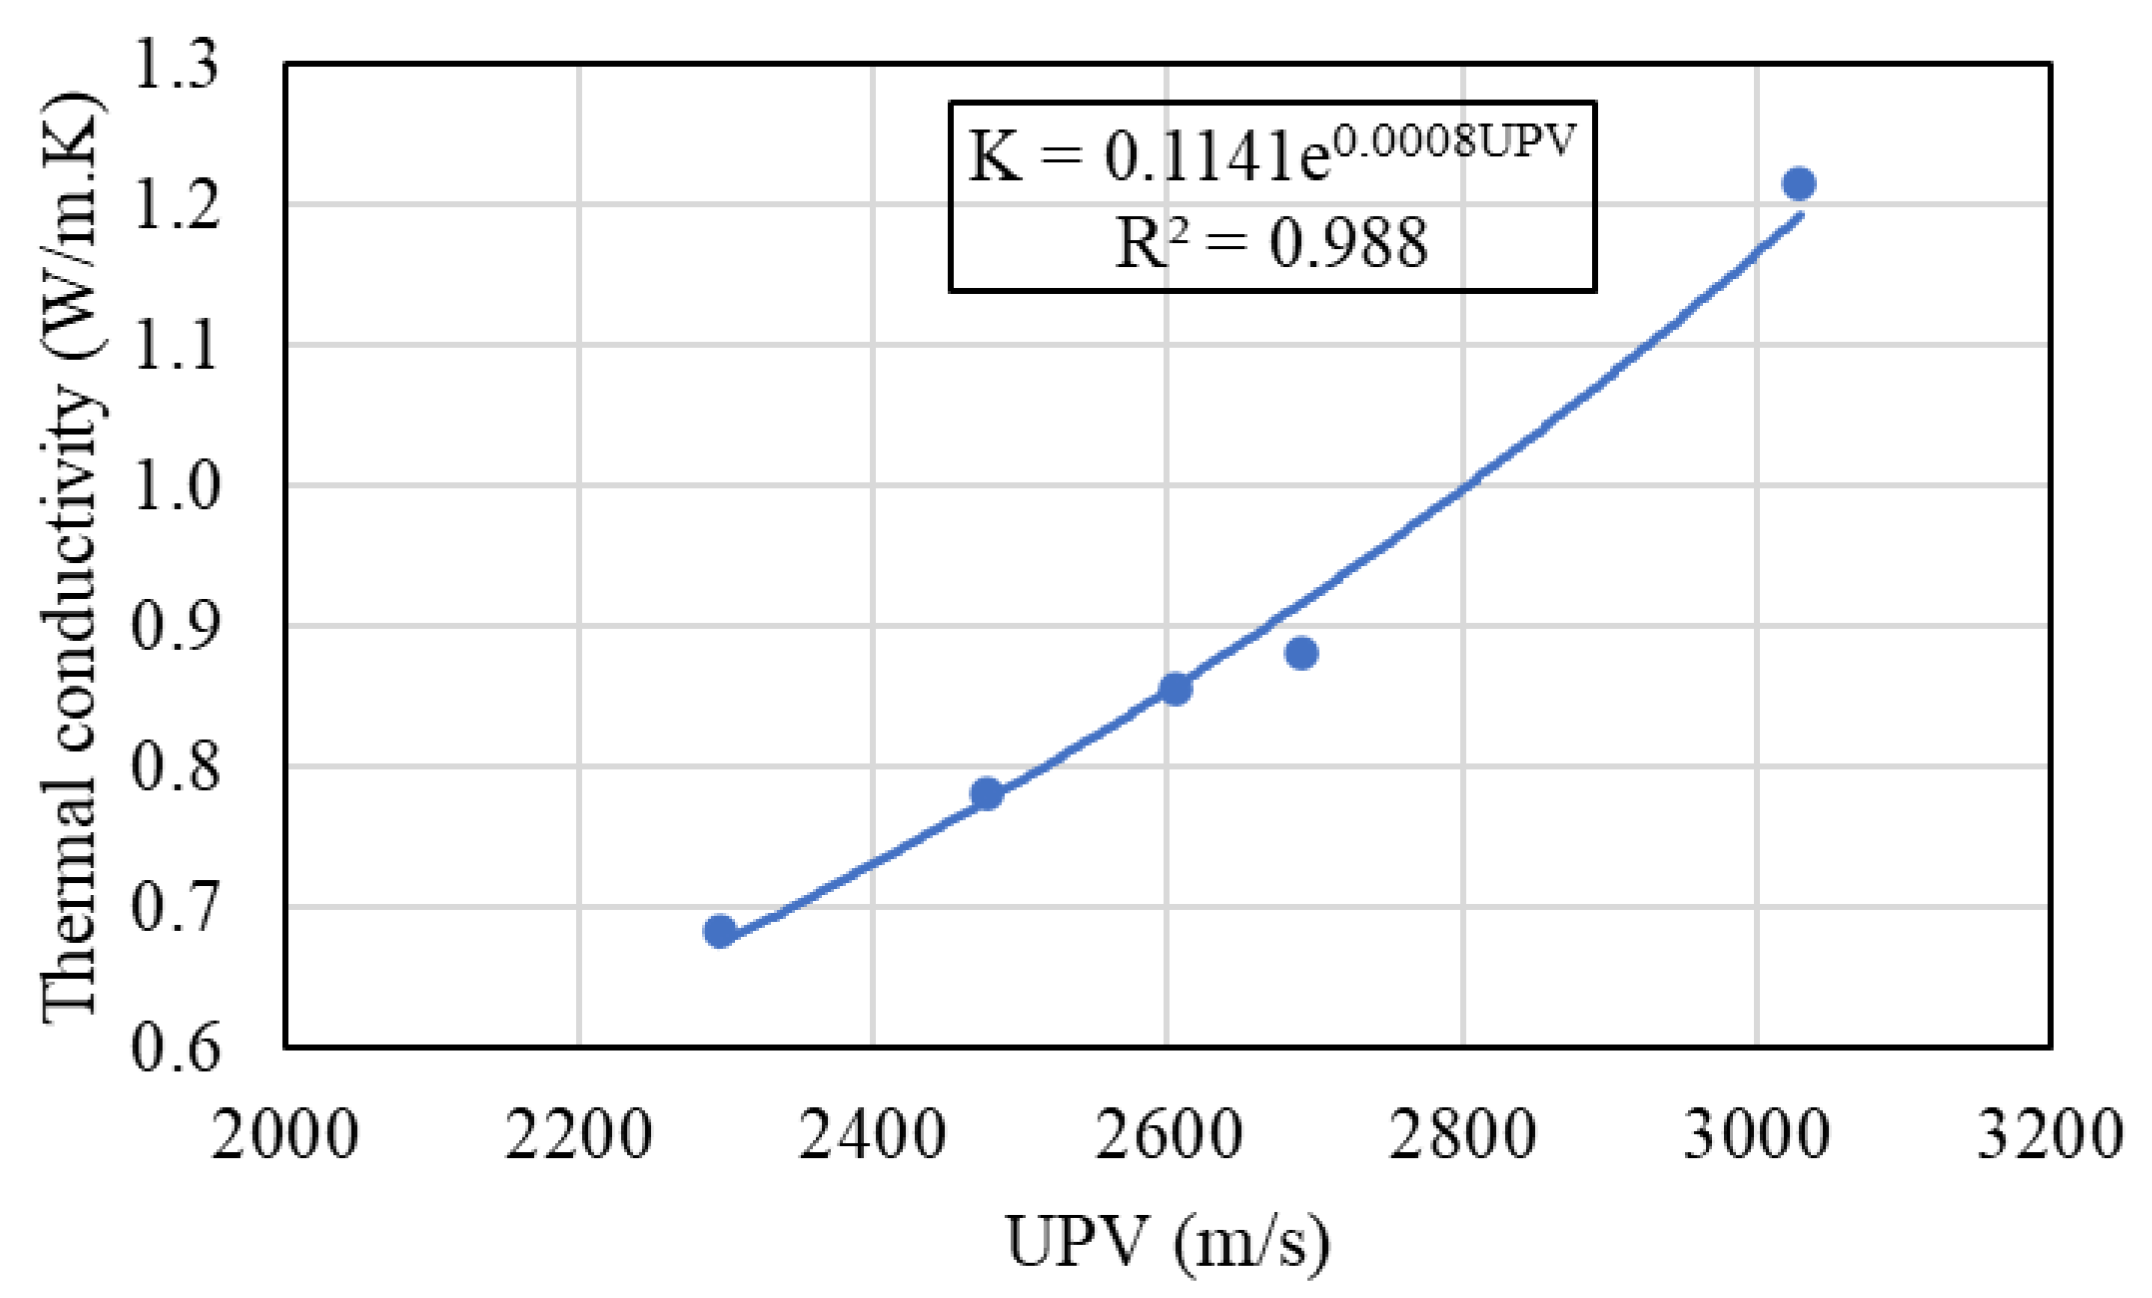
3.5. Thermal Conductivity
3.6. Fire Resistance
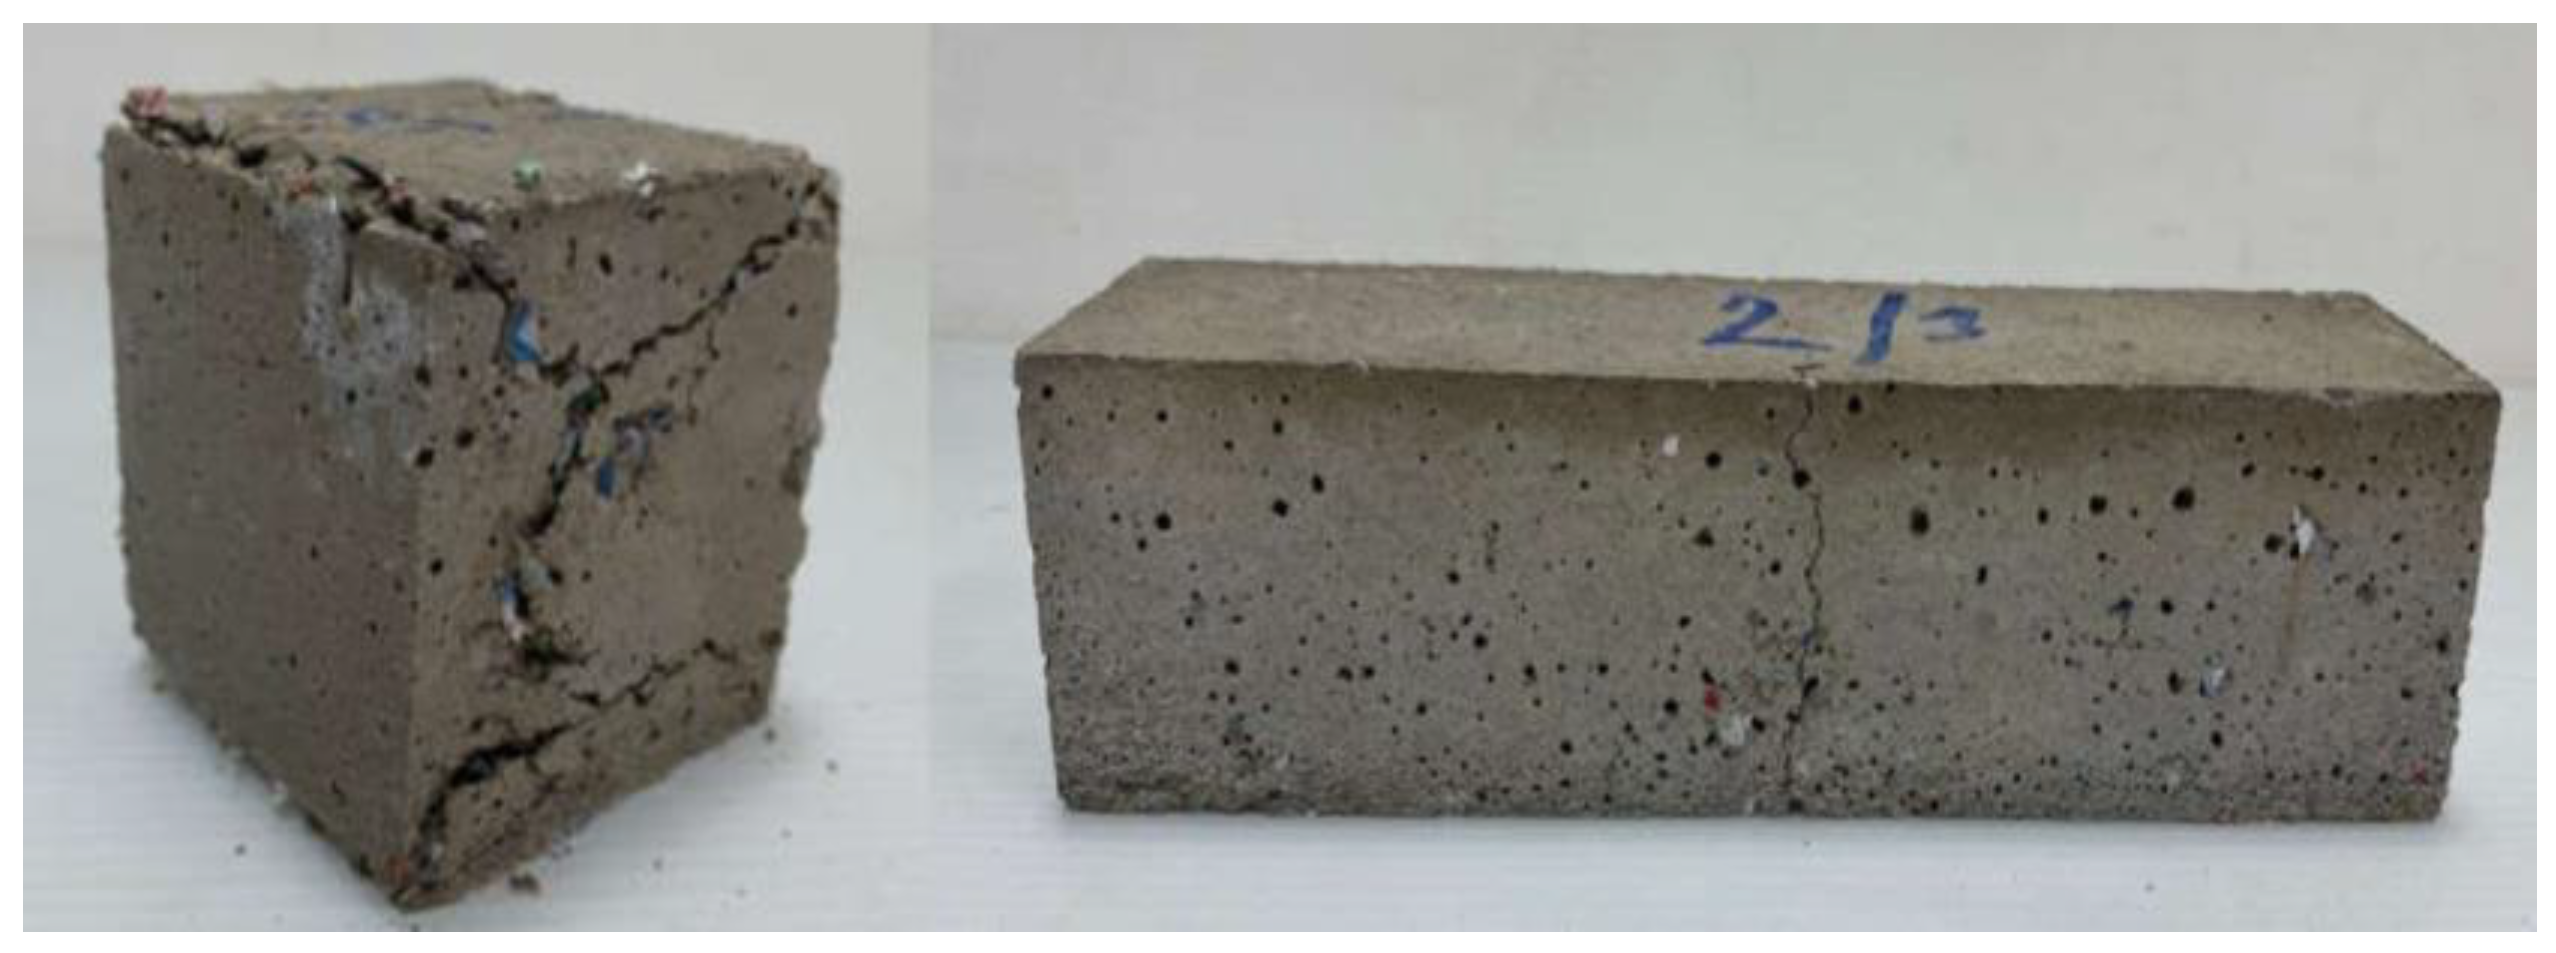
3.6.1. Visual Observation
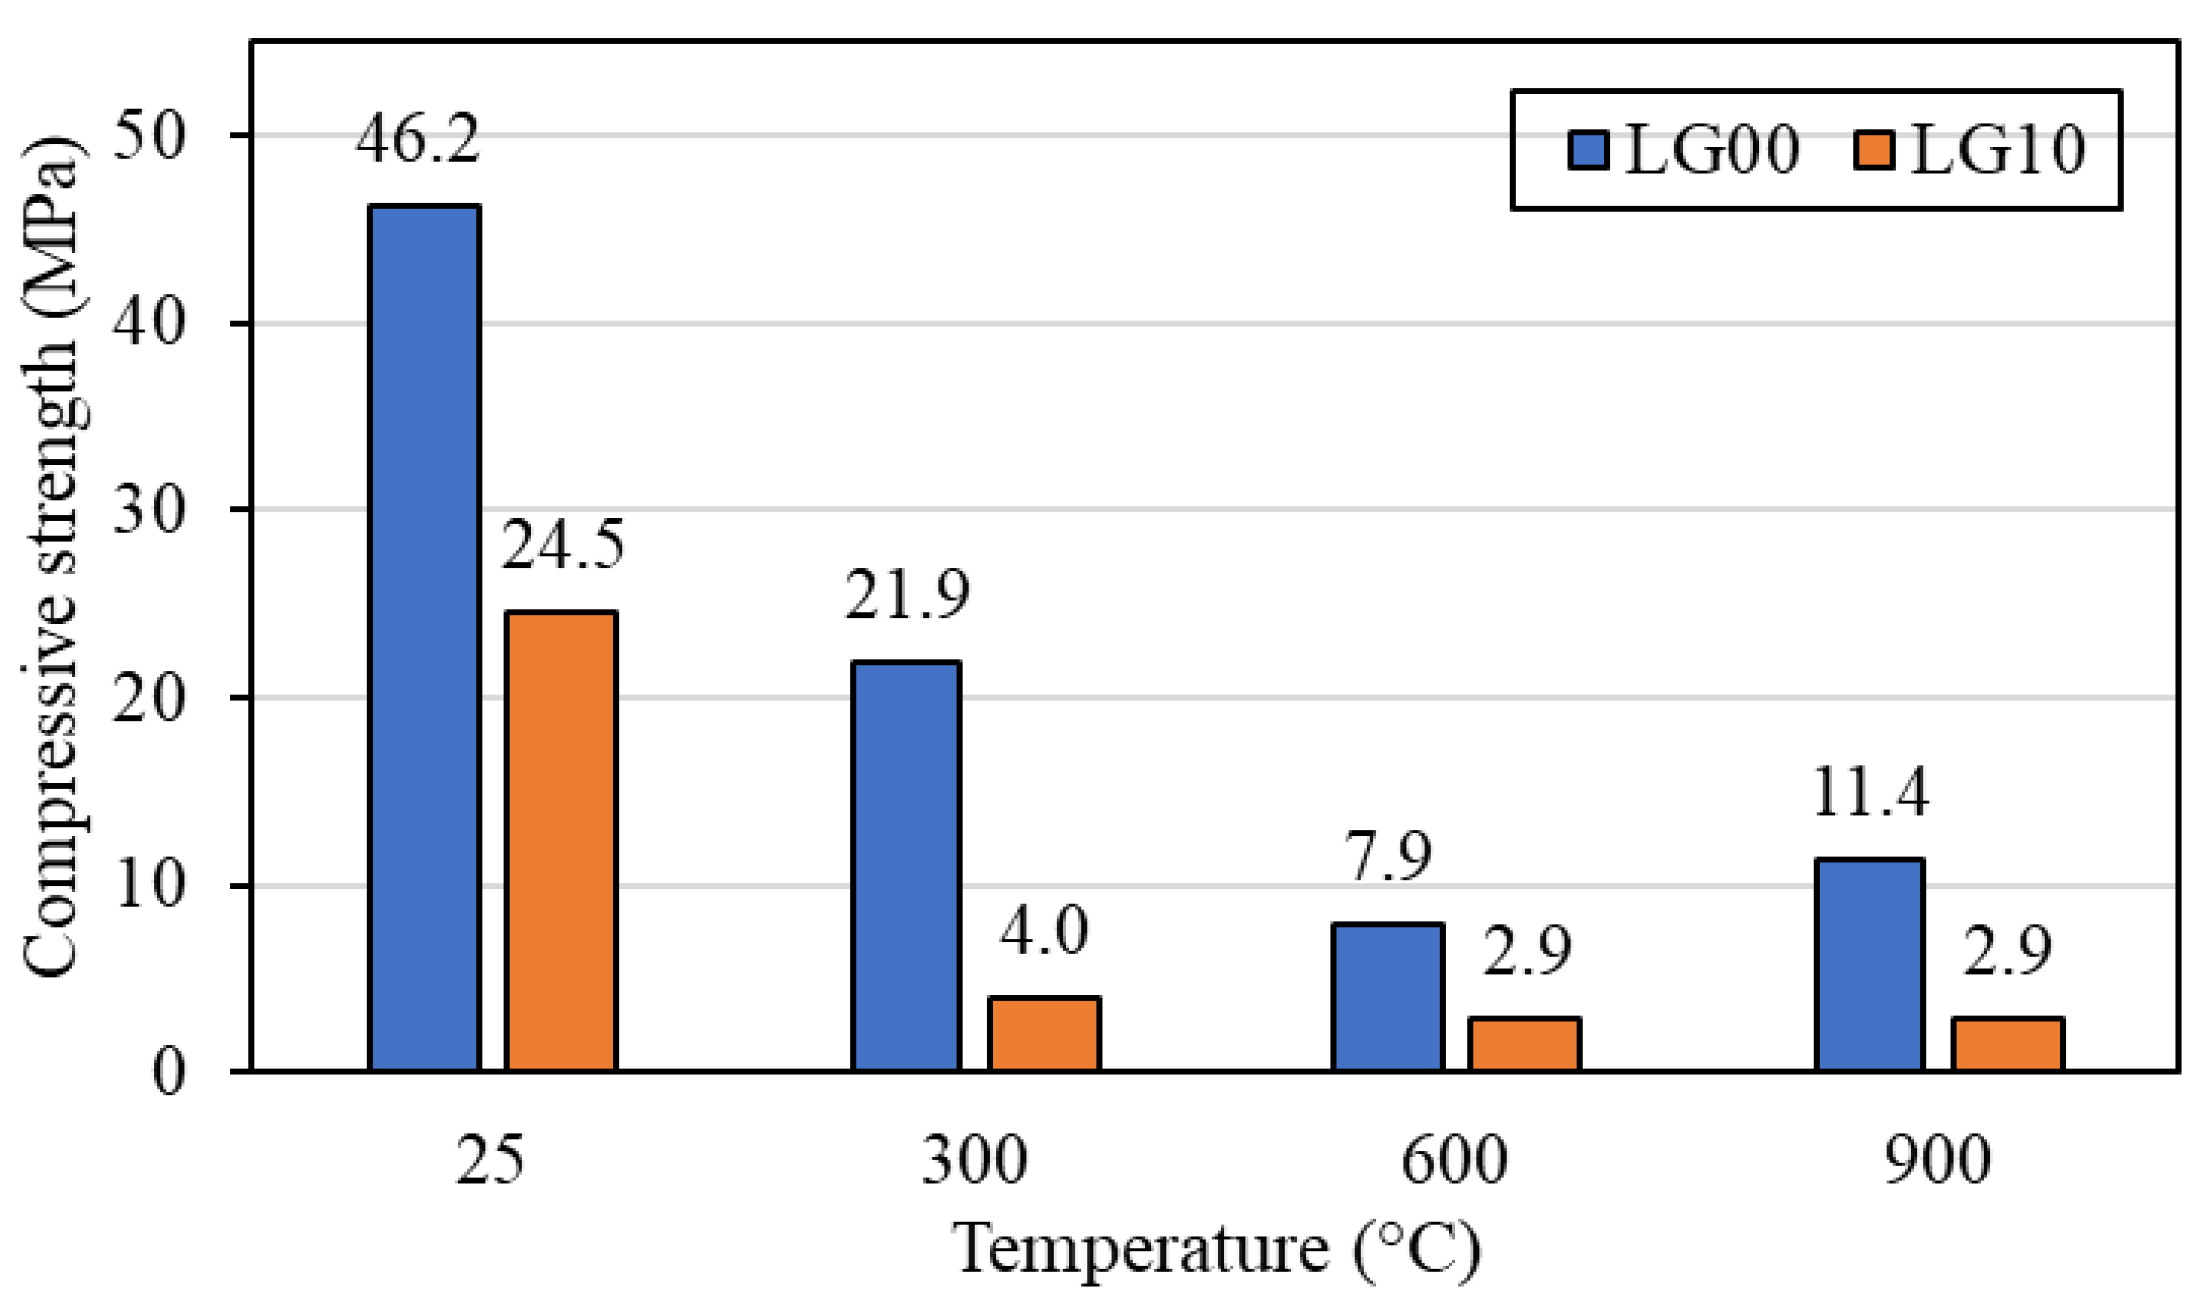
3.6.2. Compressive Strength
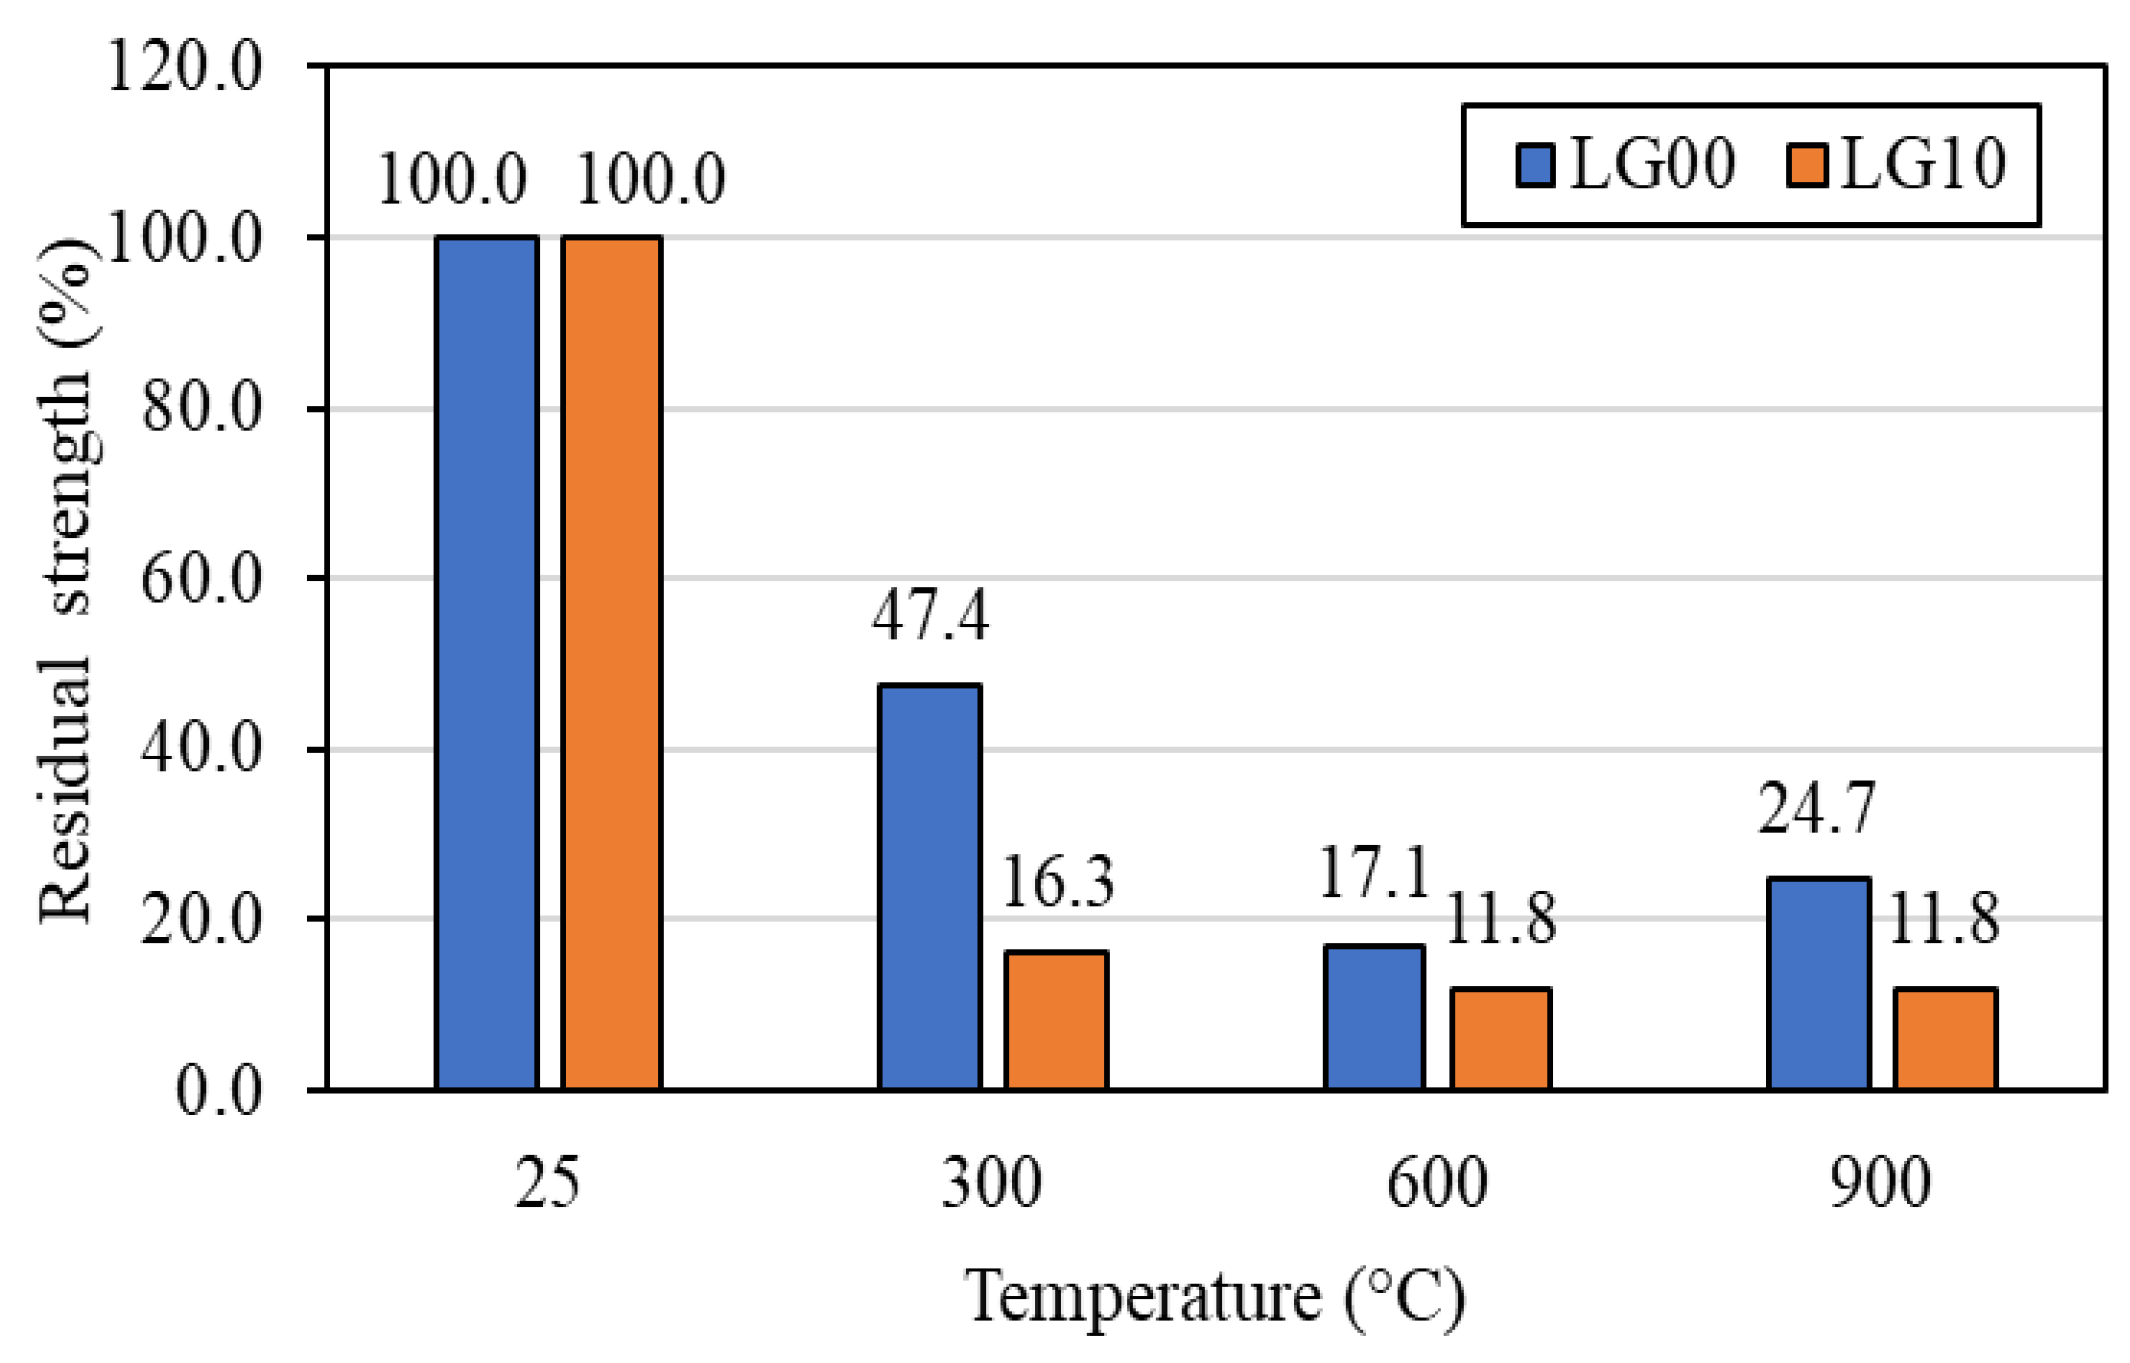
3.6.3. Residual Compressive Strength
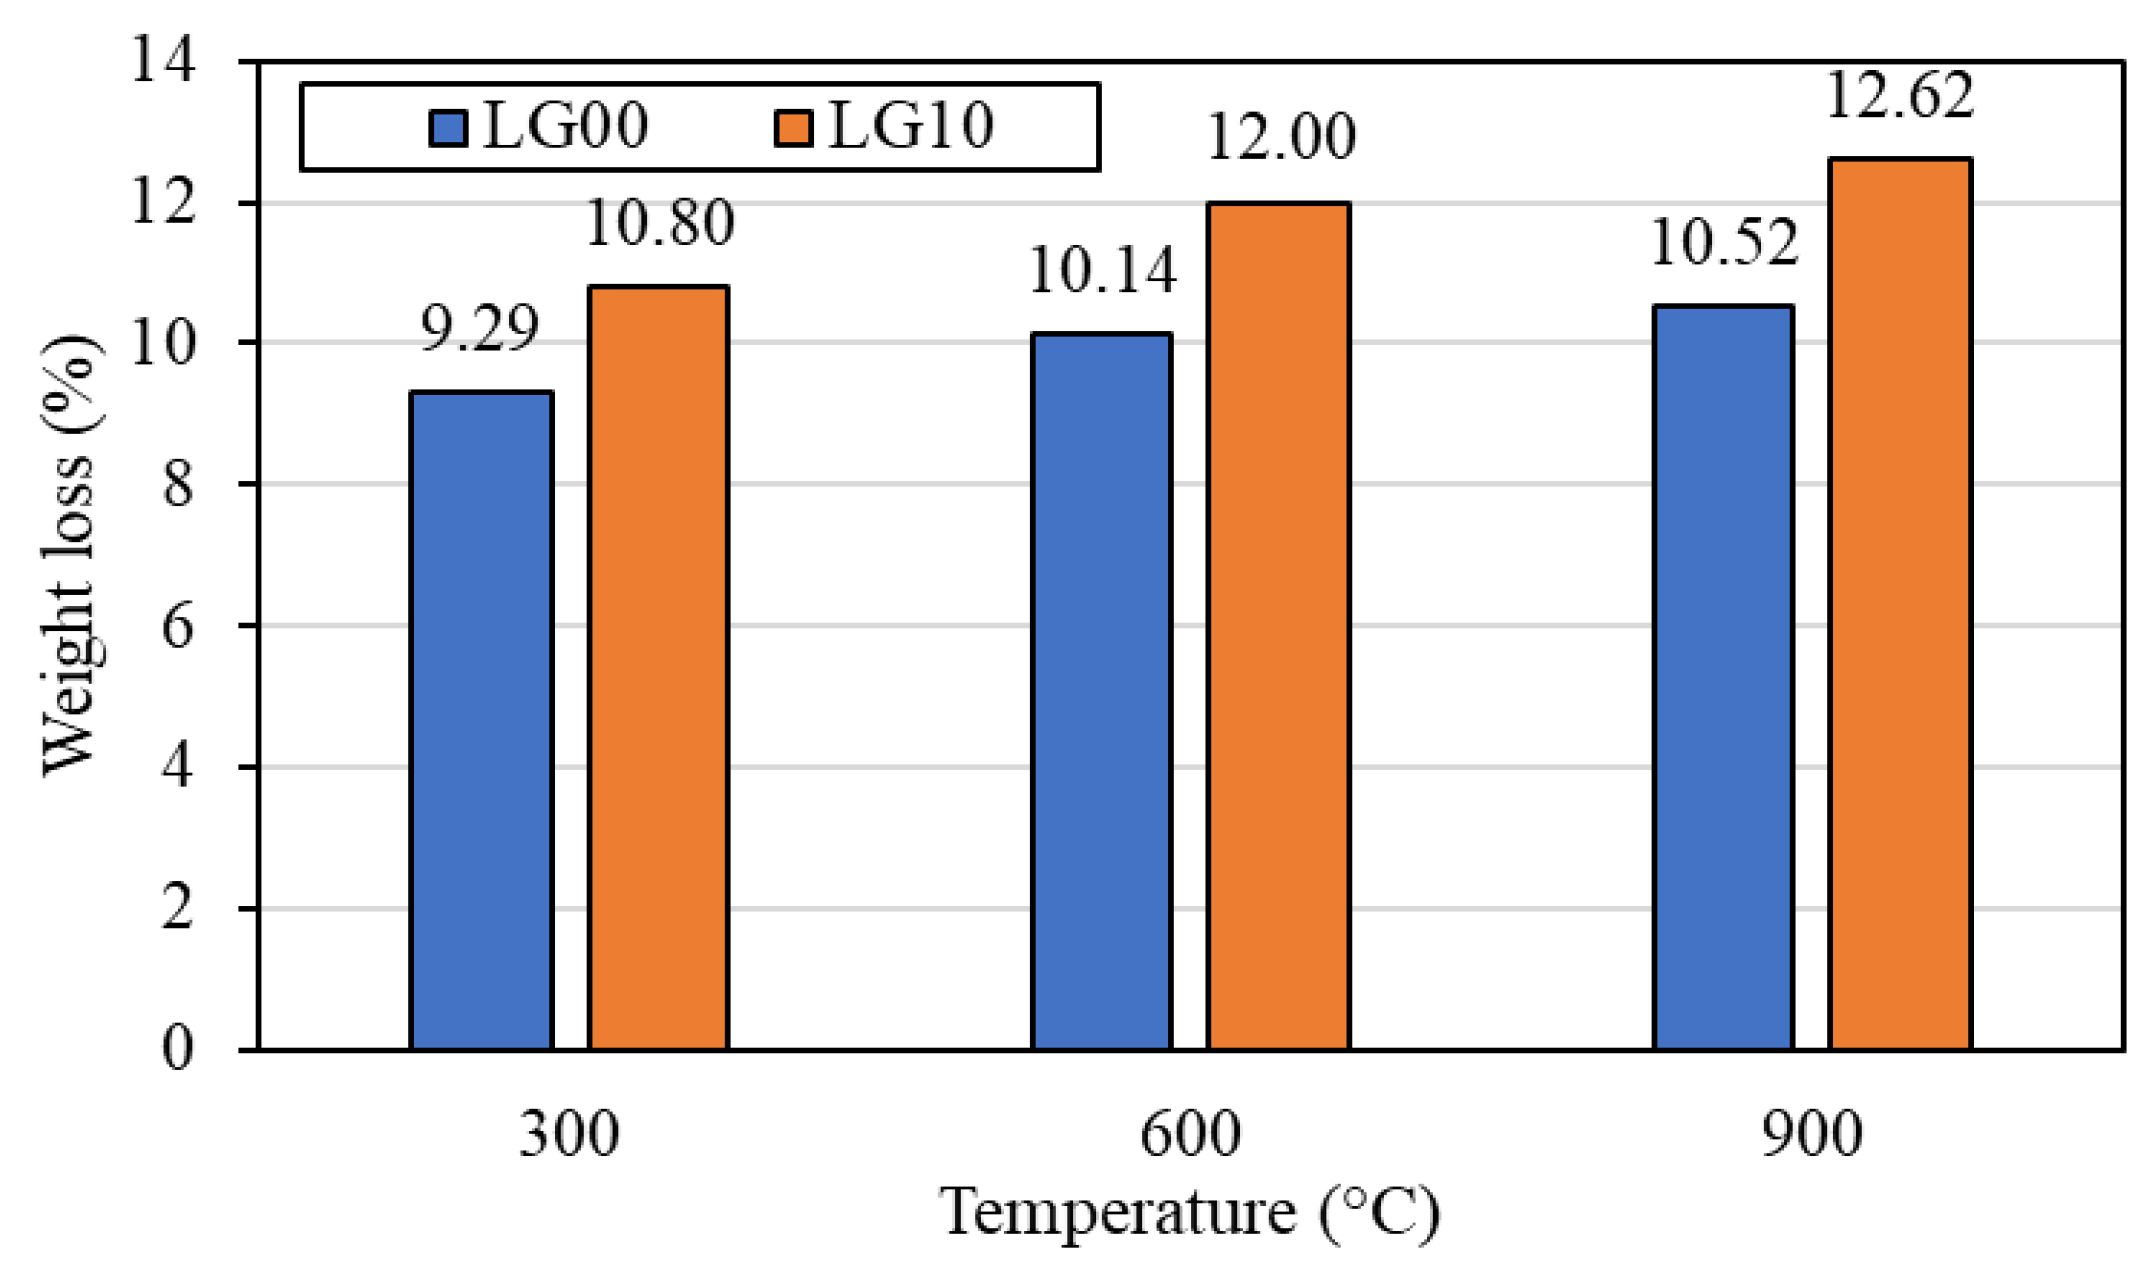
3.6.4. Weight Loss
3.6.5. Density, Porosity, Water Absorption, UPV, and Thermal Conductivity
3.6.6. SEM Image
4. Conclusions
- The mechanical strength decreased with increasing BLWA contents. This reduction was due to weaker and lower bonding of BLWA with the geopolymer paste than those of natural fine aggregates. Note that although the compressive strength of geopolymer mortar containing BLWA was reduced, it met the requirement for use in masonry work. In addition, the use of a higher volume of BLWA could improve the ductility of geopolymer mortar.
- The porosity and water absorption significantly increased due to increased voids at the interface between BLWA and the paste.
- The compressive strength of 0% BLWA (LG00) and 10% BLWA (LG10) reduced with increasing exposure temperatures (300, 600, and 900 °C). The largest reduction in strength was observed at the temperature of 600 °C, considered a critical exposure temperature for this material.
- The loss of weight and compressive strength of LG10 after exposure to elevated temperatures were higher than that of LG00 due to the thermal decomposition of BLWA. Interestingly, LG10 could maintain its weight and strength after exposure to 900 °C.
- The increase in the substitution content of BLWA decreased the density and thermal conductivity of geopolymer mortar, which favored the use of BLWA for manufacturing eco-friendly lightweight geopolymer mortars with thermal-insulating properties.
- The substitution of sand with BLWA 10% by volume in geopolymer mortar is the most suitable for engineering application, considering workability, physical and mechanical properties, and the amount of plastic waste reused in the mixture.
Author Contributions
Funding
Data Availability Statement
Conflicts of Interest
References
- PlasticsEurope. Plastics—The Facts 2016: An Analysis of European Plastics Production, Demand and Waste Data. [Online] 2016. Available online: https://www.plasticseurope.org/wp-content/uploads/2021/10/2016-Plastic-the-facts.pdf (accessed on 20 August 2020).
- Richens, J. Plastics and Sustainability: A Valuation of Environmental Benefits, Costs and Opportunities for Continuous Improvement; The American Chemistry Council (ACC): Washington, DC, USA, 2016. [Google Scholar]
- EPA. Advancing Sustainable Materials Management: Facts and Figures Report; United States Environmental Protection Agency: Washington, DC, USA, 2019.
- Awoyera, P.O.; Adesina, A. Plastic wastes to construction products: Status, limitations and future perspective. Case Stud. Constr. Mater. 2020, 12, e00330. [Google Scholar] [CrossRef]
- Bridson, J.H.; Gaugler, E.C.; Smith, D.A.; Northcott, G.L.; Gaw, S. Leaching and extraction of additives from plastic pollution to inform environmental risk: A multidisciplinary review of analytical approaches. J. Hazard. Mater. 2021, 414, 125571. [Google Scholar] [CrossRef] [PubMed]
- Khangale, U.B.; Ozor, P.A.; Mbohwa, C. A review of recent trends and status of plastics recycling in industries. Eng. Appl. Sci. Res. 2021, 48, 340–350. [Google Scholar]
- Lithner, D.; Larsson, A.; Dave, G. Environmental and health hazard ranking and assessment of plastic polymers based on chemical composition. Sci. Total Environ. 2011, 409, 3309–3324. [Google Scholar] [CrossRef] [PubMed]
- Oliveira, M.; Almeida, M.; Miguel, I. A micro(nano)plastic boomerang tale: A never ending story? TrAC Trends Anal. Chem. 2019, 112, 196–200. [Google Scholar] [CrossRef] [Green Version]
- Zhang, K.; Hamidian, A.H.; Tubic, A.; Zhang, Y.; Fang, J.K.H.; Wu, C.; Lam, P.K.S. Understanding plastic degradation and microplastic formation in the environment: A review. Environ. Pollut. 2021, 274, 116554. [Google Scholar] [CrossRef]
- Freedonia Group. World Construction Aggregates—Industry Report. [Online] 2019. Available online: https://www.freedoniagroup.com/industry-study/global-construction-aggregates-3742.htm (accessed on 21 July 2021).
- Celik, A.I.; Ozkilic, Y.O.; Zeybek, O.; Karalar, M.; Qaidi, S.; Ahmad, J.; Burduhos-Nergis, D.D.; Bejinariu, C. Mechanical Behavior of Crushed Waste Glass as Replacement of Aggregates. Materials 2022, 15, 8093. [Google Scholar] [CrossRef]
- Basaran, B.; Kalkan, I.; Aksoylu, C.; Ozkilic, Y.O.; Sabri, M.M.S. Effect of Waste Powder, Fine and Coarse Marble Aggregates on Concrete Compressive strength. Sustainability 2022, 14, 14388. [Google Scholar] [CrossRef]
- Bamigboye, G.; Tarverdi, K.; Adigun, D.; Daniel, B.; Okorie, U.; Adediran, J. An appraisal of the mechanical, microstructure, and thermal characteristics of concrete containing waste PET as coarse aggregate. Clean. Waste Syst. 2022, 1, 100001. [Google Scholar] [CrossRef]
- Kangavar, M.E.; Lokuge, W.; Manalo, A.; Karunasena, W.; Frigione, M. Investigation on the properties of concrete with recycled polyethylene terephthalate (PET) granules as fine aggregate replacement. Case Stud. Constr. Mater. 2022, 16, e00934. [Google Scholar] [CrossRef]
- Lazorenko, G.; Kasprzhitskii, A.; Fini, E.H. Sustainable construction via geopolymer composites incorporating waste plastic of different sizes and shapes. Constr. Build. Mater. 2022, 234, 126697. [Google Scholar] [CrossRef]
- Almeshal, I.; Tayeh, B.A.; Alyousef, R.; Alabduljabbar, H.; Mohamed, A.M. Eco-friendly concrete containing recycled plastic as partial replacement for sand. J. Mater. Res. Technol. 2020, 9, 4631–4643. [Google Scholar] [CrossRef]
- Boucedra, A.; Bederina, M.; Ghernouti, Y. Study of the acoustical and thermo-mechanical properties of dune and river sand concretes containing recycled plastic aggregates. Constr. Build. Mater. 2020, 256, 119447. [Google Scholar] [CrossRef]
- Adnan, H.M.; Dawood, A.O. Recycling of plastic box waste in the concrete mixture as a percentage of fine aggregate. Constr. Build. Mater. 2021, 284, 122666. [Google Scholar] [CrossRef]
- Ullah, K.; Qureshi, M.I.; Armad, A.; Ullah, Z. Substitution potential of plastic fine aggregate in concrete for sustainable production. Structures 2022, 35, 622–637. [Google Scholar] [CrossRef]
- Quidi, S.; Al-Kamaki, Y.; Hakeem, I.; Dulaimi, A.F.; Ozkilic, Y.; Sabri, M.; Sergeev, V. Investigation of the Physical-Mechanical Properties and Durability of High-Strength Concrete with Recycled PET as a Partial Replacement for Fine Aggregates. Front. Mater. 2023, 10, 1101146. [Google Scholar] [CrossRef]
- Ghanem, H.; Chahal, S.; Khatib, J.; Elkordi, A. Flexural Behavior of Concrete Beams Reinforced with Recycled Plastic Mesh. Buildings 2022, 12, 2085. [Google Scholar] [CrossRef]
- Nematzadeh, M.; Mousavimehr, M. Residual Compressive Stress–Strain Relationship for Hybrid Recycled PET–Crumb Rubber Aggregate Concrete after Exposure to Elevated Temperatures. J. Mater. Civ. Eng. 2019, 31, 04019136. [Google Scholar] [CrossRef]
- Gopi, K.S.; Srinivas, T. Feasibility Study of Recycled Plastic Waste as Fine Aggregate in Concrete. In E3S Web of Conferences; EDP Sciences: Les Ulis, France, 2020. [Google Scholar]
- Mesgari, S.; Akbarnezhad, A. Recycled geopolymer aggregates as coarse aggregates for Portland cement concrete and geopolymer concrete: Effects on mechanical properties. Constr. Build. Mater. 2020, 236, 117571. [Google Scholar] [CrossRef]
- Si, R.; Guo, S.; Dai, Q.; Wang, J. Atomic-structure, microstructure and mechanical properties of glass powder modified metakaolin-based geopolymer. Constr. Build. Mater. 2020, 254, 119303. [Google Scholar] [CrossRef]
- Tho-in, T.; Sata, V.; Boonserm, K.; Chindaprasirt, P. Compressive strength and microstructure analysis of geopolymer paste using waste glass powder and fly ash. J. Clean. Prod. 2017, 172, 2892–2898. [Google Scholar] [CrossRef]
- Zhang, D.W.; Zhao, K.F.; Xie, F.; Li, H.; Wang, D. Rheology and agglomerate structure of fresh geopolymer pastes with different Ms ratio of waterglass. Constr. Build. Mater. 2020, 250, 118881. [Google Scholar] [CrossRef]
- Kuri, J.C.; Hosan, A.; Shaikh, F.U.A.; Biswas, W.K. The Effect of Recycled Waste Glass as a Coarse Aggregate on the Properties of Portland Cement Concrete and Geopolymer Concrete. Buildings 2023, 13, 586. [Google Scholar] [CrossRef]
- Acar, M.C.; Celik, A.I.; Kayabasi, R.; Sener, A.; Ozdoner, N.; Ozkilic, Y.O. Production of Perlite-Based-Aerated Geopolymer Using Hydrogen Peroxide as Eco-Friendly Material for Energy-Efficient Buildings. J. Mater. Res. Technol. 2023, 24, 81–99. [Google Scholar] [CrossRef]
- Celik, A.I.; Ozkilic, Y.O. Geopolymer Concrete with High Strength, Workability and Setting Time Using Recycled Steel Wires and Basalt Powder. Steel Compos. Struct. 2023, 46, 689–707. [Google Scholar]
- Wongkvanklom, A.; Posi, P.; Homwuttiwong, S.; Sata, V.; Wongsa, A.; Tanangteerapong, D.; Chindaprasirt, P. Lightweight geopolymer concrete containing recycled plastic beads. Key Eng. Mater. 2019, 801, 377–384. [Google Scholar] [CrossRef]
- Strum, P.; Gluth, G.J.G.; Simon, S.; Brouwers, H.J.H.; Kühne, H.C. The effect of heat treatment on the mechanical and structural properties of one-part geopolymer-zeolite composites. Thermochim. Acta 2016, 635, 41–58. [Google Scholar] [CrossRef]
- Payakaniti, P.; Chuewangkam, N.; Yensano, R.; Pinitsoontorn, S.; Chindaprasirt, P. Changes in compressive strength, microstructure and magnetic properties of a high-calcium fly ash geopolymer subjected to high temperature. Constr. Build. Mater. 2020, 265, 120650. [Google Scholar] [CrossRef]
- Wattanasiriwech, S.; Nurgesang, F.A.; Wattanasiriwech, D.; Timakul, P. Characterisation and Properties of Geopolymer Composite Part 1: Role of Mullite Reinforcement. Ceram. Int. 2017, 43, 16055–16062. [Google Scholar] [CrossRef]
- Abdulkareem, O.A.; Bakri, A.M.M.A.; Kamarudin, H.; Nizar, I.K.; Saif, A.A. Effects of elevated temperatures on the thermal behavior and mechanical performance of fly ash geopolymer paste, mortar and lightweight concrete. Constr. Build. Mater. 2014, 50, 377–387. [Google Scholar] [CrossRef]
- ASTM C128-17; Standard Test Method for Density, Relative Density (Specific Gravity), and Absorption of Fine Aggregate. American Society for Testing and Materials: West Conshohocken, PA, USA, 2017; Annual Book of ASTM Standards. Volume 04.02.
- ASTM C136-17; Standard Test Method for Sieve Analysis of Fine and Coarse Aggregates. American Society for Testing and Materials: West Conshohocken, PA, USA, 2017; Annual Book of ASTM Standards. Volume 04.02.
- ASTM C33-18; Standard Specification for Concrete Aggregates. American Society for Testing and Materials: West Conshohocken, PA, USA, 2018; Annual Book of ASTM Standards. Volume 04.02.
- Matuschek, G.; Milanov, N.; Kettrup, A. Thermoanalytical investigations for the recycling of PVC. Thermochim. Acta 2000, 361, 77–84. [Google Scholar] [CrossRef]
- Suresh, S.S.; Mohanty, S.; Nayak, S.K. Composition analysis and characterization of waste polyvinyl chloride (PVC) recovered from data cables. Waste Manag. 2017, 60, 100–111. [Google Scholar] [CrossRef] [PubMed]
- Yu, J.; Sun, L.; Ma, C.; Qiao, Y.; Yao, H. Thermal degradation of PVC: A review. Waste Manag. 2015, 48, 300–314. [Google Scholar] [CrossRef] [PubMed]
- Merlo, A.; Lavagna, L.; Reira, D.S.; Pavese, M. Mechanical properties of mortar containing waste plastic (PVC) as aggregate partial replacement. Case Stud. Construc. Mater. 2020, 13, e00467. [Google Scholar] [CrossRef]
- Chindaprasirt, P.; Chareerat, T.; Sirivivatnanon, V. Workability and Strength Of Coarse High Calcium Fly Ash Geopolymer. Cem. Concr. Comp. 2007, 29, 224–229. [Google Scholar] [CrossRef]
- ASTM C1437-15; Standard Test Method for Flow of Hydraulic Cement Mortar. American Society for Testing and Materials: West Conshohocken, PA, USA, 2015; Annual Book of ASTM Standards. Volume 04.01.
- ASTM C807-20; Standard Test Method for Time of Setting of Hydraulic Cement Mortar by Modified Vicat Needle. American Society for Testing and Materials: West Conshohocken, PA, USA, 2020; Annual Book of ASTM Standards. Volume 04.01.
- ASTM C642-13; Standard Test Method for Density, Absorption, and Voids in Hardened Concrete. American Society for Testing and Materials: West Conshohocken, PA, USA, 2013; Annual Book of ASTM Standards. Volume 04.02.
- Applied Precision Ltd.|Isomet 2114. Available online: https://www.appliedp.com/product/isomet/ (accessed on 10 February 2020).
- ASTM D5930-09; Standard Test Method for Thermal Conductivity of Plastic by Means of a Transient Line-Source Technique. American Society for Testing and Materials: West Conshohocken, PA, USA, 2009; Annual Book of ASTM Standards. Volume 08.03.
- ASTM C597-16; Standard Test Method for Pulse Velocity through Concrete. American Society for Testing and Materials: West Conshohocken, PA, USA, 2016; Book of Standards. Volume 04.02.
- ASTM C109/C109M-99; Standard Test Method For Compressive Strength of Hydraulic Cement Mortars (Using 2-in or (50 mm) Cube Specimens). American Society for Testing and Materials: West Conshohocken, PA, USA, 2001; Annual Book of ASTM Standards. Volume 04.01.
- ASTM C348-97; Standard Test Method for Flexural Strength of Hydraulic-Cement Mortars. American Society for Testing and Materials: West Conshohocken, PA, USA, 2001; Annual Book of ASTM Standards. Volume 04.01.
- ASTM C496/C496M-17; Standard Test Method for Splitting Tensile Strength of Cylindrical Concrete Specimens. American Society for Testing and Materials: West Conshohocken, PA, USA, 2017; Book of Standards. Volume 04.02.
- Zhang, H.; Kodur, V.; Qi, S.L.; Cao, L.; Wu, B. Development of metakaolin–fly ash based geopolymers for fire resistance applications. Constr. Build. Mater. 2014, 55, 38–45. [Google Scholar] [CrossRef]
- Batayneh, M.; Marie, I.; Asi, I. Use of selected waste materials in concrete mixes. Waste Manag. 2007, 27, 1870–1876. [Google Scholar] [CrossRef]
- Rahmani, E.; Dehestani, M.; Beygi, M.; Allahyari, H.; Nikbin, I. On the mechanical properties of concrete containing waste PET particles. Constr. Build. Mater. 2013, 47, 1302–1308. [Google Scholar] [CrossRef]
- Ferreira, L.; De Brito, J.; Saikia, N. Influence of curing conditions on the mechanical performance of concrete containing recycled plastic aggregate. Constr. Build. Mater. 2012, 36, 196–204. [Google Scholar] [CrossRef]
- Kaur, G.; Pavia, S. Physical properties and microstructure of plastic aggregate mortars made with acrylonitrile-butadiene-styrene (ABS), polycarbonate (PC), polyoxymethylene (POM) and ABS/PC blend waste. J. Build. Eng. 2020, 31, 101341. [Google Scholar] [CrossRef]
- ACI 213R-14; Guide for Structural Lightweight-Aggregate Concrete. Reported by ACI Committee 213. ACI Manual of Concrete Practice Part I. American Concrete Institute: Farmington Hills, MI, USA, 2014.
- Frigione, M. Recycling of PET bottles as fine aggregate in concrete. Waste Manag. 2010, 30, 1101–1106. [Google Scholar] [CrossRef] [PubMed]
- Akçaözoglu, S.; Atis, C.D.; Akçaözoglu, K. An investigation on the use of shredded waste PET bottles as aggregate in lightweight concrete. Waste Manag. 2010, 30, 285–290. [Google Scholar] [CrossRef] [PubMed]
- Ohemeng, E.A.; Ekolu, S.O. Strength prediction model for cement mortar made with waste LDPE plastic as fine aggregate. J. Sustain. Cem.-Based. Mater. 2019, 8, 228–243. [Google Scholar] [CrossRef]
- Safi, B.; Saidi, M.; Aboutaleb, D.; Maallem, M. The use of plastic waste as fine aggregate in the self-compacting mortars: Effect on physical and mechanical properties. Constr. Build. Mater. 2013, 43, 436–442. [Google Scholar] [CrossRef]
- Islam, M.J.; Meherier, M.S.; Islam, A.R. Effects of waste PET as coarse aggregate on the fresh and harden properties of concrete. Constr. Build. Mater. 2016, 125, 946–951. [Google Scholar] [CrossRef]
- Latroch, N.; Benosman, A.S.; Bouhamou, N.-E.; Senhadji, Y.; Mouli, M. Physico-mechanical and thermal properties of composite mortars containing lightweight aggregates of expanded polyvinyl chloride. Constr. Build. Mater. 2018, 175, 77–87. [Google Scholar] [CrossRef]
- Kou, S.; Lee, G.; Poon, C.; Lai, W. Properties of lightweight aggregate concrete prepared with PVC granules derived from scraped PVC pipes. Waste Manag. 2009, 29, 621–628. [Google Scholar] [CrossRef]
- Zulkernain, N.H.; Gani, P.; Chuan, N.C.; Uvarajan, T. Utilisation of plastic waste as aggregate in construction materials: A review. Constr. Build. Mater. 2021, 296, 123669. [Google Scholar] [CrossRef]
- ASTM C91-18; Standard Specification for Masonry Mortar. American Society for Testing and Materials: West Conshohocken, PA, USA, 2018; Book of Standards. Volume 04.01.
- Hannawi, K.; Kamali-Bernard, S.; Prince, W. Physical and mechanical properties of mortars containing PET and PC waste aggregates. Waste Manag. 2010, 30, 2312–2320. [Google Scholar] [CrossRef]
- Babu, K.G.; Babu, D.S. Behaviour of lightweight expanded polystyrene concrete containing silica fume. Cem. Concr. Res. 2003, 33, 755–762. [Google Scholar] [CrossRef]
- Saikia, N.; Brito, J.D. Waste polyethylene terephthalate as an aggregate in concrete. Mater. Res. 2013, 16, 341–350. [Google Scholar] [CrossRef] [Green Version]
- Belmokaddem, M.; Mahi, A.; Senhadji, Y.; Pekmezci, B.Y. Mechanical and physical properties and morphology of concrete containing plastic waste as aggregate. Constr. Build. Mater. 2020, 257, 119559. [Google Scholar] [CrossRef]
- Senhadji, Y.; Siad, H.; Escadeillas, G.; Benosman, A.S.; Chihaoui, R.; Mouli, M.; Lachemi, M. Physical, Mechanical and Thermal Properties of Lightweight Mortars Containing Recycled Polyvinyl Chloride. Constr. Build. Mater. 2019, 195, 198–207. [Google Scholar] [CrossRef]
- Iucolano, F.; Liguori, B.; Caputo, D.; Colangelo, F.; Cioff, R. Recycled plastic aggregate in mortars composition: Effect on physical and mechanical properties. Mater. Des. 2013, 52, 916–922. [Google Scholar] [CrossRef]
- Rilem, L. Functional classification of lightweight concrete. Mater. Struct. 1978, 11, 281–283. [Google Scholar]
- Hacini, M.; Benosman, A.S.; Tani, N.K.; Mouli, M.; Senhadji, Y.; Badache, A.; Latroch, N. Utilization and assessment of recycled polyethylene terephthalate strapping bands as lightweight aggregates in Eco-efficient composite mortars. Constr. Build. Mater. 2021, 270, 121427. [Google Scholar] [CrossRef]
- Sengul, O.; Azizi, S.; Karaosmanoglu, F.; Tasdemir, M.A. Effect of expanded perlite on the mechanical properties and thermal conductivity of lightweight concrete. Energy Build. 2011, 43, 671–676. [Google Scholar] [CrossRef]
- Sarker, P.K.; Kelly, S.; Yao, Z. Effect of fire exposure on cracking, spalling and residual strength of fly ash geopolymer concrete. Mater. Des. 2014, 63, 584–592. [Google Scholar] [CrossRef] [Green Version]
- Wongsa, A.; Wongkvanklom, A.; Tanangteerapong, D.; Chindaprasirt, P. Comparative study of fire-resistant behaviors of high-calcium fly ash geopolymer mortar containing zeolite and mullite. J. Sustain. Cem.-Based Mater. 2020, 9, 307–321. [Google Scholar] [CrossRef]
- Zhao, R.; Sanjayan, J.G. Geopolymer and Portland cement concretes in simulated fire. Mag. Concr. Res. 2011, 63, 163–173. [Google Scholar] [CrossRef]
- Hager, I.; Sitarz, M.; Mroz, K. Fly-ash based geopolymer mortar for high-temperature application—Effect of slag addition. J. Clean. Prod. 2021, 316, 128168. [Google Scholar] [CrossRef]
- Rickard, W.D.A.; Gluth, G.J.G.; Pistol, K. In-situ thermo-mechanical testing of fly ash geopolymer concretes made with quartz and expanded clay aggregates. Cem. Concr. Res. 2016, 80, 33–43. [Google Scholar] [CrossRef]
- Saxena, R.; Siddique, S.; Gupta, T.; Sharma, R.K.; Chaudhary, S. Impact resistance and energy absorption of concrete containing plastic waste. Constr. Build. Mater. 2018, 176, 415–421. [Google Scholar] [CrossRef]
- Correia, J.R.; Rima, J.S.; De Brito, J. Post-fire mechanical performance of concrete made with selected plastic waste aggregates. Cem. Concr. Compos. 2014, 53, 187–199. [Google Scholar] [CrossRef]


| Composition | Percentage (%wt) |
|---|---|
| Al2O3 | 21.3 |
| SiO2 | 41.3 |
| CaO | 15.1 |
| Fe2O3 | 11.9 |
| MgO | 2.5 |
| K2O | 2.4 |
| SO3 | 2.5 |
| LOI | 0.7 |
| Properties | Sand | BLWA |
|---|---|---|
| Specific gravity | 2.59 | 1.12 |
| Fineness modulus | 2.74 | 3.73 |
| Unit weight (kg/m3) | 1682 | 71 |
| Water absorption (%) | 0.63 | - |
| Sieve Size (mm) | Cumulative Passing (%) | Lower Limit (%) ASTM C33 [38] | Upper Limit (%) ASTM C33 [38] | |
|---|---|---|---|---|
| Sand | BLWA | |||
| 4.75 (#4) | 97.9 | 100.0 | 95 | 100 |
| 2.36 (#8) | 90.1 | 94.5 | 80 | 100 |
| 1.18 (#16) | 76.7 | 21.9 | 50 | 85 |
| 0.60 (#30) | 49.0 | 8.3 | 25 | 60 |
| 0.30 (#50) | 11.4 | 1.6 | 10 | 30 |
| 0.15 (#100) | 1.4 | 0.4 | 2 | 10 |
| Mix | FA | NS | NH | RS | BLWA |
|---|---|---|---|---|---|
| LG00 | 453 | 159 | 159 | 1246 | - |
| LG05 | 453 | 159 | 159 | 1184 | 26 |
| LG10 | 453 | 159 | 159 | 1121 | 53 |
| LG15 | 453 | 159 | 159 | 1059 | 80 |
| LG20 | 453 | 159 | 159 | 997 | 106 |
| Mix | Density (kg/m3) (STD .dev) | Porosity (%) (STD .dev) | Water Absorption (%) (STD .dev) | Ultrasonic Pulse Velocity (m/s) (STD .dev) |
|---|---|---|---|---|
| LG00 | 1989 (4.1) | 20.6 (0.4) | 7.7 (0.0) | 3030 (190) |
| LG05 | 1819 (17.1) | 26.9 (0.3) | 9.4 (0.2) | 2691 (44) |
| LG10 | 1732 (5.1) | 27.5 (0.5) | 9.8 (0.3) | 2606 (70) |
| LG15 | 1696 (8.3) | 27.9 (1.6) | 10.1 (0.4) | 2476 (132) |
| LG20 | 1645 (6.2) | 30.4 (0.8) | 10.7 (0.5) | 2295 (96) |
| Mix | Temperature (°C) | Properties | ||||
|---|---|---|---|---|---|---|
| Density (kg/m3) | Porosity (%) | Water Absorption (%) | UPV (m/s) | Thermal Conductivity (W/m·K) | ||
| LG00 | 25 | 1989 | 20.6 | 7.7 | 3030 | 1.2167 |
| LG00 | 300 | 1953 | 26.1 | 10.0 | 1554 | 1.0469 |
| LG00 | 600 | 1914 | 27.0 | 10.4 | 626 | 0.7472 |
| LG00 | 900 | 1902 | 25.9 | 10.2 | 725 | 0.7641 |
| LG10 | 25 | 1732 | 27.5 | 9.8 | 2606 | 0.8571 |
| LG10 | 300 | 1653 | 34.8 | 12.3 | 1123 | 0.7021 |
| LG10 | 600 | 1634 | 36.6 | 14.0 | 529 | 0.5789 |
| LG10 | 900 | 1623 | 36.6 | 13.9 | 510 | 0.5129 |
Disclaimer/Publisher’s Note: The statements, opinions and data contained in all publications are solely those of the individual author(s) and contributor(s) and not of MDPI and/or the editor(s). MDPI and/or the editor(s) disclaim responsibility for any injury to people or property resulting from any ideas, methods, instructions or products referred to in the content. |
© 2023 by the authors. Licensee MDPI, Basel, Switzerland. This article is an open access article distributed under the terms and conditions of the Creative Commons Attribution (CC BY) license (https://creativecommons.org/licenses/by/4.0/).
Share and Cite
Kunthawatwong, R.; Wongsa, A.; Ekprasert, J.; Sukontasukkul, P.; Sata, V.; Chindaprasirt, P. Performance of Geopolymer Mortar Containing PVC Plastic Waste from Bottle Labels at Normal and Elevated Temperatures. Buildings 2023, 13, 1031. https://doi.org/10.3390/buildings13041031
Kunthawatwong R, Wongsa A, Ekprasert J, Sukontasukkul P, Sata V, Chindaprasirt P. Performance of Geopolymer Mortar Containing PVC Plastic Waste from Bottle Labels at Normal and Elevated Temperatures. Buildings. 2023; 13(4):1031. https://doi.org/10.3390/buildings13041031
Chicago/Turabian StyleKunthawatwong, Ronnakrit, Ampol Wongsa, Jindarat Ekprasert, Piti Sukontasukkul, Vanchai Sata, and Prinya Chindaprasirt. 2023. "Performance of Geopolymer Mortar Containing PVC Plastic Waste from Bottle Labels at Normal and Elevated Temperatures" Buildings 13, no. 4: 1031. https://doi.org/10.3390/buildings13041031