
Evaluation of the Spatial Disparities in the Youth Suitability of Shenzhen Public Primary School Campuses


1
College of Forestry and Landscape Architecture, South China Agricultural University, Guangzhou 510642, China
2
Guangdong Provincial Key Laboratory of Agricultural and Rural Pollution Abatement and Environmental Safety, College of Natural Resources and Environment, South China Agricultural University, Guangzhou 510642, China
*
Author to whom correspondence should be addressed.
Buildings 2023, 13(5), 1306; https://doi.org/10.3390/buildings13051306
Submission received: 23 April 2023
/
Revised: 8 May 2023
/
Accepted: 16 May 2023
/
Published: 17 May 2023
(This article belongs to the Special Issue Sustainable Buildings and Cities)
Abstract
:This paper delves into the critical issue of youth suitability in the public primary school campuses in Shenzhen Central District, China. Youths constitute a crucial part of the urban population, contributing greatly to social wealth; thus, considering their needs and well-being is imperative in the urban planning and development process. The paper employs a comprehensive Python script tool, based on ArcGIS, that is augmented with an empirical investigation and data from the statistical yearbook in order to conduct a meticulous evaluation of the youth suitability of primary school campuses. The results of the study reveal spatial differences in the youth suitability of primary school campuses, with the suitability diminishing from the district’s inner areas to its outer regions. Additionally, the study unearths that primary school campuses in the Shenzhen Central District are generally stratified, and that the campus service space could be appropriately categorized into several groups based on the dual criteria of accessibility as well as youth suitability. Finally, this study provides illuminating decision-making suggestions for optimizing the youth suitability of primary school campuses in Shenzhen Central District, highlighting the crucial role of education policies, regional economic development, and campus infrastructure improvements in nurturing inclusive, vibrant, and sustainable urban environments.
1. Introduction
The potential of the youth to shape the trajectory of sustainable urban development is undeniable [1]. As a crucial component of the urban fabric, they possess the ability to contribute to the social wealth of a city in ways that are both tangible and intangible. It is, therefore, imperative to equip the youth with the necessary resources to navigate the complexities of urban living [1,2]. Ensuring that public primary school campuses are tailored to the needs of the youth is a vital step towards achieving this goal. By providing them with access to safe and stimulating indoor and outdoor spaces, study, sports, recreational facilities, and other vital amenities, we can empower them to realize their full potential [3,4]. This can help create a virtuous cycle of sustainable urban development that benefits all members of the community [5].
In the realm of urban planning and design, the issue of ensuring the suitability of public primary school campuses for the youth has become increasingly pressing [6]. Early research in the 1970s and 1980s placed considerable emphasis on the internal attributes and infrastructure of school buildings, including the dimensions of classrooms, their arrangement, lighting, and ventilation, which were conducive to the physical and educational growth of students [7,8]. Since then, the concentration on the classroom setting has been predominant and an increasing number of scholars have started to examine the effects of internal classroom design. However, more recent scholarship has called attention to the external spaces and amenities of school campuses instead of merely focusing on the internal settings of classrooms, including playgrounds, sports fields, gardens, and other recreational areas that are tailored to the needs of the youth. Scholars have underscored the importance of establishing safe, inclusive, and accessible outdoor spaces that foster physical activity, social engagement, and environmental awareness among students [9]. Initiatives such as these do not only intend to enhance the quality of study life and the educational outcomes of youth, but also to greatly contribute to the sustainable development of urban society.
The concept of a “sustainable city” emerged relatively recently, in 1997, as a holistic approach to urban development that prioritizes equity, aesthetics, innovation, environmental stewardship, and efficient communication [10,11]. This paradigm shift towards sustainability has gained momentum in recent years, with some scholars hailing it as an exemplary model for achieving sustainable development goals [12]. However, while the pursuit of sustainable urban development aims to enhance the quality of life for all urban inhabitants, including the youth, it is crucial to recognize the unique challenges and opportunities presented by young populations [13]. Sustainable development strategies are the only viable path towards solving the problems faced by the youth and realizing sustainable development for humanity; therefore, it is imperative to investigate how cities can adapt to the needs of youth populations in the context of sustainable urban development.
Providing health and well-being care to urban children while maintaining a sense of community is one of the most key functions of public primary schools. Recent research has demonstrated the importance of designing school campuses to meet the diverse needs of children, considering factors such as their study interests [14,15], social behaviors, and personalities [16]. However, urban children suffer grave consequences when spatial disparities are ignored when it comes to sustainable development and quality of study life, as several other significant factors, including accessibility, of school campuses are overlooked [17]. As schools in certain areas are less suitable, children may need to travel to distant high-quality schools, exacerbating traffic congestion, reducing their quality of life, and impeding sustainable urban development [18]. Therefore, a sustainable urban planning approach should not only focus on improving the suitability of individual schools but also prioritize the principles, proposed by the European Union, of “beauty”, “inclusiveness”, and “sustainability” to ensure the rational and scientific distribution of resources as well as to promote the renovation of living spaces [19].
As a result, it is noteworthy that little attention has been paid to the spatial differences between different types of cities or certain types of schools in terms of the neglected essential factors for youth suitability when it comes to the concept of a sustainable city. In order to bridge the existing research gap, this study conducted a comprehensive evaluation of 97 school campuses situated in the bustling Shenzhen Central District in order to evaluate the suitability of school campuses through more comprehensive and systematic approaches when compared with the ones applied by previous studies. By examining the characteristics and root causes of the spatial disparities in the youth suitability of these campuses, the research not only sheds light on the impact of such differences in the public-school service on local residents, but also provides informed recommendations and valuable insights for scientific decision making aimed at enhancing the youth suitability of school campuses in Shenzhen and other metropolitan cities. Ultimately, this study aims to foster sustainable development and optimize the well-being of urban youth through the promotion of optimal school campus design [20].
2. Related Literature
Although a standardized definition of a primary school campus is yet to be established, it is widely recognized that primary schools play a crucial role in meeting the daily educational and social needs of urban children. As Scarfò, F et al. [21] pointed out, it is generally accepted that the greatest distance between primary schools and residential areas should be 0.2 km to 0.5 km, but there is less agreement on the standard school campus size.
Accessibility to primary schools not only reflects the cost (in terms of time, distance, energy, etc.) of children (some escorted by their parents) traveling to and from school, but it also reveals the rationality and fairness of the spatial arrangement of the public primary school system [22,23,24]. Youths, as a group, are particularly vulnerable to issues surrounding access and mobility; these can impact their physical and mental health. Thus, accessibility is a crucial criterion for assessing the suitability of primary schools for urban children. A number of studies have identified three primary factors that influence the accessibility of primary schools: first, the attractiveness of the school, such as the quality of the campus environment [25], cultural and historical significance, natural setting, size, and available facilities; second, the specific requirements and attributes of distinct student cohorts, such as their developmental stages and socioeconomic backgrounds, must be taken into account; and third, the presence of physical barriers, such as busy roads or rivers, which may hinder access to the school [26].
You, W et al. posited that the appropriate extraction and simplifying representation of spatial objects, such as primary schools, is the main concern when assessing the accessibility of primary schools. Representing a primary school by its geometric center (or centroid) [27,28,29,30,31,32,33] or its boundaries [34] can result in an over- or underestimation of primary school accessibility. In addition, several papers argued that the real entry point of the primary school should represent the school campuses. However, we assert that this methodology is too complicated and may substantially decrease the efficiency of the evaluation.
The scholarly works cited [13,14,15,16,17,18,19] reveal the more stringent demands of the youthful population for primary school campuses as opposed to their elder counterparts, elucidating several predilections of the youth for distinct features of the school campus (incorporating spatial and non-spatial aspects). In the same vein, Schatzmann, M. et al. [34] posited that functional requisites, the study conditions, suitable fencing, and administrative measures were the key elements for improving the suitability of microspaces for the youth through a survey of urban microspaces (consisting of 22 factors relating to site, layout, and settings). Drawing on the sociological and physical characteristics of children, Wang, X. et al. [22] postulated that a comfortable, identifiable, safe, spatially diverse, and communicative environment is critical for assessing the suitability of urban primary school campuses for children. According to Eastern, J.R. [23], accessible amenities, adequately illuminated and spacious classrooms, appropriate space scale, restful seating, restrooms, and shelter (ideally waterproof) are the hallmarks of youth-centered primary school campuses.
In accordance with the geographic demarcation of the study area, this research has handpicked primary schools that conform to the “Standard Classification of Public Primary Schools in China” as the focal point of the study. These selected primary schools are characterized by being publicly accessible, relatively independent, and primarily education-centric, with functionally educational and social characteristics. Primary schools in this area have service radiuses ranging from 0.3 km to more than 2 km, while their physical footprints vary from 0.8 to 10 km.
3. Statistics and Methodology
3.1. Study Area
Shenzhen, a prominent economic hub in China, is located in the southeastern part of the country. It borders Hong Kong to the south and Dongguan to the north (Figure 1). It is a core city in the Greater Bay Area (GBA). In 2009, in light of its growing youth population and the current demographic trend, Shenzhen authorities launched a pilot project aimed at transforming selected school campuses into youth-friendly enclaves following the implementation of the Youth-Friendly City in 2015. The 2016–2020 editions of the Shenzhen statistics reveal that school campuses designed for children account for a small percentage of the city’s total school campuses; specifically, only 27% of the city’s school campuses are designated youth-accessible campuses, even though the Shenzhen Central District, which comprises seven administrative divisions, accounts for roughly 45% of the city’s youth population. These statistics suggest that enhancing the quantity, service quality, and other aspects of school campuses designated for the youth in Shenzhen is critical to addressing the demand for youth-friendly areas in school campuses.
3.2. Research Data
The present research employs two distinct categories of data. First, the geospatial data encompassing school campuses, road route networks, rivers, and streets across the area for research, which were primarily derived from the Shenzhen Map of Traffic, composed by the Shenzhen Mapping Institutions in March 2021, were taken into consideration. The information was procured through a combination of paper map scanning and classified vectorizing performed via the ArcGIS 10.3 software suite (a pioneering GIS technology developed by the Research Institution of USA Environment). Second, numerous ground elements were examined in terms of their general attribution data, incorporating the number of residents on every street by 2021 and data related to the evaluation index of youth suitability in every primary school. The data on the population were obtained from the statistics forms of administrative departments composed by the Shenzhen Statistical Institution in 2021. The index data were derived from comprehensive investigations, after which a composite score was assigned based on complete standard.
3.3. Research Methodology
3.3.1. Survey
In order to holistically and comprehensively assess the youth suitability of public primary school campuses in the Shenzhen Central District, a rigorous and meticulous methodology was employed to collect subjective indices through a combination of on-site interviews and questionnaires. To ensure that the data gathered were both accurate and representative, a multi-stage sampling approach was implemented, whereby 2–3 primary school campuses were carefully selected in each administrative street block, and 20–30 student groups (made up of 5–10 students) were chosen randomly in every campus for on-site interviews. With the pursuit of detail and precision, a total of 100 interviews were carried out on weekdays during the optimal study and campus conditions during spring and autumn. These interviews were carried out during a carefully selected timeframe, encompassing three different timeslots each day (07:30–08:30, 12:30–01:30, and 17:30–18:30) spanning the months of April, May, and November in 2021. These months were specifically chosen for their conducive study conditions, with a low stress environment for the youth, unencumbered by the burden of exams and homework. Importantly, it should be noted that the interviews were conducted both before and after school hours in order to gather a comprehensive understanding of the youth suitability for campuses across different time periods. The information gathered from 1000 self-administered questionnaires (excluding those interviewed on-site) proved indispensable in the development of this study, with a focus on highlighting the need for urban sustainable development to consider the perspectives and needs of the youth, particularly in primary school campuses [35].
3.3.2. Evaluation System
After each insightful interview, a non-random sampling questionnaire was administered to each student, enabling the acquisition of their individualized data on the indices of youth suitability, including the adequacy of the classroom space and the quality of the recreational facilities. Meanwhile, drawing from the wealth of present scholarship [36,37,38,39,40,41,42,43], the research posits that primary schools’ spatial accessibility, pedagogical and recreational resources, and environmental comfort are critical domains underpinning sustainable cities and are indicative of youth suitability. Correspondingly, those four features were selected as the main indices guiding the evaluation index of Shenzhen’s school campuses’ youth suitability. Secondary-level indicators were determined via a principle approach informed by systematics, representativeness, and feasibility. Applying the analytic hierarchy process and expert judgement, an evaluative index system of youth suitability is presented in Table 1. Moreover, as a mainly objective index in the evaluation system, the spatial accessibility in Table 1 is calculated by a potential model formulation of the latent capacity framework concerning the decay of the geographical influence.
Examining the weightings calculated for each first-level index in Table 1, one can readily observe that environmental comfort, study, and recreation are assigned greater importance. This reflects the youth’s strong proclivity for preserving physical and mental wellbeing in addition to their craving aesthetically appealing and inviting outdoor spaces. Meanwhile, the environmental safety index exhibits a lower weighting, signifying that while safety in school campuses remains a critical concern for the youth, it is not their paramount interest when assessing the suitability of school campuses. In terms of the weighting of peripheral indicators, the criteria of green space enjoyment, entertainment amenity completeness, and the adequacy of barrier-free channel allocation all rank highly. This indicates that bolstering the quality and level of these spatial features can remarkably enhance the youth suitability of Shenzhen’s school campuses.
3.3.3. Workflow of Analysis
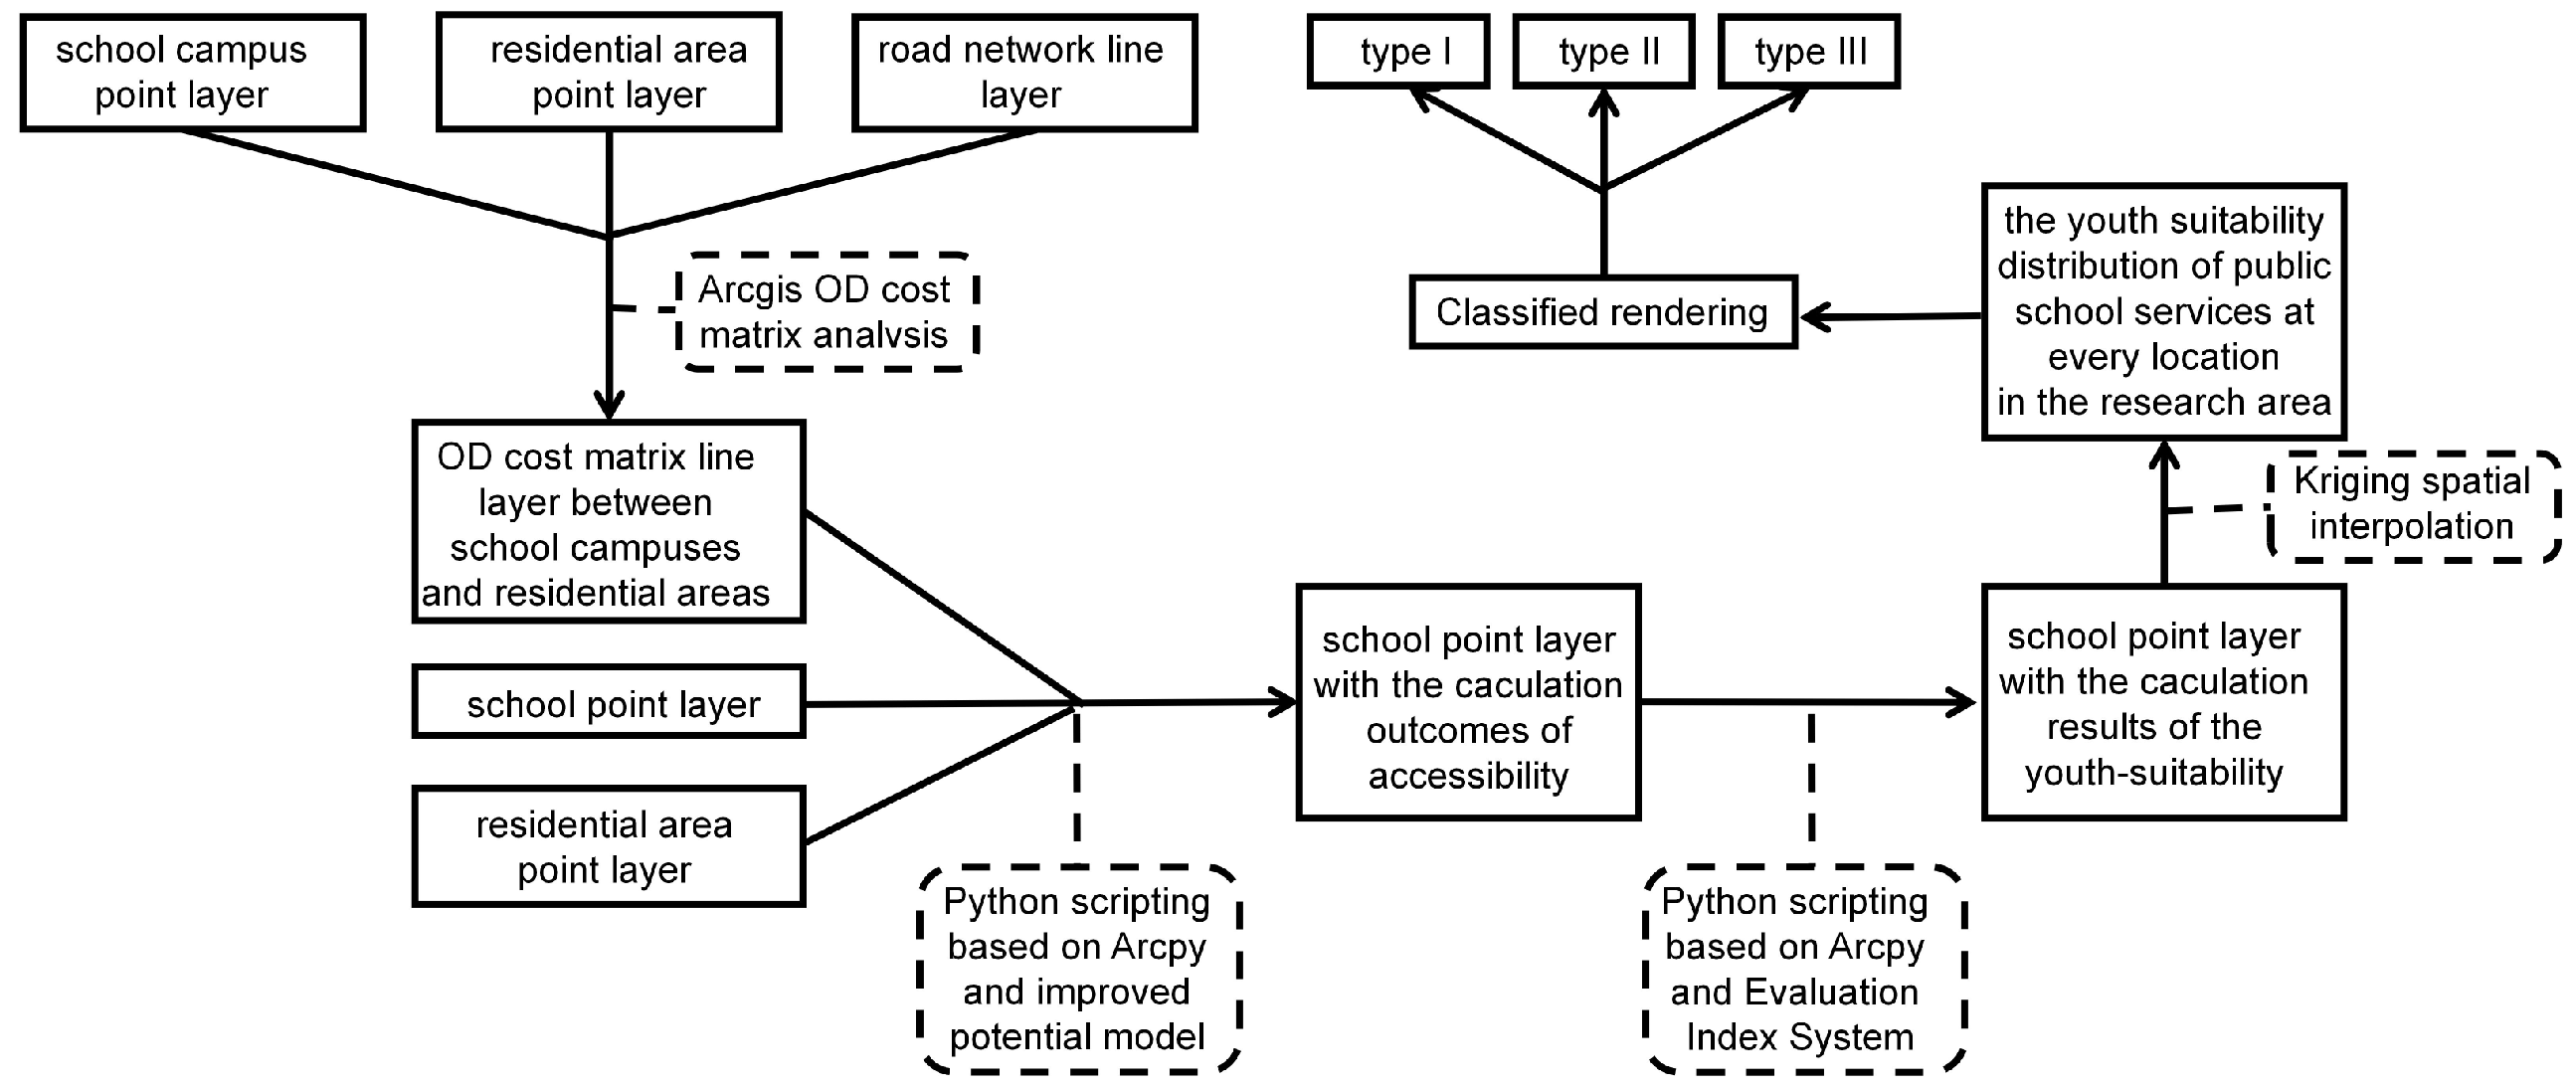
According to Wen, C et al.’s scholarship [44], a significant portion of children exhibit a predilection for attending prestigious educational institutions located at a distance from their residential abodes, contingent upon the alluring and captivating features that the institution has to offer within the bounds of Shenzhen. Consequently, it is imperative to avoid diminishing the concept of campus proximity [45]. Hence, several defining variables were selected for this paper, including each residential centroid and the school campus centroid, postulating that progenies would exclusively consider campuses with a delimited variable value that does not exceed the 2 km benchmark.
To facilitate the study, ArcGIS Origin-Destination was utilized to obtain the origin–destination cost matrix between each school campus and all residential areas within a maximum distance of 2 km. Furthermore, through the use of toolkits for writing Python scripts on the basis of ArcPy (an ArcGIS site package written in Python), a series of calculations were conducted to determine school campuses’ youth and accessibility suitability using the improved potential model. Finally, by leveraging the power of general kriging interpolation based on ArcGIS, the youth suitability of every school campus within the research area was derived. Meanwhile, the suitability of public-school campuses was then classified into type I (below 0.30), type II (0.30–0.60), and type III (above 0.60). These steps allowed the classification of school campus service spaces within the research area, along with an analysis of the factors behind the spatial distribution mode of campus services, as illustrated in Figure 2.
3.3.4. Youth suitability Evaluation of Primary School Campuses
The theoretical underpinning of this study’s investigation into the youth suitability of school campuses is rooted in the potential model, a refined version of Hansen’s gravity model, which has been extensively utilized in the field of spatial accessibility [46,47,48]. Leveraging Equation (1), a widely accepted formulation of the latent capacity framework that considers the decay of the geographical influence of suppliers and demanders alike with distance, as well as the effects of self-propagation by both parties [49], this research employed this sophisticated model to grapple with school accessibility as a critical determinant of youth suitability of school campuses.
where the accessibility of residential area I to school campus , denoted as , was determined by considering the service attraction of school campus j, represented by , and the negative impact of residential service demand, denoted as . The actual distance between residential area I and school campus , denoted as , was also factored in and multiplied by a travel friction coefficient β to account for any hindrances in travel. Moreover, the number of school campuses and residential areas, represented by n and m, respectively, along with the population of each housing area K in the vicinity of school campus , denoted as Pk, were also considered in this equation.
Py-GIS technology has revolutionized geospatial data analysis and visualization. The combination of Python with GIS software has opened vast new possibilities for data processing, management, and automation. Considering the challenges posed by the scale of data (encompassing both geospatial and non-spatial attributes) and the complexity of the calculations involved, as well as the limitations of the existing GIS software in evaluating the youth suitability of school campuses, this study undertook a cutting-edge approach to customizing a Python script tool for assessing the youth suitability of school campuses based on the refined mode [50]. The approach represents a powerful and efficient means of automated evaluation of the youth suitability of school campuses.
The methodology for constructing this tailored tool was multi-faceted, entailing: (1) composing a Python source code using the Jupyter notebook and storing it as a file with a .py extension; (2) generating a new toolbox through ArcMap under the “My Toolbox” mode, in which the tools were replaced; and (3) via the Script Tool Wizard, specifying the tool name, label, and descriptive attributes, assigning the Python script file, and setting the running parameters. This primary functioning coding for the tool (i.e., the core content of the aforementioned .py file) is self-evident, and its execution time was a mere 56 s.
3.3.5. Spatial Interpolation-Based Estimation of the Suitability of School Campuses for Youth Services in Residential Areas
Given the notion that neighboring residential areas tend to have similar accessibility to school campuses, both in terms of quantity and quality, it is reasonable to posit that the youth suitability of school campuses available to neighboring areas may be similarly related and connected. Consequently, this study introduces the novel notion of “the youth suitability of school campuses” in order to better comprehend the implications of spatial variations in youth suitability of school campus services in local residential areas. To achieve this aim, the research employs the method of spatial interpolation, which involves transforming discrete point data into continuous data surfaces, thus allowing for a comprehensive evaluation of the youth suitability of school campuses at multiple locations within the research area.
There exists a vast range of interpolation techniques, each varying in sophistication and accuracy. Given the limited sampling sites in the research [51], the optimum and non-bias linear regression method based on temporal auto correlation, known as ordinary kriging interpolation, is preferred. This technique utilizes the structures of the semi-variogram, as well as the database of the focused circumferences, to foresee the value of a variable at non-sampled sites via a linear combination of point values of a regionalized variable or averages on blocks of a regionalized variable (Equation (2)) [52,53]. Thus, the study adopts kriging interpolation to realize the aforementioned objective. In essence, the youth suitability of all accessible campuses within a 2 km radius of every road center was summed to determine the youth suitability of school campus services. Subsequently, the youth suitability of school campuses at each site in the study region was assessed using the ordinary kriging interpolation kit, on the basis of ArcGIS [54], with the youth suitability of school campuses at the center of every street serving as the counterpart value. Lastly, the spatial distribution map of the youth suitability of school campuses in the study region was utilized to assess the implications of the space variance in the youth suitability of the school campuses on regional residential spaces’ public school campuses services.
where epitomizes the calculated value of the youth suitability of school campus service at the point , whereas embodies the factual value of point , signifying the youth suitability of school campus service at the center of every street. The parameter n signifies the quantity interpolated from known factual points, which in the investigation is 97, or the total amount of streets surveyed. Moreover, the coefficient represents the kriging weight coefficient, which allocates weights to the neighboring points based on their proximity and spatial correlation to the estimation point.
4. Results
4.1. Evaluation Outcomes
By means of this previously mentioned methodology, the study assessed the aptness of school campuses for the younger population in the Shenzhen Central District by scrutinizing various indicators, including, but not limited to, spatial accessibility, study and recreational activities, environmental comfort, and safety of the school campuses (as displayed in Table 2).
Correspondingly, if the suitability of public-school campuses is below 0.30 or even lower, the school campuses would be subject to a thorough renovation, since most of its facilities and campus design fail to meet the demands of children. Meanwhile, if the suitability of public-school campuses is above 0.60 and closer to 1.0 relatively, the spatial design of school campuses could suit the distinct needs of children. A comprehensive examination of the descriptive statistics manifests conspicuous disparities in the youth friendliness of school campuses across different administrative regions within the central district. Of these regions, Nanshan District exhibited a superior average value regarding the youth suitability, accessibility, study and leisurely entertainment opportunities, environmental comfort, and safety of the school campuses, significantly surpassing the overall research area’s mean (0.49). Notably, Yantian and Luohu had relatively lower average values.
4.2. The Geographic Variations and Distinctive Characteristics
Drawing upon the findings delineated above, through the meticulous application of cutting-edge cartographic techniques in ArcMap 10.3, including the strategic interweaving of school campus strata, administrative demarcations, circumferential city ring lines, and elevated highways, and leveraging the discerning algorithmic framework of Jenks Natural Breaks, a refined rendering of campus components was synthesized to capture the nuanced variation in youth suitability values across distinct school grounds. This comprehensive and intricate analysis culminated in the development of a visually captivating and intellectually stimulating spatial distribution map, showcased in Figure 3, that elucidates the spatial pattern in the youth suitability of school campuses at the heart of the central region.
Figure 3 shows school campuses in Shenzhen Central District in three tiers based on their youth suitability score. A space-based analysis of these campuses divulges an evident trend in decreasing youth suitability from the inner to the outer ring within the scope of the city. Moreover, the distribution delineates the following patterns: (1) a majority of school campuses with a higher youth suitability rating are situated within the inner ring and stretch from the southwestern (Nanshan District) to the northwestern regions; (2) campuses with a middle youth suitability rating are also predominantly located in the inner region, with the number of high-youth suitability campuses declining precipitously in the central and surrounding areas; (3) school campuses of poor suitability are largely concentrated in the outer perimeter, spanning from the southern part (Futian District) to the central area of Yantian.
At first glance, the youth suitability landscape in each district appears unique; however, upon closer inspection, it is discernible that districts with a higher level of youth suitability in school campuses (such as Futian and Nanshan) own the features of a “high center”, as those possessing a decreased degree of youth suitability (within school campuses) exhibit the attributes of a “low center”.
The aforementioned evidence highlights a noteworthy contrast in the spatial pattern displaying the youth suitability of school campuses in the central regions of Shenzhen when compared to small city centers [55]. Conventionally, the youth suitability of school campuses within the central regions of mid-sized prefectural-grade urban hubs is typified by a lower central region and higher circumference; however, this is never the case in Shenzhen Center District. The divergence might be attributed to a myriad of factors, including population, economic, and social development disparities.
To begin with, the economical and education features of residency in the central regions of a metropolis may engender a greater emphasis on the quality requirements of school campuses when compared to those living within the central regions of mid-sized prefectural-grade urban hubs. Furthermore, the Shenzhen metropolis displays a clear trend in residential suburbanization [56], which has led to a diminished influence of population factors on the youth suitability of school campuses in its central region when compared to small prefecture-level cities.
Additionally, small prefecture-level cities often suffer from a lower level of social and economic development than their metropolitan counterparts, leading to a lack of attention given to improving the youth suitability of school campuses by planning and management departments in such areas [57]. Despite the implementation of similar promotional activities in both the central regions of Shenzhen and mid-sized prefectural-grade urban hubs, the youth suitability of school campuses in the central regions of mid-sized prefectural-grade urban hubs remains decreased due to the natural allure of the surrounding environment. Consequently, the spatial distribution of youth suitability in school campuses in small prefecture-level cities generally exhibits lower central region and higher circumference characteristics [58]. Nevertheless, the projects implemented in the Shenzhen Central District have significantly enhanced the youth suitability of school campuses and caused the region to deviate from the standard pattern observed in small city centers [59,60].
5. Discussion
By incorporating the youth suitability of all reachable primary schools in a 2 km radius from every road center into the ‘caging’ area of the respective road factors, we were able to derive the youth suitability of campus services at every road center. Employing the geospatial data interpolation methodology aforementioned, we ascertained the youth suitability of campus services at any location within the research area. Given that accessibility serves as a reflection of the youth suitability of school campuses from a spatial perspective and an objective parameter in the evaluation system, we segmented the study region into distinct spaces of school services (Table 3) based on the intersection between the accessibility of the school service at given locations and overall youth suitability of all the school campuses (Figure 4). Meanwhile, as factors of population also play an important role in the progress of evaluation, the index mean incorporates the fifth parameter (population impact). In the process, the suitability of public-school campuses were classified into type I (below 0.30), type II (0.30–0.60), and type III (above 0.60). This approach allowed us to explore the discrepancies and the underlying factors that influence the youth suitability of the school services in various residential spaces in the study region.
Drawing on the empirical data presented in Figure 4, Table 3, and other relevant statistical yearbooks, a comprehensive analysis posits that the spatial distribution of school services is primarily influenced by an interplay of population, economic, geographic, and political elements. Notably, the internal circle of Shenzhen Central District serves as a pulsating hub of commercial and intellectual growth. Leveraging the region’s strategic location, as well as the flourishing education development surrounding the ring boundary, type III space (situated within the interior space) boasts an enviable network of urban roads, state-of-the-art campus facilities, and a plethora of amenities. With school campuses that are generally comfortable (Table 3), the youth suitability of school services in this area reaches unprecedented heights in terms of accessibility, safety, study, recreational entertainment, and other critical aspects. Moreover, given that the government occupies a substantial chunk of space in the region, the influence of demographic change is rather inconsequential, thereby buoying the youthful accessibility of school services in type III space. Despite the proximity of type II space to type III space, the former exhibits comparably smaller areas, lower attraction, and reduced environmental comfort in its school campuses. Consequently, type II school services remain suboptimal in terms of suitability as well as accessibility for the youth.
In the realm of urban planning, it is indubitable that the traffic system and the quality of transport beyond the central area require better enhancement, and that the accessibility of school campuses in type I and II residential areas remains woefully inadequate. Furthermore, the copious and persistent population in Luohu and Futian, coupled with the exorbitant population density in the eastern precincts of Luohu and Yantian, exerts a formidable influence on the youthful fitness of school campuses in type I residential spaces. As a consequence, the youthful suitability of school services in these areas is rendered at an abysmally low level, making it one of the least favorable places within the urban area.
When contrasting type I with type III, it becomes apparent that the latter is comparatively less vulnerable to the impact of population density, owing to a multitude of factors. Luohu and Nanshan have made considerable strides in education over recent years, resulting in a marked enhancement in their urban landscape. In the Qianhai and Shekou areas, the campus facilities and environmental comfort of schools have seen rapid improvement, directly translating into a beneficial effect on the youth suitability of local school campuses. Furthermore, Luohu boasts a significant youth population, and although the youth suitability of primary schools in this district may be lower than desirable, it compensates through its copious school campuses, which are the most plentiful in the entire city. When coupled with the high-youth suitability school campuses of the Nanshan Central District, it becomes clear that type III space enjoys a superior youth suitability rating when compared to type I space.
As far as type III residential space is concerned, the Futian district is grappling with a youth population at a normal rate. However, it has made active efforts to improve the comfort and amenities of public service and surroundings, in line with the administration’s directives on “Pleasure Childhood Care” [61] and “Guidelines for the Construction of Child-Friendly Cities” [62]. Consequently, the school campuses in the region have achieved a leading status in terms of attraction, accessibility, comfort, safety, and study entertainment for the youth, reflecting a high youth suitability rating of school services in type III residential spaces.
Overall, the regional services and positioning, the commercial and educational development, and the practices of local youth-oriented policies all played an instrumental role in improving the youth suitability in respective school campus at the central district of Shenzhen. Nevertheless, the huge area population and high population concentration pose significant obstacles to improving the youth suitability of local school campuses [63].
6. Conclusions
The dearth of studies concerning the incessant improvements of accessible public places intended to nurture a flourishing youthful city is a glaring reality [64]. In view of this, the objective of this research is to provide an erudite point of reference for decision makers, one that is rooted in scientific principles, in order to optimize the suitability of school campuses for children in Shenzhen and other vibrant Chinese cities. This, in turn, would ensure the city’s sustainable development. The findings of this study revealed that: (1) the youth suitability of school campuses situated in Shenzhen Central District gradually declines as one moves from the innermost to the outermost ring, and (2) the accessibility of school campuses in the same district is generally low, as they comprise three distinct service spaces. Furthermore, this article posited that effective improvements in the youth suitability of primary school campuses in Shenzhen can be achieved by means of the promotion of the advancement of education, the successful execution of youth care policies that are regionally specific, and the strategic utilization of the functional positioning advantages offered by the region.
The methodology devised for the research will revolutionize the efficiency of the evaluation of school campuses’ youth suitability and open up a fresh vista for scholars grappling with similar issues. In the case of other cities, provided that scholars have unfettered access to geospatial data, population composition data, and youth suitability score data pertaining to school campuses, the methodology articulated in the study can be customized to fashion a bespoke evaluation instrument that expedites a meticulous and accurate appraisal of the youth suitability status of school campuses. It is imperative to note that, given the distinctive features of young people in divergent cities, other scholars should adroitly calibrate the index system or weighting regarding the regional context as well as tenets of youth suitability in school campuses. This would not only boost the impartiality of the evaluation, but also amplify the practicality in their advice.
The salient outcomes expounded in the research, when integrated with the current movement toward equitable and uniform allocation of urban public resources in developing societies, combined with China’s prescriptive guidance on the development of livable environments for the youth, yield critical impacts on enhancing the youth suitability for school campuses in the Central District of Shenzhen and its counterparts. Primarily, it is imperative to underscore the indirect role that the regional economy and education play in the youth suitability of public-school campuses. As evinced by the impressive youth suitability ratings of public-school campuses in Nanshan and Futian districts, regional policies pertaining to economy and education have the potential to galvanize, facilitate, or harmonize city construction efforts. Consequently, educational and construction strategies, such as child-centered pedagogy and youth-oriented safety design, can be leveraged to refine the built environment of public-school campuses to suit the preferences and proclivities of young people [65]. By doing so, the improvement in the youth suitability of public-school campus services can be expedited, rendering a more optimized and gratifying learning experience for the youth [66,67].
In summary, to effectively address the issue of public-school campus suitability for youths, it is essential to adopt a comprehensive approach that encompasses diverse factors. First, the present study emphasizes the need to promote education and public infrastructure development based on the regional context, taking cues from the eastern Yantian District and southern Futian District. Second, the study underscores the pivotal role of public-school campus accessibility in determining their suitability for youths. Specifically, the low accessibility of public-school campuses in a residential area corresponds to a low level of youth suitability, indicating the importance of addressing accessibility issues as a primary objective. In this regard, strategies such as the creation of youth-friendly transport, improving neighborhood accessibility, enhancing the attractiveness of public-school campuses, and increasing the number and area of public school campuses with barrier-free facilities, can significantly enhance public school campus accessibility and youth suitability. Lastly, the study highlights the significance of policy support and demonstration guidance in enhancing public school campus suitability for youths in underdeveloped areas. Identifying appropriate model communities and following a youth happiness index system that stresses comfort, security, and the efficient administration of study spaces and settings on public school campuses might help achieve this.
The greatest travel distance for the youths was conservatively established at 2 km, and although the index scores of certain public-school campuses were generated via interviews and the index weights were decided based on expert opinion, the research is not without its limits. First off, the subjective nature of the index value setting and the fact that most interviews came from youths (under 14) may have caused some divergence in the assessment of those public-school campuses’ youth suitability. Second, the threshold of maximal travel distance for youths remains a controversial issue in the academic field. In this paper, the distance criterion was only established based on the views of a handful of scholars and the predominant forms of transport (not simply walking) used by young people in Shenzhen. To enhance the reliability of the research conclusions, further inquiry is warranted into the method of gathering the youths’ scoring data and the greatest distance criteria for them. Thus, future research endeavors are poised to address these concerns and reinforce the veracity of our findings.
Author Contributions
Methodology, Y.L.; Formal analysis, Y.L.; Resources, C.C.; Writing—review & editing, Y.L. and C.C.; Supervision, C.C.; Project administration, C.C. All authors have read and agreed to the published version of the manuscript.
Funding
This research received no external funding.
Data Availability Statement
The geospatial data could be obtained from http://pnr.sz.gov.cn/xxgk/sjfb/tjsj/ (accessed on 2 March 2022). Meanwhile, the data of interviews will not be disclosed as a result of privacy and an ongoing research in the lab.
Conflicts of Interest
The authors declare no conflict of interest.
References
- Chong, Z.; Pan, S. Understanding the Structure and Determinants of City Network through Intra-Firm Service Relationships: The Case of Guangdong-Hong Kong-Macao Greater Bay Area. Cities 2020, 103, 102738. [Google Scholar] [CrossRef]
- Liu, K.; Xue, Y.; Chen, Z.; Miao, Y.; Shi, J. Economic Spatial Structure of China’s Urban Agglomerations: Regional Differences, Distribution Dynamics, and Convergence. Sustain. Cities Soc. 2022, 87, 104253. [Google Scholar] [CrossRef]
- Mori, T.; Smith, T.E.; Hsu, W.-T. Common Power Laws for Cities and Spatial Fractal Structures. Proc. Natl. Acad. Sci. USA 2020, 117, 6469–6475. [Google Scholar] [CrossRef] [PubMed]
- Rivera-Gonzalez, C.; Holguin-Veras, J.; Calderon, O. Supply-Chain-Focused Measures of Centrality and Spread in Metropolitan Areas. J. Transp. Geogr. 2023, 107, 103553. [Google Scholar] [CrossRef]
- Wang, Y.; Niu, Y.; Li, M.; Yu, Q.; Chen, W. Spatial Structure and Carbon Emission of Urban Agglomerations: Spatiotemporal Characteristics and Driving Forces. Sustain. Cities Soc. 2022, 78, 103600. [Google Scholar] [CrossRef]
- Wei, C.; Taubenböck, H.; Blaschke, T. Measuring Urban Agglomeration Using a City-Scale Dasymetric Population Map: A Study in the Pearl River Delta, China. Habitat Int. 2017, 59, 32–43. [Google Scholar] [CrossRef]
- Shankar, S.; Naveen, K.R.; Janaki, R.S.; Cps, H.; Karthik, R.S. Ergonomic evaluation of ergonomically designed chalkboard erasers on shoulder and hand-arm muscle activity among college professors. Int. J. Ind. Ergonom. 2021, 84, 103170. [Google Scholar]
- Zhu, R.X. Study on neck muscle fatigue identification of combine harvester deriver based on sEMG. Ind. Eng. Manag. 2020, 25, 138–144. [Google Scholar]
- Wang, Y.; Wang, W.; Bao, D.F.; Luo, Z.Z. Research on the physiological load of interactive gesture in elderly based on sEMG. CCF Trans. Pervasive Comput. Interact. 2021, 3, 186–198. [Google Scholar] [CrossRef]
- Qi, T.; Zhang, G.; Wang, Y.; Liu, C.; Li, X. Research on landscape quality of country parks in Beijing as based on visual and audible senses. Urban For. Urban Green. 2017, 26, 124–138. [Google Scholar] [CrossRef]
- Carstens, D.Y. Site Planning and Design for the Elderly: Issues, Guildelines and Alternatives; John Wiley & Sons: Hoboken, NJ, USA, 1993. [Google Scholar]
- Marcus, C.C.; Sachs, N.A. Therapeutic Landscapes: An Evidence-Based Approach to Designing Healing Gardens and Restorative Outdoor Spaces; John Wiley & Sons: Hoboken, NJ, USA, 2013. [Google Scholar]
- Cao, Y. Research on Appropriate Public Space Based on Public Health in the Context of Population Aging. Master’s Thesis, North China University of Technology, Beijing, China, 2015. [Google Scholar]
- Abildtrup, J.; Garcia, S.; Olsen, S.B.; Stenger, A. Spatial Preference Heterogeneity in Forest Recreation. Ecol. Econ. 2013, 92, 67–77. [Google Scholar] [CrossRef]
- Agimass, F.; Lundhede, T.; Panduro, T.E.; Jacobsen, J.B. The Choice of Forest Site for Recreation: A Revealed Preference Analysis Using Spatial Data. Ecosyst. Serv. 2018, 31, 445–454. [Google Scholar] [CrossRef]
- Li, M. Effect of the Plant Visual Characteristics on Configuration of Landscape Space. Mol. Plant Breed. 2018, 24, 8239–8243. [Google Scholar]
- Qiu, Y.; Gao, J.; Zhan, Q. The GIS-based visual landscape evaluation in mountain area: A case study of Mount Nan-kun National Forest Park, Guangdong Province. Acta Ecol. Sin. 2011, 31, 1009–1020. [Google Scholar]
- Liu, X.; Li, Y.; Chen, G. Automatic Edge Matching and Attribute Checking of Line Features Based on Arcpy. Bull. Surv. Map. 2016, 62, 114–117. [Google Scholar]
- Maurizio, B.; Roberto, P. Creativity and Social Capital: The Pillars of Venice’s Success in the New European Bauhaus Programme. Soc. Sci. 2022, 11, 545. [Google Scholar]
- Rahman, K.M.A.; Zhang, D. Analyzing the Level of Accessibility of Public Urban Green Spaces to Different Socially Vulnerable Groups of People. Sustainability 2018, 10, 3917. [Google Scholar] [CrossRef]
- Scarfò, F.; Mercurio, R.; del Peso, C. Assessing visual impacts of forest operations on a landscape in the Serre Regional Park of southern Italy. Landsc. Ecol. Eng. 2013, 9, 1–10. [Google Scholar] [CrossRef]
- Wang, X.; Rodiek, S. Older Adults’ Preference for Landscape Features Along Urban Park Walkways in Nanjing, China. Int. J. Environ. Res. Pub. Health 2019, 16, 3808. [Google Scholar] [CrossRef] [PubMed]
- Eastman, J.R.; Jiang, H.; Toledano, J. Multi-Criteria and Multi-Objective Decision Making for Land Allocation Using GIS; Springer: Dordrecht, The Netherlands, 1998; pp. 227–251. [Google Scholar]
- Holland, J.H. Adaptation in Natural and Artificial Systems: An Introductory Analysis with Application to Biology, Control, and Artificial Intelligence; University of Michigan Press: Ann Arbor, WI, USA, 1975. [Google Scholar]
- Svoray, T.; Bar, P.; Bannet, T. Urban land-use allocation in a Mediterranean ecotone: Habitat Heterogeneity Model incorporated in a GIS using a multi-criteria mechanism. Landsc. Urban Plan. 2005, 72, 337–351. [Google Scholar] [CrossRef]
- Gómez, F.; Cueva, A.; Valcuende, M.; Matzarakis, A. Research on ecological design to enhance comfort in open spaces of a city (Valencia, Spain). Utility of the physiological equivalent temperature (PET). Ecol. Eng. 2013, 57, 27–39. [Google Scholar] [CrossRef]
- Xu, J.; Wei, Q.; Huang, X.; Zhu, X.; Li, G. Evaluation of human thermal comfort near urban waterbody during summer. Build. Environ. 2010, 45, 1072–1080. [Google Scholar] [CrossRef]
- Mahmoud, A. Analysis of the microclimatic and human comfort conditions in an urban park in hot and arid regions. Build. Environ. 2011, 46, 2641–2656. [Google Scholar] [CrossRef]
- Taleghani, M.; Berardi, U. The effect of pavement characteristics on pedestrians’ thermal comfort in Toronto. Urban Clim. 2018, 24, 449–459. [Google Scholar] [CrossRef]
- Yang, F.; Lau, S.; Qian, F. Thermal comfort effects of urban design strategies in high-rise urban environments in a sub-tropical climate. Arch. Sci. Rev. 2011, 54, 285–304. [Google Scholar] [CrossRef]
- Rosso, F.; Golasi, I.; Castaldo, V.; Piselli, C.; Pisello, A.; Salata, F.; Ferrero, M.; Cotana, F.; Vollaro, A.D.L. On the impact of innovative materials on outdoor thermal comfort of pedestrians in historical urban canyons. Renew. Energy 2018, 118, 825–839. [Google Scholar] [CrossRef]
- Rosso, F.; Pisello, A.; Cotana, F.; Ferrero, M. On the thermal and visual pedestrians’ perception about cool natural stones for urban paving: A field survey in summer conditions. Build. Environ. 2016, 107, 198–214. [Google Scholar] [CrossRef]
- You, W.; Shen, J.; Ding, W. Improving Wind Environment of Residential Neighborhoods by Understanding the Relationship between Building Layouts and Ventilation Efficiency. Energy Procedia 2017, 105, 4531–4536. [Google Scholar] [CrossRef]
- Schatzmann, M.; Britter, R. Quality assurance and improvement of micro-scale meteorological models. Int. J. Environ. Pollut. 2011, 44, 139–146. [Google Scholar] [CrossRef]
- Blocken, B.; Stathopoulos, T.; Carmeliet, J.; Hensen, J. Application of computational fluid dynamics in building performance simulation for the outdoor environment: An overview. J. Build. Perform. Simul. 2011, 4, 157–184. [Google Scholar] [CrossRef]
- Rantanen, T.; Portegijs, E.; Viljanen, A.; Eronen, J.; Saajanaho, M.; Tsai, L.-T.; Kauppinen, M.; Palonen, E.-M.; Sipilä, S.; Iwarsson, S.; et al. Individual and environmental factors underlying life space of older people—Study protocol and design of a cohort study on life-space mobility in old age (LISPE). BMC Public Heal 2012, 12, 1018. [Google Scholar] [CrossRef] [PubMed]
- Yung, E.H.; Conejos, S.; Chan, E.H.; Chan, E.H.W. Social needs of the elderly and active aging in public open spaces in urban renewal. Cities 2016, 52, 114–122. [Google Scholar] [CrossRef]
- Thompson, C.W. Urban open space in the 21st century. Landsc. Urban. Plan. 2002, 60, 59–72. [Google Scholar] [CrossRef]
- Pasaogullari, N.; Doratli, N. Measuring accessibility and utilization of public spaces in Famagusta. Cities 2004, 21, 225–232. [Google Scholar] [CrossRef]
- Philips, D.R.; Siu, O.; Yeh, A.G.O.; Cheng, K.H.C. The impacts of dwelling conditions on older persons’ psychological well-being in Hong Kong: The mediating role of residential satisfaction. Soc. Sci. Med. 2005, 60, 2785–2797. [Google Scholar] [CrossRef]
- Fernández-Portero, C.; Alarcón, D.; Barrios Padura, A. Dwelling conditions and life satisfaction of older people through residential satisfaction. J. Environ. Psychol. 2017, 49, 1–7. [Google Scholar] [CrossRef]
- Liu, Y.; Dijst, M.; Faber, J.; Geertman, S.; Cui, C. Healthy urban living: Residential environment and health of older adults in Shanghai. Health Place 2017, 47, 80–89. [Google Scholar] [CrossRef]
- Zhang, Z.; Zhang, J. Perceived residential environment of neighborhood and subjective well-being among the elderly in China: A mediating role of sense of community. J. Environ. Psychol. 2017, 51, 82–94. [Google Scholar] [CrossRef]
- Yan, B.; Gao, X.; Lyon, M. Modeling satisfaction amongst the elderly in different Chinese urban neighborhoods. Soc. Sci. Med. 2014, 118, 127–134. [Google Scholar] [CrossRef]
- Wen, C.; Albert, C.; Von Haaren, C. The elderly in green spaces: Exploring requirements and preferences concerning nature-based recreation. Sustain. Cities Soc. 2018, 38, 582–593. [Google Scholar] [CrossRef]
- De Vries, S.; Verheij, R.A.; Groenewegen, P.P.; Spreeuwenberg, P. Natural environments—Healthy environments? An exploratory analysis of the relationship between greenspace and health. Environ. Plan. A 2003, 35, 1717–1731. [Google Scholar] [CrossRef]
- Takano, T.; Nakamura, K.; Watanabe, M. Urban residential environments and senior citizens’ longevity in megacity areas: The importance of walkable green spaces. J. Epidemiol. Community Health 2002, 56, 913–918. [Google Scholar] [CrossRef]
- Maller, C.; Townsend, M.; Pryor, A.; Brown, P.; St Leger, L. Healthy nature healthy people: ‘Contact with nature’ as an upstream health promotion intervention for populations. Health Promot. Int. 2006, 21, 45–54. [Google Scholar] [CrossRef]
- De Vries, S. Nearby nature and human health: Looking at mechanisms and their implications. In Innovative Approaches to Researching Landscape and Health: Open Space: People Space 2, 1st ed.; Thompson, W.C., Aspinall, P., Bell, S., Eds.; Routledge: London, UK, 2010; pp. 77–96. [Google Scholar]
- Van den Berg, A.; Joye, Y.; De Vries, S. Chapter5: Health benefits of nature. In Environmental Psychology: An Introduction, 1st ed.; Steg, L., van den Berg, A.E., De Groot, J.I., Eds.; The British Psychological Society: Chichester, UK, 2012; pp. 50–55. [Google Scholar]
- Kemperman, A.; Timmermans, H. Green spaces in the direct living environment and social contacts of the aging population. Landsc. Urban Plan. 2014, 129, 44–54. [Google Scholar] [CrossRef]
- Finlay, J.; Franke, T.; McKay, H.; Sims-Gould, J. Therapeutic landscapes and wellbeing in later life: Impacts of blue and green spaces for older adults. Health Place 2015, 34, 97–106. [Google Scholar] [CrossRef]
- Moran, M.; van Cauwenberg, J.; Hercky-Linnewiel, R.; Cerin, E.; Deforche, B.; Plaut, P. Understanding the relationships between the physical environment and physical activity in older adults: A systematic review of qualitative studies. Int. J. Behav. Nutr. Phys. 2014, 11, 79. [Google Scholar] [CrossRef]
- Suter, E.; Baylin, D. Choosing art as a complement to healing. Appl. Nurs. Res. 2007, 20, 32–38. [Google Scholar] [CrossRef]
- Steptoe, A.; Shankar, A.; Demakakos, P.; Wardle, J. Social isolation, loneliness, and all-cause mortality in older men and women. Proc. Natl. Acad. Sci. USA 2013, 110, 5797–5801. [Google Scholar] [CrossRef]
- Han, L.; Zhao, J.; Gao, Y.; Gu, Z.; Xin, K.; Zhang, J. Spatial distribution characteristics of PM 2.5 and PM 10 in Xi’an City predicted by land use regression models. Sustain. Cities Soc. 2020, 61, 102329. [Google Scholar] [CrossRef]
- Cao, K.; Batty, M.; Huang, B.; Liu, Y.; Yu, L.; Chen, J. Spatial multi-objective land use optimization: Extensions to the non-dominated sorting genetic algorithm-II. Int. J. Geogr. Inf. Sci. 2011, 25, 1949–1969. [Google Scholar] [CrossRef]
- The Midterm Assessment Report of 12th Five-Year Planning of Harbin Aging Enterprise. Available online: www.hrbllw.gov.cn/attachment/20150511095602498.doc (accessed on 19 May 2016).
- 13th Five-Year Planning of Harbin Aging Enterprise. Available online: www.hrbllw.gov.cn/attachment/20160509090849939.doc (accessed on 2 July 2016).
- Wilson, J.Q.; Kelling, G.L. Broken windows. In Critical Issues in Policing: Contemporary Readings, 1st ed.; Dunham, R., Alpert, G., Eds.; Waveland Press: Long Grove, IL, USA, 1989; pp. 395–407. [Google Scholar]
- Gibson, B.D.; Werner, C. Airport waiting areas as behavior settings: The role of legibility cues in communicating the setting program. J. Pers. Soc. Psychol. 1994, 66, 1049. [Google Scholar] [CrossRef]
- Kane, R.A. Accomplishments, problems, trends and future challenges. In Assessing Older Persons: Measures, Meaning, and Practical Applications, 1st ed.; Kane, R.L., Kane, R.A., Eds.; Oxford University Press: Oxford, UK, 2000; p. 526. [Google Scholar]
- Ou Yang, Y.P.; Shieh, H.M.; Leu, J.D.; Tzeng, G.H. A novel hybrid MCDM model combined with DEMATEL and ANP with applications. Int. J. Oper. Prod. Manag. 2008, 5, 160–168. [Google Scholar]
- Hu, K.H.; Chen, F.H.; Tzeng, G.H. Evaluating the Improvement of Sustainability of Sports Industry Policy Based on MADM. Sustainability 2016, 8, 606. [Google Scholar] [CrossRef]
- Huang, K.W.; Huang, J.H.; Tzeng, G.H. New hybrid multiple attribute decision-making model for improving competence sets: Enhancing a company’s core competitiveness. Sustainability 2016, 8, 175. [Google Scholar] [CrossRef]
- Lu, M.T.; Lin, S.W.; Tzeng, G.H. Improving RFID adoption in Taiwan’s healthcare industry based on a DEMATEL technique with a hybrid MCDM model. Decis. Support Syst. 2013, 56, 259–269. [Google Scholar] [CrossRef]
- Lu, M.T.; Tzeng, G.H.; Cheng, H.; Hsu, C.C. Exploring mobile banking services for user behavior in intention adoption: Using new hybrid MADM model. Serv. Bus. 2015, 9, 541–565. [Google Scholar] [CrossRef]
Figure 1.
Map of Shenzhen City.

Figure 2.
Workflow of evaluation.

Figure 3.
The spatial distribution pattern of the youth suitability of school campuses.

Figure 4.
School campus index mean.


Table 1.
Evaluation system of the youth suitability of primary school campuses.
| Overall Objective A | Main Indices B (Weight B—A) | Secondary Indices C | |||
|---|---|---|---|---|---|
| Name | Description | Weight (C—B) | Weight (C—A) | ||
| The youth suitability of campus | Spatial Accessibility (0.2) | Traffic distance Friction coefficient Surrounding population School attraction | The shortest traffic distance from residential space to the school Friction coefficient for the children to school along the shortest path Total population within a certain traffic distance from school Attraction of school for children | Calculating by the potential model formula | |
| Study and Recreation (0.3) | Capacity of study facilities Capacity of entertainment facilities | The degree to which quantity and type meet the needs of the children The degree to which quantity and type meet the needs of the children | 0.33 0.67 | 0.10 0.20 | |
| Environmental Comfort (0.42) | Capacity of classroom tables and chairs Classroom space scale Walkway spaciousness Pleasure extent of green spaces Public toilet allocation | The degree to which quantity and type of tables and chairs suit the demands of the children Classroom size The spaciousness of the main pedestrian passages General degree of pleasure of green spaces on the school campus If the quantity and location of public toilets are appropriate for the children | 0.29 0.42 0.10 0.14 0.05 | 0.12 0.18 0.04 0.06 0.02 | |
| Environmental safety (0.08) | Extent of space enclosure Identity plate clarity Configuration degree of soft ground Configuration degree of lighting Channel of barrier-free allocation | The extent of campus enclosure Whether the campus site of the sign is suitable or salient Scale and extent of soft ground in constant active space If there is adequate lighting in the school campus If barrier-free access to is set in types of places in campus | 0.25 0.25 0.125 0.125 0.25 | 0.02 0.02 0.01 0.01 0.02 | |
Table 2.
Evaluation results of the youth suitability of public primary schools.
| School Name | Youth Suitability | School Name | Youth Suitability |
|---|---|---|---|
| Haibin Experimental Primary School, Shenzhen Bay department | 0.77 | Qianhai School | 0.48 |
| Shenzhen Jinglian Primary School | 0.76 | Nanyuan Primary School | 0.48 |
| The second Experimental Primary School of South University of Science and Technology | 0.75 | Nantou City Primary School | 0.47 |
| South University of Science and Technology Experimental Primary School | 0.74 | Nanhai Primary School | 0.46 |
| Shenzhen University Town Taoyuan Experimental School | 0.74 | Gangxia Primary School | 0.46 |
| Xiasha Primary School | 0.73 | Fuhua Primary School | 0.45 |
| Nanshan Experimental School Baimang Primary School | 0.73 | Sunshine Primary School | 0.43 |
| Nanshan Experimental School, Liwan Primary School | 0.73 | Nanshan Experimental School, Lilin Primary School | 0.43 |
| Nanshan Second Foreign Language School | 0.72 | Nanshan Second Experimental School | 0.42 |
| Haitao Primary School | 0.72 | Shenzhen Huaxin Primary School | 0.42 |
| Gardener school | 0.71 | Nanhu Primary School | 0.42 |
| Shenzhen Bay School | 0.71 | Nanshan Experimental School, Dingtai Primary School | 0.41 |
| Gold Rush Mountain Primary School | 0.71 | Songping School Primary School | 0.41 |
| Luohu Primary School | 0.70 | Pingshan Primary School | 0.40 |
| Nanshan High School Affiliated to Beijing Normal University | 0.70 | Xili No. 2 Primary School | 0.40 |
| Nanshan Experimental School of Arts and Sciences | 0.69 | Nanshan Primary School | 0.39 |
| Xuefu Primary School (Haven Department) | 0.69 | Happy school | 0.39 |
| Jinglong Primary School | 0.69 | Shekou School Primary School | 0.38 |
| Honghu Primary School | 0.68 | Nanshan Affiliated Primary School of Beijing Normal University | 0.38 |
| Moon Bay Primary School | 0.67 | Nanshan Foreign Language School, Binhai Primary School | 0.37 |
| Chiwan School | 0.67 | Boxer Shouyi Zhongshan Memorial School | 0.37 |
| Yucai three small | 0.66 | Nanshan Experimental School Nantou Primary School | 0.36 |
| Xinzhou Primary School | 0.66 | Nanshan Foreign Language School, Mandarin Campus | 0.36 |
| Xili No. 2 Primary School | 0.64 | Shenzhen Futian District tianjian Primary School | 0.36 |
| Daxin Primary School | 0.64 | Le Qun Primary School | 0.36 |
| Qianhai Primary School | 0.64 | Tiandong Primary School | 0.35 |
| New lotus Primary School | 0.64 | LiuXian school | 0.35 |
| Tian Xin Primary School | 0.64 | Shenzhen Institute of Advanced Technology of Chinese Academy of Sciences | 0.34 |
| South Primary School | 0.63 | Houhai Primary School | 0.34 |
| Pearl light Primary School | 0.62 | Tanglang Primary School | 0.34 |
| Shixia School Primary School | 0.61 | Nanshan Foreign Language School, Keyuan Primary School | 0.33 |
| Shenzhen University Chengxi Li Experimental Primary School | 0.60 | Yantian Foreign Language Primary School | 0.32 |
| Nanyou Primary School | 0.60 | Haibin Experimental Primary School, Yukang Department | 0.32 |
| Yucai No. 2 Primary School | 0.60 | Shenzhen University Town Lihu Experimental School | 0.32 |
| Bamboo Primary School | 0.59 | Meisha Primary School | 0.31 |
| Zhuyuan Primary School | 0.58 | Futian Whampoa School | 0.31 |
| Funan Primary School | 0.56 | Dragon Ball School | 0.30 |
| Liyuan Primary School | 0.54 | Yucai four small | 0.29 |
| Huafu Primary School | 0.54 | Yuanling Experimental Primary School | 0.29 |
| Shenzhen Primary School | 0.53 | Hom Primary School | 0.28 |
| Hundred flowers Primary School | 0.52 | Yuanling Foreign Language Primary School | 0.28 |
| Nanshan Experimental School, Qilin Primary School | 0.52 | Lin yuan Primary School | 0.27 |
| Yucai No. 1 Primary School | 0.52 | Xiangshan Li Primary School | 0.27 |
| JingPeng Primary School | 0.51 | Lixiang School Primary School | 0.27 |
| OCT Primary School | 0.50 | Qianhai Harbor Primary School | 0.26 |
| Taoyuan Primary School | 0.49 | Songping No. 2 Primary School | 0.25 |
| Futian Primary School | 0.49 | Yantian District Foreign Language Primary School, Donghe Branch School | 0.25 |
| Yucai Taizi Bay School Primary School | 0.49 | Zhuo Ya Primary School | 0.24 |
| Haibin Experimental Primary School, Shenzhen Bay | 0.48 | Average | 0.49 |
Table 3.
Division of primary school service space in research area.
| Space Type | Space Location | School Campuses |
|---|---|---|
| I. low accessibility, low-youth suitability region (“low, low”) | Yantian district and some areas of Luohu | 28 school campuses in total |
| II. middle accessibility, middle-youth suitability region (“middle, middle”) | The eastern parts of Luohu, the southern part of Futian | 33 school campuses in total |
| III. high accessibility, super high-youth suitability region (“high, super-high”) | Central area of Nanshan and Futian | 36 school campuses in total |
Disclaimer/Publisher’s Note: The statements, opinions and data contained in all publications are solely those of the individual author(s) and contributor(s) and not of MDPI and/or the editor(s). MDPI and/or the editor(s) disclaim responsibility for any injury to people or property resulting from any ideas, methods, instructions or products referred to in the content. |
© 2023 by the authors. Licensee MDPI, Basel, Switzerland. This article is an open access article distributed under the terms and conditions of the Creative Commons Attribution (CC BY) license (https://creativecommons.org/licenses/by/4.0/).
Share and Cite
MDPI and ACS Style
Li, Y.; Chen, C. Evaluation of the Spatial Disparities in the Youth Suitability of Shenzhen Public Primary School Campuses. Buildings 2023, 13, 1306. https://doi.org/10.3390/buildings13051306
AMA Style
Li Y, Chen C. Evaluation of the Spatial Disparities in the Youth Suitability of Shenzhen Public Primary School Campuses. Buildings. 2023; 13(5):1306. https://doi.org/10.3390/buildings13051306
Chicago/Turabian StyleLi, Yixuan, and Chengyu Chen. 2023. "Evaluation of the Spatial Disparities in the Youth Suitability of Shenzhen Public Primary School Campuses" Buildings 13, no. 5: 1306. https://doi.org/10.3390/buildings13051306
Note that from the first issue of 2016, this journal uses article numbers instead of page numbers. See further details here.