
The Spatiotemporal Variation Characteristics of Urban Sustainability Based on the SDGs in Yangtze River Delta, China


1
iSMART, Qingdao University of Technology, Qingdao 266061, China
2
Research Institute for Science and Technology, Tokyo University of Science, Tokyo 125-8585, Japan
3
College of Architecture and Urban Planning, Qingdao University of Technology, Qingdao 266061, China
4
Piaggio Fast Forward Co., Ltd., Boston, MA 02129, USA
5
College of Architecture and the Built Environment, Thomas Jefferson University, Philadelphia, PA 19144, USA
6
Faculty of Environmental Engineering, The University of Kitakyushu, Kitakyushu 808-0135, Japan
*
Authors to whom correspondence should be addressed.
Buildings 2023, 13(8), 1909; https://doi.org/10.3390/buildings13081909
Submission received: 21 June 2023
/
Revised: 22 July 2023
/
Accepted: 24 July 2023
/
Published: 27 July 2023
(This article belongs to the Special Issue Sustainable Buildings and Cities)
Abstract
:At present, most developing countries need to improve the quality of the built environment by means of large-scale infrastructure construction, thereby promoting rapid urbanization. The quality of the built environment () and its environmental pressure () have become our primary focus to achieve a globally acknowledged vision of the Sustainable Development Goals (SDGs). In this study, we proposed an overall workflow by combining the proven urban sustainability () assessment tool with the evaluation process and the analysis of the spatiotemporal dimension to investigate the urban characteristics of the 41 cities in the Yangtze River Delta. Our results showed an upward trend of urban sustainability from 2010 to 2018, but there are still 19 cities with unsustainable urbanization processes. The megalopolis is rapidly progressing toward an imbalanced state. Specifically, the urban sustainability of the southern region performs better than the northern region, coastal cities perform better than the inland cities, and the regional peripheral cities perform better than the inner cities. Across the 41 cities in the delta, five different relational trends between and have been found to predict their future development. The results of this research will help decision-makers to coordinate the future development of regional integration between cities and to target the alleviation of the adverse chain reaction brought about by the situation of imbalance or further improving urban sustainability.
1. Introduction
Urban areas, due to their high population concentration, both drive and bear development challenges [1,2]. During urbanization, cities often face problems such as limited infrastructure land, traffic congestion, harsh environments, and the spread of diseases, especially in developing countries like China [3,4,5,6]. These challenges stem from competing interests between the urban built and natural environments [7,8,9]. Despite these obstacles, the urban built environment can enhance local citizens’ quality of life. Factors such as economic growth, functional land development, residential areas, efficient transit networks, and external competitiveness are critical to promoting healthy urban development [10,11,12]. While many other factors such as the quality of education, the ability to innovate, and the availability of renewable energy may influence the development of cities, the built and natural environments have a profound impact on the health of citizens as well as the cities’ urbanization level [13,14]. For these reasons, the concept of sustainable development is a necessary goal for urban development.
The SDGs account for the intricate urban landscape and serve as a critical framework for numerous scholars to assess urban development using quantitative measures [15,16,17,18,19,20]. In many studies, scholars are focusing on the designation of the indicator system, yet these assessment tools are still questioned [21] for the following reasons. (1) Different indicator systems are formulated for different cities, and comparisons cannot be made between different cities. Shen and Zhou, 2014 [22], examine the effectiveness of eight of the sustainable urbanization indicator systems in China in helping policymakers’ decisions. The results show that due to the large inconsistency between the existing indicator systems, there are limitations to them in practice. (2) Urbanization is a dynamic process, but few studies consider this system in a dynamic way. It is believed that the assessment indicators based on the index system can represent multiple sustainability-related processes, and while they are easy to use, they do not have enough complexity to describe a city [23]. (3) The data collection and calculation methods are complex, and the setting of some indicators is subjective, with vague definitions and quantifications. Due to the decentralized nature of these urban evaluation methods, the cost of using these kinds of indicator systems is high, their promotion is difficult, and they place local departments under great pressure, resulting in the consumption of many internal government resources [23,24].
The optimization of human activities, resources, and the environment forms a crucial foundation for achieving sustainable social development. Chen et al., 2022 [25], believed that some methods only focus on the performance of different cities, while ignoring spatial characteristics or spatial patterns, evolution mechanisms, and the interaction between different indicators. It is necessary to evaluate the effectiveness of established sustainable urbanization methods [26], and on this basis, it is also an important challenge [27] to make more accurate judgments and descriptions of observational data on multiple spatial and temporal scales. Spatiotemporal environmental data are usually characterized by spatial and temporal correlations, and capturing these dependencies is an extremely important task [28]. Few studies have explored the spatial and temporal differences in environment-related SDGs at the national and regional scales [29].
This paper aims to establish an overall workflow for an urban sustainably assessment from the indicator system to the evaluation process and the analysis of the spatiotemporal dimension so as to provide a theoretical reference and suggestions for the implementation of sustainable strategies, ranging from the microcity to the macroregional scale. This paper examines a representative megalopolis (the Yangtze River Delta) as a case study, focusing on the period between 2010 and 2018, which holds significant importance for the future of China’s urbanization. We use a proven evaluation system of urban sustainability based on SDGs [30], further analyze the spatiotemporal variation characteristics and action mechanisms, and then propose strategies for both cities and the megalopolis. The remainder of this paper is structured as follows: Section 2 provides a critical literature review; Section 3 introduces the research framework, study area, assessment system, and research methods; Section 4 conducts a spatiotemporal feature analysis based on indicator measurements; and Section 5 and Section 6 draw conclusions and propose appropriate sustainable development directions for urban megalopolises, respectively.
2. Literature Overview and Research Objective
2.1. Sustainable Development and Its Evaluation System
The United Nations General Assembly’s “2030 Agenda” report has established 17 overarching sustainable development goals and 169 specific objectives [31]. Achieving sustainable development typically involves collaborative efforts among government decision-making and coordination agencies. Some experts believe that if sustainability can be understood by the public, it will be a far more powerful and productive strategy than if it is left to the experts [32,33,34]. Since the beginning of the twentieth century, various sustainability evaluation systems have been utilized and developed. Some of these tools have been proven effective such as LEED, BREEAM, CASBEE, UN 17/169, and so on [35]. Although these tools have served the same goal, they vary widely in development background, measurement standards, the degree of availability, operability, and so on. Therefore, their universality is often brought into question, especially when used as an evaluation tool for developing countries like China [36,37,38,39,40,41].
Because the variation in needs and priorities for developing countries is substantial, it is important for these countries to consider local conditions in their urban sustainability assessments. In these countries, economic and infrastructural aspects of urban development are considered to be more important [42]. At the same time, environmental quality has become a key endogenous factor that determines a city’s competitiveness. Many scholars to date have evaluated a single SDG or a single sub-goal at the provincial or municipal level in China. Zhou, Q. et al., 2021 [43], has pointed out that China has an uneven performance for environment-related SDG indicators. Javanbakht et al., 2021 [44], proposed an urban environmental quality (UEQ) system from the quantitative measurement of the ability of the environment to respond to the needs of the urban population. Xu et al., 2019 [45], evaluated the implementation of SDG 11 in the Yangtze River Delta, while Wang et al., 2020 [46], modeled the spatial variability of the SDGs at the provincial level to assess the sustainable development of Fujian Province. However, in the face of the complexity of rapid urbanization in developing countries, driven by the government’s strong political guidance, the scope and thoroughness of the abovementioned objectives are still lacking.
2.2. The Exploration of Urban Characteristics through Spatiotemporal Distribution
Environmental spatiotemporal data are usually characterized by spatial and temporal correlations [28] and it is an important topic in the study of urbanization in megalopolises [47]. However, this analysis requires information from multiple locations, especially over large areas [48]. The geographic information system (GIS) is a popular tool that has the ability to provide various ways to display the spatial qualities of an event on a map [2,49] and is considered one of the most powerful tools for analyzing the characteristics of spatiotemporal changes. Li et al., 2013 [47], analyzed the temporal and spatial dynamics of the Shanghai metropolitan area between 1989 and 2005, revealing both similarities and unique aspects of Shanghai’s urban expansion patterns. They proposed a complex diffusion–condensation model to account for these findings. Xia et al., 2020 [4], employed geospatial techniques to investigate the relationship between urban form and carbon emissions, offering influential data to inform spatial planning policies. Brown et al., 2020 [50], underscored the significance of sociodemographic factors in shaping individuals’ environmental attitudes. Additionally, researchers found that participants perceived environmental problems at a global scale to be more severe than those in their local communities (i.e., spatial bias) [51]. Therefore, sustainability and related indicators have a relationship with both space and time. To better understand the variation of these parameters, capturing these dependencies is an extremely important task.
2.3. Chinese Urban Development toward Sustainability
Since 2000, the rapid acceleration of urbanization in China’s administrative regions has brought about significant economic growth and urban development, but has also placed immense pressure on environmental resources and led to severe pollution [5,6]. However, some aspects of China’s development plan diverge significantly from the “standard” Western model [52]. Since the “Twelfth Five-Year Plan” in 2010, China’s urban population has exceeded the rural population and is continuing to grow at an unprecedented rate [5]. At the same time, a series of other problems have arisen that affect the sustainable development of cities. Although China has made some progress in transitioning from traditional industry-led urbanization to a new type of urbanization since 2014 [53], environmental pressures that impede significant development have continued to rise [54,55,56].
At present, China utilizes a composite mechanism for development [57], and has put forward a number of planning strategies to promote the regional integration of urban megalopolises. It intends to use the agglomeration effect to drive regional development, focusing especially on the three major urban megalopolises of the Yangtze River Delta, the Pearl River Delta, and the Jingjinji. It is expected that they will gradually become the main “growth poles” leading China’s development [58,59]. Due to these different approaches, the study of these Chinese urban development patterns will contribute to Western urban studies and urban entrepreneurship [60]. This will provide alternative solutions for the coordinated development of megalopolises, which currently face enormous challenges [61]. Given the complexity of urban environments in regions like China, an effective quantitative assessment is critical in identifying coping strategies, and it also provides valuable experience and reference for more underdeveloped regions and developing countries that are about to experience this same level of urban growth.
3. Methodology
3.1. Research Framework
This research flow is designed to include four steps (Figure 1). Firstly, basic information on the megalopolis and its evolution of urbanization are investigated and a database is created to house the temporal statistical data of all indicators and the spatial GIS database of targeted cities in the megalopolis. It should be noted that statistical data were collected from the China Statistical Yearbook Series [62], published on authoritative websites by the National Bureau of Statistics of China. Secondly, an urban sustainability assessment was conducted. At this stage, we finish determining indicator weights based on the evaluation period and complete the data processing and calculations necessary to obtain evaluation results using the database. Then, the temporal statistical analyses are performed using the curve estimation regression method to reveal the time-series variation characteristics of indicators and their coupling mechanisms. Lastly, based on geographic information, spatial statistical tools are used to visualize the temporal characteristics of indicators in the geospatial dimension. We combine the evaluation system with the spatiotemporal analysis method to effectively complete a comprehensive evaluation of the spatiotemporal characteristics of each index during the process of urban development. With this comprehensive process, we can not only diagnose each target city at the microlevel, but also understand the overall development structure of the megalopolis at the macrolevel.
3.2. Study Area
The Yangtze River Delta, which is one of the world’s six largest megalopolises, is a key strategic developmental region [63] and serves as an international gateway on China’s eastern coast to the Asia–Pacific region. It plays a significant role in economic cooperation among Japanese and Korean cities as part of the Yellow Sea Rim. Additionally, it dominates the development of the domestic Yangtze River Economic Belt. The Yangtze River Delta began with the establishment of the Shanghai Economic Zone in 1982 [64,65], and has expanded from 14 cities to 41 cities in 2019, including Shanghai and cities in Zhejiang Province, Jiangsu Province, and Anhui Province [66]. However, many experts continue to use outdated planning areas in their research [67,68,69], and there are relatively few studies on urban agglomerations based on the latest extent of 41 cities.
The region’s urbanization rate hit 67.31% in 2018, with a population density of 629.3 people per square kilometer [62]. This growth is especially evident in the eastern coastal cities, which have become densely populated. However, inland areas have also seen an influx of people thanks to inter-regional ties and policy support for integrated regional planning (Figure 2). Despite the success of the Yangtze River Delta as a model for quality urban development, the extensive production methods and resource consumption have led to growing environmental problems, including acid rain and a degraded water quality in the river basin. As such, it is clear that while urbanization has brought many benefits to the region, it has also led to some significant challenges that must be addressed. [70,71,72]. With regard to the future of urban development, the Chinese government has endorsed rapid economic growth and continued expansion. Therefore, the sustainable development of regional cities is an unavoidable issue to consider.
3.3. Urban Sustainability Assessment System
Urban sustainability () draws inspiration from the “ratio model (input/output)” of the X-efficiency theory in economics [73,74]. We utilized this model with our own variables (quality/pressure) by measuring the quality of the built environment () and the corresponding environmental pressure () of each city. The degree of urban sustainability () is measured by the ratio of the performance of and across several indicator categories:
where represents the total value of indicator category i for the quality of the built environment and represents the value of indicator category i for environmental pressure. value of less than or equal to 1 indicates that the pace of environmental pressure () is growing faster than the quality of the built environment (), which suggests that the city is undergoing an unsustainable urbanization process. Conversely, an value of greater than or equal to 1 suggests that the pace of environmental pressure () is growing slower than the quality of the built environment (), indicating a relatively sustainable urbanization process.
3.3.1. Indicator System
The selection of indicators for this study strictly follows the represented indicators provided in the urban sustainability evaluation system [30] based on SDGs and the 14 Chinese assessment tools. The 14 existing reports include Ecological Counties, Ecological Cities Construction Evaluation System (trial version, 2003), China’s Livable Cities Scientific Evaluation Standards (2007), Low-Carbon City Evaluation System of China (2011), Green and Low-Carbon Cities Evaluation Indicators (trial version, 2011), National Environmental Protection Model City Assessment Index and Implementation Rules (2011), National Ecological Civilization Pilot Policy Evaluation System (trial version, 2013), Technical Criterion for Eco-environmental Status Evaluation (draft, 2015), Evaluation System for the Construction of National Ecological Civilization Model City (trial version, 2016), China Green Development Index System (2016), Evaluation System for Ecological Civilization Construction (2016), Green City Evaluation Index System (draft, 2017), Evaluation System of the Construction Target of the National Ecological Civilization Pilot Zone (2018), Indicators for City Services and Quality of Life (2019), and New-Type Urbanization Evaluation Index System of New Urbanization Quality City (trial version, 2020). Within the indicator system of 17 representative indicators, there are three categories of 11 positive indicators that can either directly or indirectly reflect the . Here, the categories of economic urbanization () and infrastructure development () are related to the size of the urban population, so their indicators need to be converted to reflect the average adult value. The indicators of urban attraction () are not affected by the scale at all, and the existing statistical values can be used. These three categories of indicators reflect the three dimensions (economy, society, and culture) of sustainable development and correspond to SDG 8 (decent work and economic growth), SDG 11 (sustainable cities and community) and SDG 17 (partnership), respectively [75,76,77]. Additionally, two categories of 6 negative indicators can represent urban environmental pressure of regional concern. The categories of resource consumption () and environmental pollution () highlight the importance of the environmental dimension of sustainable development, corresponding to SDG 12 (responsible consumption and production), SDG 6 (clean water and sanitation), and SDG 13 (climate action).
3.3.2. Data Source and Processing
To determine the appropriate contribution of component scores in each corresponding category, the principal component analysis (PCA) method based on statistical data [78] from the Yangtze River Delta from 2010 to 2018 was used. And each indicator category in the dataset had to pass the Kaiser–Meyer–Olkin (KMO) test with acceptable values greater than 0.5 [79] in order to ensure that the data were suitable for PCA. Therefore, data processing is first standardized:
where is the original data value of each indicator category i; min(ui) and max(ui), respectively, refer to the minimum and maximum value in the 9-year dataset for the corresponding indicator category, and the standardized value is .
And then weights () are calculated:
where represents the component score coefficient matrix and represents the sum of the component scores of each indicator category i of Qu or Pu calculated by the PCA method.
The sum of the standardized value or multiplied by the corresponding weight or is the comprehensive score ( or ) of each dimension for the urban sustainability assessment:
Table 1 shows the weights of each indicator constructed with 11 represented indicators of and 6 indicators of , which have the greatest impact on their respective indicator categories.
3.4. Spatiotemporal Methodologies Based on Statistics and Geoinformatics
3.4.1. Curve Estimation Regression
Regression analysis, a commonly used statistical technique, involves fitting a line to the data that best represents the relationship between dependent variables and an independent variable [80]. Linear regression is a basic statistical method that aims to establish a linear connection between two variables. On the other hand, non-linear regression is more suitable for modeling complex relationships between variables, and can often lead to a better match with the data than linear regression. However, it is important to note that a regression model must meet the assumptions of homoscedasticity and independence to be trustworthy and valid. Otherwise, breaches of these assumptions can lead to incorrect inferences and biased estimates of the regression coefficients. The interaction relationship can be seen in Figure 2, Figure 3, Figure 4 and Figure 5 and the predictable regression model are as follows:
where are coefficients of the regression models. Here, we model how the change in affects the value of .
3.4.2. Geographic Distributions
Spatial statistics tools are commonly employed to analyze geographic data and identify patterns and trends in the data over time by calculating characteristic values. It is represented by a circle, the radius of which equals the standard distance called the standard deviational ellipse, centered on the geographic geometric center identified by the mean center [81,82]. And the standard distance is a measure of distribution that expresses the compactness of a set of spatial characteristics. The time-series results of the standard deviation ellipses, which covered approximately 68% of the features analyzed, present three pieces of information about spatiotemporal characteristics: (1) the dispersion of a univariate feature around its geometric center; (2) the distribution of indicators and the location offset of the center; and (3) the migration direction and speed of the center.
We utilized tools for geographic distribution in our study to examine the connection between the spatial features of urban sustainability and the displacement of the geographic geometric center. This measurement provides an intuitive assessment of whether the regional development is unbalanced, and it serves as a crucial foundation for devising macroregional planning strategies. The related formulas are shown below.
The coordinates of geometric center (or mean center):
The standard distance in the X and Y directions:
where and are the coordinates of feature , or in the t year, and k is equal to the number of cities.
4. Empirical Results of Spatiotemporal Variation
4.1. The Evaluation Results through the Temporal Statistical Analysis
4.1.1. Temporal Performance and Urban Characteristic Diagnosis
The urban sustainability assessment method described above was applied to evaluate the performance of 41 cities in the Yangtze River Delta from 2010 to 2018. Figure 3 displays box charts illustrating the ranges of , , and values for each city.
In Figure 3a, the values for the 41 cities ranged from 0.022 to 0.658, with a CAGR between 0.61% and 19.14% over the 9-year period. The city of Shanghai had the highest initial score, whereas Lu’an had the lowest score initially but showed the most significant improvement over the span of nine years. According to Figure 3b, the index varied from 0.020 to 0.743 in 2010, and Bozhou and Ma’anshan consistently had the lowest and highest environmental stress levels, respectively, throughout the entire study period. The CAGR ranged from −8.73% to 8.84%, with 19 cities exhibiting a negative growth rate, indicating a reduction in environmental pressure, while 22 cities experienced adverse effects with CAGR values exceeding 0. Heavy industry was the primary cause of environmental degradation in cities such as Ma’anshan and Lianyungang. In Figure 3c, unfortunately, some cities, such as Ma’anshan, Yancheng, Tongling, Chizhou, Quzhou, and Wuhu, continued to experience severe unsustainability with little change over the 9-year period, especially Ma’anshan City, which had the lowest score (0.259) in 2010.
4.1.2. Temporal Performance and Urban Characteristic Diagnosis
The future direction of urban development can be predicted by understanding the logic and strength of the mutual coupling mechanism between and . While general linear regression is commonly used to explore this relationship, it has limitations when matching nonlinear datasets. We utilized SPSS Statistics (version 26) for the regression analysis and obtained the significant results less than 0.05 with the p-value test.
As shown in Table 2, the regression analysis indicated that there were five coupling relationships between and identified in 83% of cities in the Yangtze River Delta (seven cities showed no significant relationship). (1) An inverted U-shaped relationship, in which the Pu initially increased swiftly with improved, but was subsequently controlled through environmental protection policies and technology, resulting in a decline in environmental pressure, while continued to improve in cities such as Hangzhou, Nanjing, and Jiaxing. The injection of a new city planning through international cooperation, incorporating strong sustainability features, in cities such as Shanghai, Suzhou, and Zhoushan likely has led to the phenomena. (2) A negative linear relationship, in which Zhoushan and Taizhou continuously improved environmental pressure without initial degradation. (3) An S-shaped relationship, in which seven cities showed a rebound trend in environmental pressure after initial improvement around 2013, indicating the need for continuous attention to environmental issues. (4) A positive linear relationship, with environmental pressure increasing along with improved in four cities, highlighting the importance of effective environmental governance. (5) A U-shaped relationship, in which environmental pressure initially decreased and then increased with urban construction in cities such as Huai’an City, emphasizing the need for resource consumption and pollution control measures.
4.2. Spatial–Temporal Distribution and Evolution Characteristics
4.2.1. Spatiotemporal Variation Patterns of Urban Sustainability
The Arc-GIS 10.3 tool is used to visualize the data of 41 cities to reveal the characteristics of the development change of the spatial–temporal pattern of cities in the Yangtze River Delta in 2010, 2014, and 2018, as shown in Figure 4.
Figure 4a illustrates that the areas with superior urban built environments were initially concentrated around Shanghai due to its favorable location. Subsequently, the positive effects emanating from Shanghai gradually contributed to the enhancement of urban quality in the neighboring eastern cities. This distribution pattern aligns with the evolution of urbanization depicted in Figure 2. Being an international metropolis, Shanghai was the first city in the region to attract more population. As development progressed, policies such as industrial alliances were implemented, uniting cities like Hangzhou and Nanjing, which possess greater economic power when working together. Consequently, the core area of urbanization is shifting from the coast to the inland areas because of the rapid development of industrialization and infrastructure construction in the inland areas. But parts of the interior such as the west and north are still underdeveloped.
The distribution pattern of urban environmental pressure is shown in Figure 4b. Our findings indicate that the central and southern inland areas were the most severely affected regions. The central and southern interior regions appear to be impacted more severely. This may be attributed to the fact that these areas heavily rely on capital-intensive industries, such as large factories and industrial parks, as well as transportation facilities like subway projects. The construction of these facilities results in a higher energy consumption and waste emissions. As a result, the southern region has implemented specific environmental policies to address these concerns since 2014, leading to some relief in environmental pressure. But the northern region still continues to face more significant or even worsening environmental issues.
Figure 4c depicts the variation pattern of urban sustainability. In the northern region of the Yangtze River Delta, there is a notable contrast between the outer areas exhibiting a high level of sustainable development, and the inner cities with a lower level of sustainable development. Despite the relatively low quality of urban construction in certain small and medium-sized cities, they have managed to maintain a favorable urban environment, resulting in a steady increase in sustainable urbanization. The southern inland areas also exhibit a positive trend toward sustainable urbanization. Currently, the majority of southern cities have transitioned from an unsustainable state in 2010 to a sustainable development state, forming a benign area of coordinated development.
4.2.2. Evolution Characteristics of Regional Structure
In Figure 5, we utilized geographic distribution tools such as weighted mean center and standard deviation ellipse to examine the spatial evolution with the corresponding results. It revealed that the Yangtze River Delta region remains in a state of imbalanced development even after 9 years since 2010. More specifically, the centers of , which are located in the city of Changzhou, have shifted closer to the geometric center, but still offsets 58.72 km away from the geographic center. The mean centers of Pu and Su, however, have increased in distance from the geometric center by 1.23 km and 7.71 km, respectively, for a total distance of 20.04 km and 39.46 km in 2018. These increases show that the regional imbalance is increasing. While the shape changes of the ellipses differ significantly, the standard deviation ellipses for all variables indicate a consistent principal axis orientation in the southeast–northwest direction. The elongated long axes of and , as well as the elongated short axes of and , suggest a heterogeneous spatial change over time.
The average speeds of the mean centers’ annual migration are relatively similar, with being the fastest (VPu = 1.87 km/year), followed by (VSu = 1.77 km/year) and (VQu = 1.51 km/year). These findings suggest that the Yangtze River Delta region is rapidly moving toward an imbalanced situation, which may result in a widening sustainable development gap between northern and southern cities. This trend is strongly associated with the escalating environmental pressure faced by cities in the north. Currently, there exists a considerable gap between the northern and southern regions. To address the adverse effects of imbalanced development in the Yangtze River Delta region, it is crucial to prioritize the enhancement of governance and management in cities located in the north, particularly in the areas surrounding Nanjing.
5. Discussion
At present, many developing countries are trying to base the future development of their cities on achieving certain urbanization goals [83,84]. Although it is a fact that Chinese cities with a high level of urbanization tend to have a better quality of , this model of development also has substantial environmental implications and costs. This means that the risk of sustainability in these cities is real and cannot be underestimated. Zhu et al. (2016) [69] and other scholars have also discovered similar findings from their studies. In rapidly growing cities with low-quality urban built environments, the scale of development often leads to an increased pollution and environmental degradation. However, in the higher quality stage, the pace of urban growth tends to slow down and pollution reduction efforts can match or even surpass the scale of development. As the demand for a cleaner environment increases, there is a greater potential for environmental improvements to be made. This is shown by the famous Kuznets curve [85,86].
In some cases, however, an increased efficiency has accelerated economic growth with technological advances or dedicated policy support. However, when the demand is particularly high, the demand or consumption of resources may also increase, and a rebound phenomenon may occur, which is the so-called Jevons paradox [87]. This is often overlooked by policymakers who blindly declare the need to emulate large cities. This would cause urban residents to be tempted by short-term interests and ignore long-term and stable urban environment solutions. For example, the infrastructure and public services of most small and medium-sized cities are still insufficient, and the large-scale construction activities and outdated production techniques carried out by some of these cities in order to maintain output value have severely damaged the environment and excessively consumed resources [88,89,90,91]. Furthermore, a lack of planning at scale causes an imbalance of urban development in the region. This will result in an unfavorable chain of events in any region in the process of rapid urbanization. In turn, it exacerbates urban environmental problems and threatens the sustainable development of megalopolises [92,93]. In the coming decades, China’s urbanization rate will continue to increase steadily at a rate of about 1% per year [88], and it is firmly believed that urbanization is the only way for the country to modernize. However, we can clearly see that the sustainable development level of each city in the region is significantly different. We suggest that on the premise of coordinating the balanced development of and in the region, we should understand the temporal and spatial characteristics of each city and give priority to implementing corresponding policy support and resource allocation within the scope of impact factors. By comparing the heat map of each indicator, it is possible to clearly identify key areas where the city needs improvement (as shown in Figure 6 and Figure 7). This information can be used to develop more targeted urban development strategies that are better coordinated with the needs of the city.
Regarding the quality of the built environment () (as shown in Figure 6), the industrial sector has traditionally been a key driver of economic development in these cities. However, with the shift toward a stock-and-investment capital-based economy, it is now important for these cities to prioritize the optimization of their industrial structure and provide preferential treatment or support policies to those cities with less developed urbanization economies in order to stimulate their economic growth. In 2022, the Chinese government announced plans for macroeconomic adjustments [94], with a focus on supporting infrastructural development through measures such as prioritizing cities with significant infrastructure shortages for support under these policies. In addition, it is worth noting that many cities in the Yangtze River Delta region currently lack competitive urban features. These cities should consider leveraging and promoting local cultural heritage or improving the natural environment to attract international events and increase visibility. Furthermore, promoting a diversified and knowledge-based economy by attracting high-tech industries, creative industries, and advanced services can also help to enhance their competitive edge.
Regarding the environmental pressure () (Figure 7), more than half of the cities in the Yangtze River Delta region have shown an increase in resource consumption since 2010. The primary reason for this is the substantial energy consumption by industries, particularly in economically underdeveloped cities that rely on traditional, high-energy-consuming industrial practices. Moreover, poor water-saving awareness and inadequate mechanisms to regulate water consumption have led to the wastage of water resources. To address these issues, there is a need for sufficient funds, advanced technology, and spontaneous environmental awareness. It is worth noting that since 2010, pollution levels in most cities have decreased, especially the cities with a lower urbanization level. But the outdated purification treatment technology still leads to a large amount of pollutant discharge. Special vigilance is required to control nitrogen oxides and solid waste emissions to manage risks and develop strategies for climate mitigation and adaptation [6].
6. Conclusions
There has been an overall improvement in the quality of the built environment, while environmental pressure has been on a declining trend over the past years. This paper provides a perspective that combines a concise urban sustainability assessment system with effective spatiotemporal analysis methods. Our results reveal the urban development status of megalopolises in the current urbanization period in China represented by the Yangtze River Delta by highlighting the improvement of urban construction quality, the magnitude of environmental impact, regional geographic and spatial distribution differences, the interaction between sustainable impact dimensions, and the priority focal points of future development. The following are the key findings from the empirical analysis of the Yangtze River Delta between 2010 and 2018:
- The sustainability of the urban environment in the Yangtze River Delta shows obvious differences and spatial heterogeneity. By 2018, there are still 19 cities in an unsustainable state of development. From the perspective of the regional structure of the whole megalopolis, the gap between the East and the West has changed to the gap between the North and the South and continues to increase. It is necessary to formulate a master plan for integrated regional development on rationally distributing and efficiently gathering various production factors to prioritize the development of cities in the northwest, so as to achieve a balanced development.
- From two major dimensions of evaluation, the quality of the built environment (Qu) of the Yangtze River Delta appears high in the Southeast than in the Northwest, while the urban environmental pressure (Pu) develops from the center to the North at a rapid rate. Fortunately, after a certain level of economic growth in southern cities, it has driven the rapid adjustment of the industrial structure, which is good for the environment. However, this has led to the blind consumption of resources by northwestern cities to reduce the gap. Therefore, it is very important to build an inter-regional cooperation platform, eliminate confrontation, and establish mutual assistance in technological, industrial, and many other aspects.
- A curve estimation regression analysis of the relationship between and has revealed five distinct types of urban development trends in the Yangtze River Delta. Among them, the inverted U-shaped and negative linear types of cities mean that the environmental load caused by the improvement of is less than in other cities. But the inverted U-shaped city is relatively sensitive to environmental changes due to environmental degradation and may rebound due to minor factors. This benign development trend needs to be maintained by insisting on the implementation of energy-saving and emission reduction. In order to avoid turning into an unstable S-shaped type of city, we should prevent overexploitation or the overspeed of urbanization, and instead implement a constant focus on seeking to balance urban development with the environment. However, cities of S-shaped, U-shaped, and positive linear types are facing different degrees of environmental degradation. Decision-makers should appropriately slow down the speed of urbanization and give priority to taking targeted measures to deal with urban environmental problems in order to minimize the impact of urban development on the environment. Also, we need to strengthen sustainable publicity efforts to raise public awareness of environmental protection in the near future.
Our research results offer a comprehensive assessment and detailed diagnosis, providing urban planners and policymakers with crucial information. The findings reveal potential hotspots and areas that require immediate attention, directing resources and interventions where they are most needed. This allows them to identify the strengths and weaknesses of different cities concerning specific targets and prioritize actions accordingly, leading to more effective and sustainable outcomes. Moreover, our research findings have the potential to be transformed into a user-friendly and interactive visualized tool in the future, enabling a rapid and efficient means of evaluating and analyzing a city’s sustainability, providing valuable insights, and guiding recommendations.
However, this study is particularly relevant for developing and underdeveloped cities experiencing or approaching rapid urbanization. We recognize that urbanization is a dynamic process, and cities’ needs and priorities may evolve over time. Consequently, it is essential to regularly review, improve, and update our indicators and conclusions to ensure their continued relevance and effectiveness in addressing changing circumstances and emerging sustainability challenges during the next stage of urbanization.
In addition, our study primarily interprets urban development through the lens of objective indicators, which may limit the depth of understanding from an on-the-ground perspective. For future work, we plan to conduct more detailed research and engage more closely with local decision-makers and residents. By actively seeking insights and feedback from stakeholders, we can gain a deeper understanding of the nuanced challenges and opportunities faced by these cities in their development journey. Through this iterative and collaborative process, we aim to bridge the gap between objective indicators and comprehensive understanding, thereby supporting the sustainable development aspirations of these cities and contributing to their long-term well-being.
Author Contributions
Conceptualization, X.F. and W.G.; methodology, X.F. and X.S.; software, X.S. and T.K.P.; validation, X.F. and W.G.; formal analysis, T.K.P.; investigation, P.D. and X.S.; resources, X.S.; data curation, T.K.P.; writing—original draft preparation, X.F.; visualization, P.D.; supervision, W.G. All authors have read and agreed to the published version of the manuscript.
Funding
This research received no external funding.
Institutional Review Board Statement
Not applicable.
Informed Consent Statement
Not applicable.
Data Availability Statement
Data sharing is not applicable to this article.
Acknowledgments
This study was supported by the Innovation Institute for Sustainable Maritime Architecture Research and Technology (iSMART) of Qingdao University of Technology. We would like to acknowledge and express our gratitude to all the people who helped complete this research and to the editors and reviewers for their suggestions for improving the manuscript.
Conflicts of Interest
The authors declare no conflict of interest.
References
- Habitat, United Nations. World Cities Report 2016: Urbanization and Development: Emerging Futures; United Nations: Nairobi, Kenya, 2016. [Google Scholar]
- Chief Executives Board. UN System-Wide Strategy on Sustainable Urban Development; United Nations: Nairobi, Kenya, 2017. [Google Scholar]
- Xia, C.; Chen, B. Urban Land-Carbon Nexus Based on Ecological Network Analysis. Appl. Energy 2020, 276, 115465. [Google Scholar] [CrossRef]
- Xia, C.; Xiang, M.; Fang, K.; Li, Y.; Ye, Y.; Shi, Z.; Liu, J. Spatial-Temporal Distribution of Carbon Emissions by Daily Travel and Its Response to Urban Form: A Case Study of Hangzhou, China. J. Clean. Prod. 2020, 257, 120797. [Google Scholar] [CrossRef]
- Bai, X.; Shi, P.; Liu, Y. Society: Realizing China’s Urban Dream. Nature 2014, 509, 158–160. [Google Scholar] [CrossRef] [PubMed] [Green Version]
- Bai, X.; Dawson, R.J.; Ürge-Vorsatz, D.; Delgado, G.C.; Salisu Barau, A.; Dhakal, S.; Dodman, D.; Leonardsen, L.; Masson-Delmotte, V.; Roberts, D.C. Six Research Priorities for Cities and Climate Change. Nature 2018, 555, 23–25. [Google Scholar] [CrossRef] [PubMed]
- Finco, A.; Nijkamp, P. Pathways to Urban Sustainability. J. Environ. Policy Plan. 2001, 3, 289–302. [Google Scholar] [CrossRef]
- WHO. Preventing Noncommunicable Diseases (NCDs) by Reducing Environmental Risk Factors; WHO: Geneva, Switzerland, 2017. [Google Scholar]
- Che, X.; English, A.; Lu, J.; Chen, Y.D. Improving the Effectiveness of Planning EIA (PEIA) in China: Integrating Planning and Assessment during the Preparation of Shenzhen’s Master Urban Plan. Environ. Impact Assess. Rev. 2011, 31, 561–571. [Google Scholar] [CrossRef]
- Moore, T.H.M.; Kesten, J.M.; López-López, J.A.; Ijaz, S.; McAleenan, A.; Richards, A.; Gray, S.; Savović, J.; Audrey, S. The Effects of Changes to the Built Environment on the Mental Health and Well-Being of Adults: Systematic Review. Health Place 2018, 53, 237–257. [Google Scholar] [CrossRef] [PubMed]
- Iimi, A. Urbanization and Development of Infrastructure in the East Asian Region. JBICI Rev. 2005, 10, 88–109. [Google Scholar]
- Surya, B.; Ahmad, D.N.A.; Sakti, H.H.; Sahban, H. Land Use Change, Spatial Interaction, and Sustainable Development in the Metropolitan Urban Areas, South Sulawesi Province, Indonesia. Land 2020, 9, 95. [Google Scholar] [CrossRef] [Green Version]
- Coussens, C.; Hanna, K. Rebuilding the Unity of Health and the Environment: A New Vision of Environmental Health for the 21st Century; National Academies Press: Washington, DC, USA, 2001; ISBN 030907259X. [Google Scholar]
- Balaban, O.; Doll, C.N.H. Cities, Biodiversity and Governance; UNU-IAS: Yokohama, Japan, 2010. [Google Scholar]
- Valencia, S.C.; Simon, D.; Croese, S.; Nordqvist, J.; Oloko, M.; Sharma, T.; Taylor Buck, N.; Versace, I. Adapting the Sustainable Development Goals and the New Urban Agenda to the City Level: Initial Reflections from a Comparative Research Project. Int. J. Urban Sustain. Dev. 2019, 11, 4–23. [Google Scholar] [CrossRef] [Green Version]
- Sharifi, A. Urban Sustainability Assessment: An Overview and Bibliometric Analysis. Ecol. Indic. 2020, 121, 107102. [Google Scholar] [CrossRef]
- Merino-Saum, A.; Halla, P.; Superti, V.; Boesch, A.; Binder, C.R. Indicators for Urban Sustainability: Key Lessons from a Systematic Analysis of 67 Measurement Initiatives. Ecol. Indic. 2020, 119, 106879. [Google Scholar] [CrossRef]
- Deng, W.; Peng, Z.; Tang, Y. A Quick Assessment Method to Evaluate Sustainability of Urban Built Environment: Case Studies of Four Large-Sized Chinese Cities. Cities 2019, 89, 57–69. [Google Scholar] [CrossRef]
- Steiniger, S.; Wagemann, E.; de la Barrera, F.; Molinos-Senante, M.; Villegas, R.; de la Fuente, H.; Vives, A.; Arce, G.; Herrera, J.-C.; Carrasco, J.-A. Localising Urban Sustainability Indicators: The CEDEUS Indicator Set, and Lessons from an Expert-Driven Process. Cities 2020, 101, 102683. [Google Scholar] [CrossRef]
- Buck, K.D.; Summers, J.K.; Smith, L.M. Investigating the Relationship between Environmental Quality, Socio-Spatial Segregation and the Social Dimension of Sustainability in US Urban Areas. Sustain. Cities Soc. 2021, 67, 102732. [Google Scholar] [CrossRef]
- Tan, Y.; Xu, H.; Zhang, X. Sustainable Urbanization in China: A Comprehensive Literature Review. Cities 2016, 55, 82–93. [Google Scholar] [CrossRef]
- Shen, L.; Zhou, J. Examining the Effectiveness of Indicators for Guiding Sustainable Urbanization in China. Habitat Int. 2014, 44, 111–120. [Google Scholar] [CrossRef]
- Xiang, N. A Review on the Research and Practice of City Sustainable Development Indicators and Indices. In IOP Conference Series: Earth and Environmental Science, Proceedings of the 5th International Conferences on Geological, Geographical, Aerospaces and Earth Sciences 2017 (5th AeroEarth 2017) Bali, Indonesia, 20–21 May 2017; IOP Publishing: Bristol, UK, 2017; Volume 88, p. 12024. [Google Scholar]
- Parris, T.M.; Kates, R.W. Characterizing and Measuring Sustainable Development. Annu. Rev. Environ. Resour. 2003, 28, 559–586. [Google Scholar] [CrossRef]
- Chen, Y.; Chen, A.; Zhang, D. Evaluation of Resources and Environmental Carrying Capacity and Its Spatial-Temporal Dynamic Evolution: A Case Study in Shandong Province, China. Sustain. Cities Soc. 2022, 82, 103916. [Google Scholar] [CrossRef]
- Hemphill, L.; Berry, J.; McGreal, S. An Indicator-Based Approach to Measuring Sustainable Urban Regeneration Performance: Part 1, Conceptual Foundations and Methodological Framework. Urban Stud. 2004, 41, 725–755. [Google Scholar] [CrossRef]
- Xiang, Y.; Wang, X.; He, L.; Wang, W.; Moran, W. Spatial-Temporal Analysis of Environmental Data of North Beijing District Using Hilbert-Huang Transform. PLoS ONE 2016, 11, e0167662. [Google Scholar] [CrossRef]
- Amato, F.; Guignard, F.; Robert, S.; Kanevski, M. A Novel Framework for Spatio-Temporal Prediction of Environmental Data Using Deep Learning. Sci. Rep. 2020, 10, 22243. [Google Scholar] [CrossRef] [PubMed]
- Wang, Q.; Liu, C.; Hou, Y.; Xin, F.; Mao, Z.; Xue, X. Study of the Spatio-Temporal Variation of Environmental Sustainability at National and Provincial Levels in China. Sci. Total Environ. 2022, 807, 150830. [Google Scholar] [CrossRef]
- Fang, X.; Shi, X.; Gao, W. Measuring Urban Sustainability from the Quality of the Built Environment and Pressure on the Natural Environment in China: A Case Study of the Shandong Peninsula Region. J. Clean. Prod. 2021, 289, 125145. [Google Scholar] [CrossRef]
- United Nations. The Future Is Now–Science for Achieving Sustainable Development; United Nations: New York, NY, USA, 2019. [Google Scholar]
- Irwin, A. Citizen Science: A Study of People, Expertise and Sustainable Development; Routledge: Oxford, UK, 2002; ISBN 0203202392. [Google Scholar]
- Ciegis, R.; Ramanauskiene, J.; Martinkus, B. The Concept of Sustainable Development and Its Use for Sustainability Scenarios. Eng. Econ. 2009, 62, 28–37. [Google Scholar]
- Hák, T.; Janoušková, S.; Moldan, B. Sustainable Development Goals: A Need for Relevant Indicators. Ecol. Indic. 2016, 60, 565–573. [Google Scholar] [CrossRef]
- Sharifi, A.; Kawakubo, S.; Milovidova, A. Urban Sustainability Assessment Tools: Toward Integrating Smart City Indicators. In Urban Systems Design; Elsevier: Amsterdam, The Netherlands, 2020; pp. 345–372. [Google Scholar]
- Ameen, R.F.M.; Mourshed, M.; Li, H. A Critical Review of Environmental Assessment Tools for Sustainable Urban Design. Environ. Impact Assess. Rev. 2015, 55, 110–125. [Google Scholar] [CrossRef]
- Kaur, H.; Garg, P. Urban Sustainability Assessment Tools: A Review. J. Clean. Prod. 2019, 210, 146–158. [Google Scholar] [CrossRef]
- Cohen, M. A Systematic Review of Urban Sustainability Assessment Literature. Sustainability 2017, 9, 2048. [Google Scholar] [CrossRef] [Green Version]
- He, B.-J.; Zhao, D.-X.; Zhu, J.; Darko, A.; Gou, Z.-H. Promoting and Implementing Urban Sustainability in China: An Integration of Sustainable Initiatives at Different Urban Scales. Habitat Int. 2018, 82, 83–93. [Google Scholar] [CrossRef]
- Kawazu, Y.; Shimada, N.; Yokoo, N.; Oka, T. Comparison of the Assessment Results of BREEAM, LEED, GBTool and CASBEE. In Proceedings of the Sustainable Building Conference (SB05), Tokyo, Japan, 27–29 September 2005; pp. 1700–1705. [Google Scholar]
- Waas, T.; Hugé, J.; Block, T.; Wright, T.; Benitez-Capistros, F.; Verbruggen, A. Sustainability Assessment and Indicators: Tools in a Decision-Making Strategy for Sustainable Development. Sustainability 2014, 6, 5512–5534. [Google Scholar] [CrossRef] [Green Version]
- Ameen, R.F.M.; Mourshed, M. Urban Sustainability Assessment Framework Development: The Ranking and Weighting of Sustainability Indicators Using Analytic Hierarchy Process. Sustain. Cities Soc. 2019, 44, 356–366. [Google Scholar] [CrossRef]
- Zhou, Q.; Dong, Z.F.; Pan, R.X. Analysis and Policy Recommendations. In Sustainable Development Report 2019; United Nations Publications: New York, NY, USA, 2021. (In Chinese) [Google Scholar]
- Javanbakht, M.; Boloorani, A.D.; Kiavarz, M.; Samany, N.N.; Zebardast, L.; Zangiabadi, M. Spatial-Temporal Analysis of Urban Environmental Quality of Tehran, Iran. Ecol. Indic. 2021, 120, 106901. [Google Scholar] [CrossRef]
- Xu, X.; Gao, J.; Zhang, Z.; Fu, J. An Assessment of Chinese Pathways to Implement the UN Sustainable Development Goal-11 (SDG-11)—A Case Study of the Yangtze River Delta Urban Agglomeration. Int. J. Environ. Res. Public Health 2019, 16, 2288. [Google Scholar] [CrossRef] [Green Version]
- Wang, Y.; Lu, Y.; He, G.; Wang, C.; Yuan, J.; Cao, X. Spatial Variability of Sustainable Development Goals in China: A Provincial Level Evaluation. Environ. Dev. 2020, 35, 100483. [Google Scholar] [CrossRef]
- Li, J.; Li, C.; Zhu, F.; Song, C.; Wu, J. Spatiotemporal Pattern of Urbanization in Shanghai, China between 1989 and 2005. Landsc. Ecol. 2013, 28, 1545–1565. [Google Scholar] [CrossRef]
- Mack, T.J.; Chornack, M.P.; Taher, M.R. Groundwater-Level Trends and Implications for Sustainable Water Use in the Kabul Basin, Afghanistan. Environ. Syst. Decis. 2013, 33, 457–467. [Google Scholar] [CrossRef] [Green Version]
- Campagna, M. GIS for Sustainable Development. In GIS for Sustainable Development; CRC Press: Boca Raton, FL, USA, 2005; pp. 23–40. ISBN 0429125011. [Google Scholar]
- Brown, G.; Reed, P.; Raymond, C.M. Mapping Place Values: 10 Lessons from Two Decades of Public Participation GIS Empirical Research. Appl. Geogr. 2020, 116, 102156. [Google Scholar] [CrossRef]
- Schultz, P.W.; Milfont, T.L.; Chance, R.C.; Tronu, G.; Luís, S.; Ando, K.; Rasool, F.; Roose, P.L.; Ogunbode, C.A.; Castro, J. Cross-Cultural Evidence for Spatial Bias in Beliefs about the Severity of Environmental Problems. Environ. Behav. 2014, 46, 267–302. [Google Scholar] [CrossRef]
- Huang, X.; Li, Y.; Hay, I. Polycentric City-Regions in the State-Scalar Politics of Land Development: The Case of China. Land Use Policy 2016, 59, 168–175. [Google Scholar] [CrossRef]
- Gollin, D.; Jedwab, R.; Vollrath, D. Urbanization with and without Industrialization. J. Econ. Growth 2016, 21, 35–70. [Google Scholar] [CrossRef]
- Hao, Y.; Zheng, S.; Zhao, M.; Wu, H.; Guo, Y.; Li, Y. Reexamining the Relationships among Urbanization, Industrial Structure, and Environmental Pollution in China—New Evidence Using the Dynamic Threshold Panel Model. Energy Rep. 2020, 6, 28–39. [Google Scholar] [CrossRef]
- Wang, J.; Wang, S.; Li, S.; Feng, K. Coupling Analysis of Urbanization and Energy-Environment Efficiency: Evidence from Guangdong Province. Appl. Energy 2019, 254, 113650. [Google Scholar] [CrossRef]
- Hall, B.J.; Leong, T.I.; Chen, W. Rapid Urbanization in China. In Urban Health; Oxford University Press: Oxford, UK, 2019; p. 356. ISBN 0190915862. [Google Scholar]
- Liu, Y.; Zhang, X.; Pan, X.; Ma, X.; Tang, M. The Spatial Integration and Coordinated Industrial Development of Urban Agglomerations in the Yangtze River Economic Belt, China. Cities 2020, 104, 102801. [Google Scholar] [CrossRef]
- Zheng, Y.; Xu, W.; Dai, L. Urban Growth in a Post-2000 Central Chinese Urban Agglomeration: Case Study of the Changzhutan Region. Growth Change 2020, 51, 464–487. [Google Scholar] [CrossRef] [Green Version]
- Fang, C.; Yu, D. China’s Urban Agglomerations; Springer: Berlin/Heidelberg, Germany, 2020; ISBN 9811515514. [Google Scholar]
- Wu, F. China’s Emergent City-region Governance: A New Form of State Spatial Selectivity through State-orchestrated Rescaling. Int. J. Urban Reg. Res. 2016, 40, 1134–1151. [Google Scholar] [CrossRef]
- Zeng, Y.-Y. Urban Public Safety Risk Assessment of 35 Cities in China Based on Context-Dependent DEA Approach and DEASort. In Proceedings of the 2019 International Conference on Building Energy Conservation, Thermal Safety and Environmental Pollution Control (ICBTE 2019), Hefei, China, 1–3 November 2019; EDP Sciences, Wuhan University of Technology: Wuhan, China, 2019; Volume 136. [Google Scholar]
- National Bureau of Statistics China Statistical Yearbook. Available online: http://www.stats.gov.cn/ (accessed on 21 January 2023).
- Gottmann, J. Megalopolitan Systems around the World. Hrvatski Geografski Glasnik 1976, 38, 103–111. [Google Scholar]
- Kamal-Chaoui, L.; Leeman, E.; Rufei, Z. Urban Trends and Policy in China. In OECD Regional Development Working Papers; No. 2009/01; OECD Publishing: Paris, France, 2009. [Google Scholar]
- Ye, L. Urbanization and Urban Governance in China; Springer: Berlin/Heidelberg, Germany, 2018; ISBN 1137578246. [Google Scholar]
- Wikipedia Yangtze Delta. Available online: https://en.wikipedia.org/wiki/Yangtze_Delta (accessed on 24 April 2023).
- Peng, B.; Chen, H.; Elahi, E.; Wei, G. Study on the Spatial Differentiation of Environmental Governance Performance of Yangtze River Urban Agglomeration in Jiangsu Province of China. Land Use Policy 2020, 99, 105063. [Google Scholar] [CrossRef]
- Xu, X.; Zhang, Z.; Long, T.; Sun, S.; Gao, J. Mega-City Region Sustainability Assessment and Obstacles Identification with GIS–Entropy–TOPSIS Model: A Case in Yangtze River Delta Urban Agglomeration, China. J. Clean. Prod. 2021, 294, 126147. [Google Scholar] [CrossRef]
- Zhu, X.; Gao, W.; Zhou, N.; Kammen, D.M.; Wu, Y.; Zhang, Y.; Chen, W. The Inhabited Environment, Infrastructure Development and Advanced Urbanization in China’s Yangtze River Delta Region. Environ. Res. Lett. 2016, 11, 124020. [Google Scholar] [CrossRef]
- Zhang, Y.; Sun, M.; Yang, R.; Li, X.; Zhang, L.; Li, M. Decoupling Water Environment Pressures from Economic Growth in the Yangtze River Economic Belt, China. Ecol. Indic. 2021, 122, 107314. [Google Scholar] [CrossRef]
- Liu, J.; Tian, Y.; Huang, K.; Yi, T. Spatial-Temporal Differentiation of the Coupling Coordinated Development of Regional Energy-Economy-Ecology System: A Case Study of the Yangtze River Economic Belt. Ecol. Indic. 2021, 124, 107394. [Google Scholar] [CrossRef]
- Wang, L.; Xue, X.; Shi, Y.; Wang, Z.; Ji, A. A Dynamic Analysis to Evaluate the Environmental Performance of Cities in China. Sustainability 2018, 10, 862. [Google Scholar] [CrossRef] [Green Version]
- Borza, M. The Connection between Efficiency and Sustainability—A Theoretical Approach. Procedia Econ. Financ. 2014, 15, 1355–1363. [Google Scholar] [CrossRef] [Green Version]
- Leibeistein, H. General X-Efficiency Theory & Economic Development; Oxford University Press: Oxford, UK, 1978; ISBN 019502379X. [Google Scholar]
- SRC Stockholm Resilience Centre. Examples of SRC’s Relevant 2030 Agenda Contributions from 2016. In SRC Stockholm Resilience Centre’s (SRC) Contribution to the 2016 Swedish 2030 Agenda HLPF Report; SRC Stockholm Resilience Centre: Stockholm, Sweden, 2017. [Google Scholar]
- Zhu, Z.; Lu, L.; Yao, X.; Zhang, W.; Liu, W. Rethinking Nature: A Pathway towards Sustainable Development. Perspectives. 2020, 38, 6–8. [Google Scholar]
- Folke, C.; Biggs, R.; Norström, A.V.; Reyers, B.; Rockström, J. Social-Ecological Resilience and Biosphere-Based Sustainability Science. Ecol. Soc. 2016, 21, 41. [Google Scholar] [CrossRef]
- Huang, L.; Wu, J.; Yan, L. Defining and Measuring Urban Sustainability: A Review of Indicators. Landsc. Ecol. 2015, 30, 1175–1193. [Google Scholar] [CrossRef]
- Kaiser, H.F. An Index of Factorial Simplicity. Psychometrika 1974, 39, 31–36. [Google Scholar] [CrossRef]
- Efromovich, S. Nonparametric Curve Estimation: Methods, Theory, and Applications; Springer Science & Business Media: Berlin/Heidelberg, Germany, 2008; ISBN 0387226389. [Google Scholar]
- Wieland, R.; Voss, M.; Holtmann, X.; Mirschel, W.; Ajibefun, I. Spatial Analysis and Modeling Tool. Ecol. Inform. 2006, 1, 67–76. [Google Scholar] [CrossRef]
- Getis, A.; Anselin, L.; Lea, A.; Ferguson, M.; Miller, H. Spatial Analysis and Modeling in a GIS Environment. In A Research Agenda for Geographic Information Science; CRC Press: Boca Raton, FL, USA, 2004; pp. 157–196. ISBN 0429122942. [Google Scholar]
- Kacyira, A.K. Addressing the Sustainable Urbanization Challenge. UN Chron. 2012, 49, 58–60. [Google Scholar] [CrossRef]
- Cohen, B. Urbanization in Developing Countries: Current Trends, Future Projections, and Key Challenges for Sustainability. Technol. Soc. 2006, 28, 63–80. [Google Scholar] [CrossRef]
- Li, T.; Wang, Y.; Zhao, D. Environmental Kuznets Curve in China: New Evidence from Dynamic Panel Analysis. Energy Policy 2016, 91, 138–147. [Google Scholar] [CrossRef]
- Dasgupta, S.; Laplante, B.; Wang, H.; Wheeler, D. Confronting the Environmental Kuznets Curve. J. Econ. Perspect. 2002, 16, 147–168. [Google Scholar] [CrossRef] [Green Version]
- Alcott, B. Jevons’ Paradox. Ecol. Econ. 2005, 54, 9–21. [Google Scholar] [CrossRef]
- Ruibo, H.; Linna, W. Challenges and Opportunities Facing China’s Urban Development in the New Era. China Perspect. 2013, 2013, 15–27. [Google Scholar] [CrossRef] [Green Version]
- UN-Habitat. Sustainable Urbanization in Asia: A Sourcebook for Local Governments; UN-Habitat: Nairobi, Kenya, 2012. [Google Scholar]
- Yang, Z.; Yang, H.; Wang, H. Evaluating Urban Sustainability under Different Development Pathways: A Case Study of the Beijing-Tianjin-Hebei Region. Sustain. Cities Soc. 2020, 61, 102226. [Google Scholar] [CrossRef]
- Zhang, L.; Huang, Q.; He, C.; Yue, H.; Zhao, Q. Assessing the Dynamics of Sustainability for Social-Ecological Systems Based on the Adaptive Cycle Framework: A Case Study in the Beijing-Tianjin-Hebei Urban Agglomeration. Sustain. Cities Soc. 2021, 70, 102899. [Google Scholar] [CrossRef]
- Cao, S.; Lv, Y.; Zheng, H.; Wang, X. Challenges Facing China’s Unbalanced Urbanization Strategy. Land Use Policy 2014, 39, 412–415. [Google Scholar] [CrossRef]
- Cao, X.; Zhou, B.; Shi, Y.; Pei, X. The Unbalanced Analysis of Economic Urbanization—A Case Study of Typical Cities in China. ISPRS Int. J. Geoinf. 2020, 9, 13. [Google Scholar] [CrossRef] [Green Version]
- Takamiya, K. People’s Republic of China: 2019 Article IV Consultation-Press Release. In Recently Acceded Members of the World Trade Organization; Springer: Berlin/Heidelberg, Germany, 2019; pp. 137–191. [Google Scholar]
Figure 1.
Research workflow of spatiotemporal variation characteristics of urban sustainability.
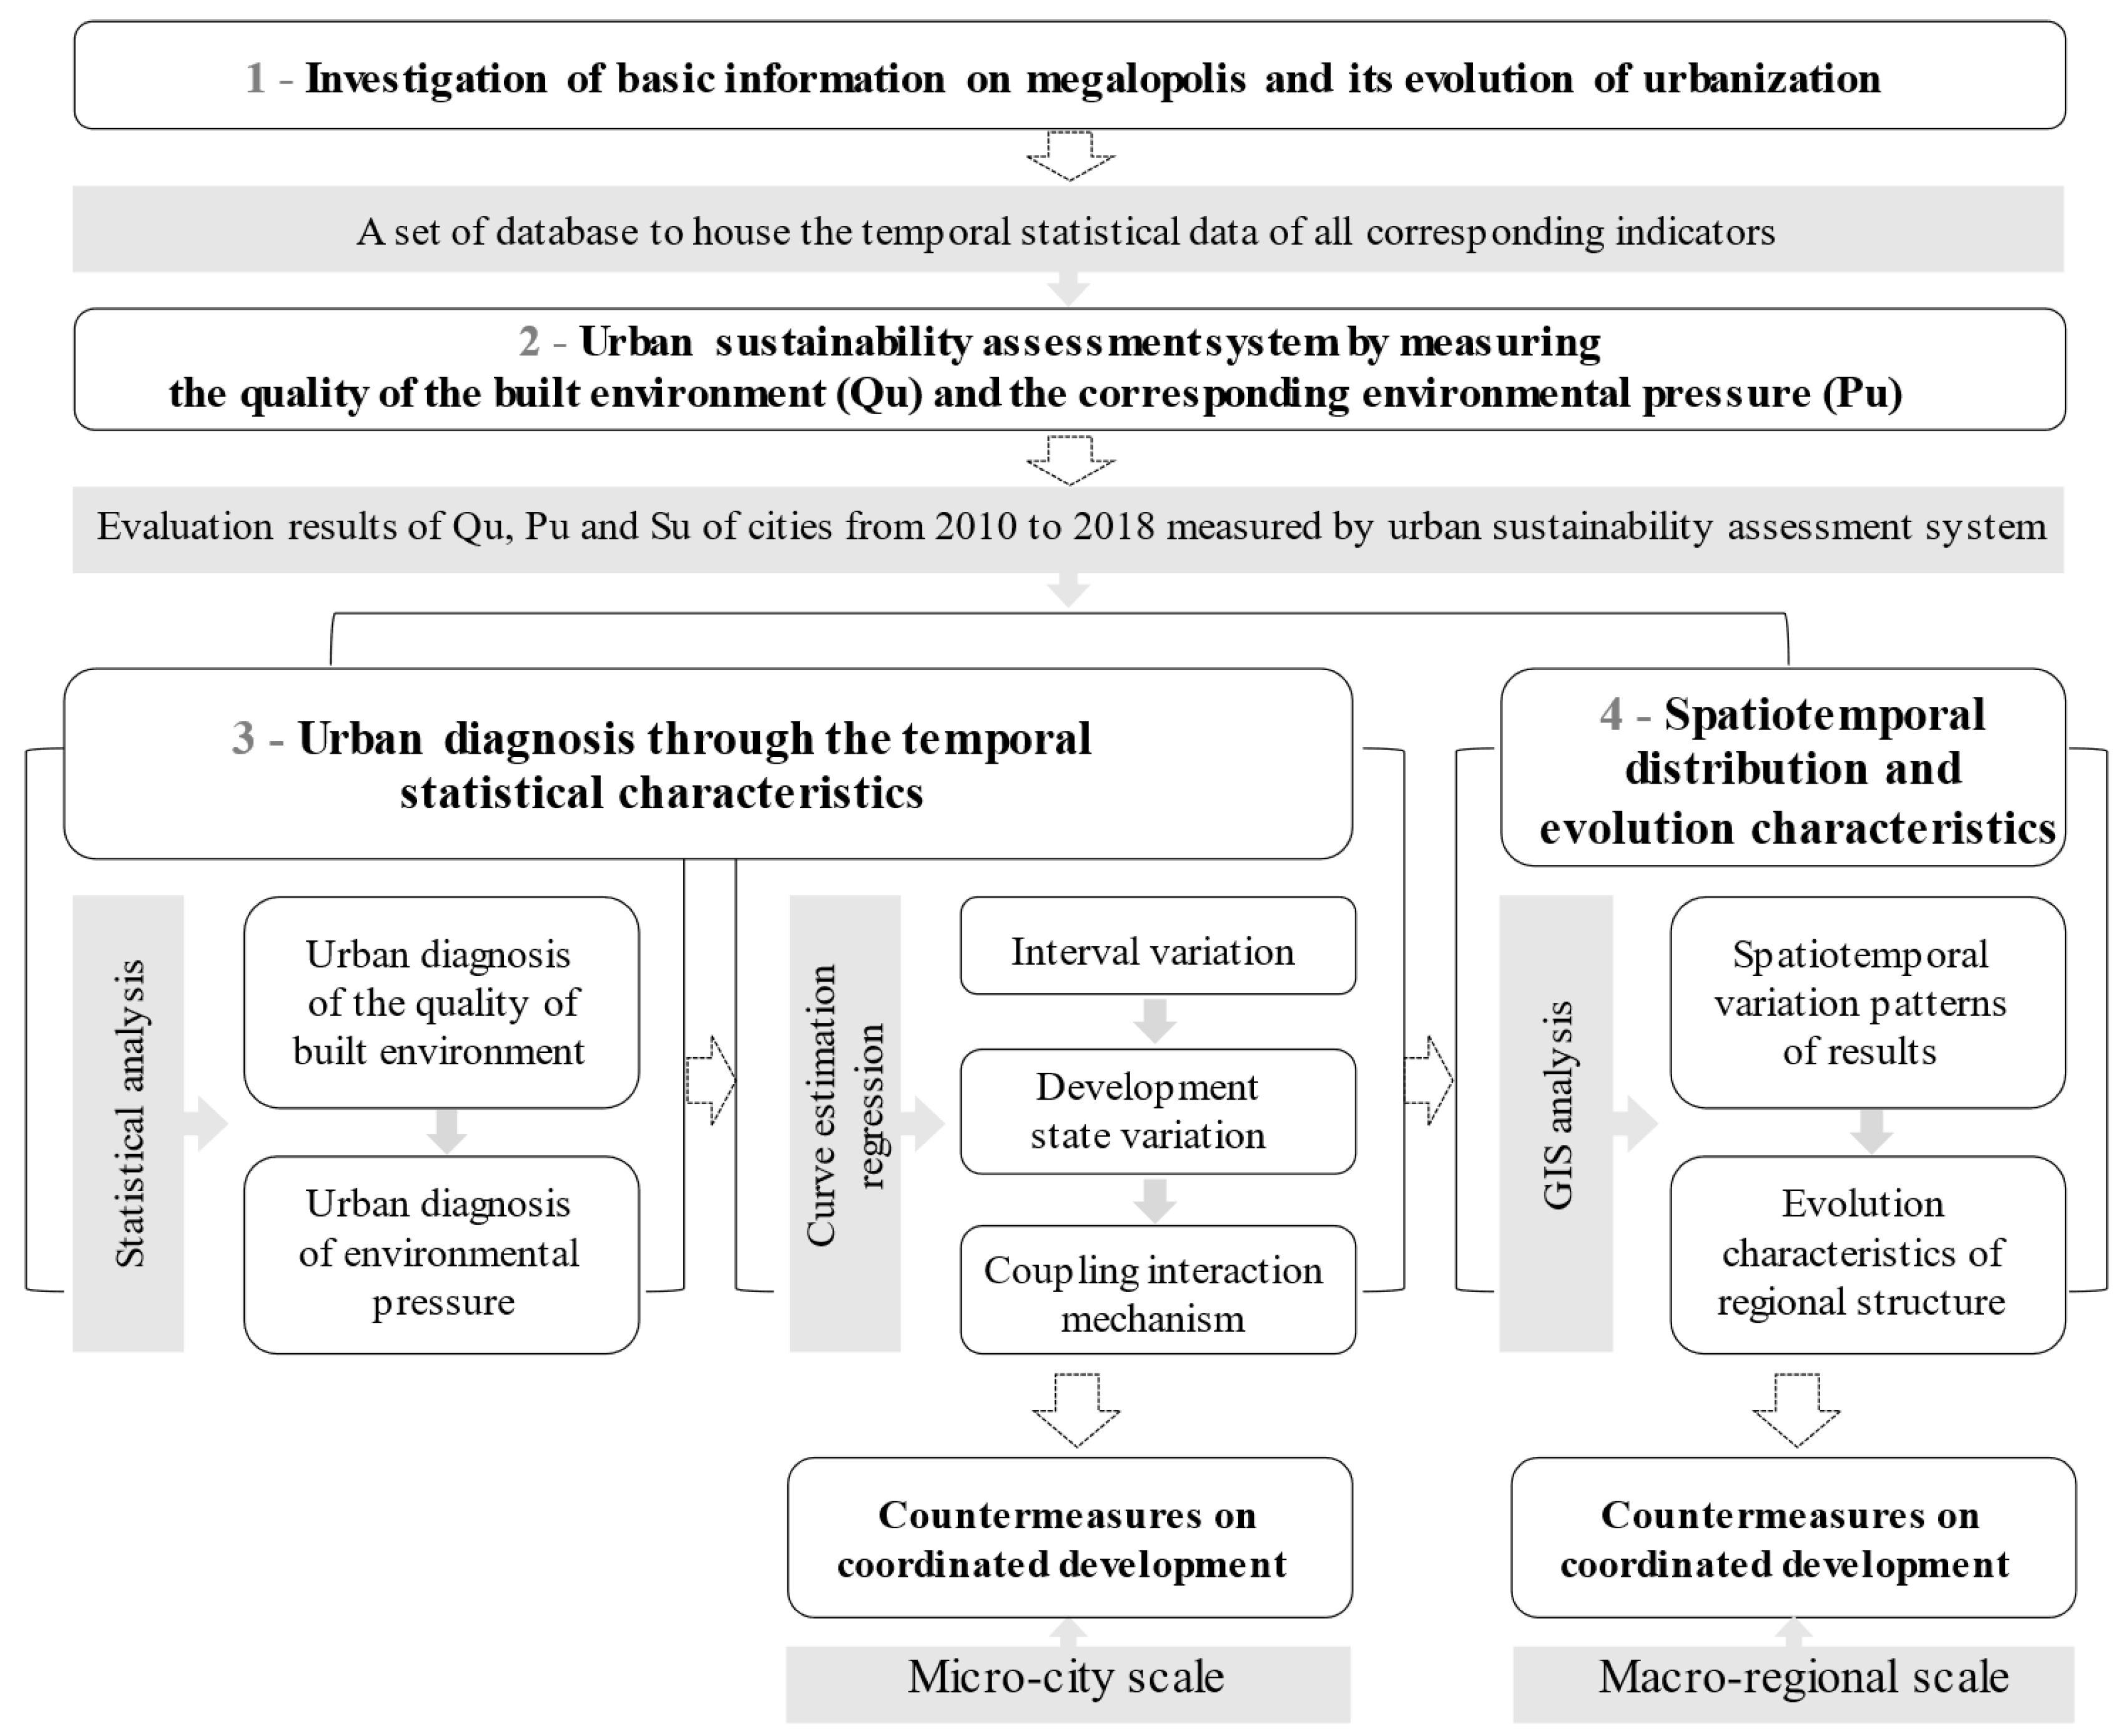
Figure 2.
The location and the level of urbanization based on nighttime light data in Yangtze River Delta in 2018. (Note: The deeper yellow color represents higher urbanization).
Figure 2.
The location and the level of urbanization based on nighttime light data in Yangtze River Delta in 2018. (Note: The deeper yellow color represents higher urbanization).
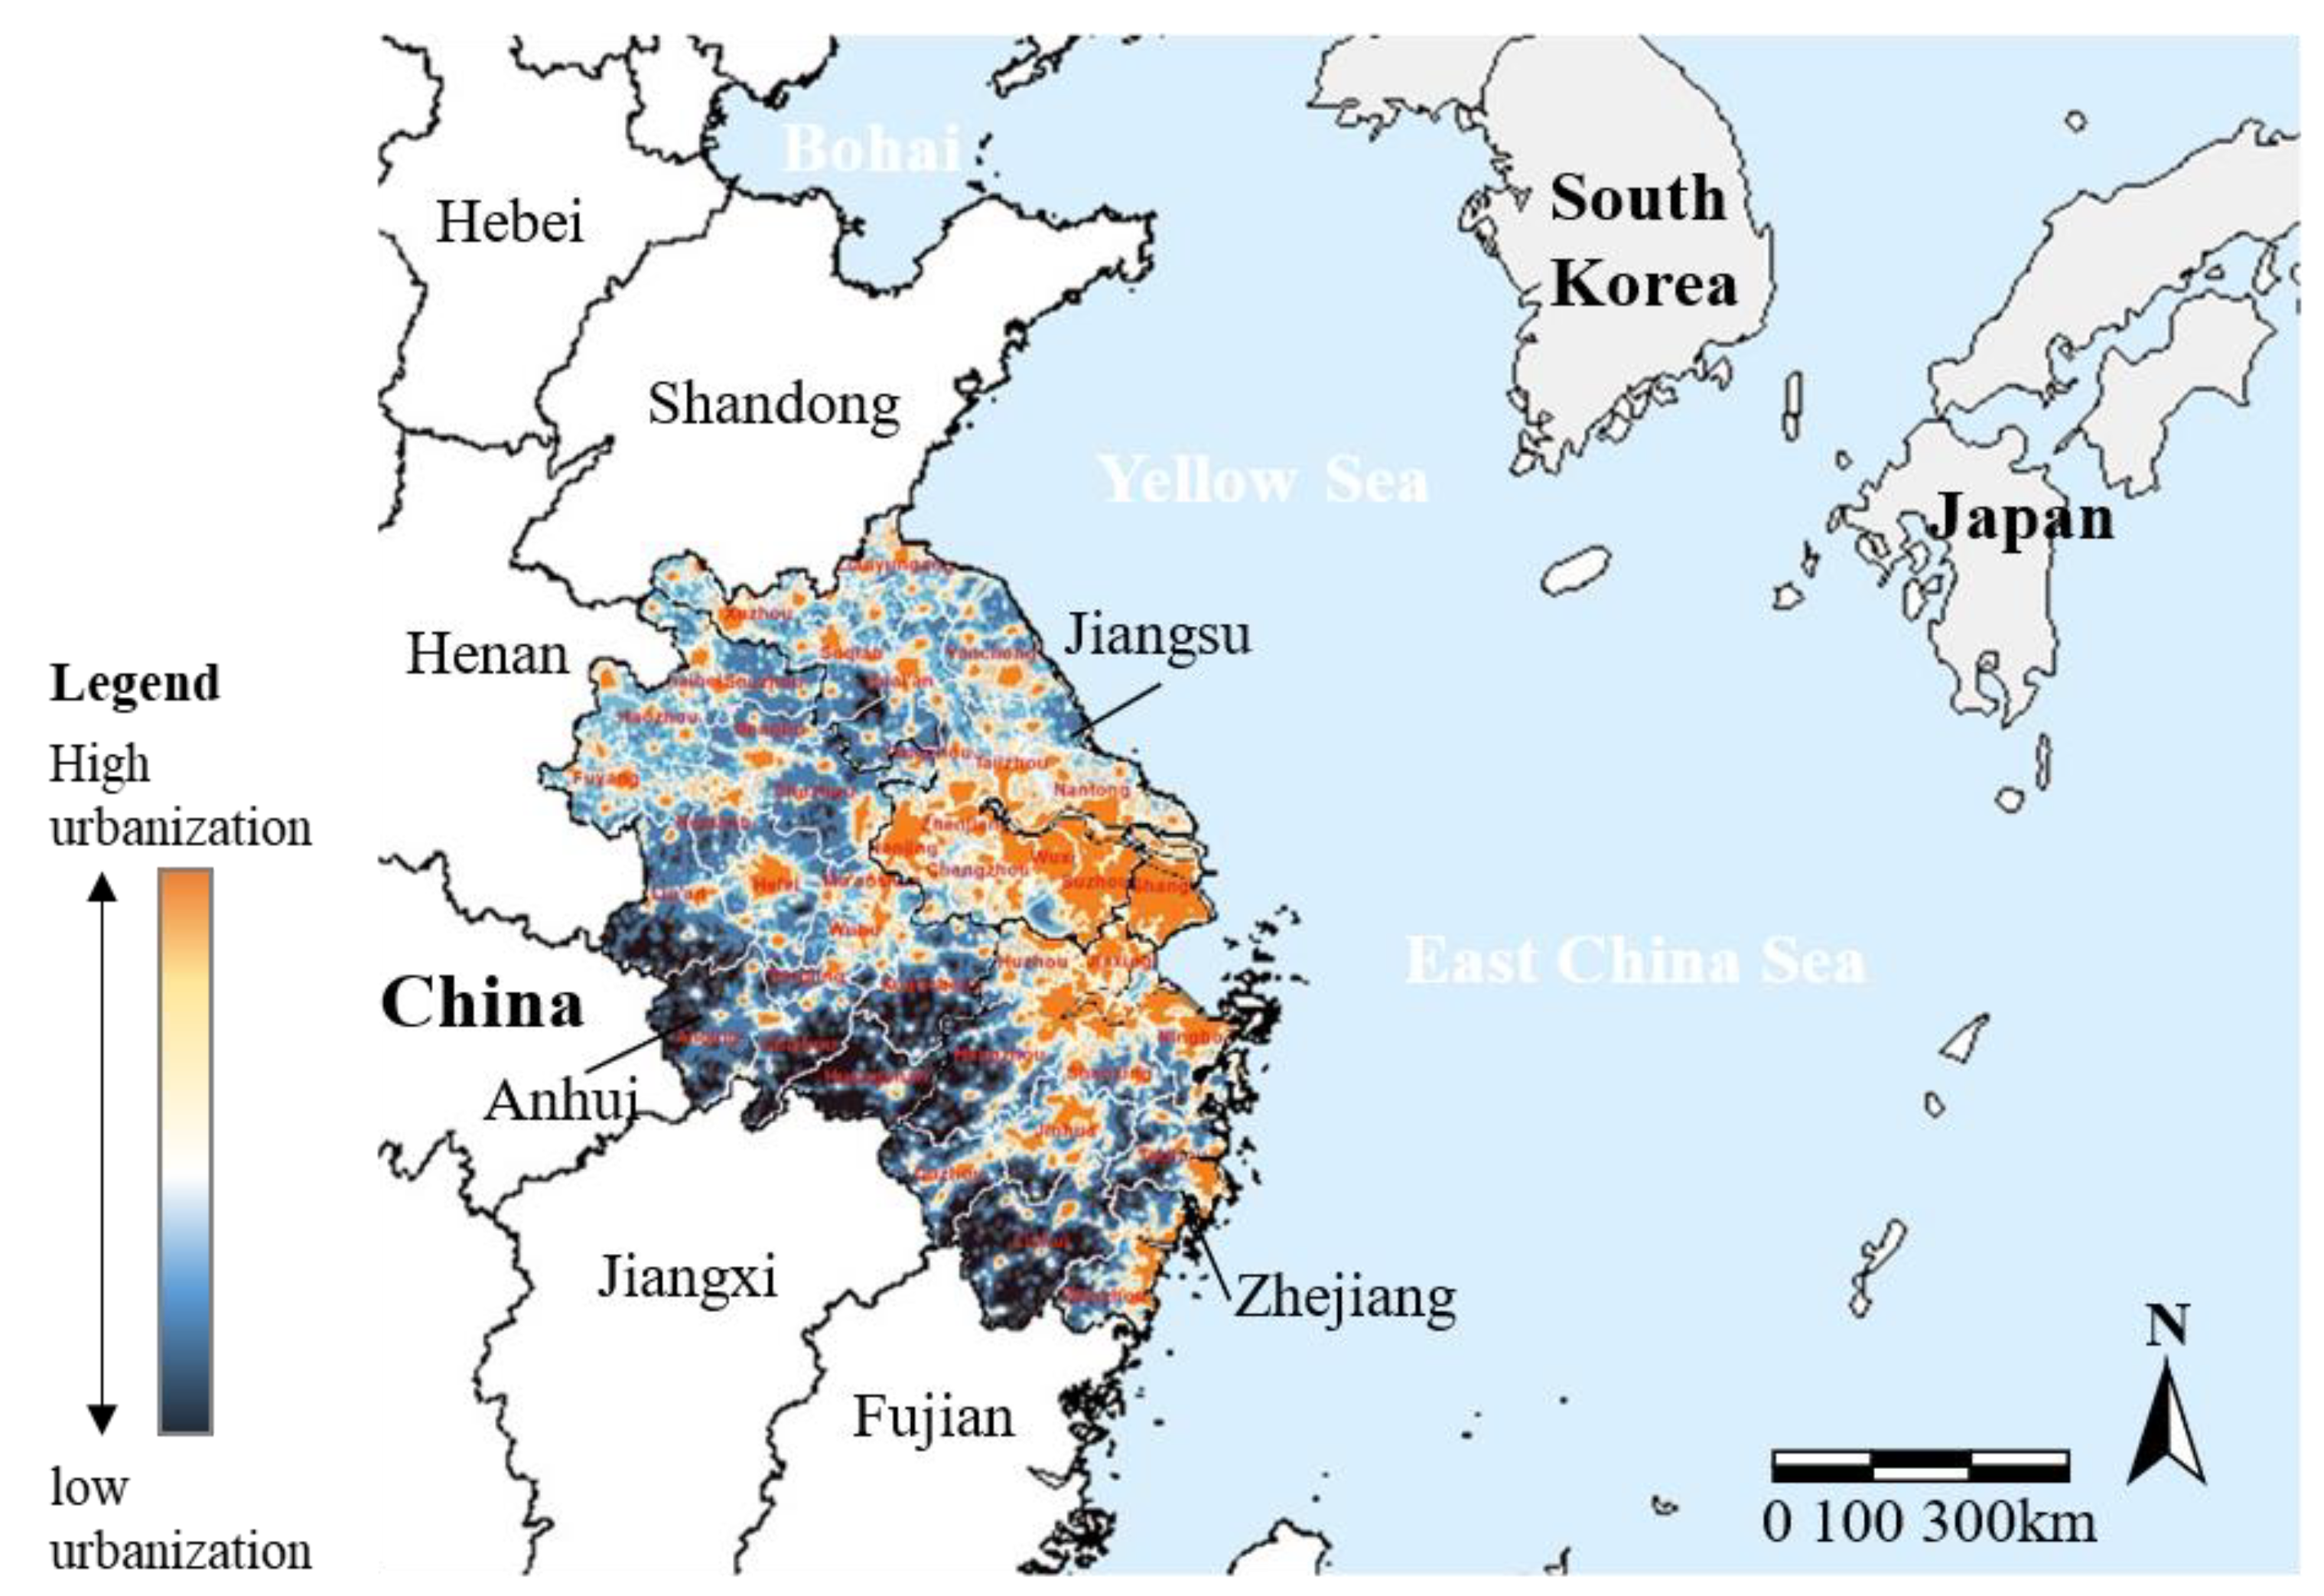
Figure 3.
The score range results of , , and for the 41 cities in Yangtze River Delta from 2010 to 2018. (a) Box plot of the score range of the quality of built environment ( ). (b) Box plot of the score range of environmental pressure ( ). (c) Box plot of the score range of urban sustainability ( ).
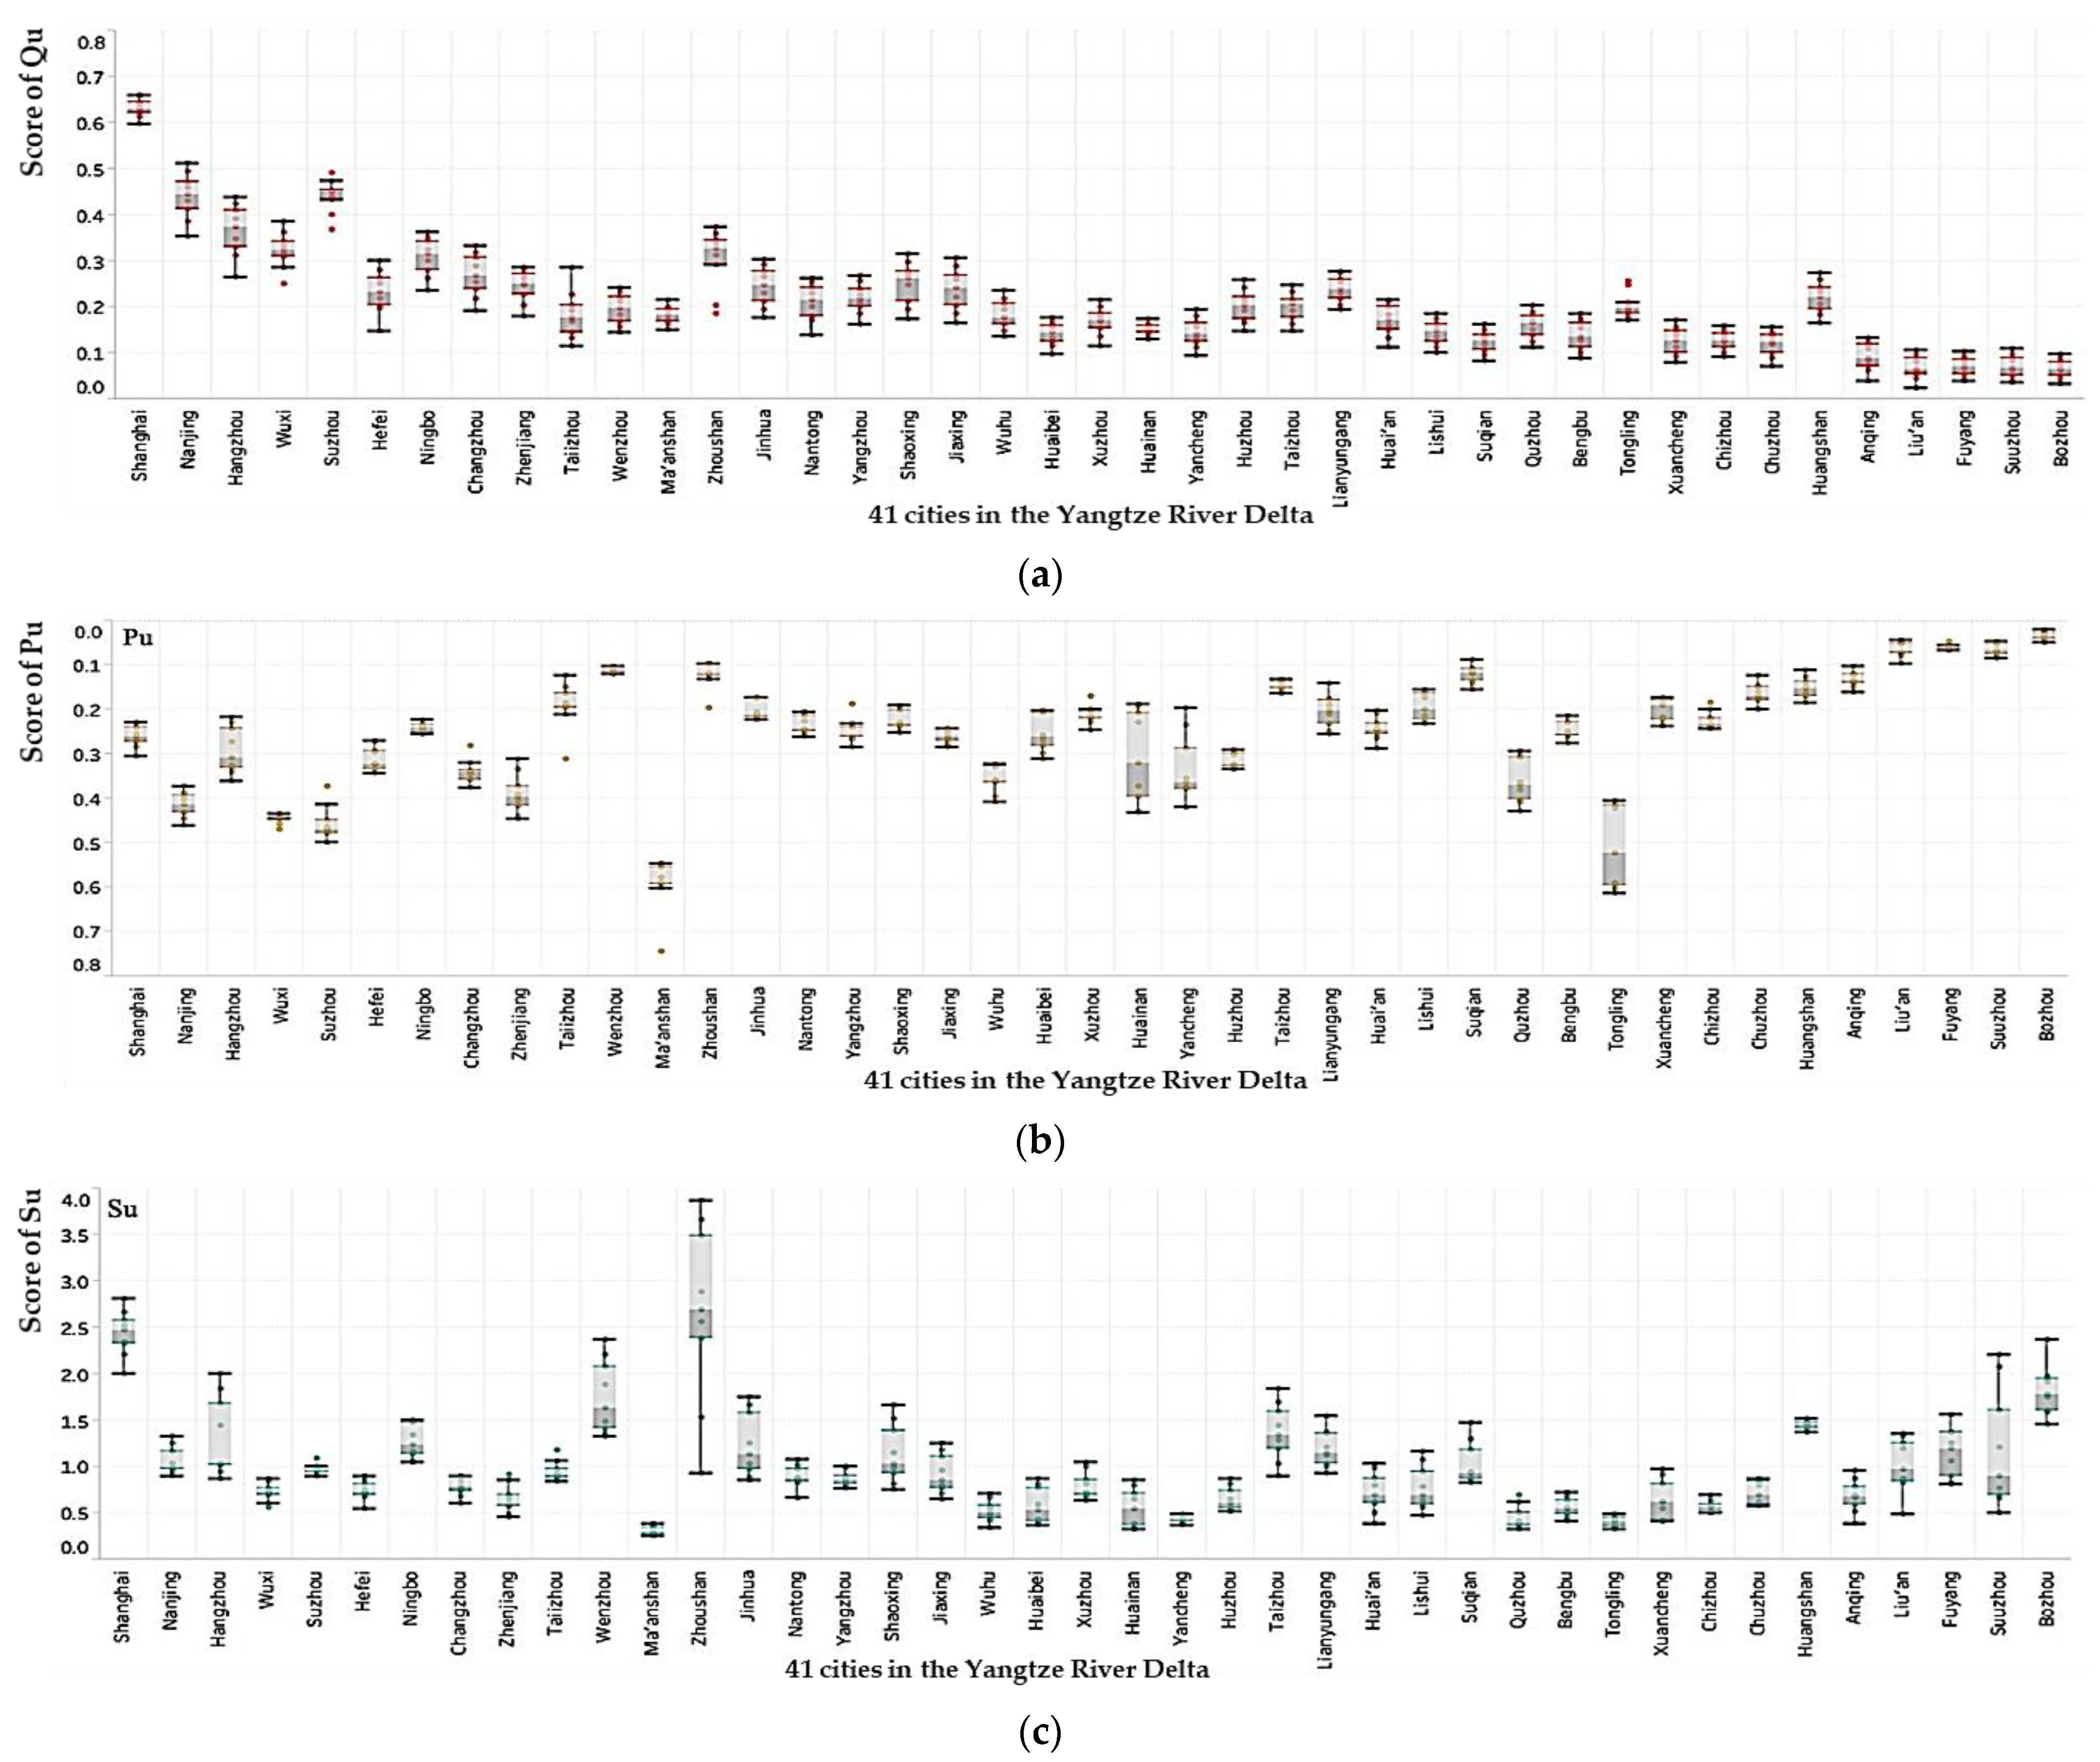
Figure 4.
The spatiotemporal variation patterns in the Yangtze River Delta from 2010 to 2018. (a) The spatiotemporal variation of the quality of built environment (). (b) The spatiotemporal variation of environmental pressure ( ). (c) The spatiotemporal variation of urban sustainability ().
Figure 4.
The spatiotemporal variation patterns in the Yangtze River Delta from 2010 to 2018. (a) The spatiotemporal variation of the quality of built environment (). (b) The spatiotemporal variation of environmental pressure ( ). (c) The spatiotemporal variation of urban sustainability ().

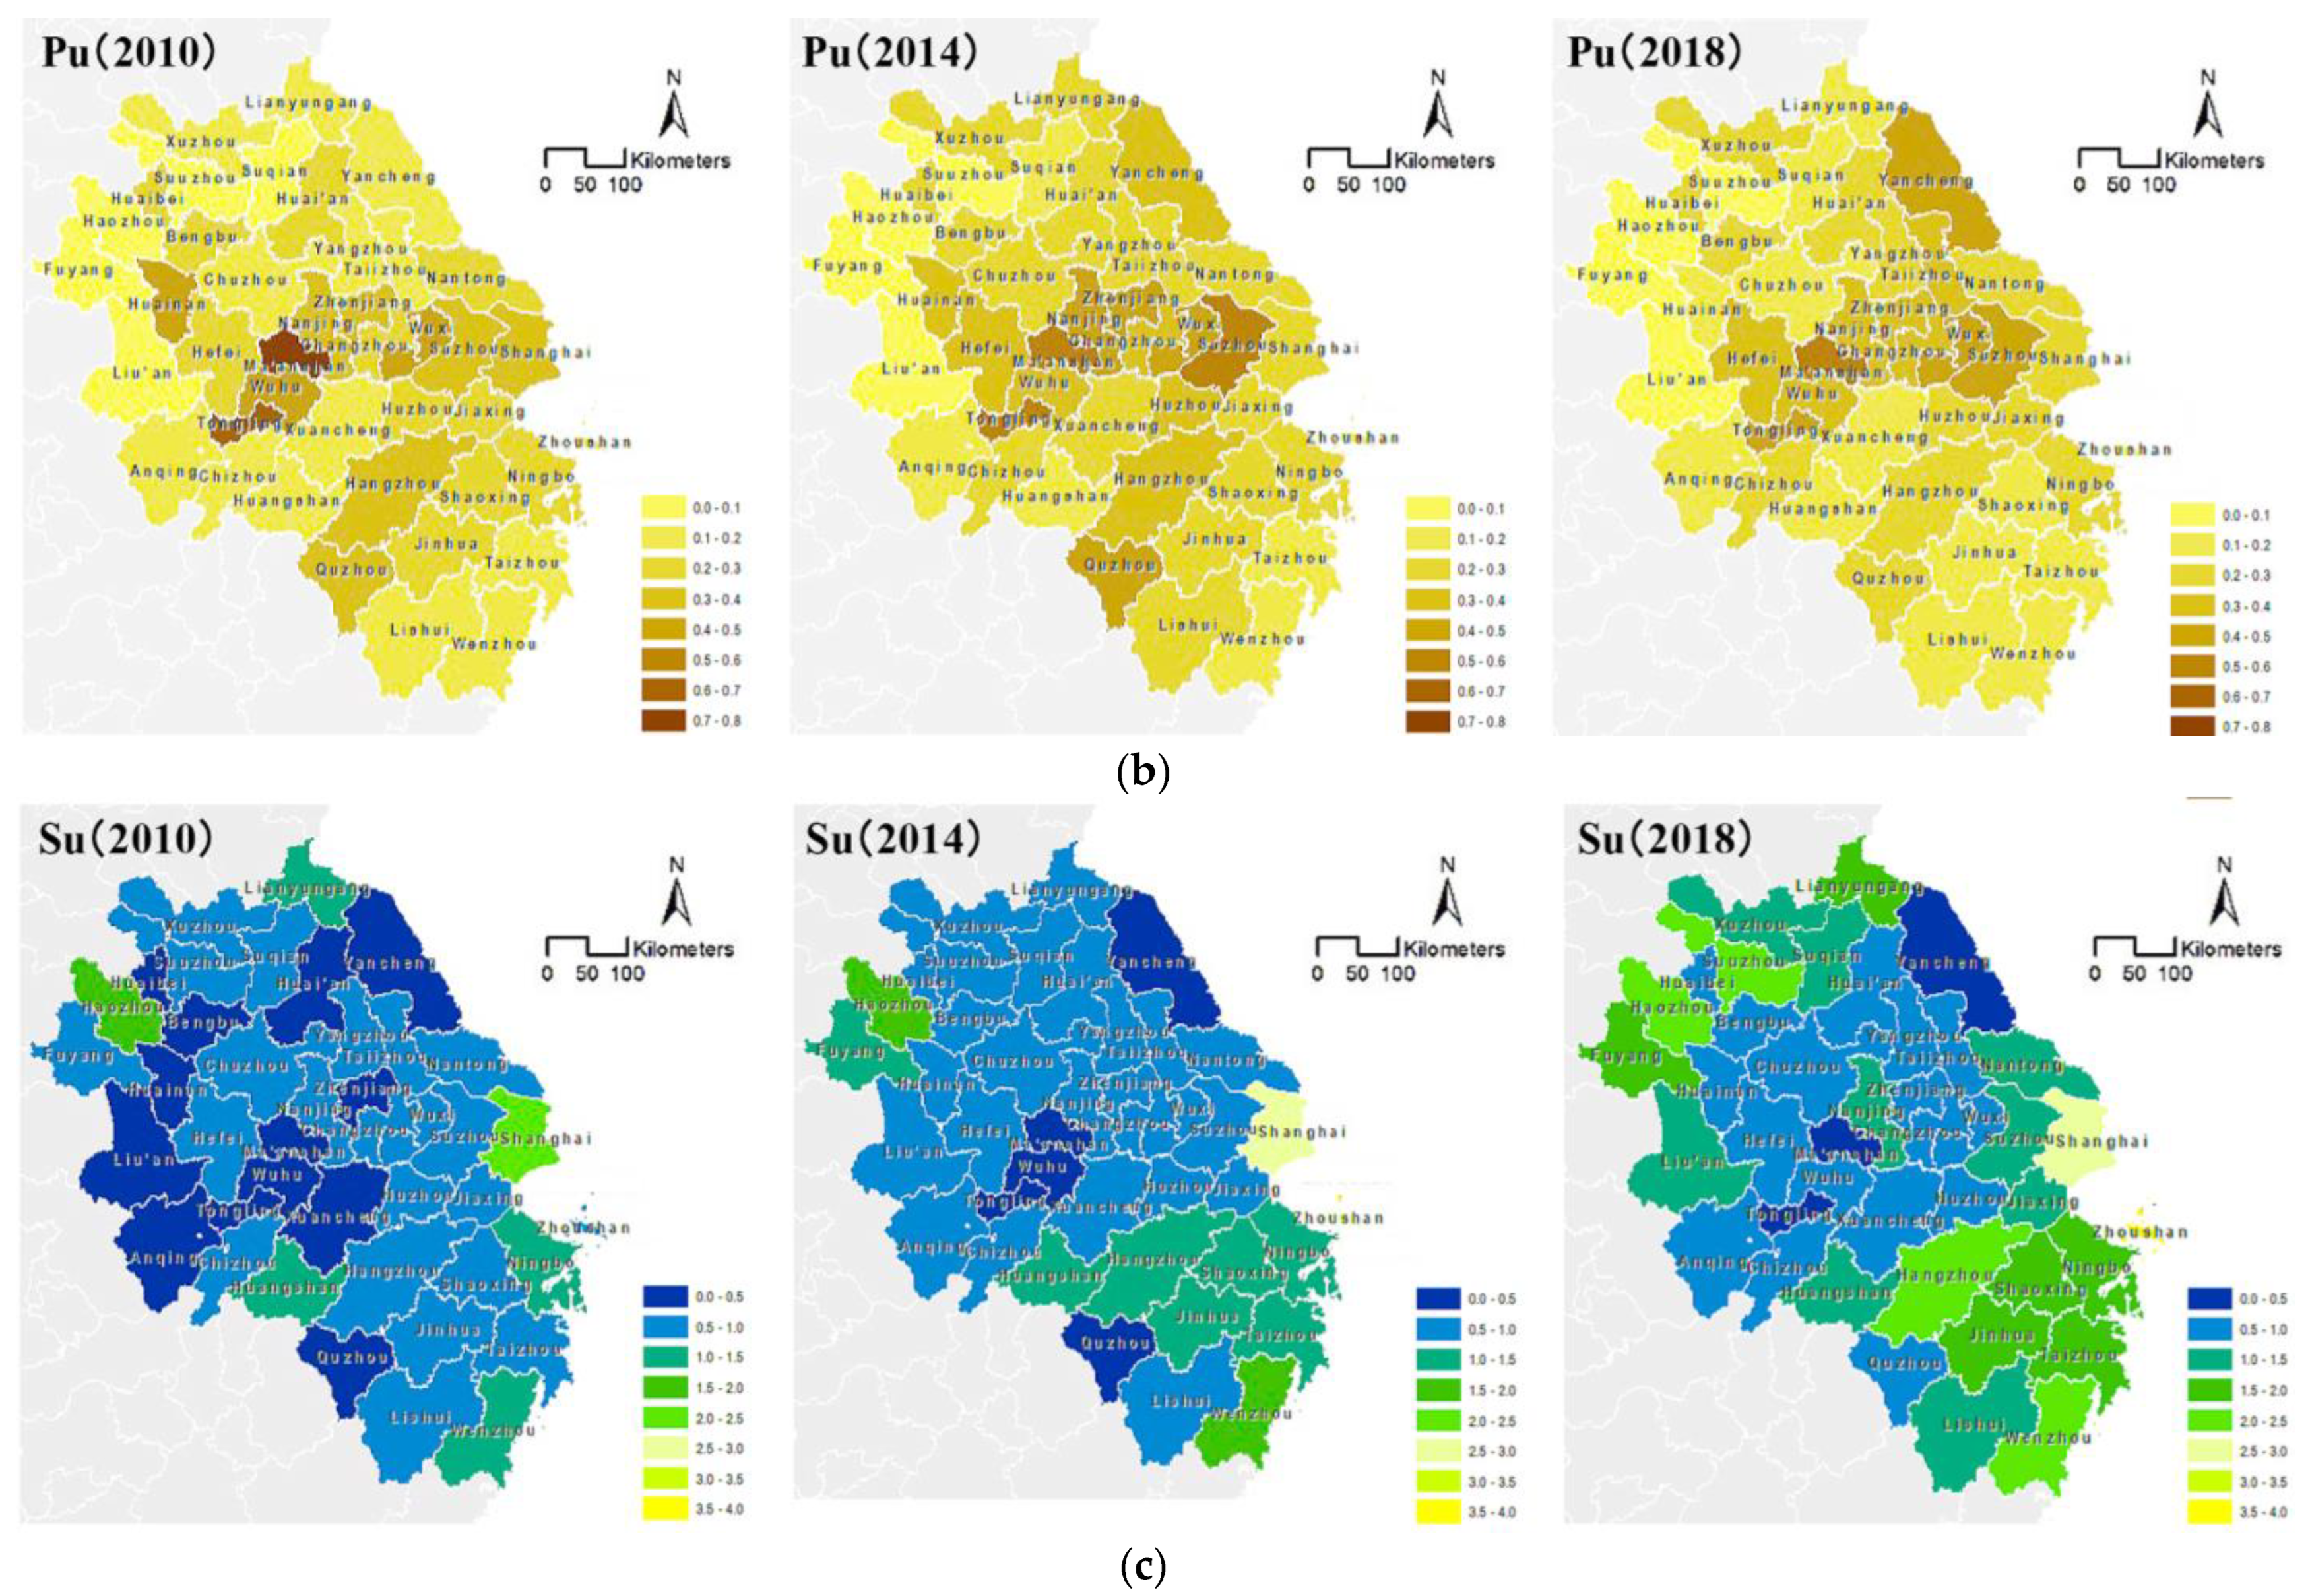
Figure 5.
The geographic distribution of in the Yangtze River Delta from 2010 to 2018.

Figure 6.
The performance of each of the indicator categories of the quality of the built environment () in Yangtze River Delta, measured by the weighted scores from 2010 to 2018. (a) Radar chart of measurement values of urbanization economics in . (b) Radar chart of measurement values of infrastructure development in . (c) Radar chart of measurement values of urban attraction in . (d) Heat maps of each original indicator of .


Figure 7.
The performance of each of the indicator categories of environmental pressure () in Yangtze River Delta measured by the weighted scores from 2010 to 2018. (a) Radar chart of the values of resource consumption and environmental pollution in . (b) Heat maps of each indicator of from 2010 to 2018.


Table 1.
The 17 indicators and their weights for the urban sustainability assessment. This table is derived from our proven assessment system [30] and has been edited.
Table 1.
The 17 indicators and their weights for the urban sustainability assessment. This table is derived from our proven assessment system [30] and has been edited.
| Basic Dimensions | Indicator Categories | Weight (%) | Represented Indicators Description | Weight (%) |
|---|---|---|---|---|
| Urban built environment quality () | Urbanization economies () | 33.33 | q1: Urban population percentage (% of total population) | 8.56 |
| q2: GDP per capita (USD/person) | 8.52 | |||
| q3: Services value added (% of GDP) | 8.51 | |||
| q4: Income per capita (USD/person) | 7.74 | |||
| Infrastructure development () | 33.33 | q5: Construction land per capita (m2/person) | 9.30 | |
| q6: Residential floor space per capita (m2/person) | 9.00 | |||
| q7: Green area per capita (m2/person) | 9.01 | |||
| q8: Road area per capita (m2/person) | 6.02 | |||
| Urban attraction () | 33.33 | q9: Number of tourists (1000 person) | 10.99 | |
| q10: Foreign direct investment (USD 106) | 10.09 | |||
| q11: Export volume of trade (USD 106) | 12.25 | |||
| Urban environmental pressure (PU) | Resource consumption () | 50.00 | p1: Energy consumption per capita (GJ/person) | 25.00 |
| p2: Water consumption per capita (ton/person) | 25.00 | |||
| Environmental pollution () | 50.00 | p3: Wastewater discharged per capita (ton/person) | 10.47 | |
| p4: SO2 discharged per capita (kg/person) | 15.03 | |||
| p5: NOx discharged per capita (kg/person) | 9.56 | |||
| p6: Soot and dust discharged per capita (kg/person) | 14.94 |
Notes: (1) To convert Chinese currency (RMB) into U.S. currency (USD), we multiplied the RMB amount by the annual average closing price of the USD/RMB exchange rate. We used the annual exchange rate data for the years 2010 to 2018, provided by Macrotrends for currency. (2) Income refers to disposable income, which represents the actual income available to residents for final consumption, other non-compulsory expenditures, and savings. (3) Green area includes public parks, community parks, and green areas located near streets. (4) Energy consumption includes coal, crude oil, natural gas, electricity, and other sources of energy.
Table 2.
The coupling interaction mechanism between f(Q) and g(P) by a curve regression analysis of the 41 cities.
Table 2.
The coupling interaction mechanism between f(Q) and g(P) by a curve regression analysis of the 41 cities.
| Model | Quadratic Model | Linear Model | Cubic Model | Linear Model | Quadratic Model | - |
|---|---|---|---|---|---|---|
| Type | 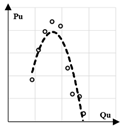 |  | 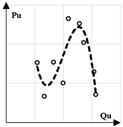 |  | 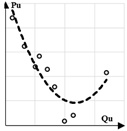 | |
| Interaction relationship | Inverted U-shaped relationship | Negative linear relationship | S-shaped relationship | Positive linear relationship | U-shaped relationship | No significant relationship |
| Related cities | Zhenjiang, Wenzhou, Jinhua, Nantong, Yangzhou, Shaoxing, Jiaxing, Huaibei, Yancheng, Suqian, Chizhou, Chuzhou, Anqing, Fuyang, Suuzhou, Bozhou, Nanjing, Hangzhou, and Suzhou | Zhoushan and Taizhou | Ningbo, Xuzhou, Huzhou, Lianyungang, Lishui, Quzhou, and Bengbu | Hefei, Changzhou, Taiizhou, Huangshan, and Liu’an | Huai’an | Shanghai, Wuxi, Ma’anshan, Wuhu, Huainan, Tongling, and Xuancheng |
Disclaimer/Publisher’s Note: The statements, opinions and data contained in all publications are solely those of the individual author(s) and contributor(s) and not of MDPI and/or the editor(s). MDPI and/or the editor(s) disclaim responsibility for any injury to people or property resulting from any ideas, methods, instructions or products referred to in the content. |
© 2023 by the authors. Licensee MDPI, Basel, Switzerland. This article is an open access article distributed under the terms and conditions of the Creative Commons Attribution (CC BY) license (https://creativecommons.org/licenses/by/4.0/).
Share and Cite
MDPI and ACS Style
Fang, X.; Shi, X.; Phillips, T.K.; Du, P.; Gao, W. The Spatiotemporal Variation Characteristics of Urban Sustainability Based on the SDGs in Yangtze River Delta, China. Buildings 2023, 13, 1909. https://doi.org/10.3390/buildings13081909
AMA Style
Fang X, Shi X, Phillips TK, Du P, Gao W. The Spatiotemporal Variation Characteristics of Urban Sustainability Based on the SDGs in Yangtze River Delta, China. Buildings. 2023; 13(8):1909. https://doi.org/10.3390/buildings13081909
Chicago/Turabian StyleFang, Xue, Xinyu Shi, Tyson Keen Phillips, Peng Du, and Weijun Gao. 2023. "The Spatiotemporal Variation Characteristics of Urban Sustainability Based on the SDGs in Yangtze River Delta, China" Buildings 13, no. 8: 1909. https://doi.org/10.3390/buildings13081909
Note that from the first issue of 2016, this journal uses article numbers instead of page numbers. See further details here.