

The Impact of High-Density Urban Wind Environments on the Distribution of COVID-19 Based on Machine Learning: A Case Study of Macau


Faculty of Humanities and Arts, Macau University of Science and Technology, Macau 999078, China
*
Author to whom correspondence should be addressed.
†
These authors contributed equally to this work.
Buildings 2023, 13(7), 1711; https://doi.org/10.3390/buildings13071711
Submission received: 14 June 2023
/
Revised: 29 June 2023
/
Accepted: 3 July 2023
/
Published: 4 July 2023
(This article belongs to the Special Issue The Adaptability of Residential Planning and Design to World-Changing Events)
Abstract
:The COVID-19 epidemic has become a global challenge, and the urban wind environment, as an important part of urban spaces, may play a key role in the spread of the virus. Therefore, an in-depth understanding of the impact of urban wind environments on the spread of COVID-19 is of great significance for formulating effective prevention and control strategies. This paper adopts the conditional generative confrontation network (CGAN) method, uses simulated urban wind environment data and COVID-19 distribution data for machine training, and trains a model to predict the distribution probability of COVID-19 under different wind environments. Through the application of this model, the relationship between the urban wind environment and the spread of COVID-19 can be studied in depth. This study found that: (1) there are significant differences in the different types of wind environments and COVID-19, and areas with high building density are more susceptible to COVID-19 hotspots; (2) the distribution of COVID-19 hotspots in building complexes and the characteristics of the building itself are correlated; and (3) similarly, the building area influences the spread of COVID-19. In response to long COVID-19 or residential area planning in the post-epidemic era, three principles can be considered for high-density cities such as Macau: building houses on the northeast side of the mountain; making residential building layouts of “strip” or “rectangular” design; and ensuring that the long side of the building faces southeast (the windward side). (4) It is recommended that the overall wind speed around the building be greater than 2.91 m/s, and the optimal wind speed is between 4.85 and 8.73 m/s. This finding provides valuable information for urban planning and public health departments to help formulate more effective epidemic prevention and control strategies. This study uses machine learning methods to reveal the impact of urban wind environments on the distribution of COVID-19 and provides important insights into urban planning and public health strategy development.
1. Introduction
1.1. Research Background
According to the World Health Organization (WHO), approximately 10–20% of people infected with COVID-19 may continue to experience medium- and long-term effects of COVID-19 [1,2,3]. These effects are collectively referred to as the “long-term effects of COVID-19” or “long-term COVID-19 syndrome” (long COVID-19). Common symptoms of “long COVID-19” include fatigue, shortness of breath, cognitive impairment, headache, chest pain, joint pain, etc., which may affect daily life [4]. Taking cities in 31 provinces in the Chinese mainland as an example, the number of people infected with COVID-19 from 1 May to 31 this year was 2777, and 164 died. Many netizens claim on social platforms that they have been infected with COVID-19 for the second or even third time, and it is evident that the risk of COVID-19 still exists and cannot be ignored. In the face of this sudden public health incident, we sincerely appreciate the government’s timely and powerful management and control capabilities and admire the silently contributing medical staff. At the same time, in our roles, as an architect, urban design worker, or scholar of urban architecture research, we also deeply understand the inadequacy of existing cities in responding to public health emergencies. The global pandemic has given the scientific community a lot to think about, but the recurrence of the pandemic or the outbreak of similar diseases is unknown in the future. Unknown things are difficult to predict, but it is possible to work hard for the well-being of mankind and improve housing conditions objectively. How can we prevent problems before they happen; be prepared when other unknown pandemic diseases are introduced; and provide people with a safe, secure, healthy, and comfortable living space?
Because of regional differences and differences between cities, different urban characteristics and urban environments also have differences. Macau is a city on the southeast coast of China and the west bank of the Pearl River (Figure 1). In the north, it is 145 km from Guangzhou, and in the east, it is 70 km from Hong Kong, across the Lingding Ocean. In the past, it included the Macau Peninsula, Taipa, and Coloane. However, now, the two islands of Taipa and Coloane have been reclaimed as one city. The Macau Peninsula was only 2.78 square kilometers in area in 1840. After extensive land reclamation, Macau’s total area reached 33.3 square kilometers [5]. Macau has an estimated population of 673,600, with a population density of 20,745 people per square kilometer, according to official data. The northern portion of the Macau Peninsula is one of the world’s most densely populated regions [5]. This is a veritable ultra-high-density city. At the same time, this aspect also introduces challenges that differ from other cities in terms of pandemic diseases and residential area planning. The impact of the COVID-19 epidemic on Macau began in early 2020 and has been divided into six waves. On 8 January 2023, the transition period of the epidemic ended, and severe special infectious pneumonia was listed as an “endemic disease” [6]. In February of the same year, the influenza A virus also broke out, and most outbreaks were related to mass gathering incidents. Controlling epidemic diseases requires the joint efforts of all parties, but in the urban environmental space, it is also worthy of attention and research.
1.2. Literature Review
1.2.1. The Pandemic and the Urban Wind Environment
Safe urban public spaces are very important to public health. Whether during a pandemic or in the post-epidemic era of COVID-19, urban design inevitably needs to consider the risk of virus transmission. Therefore, the design of the urban and architectural wind environment has also become an important consideration. At present, some scholars have explored this. For example, the urban wind environment is closely related to the pollutant index, which will increase the risk of disease transmission [7,8,9,10,11]. Researchers have also explored geometric design parameters and the infection possibility of courtyards under calm wind conditions [12]; natural ventilation conditions have been shown to effectively reduce the risk of COVID-19 spreading in open offices [13]; a semantic similarity model based on point of interest (POI) selection was used to explore the natural ventilation potential (NVP) of four basic residential layouts (point layout, parallel layout, central layout, and mixed layout) in Wuhan to evaluate measures to improve urban ventilation [14]; using Design-Builder (licensed version) and Autodesk CFD software (student version), researchers performed simulations to compare the amount of natural ventilation and lighting before and after modifying the shape of the building, and then they obtained a multi-story residential design adapted to COVID-19 [15].
1.2.2. Application Areas of Machine Learning in COVID-19
On the other hand, with the rise and vigorous promotion of artificial intelligence, machine learning, as one of its core technologies, has also been applied in the research of urban environments and COVID-19 [16,17,18,19,20,21]. For example, some scholars incorporated the parameters of the urban environment into the effect of daily COVID-19 case prediction and used long short-term memory (LSTM) models to predict India’s (New Delhi and Nagpur), the United States’s (Yuma and Los Angeles), and Sweden’s (Stockholm, Skne, Uppsala, and Vastra Götaland) daily cases (tropical, subtropical, and boreal) in nine cities in different climatic zones of these three countries [22]. However, more models are still being applied to the prediction of disease data models in the field of medical care, ranging from the prediction of disease transmission trajectory to the development of diagnosis and prognosis models [23,24,25]; the identification and diagnosis of radiological images and their use in treatment [26,27,28,29,30,31,32]; and the discovery of potential drugs and the prediction of their structures [32,33,34]. In addition, there is a significant amount of research on forecasting for economic recovery and financial calculation. However, in the field of urban design, there is still a lot of room for exploration.
1.2.3. COVID-19 and Housing Conditions
In addition, in the past three years, some scholars have researched COVID-19 and housing conditions. The relationship between housing conditions and the health of occupants is direct, affecting the quality of life and life expectancy as well as predisposing to the development or exacerbation of different pathologies [35]. A lack of open space, the environment, and the inability to use the most commonly used spaces in the house due to COVID-19 lockdowns may have negatively impacted the health and comfort of college students during quarantine. Therefore, increasing the size of bedrooms and having a balcony or terrace have become elements worth considering [36]. Others have investigated how residential properties in Spain recovered resiliently during the COVID-19 lockdown. Additionally, the authors pointed out that improved designs to achieve healthier and happier housing need to consider the size and characteristics of the built environment (housing and surrounding urban spaces), independent energy and equipment supply for each space, natural ventilation and lighting, and open space contact with the outside world [37]. However, in North America, people who use drugs in various housing settings, including supportive housing buildings, may be particularly at risk for drug-related injuries. Therefore, in the face of such groups, housing conditions also need to consider nursing space support under COVID-19 [38]. There are also rich empirical cases in different countries and regions showing that poor housing conditions lead to further mortality from COVID-19 [39,40,41,42,43]. Nonetheless, the correlation between housing planning and the pandemic at the macro level is worth exploring further. This helps urban designers consider more risk factors when making decisions, thereby contributing to the well-being of human settlements.
1.3. Problem Statement and Objectives
According to a study conducted in Macau, maintaining social distance, wearing masks [44], and voluntarily isolating oneself [45] are effective methods for preventing the community transmission of COVID-19. COVID-19 has disrupted the rhythm of daily life, which has significantly increased the likelihood of anxiety and isolation [46]. The decline in quality of life increases the incidence of insomnia (27.6% of Macau residents suffer from insomnia) [47], and chronic insomnia can lead to depressive symptoms (38.5%) [47]. The main psychological symptoms that Macau residents display during the epidemic are fatigue, mental disorders, and guilt [48], and a lack of exercise increases the likelihood of mental illness. However, in high-density cities with limited land area, it is difficult for many residential areas to provide outdoor rehabilitation sports facilities. At the same time, the current transmission route of epidemic diseases is mainly through the air, and the correlation with the urban wind environment is particularly significant. In the post-epidemic era, how to improve the planning of residential areas has also become a subject of ongoing research. In this paper, the researchers explored the following six questions:
- (1)
- Taking Macau, China, as an example, what is the impact of the high-density urban space and the urban wind environment it shapes on the distribution of COVID-19?
- (2)
- How does machine learning technology assist in analyzing the distribution of COVID-19?
- (3)
- Further, based on the footprint data of 500 cases of the outbreak in Macau, China, in June 2022, what is the correlation between COVID-19 and the urban wind environment?
- (4)
- How do urban wind environments promote or inhibit the distribution of COVID-19 under different morphological layouts?
- (5)
- Using the layout planning and design of sustainable residential areas, which type of form is more conducive to adapting to the environment of pandemic diseases?
- (6)
- In the post-pandemic era, what reflections can this research provide for other similar epidemics?
2. Materials and Methods
2.1. Data Collection
As mentioned above, Macau is a coastal city located in the south of China, near the mouth of the Pearl River. Its characteristics in the wind environment are closely related to its geographical location and subtropical monsoon climate (Figure 2). In summer, Macau is usually affected by the southeast monsoon, with relatively strong winds and an average wind speed of 5 to 7 m per second, often accompanied by brief gusts. The wind direction is mainly from the southeast and blows inland, but it also brings marine air currents and humid weather conditions. This monsoon wind environment may have an impact on the spread of COVID-19. On the one hand, strong winds help air flow and dilute virus particles, reducing their residence time in the air and thereby reducing the risk of transmission. On the other hand, southeasterly winds may blow from densely populated areas, carrying potential virus particles and increasing the possibility of infection. In winter, Macau is mainly affected by the northern monsoon. At this time, the wind is relatively weak, with an average wind speed of about 2 to 4 m per second, and the wind direction is mainly northwest, blowing towards the sea. Under the winter monsoon environment, the air is relatively stable, which may cause virus particles to stay in the air for a long time, increasing the risk of transmission. In addition, Macau is also affected by climate change, such as frequent typhoons, but due to the complexity of extreme climates, the impact of the wind environment in extreme climates on the epidemic is not considered in this study.
To simulate the wind environment in Macau, the researchers collected wind speed and direction data published by the Macau Meteorological Bureau. These data include changes in wind strength and wind direction at different times of the day. These data reflect the real wind conditions in Macau. Second, the Ecotect building environment analysis software (version 2011) was used (refer to Appendix A for the operating conditions of the software when performing wind environment simulation using Ecotect), which provides a scientific and accurate method to simulate the urban wind environment and provides researchers with a tool to quantitatively analyze the urban wind [49,50]. Ecotect is a commonly used environmental simulation software; some previous studies can provide a basis for its reliability [51]. Finally, the researchers applied these meteorological data to the model after building a three-dimensional model of Macau city to further simulate the wind environment in different regions of Macau and achieve an accurate simulation of the urban wind environment (Figure 3a).
In this study, the use of Ecotect software (version 2011) has the following advantages:
- (1)
- Building performance simulation: Ecotect can simulate the performance of buildings under different wind conditions. With the software, researchers can accurately assess the impact of different wind environments on the spread of COVID-19 and gain insight into the relationship between the built environment and virus spread.
- (2)
- Data collection and analysis: Ecotect provides a wealth of data collection tools to obtain the environmental parameters required by the building, such as wind speed, wind direction, and indoor and outdoor temperatures. These data are crucial for studying the association of urban wind environments with the spread of COVID-19.
- (3)
- Result visualization: Ecotect provides an intuitive result visualization function. Through charts and images, researchers can clearly display and present the analysis results. These visualization tools are important to convey research findings and conclusions to judges and readers and contribute to a better understanding of the link between urban wind environments and the spread of COVID-19.
To summarize, Ecotect software (version 2011) played an important role in this study. It provides functions such as building performance simulation, data collection and analysis, and result visualization, providing strong support for researchers to explore the relationship between urban wind environments and COVID-19 transmission.
At the same time, this study also collected the footprint data of COVID-19 patients provided by the Macau Health Bureau in June 2022. These data included the location and range of activities of 500 COVID-19 patients before onset, totaling 3982 footprints [52]. In order to convert these footprint points into geographic coordinates and analyze them, this research uses Google Maps API Web Services to convert the address information of footprint points into accurate geographic coordinates. After the footprint points are converted into geographic coordinates, these data are input into the ArcGIS Pro software (version 3.1) for processing. To create a heat map of the epidemic footprint, the researchers used the hotspot analysis feature in ArcGIS Pro. This function can generate a heat map according to the density of footprints, visually showing the concentrated areas of epidemic activity and hotspots of transmission. In order to ensure the accuracy and consistency of the data, the researchers uniformly transformed all geographic coordinates into the Observatorio Meteorologico 1965 Macau Grid coordinate system for correction. This ensures that the data used in producing the heatmap have a consistent reference frame, making the research results more reliable and comparable (Figure 3b).
In addition, since the epidemic data collected in this study are from June 2022, it is necessary to set the time of the wind simulation to the average wind force and direction of that month. This can ensure that the simulation results are consistent with the actual situation and provide an accurate data basis for this study on the relationship between the urban wind environment and the spread of COVID-19. Therefore, this study mainly focuses on the relationship between the summer monsoon environment, the distribution footprint of the COVID-19 epidemic, and the layout of buildings.
2.2. Data Processing
Using the above method, the researchers obtained the wind environment simulation results for the Macau Peninsula and outlying islands and generated the corresponding COVID-19 heat map (Figure 4). When simulating the wind environment, considering the difference in the height of Macau’s topography, it is necessary to set the analysis height of the wind environment to 5 m above sea level so as to reflect the wind environment conditions in most parts of Macau. However, it should be noted that some buildings in low-lying areas may be ignored in the simulation. When generating the COVID-19 heat map, this study used black-and-white image drawing to simplify data presentation. Black areas in the image indicate areas without COVID-19 cases, while white areas indicate COVID-19 cases. In addition, the depth of the image represents the density of hotspots, and the darker the color, the higher the density of hotspots. This drawing method can visually illustrate and compare the COVID-19 epidemic situation in different regions, identify areas where COVID-19 hotspots are concentrated, and help to understand the spread of the epidemic and the density distribution of hotspots.
In addition, since the training of the CGAN model requires a large amount of sample data (refer to Appendix B for the operating conditions of the machine learning environment), the above-mentioned images need to be cropped uniformly to generate a picture with a size of 512 × 512 pixels (Figure 5). In this study, pixels refer to the basic display unit in an image. In the wind simulation, the pixels of different colors represent the numerical value of the wind speed. In the COVID-19 heat map, white to gray pixels represent the extent of an outbreak, and black pixels represent no outbreaks. Each cropped image covers an area of 4 hectares. The specific cropping area depends on the distribution of COVID-19, which is mainly concentrated in the area containing COVID-19. The selection of these regions can help the CGAN model learn the correlation between urban wind environments and COVID-19. Regions that do not contain COVID-19 may interfere with the training of CGAN and cause the model to not fit the data well, so they are excluded during the cropping process. In this study, a total of 54 sets of images were cropped from the Macau Peninsula and used for the training phase of the model. At the same time, 35 sets of pictures were cropped from the outlying islands of Macau (mainly Taipa and Coloane), and these data were used to test the robustness of the trained model and its accuracy and generalization.
In the processing of materials, by clipping and selecting areas containing COVID-19 as samples, it is possible to ensure that the trained CGAN model can accurately reflect the relationship between the urban wind environment and COVID-19, thereby improving the predictive ability of the model. At the same time, by using the data of Macau’s outlying islands (mainly Taipa and Coloane) for testing, the model’s reliability can be verified, and its adaptability and promotion in different geographical situations can be evaluated. Such a design can ensure that the research conclusions have certain scientific credibility and provide valuable references for further research and practical application.
2.3. CGAN Method
CGAN, or conditional generative adversarial network, is the machine learning method used in this study. The characteristic of CGAN is to generate synthetic data that meet the given conditions through the game of the generator and the discriminator (Figure 6). CGAN consists of two key components: a generator and a discriminator. The generator’s goal is to generate corresponding synthetic data (COVID-19 distribution data) according to the given conditions (in this study, the conditions are urban wind environment data). The discriminator is responsible for judging whether the given data are real or generated by the generator. The generator and the discriminator compete with each other through adversarial training to continuously optimize their respective capabilities.
During training, the generator takes input conditional data (urban wind environment data) and transforms it into synthetic data similar to real COVID-19 distribution data. In contrast, the discriminator receives both the real COVID-19 distribution data and the synthetic data generated by the generator and tries to distinguish their authenticity. The goal of the generator is to generate data that can fool the discriminator into being unable to accurately distinguish real data from synthetic data, while the goal of the discriminator is to distinguish real data from generated synthetic data as accurately as possible. By repeatedly performing confrontational training between the generator and the discriminator, the network framework of CGAN can gradually optimize the generator’s ability. The synthetic data generated by it are closer to the distribution of real data, and the accuracy of the discriminator is improved to make it more effective in distinguishing real data from synthetic data. Finally, the trained generator can generate a probability model that predicts the distribution of COVID-19 under different urban wind environments based on the given urban wind environment data, thereby revealing the impact of urban wind environments on the distribution of COVID-19.
3. Model Training
3.1. Model Training Process and Verification
The model training in this study involves two models, namely, Model 1, for generating COVID-19 heat maps from wind environment images, and Model 2, for generating wind environment images from COVID-19 heat maps. The training goal of these two models is to reveal the association between the urban wind environment and the spread of COVID-19 and achieve data generation and prediction under given conditions.
The input in Model 1 is wind environment image data, and the goal is to generate the corresponding COVID-19 heat map. The model’s training uses the wind environment images of the Macau Peninsula and the corresponding COVID-19 heat map as training samples. By inputting the wind environment image into Model 1, the synthetic COVID-19 heat map generated by Model 1 is compared with the real COVID-19 heat map, and the difference between the two is calculated as the loss function of Model 1.
The training process of Model 2 is similar to that of Model 1 but in the opposite direction. The input of Model 2 is the COVID-19 heat map, and the goal is to generate the corresponding wind environment image. Additionally, using the same training samples, the COVID-19 heat map is input into Model 2, the synthetic wind environment image generated by Model 2 is compared with the real wind environment image, and the difference between the two is calculated as the loss function of Model 2.
Model 1 and Model 2 were trained for 200 epochs, respectively, and statistical analysis was performed by drawing a line graph of the training log (Figure 7). Observing the training log graph leads to the following conclusions:
- (1)
- In the early stages of training, Model 1 and Model 2 rapidly reduce the loss value, showing a preliminary understanding and grasp of the characteristics of the data. As the training progresses, they gradually optimize the parameters and network structure, and their ability to adapt to the data distribution continues to improve. This leads to a continuous decrease in the loss value, which reaches a lower level at a certain stage. With the deepening of training, the loss value gradually tends to be stable, indicating that the model has learned the key features of the data and reached an equilibrium state during the optimization process. The model has reached a good level of performance, and further training may not improve performance significantly. Therefore, the model goes through an initial stage of learning and progressive optimization, and finally it reaches a state where learning converges.
- (2)
- In the training log of statistical CGAN, it is observed that the minimum values of different indicators appear at different iteration numbers. This shows that the optimization process of the model has achieved a balance among various indicators, and the performance of each indicator is considered comprehensively rather than paying too much attention to a specific indicator. At the same time, the minimum values of different indicators are distributed on different iteration numbers, which may indicate mutual influence and interaction between them. The optimization of the model requires trade-offs and adjustments between various indicators to achieve a balanced and optimal training result. In addition, the minimum values of different indicators appear at different iteration numbers, which may also mean that the model gradually optimizes different aspects at different stages. A model may first focus on the optimization of a certain metric and then gradually shift to the optimization of other metrics to achieve better overall performance. These observations thus reveal important features such as balanced optimization, inter-metric interactions, and stepwise optimization during model training.
- (3)
- The lower Mean G_GAN, Mean D_fake, and Mean D_real indicate that the adversarial training between the generator (G) and the discriminator (D) has reached a balanced state. The generator can successfully fool the discriminator into generating realistic samples. At the same time, the discriminator can effectively distinguish generated samples from real samples and give accurate discriminative results. This shows that the model has stability, and the generator has effectively learned the characteristics of the data distribution during the training process and can generate high-quality samples similar to real samples. The discriminator has a high discrimination ability and can accurately judge the authenticity of the generated samples. Therefore, these observations reflect the model’s stability, efficient generative ability, and high-quality discriminative ability.
In addition to parsing the training log of the model, the quality of the model generation can also be evaluated by observing the test pictures of each generation of the trained model. In this study, the pictures generated by Models 1 and 2 were observed and compared with real pictures to verify the training effect and generation quality of the models.
It can be observed in the training process pictures of Model 1 that in the first 50 epochs, there is a large difference between the generated pictures and the real pictures (Figure 8). However, as training progresses, the model gradually improves the quality of the generated images as the number of epochs increases. After about 100 and 150 training epochs, the generated pictures gradually approach the reality of real ones. When the training reaches about 200 epochs, the generated images are almost indistinguishable from the real ones. Therefore, Model 1 has completed the training and has good epoch quality.
Similarly, a situation similar to that of Model 1 is also observed in the pictures of the training process of Model 2 (Figure 9). There is a large difference between the pictures generated in the initial stage and the real pictures, but as the training progresses, the model gradually improves the quality of the generated pictures. After about 100 and 150 training epochs, the generated pictures gradually approach the reality of real ones. Eventually, after about 200 training epochs, the generated images are nearly indistinguishable from real ones. This further verifies the completion of the training of Model 2 and the improvement in the epoch quality.
Through the above observations, it can be concluded that after a certain number of training algebras, the epoch quality of Models 1 and 2 has been significantly improved, and the difference between them and the real picture is gradually reduced. This shows that the model training process in this study is effective, successfully learns the association between the urban wind environment and the COVID-19 heat map, and can generate images of high quality. This provides a reliable basis for further analysis of the relationship between urban wind environments and the spread of COVID-19.
3.2. Correlation Analysis of the Wind Environment and COVID-19 in Different Building Layout Types
In order to understand the correlation between the wind environment of different building layout types and COVID-19, this study takes the materials of wind simulation and COVID-19 hotspots as the input of Model 1 and Model 2 and performs image generation of COVID-19 hotspots and wind simulations. The following characteristics can be observed through the results of generating 54 groups of picture materials on the Macau Peninsula:
In the generated results of Model 1, it can be observed that the higher the building density, the higher the distribution of COVID-19 hotspots, which aligns with common cognition (Figure 10). Among them, Figure 10A shows the situation of modern buildings, and Figure 10B shows the situation of historical buildings. In modern complexes, the distribution of COVID-19 hotspots is relatively uniform, while in historic complexes, the area in the square has the highest density of COVID-19 hotspots. This shows that the building density of the modern building complex is relatively reasonable, and there are many public spaces in it. However, the distance between buildings in the historical building complex is relatively small, and there is only one square for activities, which leads to a concentration of crowds in this square, leading in turn to a high COVID-19 hotspot density.
In addition, in Figure 10C,D, it can be observed that the distribution of COVID-19 hotspots basically matches the shape of the building complex. Especially in public spaces with high wind speeds, the distribution of COVID-19 was not observed, which indicates that open spaces with high wind speeds can effectively alleviate and inhibit the occurrence of COVID-19. Given the above observations, it can be concluded that there are obvious differences in the correlation between different types of wind environments and COVID-19. Areas with a high building density are more prone to COVID-19 hotspots. Modern buildings have relatively better evacuation and public space layouts, which can reduce the concentration of hotspots, while in open spaces with high wind speeds, the spread of COVID-19 is effectively suppressed.
In the generated results of Model 2, it can be observed that more COVID-19 hotspots are typically distributed in building complexes, while less COVID-19 is typically distributed in natural mountain landscapes, which is consistent with our assumption (Figure 11). Figure 11A,B show the distribution of many COVID-19 hotspots, but their distribution patterns are not the same, and they are also consistent with the distribution of building groups in the generated wind environment picture. This shows that the building arrangement is the main driver of the distribution of COVID-19, and the scope of the buildings largely determines the spread of COVID-19.
In addition, in Figure 11C,D, it can be observed that the distribution of COVID-19 hotspots is reduced. Under this condition, the final generated pictures all point to the natural mountain landscape, which shows that the spread of the epidemic can be effectively suppressed in the natural outdoor environment. The specific reason for this may be that the natural outdoor environment has better ventilation conditions, and some plant species also play a role in inhibiting the spread of COVID-19, thereby reducing the formation of hotspots.
In summary, there are obvious differences in the correlation between different types of wind environments and COVID-19. The distribution of more COVID-19 hotspots in the building complex relates to the shape or arrangement of the building itself, and the size of the building determines the spread of COVID-19. In contrast, the lower COVID-19 distribution in natural mountain landscapes may be due to the advantages of the outdoor environment, such as the combined effects of better ventilation conditions and plant suppression.
3.3. Robustness Test of the Model
In order to test the robustness of the model, it is necessary to select some new materials that were not used in the model training process and ensure that there is a certain logical relationship between these materials and the training materials. Therefore, in this study, some wind environment simulations and slices of COVID-19 hotspots in Macau’s outlying islands (mainly Taipa and Coloane) were selected for this study, and a total of 35 slices were acquired. As part of the Macau Special Administrative Region, the Macau Islands share climatic conditions and urban planning with the Macau Peninsula. By evaluating the results of model generation with these new materials, the robustness of the model can be further judged.
Figure 11 shows the generation results of Model 1 for the wind environment simulation materials on Macau’s outlying islands. Overall, there is a certain similarity between the generated COVID-19 hotspot distribution map and the actual results. However, there is a certain difference in percentage, ranging from 22.76% to 56.70%, and the fluctuation in accuracy is more obvious.
- (1)
- In Figure 12 group number 1,2, the difference percentages are small (26.81% and 22.76%). This is because the two illustrations have a clear separation of building groups and public spaces, as well as higher wind speeds, factors that allow the model to generate a more accurate map of the distribution of COVID-19 hotspots.
- (2)
- In Figure 12 group number 3,4, the difference percentages are higher (56.70% and 49.47%). The reason for this is that some of these buildings are not residential or have been out of use, in which case the model cannot distinguish well, resulting in generated COVID-19 hotspot distribution results that deviate significantly from the actual situation. In addition, the model avoids the generation of COVID-19 hotspots in the position of wind flow so that the overall generation results still have a certain degree of accuracy.
In summary, the robustness and accuracy of Model 1 can be preliminarily understood by evaluating the results of model generation on materials from Macau’s outlying islands. Despite some differences, Model 1 can still generate a COVID-19 hotspot distribution map similar to the actual results. Especially in the case of obvious separation of building groups and public spaces and high wind speeds, it performs better. However, for some non-residential buildings or areas that have been discontinued, the accuracy of the model drops. These findings provide valuable guidance for researchers to further optimize and improve Model 1.
Figure 13 shows the analysis of the generation results of Model 2 on the COVID-19 hotspot materials on the outlying islands of Macau. Overall, Model 2 has poor quality in generating architectural forms and can barely restore the actual architectural forms, presenting a chaotic image. However, the model showed some accuracy in generating the main locations of buildings and wind environments, but the overall error value was large (ranging from 75.83% to 87.83%). This is because the input material is the distribution map of COVID-19 hotspots, and this type of material contains much less information than the picture of the wind environment simulation. It is difficult to make the model accurately restore the actual urban architecture and wind environment based on the COVID-19 heat map alone.
Nevertheless, the experiment can still observe a certain regularity.
- (1)
- Figure 13 group number 1 features the smallest error value among the other pictures (75.83%). This is because the input COVID-19 heat map has only a small number of hotspot distributions, and the hotspot density is low. The model considers these areas to be connected to the mountain landscape, so relatively accurate results are obtained, which shows that there is a high correlation between the distribution of COVID-19 and the mountain landscape.
- (2)
- In Figure 13 group number 2, the results generated by the model show that strong wind flow is located in the middle of the building complex. This is because there is no COVID-19 hotspot distribution in the middle of Figure 13 group number 2, and the model believes this area should have good ventilation. The results of this generation are consistent with the actual situation, showing that a better ventilation environment helps to suppress the spread of COVID-19.
- (3)
- The generated results in Figure 13 group number 3 are completely different from the actual situation, and the error percentage is the highest (87.83%). This is because this location is the main commercial area of Macau’s outlying islands, and the spread of COVID-19 is mainly caused by contact between people in commercial activities, such as people smoking in this area, and COVID-19 spreads through smog. This particular case was not anticipated by the model and thus generated completely inaccurate results.
- (4)
- The generated result of Figure 12 group number 4 is similar to that of Figure 13 group number 2. Likewise, in areas where there is no distribution of COVID-19, the model considers them to be better ventilated. Therefore, there is a clear boundary between the building and the wind environment in the generated results.
However, for large buildings with medical functions or related diseases, such as hospitals, when the model generates a COVID-19 hotspot distribution map, the accuracy of the hospital area may be affected to a certain extent. As important public facilities, hospitals have different personnel flow and activity patterns from residential areas and may face higher epidemic risks and transmission challenges. Therefore, when assessing and predicting the spread of COVID-19 in hospital areas, more detailed and in-depth research is required, combined with hospital-specific environmental factors and control measures for analysis.
In summary, Model 2 is less accurate in generating COVID-19 hotspot material but can still show some accuracy in specific cases. This emphasizes the importance of considering the type of input material in the quality of model generation, and it is difficult to accurately restore the form of urban buildings and wind environments by only relying on the COVID-19 heat map. In future research, the robustness of Model 2 can be further improved to improve its adaptability to complex inputs.
4. Discussion: Residential Planning under Long COVID-19
In this study, it was found that there is a certain correlation between wind environment factors and the distribution of hotspots of the new coronavirus, and different types of wind environments have different effects on the distribution of hotspots. This means that urban planning and public health departments can reduce the risk of epidemic transmission through reasonable urban design and wind environment control. Based on this, the following four sections—typical residential building types in low-epidemic-risk areas, wind environment simulation, epidemiological situation analysis and verification, and design principles—discuss the relationship between the daily urban wind environment, the distribution of COVID-19 hotspots, and the shape of building layouts.
4.1. Typical Residential Building Types in Low-Epidemic-Risk Areas
How can we further determine which type of architectural form is more suitable for the future long COVID-19 environment? Based on the above-mentioned relationship between the wind environment of residential buildings in Macau and the impact of the epidemic, the researchers examined specific architectural space forms in areas less affected by the epidemic. First of all, taking Macau Peninsula as a typical research object, the wind speed of the epidemic-affected area and the unaffected area was analyzed to obtain the relationship between the epidemic and wind speed. To obtain the wind speed map of the epidemic-affected area and the wind speed map of the epidemic-unaffected area, the researchers superimposed the epidemic distribution map and the wind speed map (Figure 14). Second, the wind speeds of the above two epidemic distributions were counted separately to obtain the overall wind speed of the affected area and the wind speed of the area unaffected by the epidemic (Figure 15).
Given the wind speed statistics in Figure 14, it can be seen that in the areas affected by the epidemic, 63.32% of the areas affected by the epidemic have a wind speed between 0.00 and 1.94 m/s (the wind speed is 0.00 m/s, accounting for 36.96%; the wind speed is 0.97 m/s, accounting for 16.71%; and the wind speed is 1.94 m/s, accounting for 9.65%). Wind speeds between 2.91 and 9.7 m/s are relatively less affected by the epidemic, accounting for between 1.27% and 6.60%. In the areas not affected by the epidemic, 94.09% of the wind speeds are between 3.86 and 9.70 m/s, and most of them are between 4.85 and 8.73 m/s (accounting for 68.61%). Comparing the superposition of the two situations, it is found that the proportion of wind speed at 3.86 m/s is relatively similar. When the wind speed is higher than 2.91 m/s, the proportion of the overall epidemic distribution is small, indicating that most areas can reduce the spread of the epidemic to a large extent when the wind speed is higher than 2.91 m/s.
Therefore, for the areas not affected by the epidemic, the researchers selected the areas with wind speeds greater than 2.91 m/s around the buildings, combined with the building density and the surrounding topography, to further study the architectural spatial form. According to the characteristics of urban residential buildings and environmental spaces in Macau, they can be divided into the following four categories based on building density and surrounding terrain conditions:
- (1)
- High-density residential buildings without mountains: the building density is relatively high, and there is no obvious mountainous terrain around (the surrounding wind speed is 0.00~6.79 m/s). Its characteristics are: the form of a single residential building presents a “C” shape. Among them, the building is a semi-enclosed “C”-shaped building, and the inwardly enclosed frontal inner part of the building faces the east or south side (windward side) (Figure 16).
- (2)
- High-density residential buildings with mountainous types: The surrounding mountainous terrain has a relatively high building density (the surrounding wind speed is 0.97~8.73 m/s). Residential buildings are built at the foot of the mountain or on top of the mountainous terrain. Its characteristics are that most of the buildings are located on the southeast side of the mountain, and the building form is “strip” or “rectangular”. Further research found that the east and south sides of the mountain are the main windward sides, and residential buildings on the southeast side of the mountain are better ventilated and less affected by the epidemic. The buildings on the west side of the mountain have poor ventilation, and the airflow is blocked by the mountain, which means the buildings are greatly affected by the epidemic. Therefore, residential buildings should be avoided on the west side of the mountain. The single building built at the foot of the mountain has a “strip” shape, with its back against the mountain and its long side facing the southeast, maximizing the windward area. Most buildings built on the mountain are “rectangular”, and the southeast side is less affected by the epidemic (Figure 17).
- (3)
- Low-density residential buildings without mountains: the building density is relatively low, and there is no mountainous terrain around (the surrounding wind speed is 0.00~5.82 m/s). Its characteristics are that the residential building presents a single shape, mostly an “L” or “+”. Among them, the short side of the high-density strip, or “L”-shaped building unit, is the windward side, and the long side faces the northeast or southwest side. The “+”-shaped building layout faces the southeast side, and the “+” is also rotated by 45° to increase the windward area (Figure 18).
- (4)
- Low-density residential buildings with mountainous types: with mountainous terrain all around, the building density is relatively low (the surrounding wind speed is 0.00~4.85 m/s). Its characteristics are that most of the buildings are located on the northwest side of the mountain. The residential buildings at the foot of the mountain are more affected by the wind in the northwest, so the epidemic’s impact is lessened. The single residential building on the northwest side at the foot of the mountain presents a “C” shape, or “rectangle”. Among them, the building is a semi-enclosed “C”-shaped building, and the inwardly enclosed frontal inner part faces the southeast (windward side) or northeast side. The single building located on the northwest side of the mountain is mainly “rectangular”, with its back against the mountain and its long side facing the southeast side (windward side). Compared with buildings located on the northwest side of the mountain, they are more susceptible to the impact of the epidemic. It is recommended that residential buildings be built on the southeast side of the mountain (Figure 19).
To summarize, in residential areas with high density, residential buildings that are less affected by the epidemic are mainly elongated, “L”, “C,” and “+” types. However, low-density residential areas generally have higher wind speeds and are less affected by the epidemic. In the case of a mountainous environment, the wind environment of the mountain is obvious. Buildings built on the windward side of the southeast side of the mountain are generally less affected by the epidemic. The mountain blocks residential buildings built on the northwest side of the mountain from most of the wind and air flow, and the buildings are more affected by the epidemic. Typical residential buildings can be summarized as follows (Figure 20):
- (1)
- “C”-type, high-density residential buildings without mountains (wind speed 2.91~6.79 m/s);
- (2)
- “L” type or “+” type, low-density residential buildings without mountains (wind speed 2.91~5.82 m/s);
- (3)
- “Strip”-type, high-density residential buildings, mostly located on the northeast side of the mountain (wind speed 2.91~8.73 m/s).
- (4)
- “Rectangular”-type high-density residential buildings with mountains, mostly located on the southeast side of the mountain (wind speed 2.91~8.73 m/s).
- (5)
- “C”-type, low-density residential buildings with mountains, mostly located at the foot of the mountain in the northwest (wind speed 2.91~4.85 m/s).
- (6)
- “Rectangular”-type, low-density residential buildings with mountains, mostly located at the foot of the mountain and on the northwest side (wind speed 2.91~4.85 m/s).
4.2. Wind Environment Simulation and Epidemic Situation Analysis and Verification
In order to further verify that the typical residential space summarized above has the characteristics of a low-risk downwind environment, the researchers conducted wind environment simulation and epidemic prediction verification for several typical residential building forms summarized above. First, they simulated the wind environment of the six typical residential types obtained above (the wind simulation parameters are the same as before). Second, the typical residential layout type map was imported into the machine learning model to predict the epidemic situation under this form. Third, the wind environment simulation results were superimposed and compared with the epidemic prediction results, and the location of residential buildings was compared with the COVID-19 outbreak prediction map. In this way, it was verified that the numerous typical residential building forms summarized in this paper could effectively reduce the impact of the COVID-19 outbreak due to the influence of the wind environment.
It can be seen in Figure 18 that the six typical residential building forms are all affected by the wind environment to a certain extent, but they are less affected by the outbreak of the epidemic (the test wind speed was 2.91~9.7 m/s). Among them, the best performance is in the situation in Figure 21 group number 3: “strip”-type, high-density residential buildings with mountains (average wind speed of 5.82 m/s). The second-best performance is the situation in Figure 21 group number 6: “rectangular”-type, low-density residential buildings with mountains (average wind speed of 4.85 m/s). The typical forms of Figure 21 group number 3,6 both include mountains, and the buildings are located on the east side of the mountain terrain. Observing Figure 21 group number 3, the simulation diagram of the wind environment of the “strip” high-density residential building with mountains, it can be seen that the length of the strip and rectangular buildings is located on the windward side of the direction, and the wind passes through the building on the side of the mountain. After the height changes, it continues to rise, and an upward airflow is generated between the building and the mountain to quickly dredge the airflow between the buildings. Figure 21 group number 4 is similar to this situation, but the building is located on the northeast side of the mountain, and the mountain blocks part of the wind, so the effect is not as good as the situation in Figure 21 group number 3. Among the remaining types, most of the buildings are included in the non-outbreak area under the influence of the wind environment, but some buildings are in the predicted outbreak area.
In general, most of these six typical residential building forms are in areas without epidemics under the influence of wind environments, have the characteristics of low epidemic risk, and can be used as an important reference layout for residential buildings. Against the background of the development of long COVID-19, it can be used as a reference for future residential building planning.
4.3. Design Principles
Based on the above analysis of Macao’s wind environment and the outbreak of the epidemic, especially in high-density cities, we can summarize three principles and suggestions for the future long COVID-19 residential building form planning:
- (1)
- Select a site with mountains surrounding it for the residential buildings. Mountain scenery can effectively suppress the epidemic. The northeast side of the mountain is the best place to put a building, followed by the southeast and northwest sides. Keep a certain distance between the building and the mountain to increase the air flow between the building and the mountain.
- (2)
- Residential building form: adopt a “strip” or “rectangular shape”, and use the long side of the building as the windward side as much as possible. Guide the wind into the building to the greatest extent and renew the air in the residential building. The six typical architectural forms summarized above can be used as planning references.
- (3)
- Residential building orientation: Orient the long side of the building towards the southeast side (windward side). Most of the six typical residential buildings summarized above are inclined towards the southeast, and the purpose is to increase the airflow on the windy side as much as possible.
- (4)
- Surrounding wind speed control: It is recommended that the overall wind speed around the building be above 2.91 m/s. The wind speed can be controlled by referring to the wind speed values corresponding to the six typical residential building types obtained in the experiments in this paper. The best wind speed is between 4.85 and 8.73 m/s.
It is undeniable that the design principles in this study belong to the stage of theoretical exploration. However, the application of these principles in practice may face some challenges. Especially in the context of the current tapering of the pandemic, architectural and urban planning decisions need to consider long-term sustainability and variability. The lifespan of a building may span multiple pandemic cycles, so design decisions need to take into account a variety of factors, including special needs during the pandemic and future sustainability goals. In addition, the COVID-19 virus is not the only disease; other diseases, such as asthma, are associated with factors such as humidity and air quality. Therefore, the impact and needs of other diseases should also be considered in implementing the design principles. At the same time, it is important to actively cooperate with professionals in related fields, such as urban planners, architects, and public health experts. Further, design principles and guidelines should be validated and improved through field observations, simulation experiments, and case studies to ensure their feasibility and effectiveness in future practice.
5. Conclusions
This study aims to explore the relationship between the urban wind environment and the spread of COVID-19 to reveal the importance of the wind environment in epidemic prevention and control. Additionally, we aimed to provide new perspectives for the urban planning and public health sectors to develop effective strategies. Additionally, the study results are universal to a certain extent. This study strives to ensure the scientificity and credibility of the research by adopting systematic research methods (Ecotect wind environment simulation, CGAN) and reliable data sources (climate statistics published by the Macau Meteorological and Geophysical Bureau). The researchers used Generative Adversarial Networks (CGAN) as a main method to generate urban wind environment data and COVID-19 hotspot distribution maps. As mentioned in the literature review, GAN is a machine learning-based tool widely used in several fields and has a solid scientific foundation. The method achieves accurate simulation and generation of real data by training a generator network and a discriminator network. Generative adversarial networks have shown outstanding performance in tasks such as image generation, data augmentation, and simulation and have been extensively researched and validated. Based on the existing urban wind environment data and COVID-19 epidemic data, the researchers generated reliable and accurate wind environment data and COVID-19 hotspot distribution maps through generative adversarial networks. In this research, the training and verification of the model were carried out, and a comparison with and analysis of the actual data were conducted. By comparing the data generated by the model and the real data, the study found that the difference between the two was not very significant (Figure 7 and Figure 8). This showed that the method used was scientific and useful. The following conclusions can be drawn from this study:
- (1)
- There are significant differences in the correlation between different types of wind environments and COVID-19. Areas with high building density are more prone to COVID-19 hotspots. Modern building complexes have better evacuation and public space layouts, which can reduce the concentration of hotspots. In addition, open spaces with high wind speeds can effectively suppress the spread of COVID-19.
- (2)
- The distribution of COVID-19 hotspots in the building complex relates to the characteristics of the building itself. The size of the building area determines the spread of COVID-19. In contrast, the lower COVID-19 distribution in natural mountain landscapes may be aided by the outdoor environment, such as better ventilation conditions and the inhibitory effect of plants.
- (3)
- The model (Model 1) that generates the distribution of COVID-19 hotspots from wind environment data performs well in generating the distribution of COVID-19 hotspots, especially when there is a clear separation between building groups and public spaces, and the wind speed is high. However, in non-residential buildings or areas that have been discontinued, the model’s accuracy drops, requiring further optimization and improvement.
- (4)
- The model (Model 2) that generates wind environment data through the distribution of COVID-19 hotspots is less accurate in generating building and wind patterns but can still show some accuracy in specific cases. This emphasizes the importance of considering the type of input material on the quality of model generation, and the robustness of Model 2 needs to be further improved for complex generation tasks.
- (5)
- For high-density cities such as Macau, in response to long COVID-19 or residential area planning in the post-epidemic era, three principles can be considered: building houses on the northeast side of the mountain; ensuring residential building layouts are of “strip” or “rectangular” design; and orienting the long side of the building towards the southeast (windward side). At the same time, it is recommended that the overall wind speed around the building be above 2.91 m/s, and the best wind speed is between 4.85 and 8.73 m/s.
- (6)
- There is a close relationship between the urban wind environment and the spread of COVID-19, and the specific form of the urban wind environment may have a significant impact on the speed and scope of virus transmission. Therefore, urban planning and public health departments must consider urban wind environments in epidemic prevention and control strategies.
In addition, there are some limitations to this study:
- (1)
- This study only takes Macau as an example, and the research results may be affected by geographical specificity. Therefore, similar studies need to be carried out in more areas (such as low-density cities) to verify the generalizability of the results.
- (2)
- This study only focuses on the impact of urban wind environments on the spread of COVID-19 without considering the combined effects of other environmental factors. Future research can continue to explore the comprehensive impact of different environmental factors (such as light and thermal environments) on the spread of the epidemic.
- (3)
- The design principles and guidelines proposed in this study are based on the exploration of the relationship between the urban wind environment and the spread of COVID-19. This provides new perspectives for urban planning and public health authorities to develop strategies to help reduce the risk of spreading the disease. However, design principles belong to the stage of theoretical exploration. This may limit its direct application in practice. The impact and needs of other diseases should be considered in implementing subsequent design principles to respond to the ever-changing urban environment. At the same time, builders should actively cooperate with professionals in related fields, such as urban planners, architects, and public health experts. Architects can verify and improve design principles and guidelines through methods such as field observations, simulation experiments, and case studies to ensure their feasibility and effectiveness in practice.
- (4)
- This study focuses on exploring the relationship between the urban wind environment and the spread of COVID-19, and the conclusions mainly apply to COVID-19. From now on, designing cities around COVID-19 may not be enough, because outbreaks and virus characteristics may change over time. However, such a method can still be used as a reference in the future. At the same time, this study also has certain reference values for improving the control of other diseases. Although the transmission mechanism and characteristics of each disease are different, there may be some commonalities in the influencing factors of the urban wind environment on disease transmission. For example, the spread of diseases relating to humidity or air quality, such as asthma, may also be affected by the urban wind environment [53].
Nonetheless, this study provides an analytical approach focusing on the urban wind environment and COVID-19. This approach could provide useful guidance for urban planners and public health authorities in designing cities with the risk of transmission of different diseases in mind. However, since transmission mechanisms and risk factors may differ for each disease, further research and context-specific analyses are needed when applying this study to improve the control of other diseases. This involves an in-depth study and evaluation of the transmission pathways, environmental factors, and associated data for a particular disease. Therefore, although the conclusions of this study are mainly applicable to COVID-19, the research methods and analytical framework can provide useful references for improving the control of other diseases and inspire future related research in the fields of urban planning and public health.
For buildings and complexes that generate large numbers of users, such as so-called “urban interchanges,” the challenge may be even greater. These areas often have a higher turnover and density of people, which may increase the risk of COVID-19 transmission. Therefore, studying the relationship between the wind environment at urban intersections and the spread of COVID-19 is a direction worthy of further research. For these special areas, more factors need to be considered, such as the concentration of people, building layout and usage patterns, and ventilation systems, in order to more comprehensively assess their relevance to the spread of the epidemic. Although this study only focuses on residential areas, public facilities, buildings, and urban intersections have an important impact on the spread of the epidemic. Therefore, future research can further expand the scope, deeply explore the relationship between the characteristics of the wind environment and the spread of the epidemic in these special areas, and formulate corresponding prevention and control strategies.
In order to further improve future research, researchers can deeply explore the comprehensive influence of different environmental factors on the spread of the epidemic and optimize the model’s performance to improve the accuracy of complex inputs and non-residential building areas. At the same time, studies could focus on conducting broader research to expand the understanding of the relationship between urban wind environments and COVID-19 transmission and provide more specific guidance for urban planning and public health departments.
Author Contributions
Conceptualization, L.Z. and Y.C.; methodology, L.Z. and L.Y.; software, L.Z. and L.Y.; validation, L.Z. and L.Y.; formal analysis, L.Z. and Y.C.; investigation, L.Z. and Y.C.; resources, L.Z. and Y.C.; data curation, L.Z. and Y.C.; writing—original draft preparation, L.Z., Y.C. and L.Y.; writing—review and editing, L.Z. and Y.C.; visualization, L.Z. and Y.C.; supervision, J.Z.; project administration, J.Z.; funding acquisition, J.Z. All authors have read and agreed to the published version of the manuscript.
Funding
This research was funded by the National Social Science Foundation’s special academic team project for unpopular research (21VJXT011).
Institutional Review Board Statement
Not applicable for studies not involving humans or animals.
Informed Consent Statement
Not applicable for studies not involving humans.
Data Availability Statement
The datasets used and analyzed during the current study are available from the corresponding author upon reasonable request.
Conflicts of Interest
The authors declare no conflict of interest.
Appendix A
Ecotect’s operating environment: the operating system was Windows 10 (X64), the Autodesk Ecotect Analysis version was 2011, the graphics card was NVIDIA Quadro RTX 5000 (16G), and the processor was Intel(R) Xeon(R) Gold 6230R (2.1 GHz).
Appendix B
Machine learning environment configuration: the operating system was Windows 11 (X64), the Cuda version was 11.5, the deep-learning framework was Pytorch, the graphics card was GeForce GTX 3070 (16G), and the processor was AMD Ryzen 9 5900HX (3.30 GHz).
References
- Post COVID-19 Condition. Available online: https://www.who.int/emergencies/diseases/novel-coronavirus-2019/media-resources/science-in-5/episode-47---post-covid-19-condition?gclid=CjwKCAjwg-GjBhBnEiwAMUvNW6KAnNghamKfuAZgrMh56QRZbpESvzBoupjo7NNoe0USPARjdcFkSBoCerQQAvD_BwE (accessed on 1 June 2023).
- Post COVID-19 Condition (Long COVID). Available online: https://www.who.int/europe/news-room/fact-sheets/item/post-covid-19-condition (accessed on 1 June 2023).
- Davis, H.E.; McCorkell, L.; Vogel, J.M.; Topol, E.J. Long COVID: Major findings, mechanisms and recommendations. Nat. Rev. Microbiol. 2023, 21, 133–146. [Google Scholar] [CrossRef] [PubMed]
- Raveendran, A.V.; Jayadevan, R.; Sashidharan, S. Long COVID: An overview. Diabetes Metab. Syndr. Clin. Res. Rev. 2021, 15, 869–875. [Google Scholar] [CrossRef] [PubMed]
- Basic Information of Macau. Available online: https://www.ipim.gov.mo/zh-hant/Macau-exhibition-and-conference/information-on-exhibition-and-conference/introduction/ (accessed on 1 June 2023).
- Macau Ended the Transitional Period of the Epidemic on SUNDAY, and the Government Estimates that 60% to 70% of the Infected Population. Available online: https://www.tdm.com.mo/zh-hant/news-detail/788659?isvideo=false&lang=zh-hant&category=all (accessed on 1 June 2023).
- Coccia, M. How (Un)sustainable Environments Are Related to the Diffusion of COVID-19: The Relation between Coronavirus Disease 2019, Air Pollution, Wind Resource and Energy. Sustainability 2020, 12, 9709. [Google Scholar] [CrossRef]
- Amnuaylojaroen, T.; Parasin, N. The association between COVID-19, air pollution, and climate change. Front. Public Health 2021, 9, 662499. [Google Scholar] [CrossRef] [PubMed]
- Purwanto, P.; Astuti, I.S.; Rohman, F.; Utomo, K.S.B.; Aldianto, Y.E. Assessment of the dynamics of urban surface temperatures and air pollution related to COVID-19 in a densely populated City environment in East Java. Ecol. Inform. 2022, 71, 101809. [Google Scholar] [CrossRef]
- Fadaei, A. Ventilation systems and COVID-19 spread: Evidence from a systematic review study. Eur. J. Sustain. Dev. Res. 2021, 5, em0158. [Google Scholar] [CrossRef]
- Leng, P.C.; Aw, S.B.; Ali, N.E.H.; Ling, G.H.T.; Lee, Y.L.; Ahmad, M.H. Solar Chimneys as an Effective Ventilation Strategy in Multi-Storey Public Housing in the Post-COVID-19 Era. Buildings 2022, 12, 820. [Google Scholar] [CrossRef]
- Leng, J.; Wang, Q.; Liu, K. Sustainable design of courtyard environment: From the perspectives of airborne diseases control and human health. Sustain. Cities Soc. 2020, 62, 102405. [Google Scholar] [CrossRef]
- Abbas, G.M.; Gursel Dino, I. The impact of natural ventilation on airborne biocontaminants: A study on COVID-19 dispersion in an open office. Eng. Constr. Archit. Manag. 2022, 29, 1609–1641. [Google Scholar] [CrossRef]
- Lu, H.; Xia, M.; Qin, Z.; Lu, S.; Guan, R.; Yang, Y.; Miao, C.; Chen, T. The Built Environment Assessment of Residential Areas in Wuhan during the Coronavirus Disease (COVID-19) Outbreak. Int. J. Environ. Res. Public Health 2022, 19, 7814. [Google Scholar] [CrossRef]
- Waheeb, M.I.; Hemeida, F.A. Study of natural ventilation and daylight in a multi-storey residential building to address the problems of COVID-19. Energy Rep. 2022, 8, 863–880. [Google Scholar] [CrossRef]
- Moulaei, K.; Shanbehzadeh, M.; Mohammadi-Taghiabad, Z.; Kazemi-Arpanahi, H. Comparing machine learning algorithms for predicting COVID-19 mortality. BMC Med. Inform. Decis. Mak. 2022, 22, 2. [Google Scholar] [CrossRef]
- Dairi, A.; Harrou, F.; Zeroual, A.; Hittawe, M.M.; Sun, Y. Comparative study of machine learning methods for COVID-19 transmission forecasting. J. Biomed. Inform. 2021, 118, 103791. [Google Scholar] [CrossRef] [PubMed]
- KPrakash, B.; Imambi, S.S.; Ismail, M.; Kumar, T.P.; Pawan, Y.V.R.N. Analysis, prediction and evaluation of COVID-19 datasets using machine learning algorithms. Int. J. 2020, 8, 2199–2204. [Google Scholar]
- Wathore, R.; Rawlekar, S.; Anjum, S.; Gupta, A.; Bherwani, H.; Labhasetwar, N.; Kumar, R. Improving performance of deep learning predictive models for COVID-19 by incorporating environmental parameters. Gondwana Res. 2023, 114, 69–77. [Google Scholar] [CrossRef] [PubMed]
- Pinter, G.; Felde, I.; Mosavi, A.; Ghamisi, P. Richard Gloaguen, COVID-19 pandemic prediction for Hungary; a hybrid machine learning approach. Mathematics 2020, 8, 890. [Google Scholar] [CrossRef]
- Kushwaha, S.; Bahl, S.; Bagha, A.K.; Parmar, K.S.; Javaid, M.; Haleem, A.; Singh, R.P. Significant applications of machine learning for COVID-19 pandemic. J. Ind. Integr. Manag. 2020, 5, 453–479. [Google Scholar] [CrossRef]
- Lalmuanawma, S.; Hussain, J.; Chhakchhuak, L. Applications of machine learning and artificial intelligence for COVID-19 (SARS-CoV-2) pandemic: A review. Chaos Solitons Fractals 2020, 139, 110059. [Google Scholar] [CrossRef]
- Wynants, L.; Van Calster, B.; Collins, G.S.; Riley, R.D.; Heinze, G.; Schuit, E.; Bonten, M.M.J.; Dahly, D.L.; Damen, J.A.A.; Debray, T.P.A.; et al. Prediction models for diagnosis and prognosis of COVID-19: Systematic review and critical appraisal. BMJ 2020, 369, m1328. [Google Scholar] [CrossRef] [Green Version]
- Sear, R.F.; Velasquez, N.; Leahy, R.; Restrepo, N.J.; El Oud, S.; Gabriel, N.; Lupu, Y.; Johnson, N.F. Quantifying COVID-19 content in the online health opinion war using machine learning. IEEE Access 2020, 8, 91886–91893. [Google Scholar] [CrossRef]
- Apostolopoulos, I.D.; Mpesiana, T.A. COVID-19: Automatic detection from x-ray images utilizing transfer learning with convolutional neural networks. Phys. Eng. Sci. Med. 2020, 43, 635–640. [Google Scholar] [CrossRef] [Green Version]
- Apostolopoulos, I.D.; Aznaouridis, S.I.; Tzani, M.A. Extracting possibly representative COVID-19 biomarkers from X-ray images with deep learning approach and image data related to pulmonary diseases. J. Med. Biol. Eng. 2020, 40, 462–469. [Google Scholar] [CrossRef] [PubMed]
- Ardakani, A.A.; Kanafi, A.R.; Acharya, U.R.; Khadem, N.; Mohammadi, A. Application of deep learning technique to manage COVID-19 in routine clinical practice using CT images: Results of 10 convolutional neural networks. Comput. Biol. Med. 2020, 121, 103795. [Google Scholar] [CrossRef]
- El Asnaoui, K.; Chawki, Y. Using X-ray images and deep learning for automated detection of coronavirus disease. J. Biomol. Struct. Dyn. 2021, 39, 3615–3626. [Google Scholar] [CrossRef]
- Paul, H.Y.; Kim, T.K.; Lin, C.T. Generalizability of deep learning tuberculosis classifier to COVID-19 chest radiographs: New tricks for an old algorithm? J. Thorac. Imaging 2020, 35, W102–W104. [Google Scholar]
- Zargari Khuzani, A.; Heidari, M.; Shariati, S.A. COVID-Classifier: An automated machine learning model to assist in the diagnosis of COVID-19 infection in chest X-ray images. Sci. Rep. 2021, 11, 9887. [Google Scholar] [CrossRef]
- Oh, Y.; Park, S.; Ye, J.C. Deep learning COVID-19 features on CXR using limited training data sets. IEEE Trans. Med. Imaging 2020, 39, 2688–2700. [Google Scholar] [CrossRef]
- Heo, L.; Feig, M. Modeling of severe acute respiratory syndrome coronavirus 2 (SARS-CoV-2) proteins by machine learning and physics-based refinement. BioRxiv 2020. [Google Scholar] [CrossRef] [Green Version]
- Ke, Y.-Y.; Peng, T.-T.; Yeh, T.-K.; Huang, W.-Z.; Chang, S.-E.; Wu, S.-H.; Hung, H.-C.; Hsu, T.-A.; Lee, S.-J.; Song, J.-S.; et al. Artificial intelligence approach fighting COVID-19 with repurposing drugs. Biomed. J. 2020, 43, 355–362. [Google Scholar] [CrossRef] [PubMed]
- Ong, E.; Wong, M.U.; Huffman, A.; He, Y. COVID-19 coronavirus vaccine design using reverse vaccinology and machine learning. Front. Immunol. 2020, 11, 1581. [Google Scholar] [CrossRef] [PubMed]
- World Health Organization. Directrices de la OMS Sobre Vivienda y Salud: Resumen de Orientación. Organización Mundial de la Salud, 2018. Available online: https://apps.who.int/iris/handle/10665/279743 (accessed on 27 June 2023).
- Millán-Jiménez, A.; Herrera-Limones, R.; López-Escamilla, Á.; López-Rubio, E.; Torres-García, M. Confinement, Comfort and Health: Analysis of the Real Influence of Lockdown on University Students during the COVID-19 Pandemic. Int. J. Environ. Res. Public Health 2021, 18, 5572. [Google Scholar] [CrossRef] [PubMed]
- Cuerdo-Vilches, T.; Navas-Martín, M.Á.; Oteiza, I. A Mixed Approach on Resilience of Spanish Dwellings and Households during COVID-19 Lockdown. Sustainability 2020, 12, 10198. [Google Scholar] [CrossRef]
- MacKinnon, L.; Socías, M.E.; Bardwell, G. COVID-19 and overdose prevention: Challenges and opportunities for clinical practice in housing settings. J. Subst. Abus. Treat. 2020, 119, 108153. [Google Scholar] [CrossRef] [PubMed]
- Ahmad, K.; Erqou, S.; Shah, N.; Nazir, U.; Morrison, A.R.; Choudhary, G.; Wu, W.-C. Association of poor housing conditions with COVID-19 incidence and mortality across US counties. PLoS ONE 2020, 15, e0241327. [Google Scholar] [CrossRef]
- Ralli, M.; Cedola, C.; Urbano, S.; Morrone, A.; Ercoli, L. Homeless persons and migrants in precarious housing conditions and COVID-19 pandemic: Peculiarities and prevention strategies. Eur. Rev. Med. Pharmacol. Sci. 2020, 24, 9765–9767. [Google Scholar] [PubMed]
- Tinson, A.; Clair, A. Better housing is crucial for our health and the COVID-19 recovery. Health Found. 2020, 20, 1–25. [Google Scholar]
- Zimmermann, R.; Sarma, N.; Thieme-Thörel, D.; Alpers, K.; Artelt, T.; Azouagh, K.; Bremer, V.; Broistedt, P.; Eckmanns, T.; Feltgen, N.; et al. COVID-19 outbreaks in settings with precarious housing conditions in Germany: Challenges and lessons learned. Front. Public Health 2021, 9, 708694. [Google Scholar] [CrossRef]
- Hu, M.; Roberts, J.D.; Azevedo, G.P.; Milner, D. The role of built and social environmental factors in COVID-19 transmission: A look at America’s capital city. Sustain. Cities Soc. 2021, 65, 102580. [Google Scholar] [CrossRef]
- Ieng, S.M.; Cheong, I.H. An overview of epidemiology of COVID-19 in Macau SAR. Front. Public Health 2020, 8, 550057. [Google Scholar] [CrossRef]
- Raposo, V.L. Macau, a Luta contra a COVID-19 no Olho do Furação. Cad. Ibero-Am. De Direito Sanitário 2020, 9, 12–28. [Google Scholar] [CrossRef]
- Zuev, D.; Hannam, K. Anxious immobilities: An ethnography of coping with contagion (COVID-19) in Macau. Mobilities 2021, 16, 35–50. [Google Scholar] [CrossRef]
- Bai, W.; Zhao, Y.-J.; Cai, H.; Sha, S.; Zhang, Q.; Lei, S.-M.; Lok, G.K.I.; Chow, I.H.I.; Cheung, T.; Su, Z.; et al. Network analysis of depression, anxiety, insomnia and quality of life among Macau residents during the COVID-19 pandemic. J. Affect. Disord. 2022, 311, 181–188. [Google Scholar] [CrossRef] [PubMed]
- Zhao, Y.-J.; Bai, W.; Cai, H.; Sha, S.; Zhang, Q.; Lei, S.M.; Lok, K.-I.; Chow, I.H.I.; Cheung, T.; Su, Z.; et al. The backbone symptoms of depression: A network analysis after the initial wave of the COVID-19 pandemic in Macau. PeerJ 2022, 10, e13840. [Google Scholar] [CrossRef]
- Cheshmehzangi, A.; Zhu, Y.; Li, B. Application of environmental performance analysis for urban design with Computational Fluid Dynamics (CFD) and EcoTect tools: The case of Cao Fei Dian eco-city, China. Int. J. Sustain. Built Environ. 2017, 6, 102–112. [Google Scholar] [CrossRef]
- Yang, L.; He, B.J.; Ye, M. Application research of ECOTECT in residential estate planning. Energy Build. 2014, 72, 195–202. [Google Scholar] [CrossRef]
- Thiodore, J.; Srinaga, F. Open Space Scenario on Riverside Settlement to Access Comfortable Wind Environment. In IOP Conference Series: Earth and Environmental Science; NIOP Publishing: Bristol, UK, 2021; Volume 764, p. 012022. [Google Scholar]
- Chen, Y.; Zheng, L.; Song, J.; Huang, L.; Zheng, J. Revealing the Impact of Urban Form on COVID-19 Based on Machine Learning: Taking Macau as an Example. Sustainability 2022, 14, 14341. [Google Scholar] [CrossRef]
- Etzel, R.A. How environmental exposures influence the development and exacerbation of asthma. Pediatrics 2003, 112 (Suppl. S1), 233–239. [Google Scholar] [CrossRef]
Figure 1.
Macau’s location. The three small pictures are, respectively, the geographic location of Macau in China, the location of Macau in the Pearl River Delta, and the Macau Special Administrative Region.
Figure 1.
Macau’s location. The three small pictures are, respectively, the geographic location of Macau in China, the location of Macau in the Pearl River Delta, and the Macau Special Administrative Region.

Figure 2.
Analysis of prevailing winds and annual wind speed in Macau.
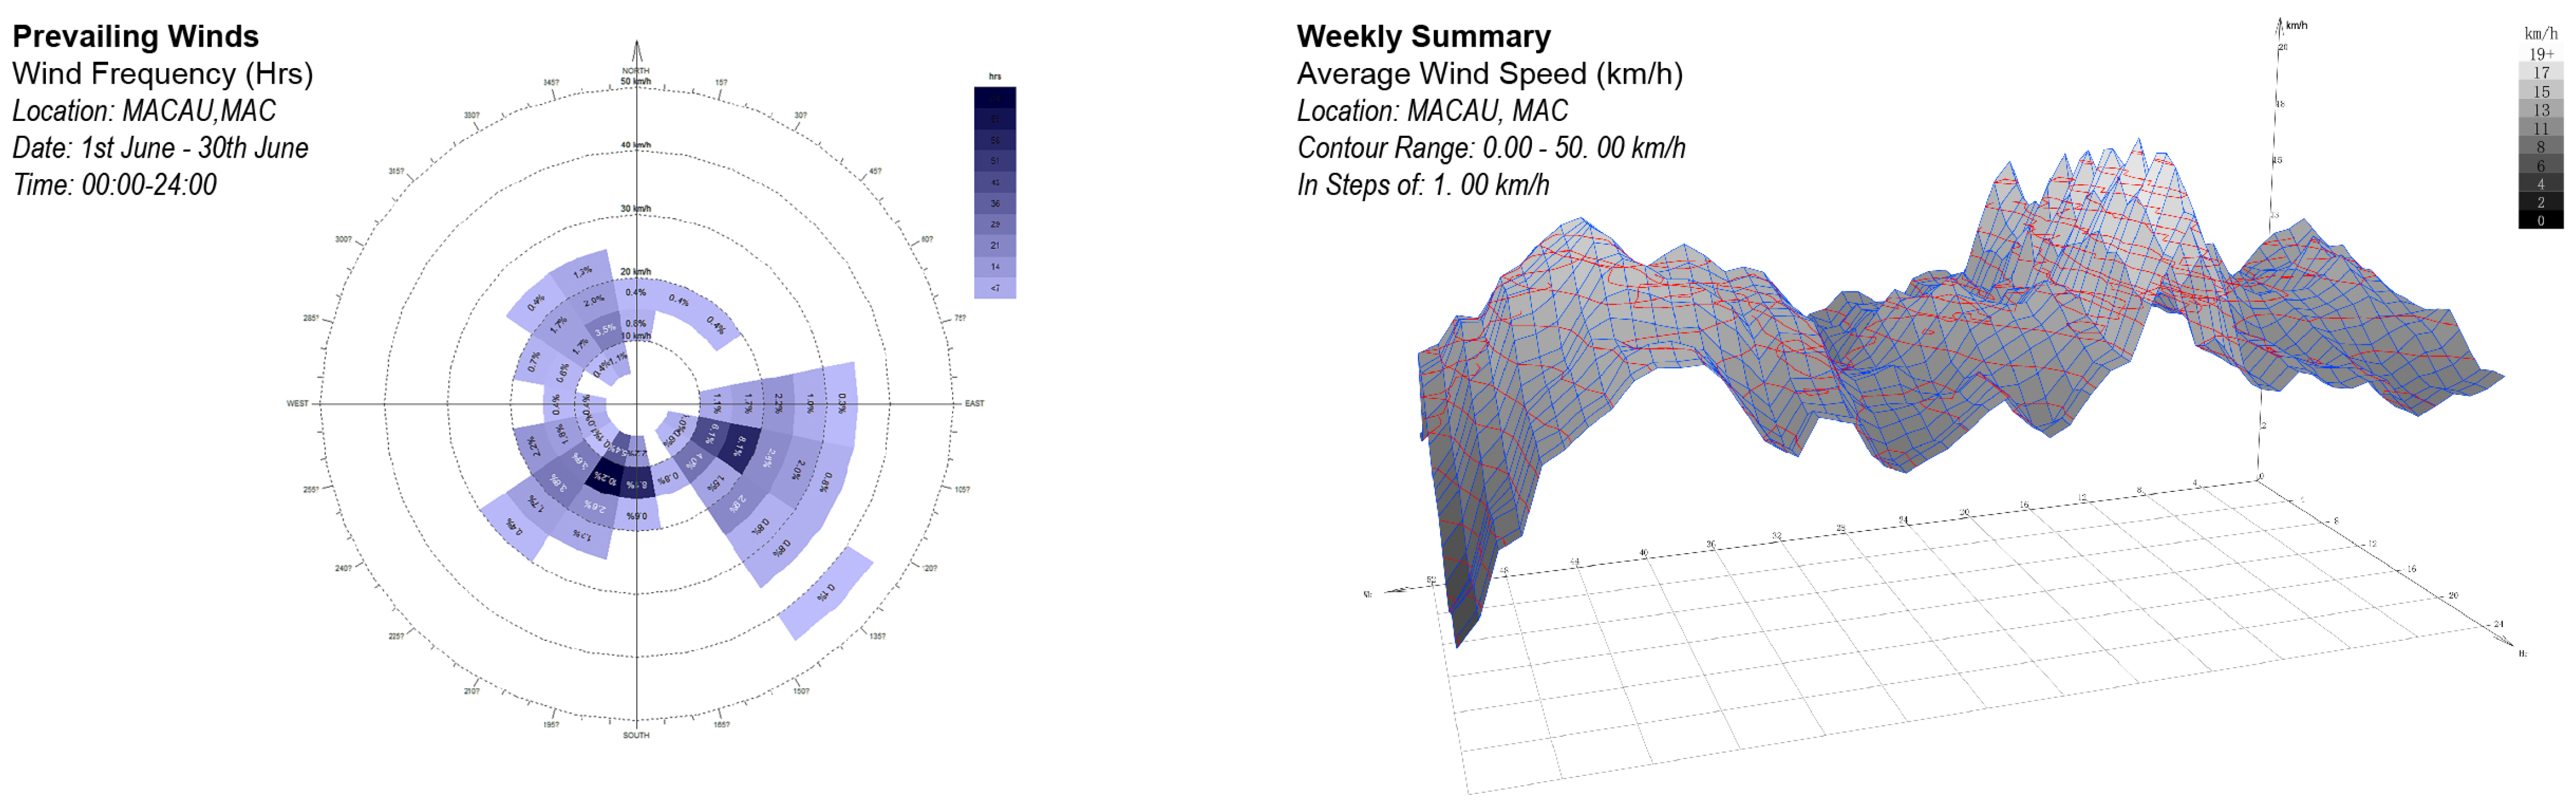
Figure 3.
Macau wind environment simulation map and COVID-19 heat map. (a) Urban wind environment data simulation; (b) COVID-19 data collection and aggregation.
Figure 3.
Macau wind environment simulation map and COVID-19 heat map. (a) Urban wind environment data simulation; (b) COVID-19 data collection and aggregation.
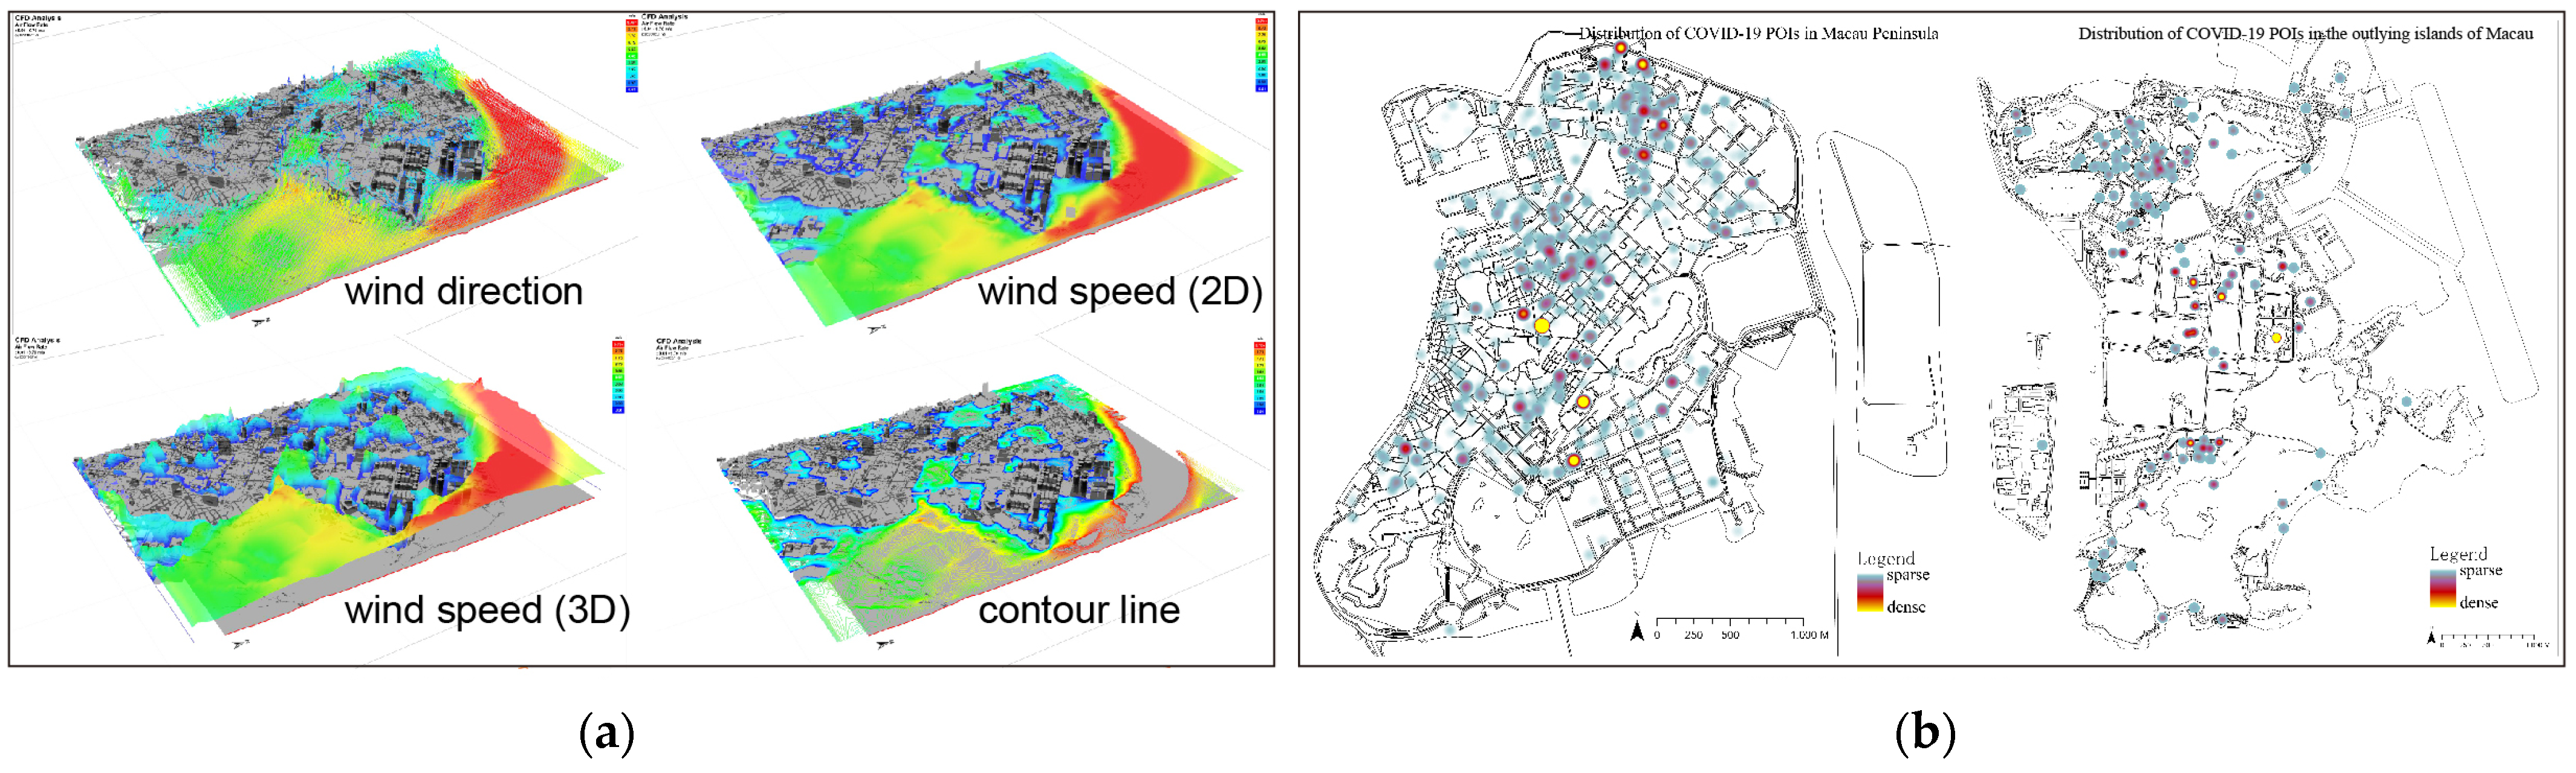
Figure 4.
Wind environment simulation map of Macau Special Administrative Region (including Macau Peninsula, Taipa, and Coloane) and its distribution map of COVID-19 hotspots. Among them, Taipa and Coloane belong to the outlying islands of the Macau Special Administrative Region.
Figure 4.
Wind environment simulation map of Macau Special Administrative Region (including Macau Peninsula, Taipa, and Coloane) and its distribution map of COVID-19 hotspots. Among them, Taipa and Coloane belong to the outlying islands of the Macau Special Administrative Region.
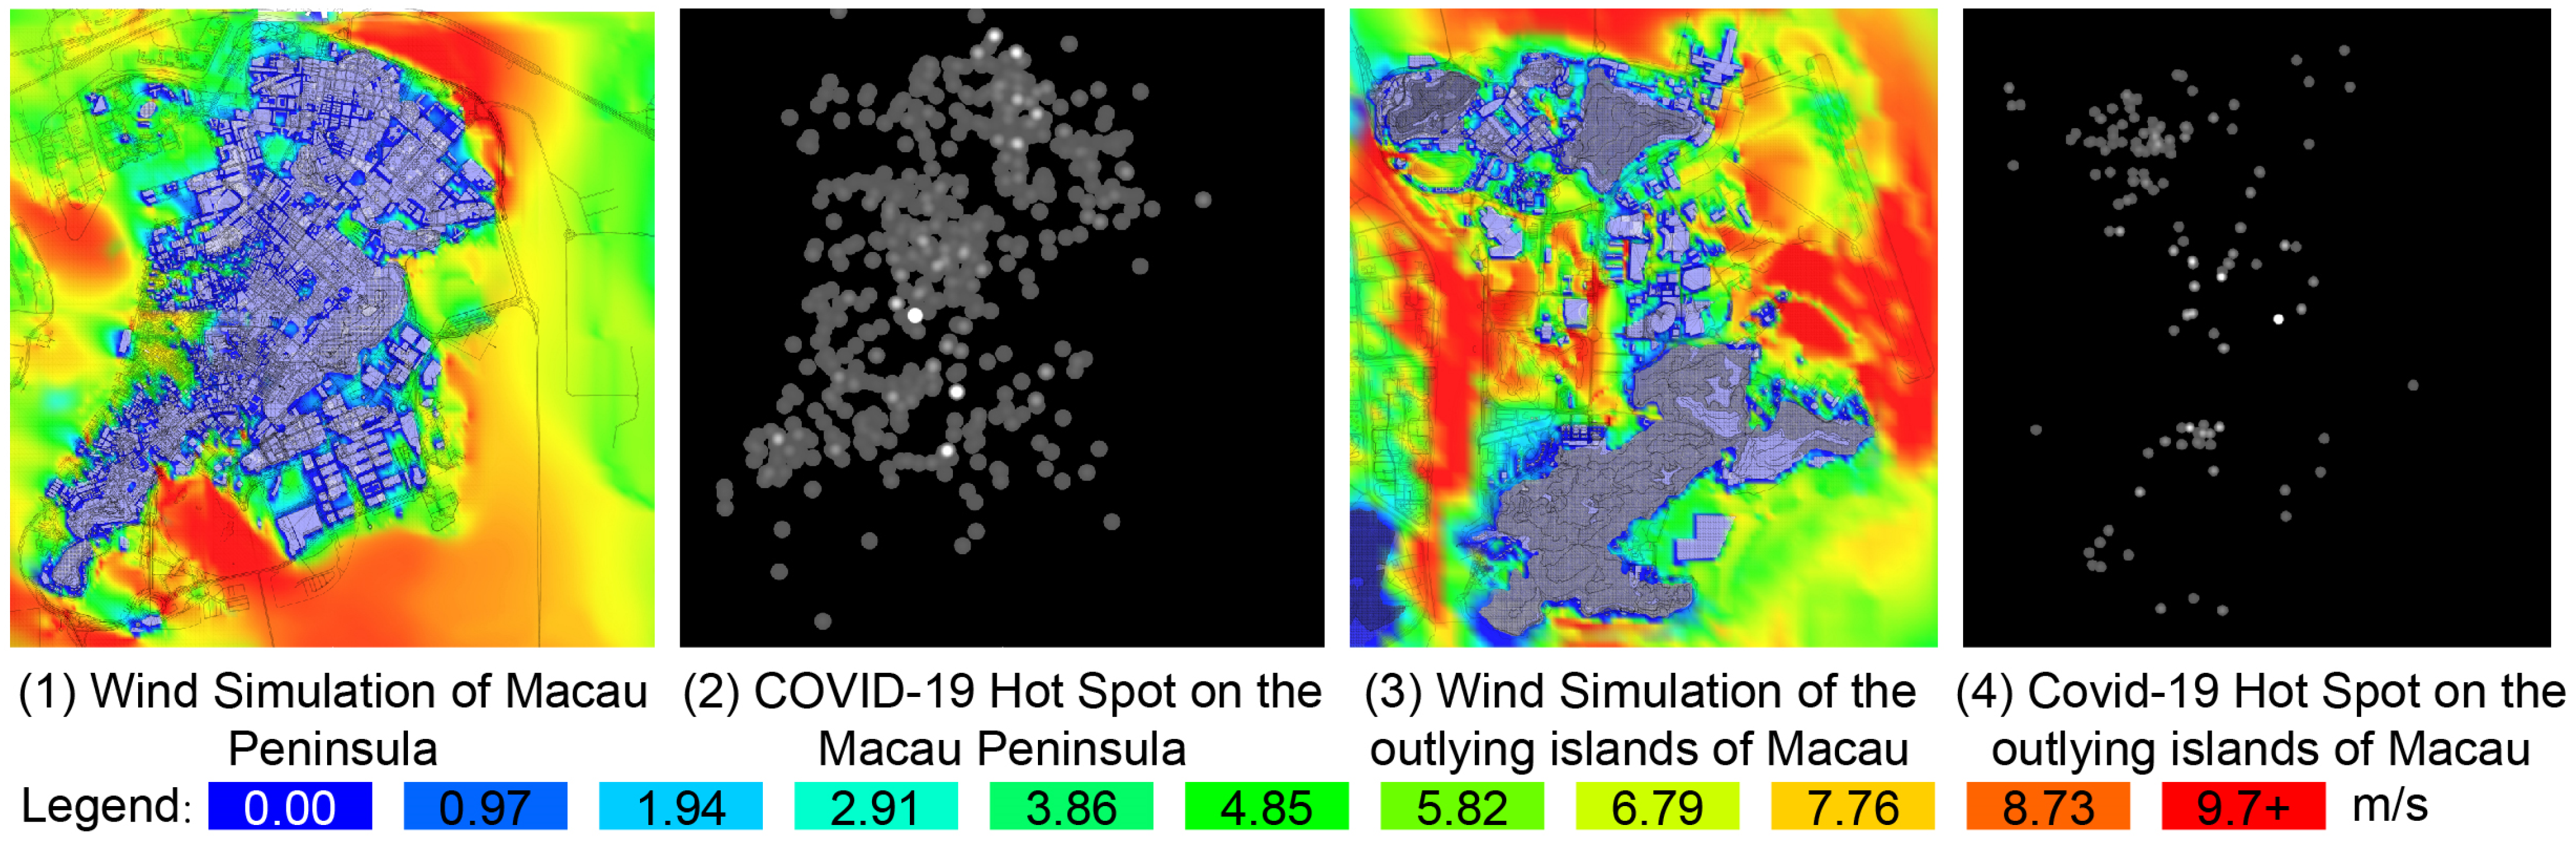
Figure 5.
A slice of the Macau Peninsula wind environment simulation map and COVID-19 hotspot distribution map. (1) Partial slice of wind simulation on the Macau Peninsula; (2) Partial slice of COVID-19 hot spot on the Macau Peninsula.
Figure 5.
A slice of the Macau Peninsula wind environment simulation map and COVID-19 hotspot distribution map. (1) Partial slice of wind simulation on the Macau Peninsula; (2) Partial slice of COVID-19 hot spot on the Macau Peninsula.
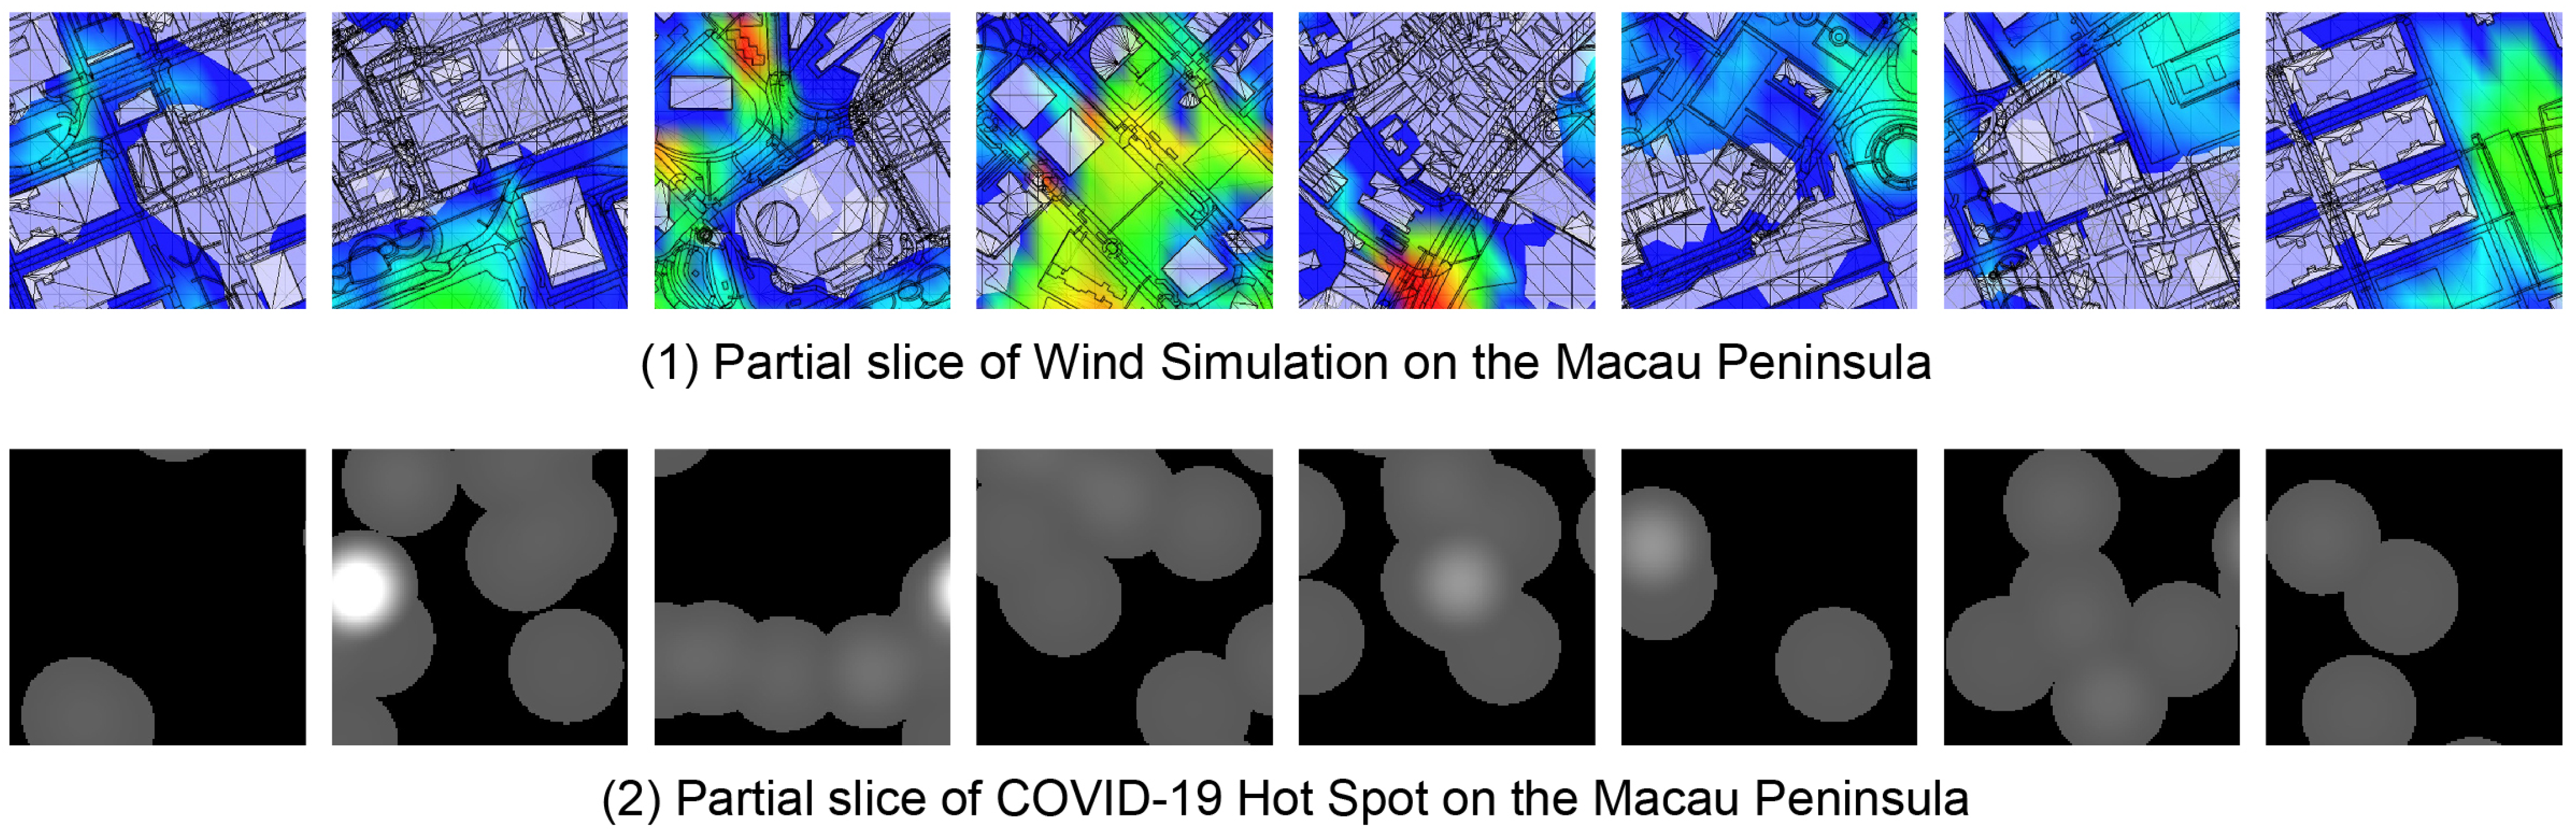
Figure 6.
CGAN principle flow chart.
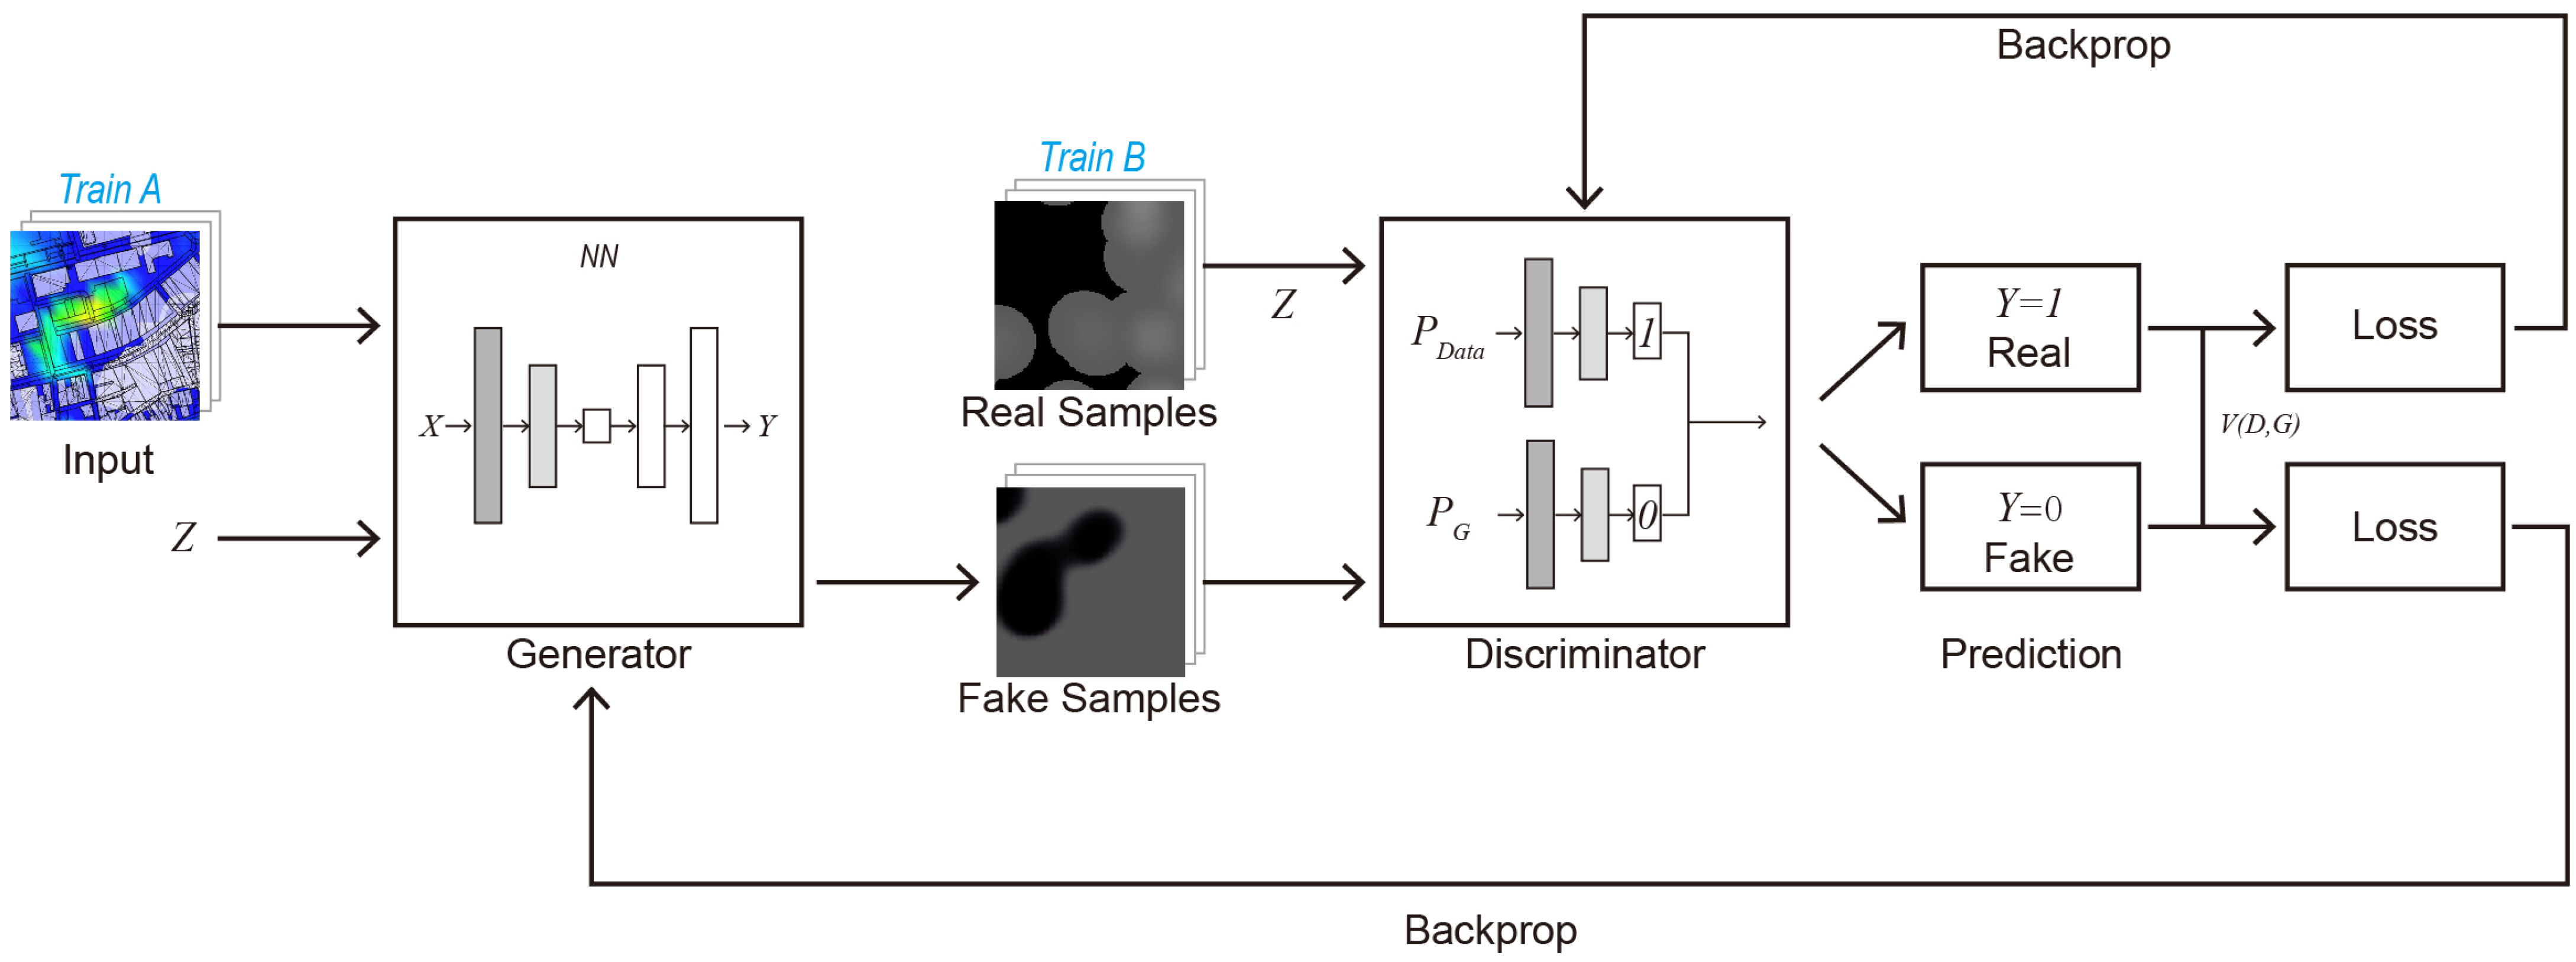
Figure 7.
Line chart of model training log.

Figure 8.
Comparison of the images generated during the training process of Model 1 with the original images. “Epoch” indicates the number of training iterations. This model has been trained for 200 epochs in total, so the test images of the 50th, 100th, 150th, and 200th epochs during the model training process are selected for analysis. “Input” represents the input wind environment simulation. The slice material of the result “Real” represents the actual COVID-19 hotspot image corresponding to the slice. “Generated” represents the image generated by the model through the material of “input”.
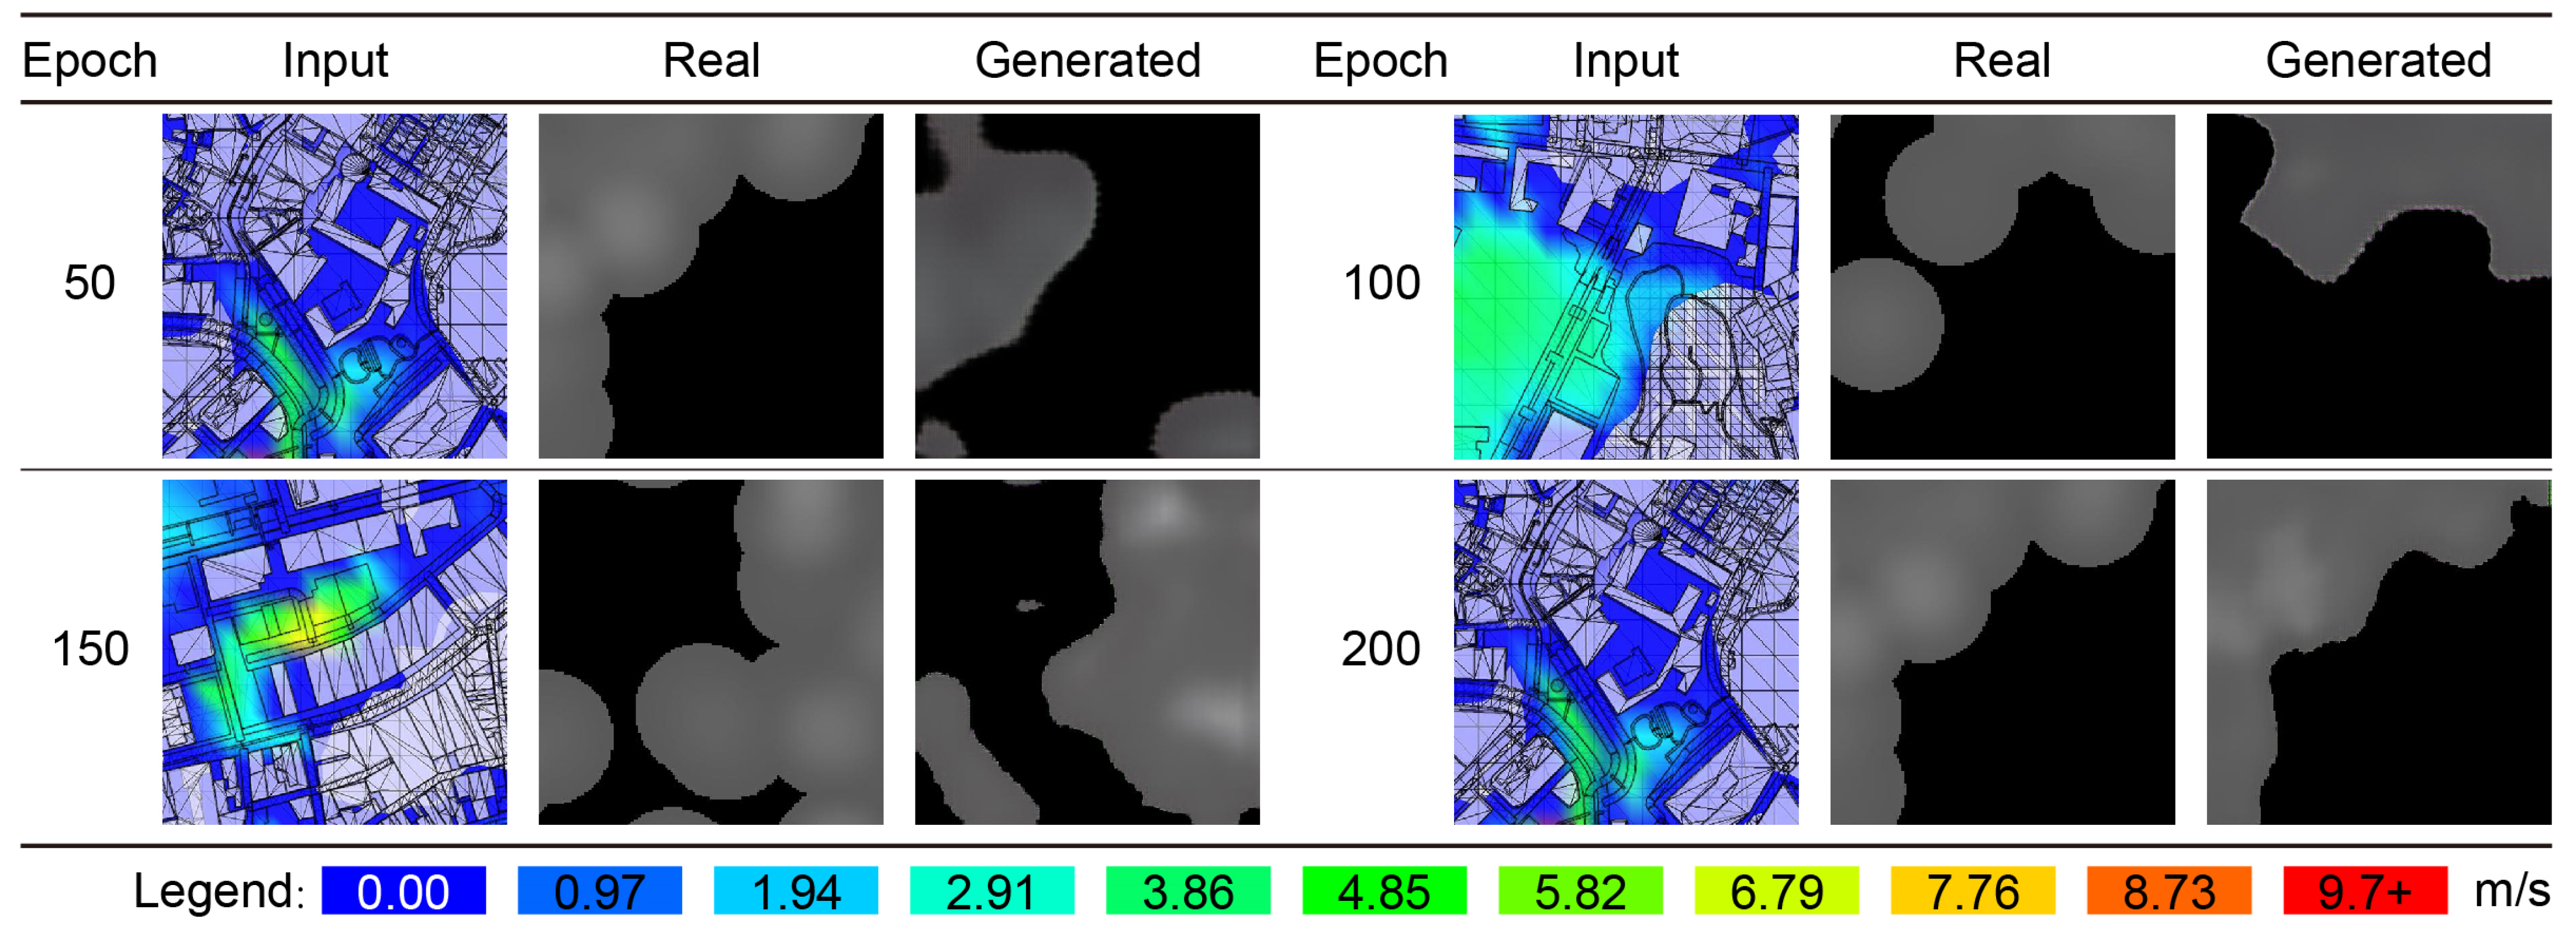
Figure 9.
Comparison of the images generated during the training process of Model 2 with the original images. “Epoch” indicates the number of training iterations. This model has been trained for 200 epochs in total, so the test images of the 50th, 100th, 150th, and 200th epochs during the model training process are selected for analysis. “Input” represents the input wind environment simulation. The slice material of the result “Real” represents the actual COVID-19 hotspot image corresponding to the slice. “Generated” represents the image generated by the model through the material of “input”.
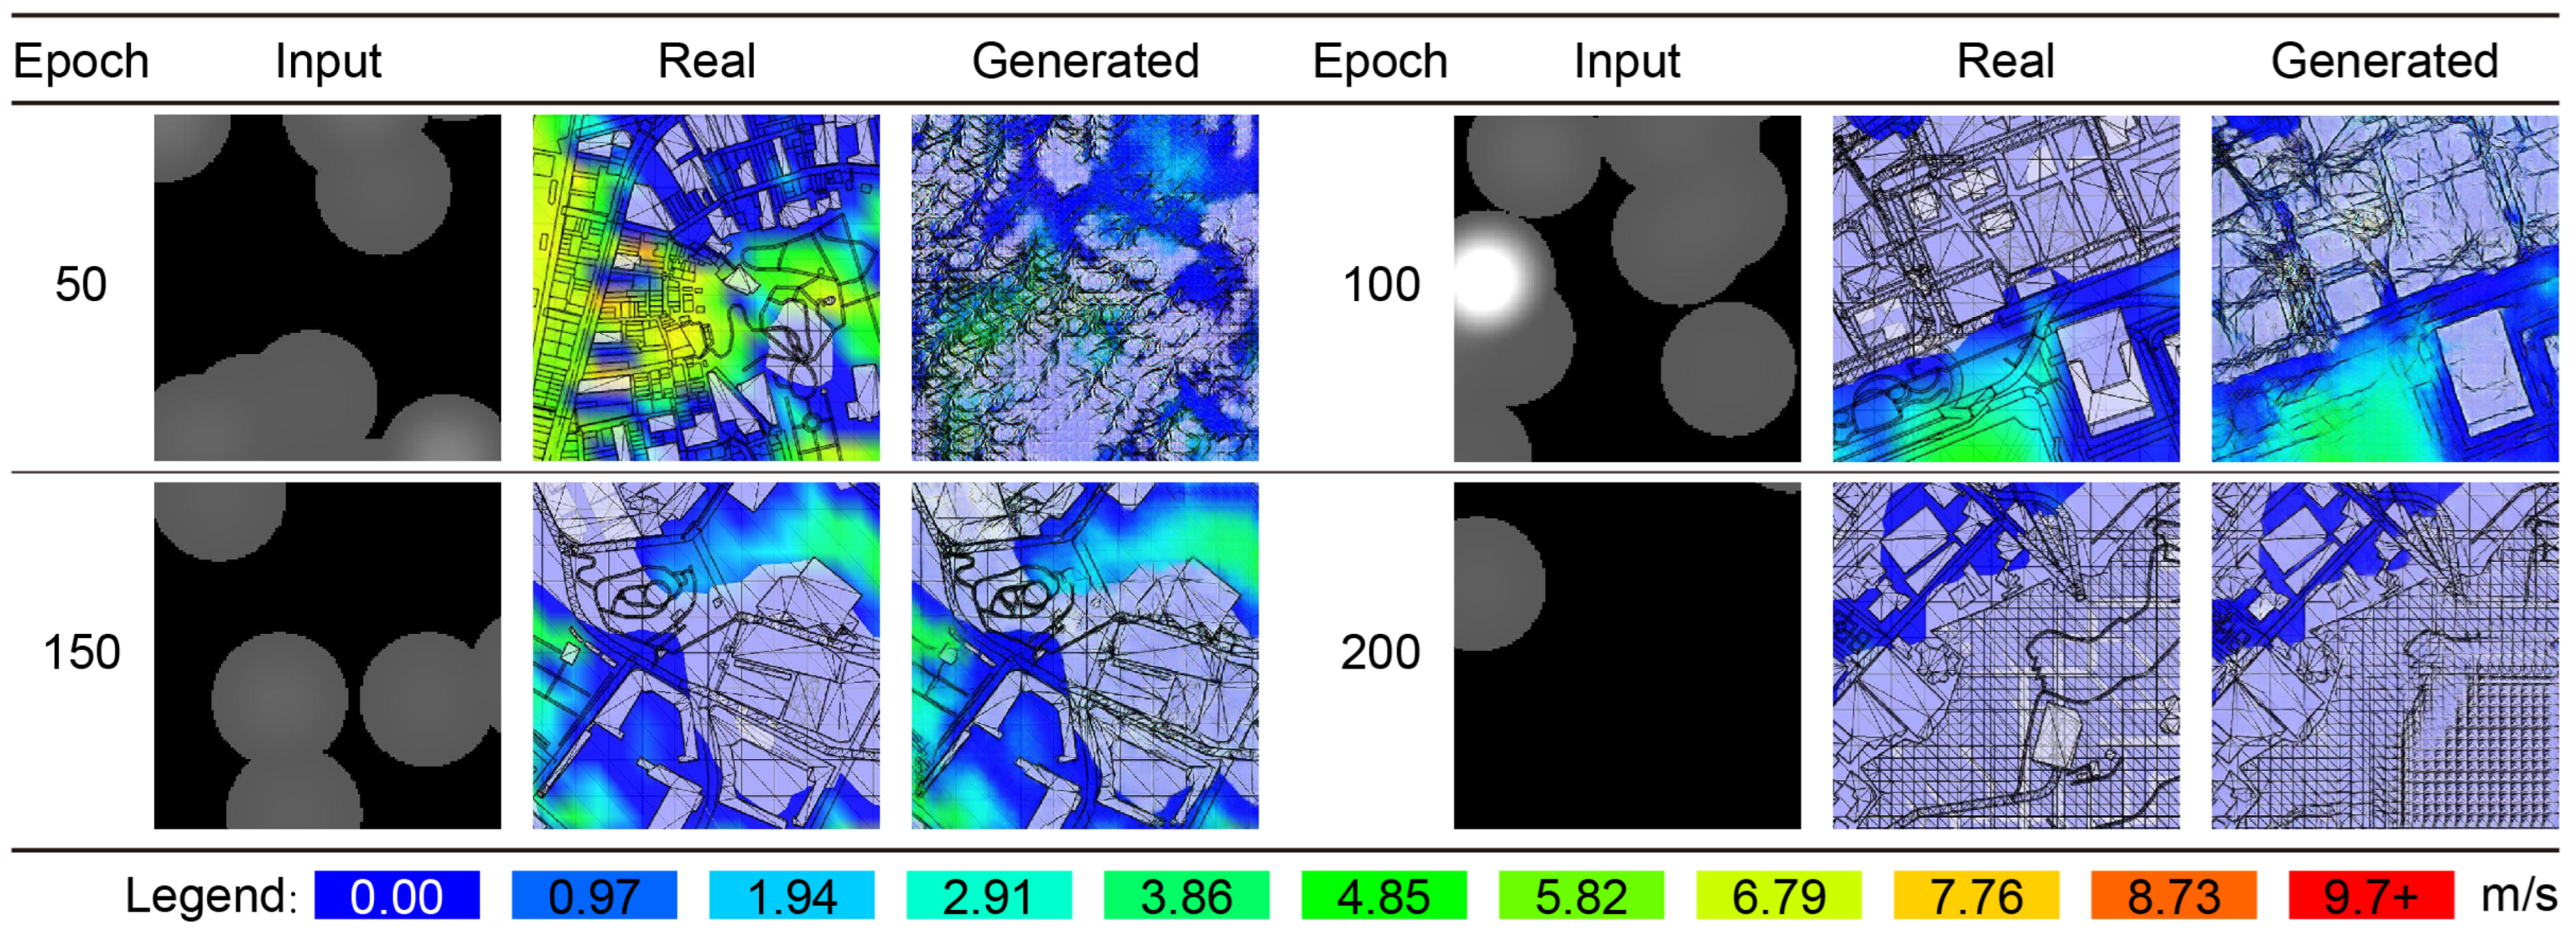
Figure 10.
Different wind environments compared to COVID-19 hotspots. “Input” represents the input wind environment simulation. “Generated” represents the image generated by the model through the material of “input”. (A–D) represent the group number.
Figure 10.
Different wind environments compared to COVID-19 hotspots. “Input” represents the input wind environment simulation. “Generated” represents the image generated by the model through the material of “input”. (A–D) represent the group number.

Figure 11.
Different COVID-19 hotspots compared to wind environments. “Input” represents the input wind environment simulation. “Generated” represents the image generated by the model through the material of “input”. (A–D) represent the group number.
Figure 11.
Different COVID-19 hotspots compared to wind environments. “Input” represents the input wind environment simulation. “Generated” represents the image generated by the model through the material of “input”. (A–D) represent the group number.

Figure 12.
Results of model testing using wind simulation data from Macau’s outlying islands. “Input” represents the input wind environment simulation. “Generated” represents the image generated by the model through the material of “input”. The slice material of the result “Real” represents the actual COVID-19 hotspot image corresponding to the slice. “Difference” represents an overlay of “Generated” and “Input” materials. Parts that are the same are black, and parts that are different are white to better analyze the accuracy difference between the results generated by the model and the actual results. “1–4” represents the group number of the simulation experiment control.
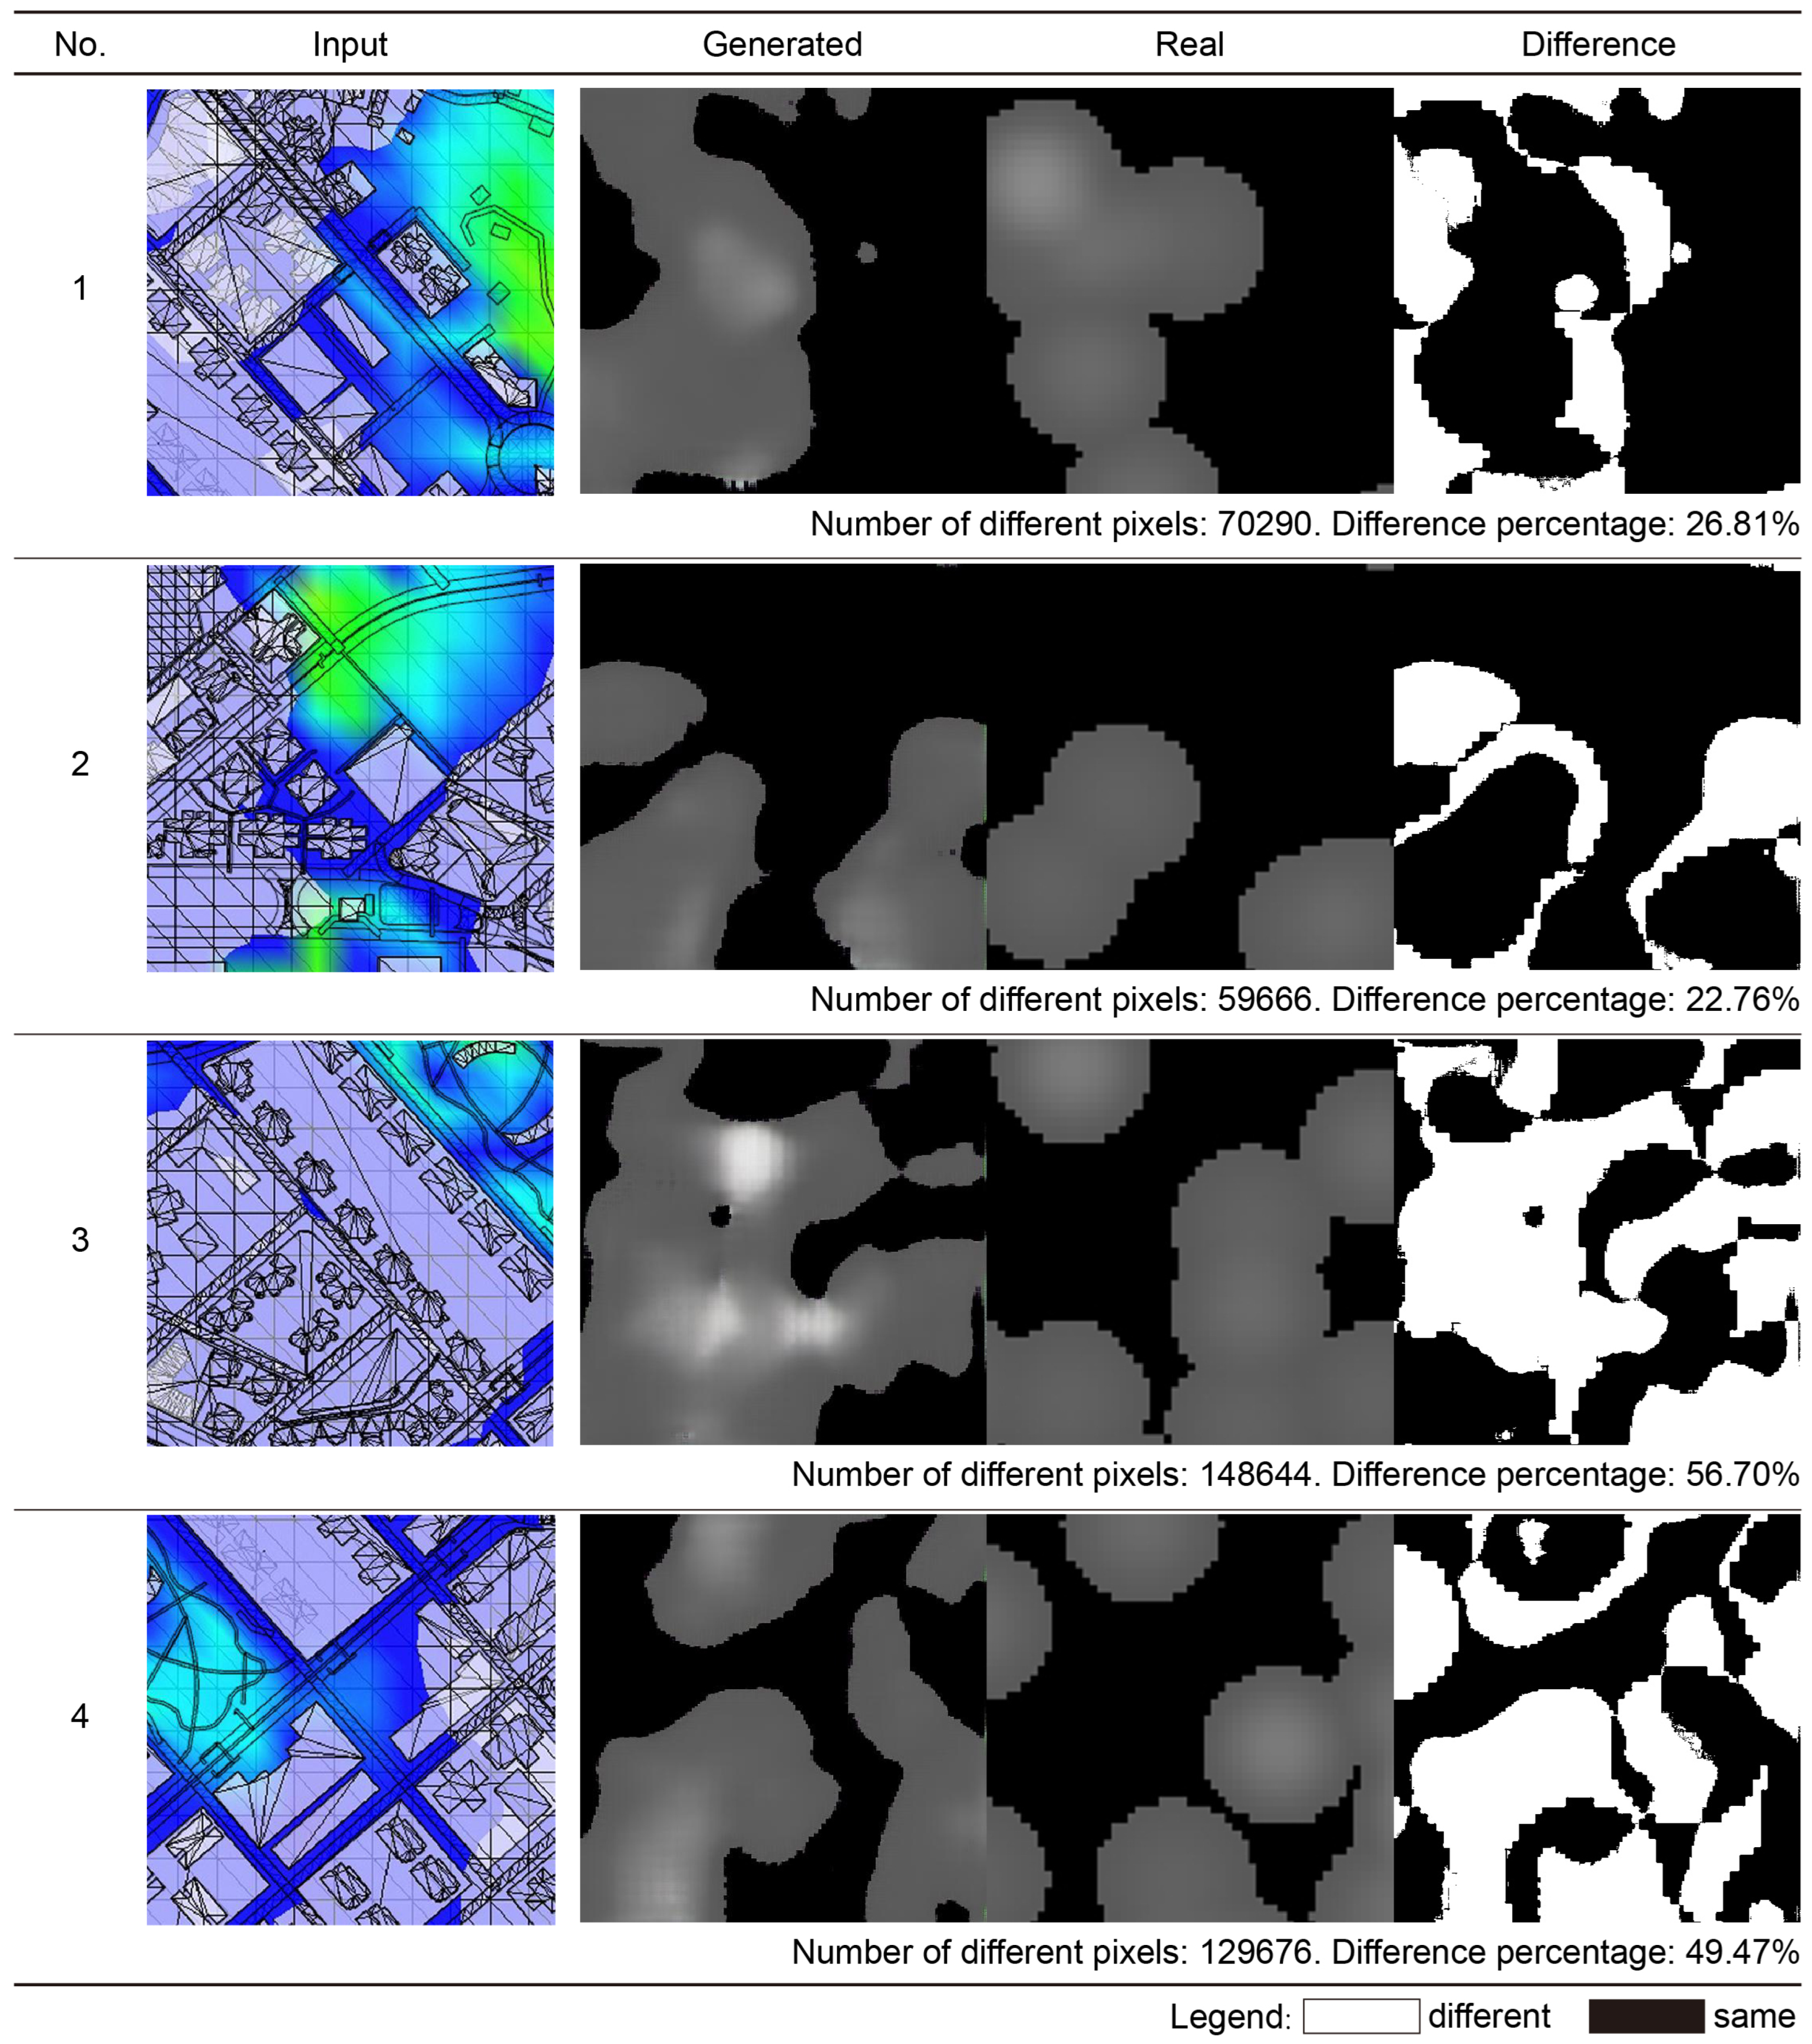
Figure 13.
Results of model testing using COVID-19 data from Macau’s outlying islands. “Input” represents the input wind environment simulation. “Generated” represents the image generated by the model through the material of “input”. The slice material of the result “Real” represents the actual COVID-19 hotspot image corresponding to the slice. “Difference” represents an overlay of “Generated” and “Input” materials. Parts that are the same are black, and parts that are different are white so as to better analyze the accuracy difference between the results generated by the model and the actual results. “1–4” represents the group number of the simulation experiment control.
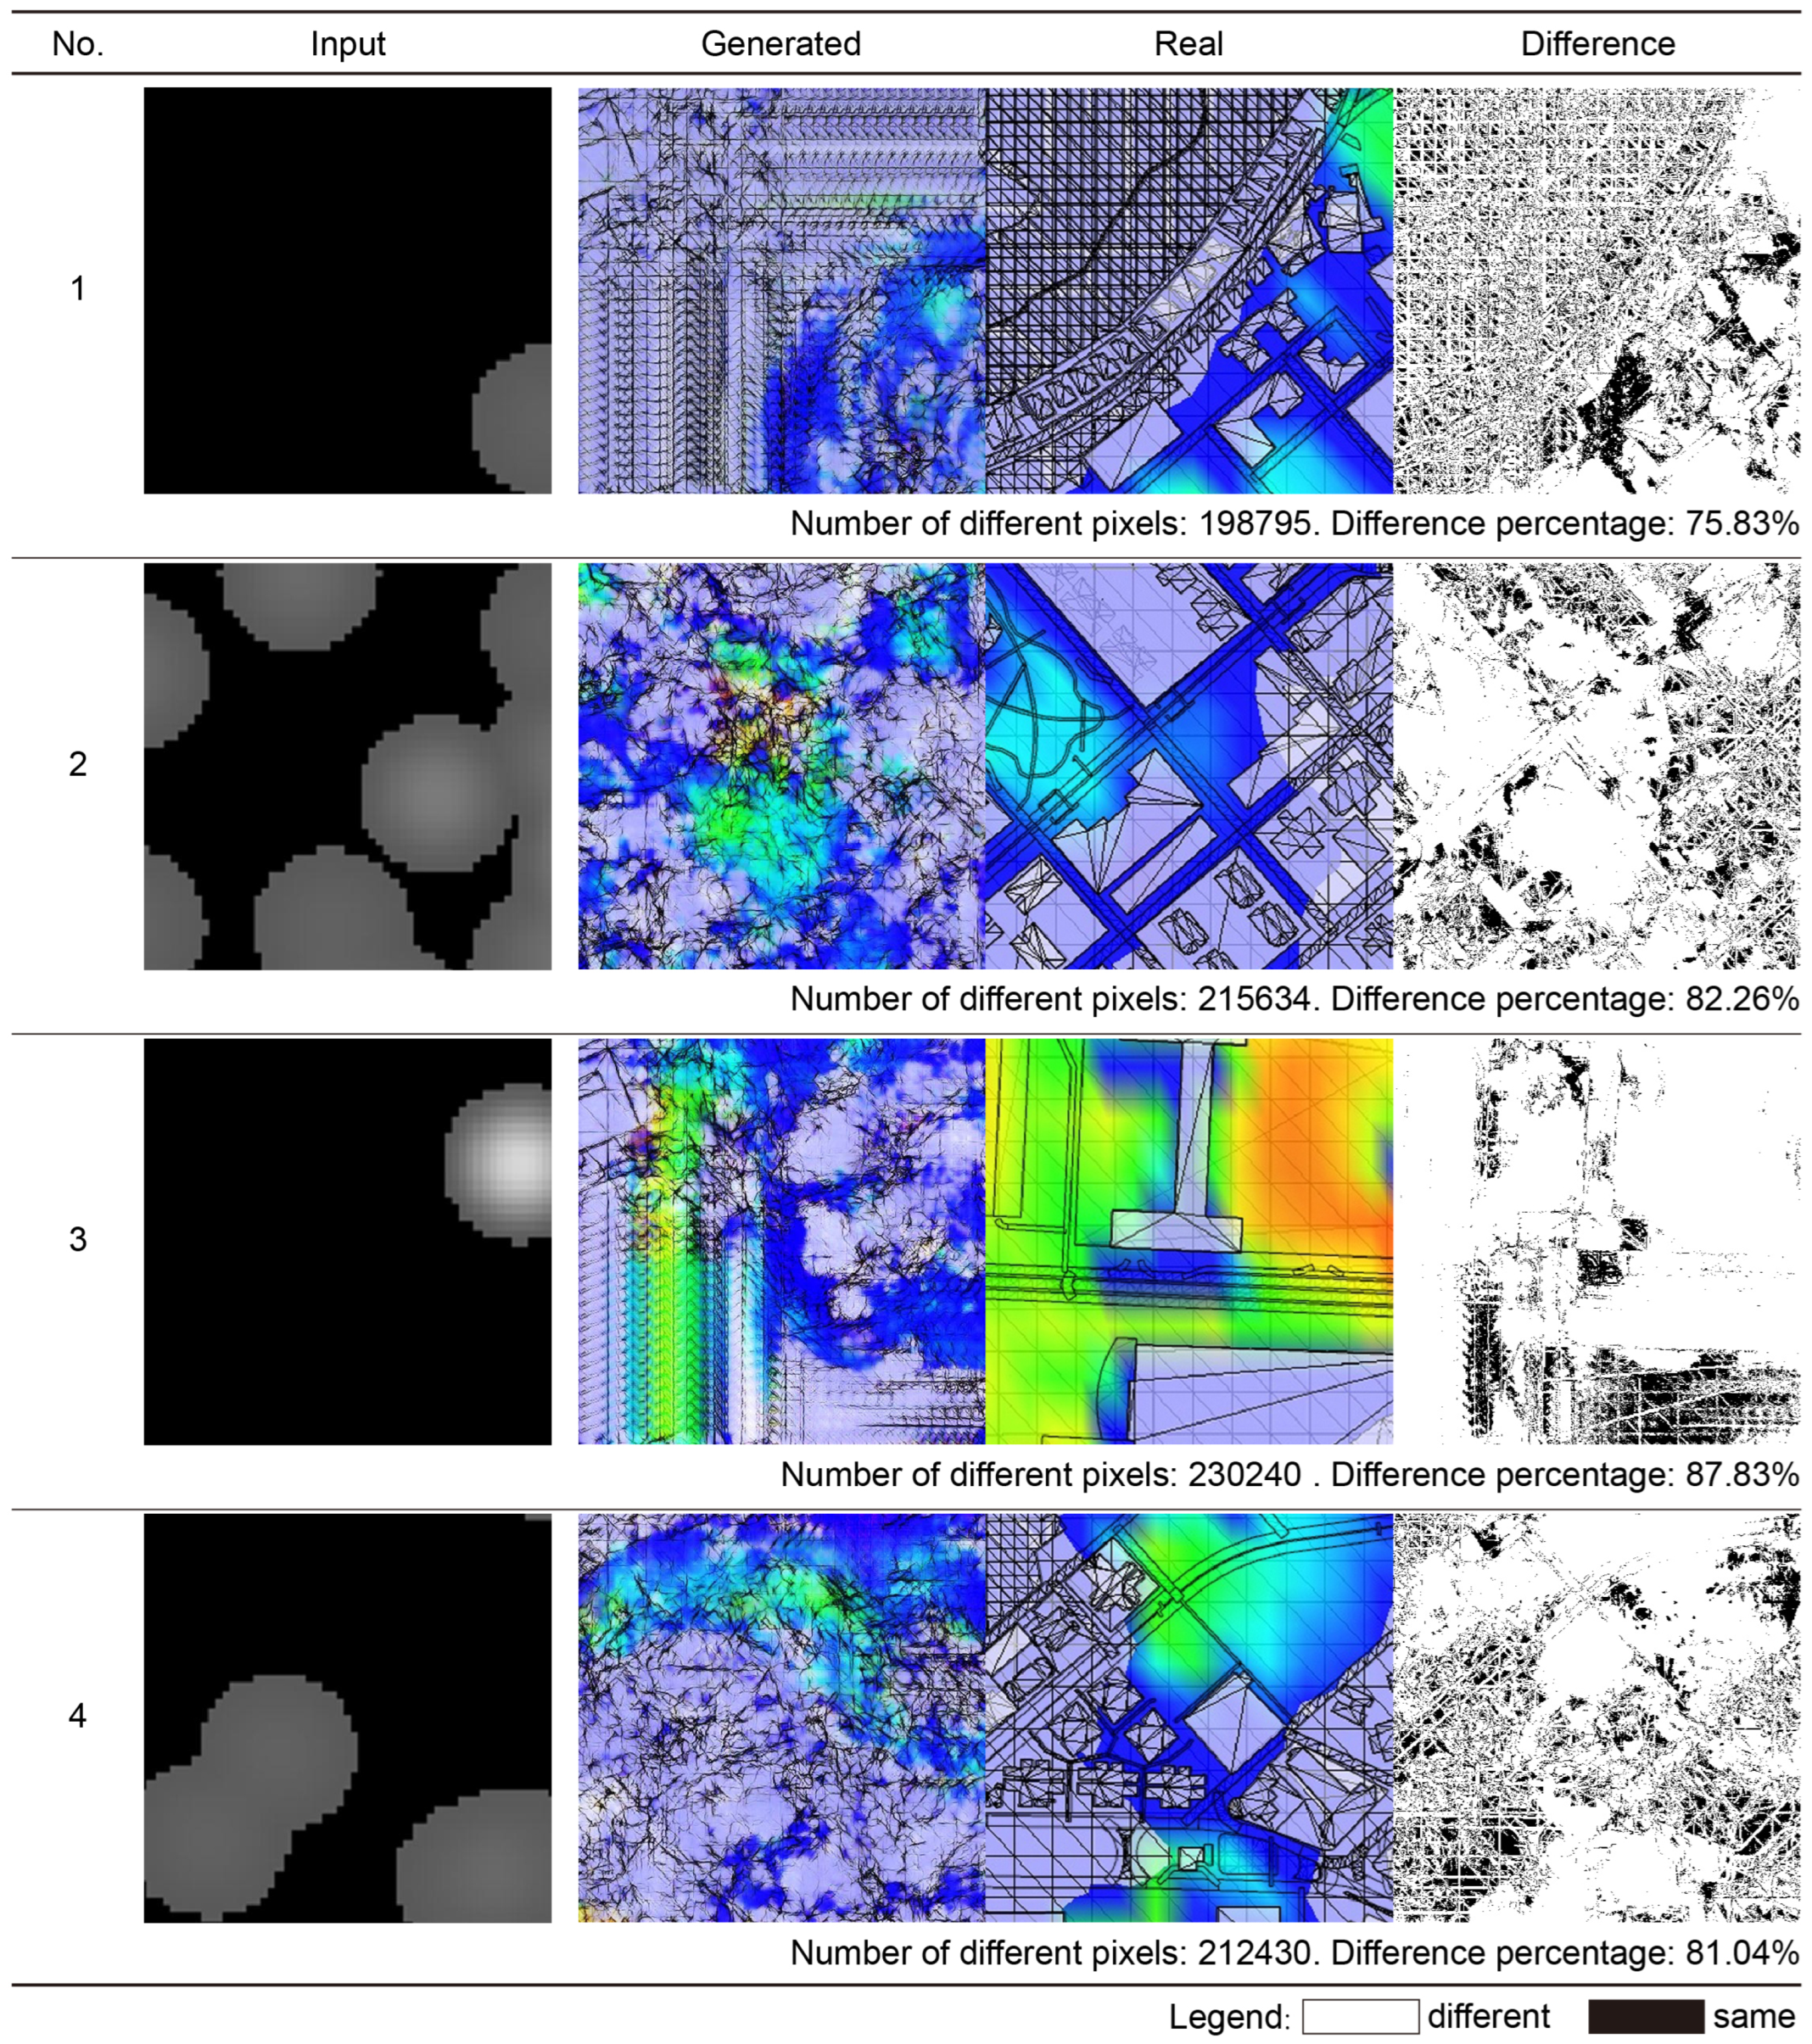
Figure 14.
Wind speed distribution map of the affected area and the unaffected area. (a) Wind speed map of the area affected by the epidemic; (b) wind speed map for areas not affected by the epidemic.
Figure 14.
Wind speed distribution map of the affected area and the unaffected area. (a) Wind speed map of the area affected by the epidemic; (b) wind speed map for areas not affected by the epidemic.

Figure 15.
A statistical map of wind speeds in areas affected by the epidemic and those unaffected.

Figure 16.
High-density residential buildings without mountains. (a) Wind environment map; (b) epidemic distribution map; (c) “C” layout of typical residential buildings; (d) building space model.
Figure 16.
High-density residential buildings without mountains. (a) Wind environment map; (b) epidemic distribution map; (c) “C” layout of typical residential buildings; (d) building space model.
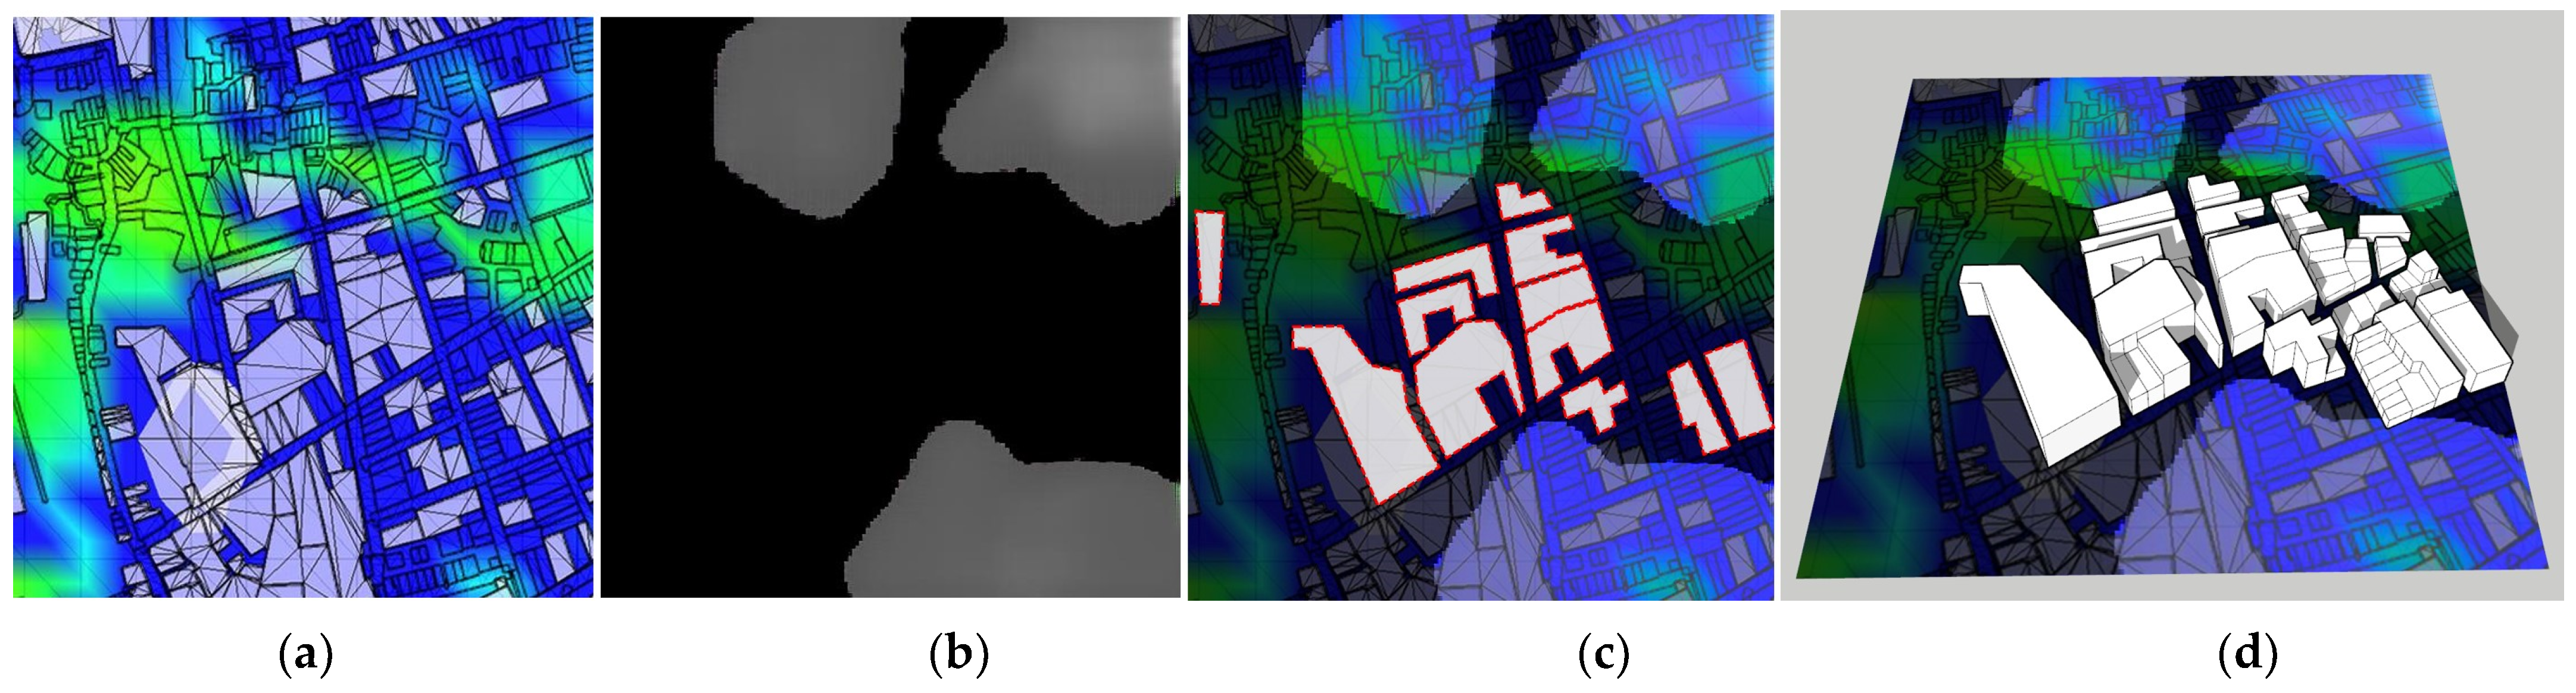
Figure 17.
High-density residential buildings without mountains. (a,e) Wind environment map; (b,f) epidemic distribution map; (c) “long strip” layout of typical residential buildings; (g) “rectangular” layout of typical residential buildings; (d,h) building space model.
Figure 17.
High-density residential buildings without mountains. (a,e) Wind environment map; (b,f) epidemic distribution map; (c) “long strip” layout of typical residential buildings; (g) “rectangular” layout of typical residential buildings; (d,h) building space model.
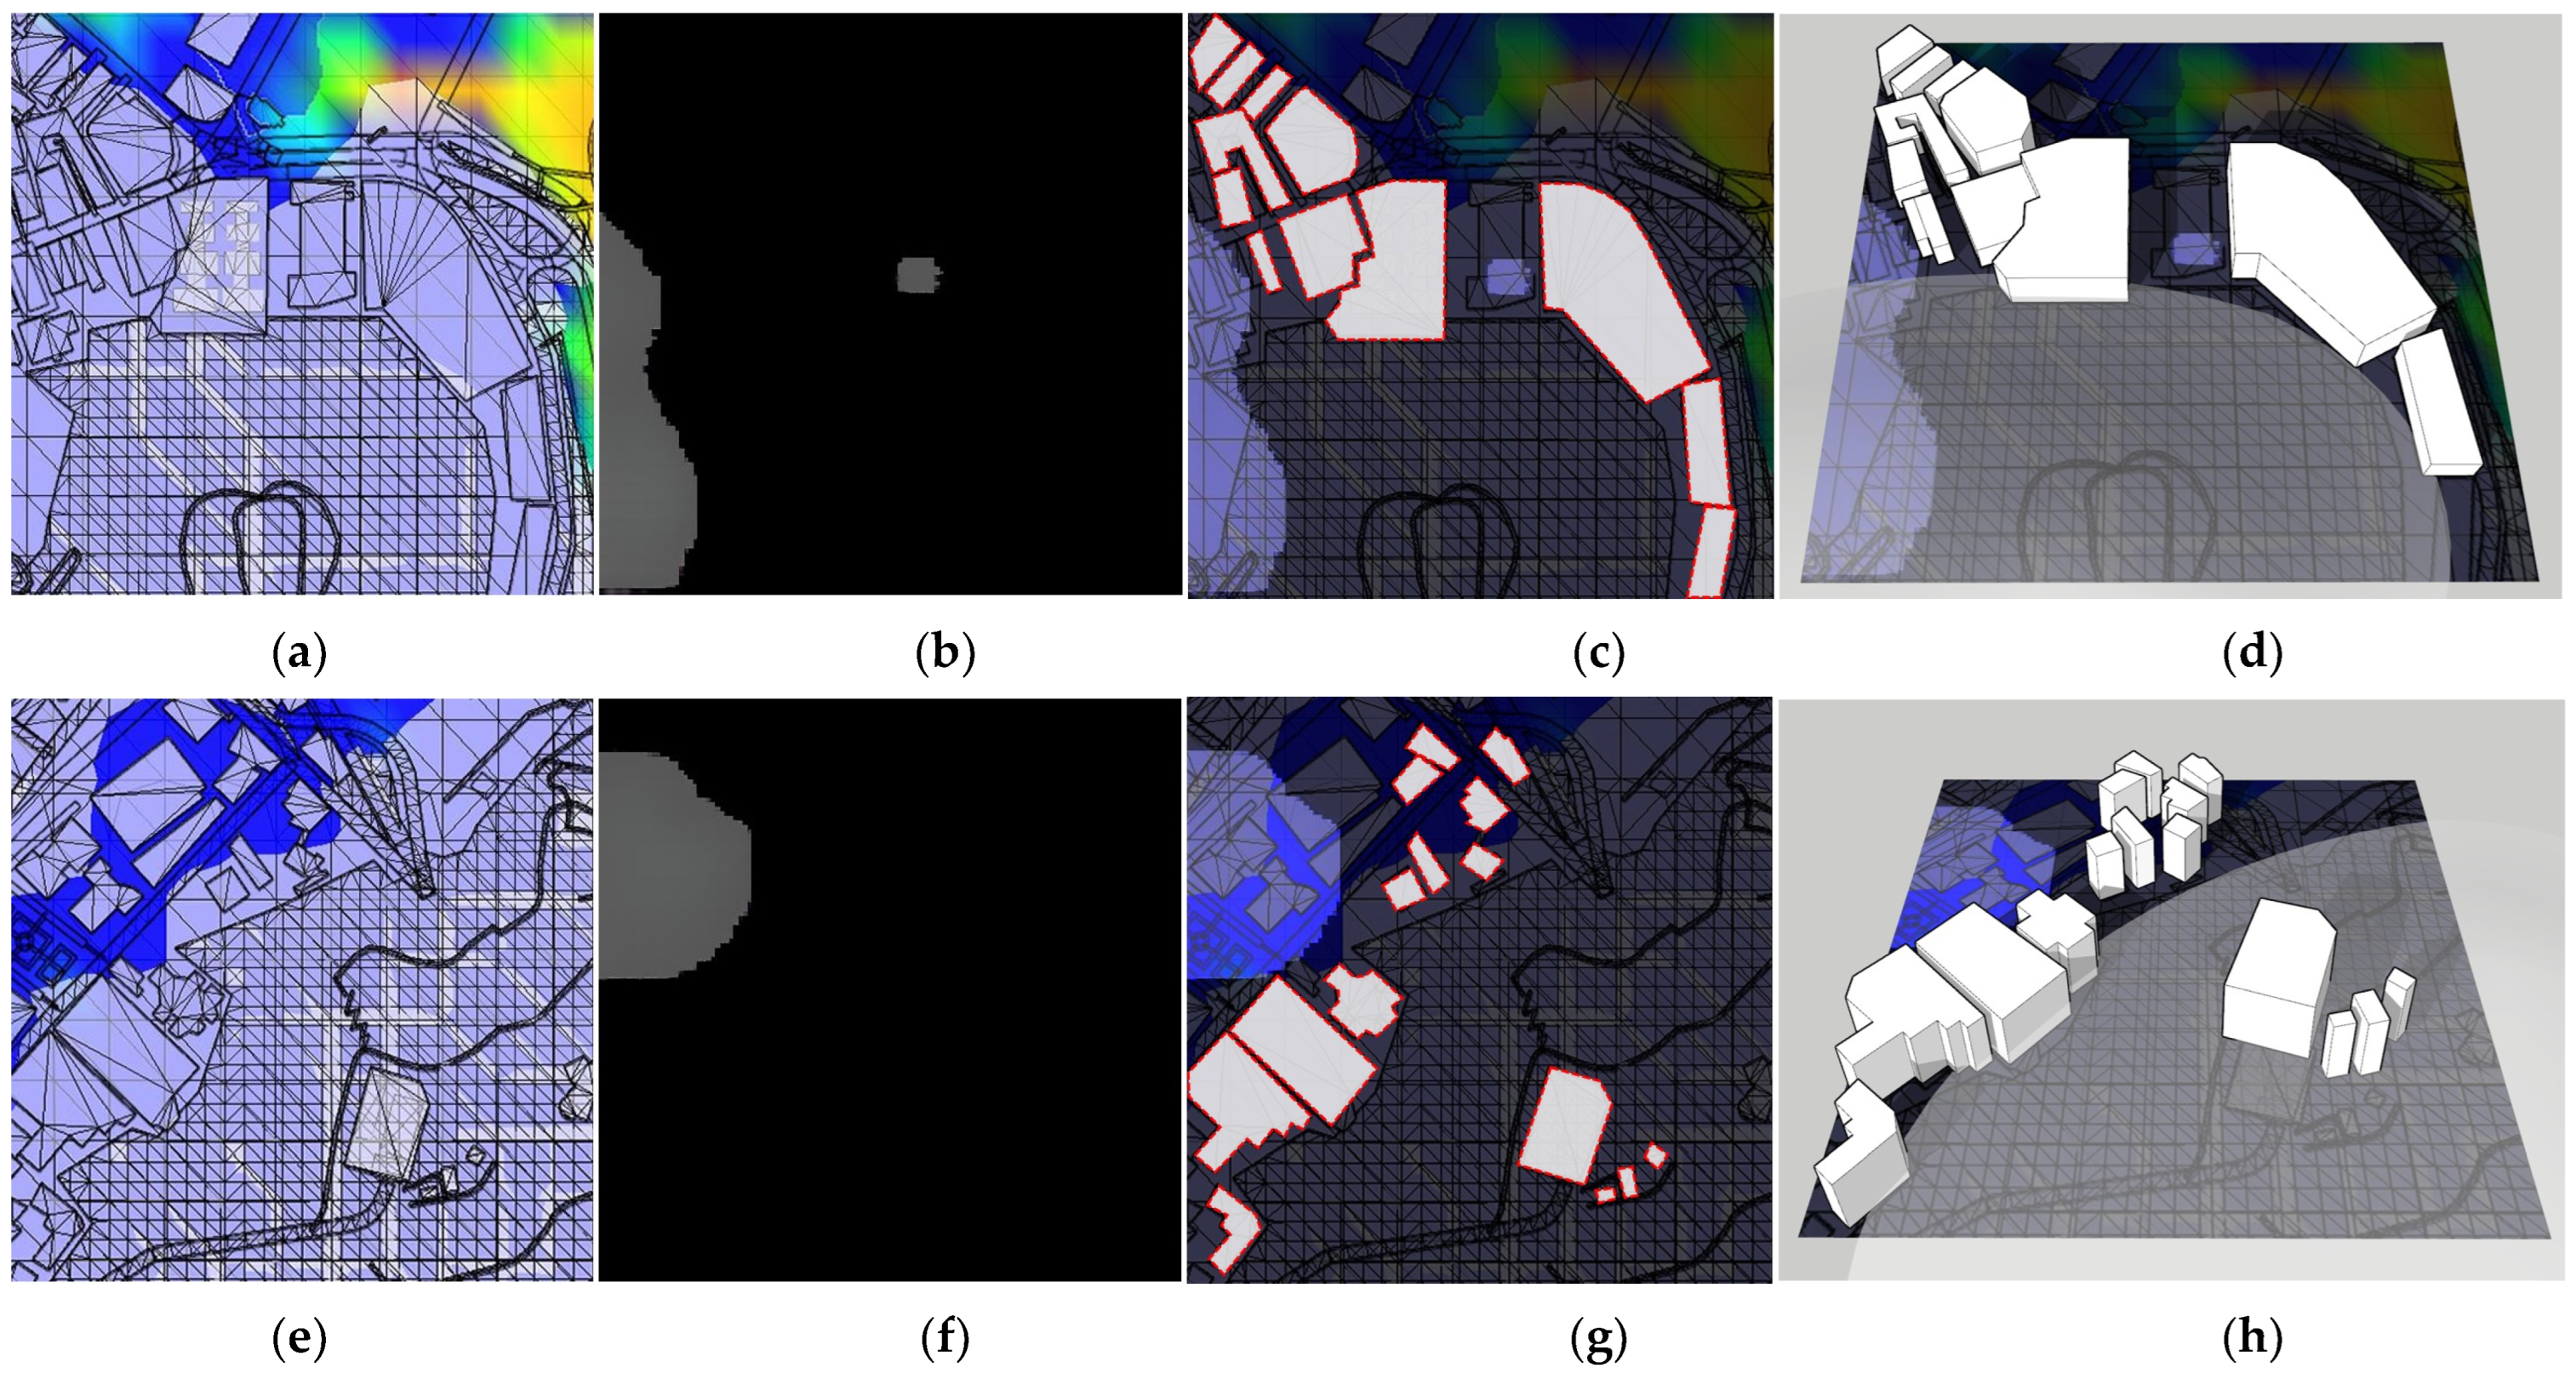
Figure 18.
Low-density residential buildings without mountains. (a) Wind environment map; (b) epidemic distribution map; (c) “L” or “+” layout of typical residential buildings; (d) building space model.
Figure 18.
Low-density residential buildings without mountains. (a) Wind environment map; (b) epidemic distribution map; (c) “L” or “+” layout of typical residential buildings; (d) building space model.
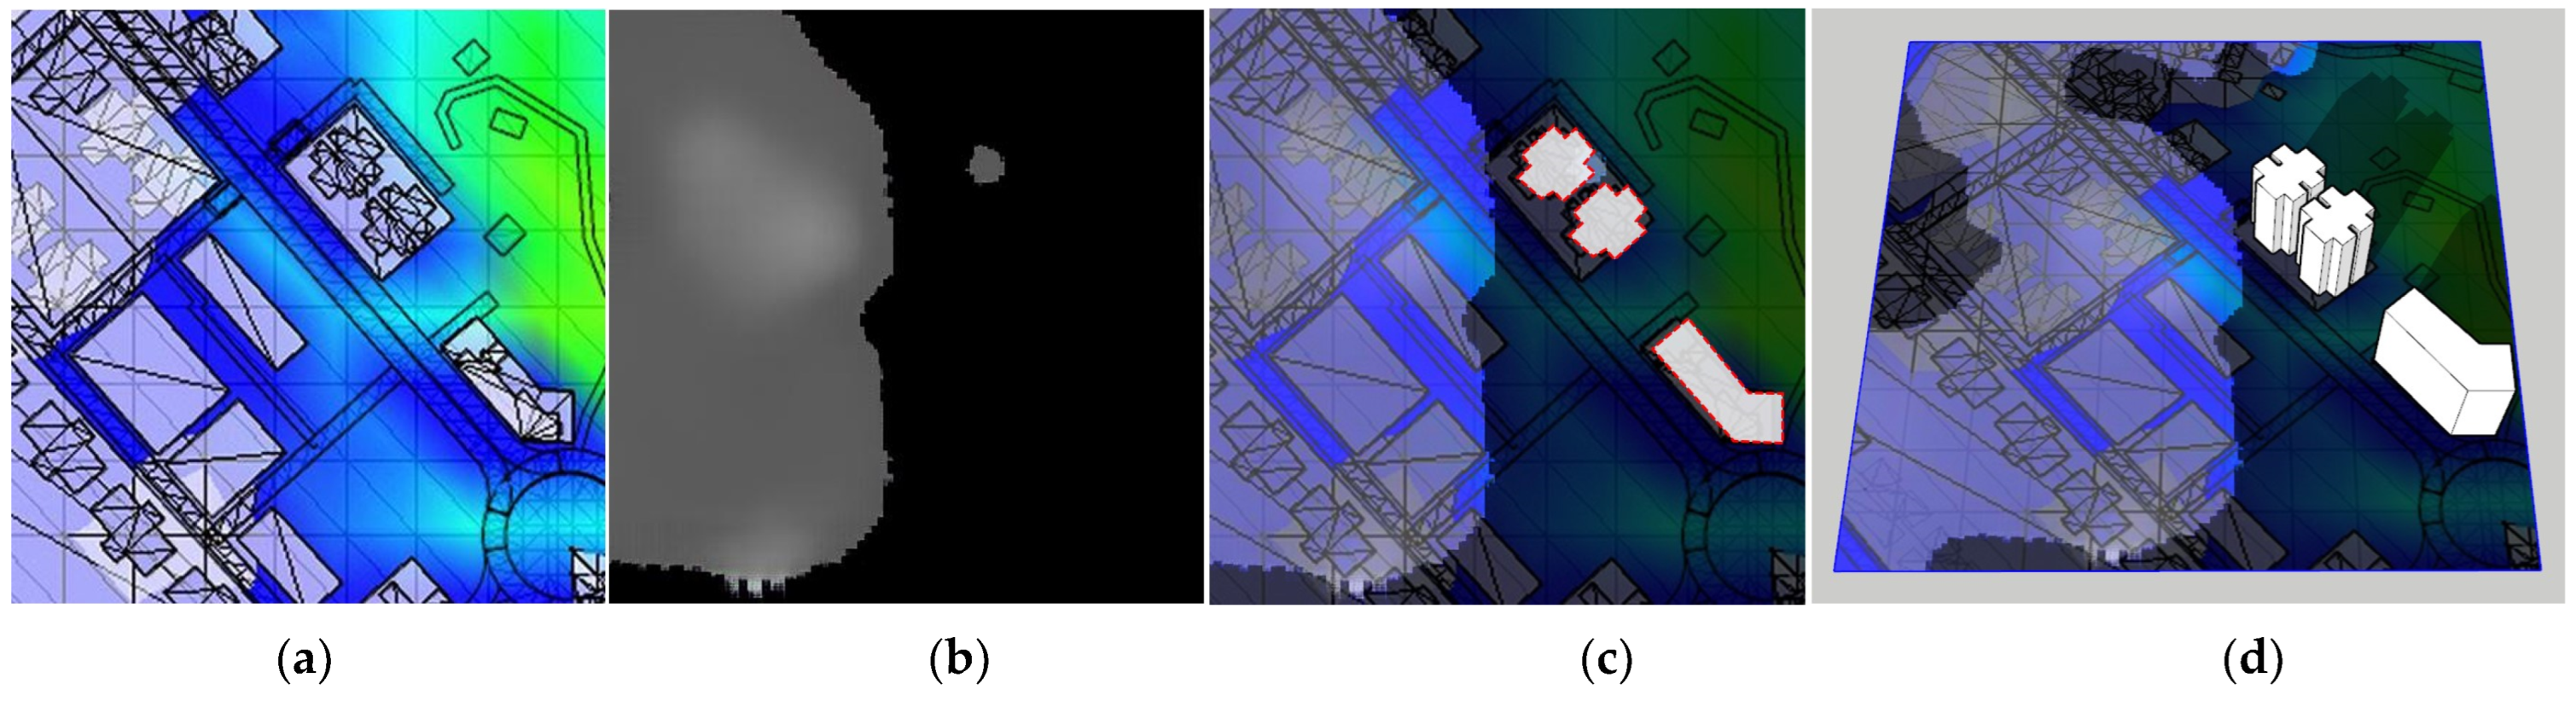
Figure 19.
High-density residential buildings without mountains. (a,e) Wind environment map; (b,f) epidemic distribution map; (c) “C” shape layout of typical residential buildings; (g) “rectangular” layout of typical residential buildings; (d,h) building space model.
Figure 19.
High-density residential buildings without mountains. (a,e) Wind environment map; (b,f) epidemic distribution map; (c) “C” shape layout of typical residential buildings; (g) “rectangular” layout of typical residential buildings; (d,h) building space model.
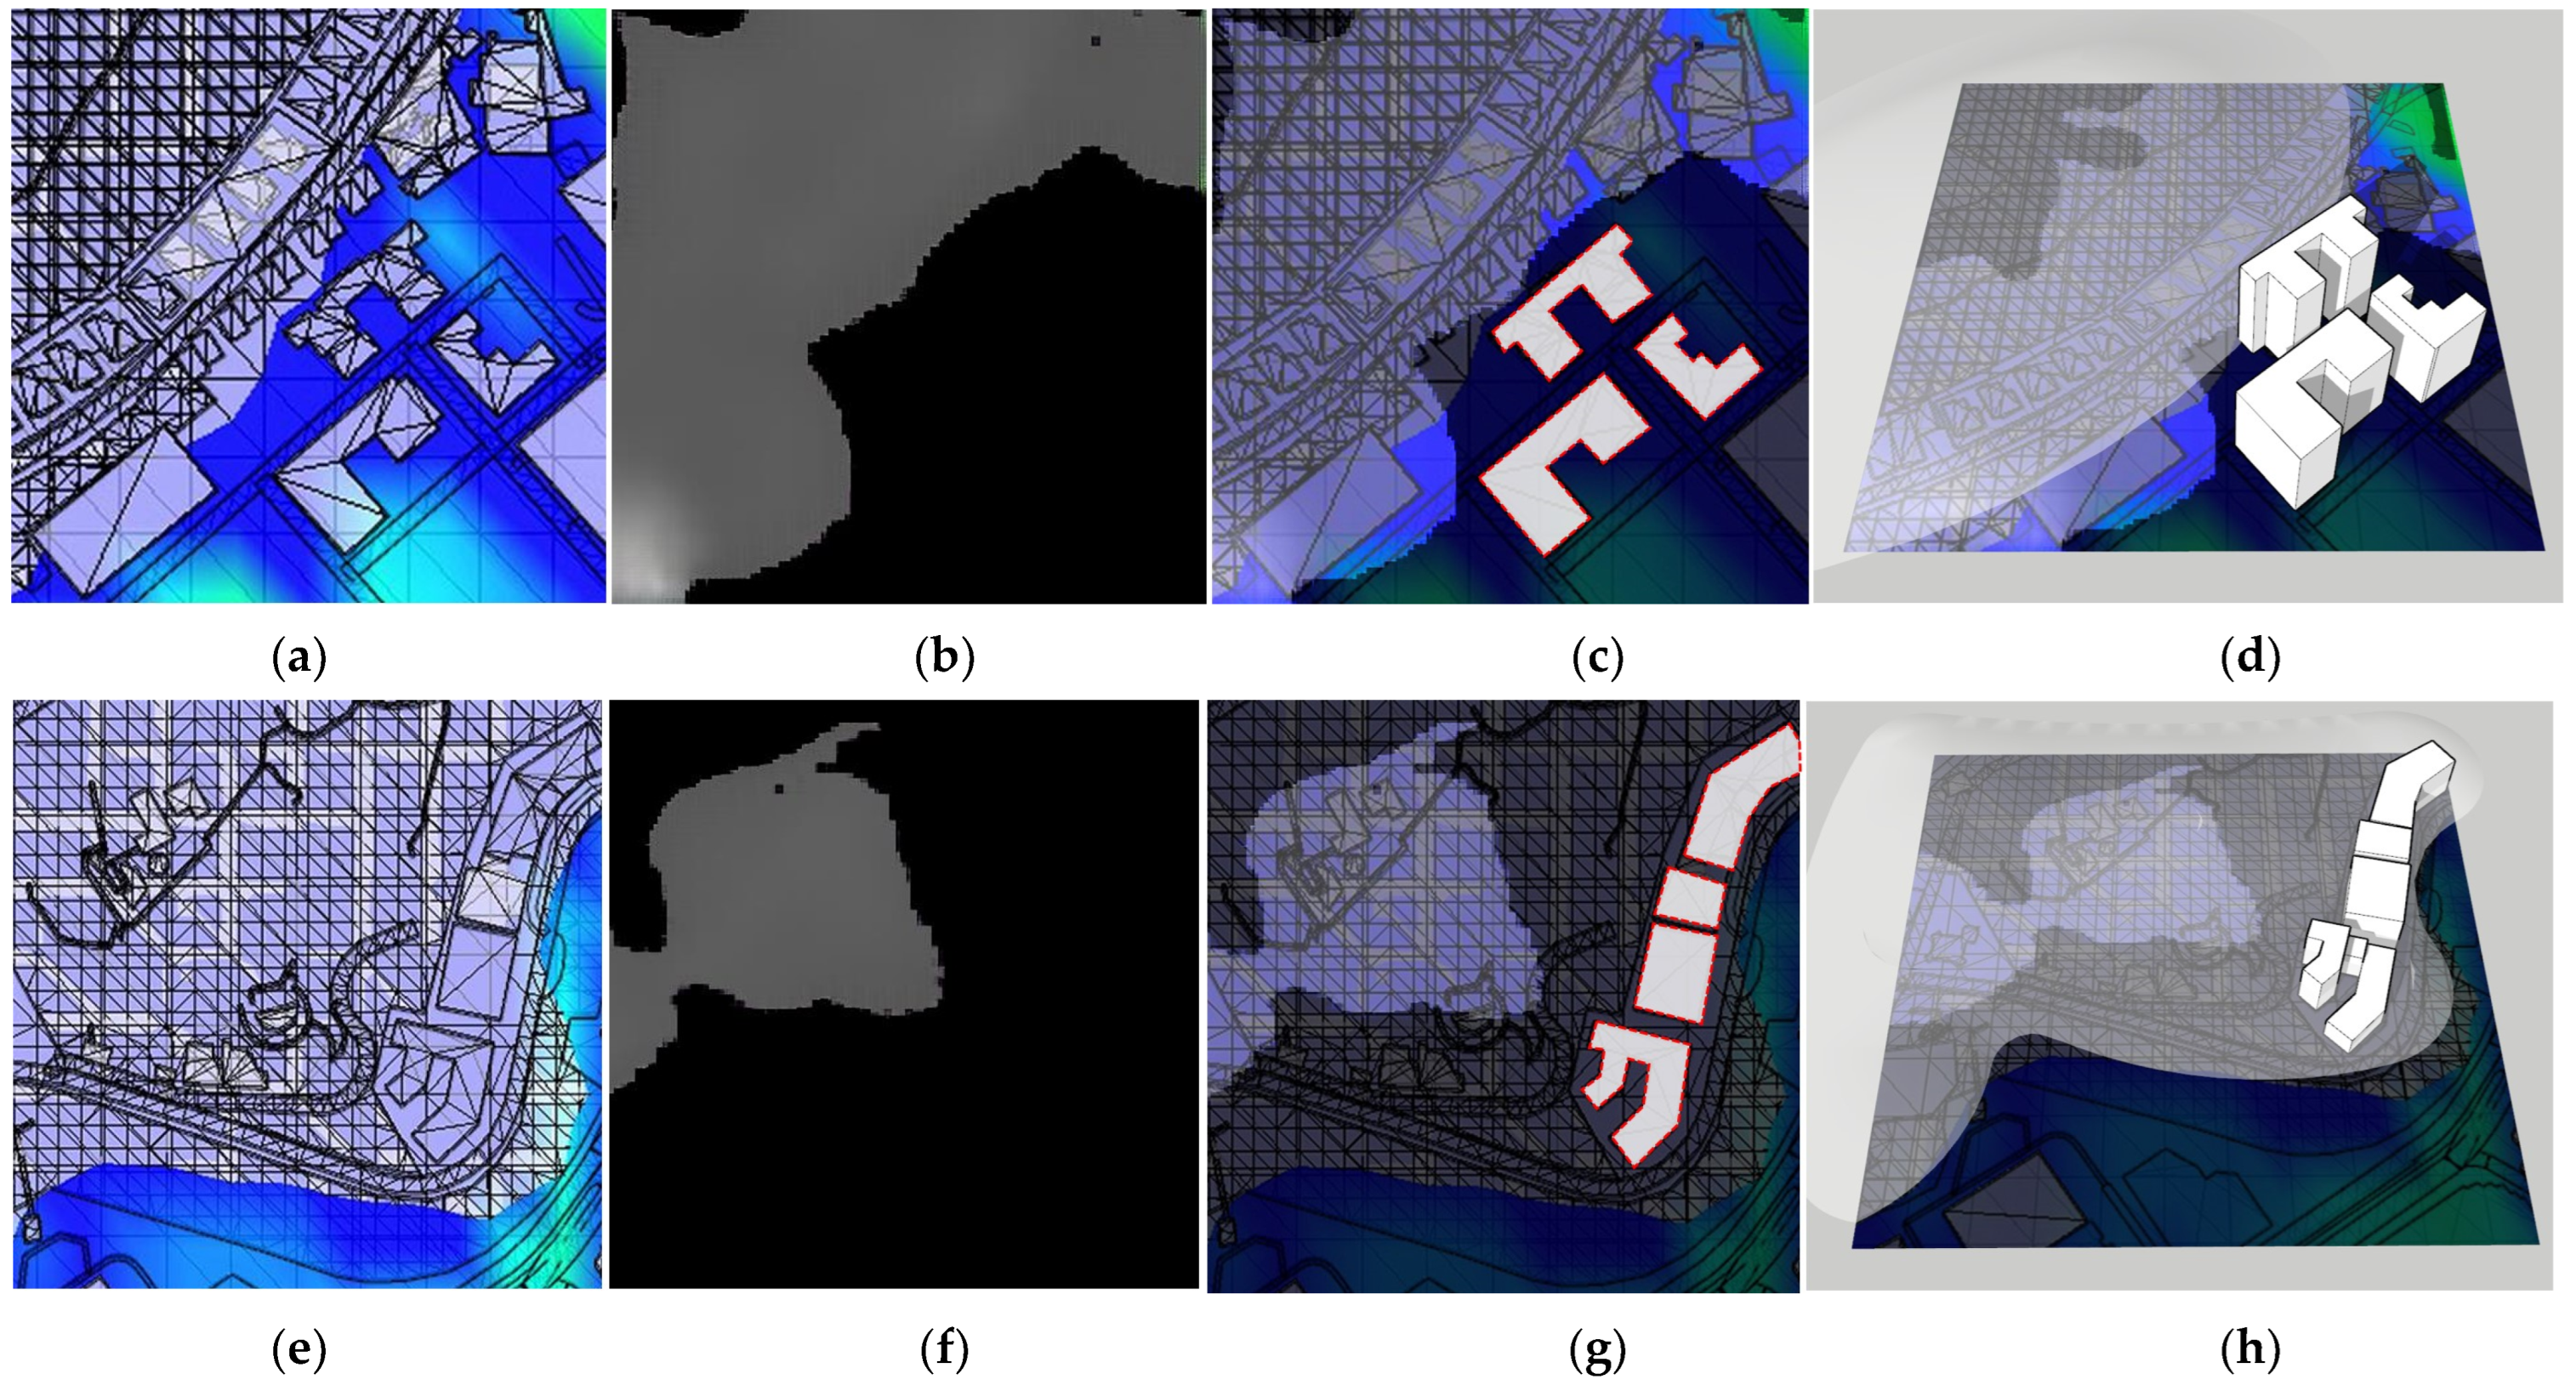
Figure 20.
Analysis of typical residential building types in areas with low incidence of COVID-19. “1–6” represents the group number of the simulation experiment control.
Figure 20.
Analysis of typical residential building types in areas with low incidence of COVID-19. “1–6” represents the group number of the simulation experiment control.
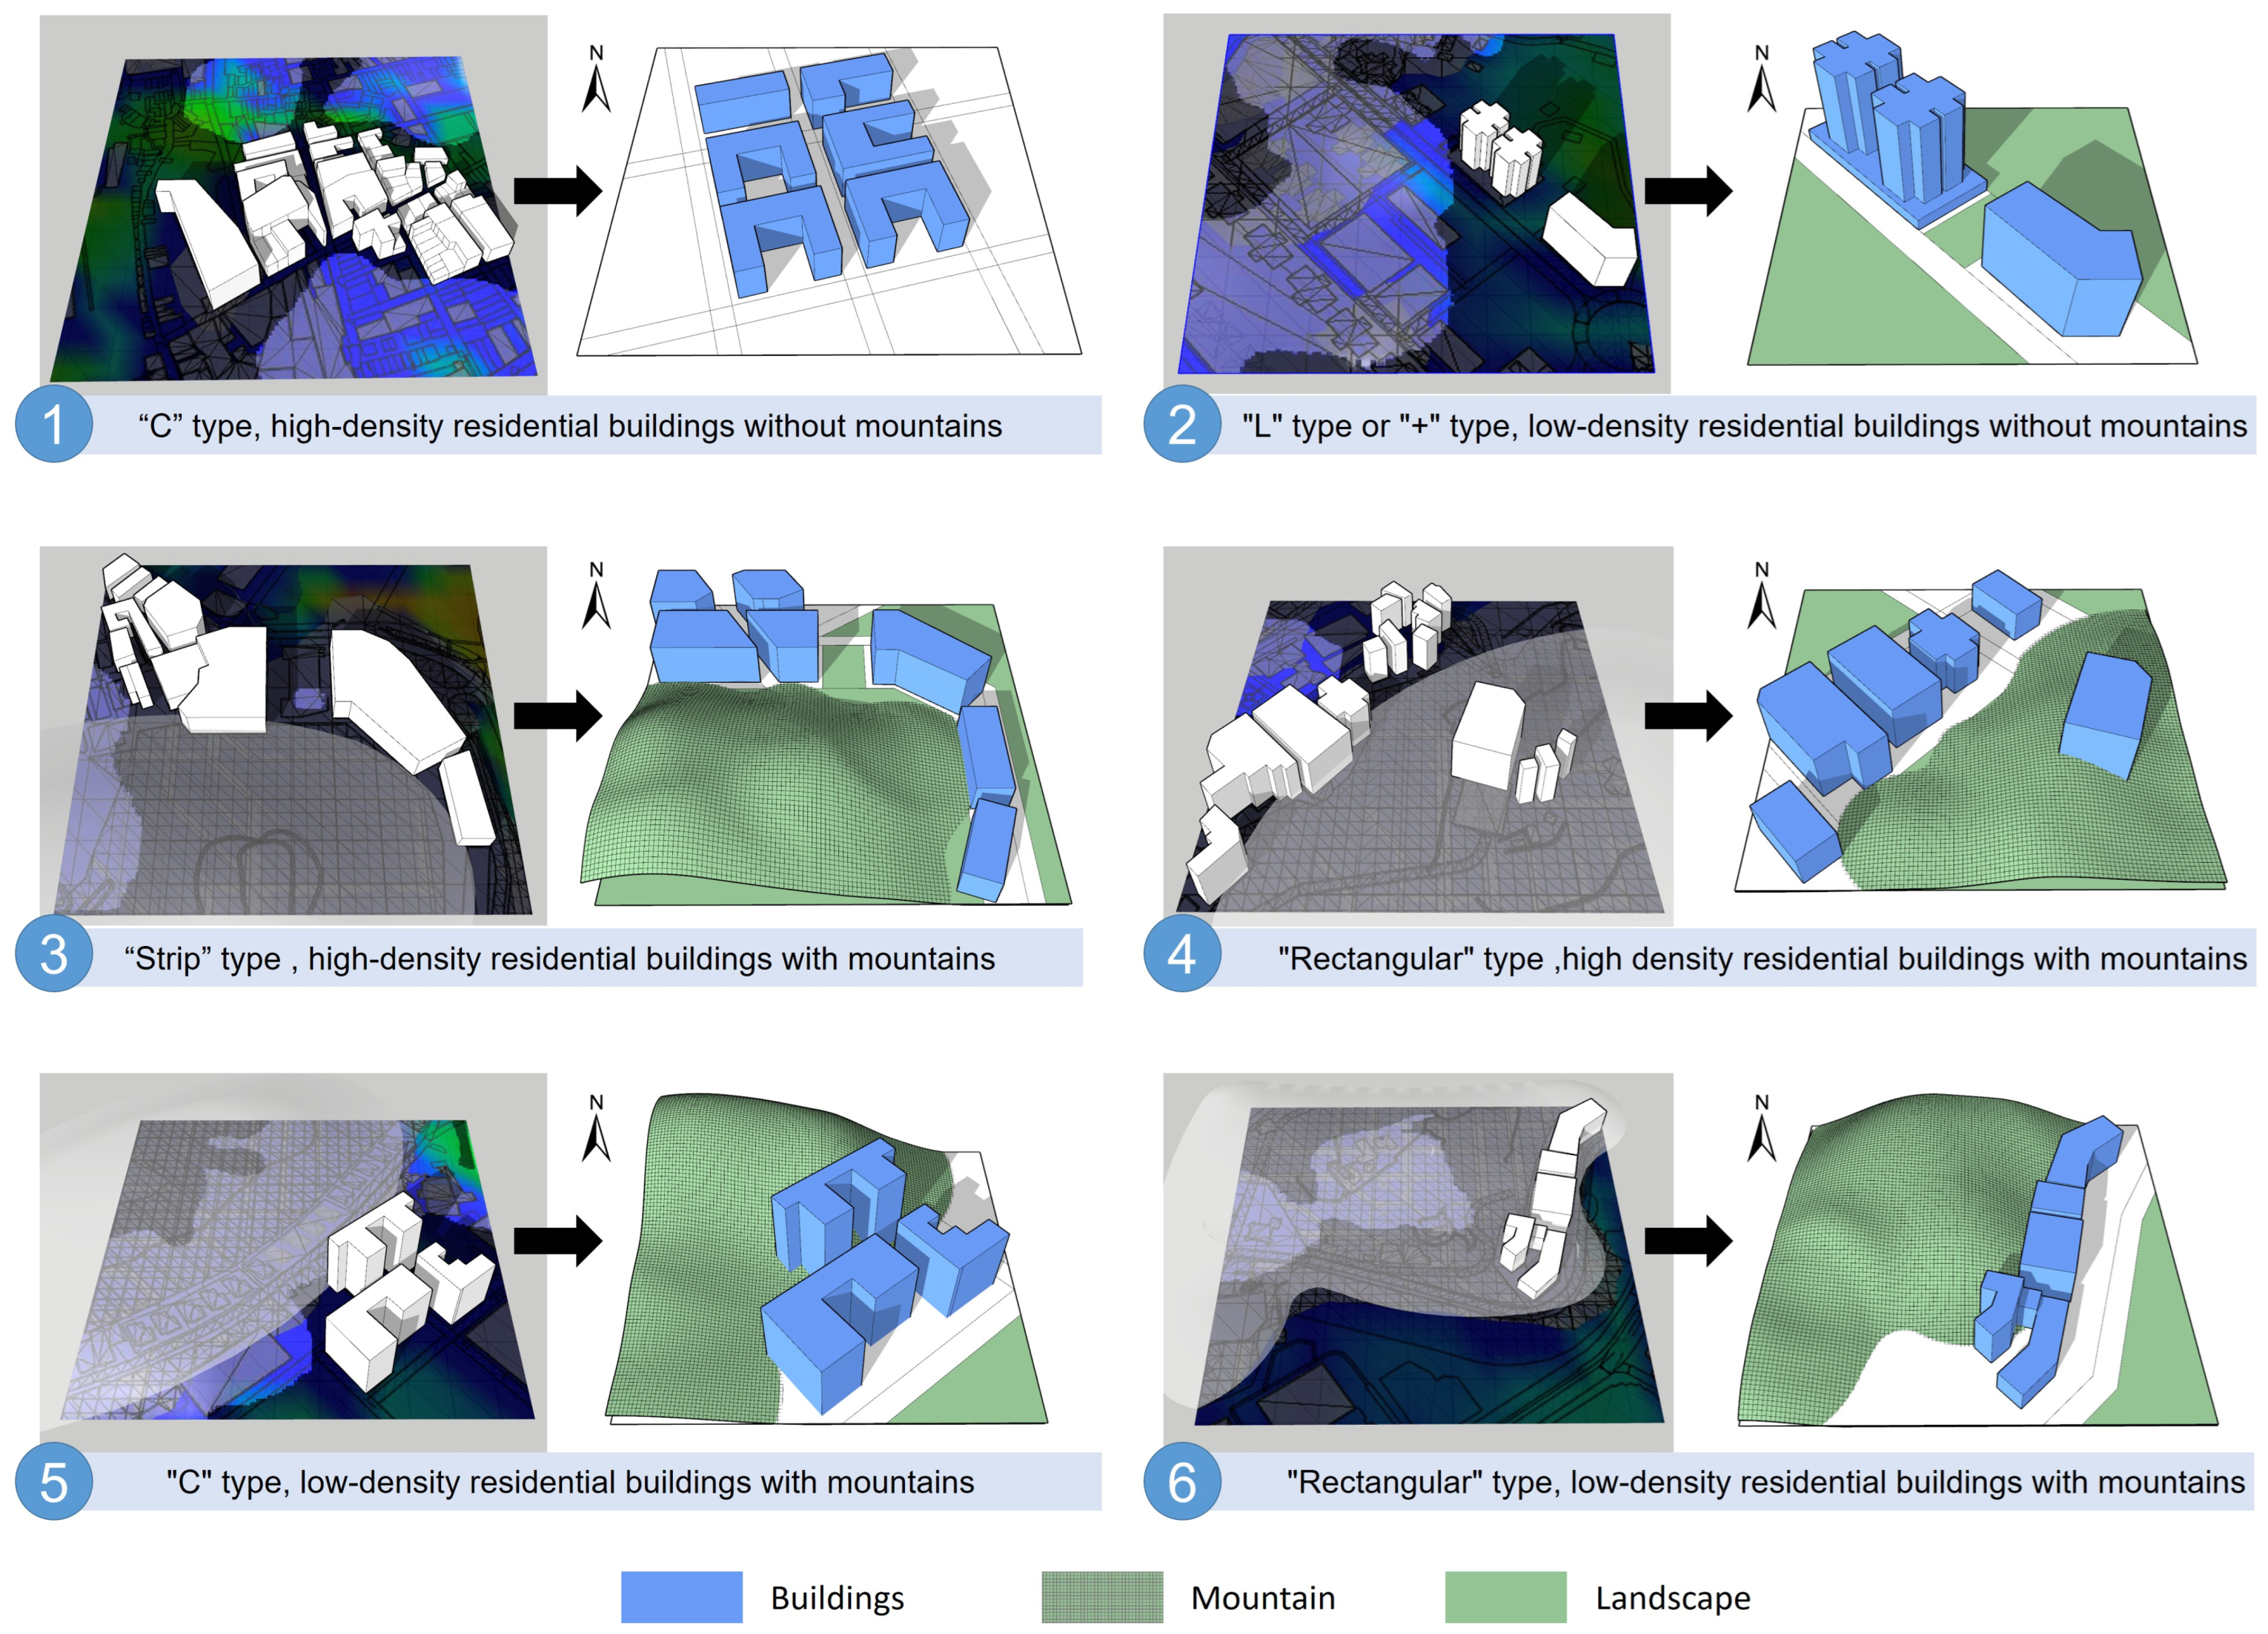
Figure 21.
Wind environment simulation and COVID-19 prediction of typical layout of residential buildings. “1–6” represents the group number of the simulation experiment control.
Figure 21.
Wind environment simulation and COVID-19 prediction of typical layout of residential buildings. “1–6” represents the group number of the simulation experiment control.
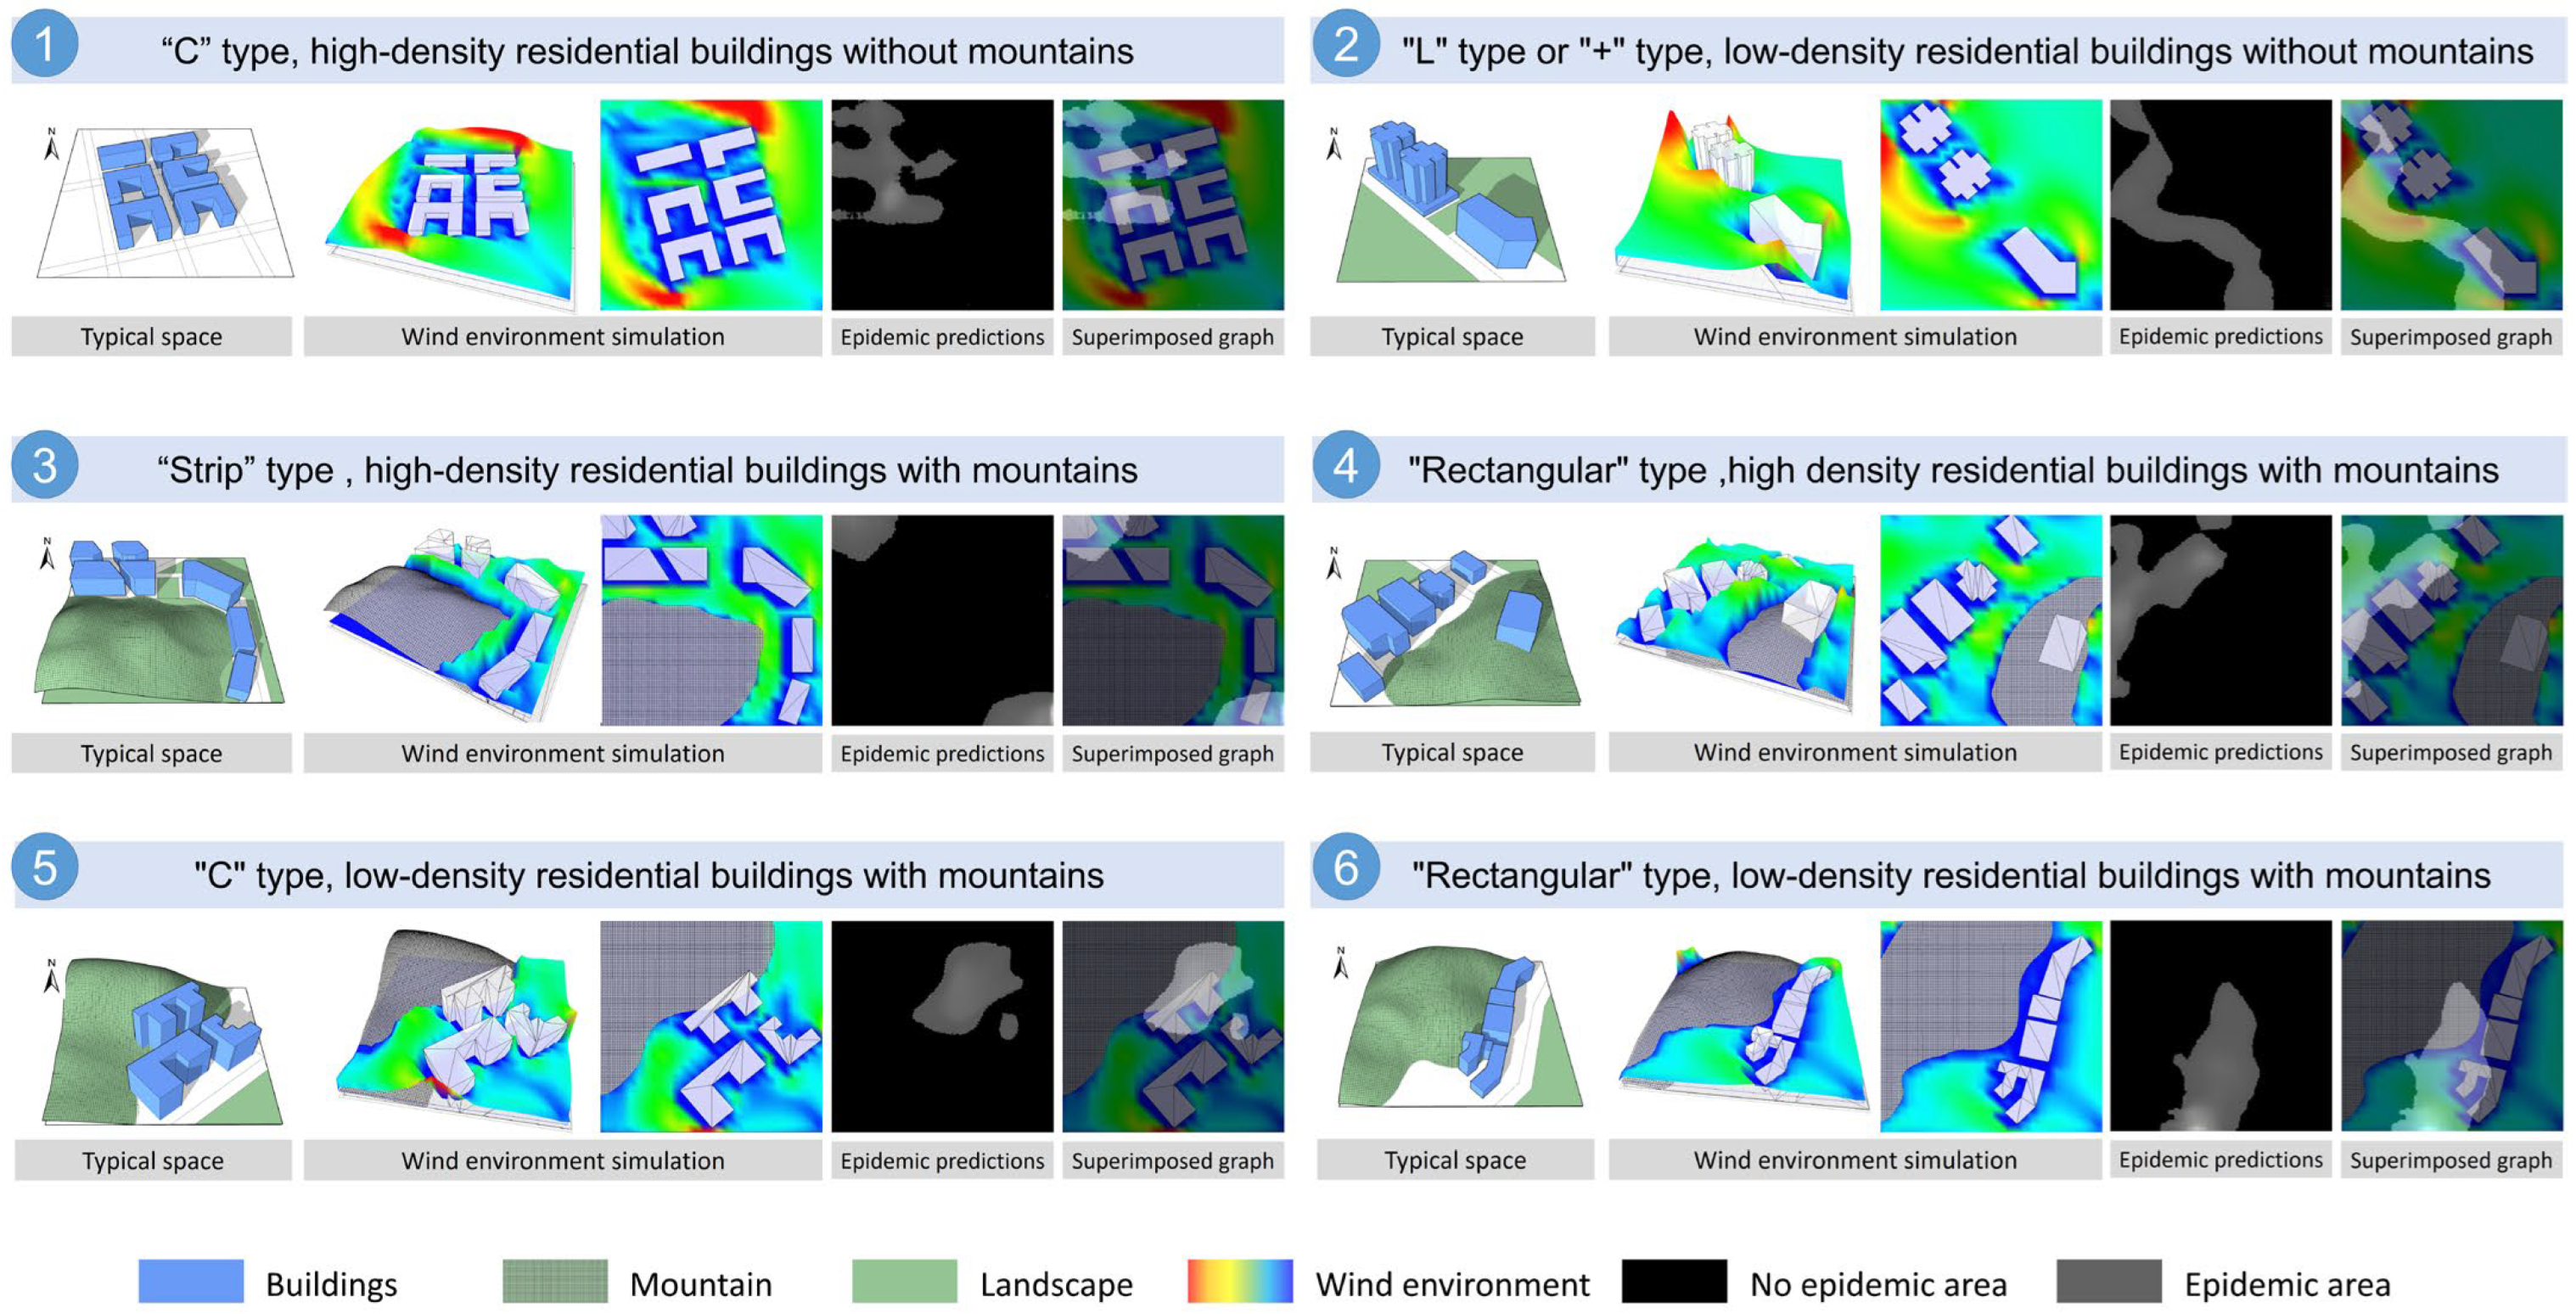
Disclaimer/Publisher’s Note: The statements, opinions and data contained in all publications are solely those of the individual author(s) and contributor(s) and not of MDPI and/or the editor(s). MDPI and/or the editor(s) disclaim responsibility for any injury to people or property resulting from any ideas, methods, instructions or products referred to in the content. |
© 2023 by the authors. Licensee MDPI, Basel, Switzerland. This article is an open access article distributed under the terms and conditions of the Creative Commons Attribution (CC BY) license (https://creativecommons.org/licenses/by/4.0/).
Share and Cite
MDPI and ACS Style
Zheng, L.; Chen, Y.; Yan, L.; Zheng, J. The Impact of High-Density Urban Wind Environments on the Distribution of COVID-19 Based on Machine Learning: A Case Study of Macau. Buildings 2023, 13, 1711. https://doi.org/10.3390/buildings13071711
AMA Style
Zheng L, Chen Y, Yan L, Zheng J. The Impact of High-Density Urban Wind Environments on the Distribution of COVID-19 Based on Machine Learning: A Case Study of Macau. Buildings. 2023; 13(7):1711. https://doi.org/10.3390/buildings13071711
Chicago/Turabian StyleZheng, Liang, Yile Chen, Lina Yan, and Jianyi Zheng. 2023. "The Impact of High-Density Urban Wind Environments on the Distribution of COVID-19 Based on Machine Learning: A Case Study of Macau" Buildings 13, no. 7: 1711. https://doi.org/10.3390/buildings13071711
Note that from the first issue of 2016, this journal uses article numbers instead of page numbers. See further details here.