
The Influence of Aeroelastic Effects on Wind Load and Wind-Induced Response of a Super-Tall Building: An Experimental Study
1
School of Civil Engineering, Central South University, Changsha 410075, China
2
School of Resources and Safety Engineering, Central South University, Changsha 410075, China
*
Author to whom correspondence should be addressed.
Buildings 2023, 13(7), 1871; https://doi.org/10.3390/buildings13071871
Submission received: 20 June 2023
/
Revised: 22 July 2023
/
Accepted: 22 July 2023
/
Published: 24 July 2023
(This article belongs to the Special Issue Development of Structural Health Monitoring, Structural Reinforcement and Structural Performance Evaluation)
Abstract
:To investigate the wind-induced response and equivalent wind load of a super-tall building, an aeroelastic model of the building was designed to measure aerodynamic interference in wind tunnel tests. Experiments on pressure and vibration measurements were conducted in both uniform and turbulent wind fields, and the displacement response and surface wind pressure at different locations of the model were recorded. The displacement time-history response spectrum and aerodynamic spectrum in both fields were compared and analyzed. The research showed that the mean displacement responses of the model in the across-wind and along-wind directions gradually increased with velocity under different wind attack angles. The mean displacement response of torsion moment in a uniform wind field changed very little, and the mean and fluctuating wind pressures in each layer were significantly stratified, making it is easy to generate a coupled vortex-induced resonance. On the other hand, the mean displacement response of torsion moment in a turbulent field increased with wind velocity. Strong turbulence made the fluctuating wind pressure at the top and bottom of the model slightly more significant than in a uniform field. The resistance of super-tall buildings came from turbulence excitation in the along-wind direction and the self-excited resistance generated by the across-wind direction. The test methods and main research conclusions may provide a reference for glass curtain walls and the structural wind-resistant design of super-tall buildings.
1. Introduction
With the development of lightweight and high-strength materials and advancements in construction technology, super-tall buildings have become taller and more flexible, leading to increased aerodynamic and elastic effects [1,2]. Especially in complex wind fields, the role of wind loads on structural safety and comfort design is becoming increasingly evident [3,4]. The directions of wind-induced vibration of super-tall buildings are illustrated in Figure 1, and these can be broadly categorized into three types: across-wind, along-wind, and torsional [5,6,7]. Across-wind vibration occurs when a building is exposed to strong, steady winds perpendicular to its main axis, resulting in lateral forces that can cause the building to sway from side to side [8]. Along-wind vibration occurs when a building experiences lateral oscillations parallel to the direction of the prevailing wind, which can be attributed to wind buffeting [9]. Torsional vibration is caused by the twisting torque along the building’s vertical axis caused by non-uniform wind load distribution [10]. Therefore, wind tunnel tests on building structures are critical for assessing a building’s structural integrity and aerodynamic performance, especially in regions prone to high winds and extreme weather [11,12,13]. Subjecting scale models to simulated wind conditions in a controlled environment can accurately predict a building’s structural response and optimize its design to ensure the safety and stability [14,15].
When air flows around a blunt body, vortices alternate shedding from the front and back of the structure, generating pulsating loads in the across-wind direction. When a vortex occurs on one side of the structure, the wind velocity on the other side increases while the wind pressure decreases, resulting in a lateral thrust action on the side where the vortex is. When vortices alternately appear on both sides of the structure, a harmonic across-wind load with the same frequency as the vortices is formed, leading to vortex-induced vibration in the structure [16,17,18]. Super-tall buildings are flexible structures that deform under across-wind lift forces. The additional self-excited aerodynamic pressure caused by structural deformation further induces structural deformation [19,20]. This trend may become smaller, eventually reaching a dynamic equilibrium state. Currently, the frequency of alternate shedding of vortices is consistent with the frequency of across-wind vibration, leading to the vortex-induced resonance of super-tall buildings [21,22,23]. Additionally, as the wind velocity increases, it may also diverge causing structural damage, a phenomenon known as galloping. The interaction among aerodynamic, inertial, and elastic forces creates wind field coupling, known as the aeroelastic effect.
Aeroelastic-model wind tunnel testing is a conventional and effective research method in structural wind engineering [8,24,25,26]. The advantages of a rigid model are its simplicity and cost-effectiveness, but unlike an aeroelastic model it lacks the ability to accurately capture aeroelastic phenomena and dynamic interactions between aerodynamics and structural flexibility. The aeroelastic model is non-constrained, which means it can generate structural vibration from external excitation and comprehensively reflect the interaction between super-tall buildings and the wind and feedback aerodynamic effects. Huang et al. [27] conducted a series of wind tunnel tests for aeroelastic model vibration measurement and rigid model pressure measurement to investigate the aeroelastic and aerodynamic interference effects on a super-tall building. Rizzo [28] discussed the acquisition time dependence of the individual values and of the wind-induced floor acceleration correlation coefficient between both the different building levels and wind directions. Su et al. [29] studied the aeroelastic responses and designed wind loads of twin super-tall reinforced concrete chimneys through wind tunnel tests. The results from rigid and aeroelastic model tests were analyzed and compared with the codes.
This paper analyzed the influence of aeroelasticity on surface wind load and wind-induced dynamic response under different wind fields by simultaneously measuring pressure and vibration on the aeroelastic model. An aeroelastic model of building structures for wind tunnel tests was designed, and the pressure and vibration measurements were conducted in both uniform and turbulent wind fields. Based on the results, the displacement response of the model and the variation of the surface wind load distribution with wind velocity were analyzed. The displacement time-history response spectrum and aerodynamic spectrum under two wind fields were compared and discussed. Compared with the related work, this study more comprehensively reflected the wind load and wind-induced response of super-tall buildings with aerodynamic interference.
2. Test Methods
2.1. Wind Field Parameters
Wind-tunnel testing was conducted in two wind field environments: uniform flow and turbulent flow. The wind tunnel laboratory is a closed-port backflow-type boundary layer wind tunnel with dimensions of 3.0 m in width, 3.0 m in height, and 15.0 m in length. The turntable diameter was 2.5 m, and the wind velocity of the test section was adjusted in the range of 5.0 to 94.0 m/s. The geometrical scale of the flow field simulation was 1:350. The designed turbulent wind field used an urban area with dense building clusters as the simulated environment (terrain C). For turbulence generation, a passive turbulence generation device was assembled with spires, roughness elements, and vertical grids to simulate the atmospheric boundary layer. The wind tunnel testing model and turbulent wind field simulation parameters are shown in Figure 2 and Figure 3, respectively.
2.2. Validation of Wind Fields
In uniform wind fields, the inflow wind velocities for experimental comparative studies were controlled at 8.5 and 10 m/s, respectively. Before the experiment, the inflow uniformity in the open test section of the wind tunnel was measured and calibrated so that the wind velocity was uniform at the inlet of the tunnel. It should be noted that due to the influence of the boundary layer of the wind tunnel, uniformity of the average wind velocity and turbulence intensity was poor below a height of 0.3 m. In turbulent wind fields, the selected reference height Hg was 1.2 m. The mean wind velocity and turbulence intensity profile are shown in Figure 4, where z is the height from the ground; Uz is the ratio of wind velocity at different heights to the wind velocity at the reference height; and Iu is the along-wind direction turbulence intensity. The test values were close to the code values in the “Load Code for the Design of Building Structures” (GB 50009-2019), and had good wind field simulation effects [30]. The comparison results of the fluctuating wind velocity spectrum at the height of the reference point obtained from the test with other wind velocity spectra are shown in Figure 5: Su denotes the wind velocity spectrum, and u* denotes the root-mean-square value of the fluctuating wind velocity. As can be seen, there was a good match between the measured velocity spectrum of the wind field and the Karma spectrum, which again indicated that this experiment simulated the atmospheric boundary layer of terrain C well.
2.3. Measurement Equipment
During the test, the surface wind pressure and displacement response of the model measurement points were measured simultaneously. A dynamic multi-hole pressure probe was used for atmospheric boundary layer simulation commissioning, wind velocity calibration, and wake testing as shown in Figure 6a. The probe had a wind velocity measurement range of 2–100 m/s, and the frequency response range was 0–2 kHz. The measurement accuracy reached ±0.5 m/s when the turbulence intensity did not exceed 30%, and the tilt angle measurement accuracy was ±1°. To measure the wind pressure time-history at each layer pressure measurement point, an electronic-scanned pressure sensor shown in Figure 6b was used. The sensor had a maximum frequency of 625 Hz and a measurement accuracy of ±0.05% FS. The number of pressure measurement channels was selected according to the number of measurement points on the model surface. Additionally, a laser distance sensor shown in Figure 6c was used to measure the displacement response. This sensor had a reference distance of 300 mm, a measurement distance range of 160–450 mm, and a linearity of ±0.25% FS. All sensors used in the test met accuracy requirements. The mean displacement/wind pressure calculation was performed by adding up all the displacement/wind pressure recorded at each measurement point on the top layer of the model and then dividing it by the total number of measurement points on that layer.
2.4. Aeroelastic Model
The dynamic response of tall buildings in the across-wind, along-wind, and torsional directions were directly measured using aeroelastic models. The aeroelastic model structure diagram of a single super-tall building installed in the wind tunnel testing section is shown in Figure 7a. The total height was approximately 1.4 m, enabling simultaneous vibration monitoring and wind pressure monitoring. The model was designed and fabricated using ANSYS based on the similarity principle. The model skeleton consisted of I-beam core bars and aluminum alloy support spacers to simulate structural stiffness. The outer coat is composed of 2 mm thick Plexiglas panels, divided into 7 layers with a 2 mm space between adjacent layers and securely fastened to the support spacers by flat-head screws. Lead counterweights were adjusted to control the model’s mass and mass moment of inertia, ensuring similarity with the prototype and meeting test design requirements. The wind tunnel’s blockage rate caused by the model was about 2.5%, making the blockage effect negligible.
Three measurement sections were arranged at 1.40, 1.05 and 0.75 m heights of the aeroelastic model, and three laser displacement sensors were arranged for each measurement section. The arrangement is shown in Figure 7b,c. Measure the linear displacement along two orthogonal horizontal cross axes and the torsional displacement around the longitudinal axis (i.e., 2 sensors on the x-axis and 1 sensor on the y-axis). The displacement signal was sampled at 625 Hz, and each signal channel contained 20,478 discrete units of data, which were collected synchronously through 9 channels. In addition, 120 pressure measurement points were laid out for simultaneous wind pressure measurement with a sampling frequency of 625 Hz and a sampling time of 32 s. The designed test wind velocity was 2–16 m/s, and the wind angles were 0°, 45°, 75° and 90°.
3. Analysis of Displacement Response under Different Wind Attack Angles
3.1. Mean Displacement Response Analysis
The mean displacement responses of a single super-tall building in uniform and turbulent flows under different wind attack angles are given in Figure 8 and Figure 9, respectively. The U on the horizontal axis represents the wind velocity, and the Dx-mean, Dy-mean, and Dθ-mean on the vertical axis represent the mean displacement in x direction, mean displacement in y direction, and torsion moment, respectively. It is clear that in both types of wind fields, the mean displacement responses of the model in across-wind and along-wind directions gradually increased with wind velocity under different wind attack angles. In the uniform wind field, there was little difference in the mean displacement response of the torsion moment under different angles. Turbulence caused asymmetric loads on the building surfaces, so in the turbulent wind field, the mean displacement response of the torsion moment was greatly affected by the wind attack angles and increased with wind velocity. In addition, at a wind attack angle of 45°, the mean displacement of wind velocity measured from high to low increased slightly more than that measured from low to high. The analysis suggested that there was a wind velocity locking interval for building structure vibration. Specifically, the velocity from high to low made the structure vibrate at the upper limit of the critical interval with a larger mean displacement response; the velocity from low to high made the building vibrate at the lower limit of the critical interval with a smaller mean displacement response.
3.2. Fluctuating Displacement Response Analysis
Figure 10 and Figure 11 show the comparison of the fluctuating displacement response of a super-tall building in uniform and turbulent wind fields under different wind attack angles. The Dx-rms, Dy-rms, and Dθ-rms on the vertical axis represent the fluctuating displacement in x direction, fluctuating displacement in y direction, and torsion moment, respectively. Under the action of 0° and 90° wind attack angles in the uniform flow field, the fluctuating displacement response of the building structure in the theoretical critical wind velocity interval produced obvious spikes, indicating that a coupled vortex-induced vibration (VIV) in three directions occurred at this time. Under the action of 45° and 75° wind attack angles, the fluctuating displacement response did not produced obvious spikes, and wind velocity variances were slight, indicating that the incoming wind direction had a great influence on the building structure. Therefore, the maximum local incoming wind direction should be fully considered when siting the building, which can avoid vortex-induced vibrations of the building structure.
In the turbulent wind field, the spikes of the curve disappeared, and no significant vortex-excited resonance occurred. In other words, the turbulence intensity suppressed strong regular vortex shedding formation. In general, the fluctuating displacement response in turbulent wind fields with different wind attack angles did not exceed a 0° wind attack angle. In the wind field with significant turbulence, the fluctuating displacement response still maintained a considerable value even if the critical wind velocity interval was exceeded.
3.3. Displacement Time-History Response Spectrum Analysis
The vibration response of the 0° wind attack angle was selected for analysis, and the wind velocities selected were 8.5 and 10 m/s. The displacement time-history response spectrum of the 0° wind attack angle in three directions for these two wind velocities are presented in Figure 12 and Figure 13. The n on the horizontal axis is the natural frequency, and the Sx(n), Sy(n) and Sz(n) on the vertical axis are the across-wind, along-wind, and torsion moment direction displacement time-history response power spectrum density function.
When the wind velocity was 8.5 m/s, the vortex-induced vibration frequency in the turbulent wind field in the three directions was slightly increased than that of the uniform flow, and the peak of the corresponding displacement time-history response spectrum was slightly reduced, while the energy contained in the low- and high-frequency structural vibration increased. For the across-wind direction in a uniform flow field, the structure twice had a smaller spectral peak at the first-order vibration frequency, indicating that the across-wind displacement response also contained the displacement response due to higher order frequencies. For the along-wind direction in a uniform flow field, the displacement time-history response spectrum also has a small spike at the second order vibration frequency of the structure, which was due to the energy transfer caused by the effect of bending-torsion coupling. For the torsion moment direction in the uniform flow field, a larger spectrum peak was at the first-order natural frequency (across-wind direction) of the structure, and a smaller peak appeared near the natural frequency (third order) of the torsion moment. Two times the natural frequency (first order) of the across-wind direction of the structure appeared when the structure was dominated by the first order across-wind vibration [31]. The torsional response of the aeroelastic model included turbulent excitation, asymmetrical distribution of lateral wind loads, and torsional angles from moments due to self-excited forces generated by a cross-wind translational motion.
When the wind velocity was 10 m/s, the response spectrum change pattern was like that for 8.5 m/s, but the difference was a larger contribution of a long-wind direction vibration to the structure. In the turbulent wind field, the displacement time-history response spectrum peak in all three directions was significantly larger than for the uniform wind field, and the first-order vibration frequency was unchanged. From the above analysis, the presence of turbulence increased the small-scale vortex clusters, leading to a surge of energy vibrations in the fluctuating response spectrum of the structure, which had a certain suppression effect on the across-wind vortex-induced vibration.
4. Wind Load Characteristics
4.1. Surface Wind Pressure
To further analyze the distribution of wind loads on the surface of the aeroelastic model under different wind fields and wind velocity conditions, the wind pressure at wind velocities of 8.5 and 10 m/s with a 0° wind attack angle were selected. Additionally, wind pressure at a wind velocity of 6 m/s before the vortex-induced vibration was also considered. The wind pressure coefficient time-history range Ci,j for the i-th measurement point on the j-th layer of the aeroelastic model surface was defined as:
where pi,j is the wind pressure time-history range at the i-th measurement point on the j-th layer of the model surface; p∞ is the incoming static pressure; ρ and Ug are the air density and the incoming wind velocity at the reference point, respectively.
The distribution of the mean and fluctuating wind pressure coefficients on the building surface in the uniform and turbulent wind fields are presented in Figure 14, Figure 15, Figure 16 and Figure 17. The Cp-mean and Cp-rms represent the mean wind pressure coefficient and the fluctuating wind pressure coefficient, respectively. In the uniform wind field, both the mean and the fluctuating wind pressures of each layer exhibited distinct layering. The trends of the surface wind pressure distribution curves in different wind fields and at different wind velocities showed relatively similar patterns.
When the wind velocity was 8.5 m/s, the lateral wind pressure was consistent with that of the windward and leeward sides at the position below the fifth floor measurement point (below 85% of the building height). Only at the top of the building near the free end, was the side wind pressure of the turbulent wind field slightly less than that of the uniform flow field, which may have been due to the end effect. In the turbulent wind field, the fluctuating wind pressure on the windward and sidewind sides was greater than for the uniform flow field, and the fluctuating wind pressure on the leeward side was greater than the uniform flow field on the top and bottom floors. In the uniform wind field, the fluctuating wind pressure on the leeward side gradually increased with building height. The possible reason is that, at the time, the building structure had an across-wind vortex-excited resonance, which meant that the structure had a larger equal amplitude lateral vibration, which in turn affected the side separation and back tail flow, making the back vortex shedding intensity larger. Since the presence of turbulence intensity just suppresses the occurrence of vortex-excited resonance, the fluctuating wind pressure at the back of the model in the turbulent wind field was smaller than that in uniform wind field. Since the end effect existed at the top of the model, which also had the largest vibration amplitude, the turbulence intensity was larger. The bottom was still the area of the greatest turbulence in the whole model. Therefore, the stronger turbulence made the fluctuating wind pressure at the top and bottom of the turbulent wind field slightly larger than for the uniform flow field.
When the wind velocity was 10 m/s, the mean and fluctuating wind pressure stratification of the model in the uniform wind field was more obvious and showed a difference in height. When vortex-induced vibration occurred in the across-wind direction, the building structure underwent large equal-amplitude lateral vibration, which affected the separation of the lateral airflow at different heights, as well as the properties and strength of the backside wake shedding, thus leading to a large difference in the mean and fluctuating wind pressures at each level, thereby showing a certain aeroelastic effect. In the turbulent wind field, the mean and the fluctuating wind pressures changed very little as velocity increased, indicating that high turbulence intensity had a certain inhibitory effect on the aeroelastic effect.
4.2. Comparative Analysis of Aerodynamic Spectrum
The fluctuating wind pressure spectrum reflected the contribution pattern of turbulent fluctuating excitation formed by the mutual coupling between wind and structure to the fluctuating energy of the wind load on the building surface. Current research on the wind load characteristics of super-tall buildings is based mostly on the fluctuating wind pressure spectrum of the rigid-body pressure measurement model, displacement response spectrum, and torsion spectrum of a single-degree-of-freedom pendulum aeroelastic model. However, only some scholars have studied the fluctuating aerodynamic spectrum with a multi-degree-of-freedom aeroelastic model. The applicability of aeroelastic models lies in their ability to capture the dynamic interactions between aerodynamics and structural flexibility, offering more accurate predictions of aeroelastic phenomena compared to wind tunnel pressure tests on rigid models.
In this section, the fluctuation lift force, drag force and torsion spectra were obtained by integration and spectrum transformation of the time-history wind pressure based on the multi-degree-of-freedom aeroelastic model. To further analyze the differences in wind pressure exhibited by each layer at different heights when the vortex-excited resonance occurred in the across-wind direction (U = 8.5 m/s), the selected study areas were layer 2 near the bottom of the model, layer 4 located at 2/3 of the height, and layer 5 near the top of the model. This also corresponded to the lower, middle, and upper directions of the super-tall building. The distribution of the layer fluctuating aerodynamic power spectrum density in different wind field types is given in Figure 18 and Figure 19. In figures, Sx(n), Sy(n), and Sz(n) on the vertical axis are the fluctuating aerodynamic power spectral density functions for each layer in the across-wind, along-wind, and torsion moment directions, and n on the horizontal axis is the natural frequency.
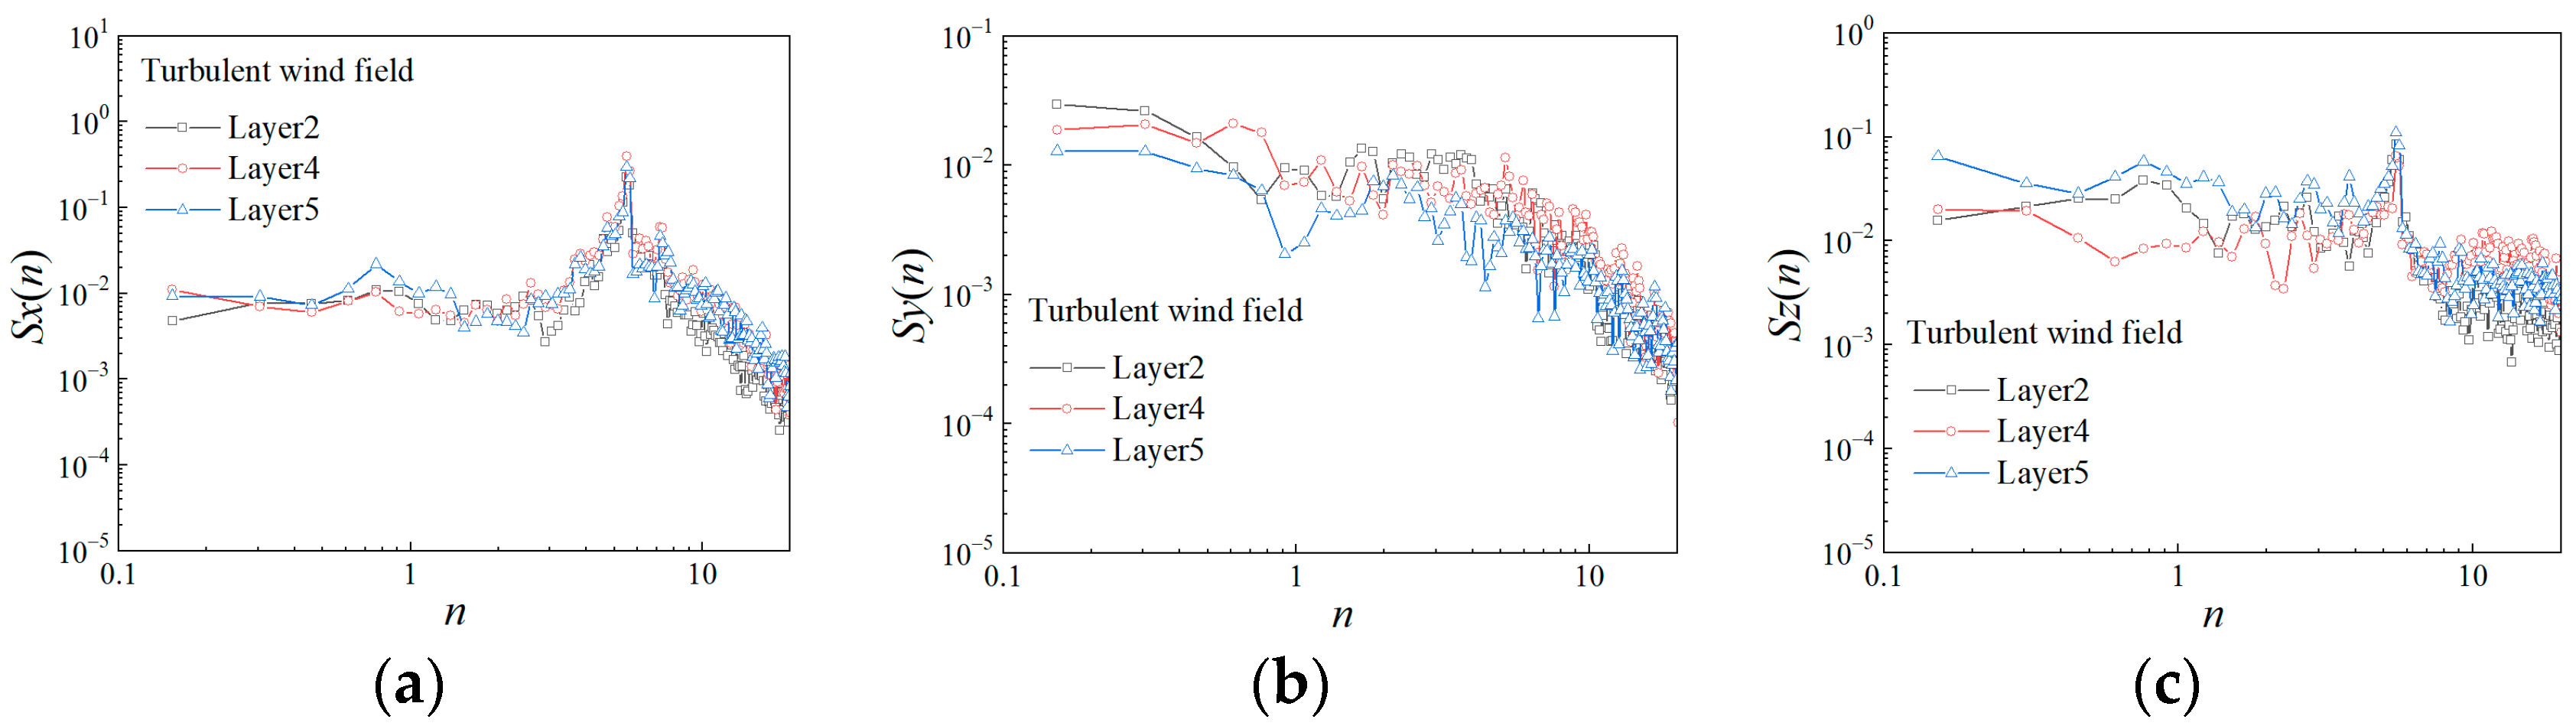
For the across-wind direction, the peak frequency at different heights was consistent, indicating that the periodic strength of vortex shedding was the same at different heights, without showing height differences, and independent of the type of flow field. However, the spectrum peaks at different heights showed variability. In the uniform wind field, vortex shedding frequency was equal in magnitude to the natural frequency of the structure, and the structure underwent vortex-excited resonance. In the turbulent wind field, vortex shedding frequency increased slightly over the natural frequency of the structure. For the across-wind aerodynamic power spectrum, in addition to the peak at the across-wind natural frequency, there was a small peak at two times the first order (across-wind) natural frequency. This indicated that the across-wind lift of the structure came from the first order frequency, and the effect of the high order frequency on it could not be neglected. This phenomenon did not occur in the turbulent wind fields.
The alone-wind aerodynamic power spectrum density distribution in the uniform flow field showed two spectral peaks: the smaller one near the second-order (alone-wind direction) natural frequency of the structure and the other near twice the first order (across-wind direction) natural frequency of the structure. From the fluctuating wind velocity variation diagram, the vibration of the structure is currently dominated by a cross-wind vortex excitation vibration, and a smaller resonance occurred in the alone-wind direction. Therefore, the resistance of the super-tall building came not only from the turbulent excitation in the alone-wind direction, but also from the self-excited resistance generated by the across-wind advection. The high turbulence intensity eliminated the narrow-band peak of the alone-wind aerodynamic power spectrum, which in turn broadened the frequency band.
The density distribution of the torsion moment aerodynamic power spectrum in the uniform flow field showed two spectral peaks: the larger one near the first order (across-wind direction) and the other one near the third order (torsion moment) natural frequency of the structure. However, the spectral peaks were small and narrow, indicating that the structure was dominated by a cross-wind vibration. The dynamic torsions of the aeroelastic model included not only the torsions formed by turbulent excitation and asymmetrical distribution of lateral wind loads, but also the self-excited moments induced by horizontal vibrations in the across-wind direction and the self-excited torsions generated by the joint action with torsional motion. In turbulent wind fields, the spectral peaks near the natural frequency of the structure twisted to broaden or even disappear.
5. Conclusions
This paper discussed the displacement response and wind load characteristics of an aeroelastic model of super-tall buildings and came to the following conclusions:
(1) The fluctuating displacement responses at different wind attack angles did not exceed 0° of wind attack. At the 0° and 90° angles, the building structure in a uniform flow field underwent torsional bending coupled with vortex-excited resonance in three directions. At a wind attack angle of 45°, there was a wind velocity locking interval for building structure vibration. The change of velocity from high to low caused the mean displacement response to increase, and the change of from low to high caused it to decrease.
(2) In wind fields with high turbulence intensity, the fluctuating displacement response was greater, and the turbulence intensity suppressed the formation of strong regular vortex shedding. The incoming wind direction had a significant effect on the building structure, which means that the maximum local wind velocity from the incoming wind direction should be carefully considered when siting the building, as it can prevent vortex-excited resonance.
(3) The effect of higher-order frequencies on the across-wind vibration of super-tall building structures cannot be ignored. The presence of turbulence intensity caused an increase in small-scale vortex clusters, leading to a surge of energy vibrations contained in the fluctuation response spectrum of the structure, which had a suppressive effect on the across-wind vortex-induced vibration.
(4) In a uniform wind field, there is great variability in the mean and fluctuating wind pressures at different heights on the model surface. The building structure experienced large equal-amplitude lateral vibrations during across-wind vortex-excited resonance, which, in turn, affected the separation of lateral airflow at different heights and the properties and intensity of backside wake shedding.
(5) The vortex shedding frequency corresponding to the main peak value of the generalized aerodynamic spectrum increased in the supercritical wind velocity region, reflecting the influence of structural vibration on the aerodynamic load on the building surface. This effect is a concrete manifestation of the feedback effect of fluid-solid coupling.
Author Contributions
Conceptualization, Z.X.; methodology, Z.X.; validation, Z.X. and J.Y.; formal analysis, Z.X. and J.Y.; investigation, Z.X. and J.Y.; resources, Z.X.; writing—original draft preparation, Z.X. and J.Y.; writing—review and editing, Z.X. and J.Y.; supervision, J.Y. All authors have read and agreed to the published version of the manuscript.
Funding
This research received no external funding.
Data Availability Statement
The data presented in this study are available upon reasonable request to the author.
Conflicts of Interest
The authors declare no conflict of interest.
References
- Lavôr, T.F.A.; de Brito, J.L.V.; Loredo-Souza, A.M. Interference effects mapping on the static wind loading of a tall building. Lat. Am. J. Solids Struct. 2023, 20, e484. [Google Scholar] [CrossRef]
- Kwok KC, S.; Hitchcock, P.A.; Burton, M.D. Perception of vibration and occupant comfort in wind-excited tall buildings. J. Wind. Eng. Ind. Aerodyn. 2009, 97, 368–380. [Google Scholar] [CrossRef]
- Elshaer, A.; Gairola, A.; Adamek, K.; Bitsuamlak, G. Variations in wind load on tall buildings due to urban development. Sustain. Cities Soc. 2017, 34, 264–277. [Google Scholar] [CrossRef]
- Salehinejad, M.M.; Flay, R.G.J. A review of approaches to generate equivalent static and synthetic wind loads on tall buildings for the preliminary stage of design. J. Wind. Eng. Ind. Aerodyn. 2021, 219, 104823. [Google Scholar] [CrossRef]
- Hou, F.; Jafari, M. Investigation approaches to quantify wind-induced load and response of tall buildings: A review. Sustain. Cities Soc. 2020, 62, 102376. [Google Scholar] [CrossRef]
- Sharma, A.; Mittal, H.; Gairola, A. Mitigation of wind load on tall buildings through aerodynamic modifications: Review. J. Build. Eng. 2018, 18, 180–194. [Google Scholar] [CrossRef]
- Kim, Y.-M.; You, K.-P. Dynamic responses of a tapered tall building to wind loads. J. Wind. Eng. Ind. Aerodyn. 2002, 90, 1771–1782. [Google Scholar] [CrossRef]
- Gu, M.; Quan, Y. Across-wind loads of typical tall buildings. J. Wind. Eng. Ind. Aerodyn. 2004, 92, 1147–1165. [Google Scholar] [CrossRef]
- Zhou, Y.; Kijewski, T.; Kareem, A. Along-Wind Load Effects on Tall Buildings: Comparative Study of Major International Codes and Standards. J. Struct. Eng. 2002, 128, 788–796. [Google Scholar] [CrossRef] [Green Version]
- Isyumov, N.; Case, P.C. Wind-induced torsional loads and responses of buildings. In Advanced Technology in Structural Engineering; ASCE Library: Philadelphia, PA, USA, 2000; pp. 1–8. [Google Scholar]
- Picozzi, V.; Malasomma, A.; Avossa, A.M.; Ricciardelli, F. The Relationship between Wind Pressure and Pressure Coefficients for the Definition of Wind Loads on Buildings. Buildings 2022, 12, 225. [Google Scholar] [CrossRef]
- Wang, Q.-A.; Zhang, C.; Ma, Z.-G.; Ni, Y.-Q. Modelling and forecasting of SHM strain measurement for a large-scale suspension bridge during typhoon events using variational heteroscedastic Gaussian process. Eng. Struct. 2022, 251, 113554. [Google Scholar] [CrossRef]
- Wang, Q.-A.; Wang, C.-B.; Ma, Z.-G.; Chen, W.; Ni, Y.-Q.; Wang, C.-F.; Yan, B.-G.; Guan, P.-X. Bayesian dynamic linear model framework for structural health monitoring data forecasting and missing data imputation during typhoon events. Struct. Health Monit. 2022, 21, 2933–2950. [Google Scholar] [CrossRef]
- Yan, B.; Li, Y.; Li, X.; Zhou, X.; Wei, M.; Yang, Q.; Zhou, X. Wind Tunnel Investigation of Twisted Wind Effect on a Typical Super-Tall Building. Buildings 2022, 12, 2260. [Google Scholar] [CrossRef]
- Wang, Q.; Zhang, B. Wind-Induced Responses and Wind Loads on a Super High-Rise Building with Various Cross-Sections and High Side Ratio—A Case Study. Buildings 2023, 13, 485. [Google Scholar] [CrossRef]
- Taniike, Y.; Inaoka, H. Aeroelastic behavior of tall buildings in wakes. J. Wind. Eng. Ind. Aerodyn. 1988, 28, 317–327. [Google Scholar] [CrossRef]
- Kim, W.; Tamura, Y.; Yoshida, A. Interference effects on aerodynamic wind forces between two buildings. J. Wind. Eng. Ind. Aerodyn. 2015, 147, 186–201. [Google Scholar] [CrossRef]
- Thepmongkorn, S.; Wood, G.; Kwok, K. Interference effects on wind-induced coupled motion of a tall building. J. Wind. Eng. Ind. Aerodyn. 2002, 90, 1807–1815. [Google Scholar] [CrossRef]
- Mara, T.; Terry, B.; Ho, T.; Isyumov, N. Aerodynamic and peak response interference factors for an upstream square building of identical height. J. Wind. Eng. Ind. Aerodyn. 2014, 133, 200–210. [Google Scholar] [CrossRef]
- Wijesooriya, K.; Mohotti, D.; Amin, A.; Chauhan, K. Wind loads on a super-tall slender structure: A validation of an uncoupled fluid-structure interaction (FSI) analysis. J. Build. Eng. 2020, 35, 102028. [Google Scholar] [CrossRef]
- Wan, J.-W.; Li, Q.-S.; Han, X.-L.; Xu, K. Investigation of structural responses and dynamic characteristics of a supertall building during Typhoon Kompasu. J. Wind. Eng. Ind. Aerodyn. 2022, 230, 105209. [Google Scholar] [CrossRef]
- Huang, D.; Wu, T.; He, S. Experimental investigation of vortex-induced aeroelastic effects on a square cylinder in uniform flow. Wind. Struct. 2020, 30, 37–54. [Google Scholar]
- Ke, S.; Ge, Y. The influence of self-excited forces on wind loads and wind effects for super-large cooling towers. J. Wind. Eng. Ind. Aerodyn. 2014, 132, 125–135. [Google Scholar] [CrossRef]
- Huang, G.; Chen, X. Wind load effects and equivalent static wind loads of tall buildings based on synchronous pressure measurements. Eng. Struct. 2007, 29, 2641–2653. [Google Scholar] [CrossRef]
- He, Y.; Cheung, J.; Li, Q.; Fu, J. Accurate determination of reference wind speed and reference static pressure in wind tunnel tests. Adv. Struct. Eng. 2020, 23, 578–583. [Google Scholar] [CrossRef]
- Shao, J.; Liu, J.; Zhao, J. Evaluation of various non-linear k–ɛ models for predicting wind flow around an isolated high-rise building within the surface boundary layer. Build. Environ. 2012, 57, 145–155. [Google Scholar] [CrossRef]
- Huang, D.; Zhu, L.; Ding, Q.; Zhu, X.; Chen, W. Aeroelastic and aerodynamic interference effects on a high-rise building. J. Fluids Struct. 2017, 69, 355–381. [Google Scholar]
- Rizzo, F. Investigation of the Time Dependence of Wind-Induced Aeroelastic Response on a Scale Model of a High-Rise Building. Appl. Sci. 2021, 11, 3315. [Google Scholar] [CrossRef]
- Su, N.; Li, Z.; Peng, S.; Uematsu, Y. Interference effects on aeroelastic responses and design wind loads of twin high-rise reinforced concrete chimneys. Eng. Struct. 2021, 233, 111925. [Google Scholar] [CrossRef]
- GB 50009-2019; Load Code for the Design of Building Structures. China Architecture & Building Press: Beijing, China, 2019.
- Huang, D.; Zhu, L.; Ren, W.; Ding, Q. A harmonic piecewise linearisation-wavelet transforms method for identification of non-linear vibration “black box” systems: Application in wind-induced vibration of a high-rise building. J. Fluids Struct. 2018, 78, 239–262. [Google Scholar] [CrossRef]
Figure 1.
Direction of wind-induced vibration of super-tall buildings.
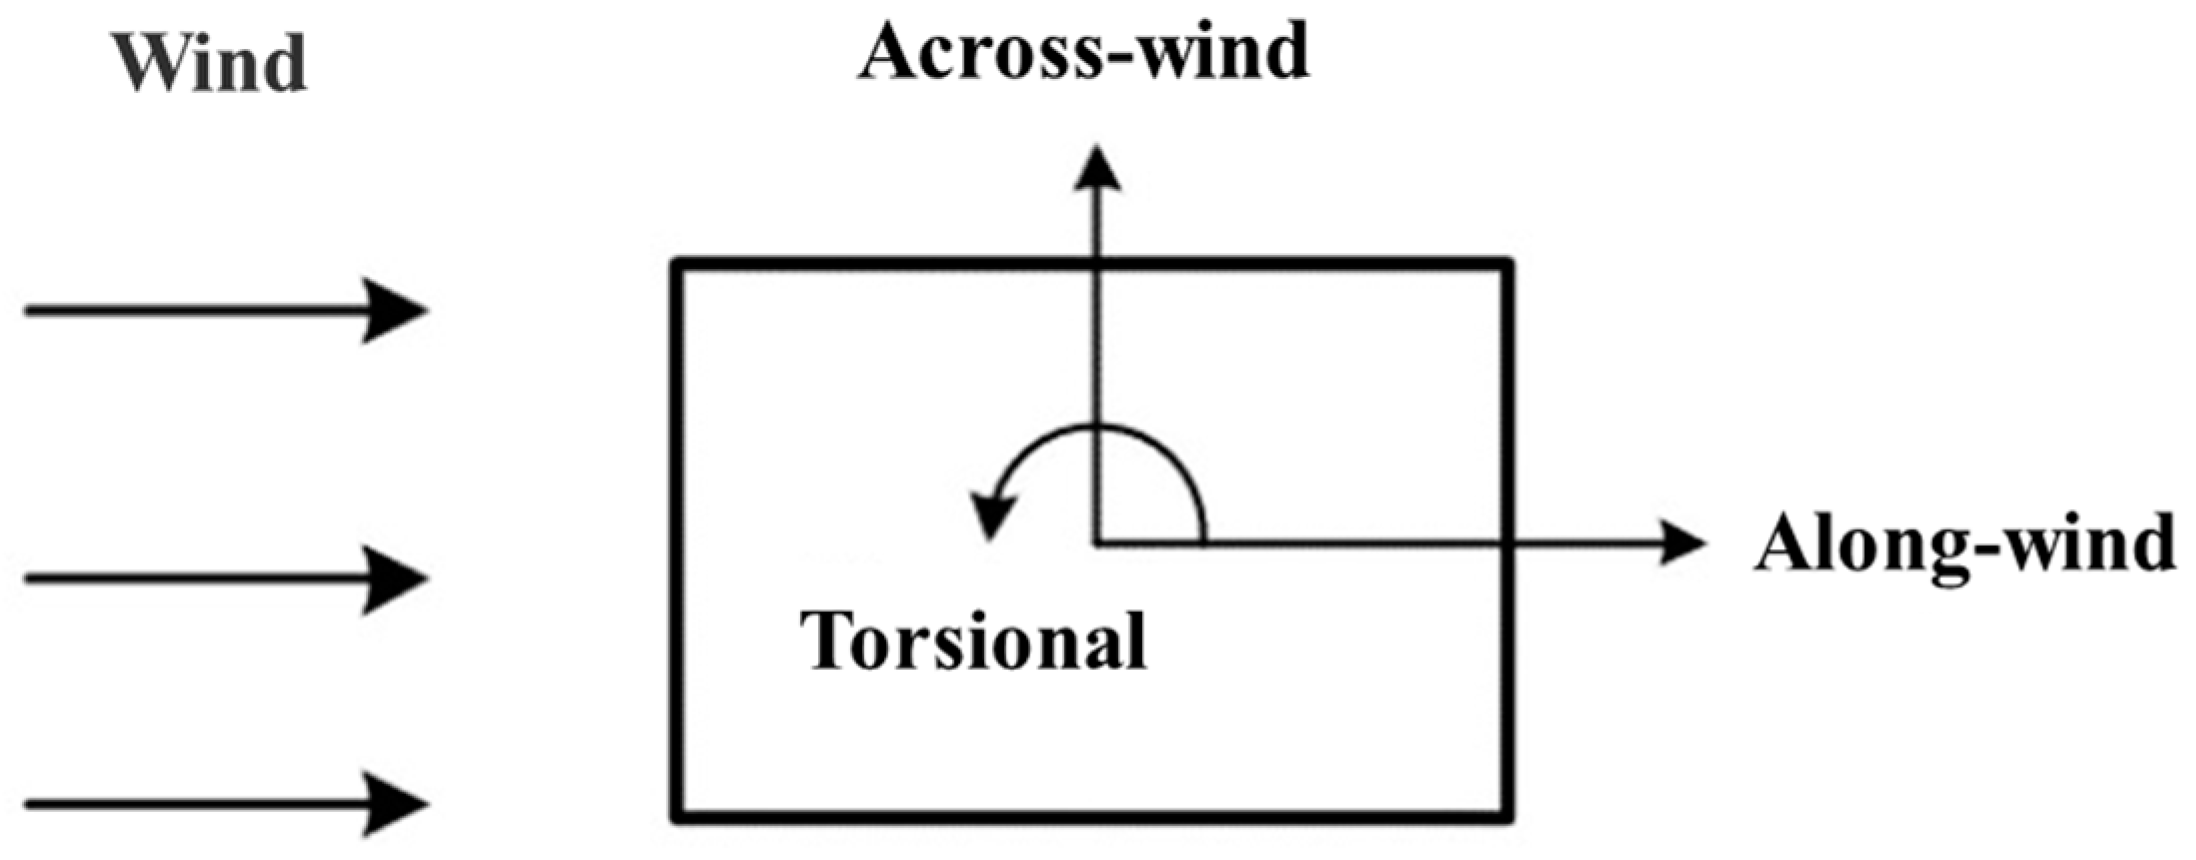
Figure 2.
Wind tunnel testing model.
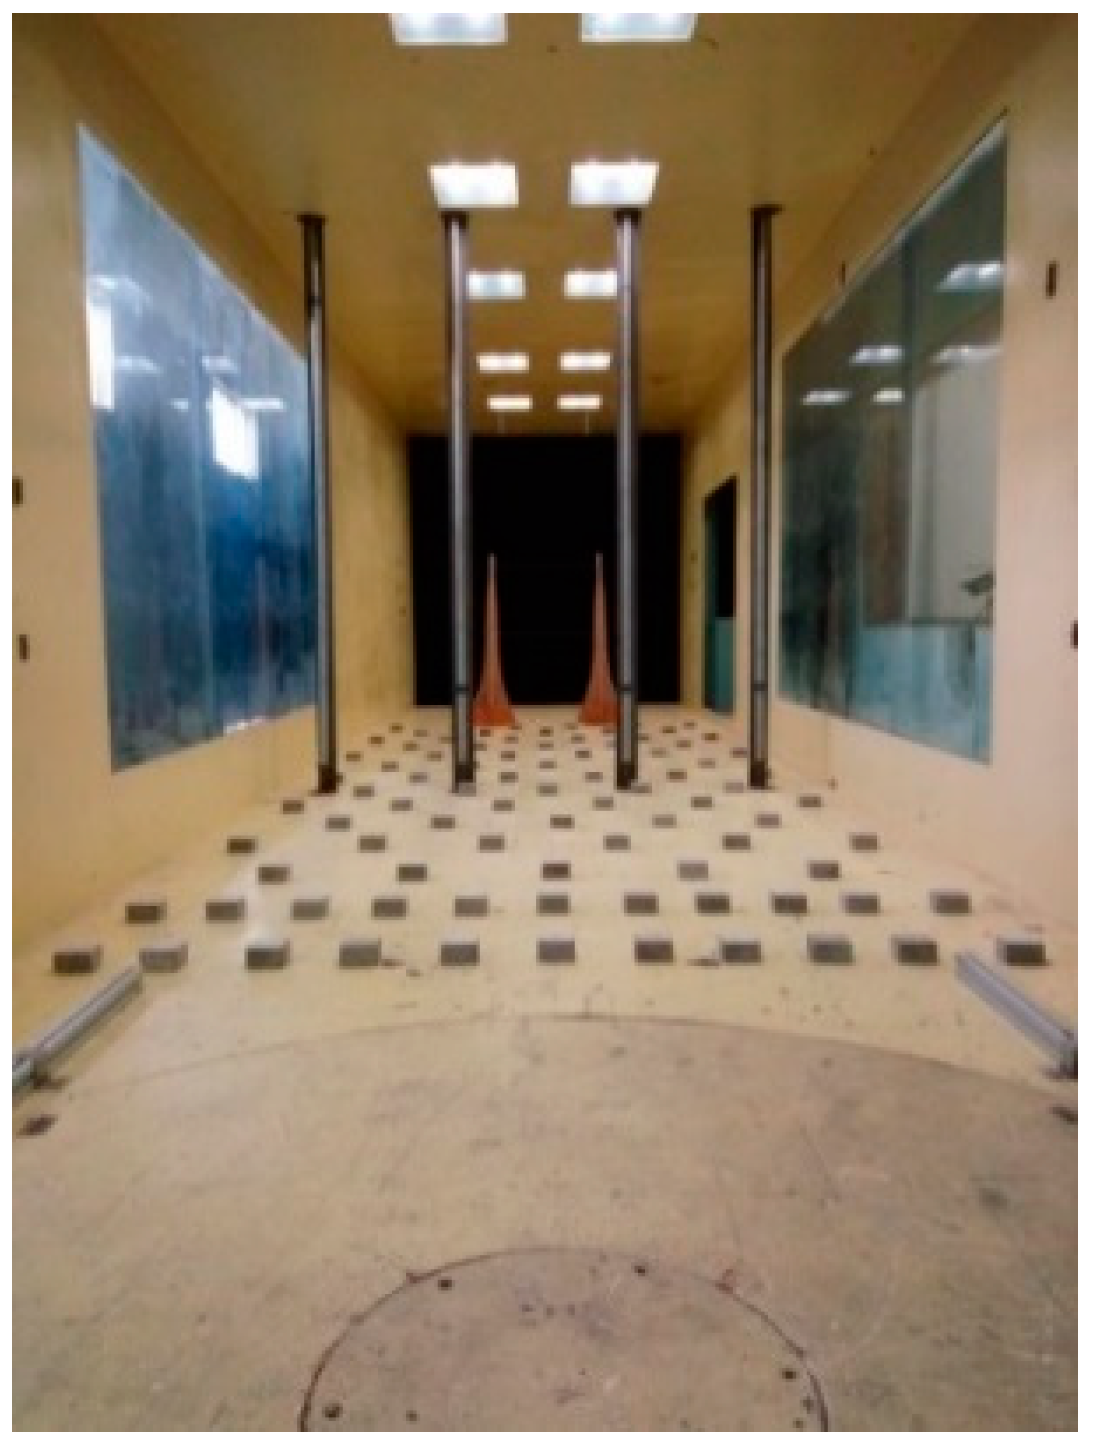
Figure 3.
Turbulent wind field simulation parameters.
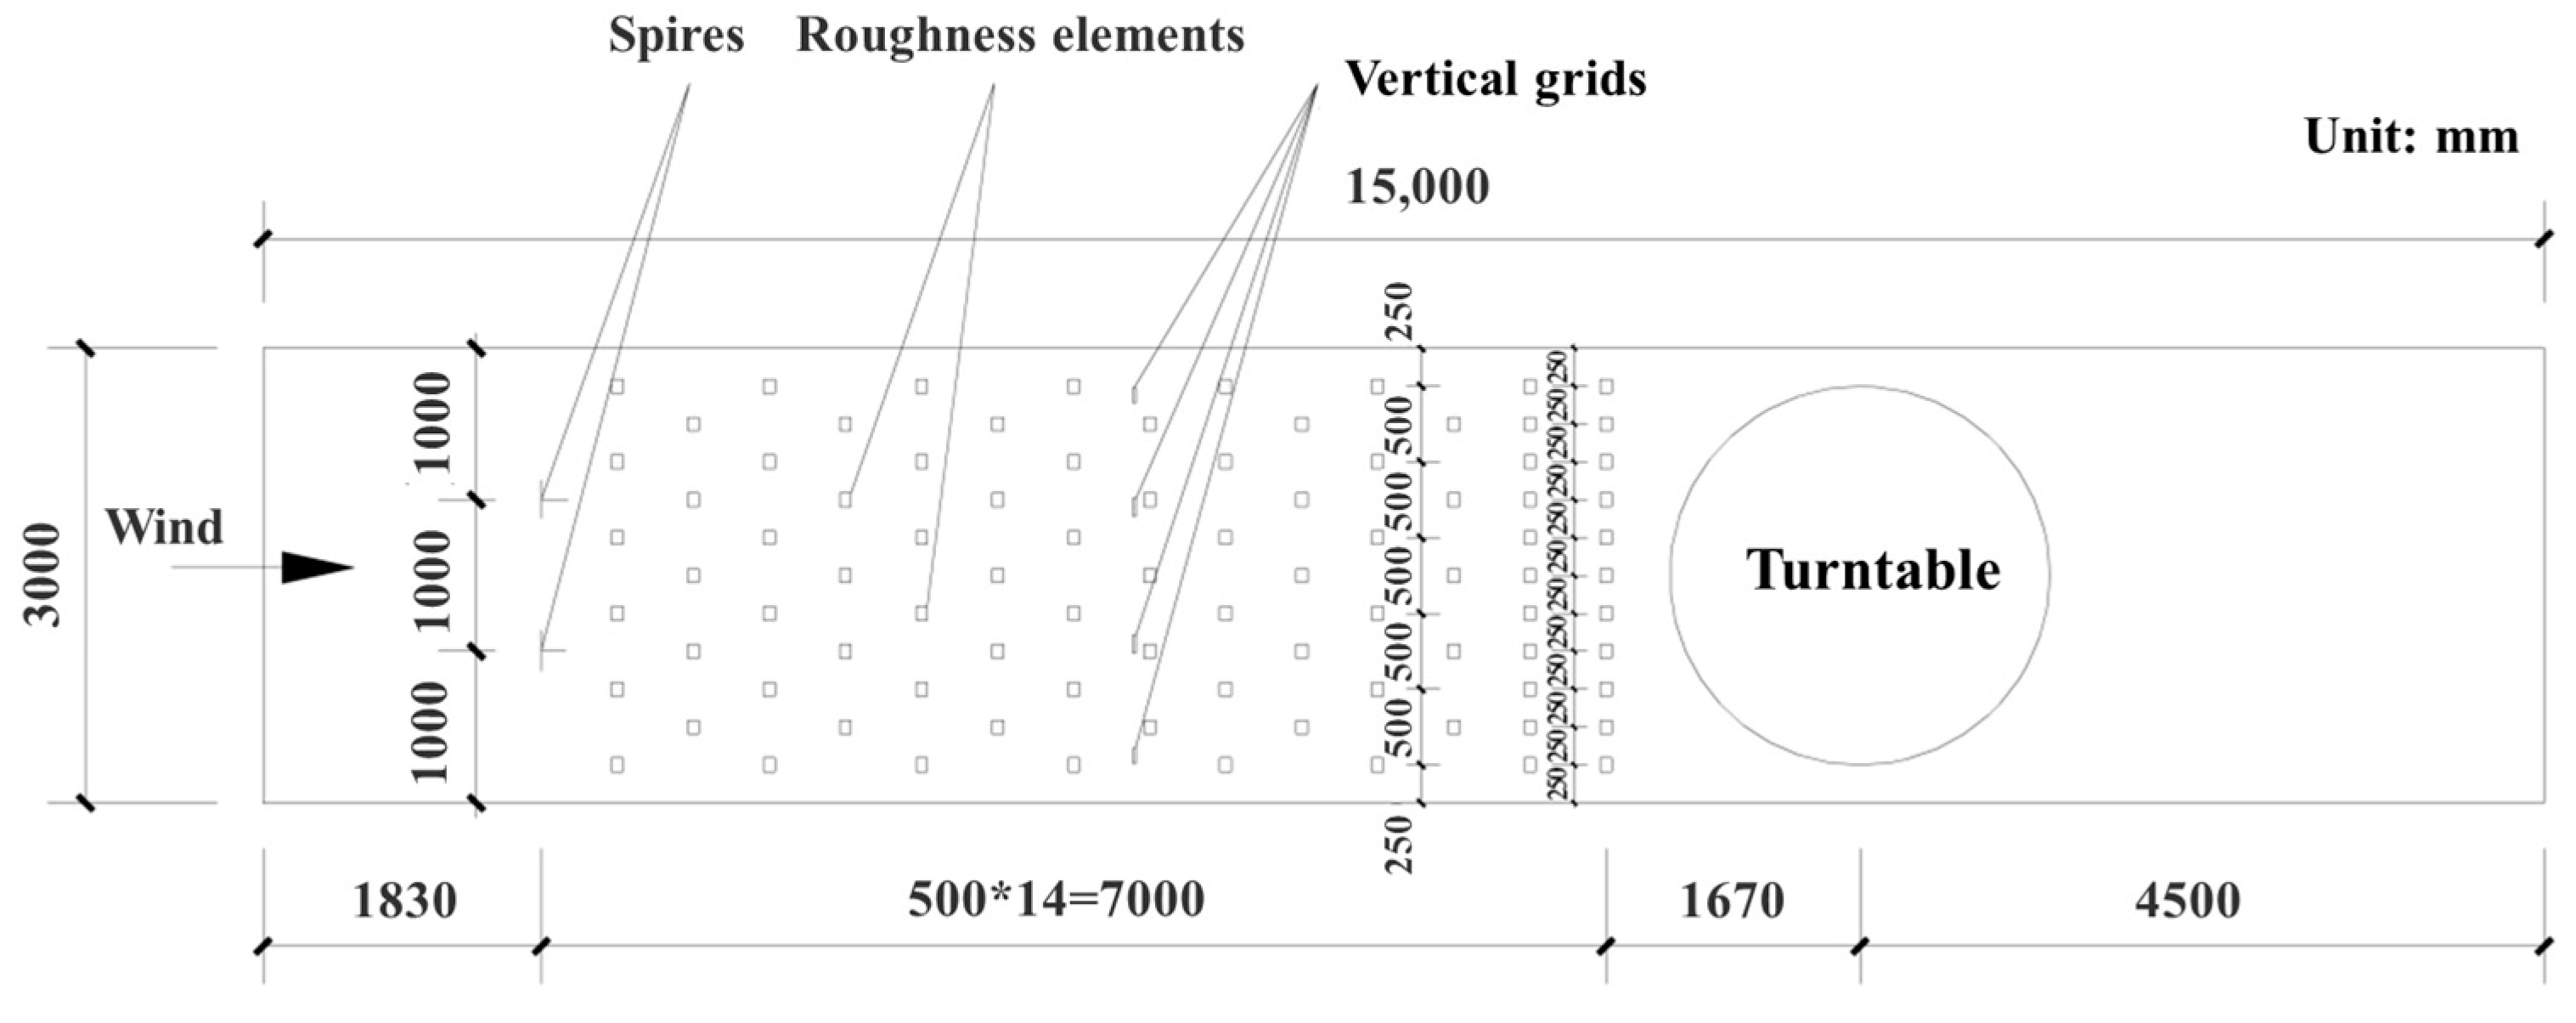
Figure 4.
Mean wind velocity and turbulence intensity profile. (a) Wind velocity; (b) Along-wind direction turbulence intensity.
Figure 4.
Mean wind velocity and turbulence intensity profile. (a) Wind velocity; (b) Along-wind direction turbulence intensity.

Figure 5.
Comparison of turbulent wind velocity spectra. (a) Along-wind direction; (b) Across-wind direction.
Figure 5.
Comparison of turbulent wind velocity spectra. (a) Along-wind direction; (b) Across-wind direction.
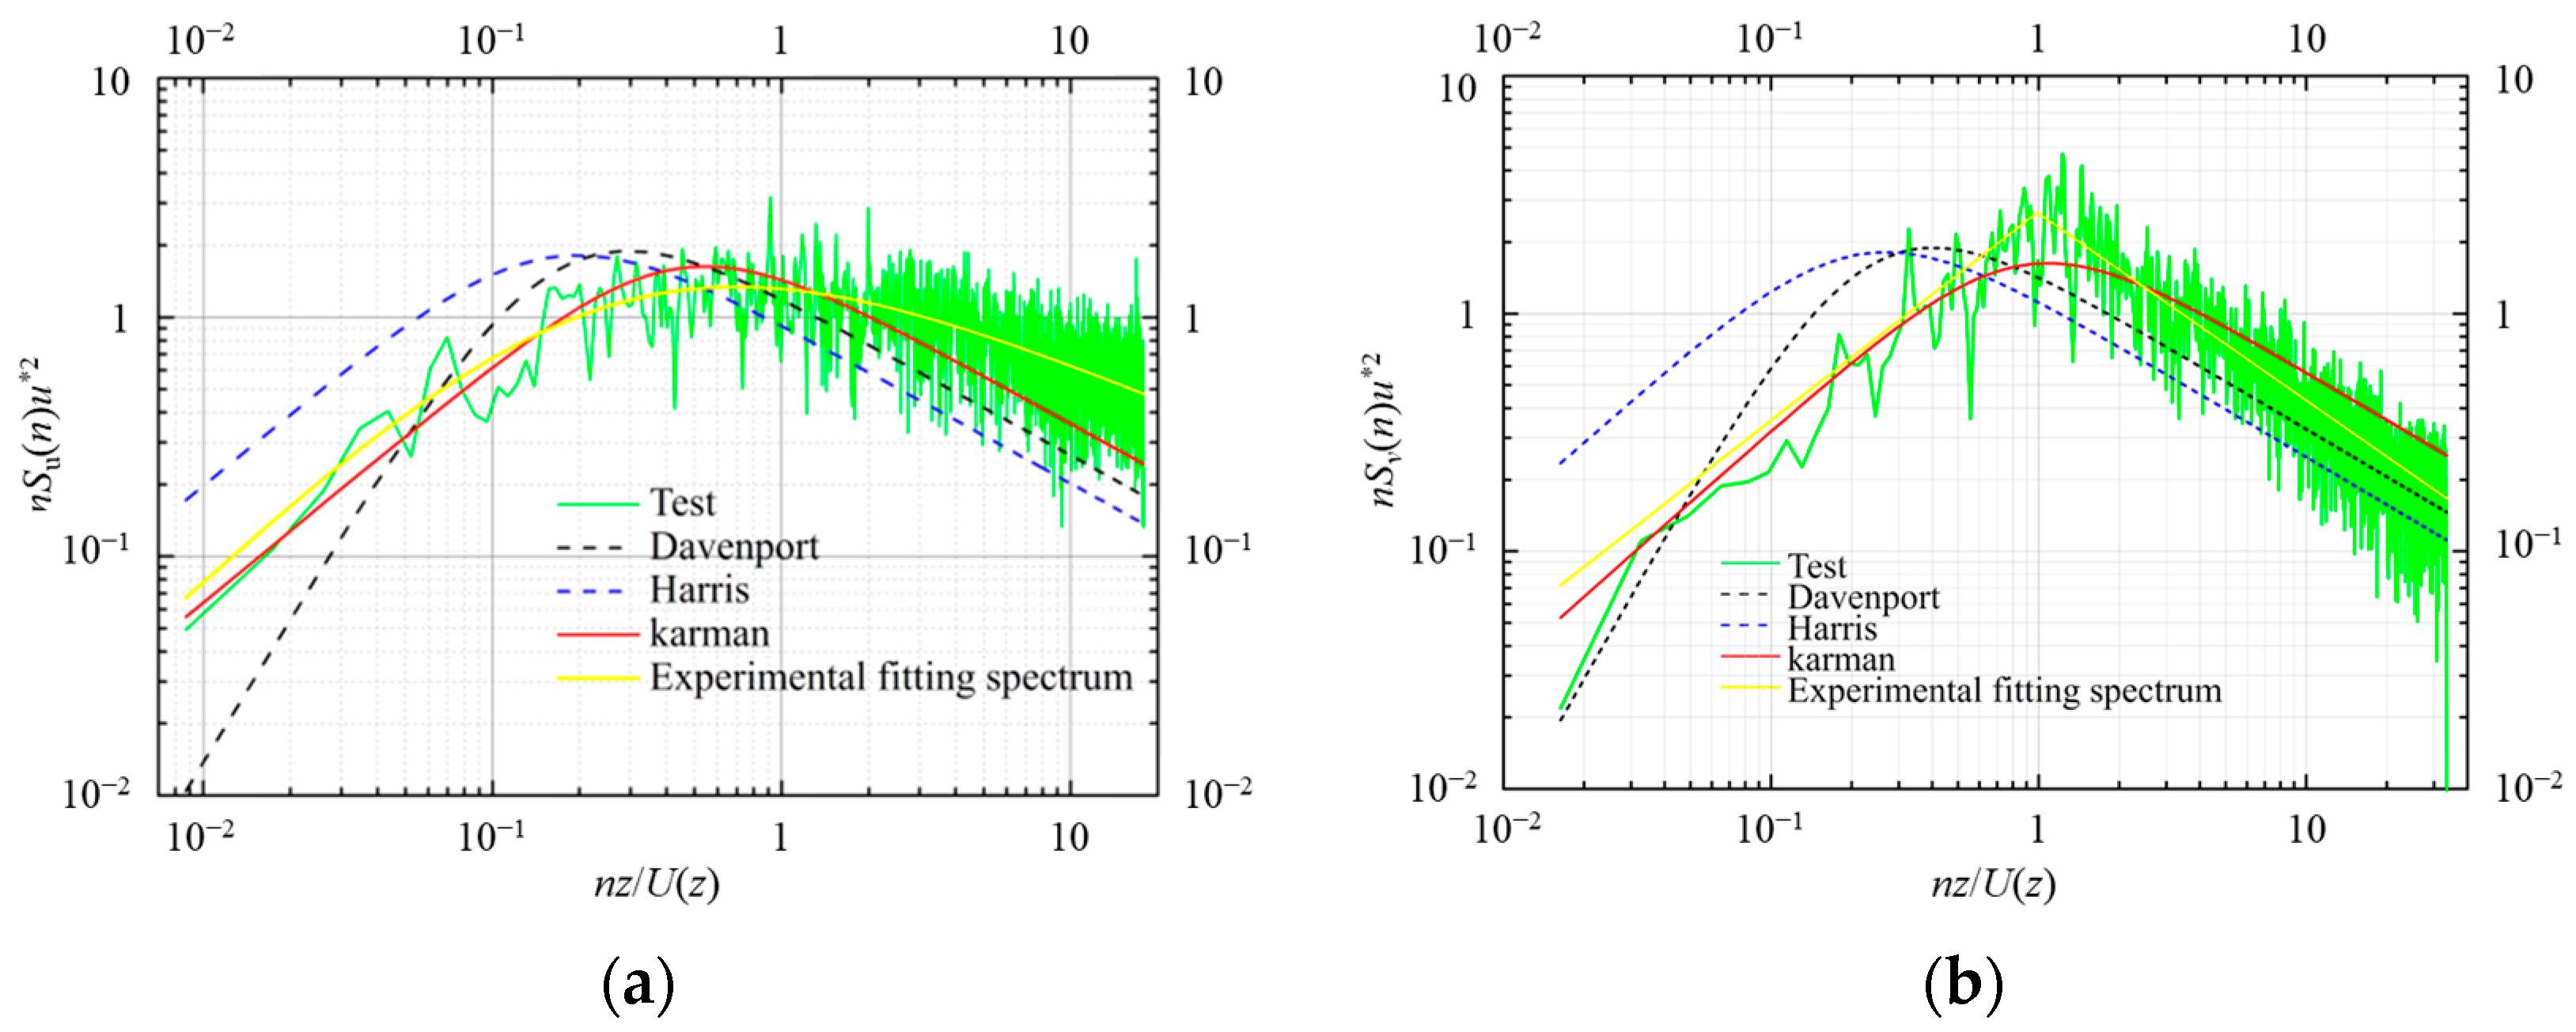
Figure 6.
Measurement equipment. (a) Dynamic multi-hole pressure probe; (b) Electronic-scanned pressure sensor; (c) Laser distance sensor.
Figure 6.
Measurement equipment. (a) Dynamic multi-hole pressure probe; (b) Electronic-scanned pressure sensor; (c) Laser distance sensor.
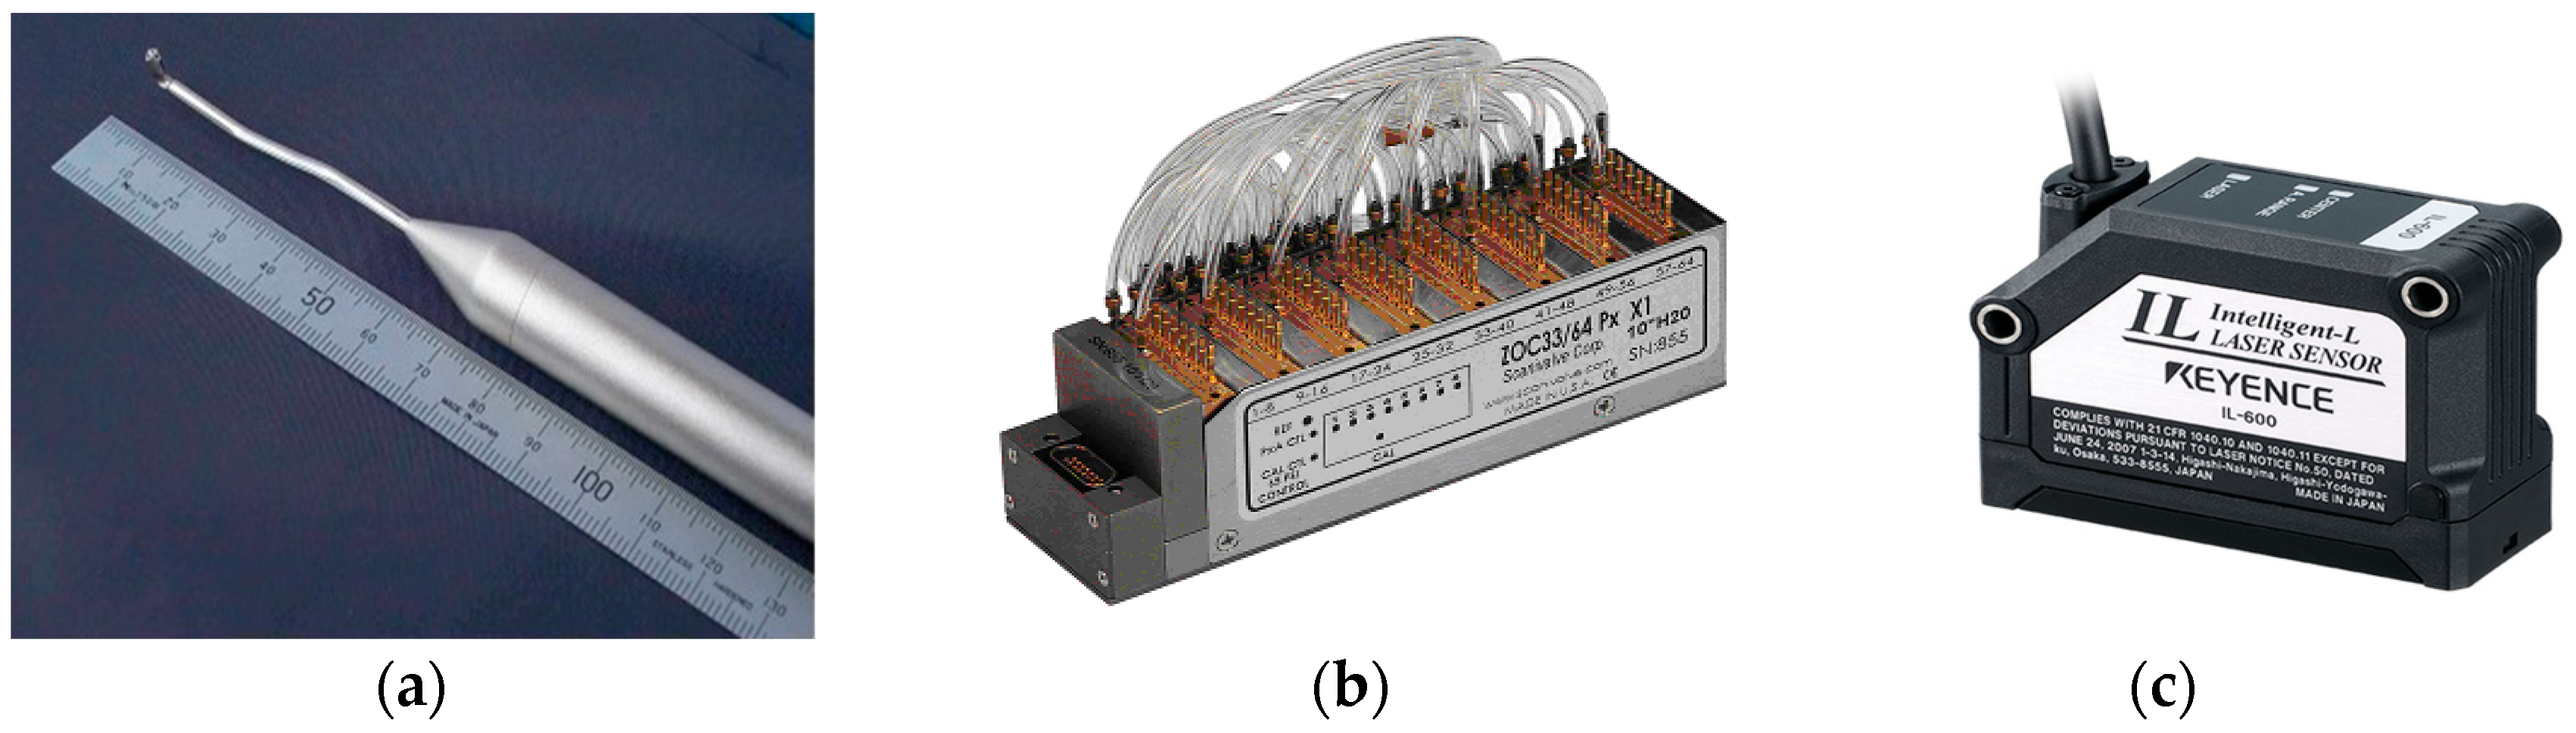
Figure 7.
Measurement point arrangement of the aeroelastic model. (a) Structure diagram; (b) Lateral measuring points at different heights; (c) Profile measuring points.
Figure 7.
Measurement point arrangement of the aeroelastic model. (a) Structure diagram; (b) Lateral measuring points at different heights; (c) Profile measuring points.
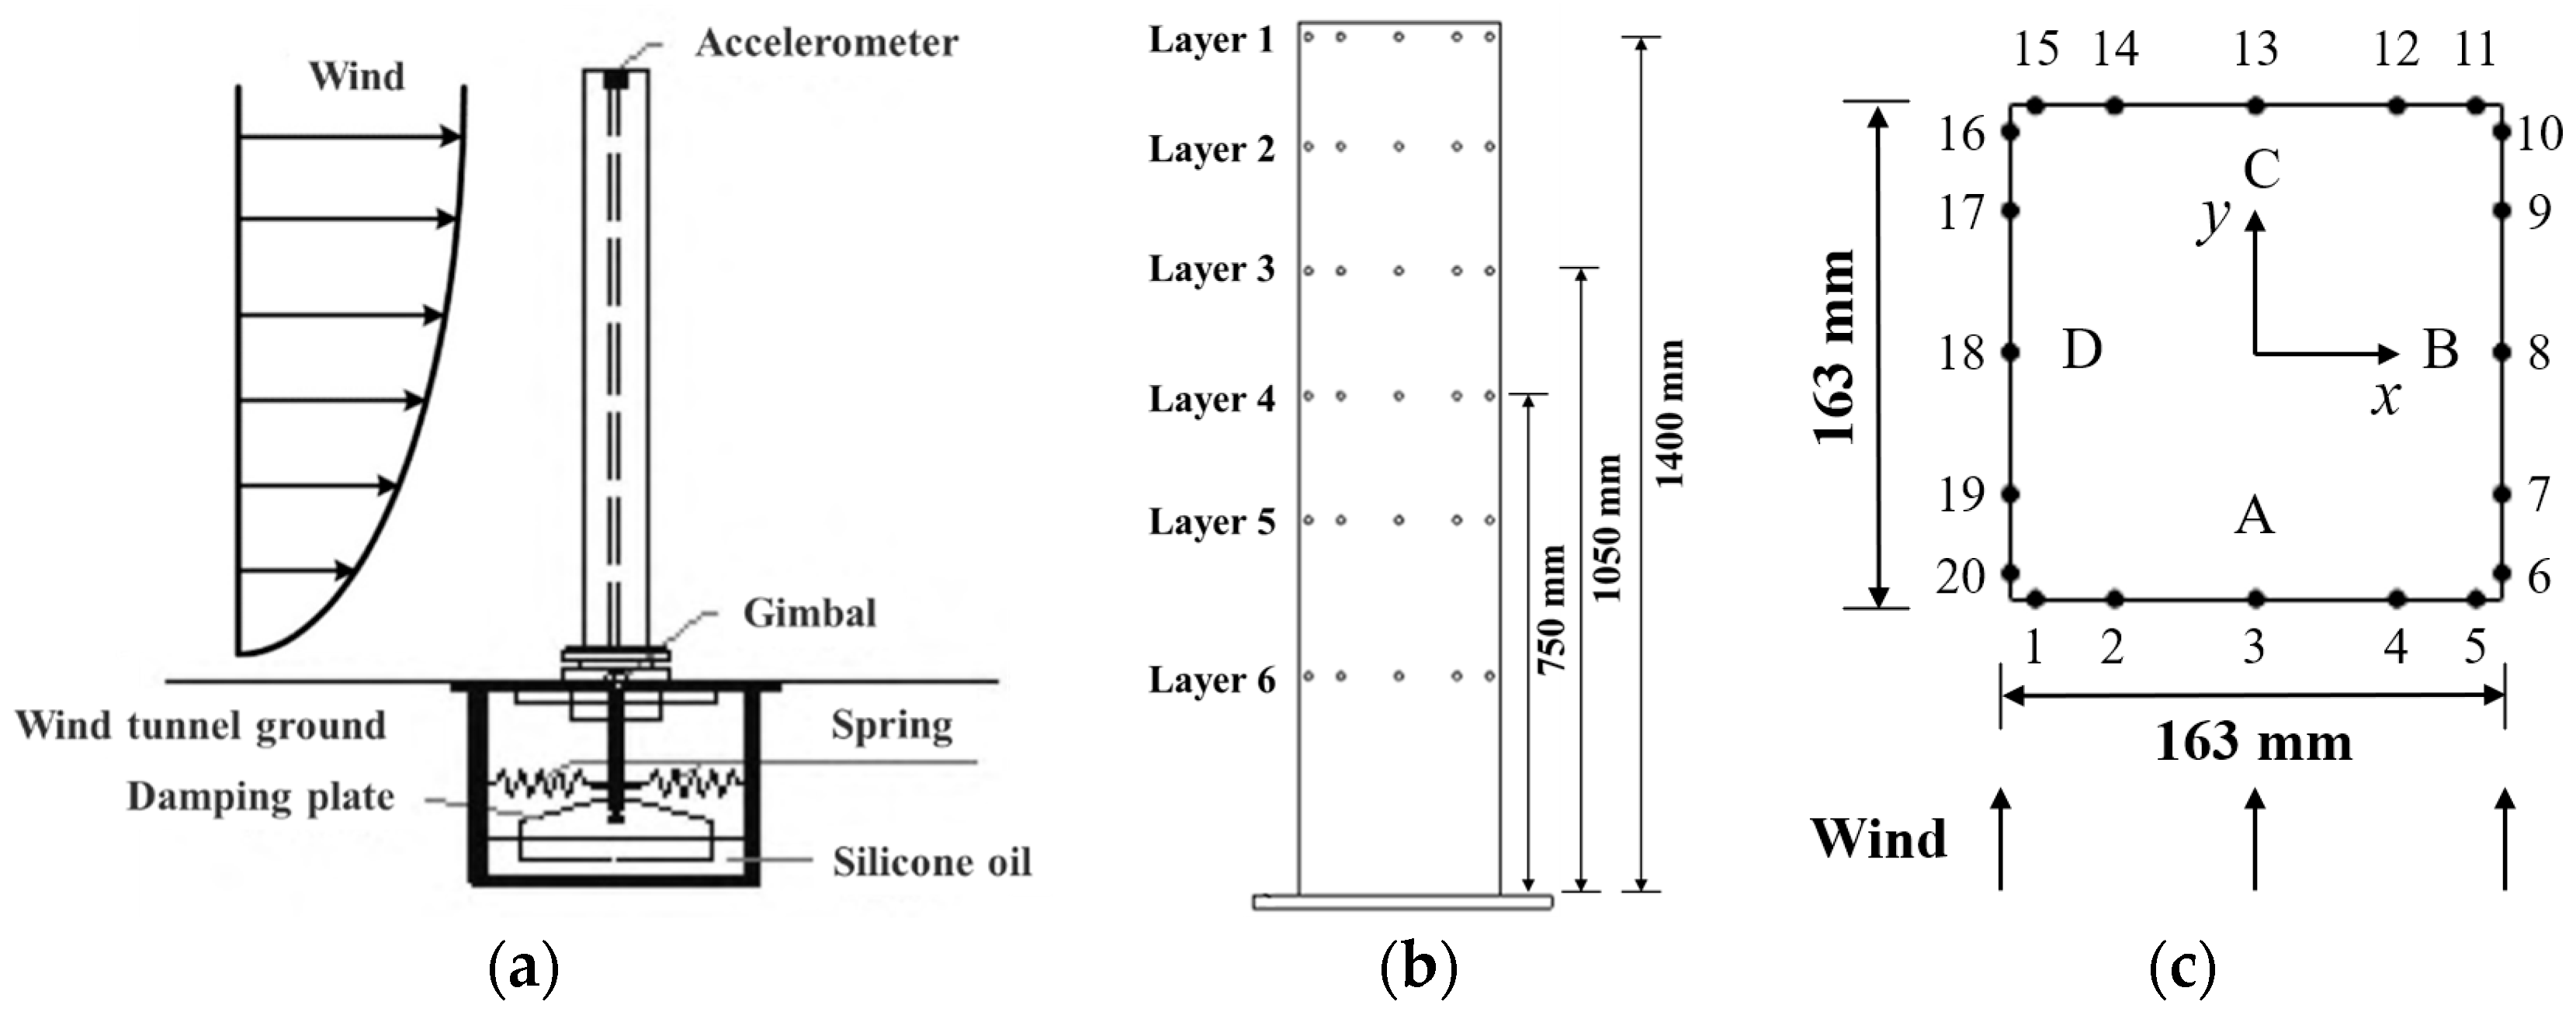
Figure 8.
Mean displacement and torsion under different wind attack angles in a uniform wind field. (a) Displacement in y direction; (b) Displacement in x direction; (c) Torsion moment.
Figure 8.
Mean displacement and torsion under different wind attack angles in a uniform wind field. (a) Displacement in y direction; (b) Displacement in x direction; (c) Torsion moment.
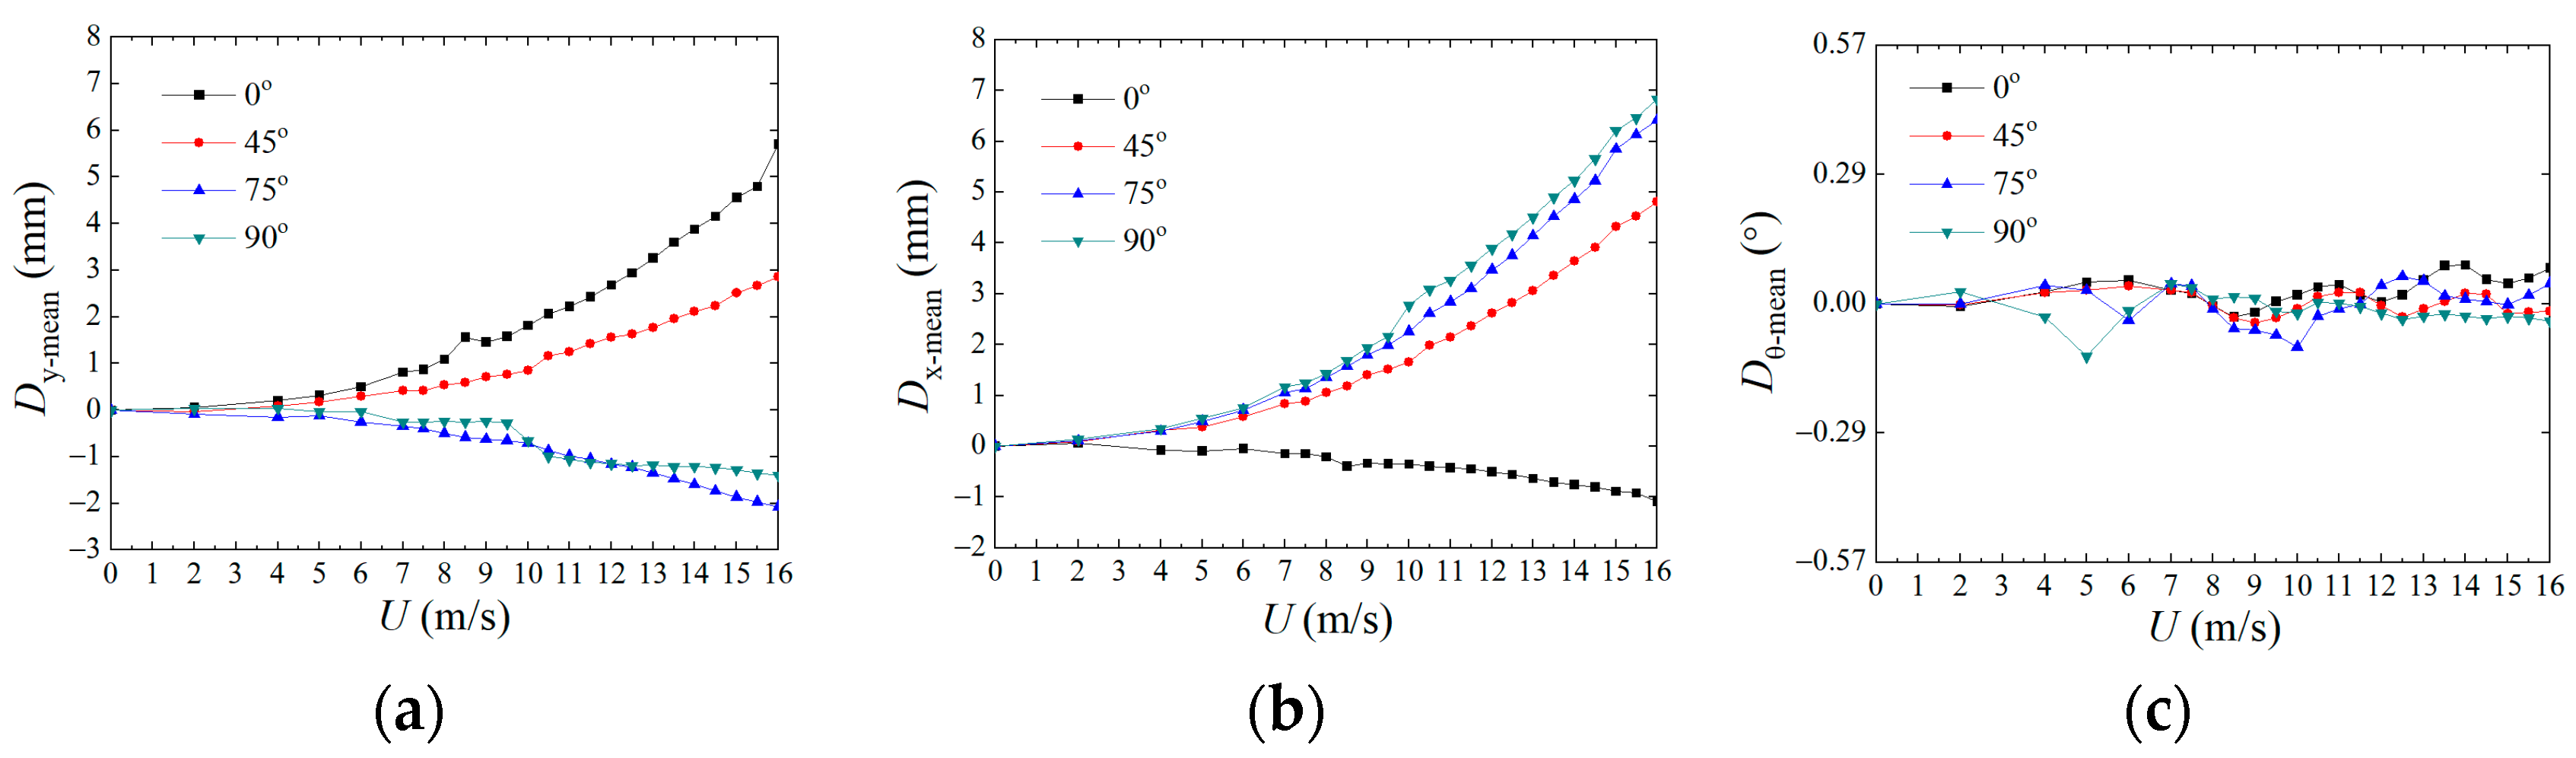
Figure 9.
Mean displacement and torsion under different wind attack angles in a turbulent wind field. (a) Displacement in y direction; (b) Displacement in x direction; (c) Torsion moment.
Figure 9.
Mean displacement and torsion under different wind attack angles in a turbulent wind field. (a) Displacement in y direction; (b) Displacement in x direction; (c) Torsion moment.
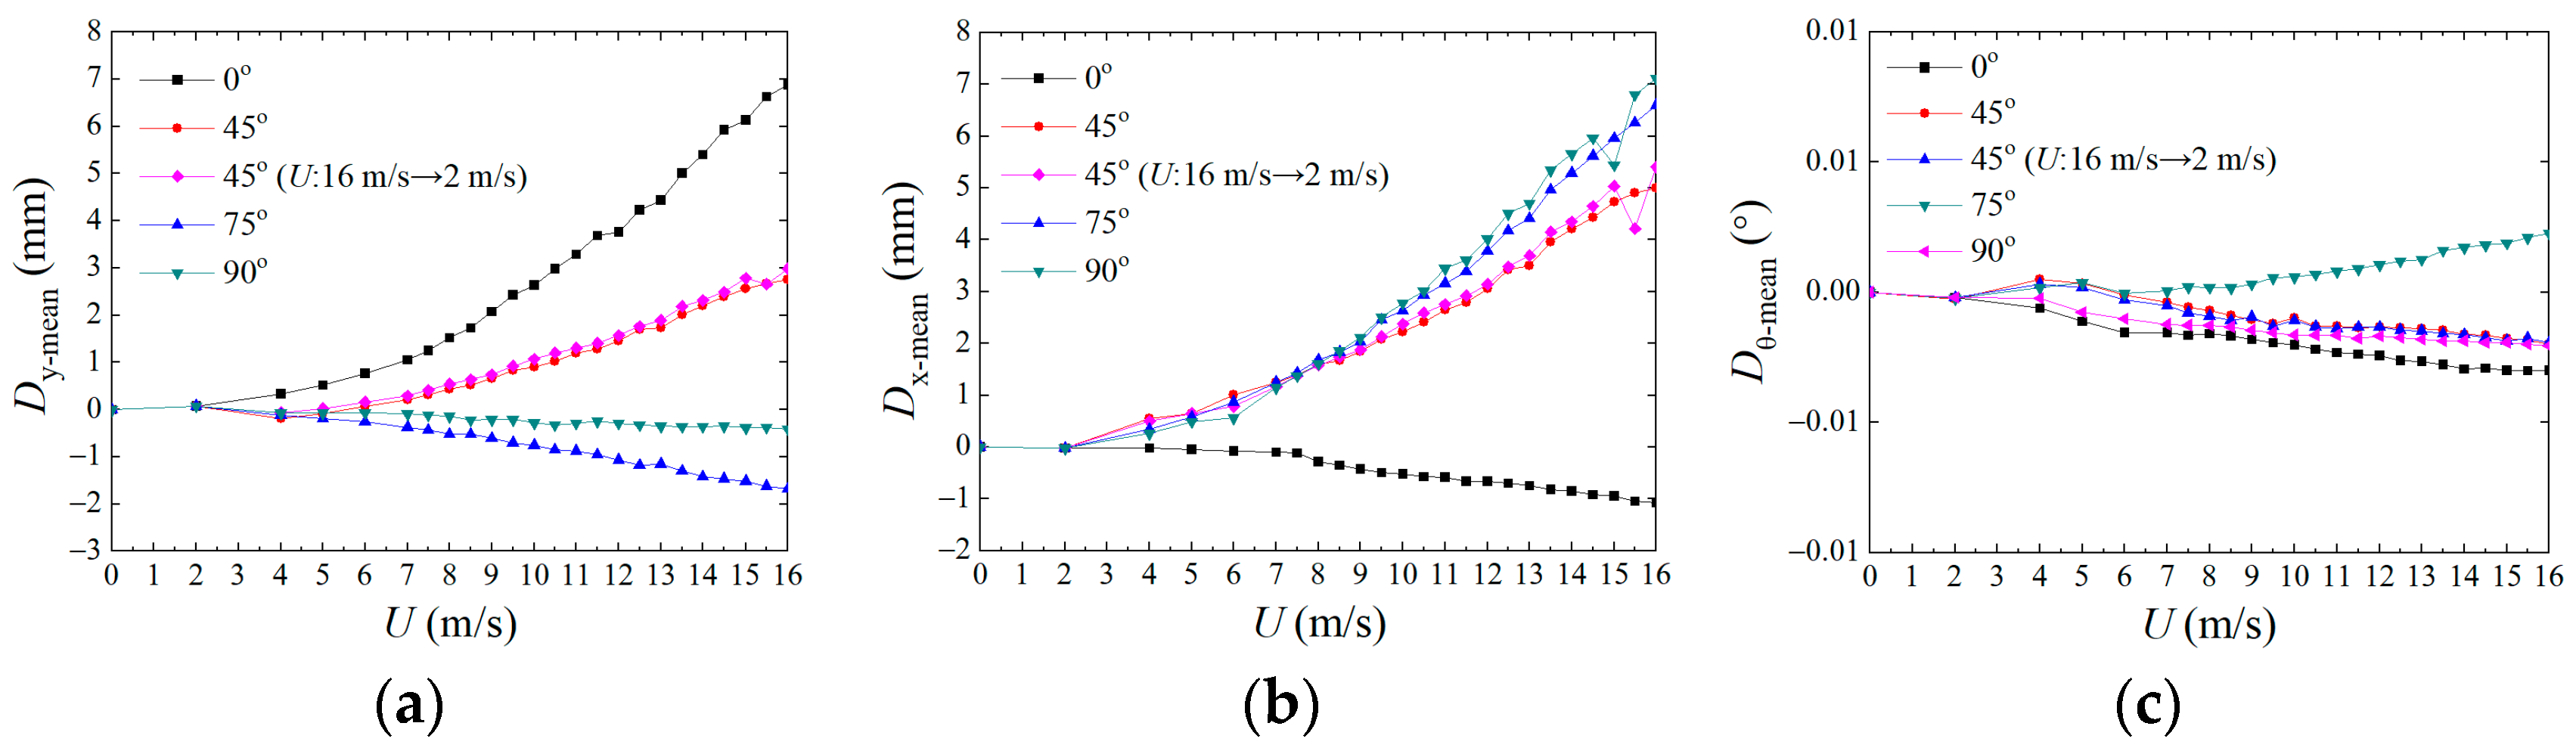
Figure 10.
The response of fluctuating displacement under different wind attack angles in a uniform wind field. (a) Displacement in y direction; (b) Displacement in x direction; (c) Torsion moment.
Figure 10.
The response of fluctuating displacement under different wind attack angles in a uniform wind field. (a) Displacement in y direction; (b) Displacement in x direction; (c) Torsion moment.

Figure 11.
The response of fluctuating displacement under different wind attack angles in a turbulent wind field. (a) Displacement in y direction; (b) Displacement in x direction; (c) Torsion moment.
Figure 11.
The response of fluctuating displacement under different wind attack angles in a turbulent wind field. (a) Displacement in y direction; (b) Displacement in x direction; (c) Torsion moment.
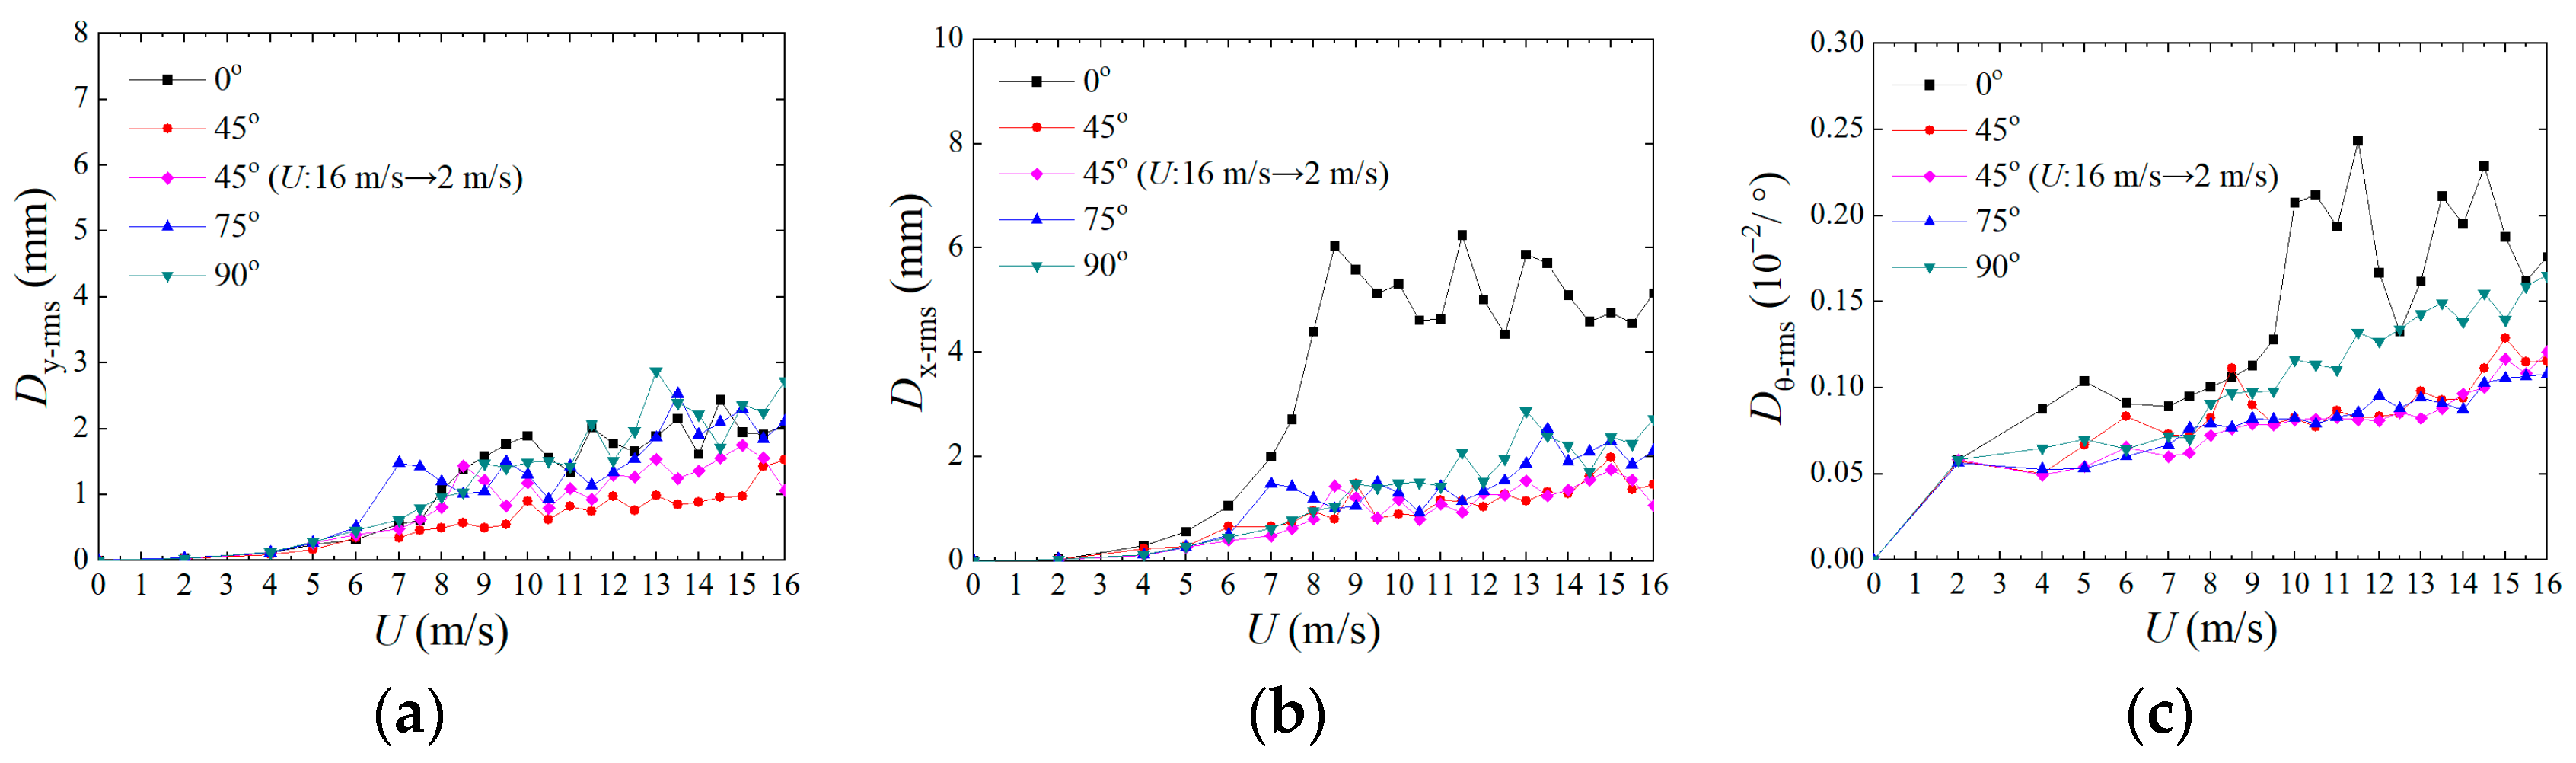
Figure 12.
Comparison of fluctuating displacement response spectra under two different wind fields (U = 8.5 m/s). (a) Across-wind direction; (b) Along-wind direction; (c) Torsion moment direction.
Figure 12.
Comparison of fluctuating displacement response spectra under two different wind fields (U = 8.5 m/s). (a) Across-wind direction; (b) Along-wind direction; (c) Torsion moment direction.
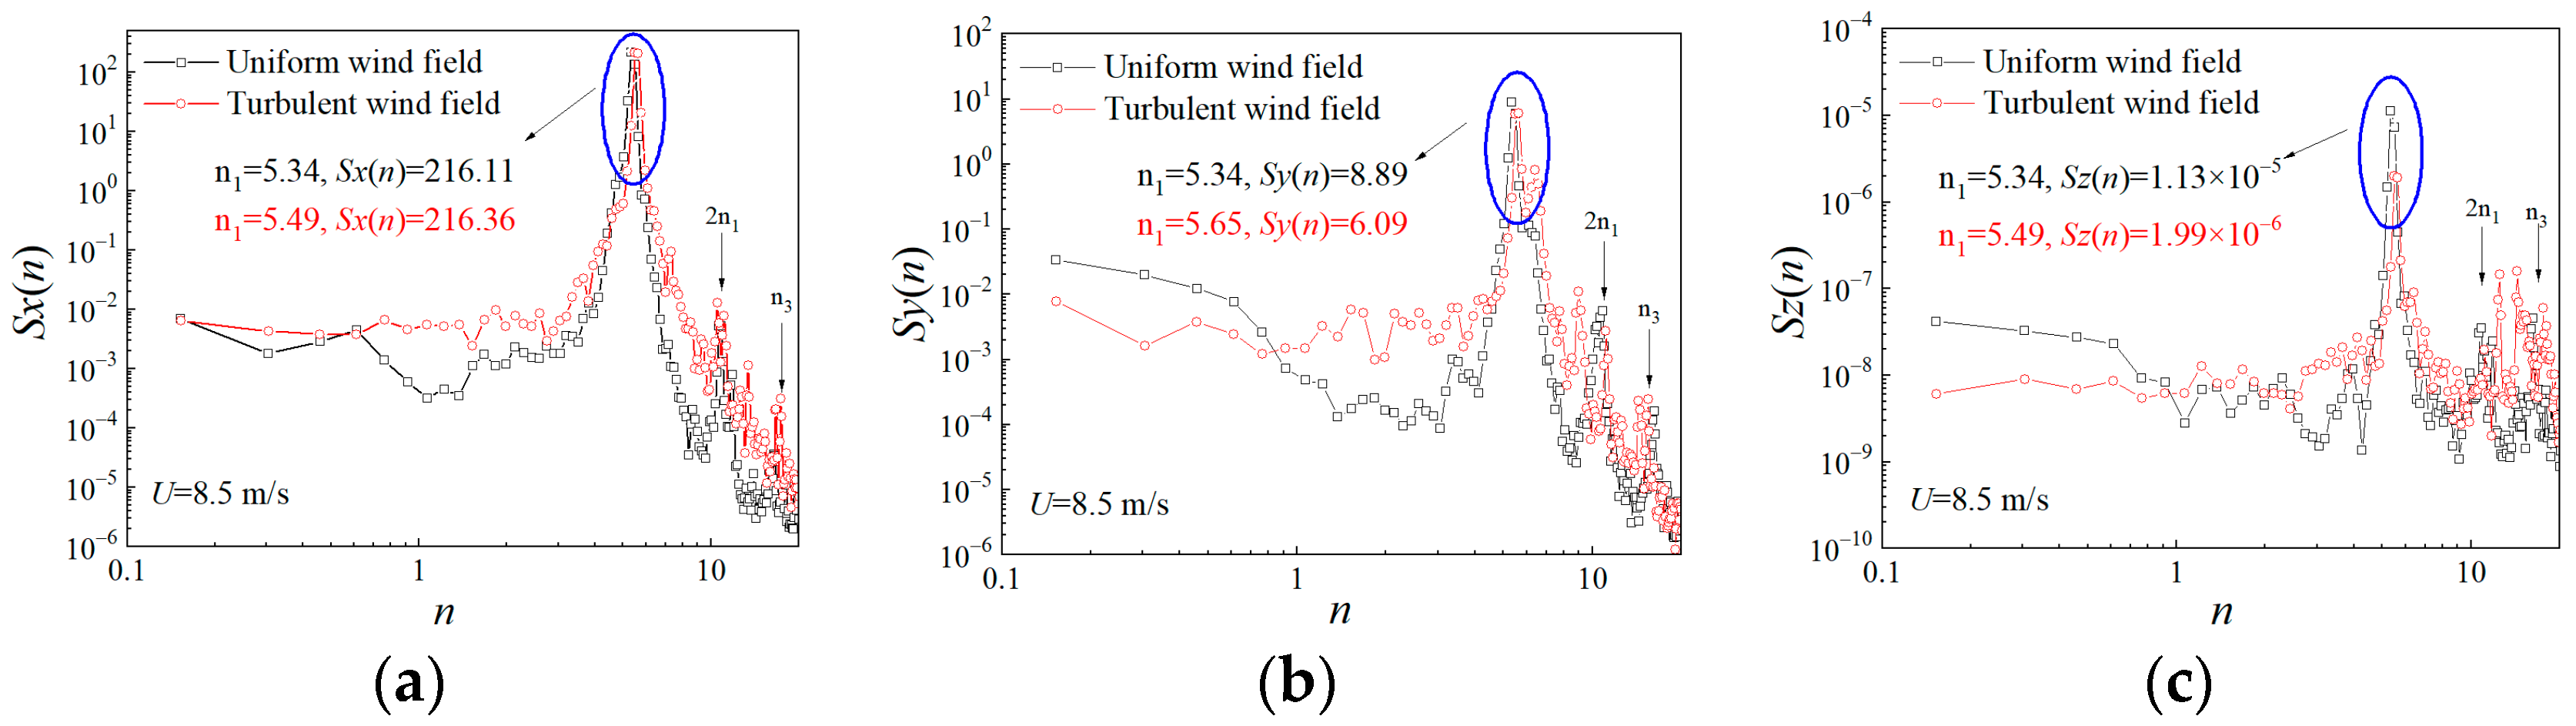
Figure 13.
Comparison of fluctuating displacement response spectra under two different wind fields (U = 10 m/s). (a) Across-wind direction; (b) Along-wind direction; (c) Torsion moment direction.
Figure 13.
Comparison of fluctuating displacement response spectra under two different wind fields (U = 10 m/s). (a) Across-wind direction; (b) Along-wind direction; (c) Torsion moment direction.

Figure 14.
Mean wind pressure coefficient at different wind velocities in a uniform wind field. (a) U = 6 m/s; (b) U = 8.5 m/s; (c) U = 10 m/s.
Figure 14.
Mean wind pressure coefficient at different wind velocities in a uniform wind field. (a) U = 6 m/s; (b) U = 8.5 m/s; (c) U = 10 m/s.
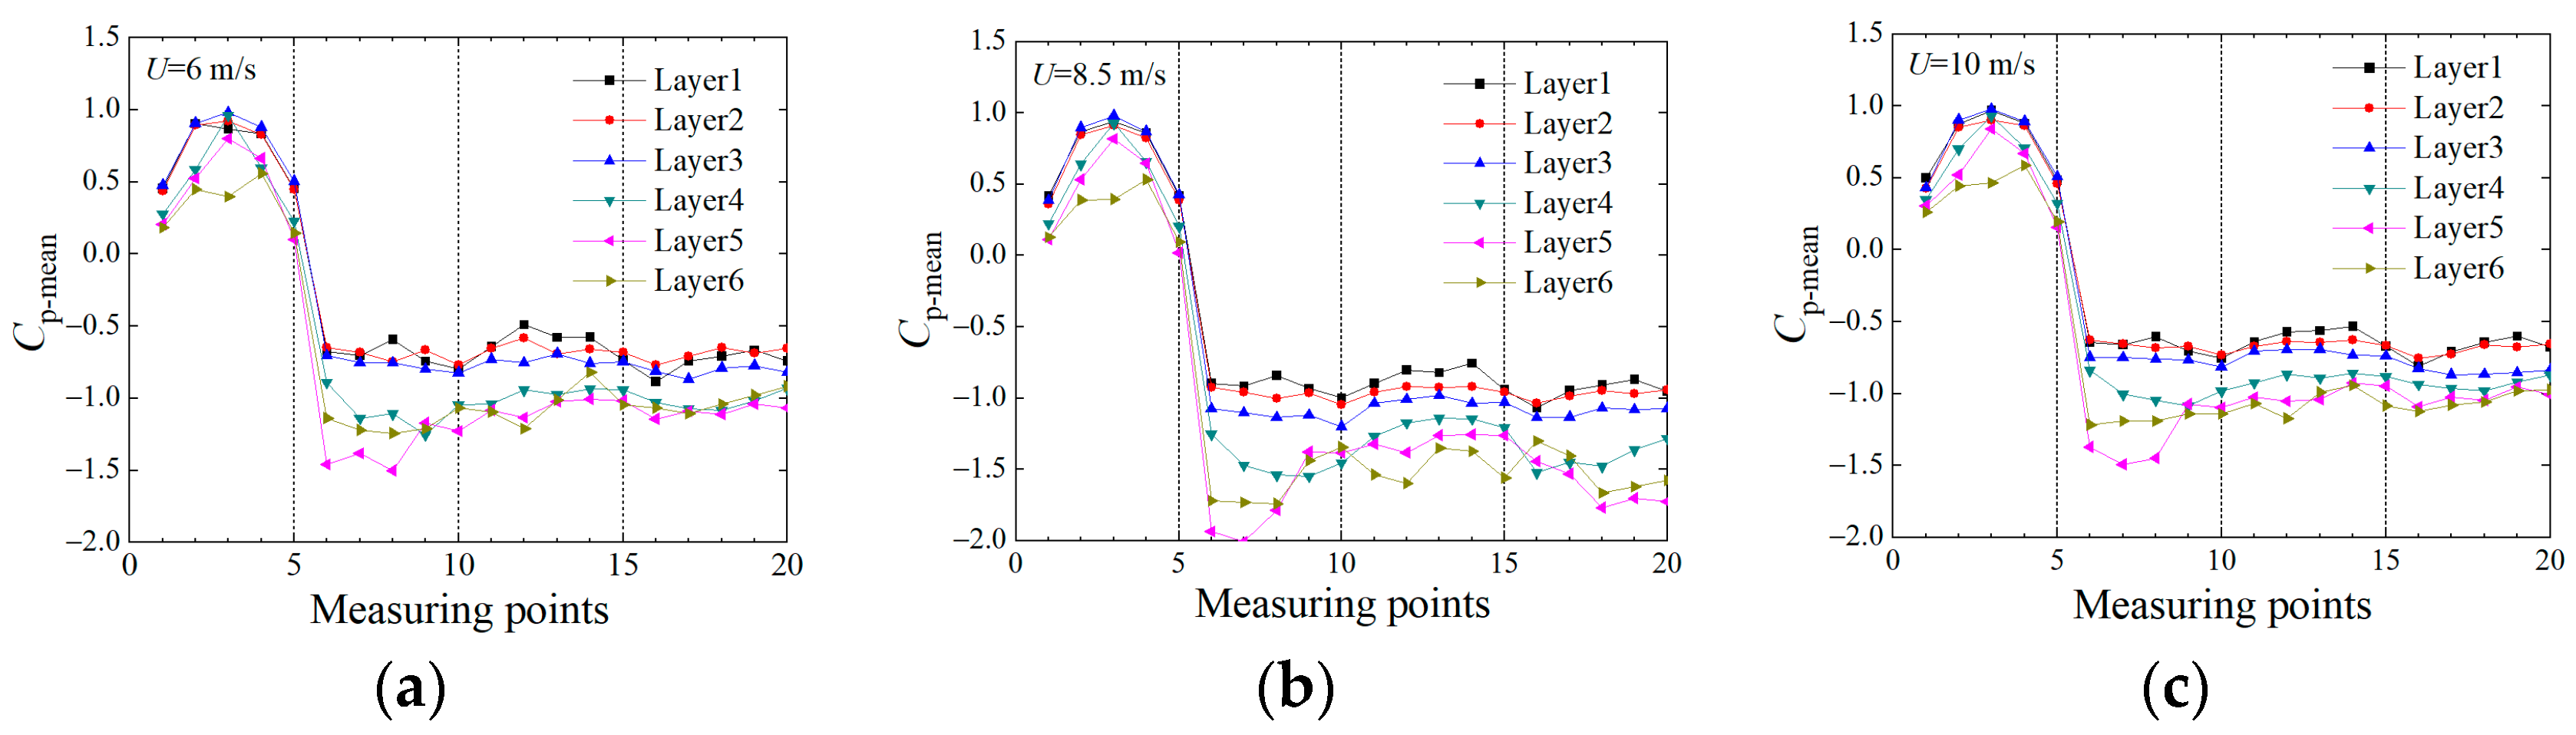
Figure 15.
Mean wind pressure coefficient at different wind velocities in a turbulent wind field. (a) U = 6 m/s; (b) U = 8.5 m/s; (c) U = 10 m/s.
Figure 15.
Mean wind pressure coefficient at different wind velocities in a turbulent wind field. (a) U = 6 m/s; (b) U = 8.5 m/s; (c) U = 10 m/s.
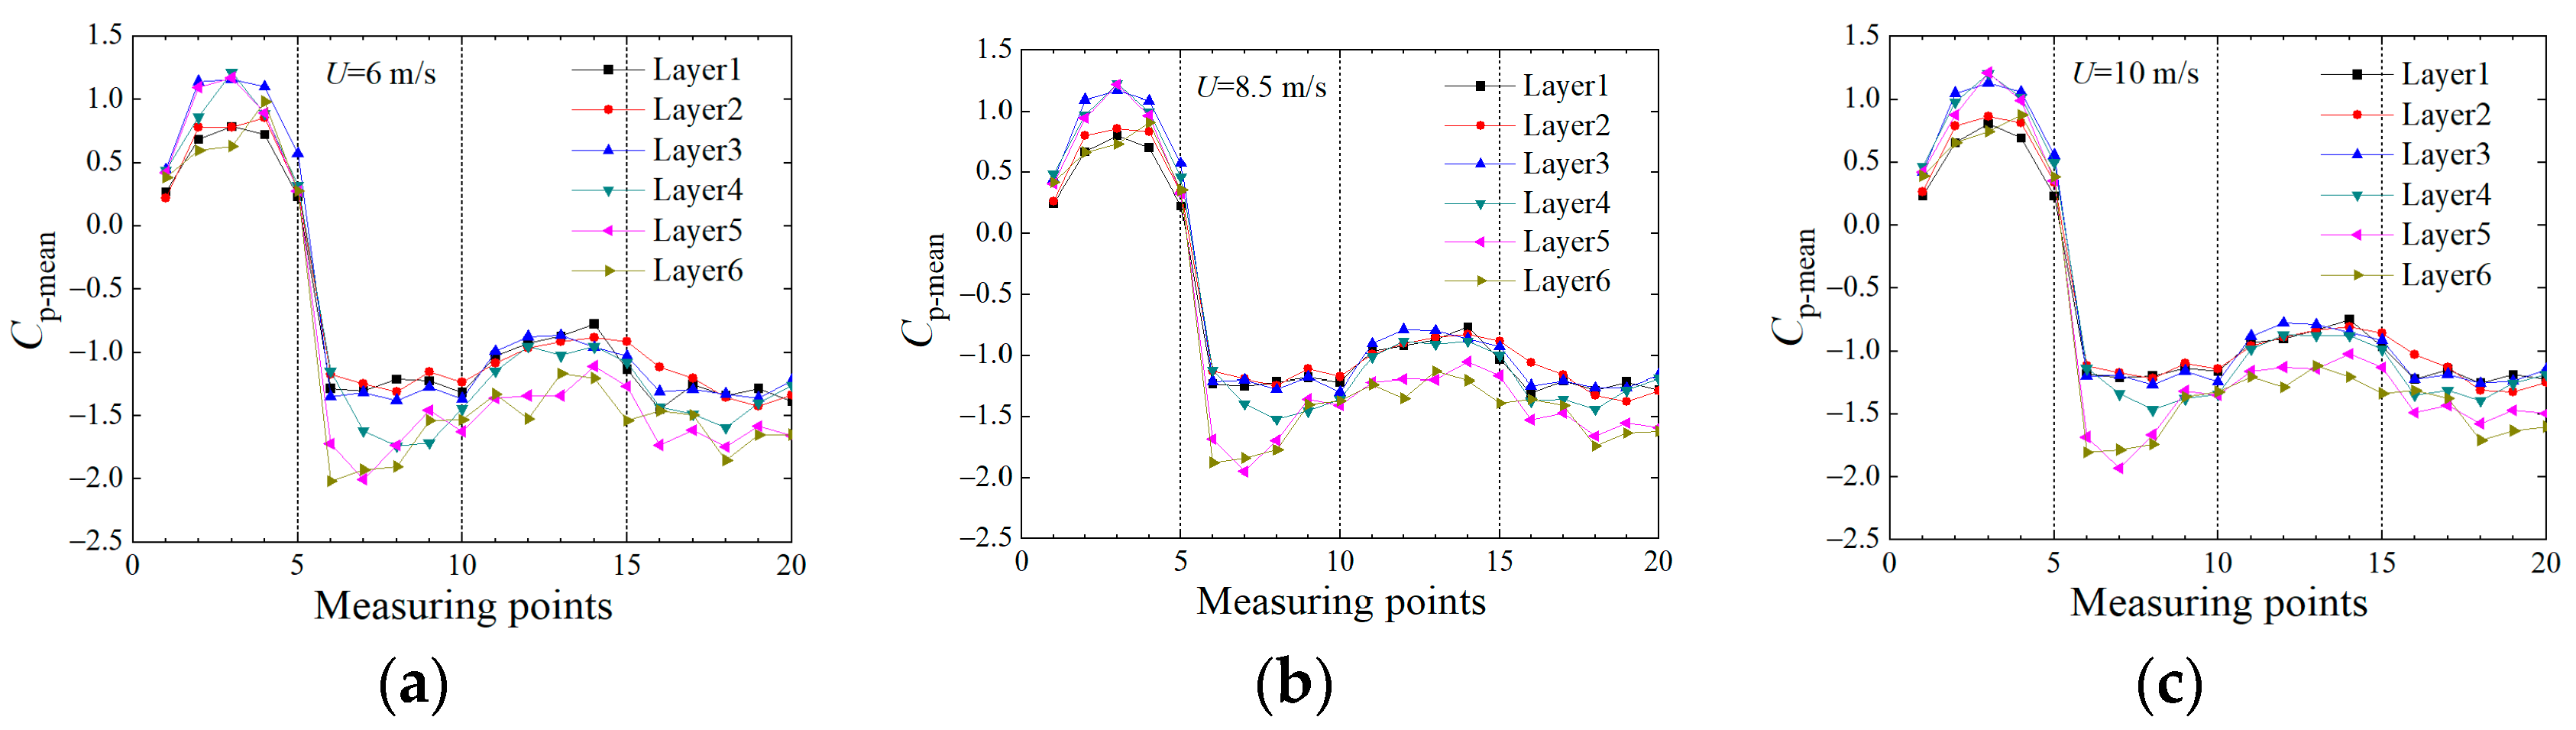
Figure 16.
Fluctuating wind pressure coefficient at different wind velocities in a uniform wind field. (a) U = 6 m/s; (b) U = 8.5 m/s; (c) U = 10 m/s.
Figure 16.
Fluctuating wind pressure coefficient at different wind velocities in a uniform wind field. (a) U = 6 m/s; (b) U = 8.5 m/s; (c) U = 10 m/s.
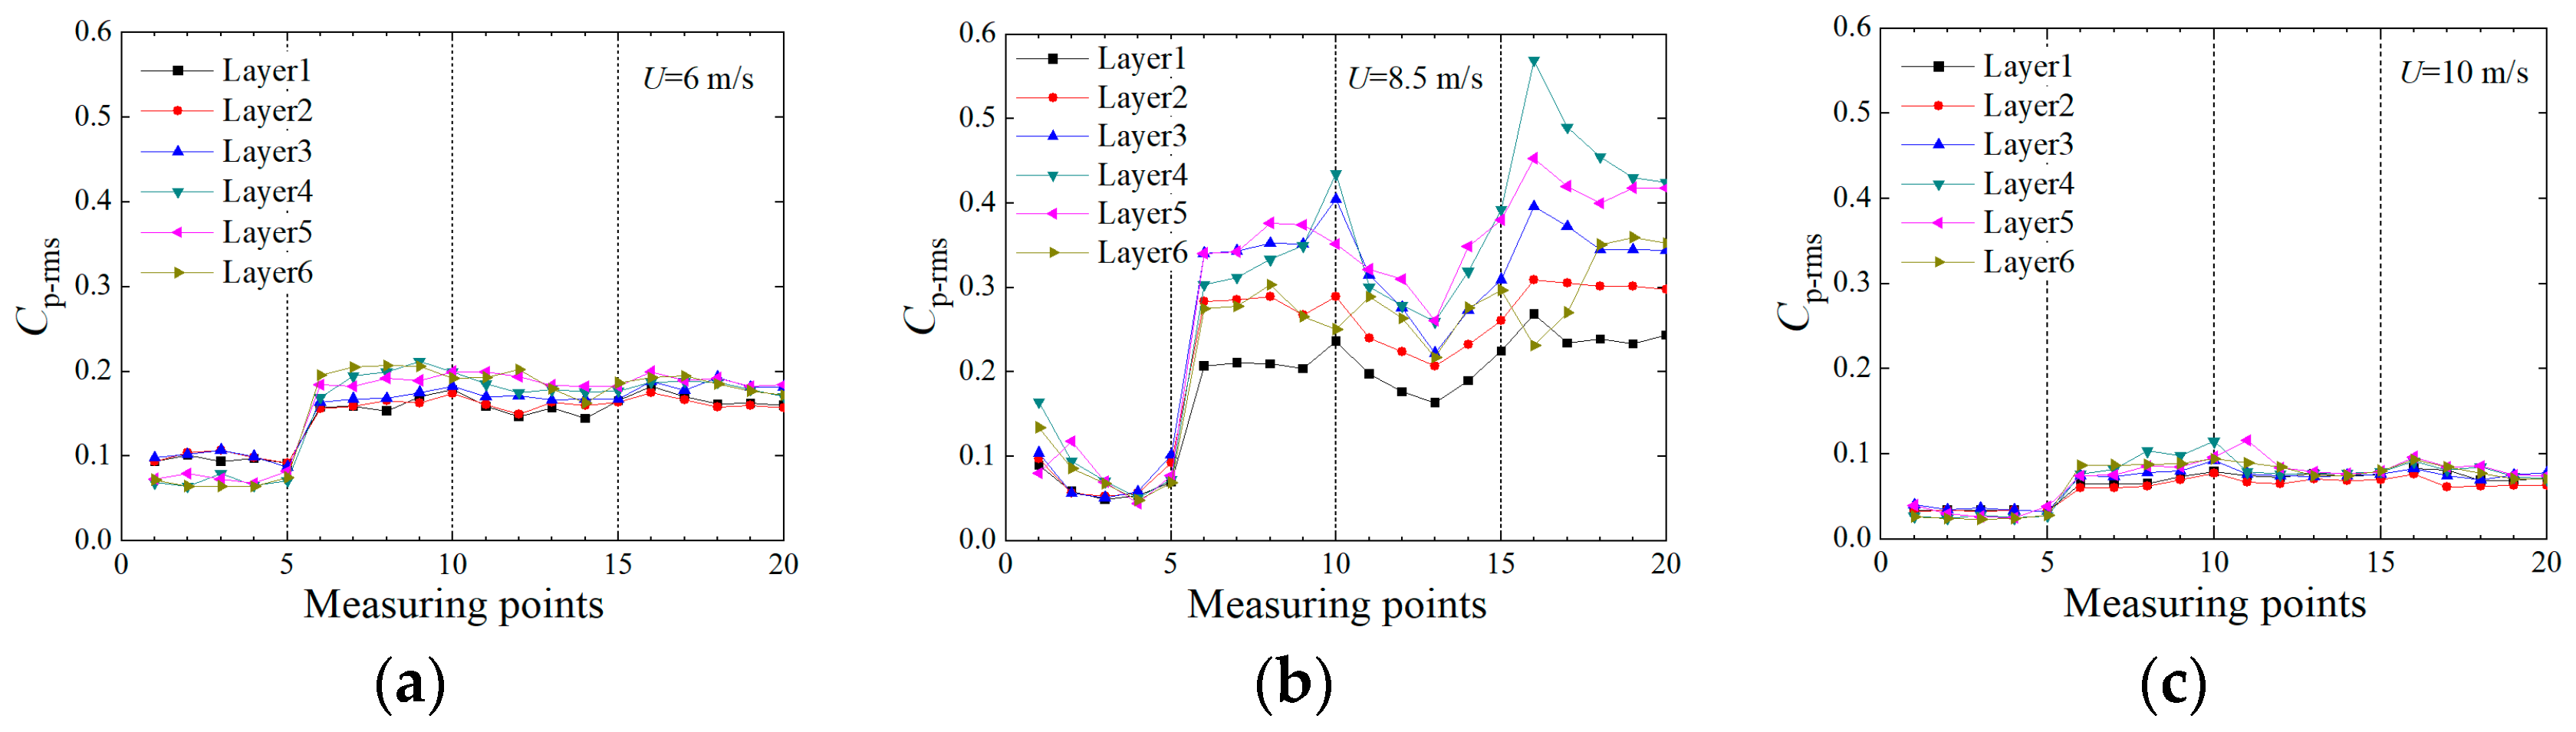
Figure 17.
Fluctuating wind pressure coefficient at different wind velocities in a turbulent wind field. (a) U = 6 m/s; (b) U = 8.5 m/s; (c) U = 10 m/s.
Figure 17.
Fluctuating wind pressure coefficient at different wind velocities in a turbulent wind field. (a) U = 6 m/s; (b) U = 8.5 m/s; (c) U = 10 m/s.
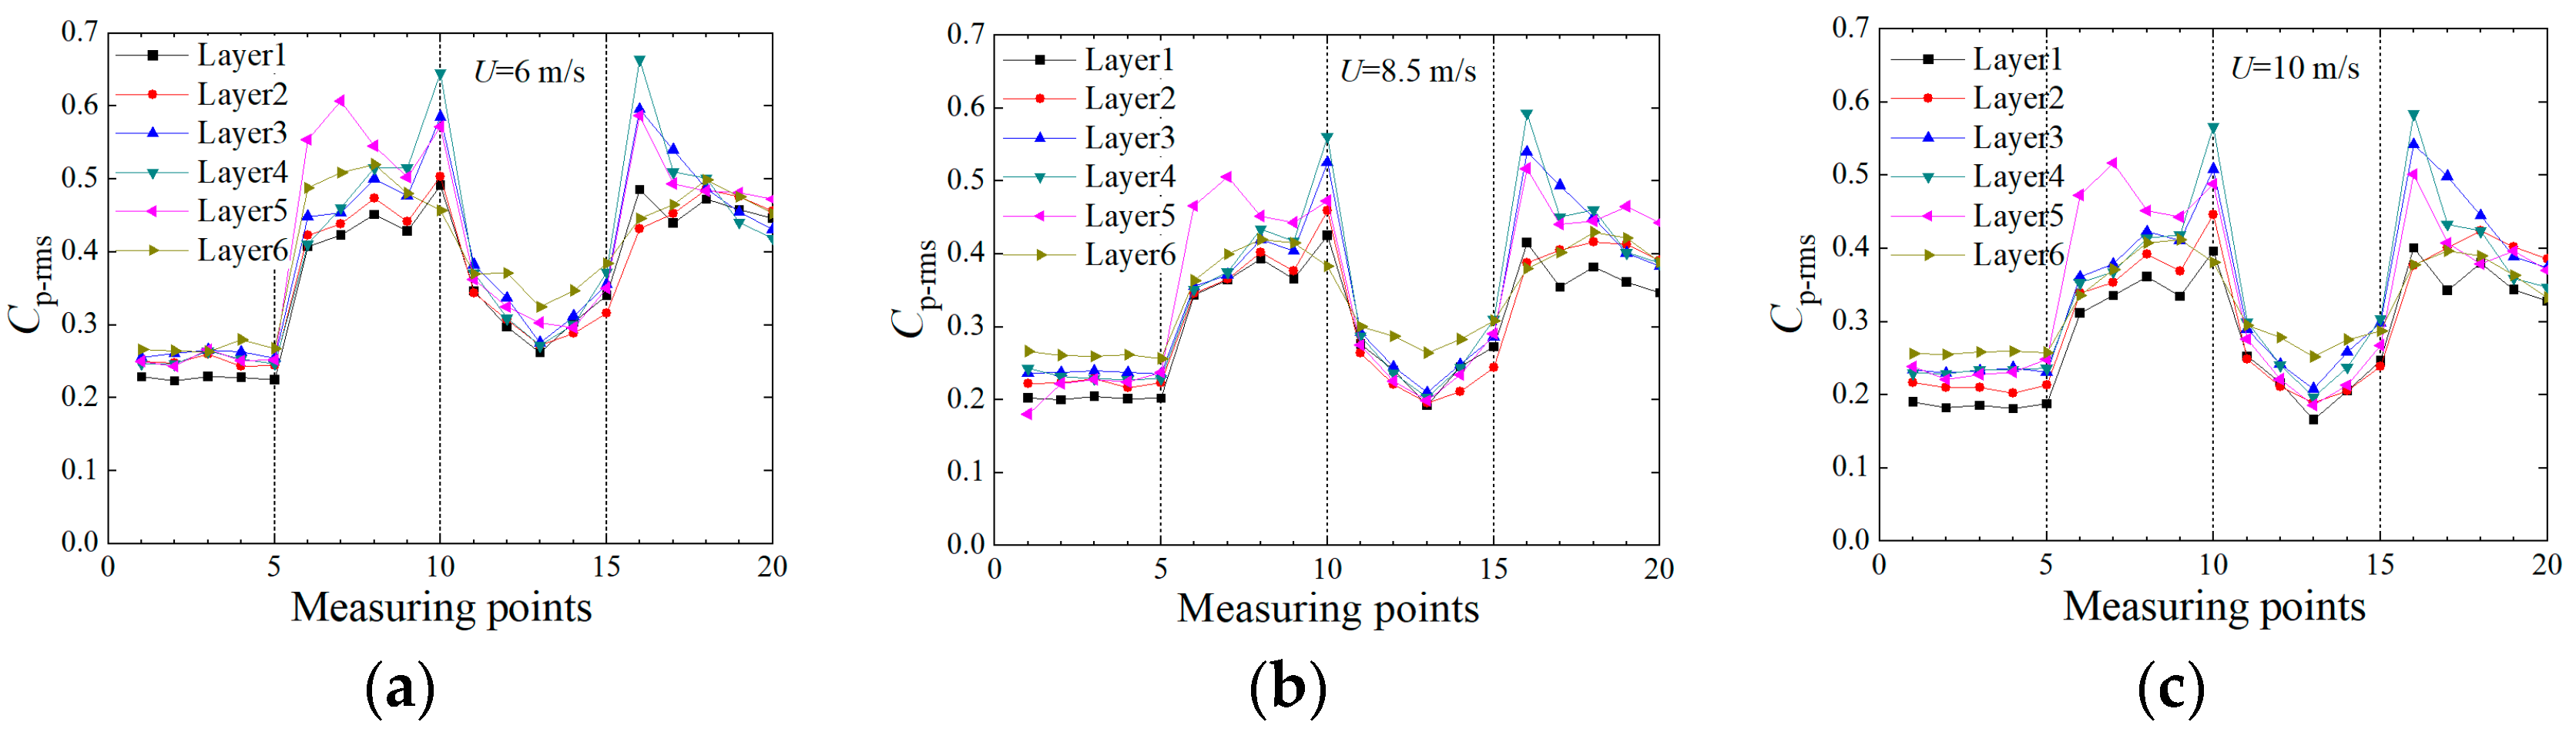
Figure 18.
Comparison of aerodynamic spectrum in a uniform wind field. (a) Across-wind direction; (b) Along-wind direction; (c) Torsion moment direction.
Figure 18.
Comparison of aerodynamic spectrum in a uniform wind field. (a) Across-wind direction; (b) Along-wind direction; (c) Torsion moment direction.
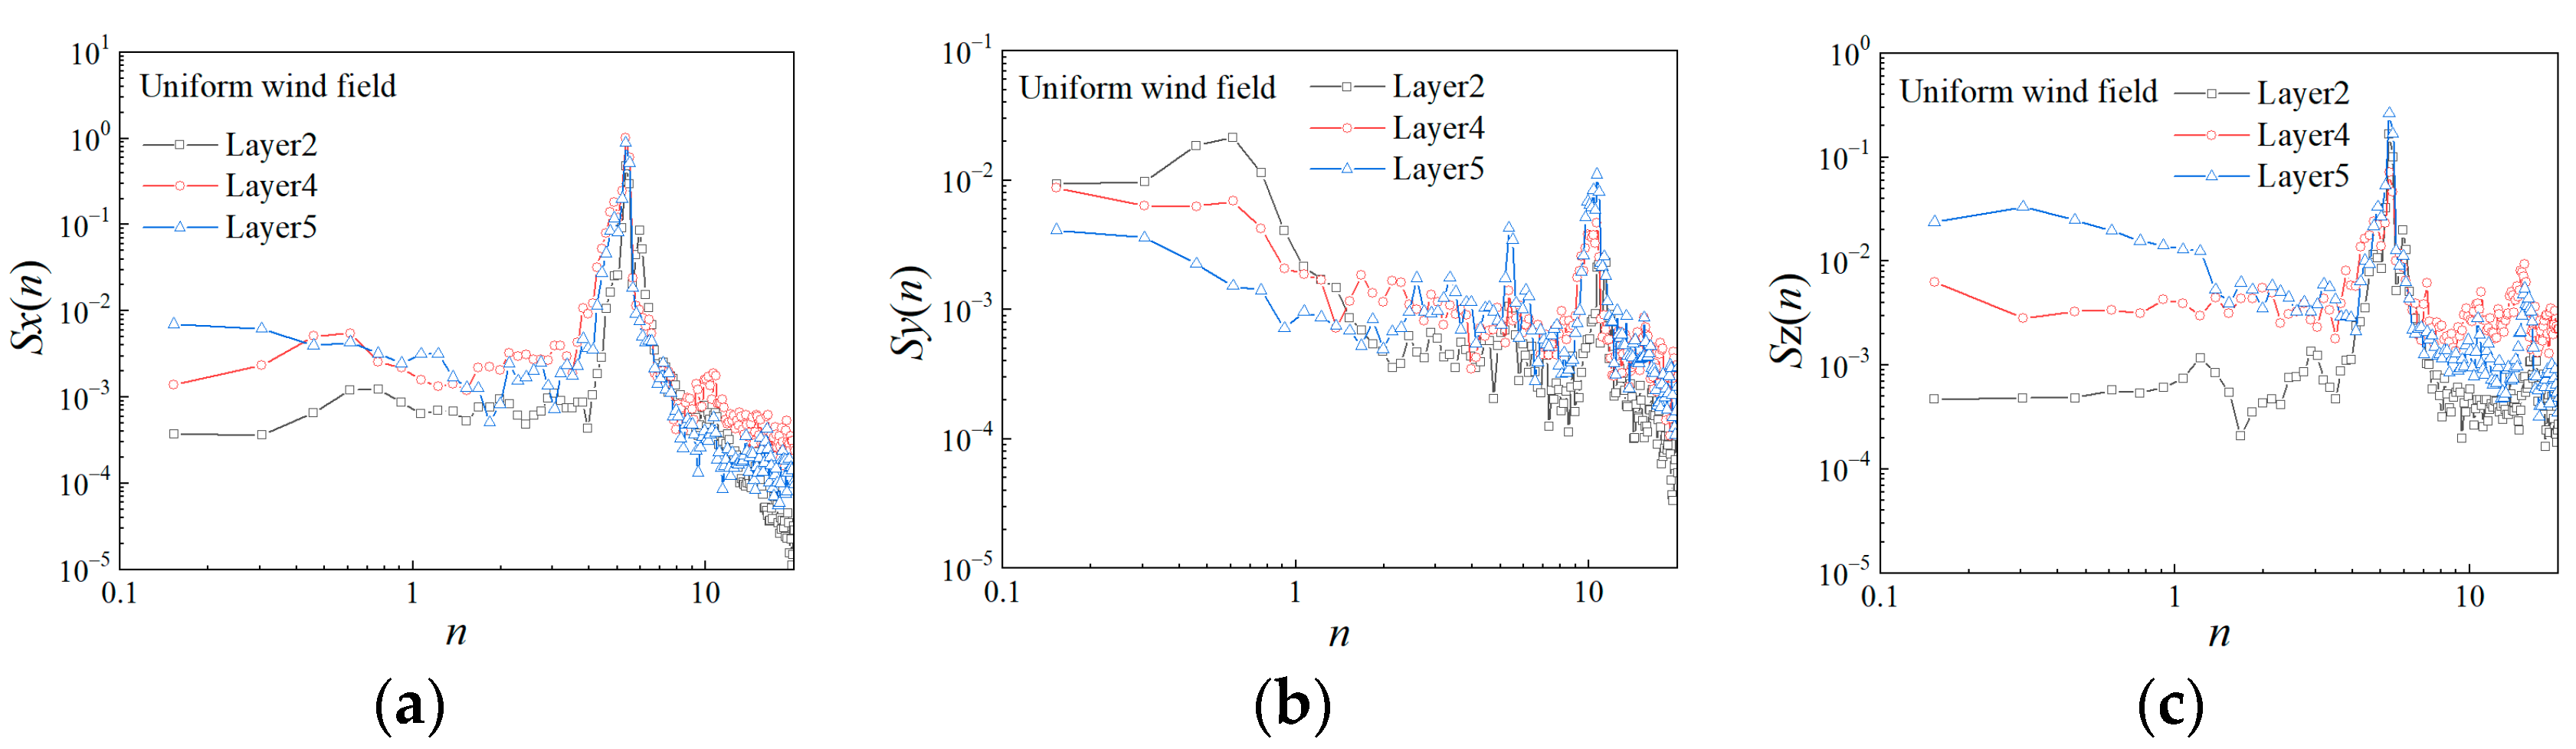
Figure 19.
Comparison of aerodynamic spectrum in a turbulent wind field. (a) Across-wind direction; (b) Along-wind direction; (c) Torsion moment direction.
Figure 19.
Comparison of aerodynamic spectrum in a turbulent wind field. (a) Across-wind direction; (b) Along-wind direction; (c) Torsion moment direction.
Disclaimer/Publisher’s Note: The statements, opinions and data contained in all publications are solely those of the individual author(s) and contributor(s) and not of MDPI and/or the editor(s). MDPI and/or the editor(s) disclaim responsibility for any injury to people or property resulting from any ideas, methods, instructions or products referred to in the content. |
© 2023 by the authors. Licensee MDPI, Basel, Switzerland. This article is an open access article distributed under the terms and conditions of the Creative Commons Attribution (CC BY) license (https://creativecommons.org/licenses/by/4.0/).
Share and Cite
MDPI and ACS Style
Xu, Z.; Yin, J. The Influence of Aeroelastic Effects on Wind Load and Wind-Induced Response of a Super-Tall Building: An Experimental Study. Buildings 2023, 13, 1871. https://doi.org/10.3390/buildings13071871
AMA Style
Xu Z, Yin J. The Influence of Aeroelastic Effects on Wind Load and Wind-Induced Response of a Super-Tall Building: An Experimental Study. Buildings. 2023; 13(7):1871. https://doi.org/10.3390/buildings13071871
Chicago/Turabian StyleXu, Ze, and Jiangjiang Yin. 2023. "The Influence of Aeroelastic Effects on Wind Load and Wind-Induced Response of a Super-Tall Building: An Experimental Study" Buildings 13, no. 7: 1871. https://doi.org/10.3390/buildings13071871
Note that from the first issue of 2016, this journal uses article numbers instead of page numbers. See further details here.