Article

Influence of Spanish Broom Fibre Treatment, Fibre Length, and Amount and Harvest Year on Reinforced Cement Mortar Quality

1
Department of Materials, Faculty of Civil Engineering, Architecture and Geodesy, University of Split, Matice hrvatske 15, 21000 Split, Croatia
2
Department of Inorganic Technology, Faculty of Chemistry and Technology, University of Split, Ruđera Boškovića 35, 21000 Split, Croatia
3
Department for Civil Engineering, University North, 104. Brigade 3, 42000 Varaždin, Croatia
4
Karst Agriculture Department, University of Applied Sciences Marko Marulic of Knin, Petra Krešimira IV 30, 22300 Knin, Croatia
5
University Department of Health Studies, University of Split, Ruđera Boškovića 35, P.P. 464, 21000 Split, Croatia
*
Author to whom correspondence should be addressed.
Buildings 2023, 13(8), 1910; https://doi.org/10.3390/buildings13081910
Submission received: 29 June 2023 / Revised: 13 July 2023 / Accepted: 25 July 2023 / Published: 27 July 2023
(This article belongs to the Special Issue Novelties in the Production of Mineral Binders and Concrete)

Abstract

:
The use of natural materials, such as natural fibres, in the construction industry is becoming more frequent. The source of natural fibres should be sought in local plants, such as Spanish Broom in the Mediterranean area. The fibre treatment process was carried out in 8 different ways with alkali 4%, 5%, 6%, 8%, 10% and 15% NaOH solution, and 5% NaOH and 2% Na2SO3 mixture solution and seawater. The fibres were tested for tensile strength. No relationship was established between the concentration of the solution and the tensile strength of the fibres. The influence of the reuse of treatment solution on fibre quality was monitored by X-ray diffraction (XRD), ATR-FTIR, and TG/DTG analysis. Fibres with lengths of 1, 2, and 3 cm were added to cement mortar specimens in amounts of 0.5 and 1 vol%. The flexural and compressive strengths were tested on mortar specimens after 28 days. For fibres 1 and 3 cm long, 0.5% natural fibre content gives higher strength results: about 9% for flexural strength and 13.5% and 11.7% for compressive strength in regard to mortar reinforced with fibres of the same length but with a proportion of 1%. For mortar reinforced with fibre 2 cm long, better results are achieved with 1% fibre content, namely 9% higher flexural strength and 11.2% higher compressive strength compared to mortars with 0.5% fibre content. SEM/EDS analysis showed that the fibres are integrated into the cement matrix but that there is no strong interaction with the binder. For examination and 3D visualisation of mortar specimens, a medical device MSCT (Multi-slice Computed Tomography) was also used. For three consecutive years of Spanish Broom harvesting, an analysis of meteorological conditions and the results of the mechanical strength of reinforced mortars is given. For the examined years, the meteorological conditions did not affect the obtained results. Additional knowledge about the Spanish Broom fibres can introduce this plant to the application of new sustainable building materials.

1. Introduction

Reinforcement of cement composites with randomly dispersed short, synthetic fibres has become very popular because it has been shown that this reinforcement significantly improves ductility, toughness, tensile strength, and impact resistance of composites, and the most popular fibres are steel and polymer fibres [1]. Steel fibres have limited use because of corrosion [2]. Although synthetic fibres do not have corrosion problems, their production is expensive and energy-intensive [3]. Therefore, recently more and more focus has been directed to natural fibres, whose extraction requires a low amount of energy, has a low environmental impact, and which are available [2]. Natural fibres are animal-based, mineral-derived, and plant-based fibres. Most common plant fibres like ramie, cotton, kenaf, flax, sisal, hemp, jute, bamboo, abaca, sugar palm, etc., have attracted a number of material researchers [4,5,6,7,8,9,10,11,12,13,14,15].
Some of the mentioned authors used their fibres untreated, while others treated them. Plants are mainly composed of lignin, cellulose, and hemicellulose. For the purposes of reinforcing the composite, it is desirable that the fibres have the lowest lignin and high cellulose content because such a composition leads to higher tensile strength [16]. The presence of cellulose, which is hydrophilic in nature, may affect the interfacial bonding between the fibres and composite matrix [17]. The purpose of the treatment is to improve the contact zone between the fibre and the cement paste, to improve the thermal stability of the fibres, and to improve the dispersibility of the fibres in the cement composite [18,19,20,21]. When it comes to fibre treatment methods, anhydride modification, organosilane treatment, and various coupling agents have been used, although alkali treatment has been found to be the most feasible [16,17,22,23]. Alkali treatment of fibres increases the crystallinity of cellulose which can lead to an increase in fibre strength [18,24,25]. Commonly used alkaline solutions for fibre treatment are NaOH and Na2SO3 [18]. Various authors have used different concentrations of NaOH, usually between 1 and 15%, and have different conclusions about which treatment is most effective. The best treatment in terms of kenaf fibre mechanical properties for Alavudeen et al. [26] is 10% NaOH treatment for 8 h at room temperature; for Yousif et al. [27] is 6% NaOH for 12 h at room temperature, while for Edeerozey et al. [28] it is 6% NaOH at 95 °C. Aravindh et al. [29], in their review of the effects of various chemical treatments on the mechanical properties of biofibre-reinforced composites, found that treatment with 5% NaOH is the most effective and economical treatment. Some authors used solutions containing 5% NaOH and 2% Na2SO3 [18,30,31] and 2.5% NaOH and 2% Na2SO3 [30,31] for fibre treatment, while the authors in [18,32,33] treated fibres with seawater as the most economically and ecologically acceptable solution.
In addition to the fibre extraction method, the chemical composition of the fibres is affected by the plant growing environment, geographical factors, and climate conditions. The influence of changing weather conditions on fibre quality has been the subject of research by numerous authors. Lefeuvre et al. [34] tested the tensile properties of flax fibres of the Marylin variety grown in the same geographical area for three years; it was determined by statistical analysis that the average tensile properties of the fibres were relatively constant despite the year of cultivation (although two years recorded a lack of precipitation). Another study also showed that there was no significant effect of weather over four years on the tensile properties of flax fibres of the Marylin variety grown in the same geographical area. Regardless of drought or excess precipitation during the vegetative period, elementary fibres had reproducible tensile properties over four years [35]. A plant under the influence of stress caused by a dry period or excess moisture reduces growth and increases the diameter of the stem. The drought of the soil reduced the rate of growth of flax, which reduced the number of fibres in cross-sections of the stem by only 16%. However, this resulted in different fibre lengths in different parts of the stem [36]. Lokhande and Reddy [37] found that quantitative functional relationships between temperature and cotton fibre quality are important for improving cotton properties. The fineness and maturity of cotton fibres, as well as their uniformity, increased with increasing temperature up to 26 °C and decreased at higher temperatures, while fibre strength increased linearly with temperature. The length of cotton fibres increased linearly from 18 °C to 22 °C; at higher temperatures, the length decreased [37].
The variety of natural fibres is wide, and the FAO organisation’s idea is that the climate differs from country to country but that in each climate zone, at least one crop for fibre production can grow [38]. It is in the interest of each country to examine the local fibre plant and the possibility of its application, especially if that plant can grow both wild and cultivated. Spanish Broom is a bushy plant that is widely distributed in the Mediterranean, and its use fully meets the mentioned requirements. Spanish Broom was used in the time of the ancient Greeks, Romans, and Carthaginians, but it lost its significance as a textile raw material in the 1960s. This paper deals with Spanish Broom and studies the effect of different treatments on the tensile strength of fibres, as well as the effect of treatment, length, and proportion of fibres on the mechanical properties of the cement composite. With regard to chemical treatments with hydroxide, the possibility of multiple uses of the same solution was examined for purely ecological reasons. The changes in the fibre structure caused by chemical treatment in a reusable solution were monitored by X-ray diffraction (XRD), Attenuated Total Reflectance-Fourier-transform infrared spectroscopy (ATR-FTIR), Thermogravimetry/Derivative thermogravimetry analysis (TG/DTG). For selected specimens, a medical device MSCT (Multi-slice Computed Tomography) for quantitative analysis of specimens (ROI, Region of Interest) and 3D visualisation (VRT, Volume Rendering Technique) were used. Given that the fibres of Spanish Broom are natural fibres, it is to be expected that their quality varies depending on the meteorological conditions of the year of growth and development of the plant. The paper presents the results of the mechanical strength of fibre-reinforced cement mortars from three consecutive harvest years, and the meteorological conditions for those three years are presented. The novelty of this paper would be the examination of the influence of the fibre tensile strength on the mechanical properties of the reinforced cement mortar, the effect of repeated use of the maceration solution on the quality of the fibres, as well as the examination of the influence of meteorological conditions on the fibre quality, respectively, on mechanical properties of the reinforced mortar. Especially because Spanish Broom is still an under-researched plant for use in building materials.

2. Materials and Methods

2.1. Spanish Broom Fibres

In purpose to reinforce the mortar, it is necessary to prepare fibres because Spanish Broom fibres are not available on the market, so the authors themselves picked shoots of Spanish Broom in the summer, as recommended in previous investigations, when a brown seedpod forms on the twig [33,38], Figure 1a,b.
After harvesting, the branches were cut to the appropriate length (up to 30 cm) and stored in a dry place. By daily weighing, it was observed that the twigs reached a constant weight after 6 days. A total of 7 different solutions were prepared: 4%, 5%, 6%, 8%, 10% and 15% NaOH solution, and 5% NaOH and 2% Na2SO3 mixed solution in a volume ratio of 4:1. The branches that were planned to be submerged in seawater were sewn into an airy net together with a 3 kg weight and thrown into the sea at a depth of 2.5 m. They were left there for 40 days. Previously prepared alkali solutions were stored in plastic containers with a volume of 15 L and equipped with lids in the laboratory. The branches were placed in the solution and, depending on the concentration of the solution, removed from it after a certain number of days. The time of keeping the branches in the solution was checked by pressing the branch between the fingers. If the fibre is easily separated from the wooden part under pressure, the branches are removed from the solution, and the next round of branches is placed in the solution. The reuse of the same solution is performed with the aim of reducing environmental pollution. The removed branches were washed under water with manual separation of the fibres from the woody part of the branch, Figure 1c, and the dry at room temperature, Figure 1d. In solutions with a higher concentration of alkali, it took less time for the fibres to be ready for separation, but after repeated use of the same solution, the storage time would be extended. The maceration started on 31 July and continued until 19 December, so the temperature also had an effect on slowing down the process. The branches were immersed in the solutions between 6 and 41 days. For example, the first round of maceration in 15% NaOH solution lasted for 6 days, the next two for 7 days and then for 10 days. ATR-FTIR and thermogravimetry/derivative thermogravimetry analyses of fibres were presented in previous papers (to be listed). Therefore, the effect of the reuse of the solution on fibre quality was studied in this paper. As an example, fibres from a 15% NaOH solution, marked as N15, were shown. Roman numerals I, II, III, IV and V indicate the number of times the solution was used. BS is untreated Spanish Broom fibre.

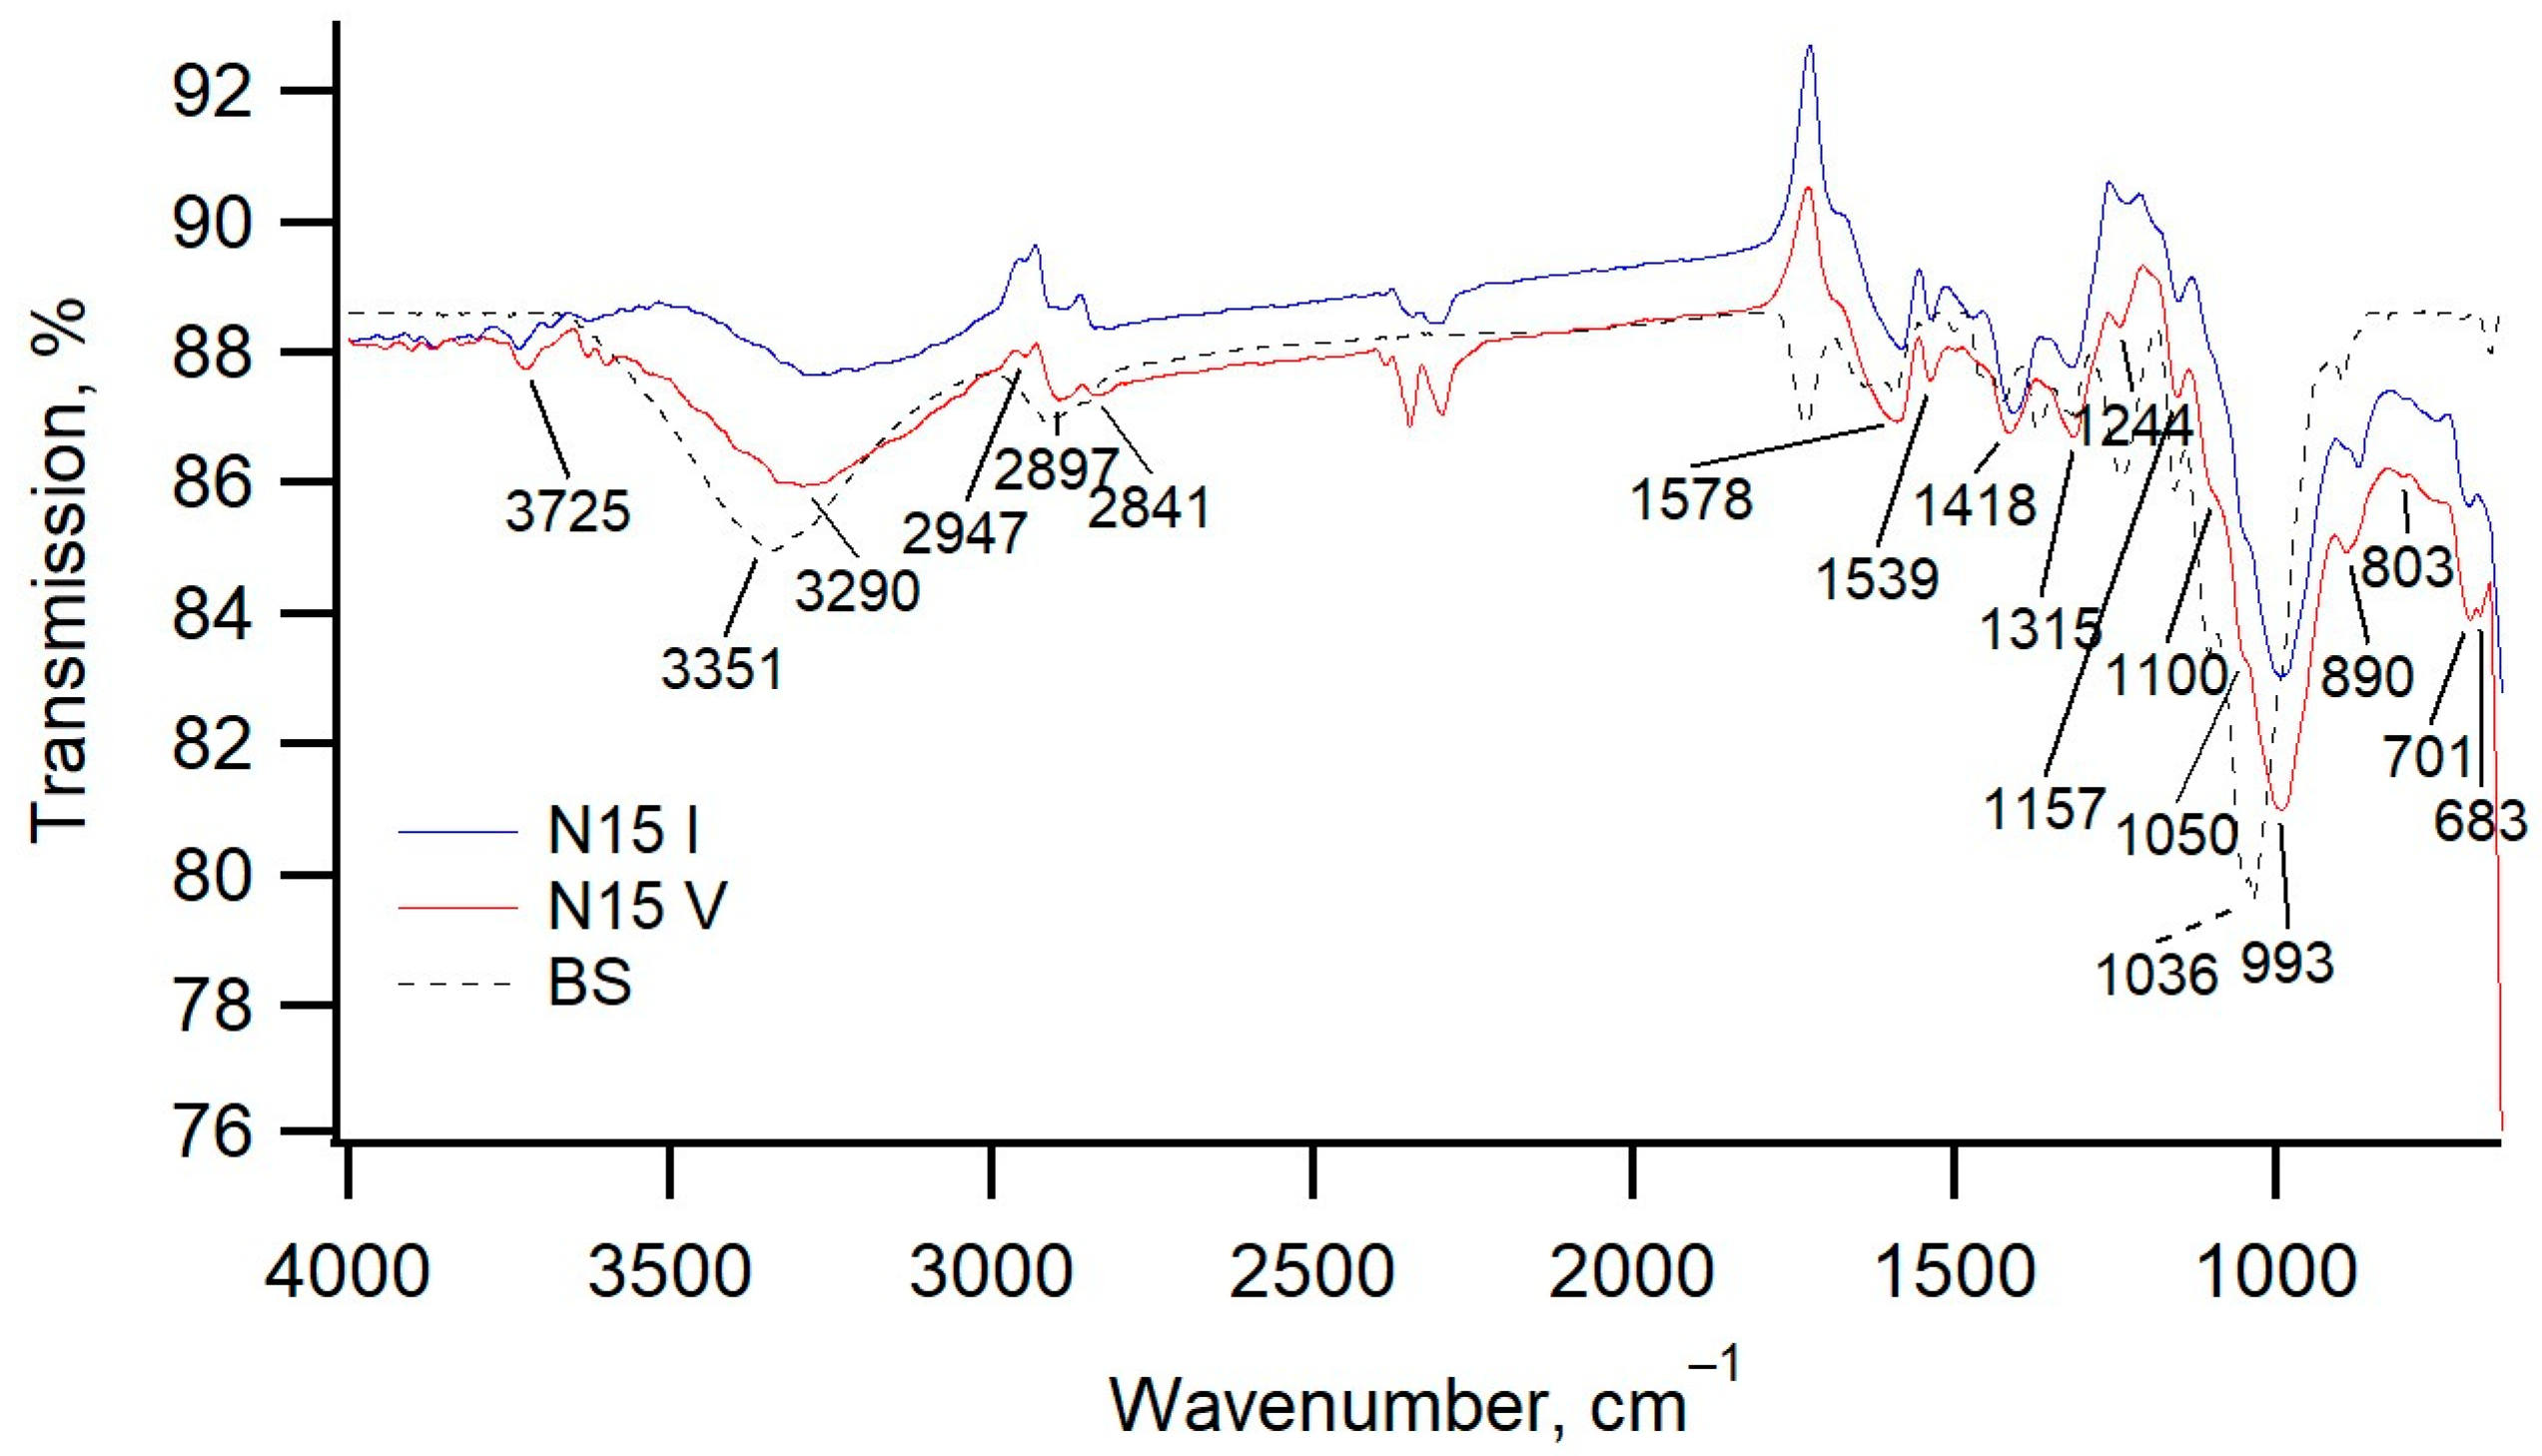
2.1.1. Attenuated Total Reflectance-Fourier Transform Infrared Spectroscopy (ATR-FTIR)

The prepared samples of fibres were recorded using a Spectrum One (Perkin Elmer) FTIR spectrometer equipped with ZnSe crystal for collecting spectrum by the method of attenuated total reflectance, ATR-FTIR. Spectrums were recorded in the range of 4000–650 cm−1 and with a resolution of 4 cm−1. The obtained spectra are shown in Figure 2.
A very weak absorption band centred at 3725 cm−1 arise from stretching –OH. In the spectrums of fibres that have been treated with a 15% NaOH solution (N15 I and N15 V) absorption band, which arises from stretching –OH is moving towards smaller values of wave numbers centred at 3290–3282 cm−1. This moving of absorption band, which arises from stretching -OH, indicates that the intra-molecular hydrogen bonding as a dominant type of hydrogen bonding in the natural Spanish Broom is substituted with intermolecular hydrogen bonding as the dominant bond after maceration [33,39].
The absence of strong absorption bands in the range of wavenumber 3730–3736 cm−1 in the spectra of samples N15 I and N15 V as a result of the stretching OH group after the maceration process was carried out suggests a sufficient number of rinses with water.
A moderately strong and broadened absorption band centred at a wavenumber of 2897 cm−1 indicates stretching of the C-H and CH2 bonds. Absorption bands at wavenumbers 890, 1100, 1157 and 1418 cm−1 indicate the asymmetric stretching of the C-O-C bond and symmetric CH2 bending vibration in cellulose, which indicates the crystallinity of cellulose fibres. The absorption band, which is very important in the context of the crystallinity of cellulose fibres, is 889–893 cm−1 and results from the glycosidic bond between the C-O-C bond within the cellulose structure in cellulose fibres. The absorption band occurring at 1416–1418 cm−1 (symmetric CH2 bending) should correspond to the changes in the environment of the C6 group forming an intermolecular hydrogen bond with O6 in the cellulose structure [33,40]. The absorption band at the wavenumber 1050 cm−1 arise from an asymmetric stretching of a glycosidic ring in line. The absorption band at 1370 cm−1 indicates the stretching of a C-H bond, the absorption band at 1315 cm−1 results from wagging the CH2 bond, while the absorption band at 1244–1246 cm−1 most likely results from the OH bending in the plane [41,42]. Absorption bands at 1513–1525 cm−1 correlated with the stretching vibration of C=C and 1240–1264 cm−1 assigned to syringyl ring and C-O stretching in lignin are bands present in the spectra of the samples BS; the same bands are also present in the spectra of all other samples, but with lower intensity, suggesting that maceration of Spanish Broom with 15% NaOH solution removes most of the lignin content as non-cellulosic compounds [43,44]. When comparing the FTIR spectrum of N15 I and N15 V, it is clear that the efficiency of the solution used (after being used five times) in the maceration process is still good. Since the maceration process takes 7 days per individual sample, the fifth maceration was performed after 35 days. During this time, freshly harvested Spanish Broom is stored in the air. The comparison of the FITR spectra shows that the success of the maceration process does not depend on whether the herbs subjected to maceration are freshly picked or almost dry.
X-ray diffraction pattern has been measured at the 3rd generation Empyrean, Malvern Panalytical. A sample of fibres of Spanish Broom was mounted at the sample holder for transmission between Kapton foils. On the primary side of the goniometer, a prefix iCore was mounted, optimised for the constant irradiated surface of 7 mm (automatic divergence slit, ADS). Measurement was performed by using the X-ray tube with a Cu anode and applying a voltage of 45 kV and a current of 40 mA. The obtained diffraction pattern was corrected for divergence slit (ADS to FDS) and for systematic error using the external Si standard.
Obtained diffraction patterns of the fibres N15 I and N15 V produced by maceration of Spanish Broom are shown in Figure 3. The structure of obtained materials is a mixture of crystalline Cellulosic material and an amorphous phase on which a very wide diffraction maximum is suggested. In all samples, two crystalline phases, Cellulose Iβ and Cellulose Iα, are found.

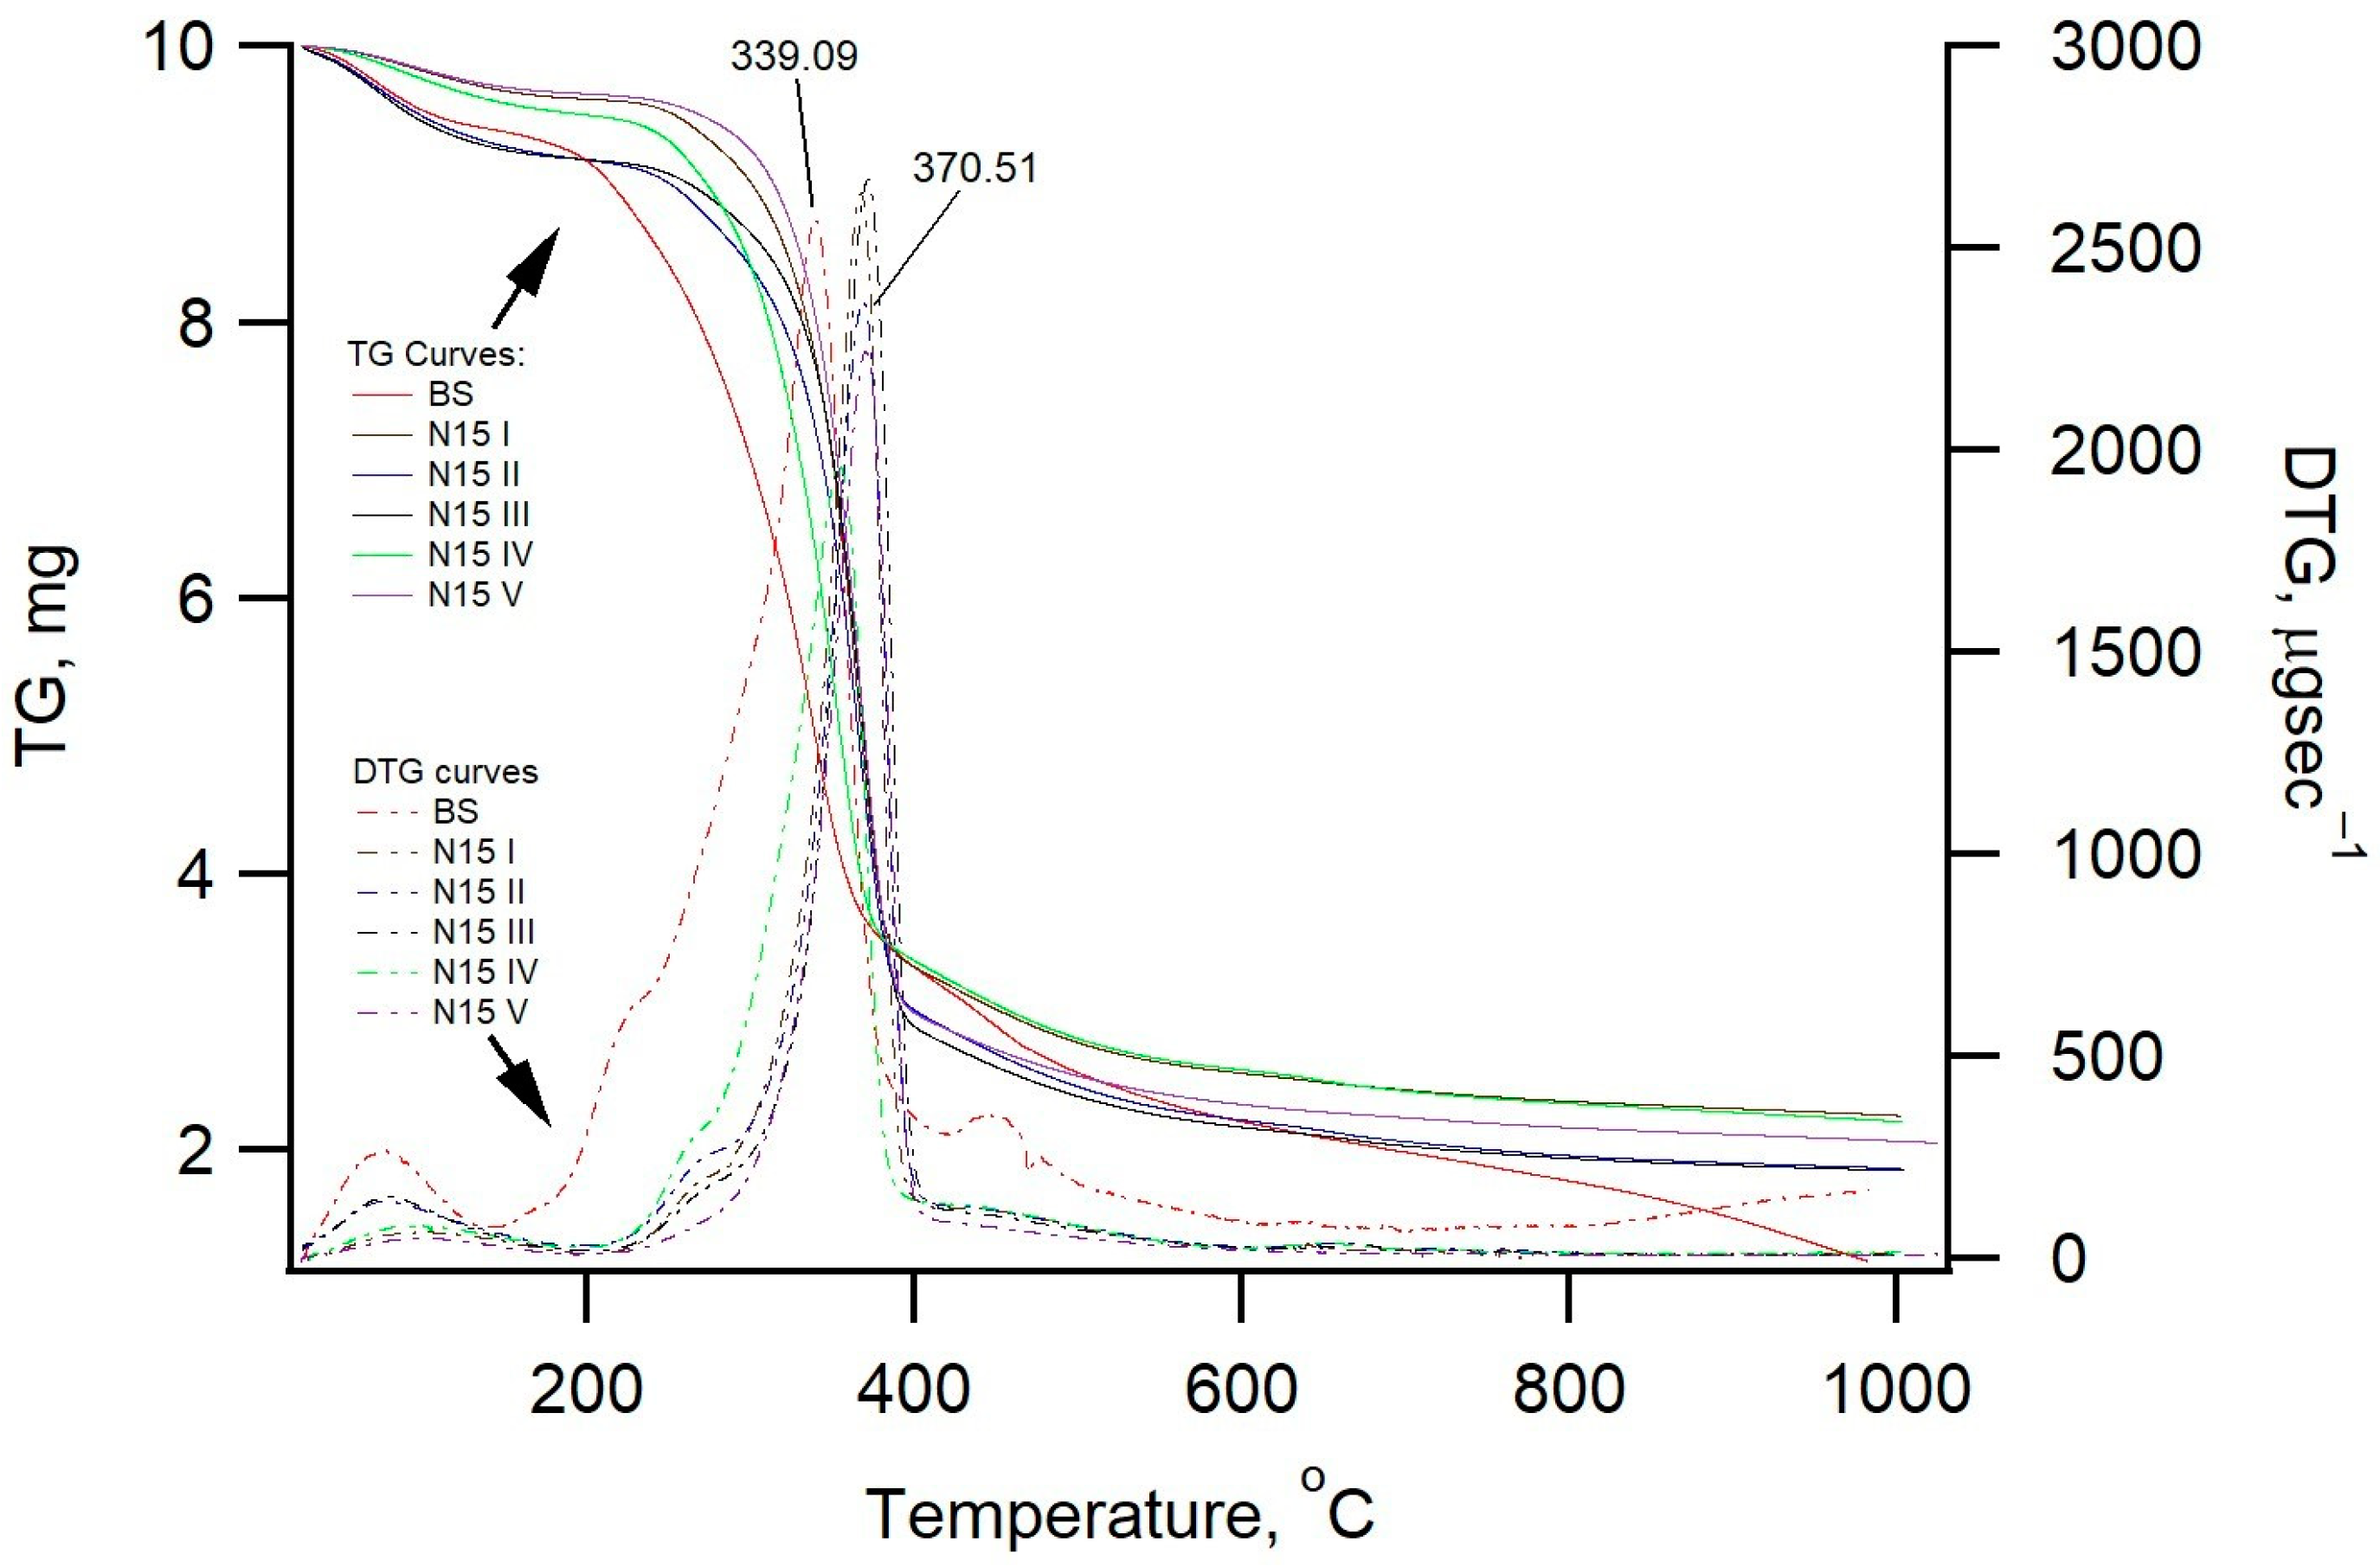
2.1.2. Thermogravimetry/Derivative Thermogravimetry Analysis (TG/DTG)

The prepared fibre samples were recorded on a TG/DTG-DTA instrument, Perkin Elmer, model Pyris Diamond, in a temperature range of 30–1000 °C. The samples were heated at a heating rate of 20 °C/minute in a nitrogen atmosphere as purge gas and with a nitrogen flow rate of 100 mL/min. The obtained TG/DTG curves are shown in Figure 4. Obtained TG/DTG curves are normalised at 10 mg of sample. From the shown results, it can be seen that in a temperature range for the sample BS, the first loss of mass is recorded in the temperature range of 30–176 °C. This first loss of mass in the amount of 7.01 mass. % is continuous, without clearly stressing other degrees of degradation, and it probably derives from absorbed moisture and constitutionally weakly bounded water. In all other samples, this loss of mass happened up to 200 °C. The second characteristic loss of mass in the amount of 5.01 wt.% can be seen in a TG/DTG curve for the BS sample in a range of 200–285 °C. This temperature region is also a characteristic peak in the DTG curve, which is located at 232.5 °C. This loss of mass is the result of thermal degradation of the hemicellulose. This value of mass loss which is related to hemicellulose is not exactly determined because the end of the temperature range is overlapped with other thermal decomposition. That means above 232.5 °C, the thermal decomposition starts and lasts until 418 °C with the peak in the DTG curve located at 339.09 °C. In this temperature range, the loss of mass is 55.52 wt.%, where the loss of mass arises from the thermal degradation of cellulosic fibres [33,44]. In the maceration of the natural plant of Spanish broom, the same water solution of 15% NaOH was used five times to determine the efficiency of maceration and to prevent the pollution of the environment by waste disposal. The efficiency of process maceration can be determined by the content of non-cellulosic materials as residue in cellulosic fibres after maceration. The beginning of thermal decomposition samples prepared by maceration in a water solution in which a content of 15% of NaOH (N15 I, N15 II, N15 III, N15 IV, and N15 V) related to the natural plant is shifted at higher temperature range. So between TG/DTG curves of samples N15 I–N15 V shifting, the beginning of thermal decomposition at higher temperatures is also visible until the maximum of DTG curves is shifted but with a very small value. This postponed thermal decomposition visible into curves of fibres obtained by maceration is a result of removing hemicellulose from the natural plant as one of the results of maceration.
In the figure, the series prepared into 15 wt.% NaOH is shown in which the structure of cellulosic materials into the structural form of Cellulose Iα and Cellulose Iβ is developed. Loss of mass in the range from the beginning of measuring up to 105 °C arises from losing mass of free water which is in the range from 5.89 up to 6.45 wt.%. The highest loss in mass happens in the range, which is characteristic for cellulosic materials in the range from 275–409 °C (peak in the DTG curves is in the range from 367–372 °C). The shift of the DTG maximum at higher temperatures indicates that the time of treatment with the alkali solution increases the thermal stability of cellulosic fibres. Loss in mass for samples N15 I, N15 II and N15 III, N15 IV and N15 V in this temperature range is between 55.73–61.12 wt.%, while the sample BS is decomposed in the range of 200–411 °C and loss in mass is 61.23 wt.%.
The third characteristic temperature range of the loss of mass is in the temperature range of 408–737 °C for the sample N15 with mass loss in the amount of 32.34. Measured loss of mass arises from the thermal decomposition of the lignin, where the breakdown of aliphatic hydroxyl groups (R-COOH) happens on the side chain of the lignin. In all other samples denoted as samples N15 I, N15 II, N15 III, N15 IV, and N15 V obtained after a longer time of exposition, the alkali environment in the process of maceration doesn’t show loss of mass in this temperature range. This obtained data suggest that the time of exposing plants to the process of maceration by using the water solution of the 15% NaOH influences the decrease of the content of lignin and also that the same alkali solution can be used for at least five preparations.

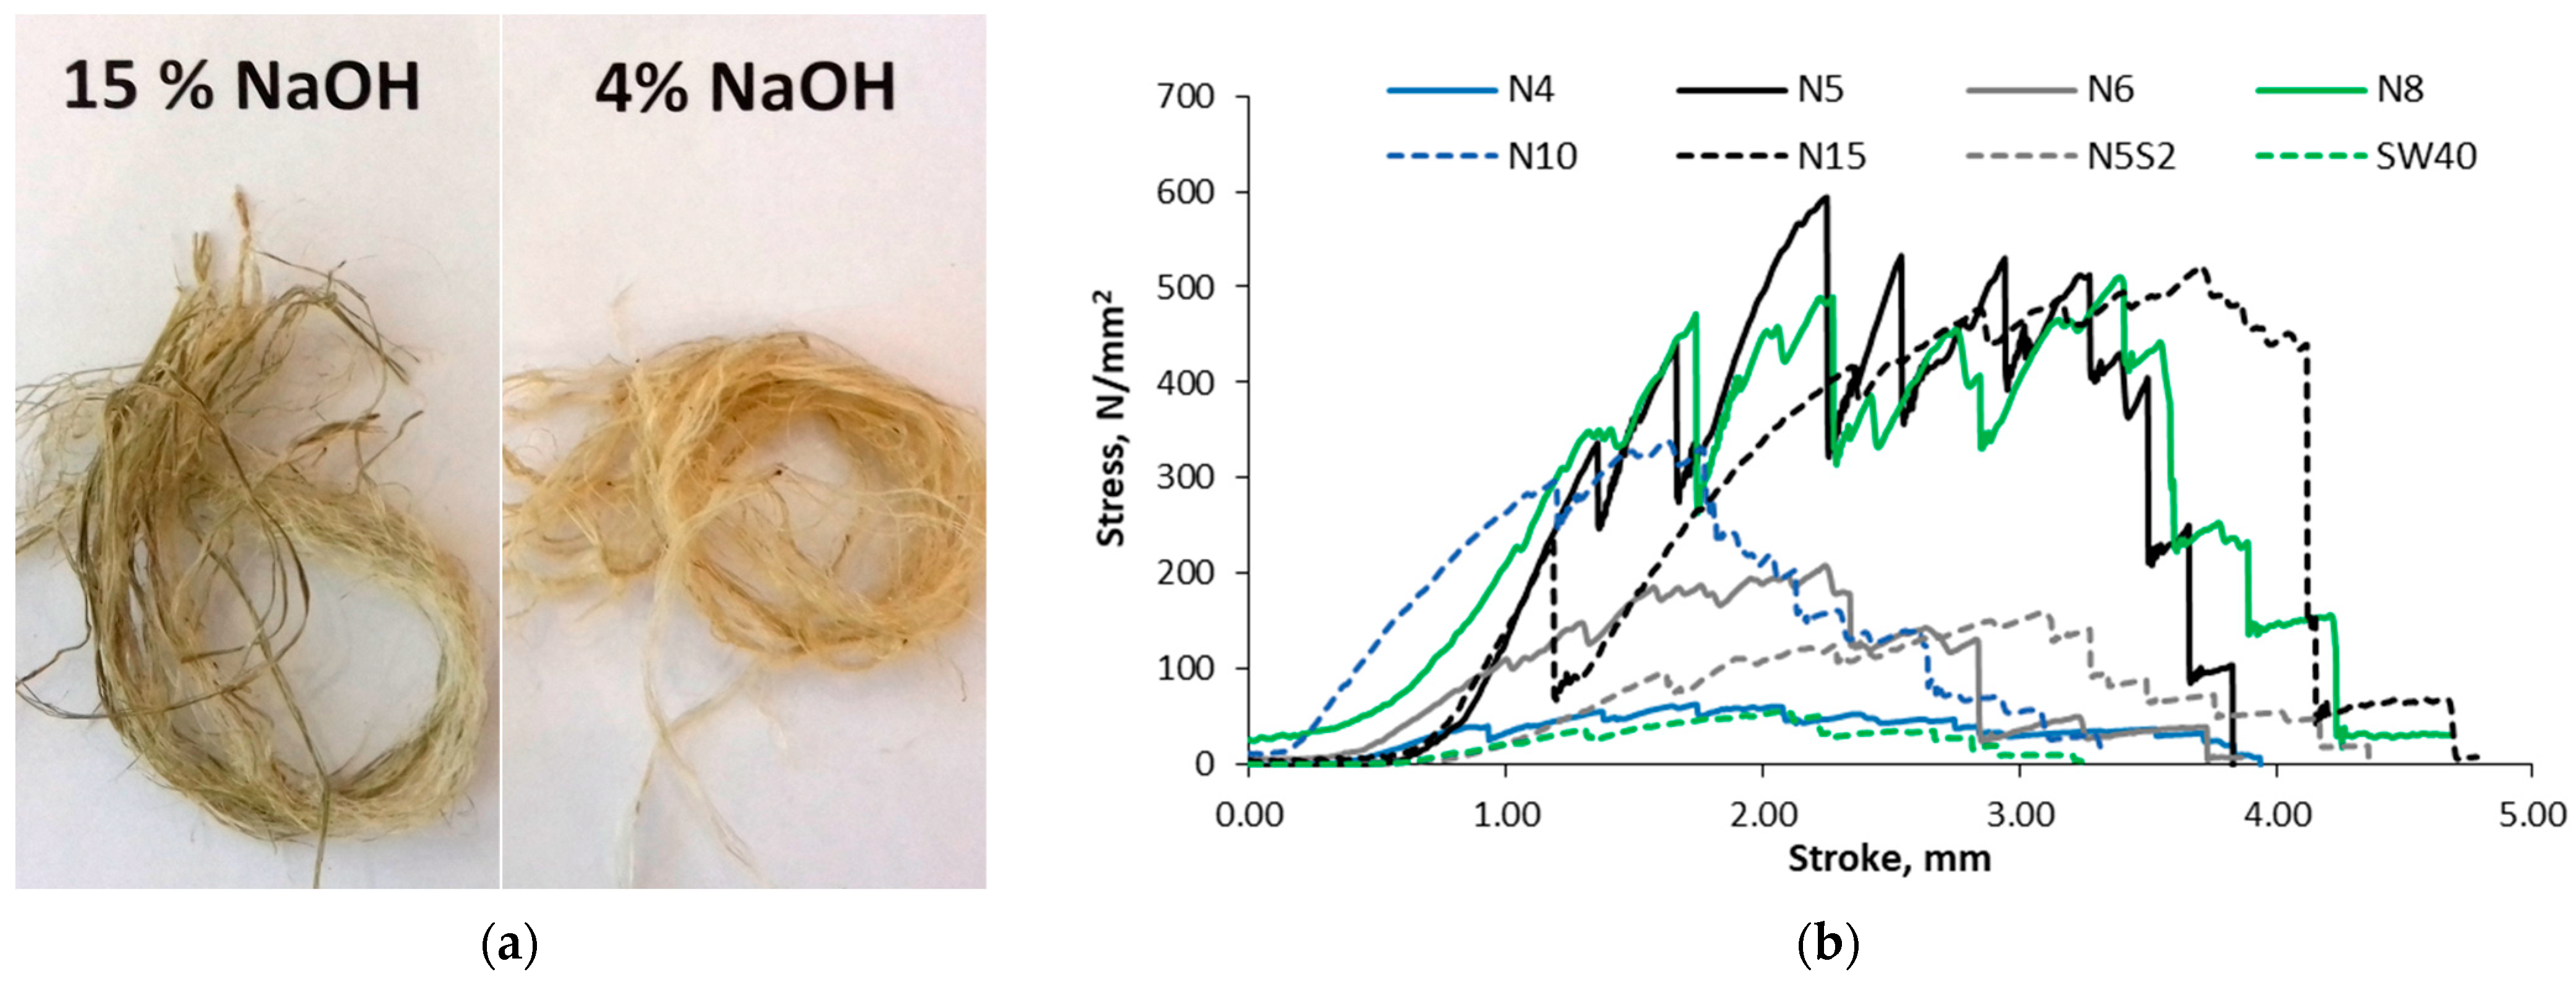
2.1.3. Mechanical Properties of Spanish Broom Fibres

After repeated use of the fibre treatment solution, fibres treated in the same solution were mixed. To determine the mechanical properties of Spanish Broom fibres, the fibres were taken by random selection. The stress–stroke diagram for fibres was determined using a Shimadzu universal tester of 50 kN capacity and loading the samples at a rate of extension 1 mm/min according to nHRN EN 14889-2 [45]. Figure 5a represents the fibres after treatment in the appropriate solutions, and Figure 5b shows a representative stress–stroke diagram for the fibres used in this paper. The fibres are marked according to the solution in which they were treated: N4 are fibres treated in 4% NaOH solution, N5 are fibres treated in 5% NaOH, etc., N5S2 is the designation for fibres treated in 5% NaOH and 2% Na2SO3, and SW40 is the designation for fibres that were submerged in the sea for 40 days. Fibre properties are listed in Table 1.
According to Table 1, the maximum tensile strength of fibres is in the range from 57.10 N/mm2 (SW40) to 593.97 N/mm2 (N5). Based on the obtained values, no connection can be established between solution concentration, fibre diameter, and tensile strength.

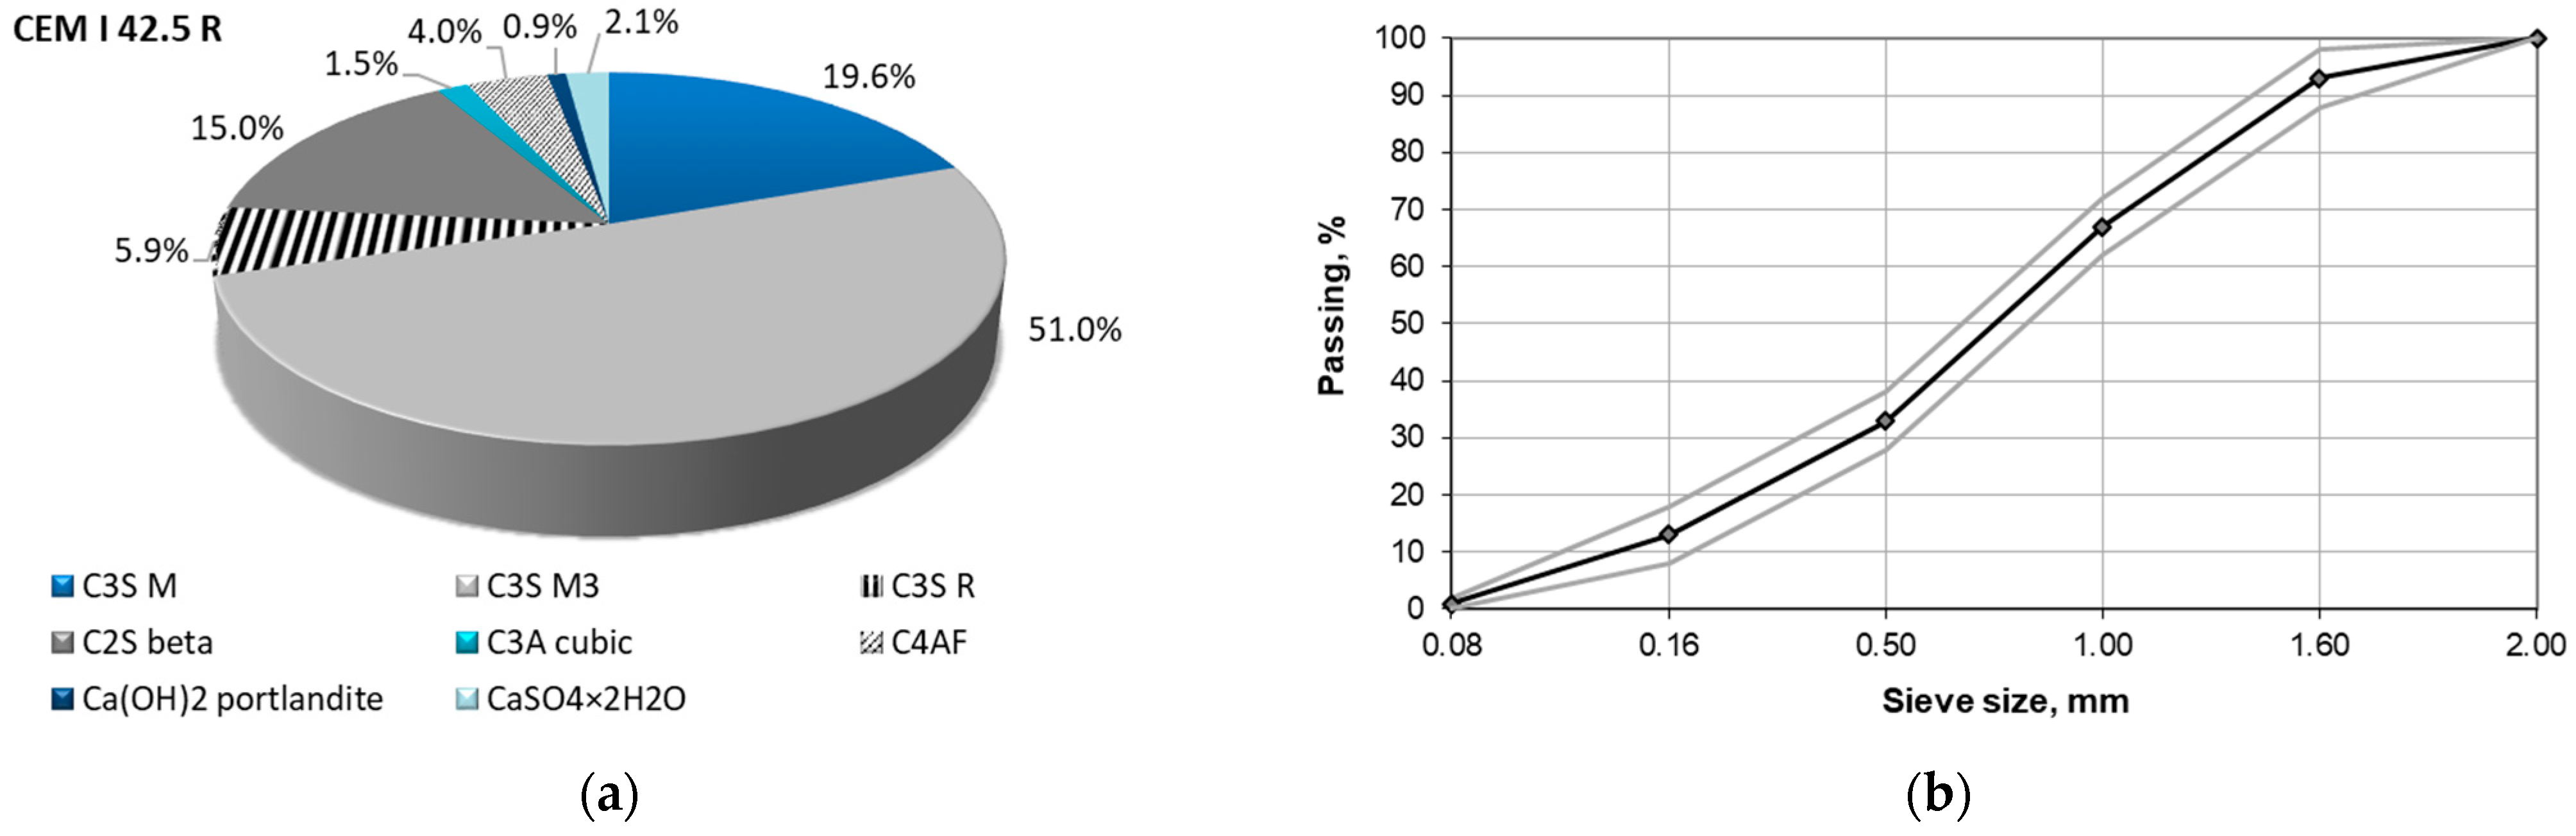
2.2. Other Materials and Mixing Proportions

In this study, CEM I 42.5 R was used with a specific gravity of 3.16 g/cm3 and a specific surface area, according to Blaine, of 3785 cm2/g. The XRD analysis was made, and obtained diffraction pattern for cement was corrected for divergence slit (ADS to FDS) and for systematic error using the external Si standard. Quantification of mineral phases present in the cement CEM I 42.5 R is made by using the Rietveld method, and results are shown in Figure 6a. The used standard quartz sand CEN-Normasand complies with the requirements of HRN EN 196-1 [46] and HRN EN 196-9 [47], Figure 6b.
The control mortar (CM) was produced according to HRN EN 196—1: 2016 [46], with 450 g of cement, 225 g of water, and 1350 g of standard quartz sand. The other 48 fibre-reinforced mixtures have cement, water, and sand in the same composition as the control mortar, with the addition of Spanish Broom fibres in the amount of 0.5% or 1% of the total volume. The fibres were stored in airy cardboard boxes and, before preparing the mortar, were cut by hand with sharp scissors to lengths of 10 mm, 20 mm, and 30 mm with a possible deviation of 2 mm. The control mortar was prepared using the standard method in an automatic laboratory mixer, while the other mortars were removed from the mixer after 30 s + 30 s + 60 s of automatic mixing of cement, sand, and water. Cut fibres were added to the container, and the mixture was mixed by hand until homogenised. The marks of the specimens and the composition of the mixtures are given in Table 2. The mark consists of the method of fibre treatment, the length of the fibre, and the volume fraction of fibres in the mixtures. Fibre treatment designations correspond to the data in Table 1. The mark X in NX replaces the concentration of the sodium hydroxide solution, which can be 4, 5, 6, 8, 10 and 15%. Mortars were moulded in a three-gang mould on a vibrating table. They were stored in an air-conditioned chamber at 20 °C and 95% of moisture for 24 h. The specimens were demoulded after 24 h and placed in water at a temperature of 20 °C ± 2 °C, and cured for 28 days.

2.3. Test Methods for Cement Mortars

The flexural test was carried out on 40 mm × 40 mm × 160 mm specimens according to [46]. After the flexural strength test was completed, two half-section specimens were taken out, and the compressive strength test was carried out on the side of the half-section specimens with an effective area of 40 mm × 40 mm.
Some specimens were examined with a scanning electron microscope. SEM/EDS analyses were performed in a low vacuum with a Jeol JEM-7610F Plus microscope equipped with an Oxford Ultim Max 65 SDD X-ray analyser for EDS analysis. The accelerating voltage and pressure were up to 1 kV and 4.4 × 10⁻⁴ Pa, respectively, for secondary electron image acquisition (SEI) and the voltage was in the range of 15 to 20 kV for elemental analysis.
Multi-slice Computed Tomography (MSCT) devices measure the attenuation of radiation passing through the material using the Hounsfield scale from −1071 to 3071. Hounsfield units can be calculated for any material using the linear attenuation coefficients for the material (μmaterial) and water (μwater) according to the formula:
H U m a t e r i a l = 1000 · μ m a t e r i a l μ w a t e r μ w a t e r
There are two fixed values in the Hounsfield unit scale, which are 0 HU for water and −1000 HU for air. MSCT devices quantify the attenuation of radiation passing through the material using the Hounsfield scale within each rectangular shape and pores, so materials that absorb more X-rays have a higher Hounsfield unit value. The cement, aggregates, and fibres can be characterised by defining specific ranges for their HU values. Osirix viewer was used for measurements of Hounsfield unit values in regions of interest (ROI) and 3D visualisation. For the 3D visualisation of mortar specimens, the Volume Rendering Technique (VRT) transparent display technique was used. More air is represented with light blue, while more cement matrix is represented with dark blue. For each individual layer within the ROI: minimum, maximum, mean, SD, median, and area were obtained.

3. Results and Discussion

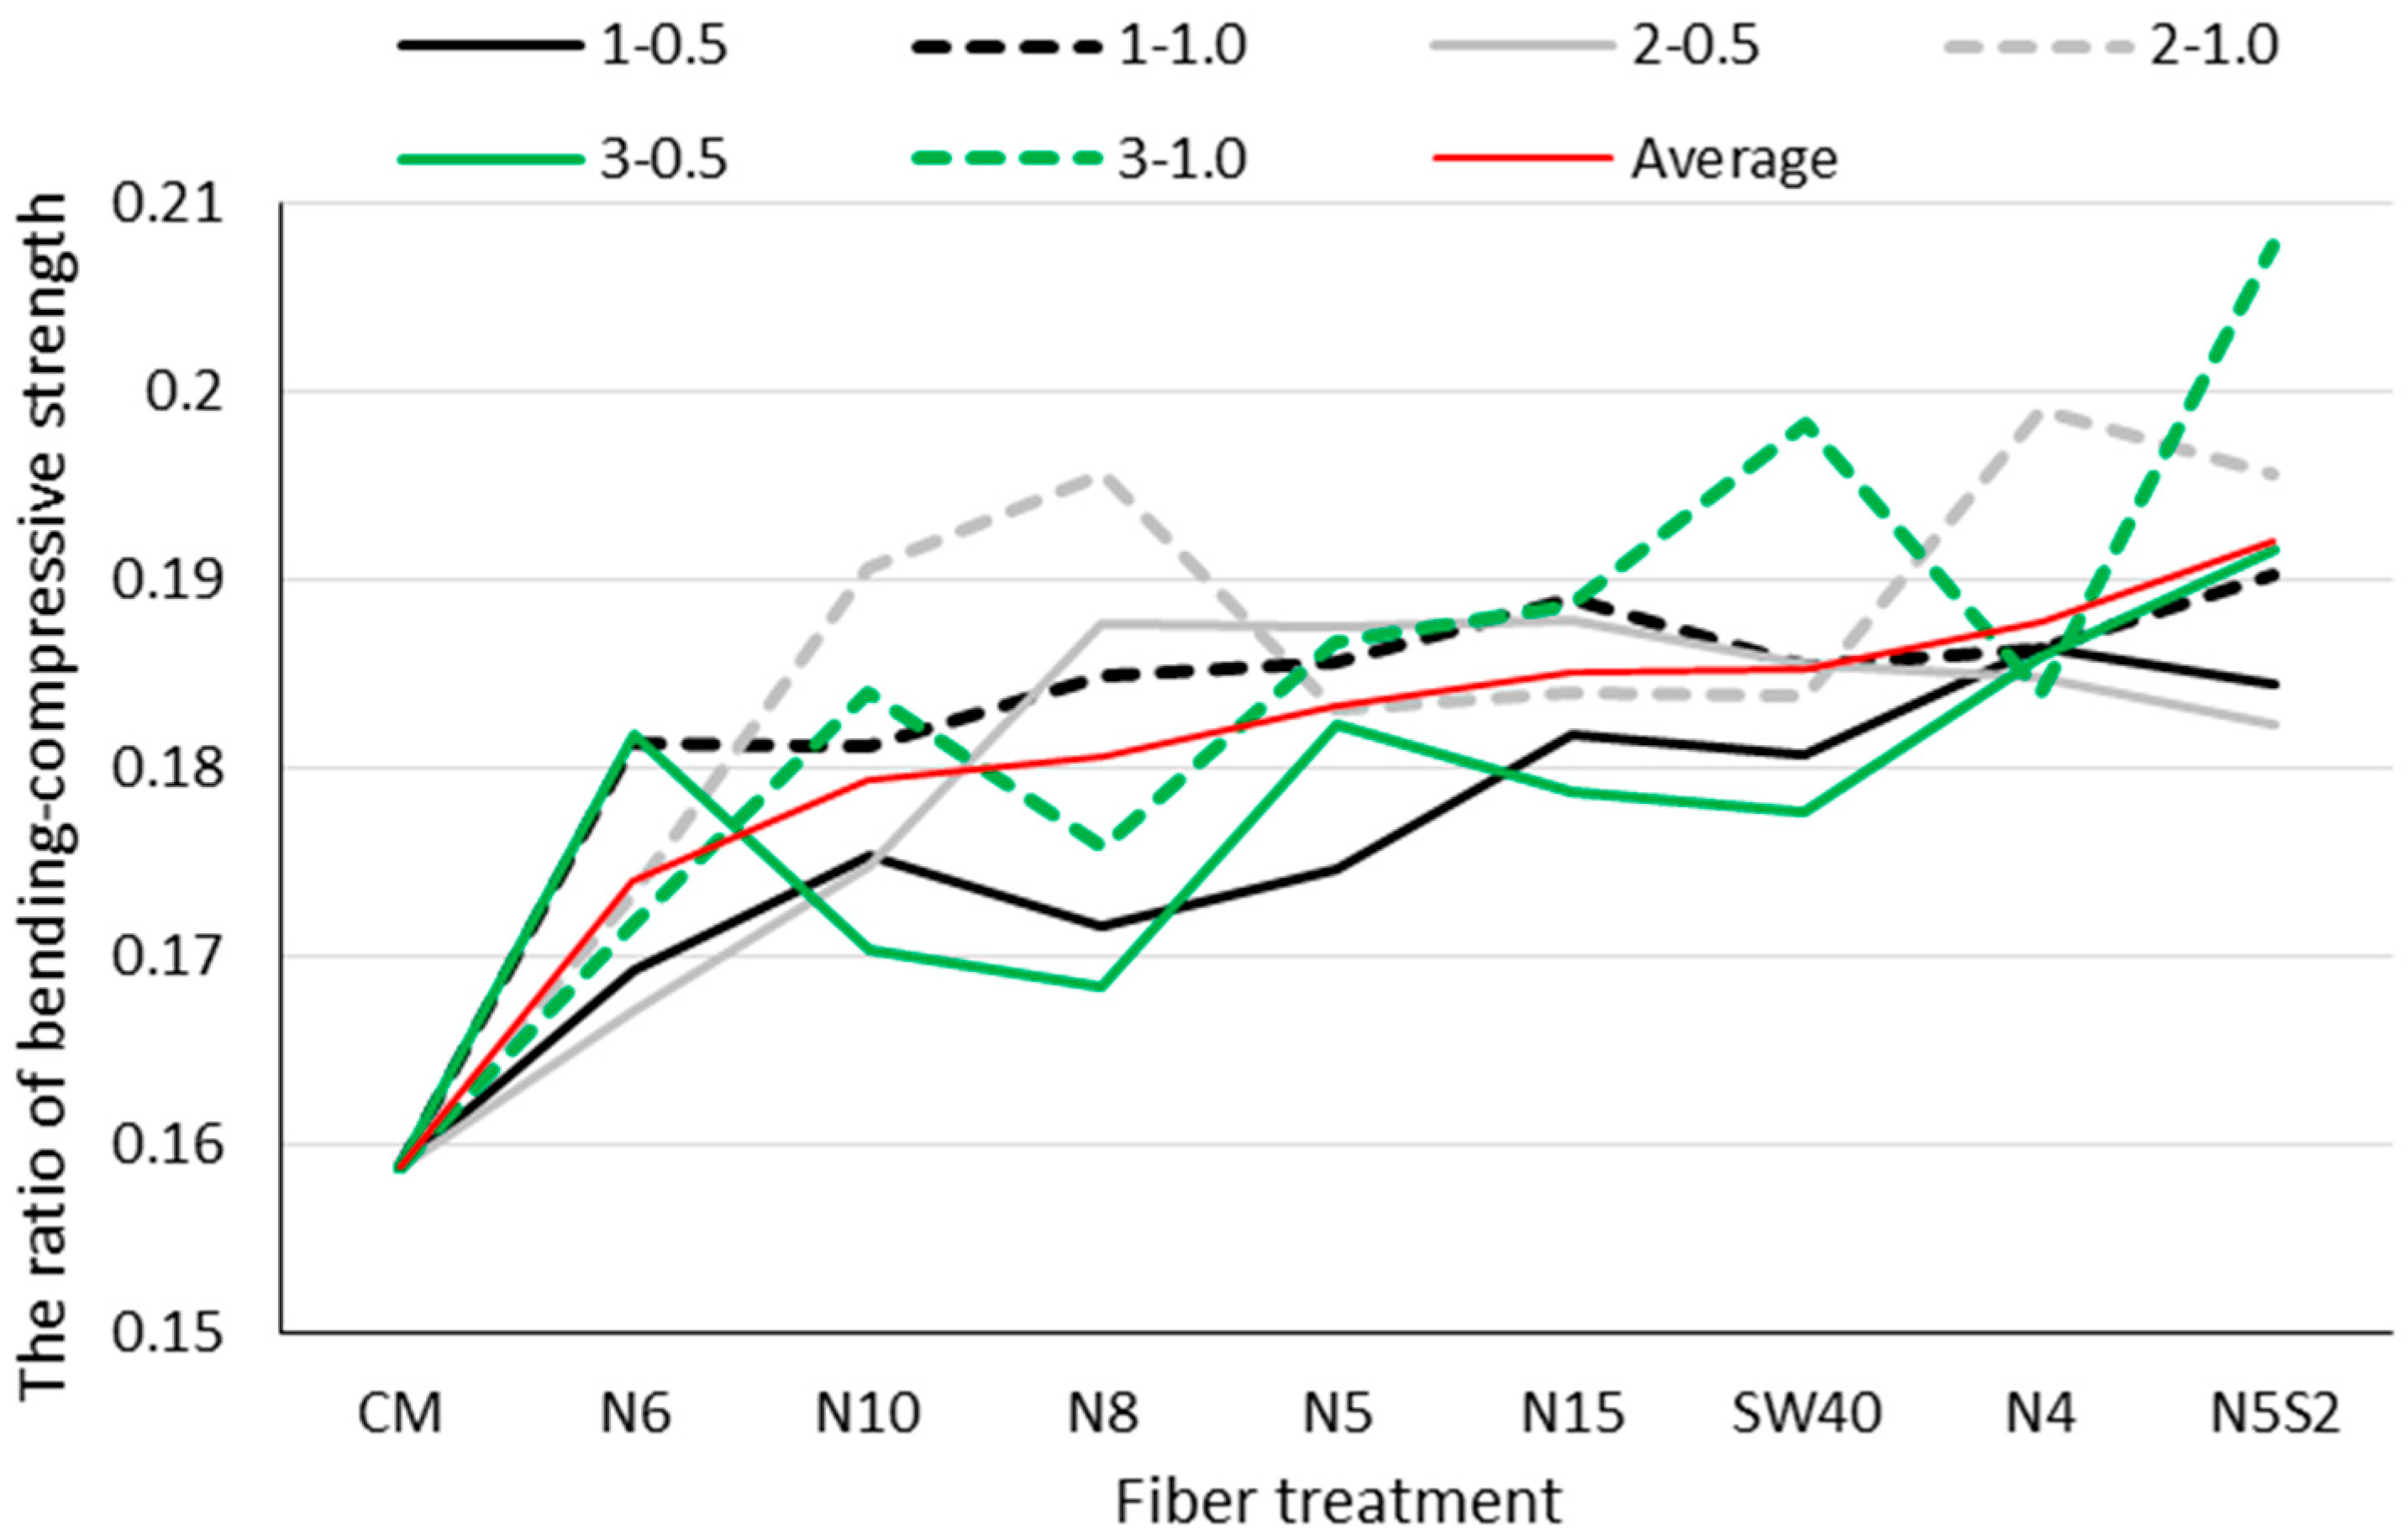
3.1. Compressive and Flexural Strength, Bending-Compressive Ratio

The effects of micro-reinforcement with Spanish Broom on the compressive and flexural tensile strengths of cement mortar specimens at the age of 28 days, standard deviation, and relative compressive and flexural strength in relation to the reference mortar specimen (CM) are shown in Table 3.
According to Table 3, only three mortar mixtures, N4-1-0.5, N4-2-0.5, and N15-2-0.5, had a higher or same flexural strength than the control mortar. In terms of relative compressive strength, none of the reinforced mixtures exceeded the value of the reference mortar. Similar results were obtained by the authors [48,49,50,51,52]; in their studies, mortars and cement-based materials containing date palm fibres showed lower compressive and bending strength compared to the referent specimen. The cause of the decrease in compressive strength can be found in three possible reasons: low mechanical strength of additions, increase in porosity, and weaker fibre/matrix adhesion [48,51]. Sedan et al. [53] also concluded similarly that the flexural strength of the composite decreases due to a non-homogeneous mixture and especially because of poor adhesion between the fibres and the matrix. Katman et al. [3] claimed that a weaker transition zone is created around the fibres, so there is a tendency for the entire specimen to be weaker. According to [54], the increase in fibre length leads to a high volume of large capillary pores. Comparing results in Table 2 and Table 3, no correlation can be established, which means that some other factor influences mortar strength. One of the reasons may be the manual mixing of mortars with fibres, while only the reference mixture was completely mixed in a laboratory mixer. Manual mixing with the addition of fibres increases the amount of incorporated air during the mixing phase, which is in accordance with the conclusion in [51]. Figure 7 shows some typical problems in mortar specimens after testing flexural strength, which fit into the above-mentioned explanations of strength reduction. In Figure 7a, there is a SW40-3-1.0 specimen from which a large-diameter fibre comes out. Additionally, according to Table 1, fibres after seawater treatment have a larger diameter than fibres after alkaline treatment. The external layer of the Spanish Broom branches consists of two types of fibrous cells: elementary fibres and technical fibres. Elementary fibres are mostly in the range of 5 to 10 μm in diameter, while the bundle diameter is approximately 50 μm [38,55,56]. It is possible that some unseparated bundles remained during the sea maceration.
In previous investigation [33], part of the fibre after sea maceration was immersed in 5% NaOH for 7 days, and the mortars reinforced with such fibres had better compressive strength in the case of a higher dosage of fibres in the composite. The alkaline solution probably separated the bundle, so fibres with a higher aspect ratio were embedded in the specimens, i.e., by the length-to-diameter ratio. In the example from Figure 7a and Table 1, the aspect ratio of the fibre is 31.9, which is at the lower limit for the usual value (30–150). The obtained results explain why, in former times, to obtain fibres, after resting Spanish Broom twigs in seawater, women rubbed them on a stone slab, separating the fibres from the woody part [57]. Figure 7b shows specimen N15-2-0.5 which has one of the two best flexural strength results. In the section, well-distributed fibres can be seen, but also an increased proportion of voids, which are the cause of reduced compressive strength. Ajougium et al. [58] with reinforced cement mortars ground Alfa fibres and also obtained a decrease of the compressive strength. One of the hypotheses of the cause of the decrease in compressive strength is the high porosity of the reinforced mortar. The third, Figure 7c, shows an example of bundles of Spanish Broom fibres in specimen N8-2-1.0. This problem has been observed in numerous previous papers [18,59]. During the preparation and mixing of the cement composite, the fibres remain in the bundle and are, thus, embedded in the cement matrix. According to [59], no cement paste enters the fibre bundles, so the space between the inner fibres is empty, and only the outer fibres of the bundle are bound in the cement matrix. Figure 7d shows that in some specimens, a contact zone between the fibre and the cement matrix is not created. The same problem was observed in [33], where it is believed that the cause of this problem is the more difficult installation of a larger amount of longer fibre in the sample of a standard 40 mm × 40 mm × 160 mm prism. The specimens, after testing the flexural strength in the fracture area, show a heterogeneous microstructure with residual fibres protruding into the fracture area. To get a better insight into the structure of the fibres and the interaction with the matrix, the same causes were ground and polished. The samples prepared in this way were examined with a scanning electron microscope. The results of the SEM/EDS analysis are shown in Figure 8 and Figure 9. It can be seen that the distribution of the fibres in the cement structure is integrated into the cement matrix, but the separation of the cellulose fibres does not indicate a strong interaction with the binder; even the surface of the fibres of Spanish Broom is covered by the product of cement hydration (Figure 9).
The characteristics of some selected mortars that were investigated by analysing the results of CT scanning and 3D reconstruction are shown in Table 4 and Figure 10. According to [60], pores range from −960 to 800 HU, cement paste from 800 to 2000 HU, and aggregate from 2000 to 2974 HU. Hou and Acton [61] found that cellulosic materials, such as cotton, exhibited X-ray densities ranging from –750 HU to –430 HU. According to Table 4, the minimum measured value is −470.889 HU, which can pore but also cellulose, i.e., fibres. The maximum measured values are in the range from 1811.333 HU to 1891.600 HU, and according to [61], this is cement mortar. Table 4 also gives the mean and median values. The existence of a difference between these two values indicates the inhomogeneity of the specimens. The same applies to higher differences between the maximum and minimum values [62]. The reference mortar has the lowest difference between the minimum and maximum values, which is in accordance with the results of Table 3. 3D visualisation of mortar specimens with transparent display technique is shown in Figure 10. According to Figure 10f, it can be seen that the N5S2-3-1.0 mixture has a large amount of pores, which resulted in the lowest compressive strength, Table 3. Slightly fewer pores are visible on specimens N6-2-0.5 ((Figure 10d) and N5-3-1.0 ((Figure 10c), the specimens CM (Figure 10a), and N15-2-1.0 ((Figure 10e), look homogeneous, while on specimen N4-1-0.5 surface roughness is visible (Figure 10b).
The ductility and toughness of cement-based composites, as well as the material’s resistance to cracking can be represented by the bending-compressive strength ratio [19]. The bending-compressive strength ratio results are shown in Figure 11. It shows the bending-compressive strength ratio of the control mortar and fibre reinforced cement-based material with the same amount of fibre and fibre length according to the treatment method.
According to Figure 11, all values of bending-compressive strength ratio for fibre reinforced mortar are higher than the value for the control mortar. The highest values were achieved by fibre-reinforced mortars (SW40, N4 and 5N2S), which have the lowest fibre tensile strength in Table 1. Mortars with a higher proportion of fibres (1%) have a stronger effect on the bending strength ratio and in this order: 2 cm, 3 cm and 1 cm. This is easy to see during the test, because after breaking the samples during the flexural strength test, it is very difficult to separate them into two halves.

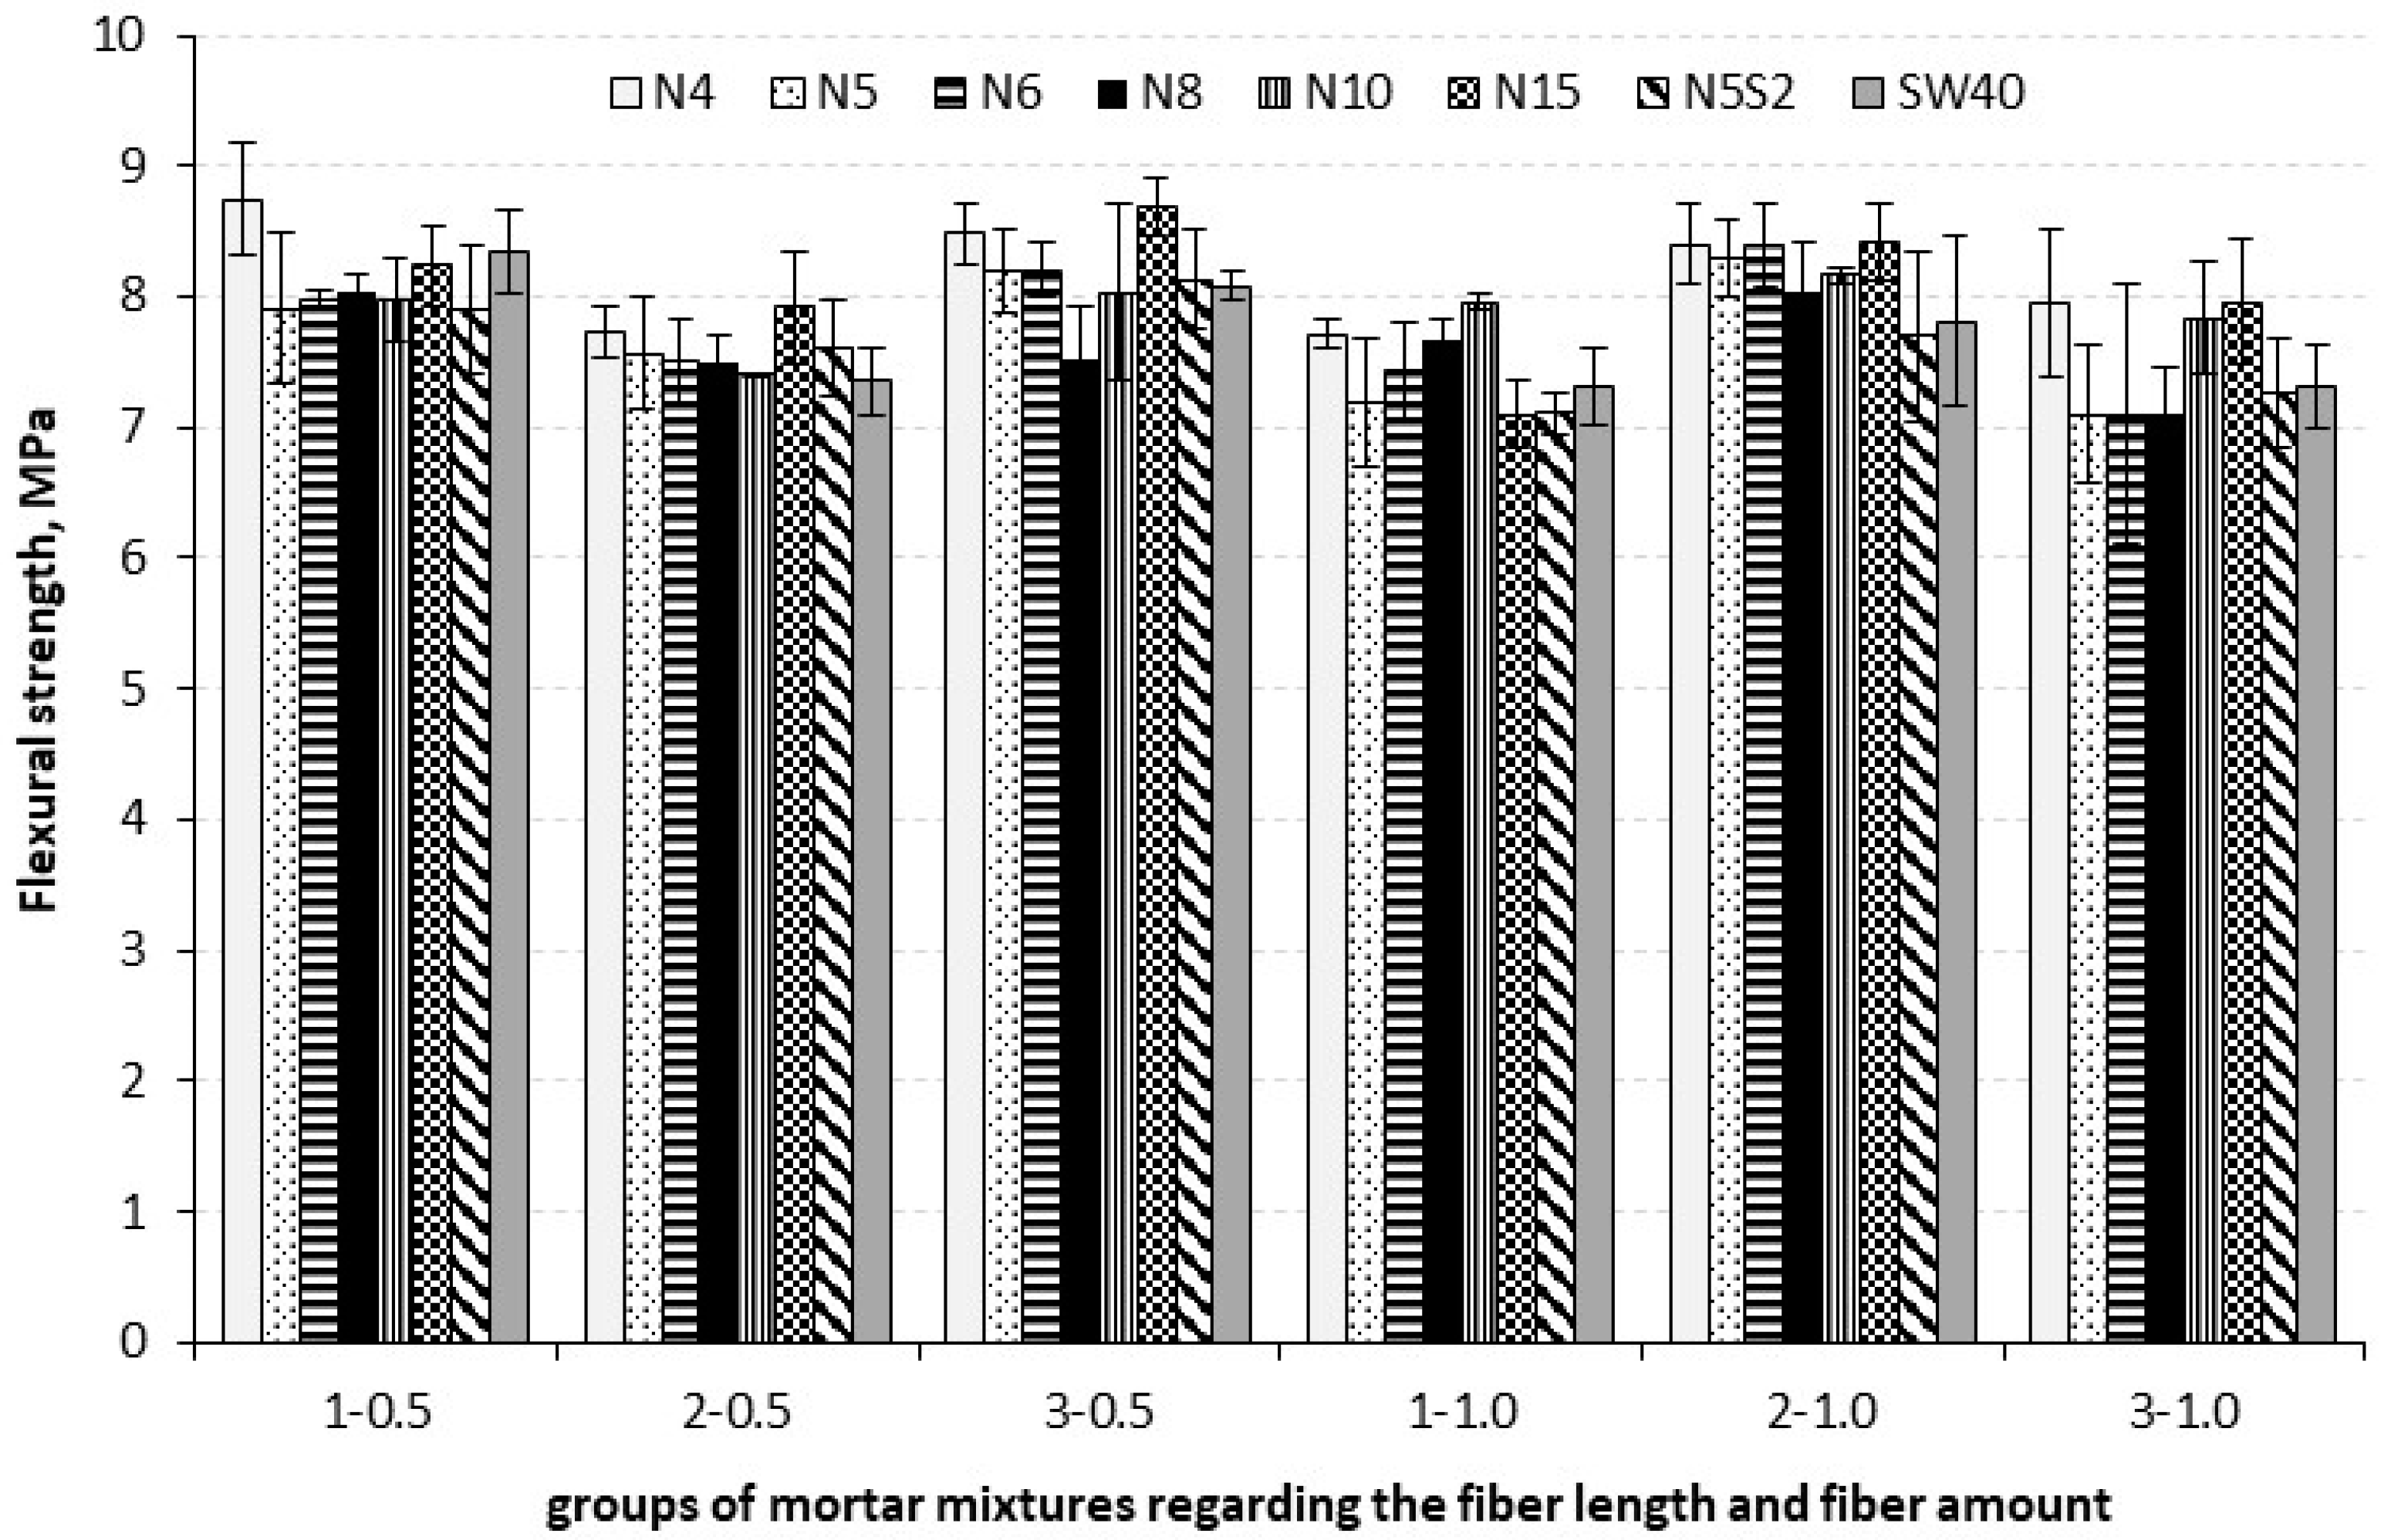
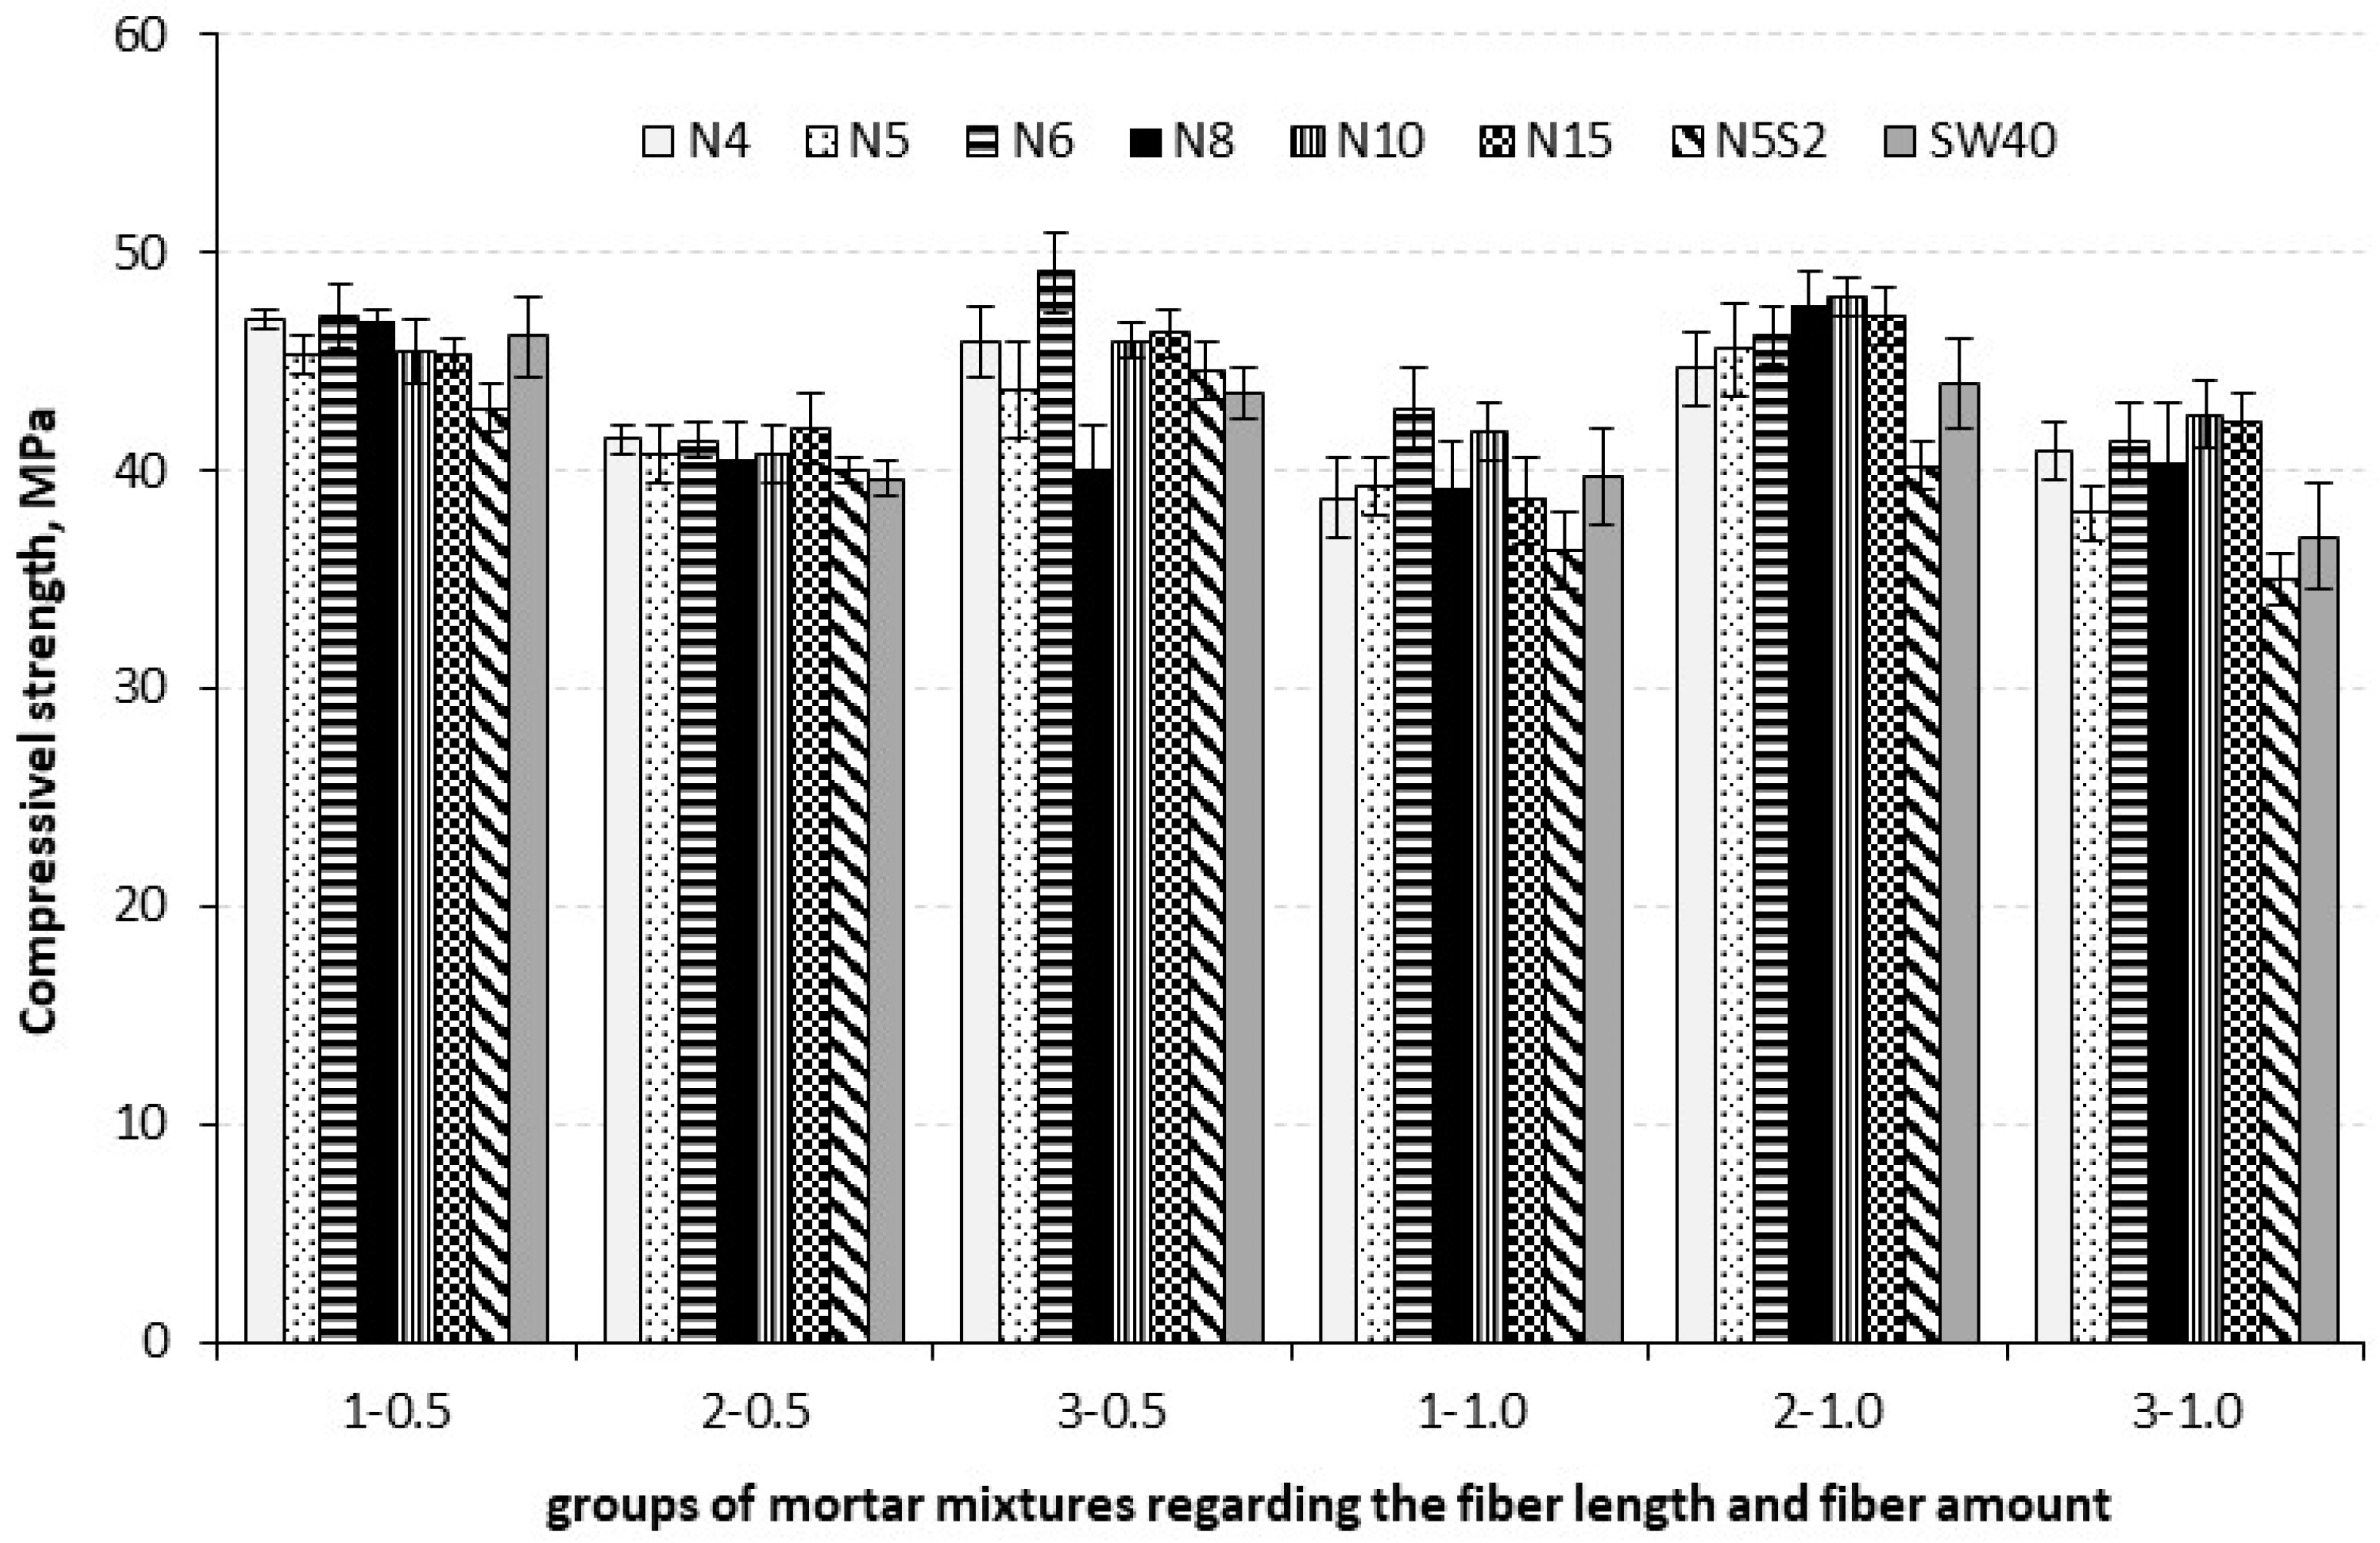
3.2. Influence of Fibre Length and amount on the Compressive and Flexural Strength

Figure 12 and Figure 13 show flexural and compressive strength reinforced mortar specimens regarding to fibre length. According to Figure 12, for fibres 1 cm and 3 cm long, the results of flexural strength at 0.5% fibre content are about 9% higher compared to flexural strength at 1% fibre volume content. With 2 cm long fibres, the situation is reversed. Considering the maceration method, the highest average value of flexural strength was achieved by mixtures N4 and N15. Spanish Broom branches in 4% NaOH were kept on average for about 28 days and in 15% NaOH for 8 days. According to Table 1, N15 fibres have almost 7 times higher tensile strength.
The results for compressive strength are almost the same as for flexural strength, Figure 13. Mortars reinforced with fibres of 1 cm and 3 cm with a proportion of 0.5% have a value of 13.5% and 11.7% higher than mortars reinforced with fibres of the same length but with a proportion of 1%. In mortar reinforced with fibres of 2 cm, the compressive strength at a proportion of 1% is 11.2% higher than the compressive strength of mortar with a proportion of fibres of 0.5%. Regarding the maceration method, the highest values were achieved by fibre-reinforced mortars from 6% and 10% NaOH solutions. Obviously, the inhomogeneity of the samples has a great influence on the obtained results, which was analyzed previously. A similar trend was obtained in Shah et al. [63]. They used sisal and coir fibers with different lengths of 1, 2 and 3 cm and various fiber concentrations of 0.5%, 1.0%, and 1.5% by mass of cement for reinforced concrete. Their results exhibit that the highest the compressive strength had hybrid (sisal/coir) fiber reinforced concrete with the length of 20 mm and with 0.5% concentration, the coir fiber reinforced concrete and sisal fiber reinforced concrete with the length of 10 mm and with 1% concentration. The split tensile strength was increased by coir fiber reinforced concrete with the length of 10 mm and with 1.5% concentration, sisal fiber reinforced concrete with the length of 30 mm and with 1% concentration and hybrid fiber reinforced concrete with the length of 20 mm and with 1% concentration.

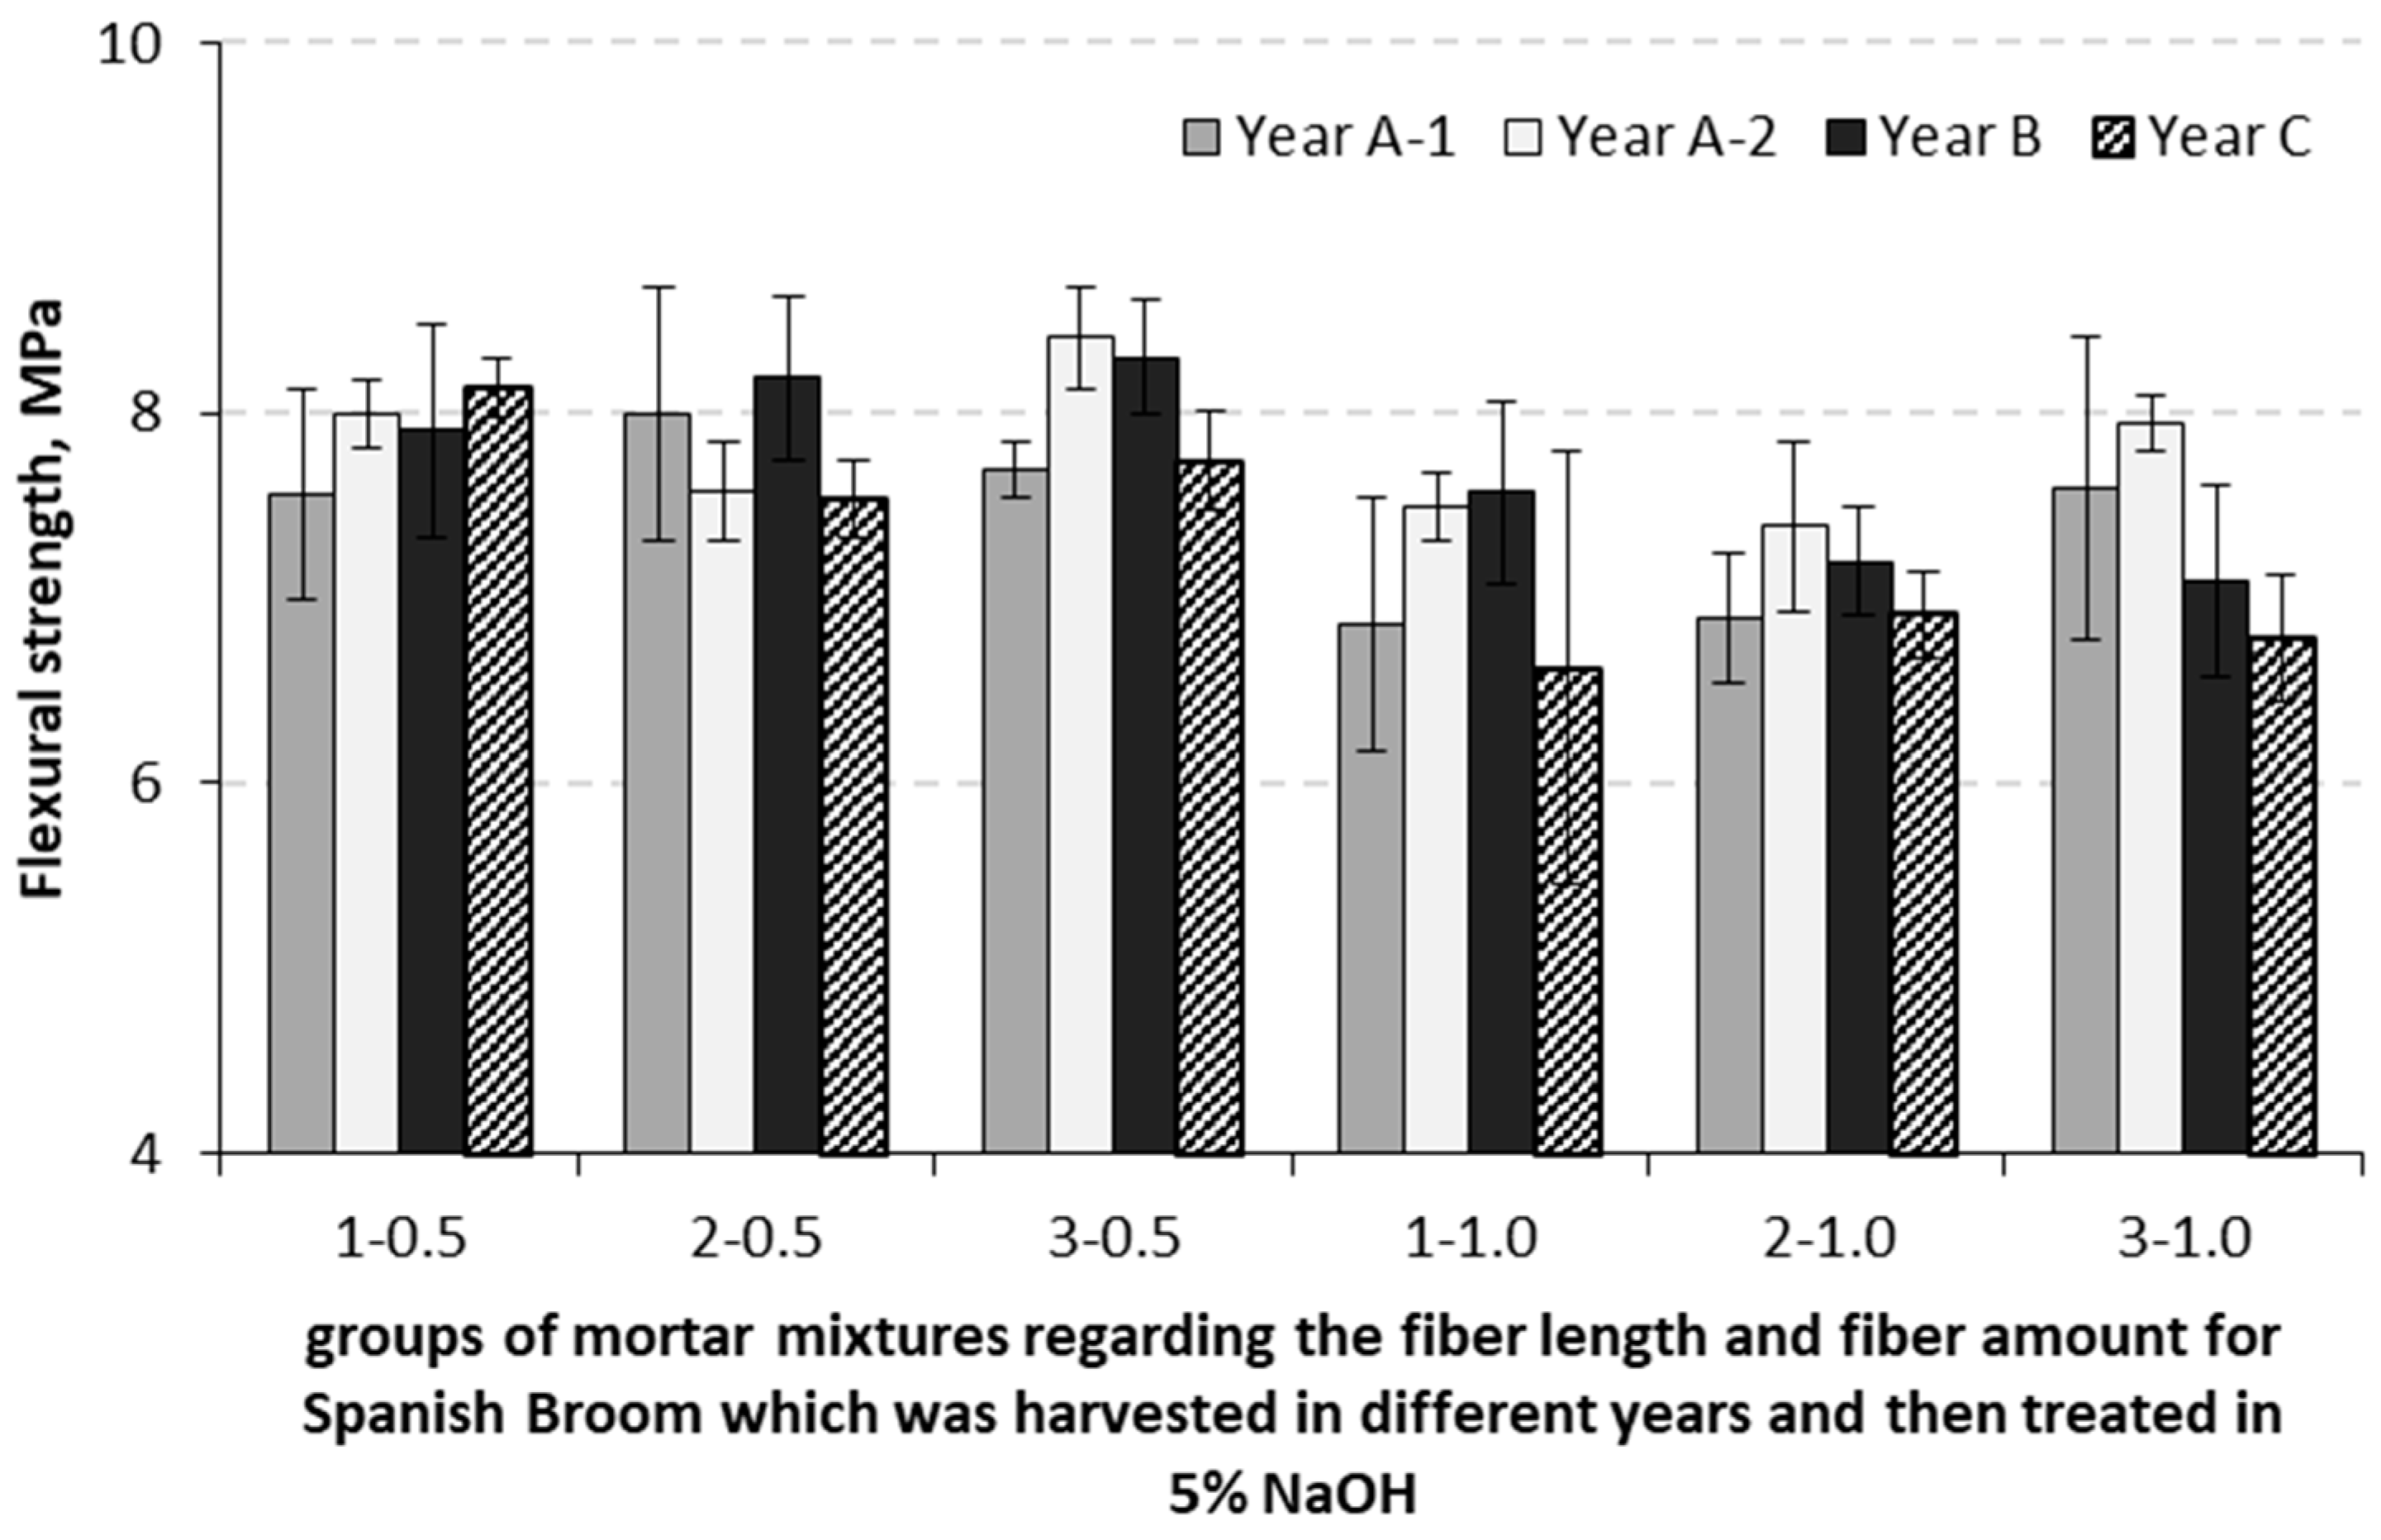
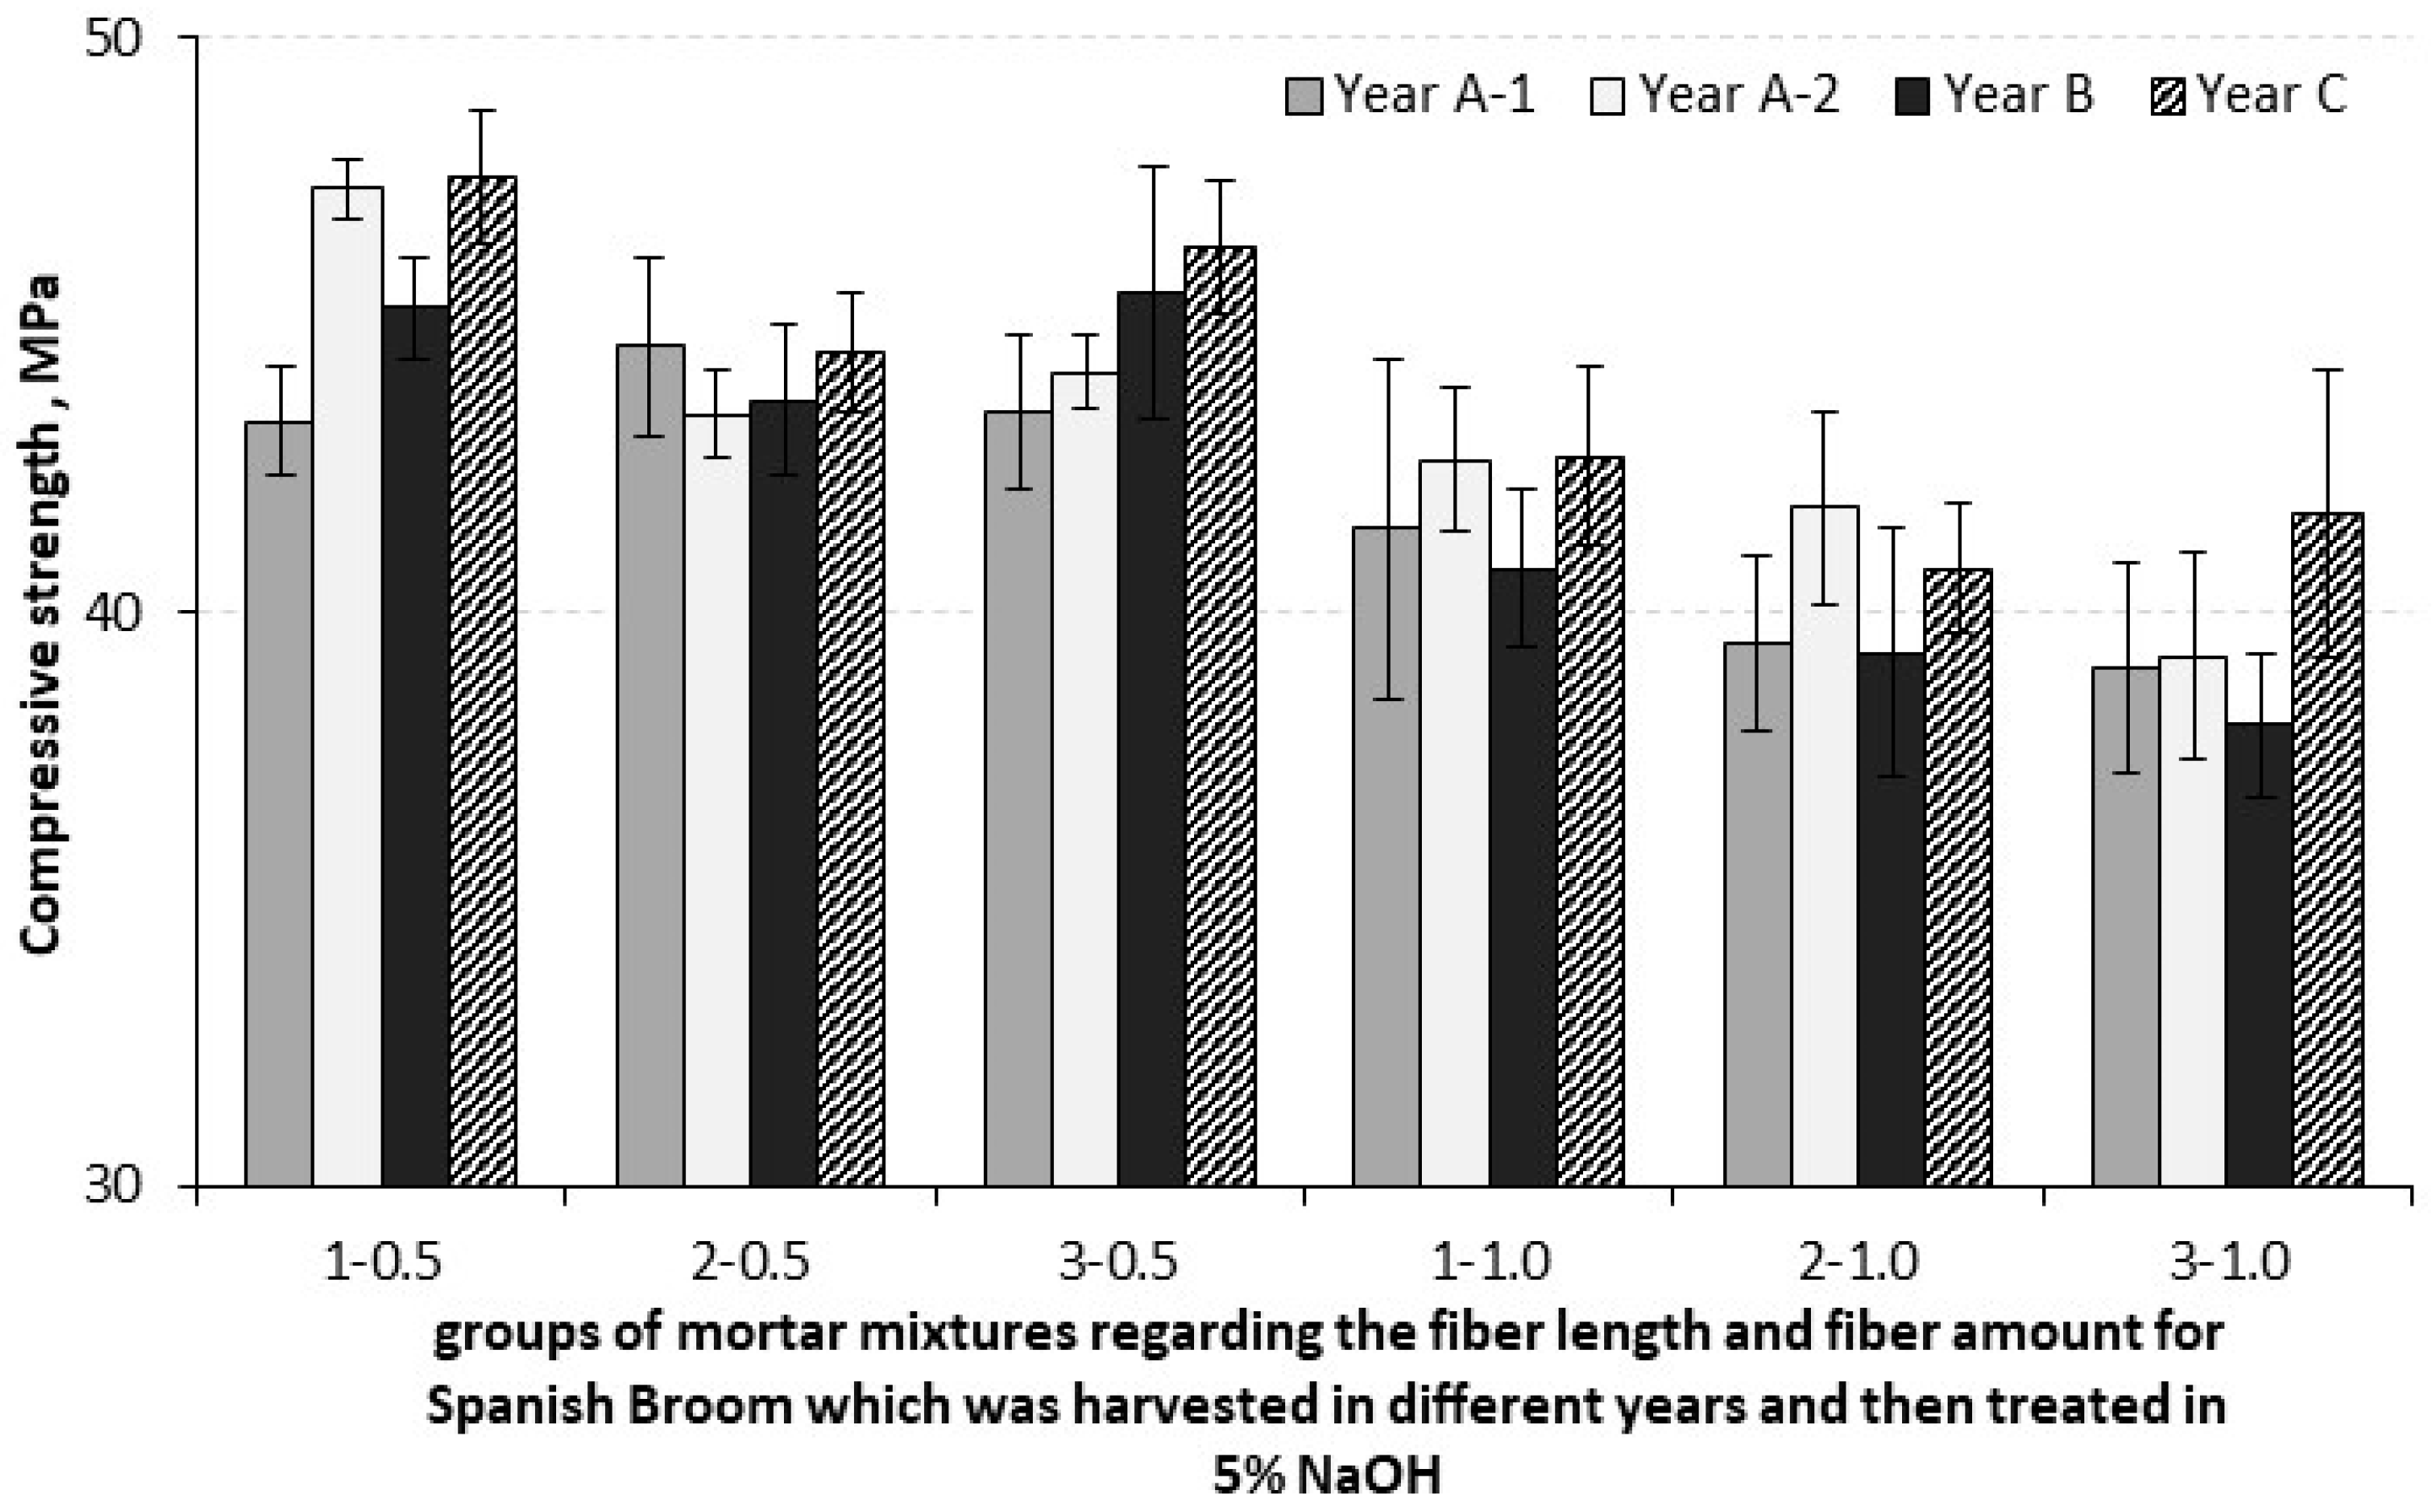
3.3. Influence of Three Consecutive Year of Harvesting on Compressive and Flexural Strength for Reinforced Mortar Specimens

In order to determine the influence of the harvest year on the characteristics of fibres and cement composites, the test results of 3 consecutive years were observed. Those three years are marked as years A, B and C. For all three years, fibres were obtained by immersing twigs in a 5% NaOH solution. In year A, 2 different samples were made: Year A-1 (branches were 15 days in 5% NaOH) and Year A-2 (branches were 19 days in 5% NaOH), then Year B (branches were 32 days in 5% NaOH) and Year C (branches were 20 days in 5% NaOH). The immersion time of the branches in the solution was chosen according to whether the fibres could be separated from the woody part. In the year A-1, the time of 15 days was short, so the separation of the fibres was performed by rubbing the branches against a rough concrete surface. Washed and dried fibres were manually cut to lengths of 1, 2 and 3 cm and mortar samples were made in the same way as previously described, and their composition can be represented in the same way as described for the N5 samples in Table 2. The mortar specimens were tested for flexural and compressive strength after 28 days and results are shown in Figure 11 and Figure 12, regarding the fibre length and fibre amount. Looking at the average values by year, which means for all lengths and amounts of fibre tested in that year, the best results for bending strength were achieved in Year B (7.83 MPa), and for compressive strength in Year C (43.95 MPa). The difference between the highest and lowest mean annual values of flexural and compressive strength is about 5%. The average results of flexural strength for Year A-1 and Year C are almost identical. They differ by 0.01 MPa and these are the lowest results. The lowest average annual compressive strength result was achieved by Year A-1. A lower proportion of fibres results in higher flexural and compressive strengths.
According to Figure 14, the highest individual flexural strength result was achieved by specimen N5-3-0.5 Year A-2 (8.41 MPa), with the fact that the average result of the entire group of samples with 3 cm long fibres in the amount of 0.5% is the highest (8.04 MPa).
The highest individual compressive strength was achieved by the specimen N5-1-0.5 Year C (47.59 MPa) and also the average result of the whole group of specimens with fibres of 1 cm length in the amount of 0, 5% is the largest (45.91 MPa), Figure 15. 3D reconstructions of specimens are shown in Figure 10c,g,h,i. According to the given figures, it is not possible to see any difference in the specimens.
Spanish Broom (Spartium junceum L.) as a characteristic plant species of the coastal limestone rocks of the Mediterranean and southwestern Europe. It grows in an area with a Mediterranean type of climate characterised by dry and hot summers with very mild and rainy winters. Average summer temperatures range between 24 °C and 26 °C. In extremely warm years, July temperatures can reach up to 40 °C [64].
This plant is resistant to drought and heat [55], the shape of the stem is rush-like, which reduces the total exposed surface of the plant, while the root is well developed and branched [65].
For the purposes of this research, the branches of Spanish Broom were cut in the coastal area of the Kozjak Mountain, in the wider vicinity of the city of Split. Perennial, self-sprouting Spanish Broom bushes were randomly selected. Two-year-old branches, 20 to 30 cm long, were cut in the first half of August during Years A, B, and C. Meteorological data for the weather station Split Marjan was provided by the Croatian Meteorological and Hydrological Service (Zagreb, Croatia) [66]. Meteorological conditions for the mentioned years are shown in Figure 16 and Figure 17. Figure 16 shows average temperatures and rainfall, and years and Figure 17 shows minimum and maximum monthly temperatures for the 3 observed years. The beginning of the vegetative growth of Spanish Broom is specifically marked in green.
The beginning of vegetative growth in Spanish Broom was recorded from the end of March to the beginning of April in pedoclimatic conditions of central Italy (the city of Pisa), although as a rule it starts at the beginning of April, while during the winter months the growth of Spanish Broom was stagnant [55]. Spano et al. [67] claim that winter temperatures in the area of the city of Ortisano (Sardinia, Italy) are not low enough to cause stagnation in vegetation growth. Average daily temperatures during March and April in years A, B, and C were roughly the same, hovering around 14 °C, Figure 16. In the mentioned years, minimum daily wages temperatures, whose values were below 0 °C, were recorded in January, February and March. In January of year A, the lowest minimum daily temperature was recorded with the value of −7.2 °C, while in year B, the minimum daily temperatures were recorded in February (−5.2 °C) and in March (−2.5 °C), Figure 17. In March of year B, although the minimum recorded daily temperature was below 0 °C, the mean daily temperature was 10.6 °C, so it can be assumed that it did not influence the possible later start of the vegetative growth of Spanish Broom, which is confirmed by the results of the flexural strength test. The minimal daily temperature in year C was closer to 0 °C compared to the previous two years, in January its value was −0.5 °C and in February −1.9 °C.
In all observed years, the maximum daily temperatures reached the expected highest values in August. In year A, the highest recorded daily maximum temperature was 37.9 °C. The maximum daily temperatures in year B were in July and August with the same value of 35.6 °C. However, in year C, apart from August, the maximum daily temperature was also recorded in June with the same value of 36.7 °C. The total amount of precipitation in year A was 540.6 mm, in year B it was 868.4 mm, while in year C the total amount of precipitation was close to the previous year’s value, 883 mm. Considering that there are different results within year A itself (Figure 14 and Figure 15), it cannot be concluded that the rainfall in year A affected the quality of the fibres, compared to the other two years. For both strengths, Year A-2 achieved the second best result, so it can be concluded that the duration of the alkali treatment or the method of mixing/incorporating the specimens had a greater influence. According to Table 4, the specimen Year A-1 has the highest difference between mean and median values and the specimen Year A-2 has the lowest. This indicates greater inhomogeneity of the Year A-1 specimen, which is probably the result of the method of mixing and installation. The lowest monthly precipitation amounts were recorded in June (4.4 mm) and August (0.0 mm) of year A, where in August precipitation is completely absent. In year B, the lowest amounts of precipitation were recorded in July (14.1 mm) and August (11.1 mm), while in year C the lowest amounts of precipitation were recorded in February (9.7 mm) and in June (8.5 mm). The specified lowest amounts of precipitation are not recorded during the spring vegetative growth of Spanish Broom, Figure 16.
Flowering is considered one of the most important phenological stages by which the sensitivity of the plant to the weather can be assessed, and a connection between temperature and the beginning of the flowering phenophase was observed in the Spanish Broom, while differences in the amount of precipitation had little effect [67]. Despite the variability of weather conditions, there were no significant differences in the flowering dates of Spanish Broom [68].
Considering that Spanish Broom is resistant to drought and does not show variability in the flowering phenophase, it can be assumed that different weather conditions during the growth and development of the plant should not significantly affect the differences in fibre properties. As mentioned in the introduction, some research on other plant species [34,35,36,37] has shown that there is no significant influence of the weather on the properties of the examined fibres, although some authors report differences in the length and number of fibres depending on the air temperature.

4. Conclusions

In this paper, the properties of cement mortars reinforced with Spanish Broom fibres, which were treated in different solutions, of different lengths and proportions, were examined. Based on the obtained results, it is possible to conclude:
  • In the investigation conducted here, it is not possible to establish a correlation between the concentration of the maceration solution and the tensile strength of the fibres. Fibres from 5%, 8% and 15% NaOH solution achieved the highest tensile strength.
  • The results of the FITR spectrum test show that the success of the maceration process does not depend on whether the macerated plants are freshly harvested or almost dry. This means that after the summer harvest, fibre separation can be carried out throughout the year as needed. At the same time results of application of XRD shown that separated fibers of cellulose have a structurally ordered form as Cellulose Iα, and Cellulose Iβ.
  • The maceration effect reduces the lignin content in the fibres, so the same alkali solution can be used for at least five preparations. The reuse of the same solution contributes to the preservation of the environment.
  • The higher flexural and compressive strength was found to be achieved in the specimens with 1 and 3 cm long fibres and a content of 0.5%, while for 2 cm long fibres, higher results are obtained with 1% fibre content.
  • No connection has been established between the tensile strength of the fibres and the strength of the reinforced mortar. Mortars with fibres from 4% and 15% NaOH solutions achieved higher flexural strength, while mortars with fibres from 6% and 10% NaOH achieved higher compressive strength. Considering the results achieved, it is optimal to macerate the fibres in 15% NaOH, because this concentration is the fastest way to separate the fibres.
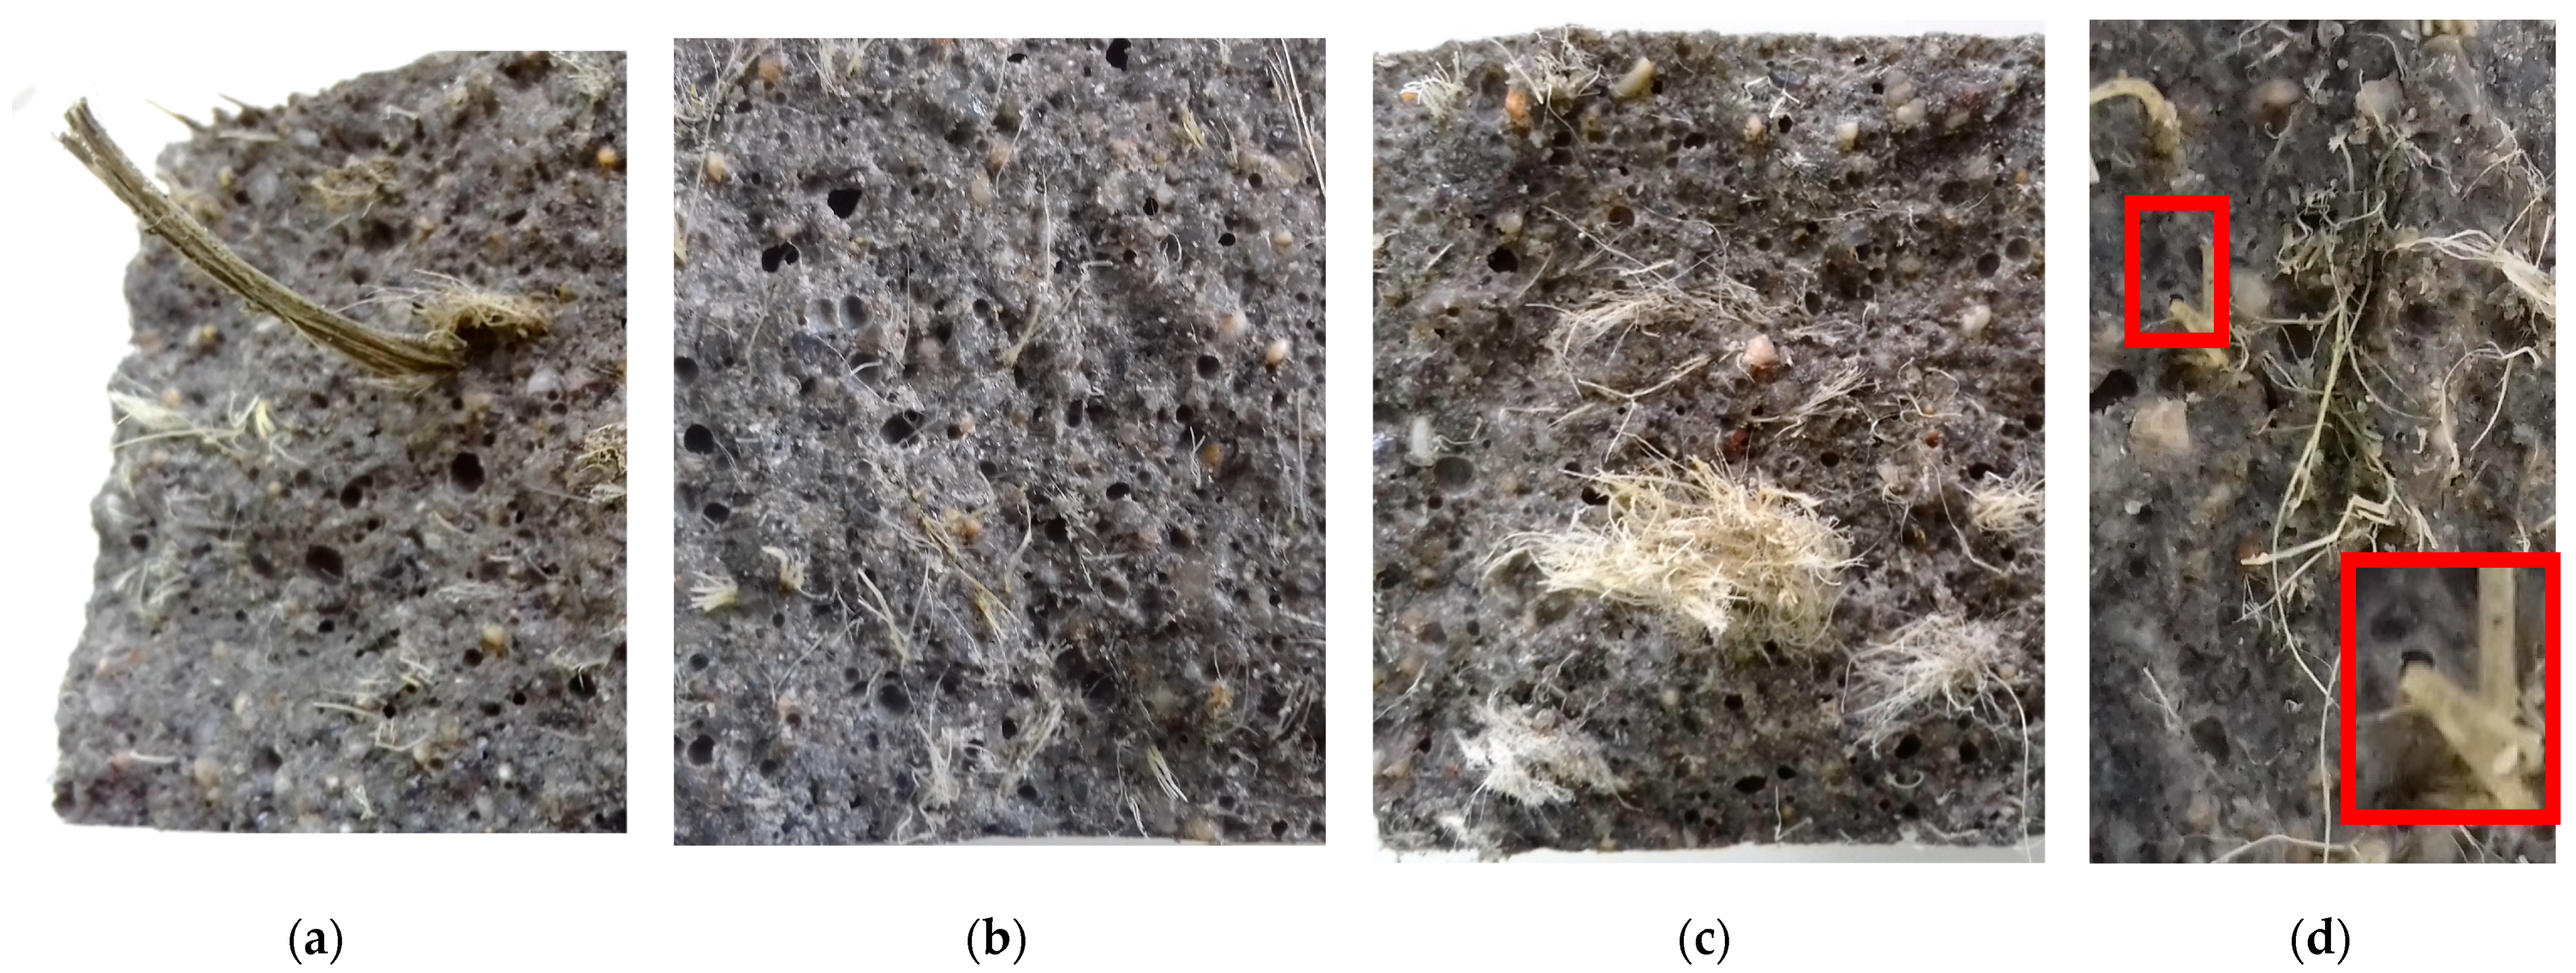
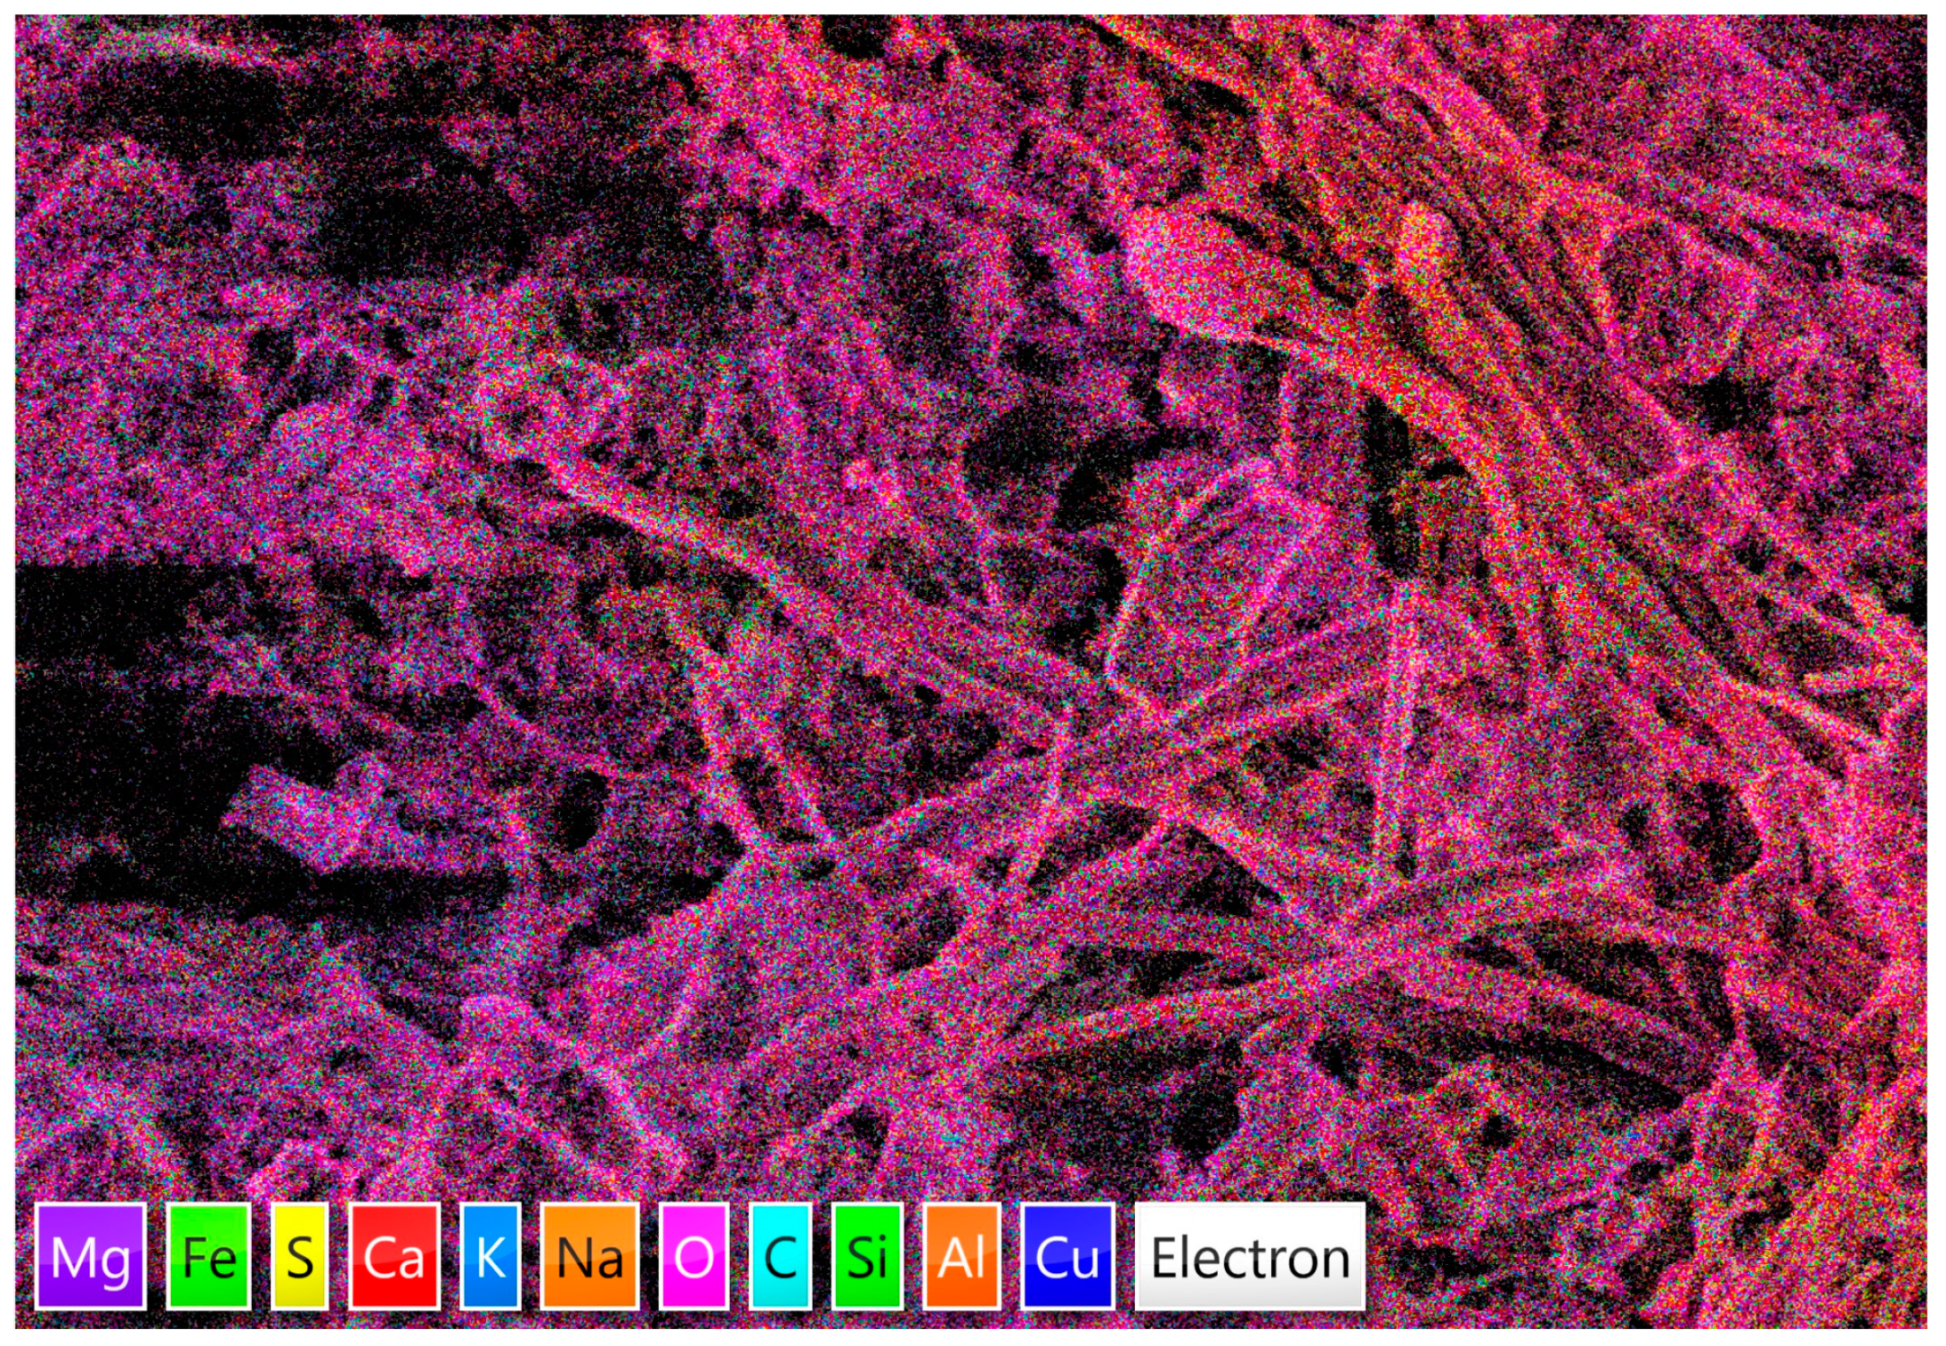
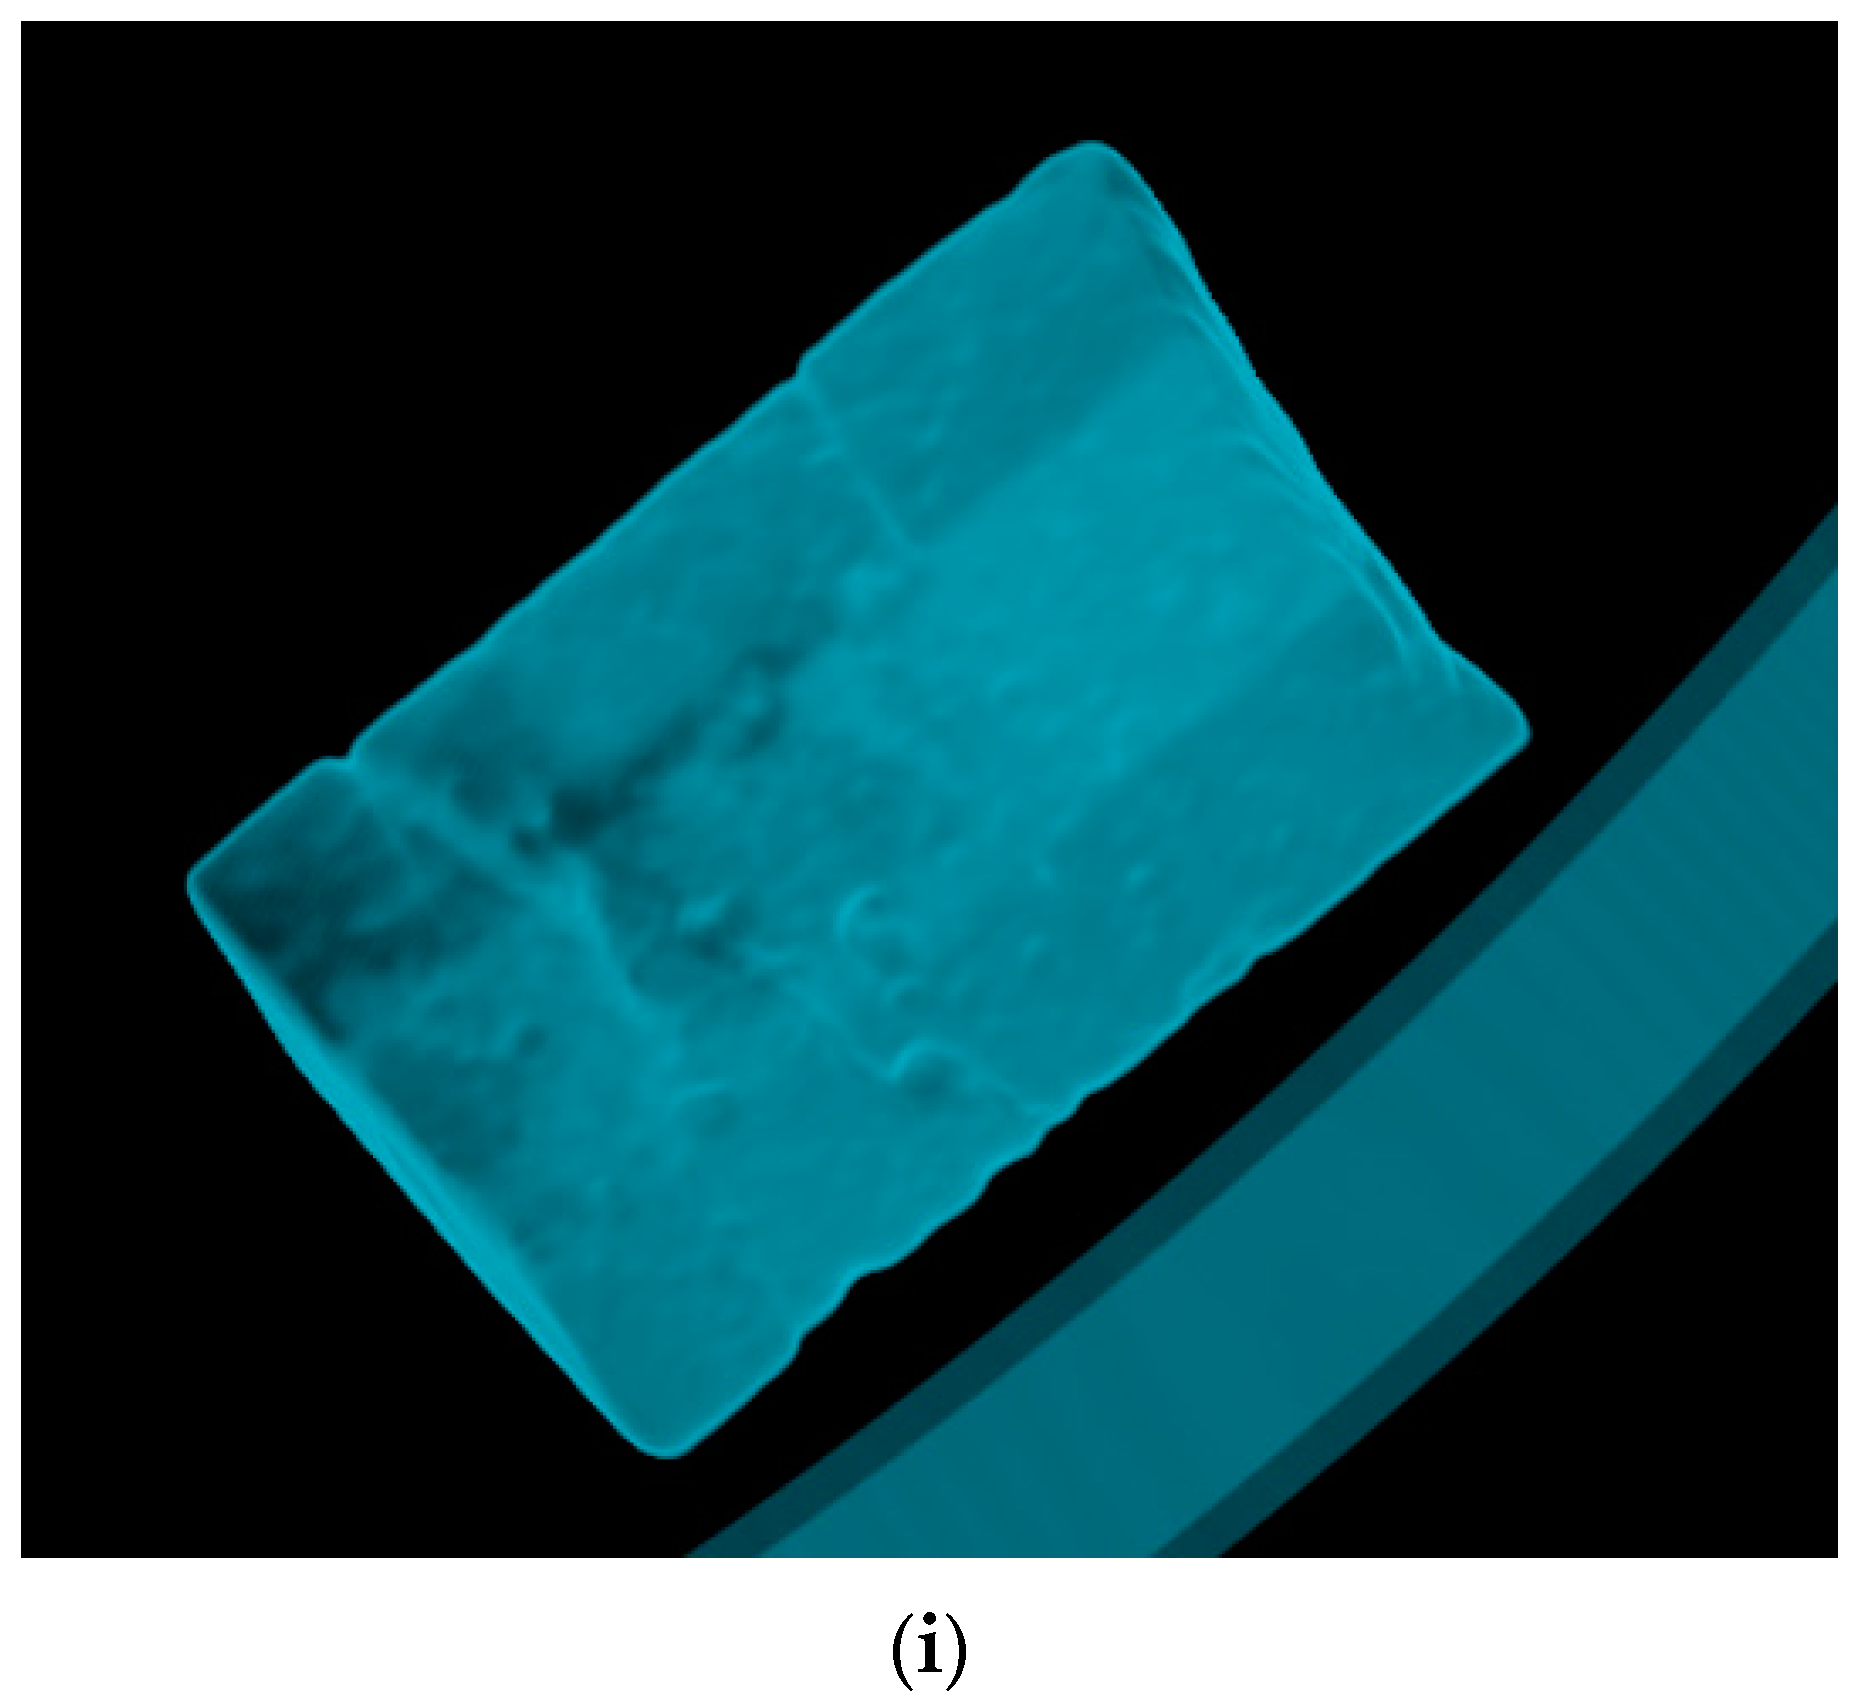
  • A visual inspection of the half prisms after testing the bending strength revealed the main problems with the installation of natural fibres: fibres with a large diameter, bundles of fibres in specimen, weak or no contact zone between fibre and cement matrix. SEM/EDS analysis showed that the fibres are integrated into the cement matrix, but there is not a strong interaction.
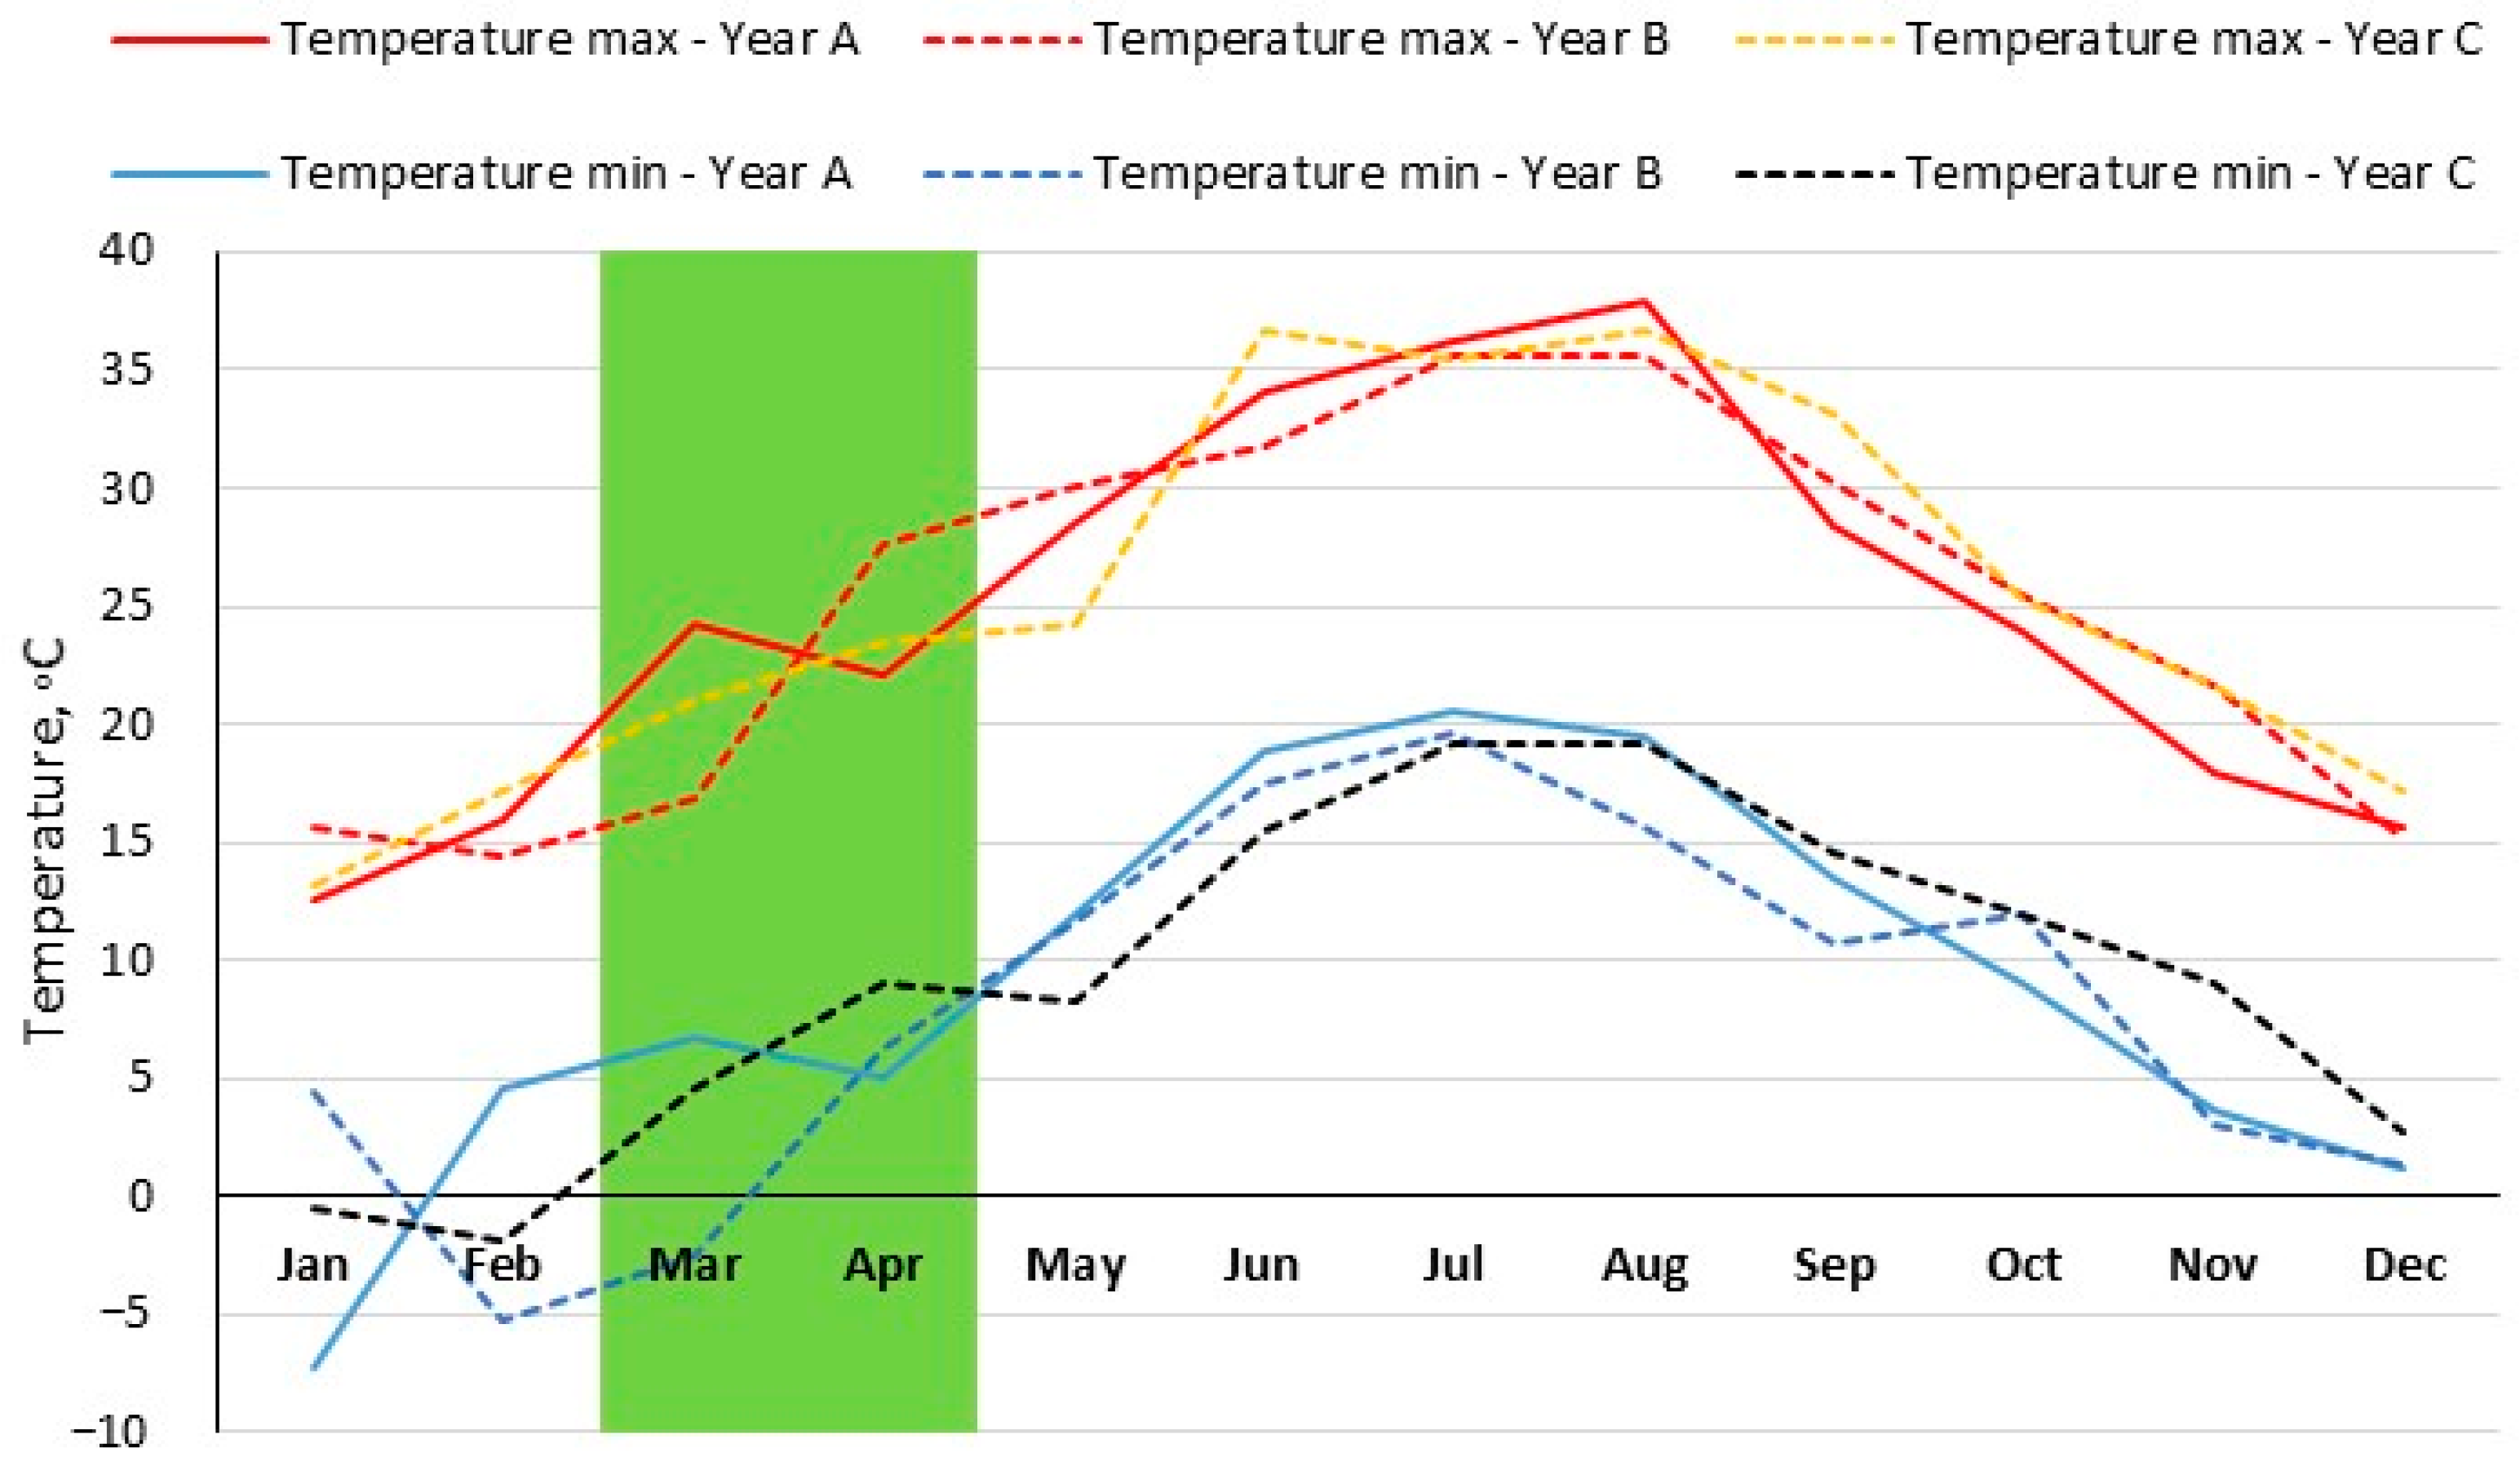
  • Spanish Broom is a very resistant plant and for the three consecutive years it was not observed that meteorological conditions affected the quality of fibres and cement mortars.
The testing carried out in this study should be extended to testing mortar/concrete specimens aged 90 and 365 days, testing the influence of fibres on the deformations of mortar/concrete in terms of shrinkage, as well as the behaviour of fibres in terms of durability.

Author Contributions

Conceptualisation, S.J. and D.J.; methodology, S.J., D.J. and I.N.G.; validation, S.J., D.J., I.N.G., A.P. and A.Č.; formal analysis, S.J., D.J., I.N.G., A.P. and A.Č.; investigation, S.J., D.J., I.N.G., A.P. and A.Č.; resources, F.M., S.J., D.J. and I.N.G.; data curation, S.J., D.J. and I.N.G.; writing—original draft preparation, S.J., D.J.; writing—review and editing, I.N.G., A.P., A.Č. and F.M.; visualisation, S.J., D.J., A.Č. and F.M.; supervision, S.J., I.N.G. and D.J.; project administration, I.N.G., A.P., A.Č. and F.M.; funding acquisition, I.N.G., D.J. and S.J. All authors have read and agreed to the published version of the manuscript.

Funding

This research received no external funding.

Data Availability Statement

The data presented in this study are available from the corresponding author upon request.

Acknowledgments

This research is partially supported through project KK.01.1.1.02.0027, a project co-financed by the Croatian Government and the European Union through the European Regional Development Fund—the Competitiveness and Cohesion Operational Programme and Functional integration of the University of Split, PMF-ST, PF-ST and KTF-ST through the development of scientific research infrastructure in the building of three faculties (KK.01.1.1.02.0018); the project was co-financed by the European Union from the European Regional Development Fund. The authors are also grateful for financial support within the project KK.01.2.1.02.0206 “Istraživanje i razvoj metoda zaštite građevinske jame: prednapeti AB roštilj (soil press metoda), BBR Adria d.o.o.” which has received funding from European Regional Development Fund, Operational Programme “Competitiveness and Cohesion 2014–2020”, as well as for financial support of University North within the project “Trajnost cementnih kompozita”.

Conflicts of Interest

The authors declare no conflict of interest.

References

  1. Onuaguluchi, O.; Banthia, N. Plant-based natural fibre reinforced cement composites: A review. Cem. Concr. Compos. 2016, 68, 96–108. [Google Scholar] [CrossRef]
  2. Bahekar, P.V.; Gadve, S.S. Corrosion of rebar in carbon fibre reinforced polymer bonded reinforced concrete. Adv. Concr. Constr. 2019, 8, 247–255. [Google Scholar] [CrossRef]
  3. Katman, H.Y.B.; Khai, W.J.; Bheel, N.; Kırgız, M.S.; Kumar, A.; Benjeddou, O. Fabrication and Characterization of Cement-Based Hybrid Concrete Containing Coir Fibre for Advancing Concrete Construction. Buildings 2022, 12, 1450. [Google Scholar] [CrossRef]
  4. Page, J.; Khadraoui, F.; Boutouil, M.; Gomina, M. Multi-physical properties of a structural concrete incorporating short flax fibres. Constr. Build. Mater. 2017, 140, 344–353. [Google Scholar] [CrossRef]
  5. Ogunbode, E.B.; Egba, E.I.; Olaiju, O.A.; Elnafaty, A.S.; Kawuwa, S.A. Microstructure and mechanical properties of Green concrete composites containing coir fibre. Chem. Eng. Trans. 2017, 61, 1879–1884. [Google Scholar] [CrossRef]
  6. Booya, E.; Gorospe, K.; Ghaednia, H.; Das, S. Durability properties of engineered pulp fibre reinforced concretes made with and without supplementary cementitious materials. Compos. B Eng. 2019, 172, 376–386. [Google Scholar] [CrossRef]
  7. Alcivar-Bastidas, S.; Petroche, D.M.; Martinez-Echevarria, M.J. The effect of different treatments on abaca fibers used in cementitious composites. J. Nat. Fibers. 2023, 20, 2177235. [Google Scholar] [CrossRef]
  8. Jami, T.; Karade, S.R.; Singh, L.P. A review of the properties of hemp concrete for green building applications. J. Clean. Prod. 2019, 239, 117852. [Google Scholar] [CrossRef]
  9. Sen, T.; Reddy, H.N.J. Various Industrial Applications of Hemp, Kinaf, Flax and Ramie Natural Fibres. Int. J. Innov. Manag. Technol. 2011, 2, 192–198. [Google Scholar]
  10. Imraan, M.; Ilyas, R.A.; Norfarhana, A.S.; Bangar, S.P.; Knight, V.F.; Norrrahim, M.N.F. Sugar palm (Arenga pinnata) fibres: New emerging natural fibre and its relevant properties, treatments and potential applications. J. Mater. Res. Technol. 2023, 24, 4551–4572. [Google Scholar] [CrossRef]
  11. da Fonseca, R.P.; Rocha, J.C.; Cheriaf, M. Mechanical Properties of Mortars Reinforced with Amazon Rainforest Natural Fibres. Materials 2020, 14, 155. [Google Scholar] [CrossRef] [PubMed]
  12. Kesikidou, F.; Stefanidou, M. Natural Fibre-Reinforced Mortars. J. Build. Eng. 2019, 25, 100786. [Google Scholar] [CrossRef]
  13. De Azevedo, A.R.G.; Marvila, M.T.; Tayeh, B.A.; Cecchin, D.; Pereira, A.C.; Monteiro, S.N. Technological Performance of Açaí Natural Fibre Reinforced Cement-Based Mortars. J. Build. Eng. 2021, 33, 101675. [Google Scholar] [CrossRef]
  14. Jabbar, A.; Militký, J.; Wiener, J.; Kale, B.M.; Ali, U.; Rwawiire, S. Nanocellulose coated woven jute/green epoxy composites: Characterization of mechanical and dynamic mechanical behavior. Compos. Struct. 2017, 161, 340–349. [Google Scholar] [CrossRef]
  15. Yamini, P.; Rokkala, S.; Rishika, S.; Rani, P.M.; Kumar, R.A. Mechanical properties of natural fibre reinforced composite structure. Mater. Today Proc. 2023. [Google Scholar] [CrossRef]
  16. Hamada, H.M.; Shi, S.; Al Jawahery, M.S.; Majdi, A.; Yousif, S.T.; Kaplan, G. Application of Natural Fibres in Cement Concrete: A Critical Review. Mater. Today Commun. 2023, 35, 105833. [Google Scholar] [CrossRef]
  17. Thyavihalli Girijappa, Y.G.; Mavinkere Rangappa, S.; Parameswaranpillai, J.; Siengchin, S. Natural Fibres as Sustainable and Renewable Resource for Development of Eco-Friendly Composites: A Comprehensive Review. Front. Mater. 2019, 6, 226. [Google Scholar] [CrossRef] [Green Version]
  18. Juradin, S.; Boko, I.; Netinger Grubeša, I.; Jozić, D.; Mrakovčić, S. Influence of different treatment and amount of Spanish Broom and hemp fibres on the mechanical properties of reinforced cement mortars. Constr. Build. Mater. 2021, 273, 121702. [Google Scholar] [CrossRef]
  19. Ji, Y.; Zou, Y.; Ma, Y.; Wang, H.; Li, W.; Xu, W. Frost Resistance Investigation of Fibre-Doped Cementitious Composites. Materials 2022, 15, 2226. [Google Scholar] [CrossRef]
  20. Neto, J.S.S.; de Queiroz, H.F.M.; Aguiar, R.A.A.; Banea, M.D. A Review on the Thermal Characterisation of Natural and Hybrid Fibre Composites. Polymers 2021, 13, 4425. [Google Scholar] [CrossRef] [PubMed]
  21. Fan, M.; Naughton, A. Mechanisms of thermal decomposition of natural fibre composites. Compos. B Eng. 2016, 88, 1–10. [Google Scholar] [CrossRef]
  22. Kurien, R.A.; Anil, M.M.; Mohan, S.L.S.; Thomas, J.A. Natural fibre composites as sustainable resources for emerging applications—A review. Mater. Today Proc. 2023; in press. [Google Scholar] [CrossRef]
  23. Hasan, A.; Rabbi, M.S.; Billah, M.M. Making the lignocellulosic fibres chemically compatible for composite: A comprehensive review. Clean. Mater. 2022, 4, 100078. [Google Scholar] [CrossRef]
  24. Sawsen, C.; Fouzia, K.; Mohamed, B.; Moussa, G. Effect of flax fibres treatments on the rheological, the mechanical behavior of a cement composite. Constr.Build. Mater. 2015, 79, 229–235. [Google Scholar] [CrossRef]
  25. Page, J.; Khadraoui, F.; Gomina, M.; Boutouil, M. Influence of different surface treatments on the water absorption capacity of flax fibres: Rheology of fresh reinforced-mortars, mechanical properties in the hardened state. Constr. Build. Mater. 2019, 199, 424–434. [Google Scholar] [CrossRef]
  26. Alavudeen, A.; Rajini, N.; Karthikeyan, S.; Thiruchitrambalam, M.; Venkateshwaren, N. Mechanical properties of banana/kenaf fibre-reinforced hybrid polyester composites: Effect of woven fabric and random orientation. Mater. Des. 2015, 66, 246–257. [Google Scholar] [CrossRef]
  27. Yousif, B.F.; Shalwan, A.; Chin, C.W.; Ming, K.C. Flexural properties of treated and untreated kenaf/epoxy composites. Mater. Des. 2012, 40, 378–385. [Google Scholar] [CrossRef]
  28. Edeerozey, A.M.M.; Akil, H.M.; Azhar, A.B.; Ariffin, M.I.Z. Chemical modification of kenaf fibres. Mater. Lett. 2007, 61, 2023–2025. [Google Scholar] [CrossRef]
  29. Aravindh, M.; Sathish, S.; Ranga Raj, R.; Karthick, A.; Mohanavel, V.; Patil, P.P.; Muhibbullah, M.; Osman, S.M. A Review on the Effect of Various Chemical Treatments on the Mechanical Properties of Renewable Fibre-Reinforced Composites. Adv. Mater. Sci. Eng. 2022, 2022, 2009691. [Google Scholar] [CrossRef]
  30. Islam, M.S.; Pickering, K.L.; Foreman, N.J. Influence of alkali fibre treatment and fibre processing on the mechanical properties of hemp/epoxy composites. J. Appl. Polym. Sci. 2011, 119, 3696–3707. [Google Scholar] [CrossRef]
  31. Grubeša, I.N.; Marković, B.; Gojević, A.; Brdarić, J. Effect of hemp fibres on fire resistance of concrete. Constr. Build. Mater. 2018, 184, 473–484. [Google Scholar] [CrossRef]
  32. Isak, M.R.; Leman, Z.; Sapuan, S.M.; Salleh, M.Y.; Misri, S. The effect of sea water treatment on the influence and flexural strength of sugar palm fibre reinforced epoxy composites. Int. J. Mech. Mater. Eng. 2009, 4, 316–320. [Google Scholar]
  33. Juradin, S.; Boko, I.; Grubeša, I.N.; Jozić, D.; Mrakovčić, S. Influence of harvesting time and maceration method of Spanish Broom (Spartium junceum L.) fibres on mechanical properties of reinforced cement mortar. Constr. Build. Mater. 2019, 225, 243–255. [Google Scholar] [CrossRef]
  34. Lefeuvre, A.; Bourmaud, A.; Lebrun, L.; Morvan, C.; Baley, C. A Study of the Yearly Reproducibility of Flax Fibre Tensile Properties. Ind. Crops Prod. 2013, 50, 400–407. [Google Scholar] [CrossRef]
  35. Lefeuvre, A.; Bourmaud, A.; Morvan, C.; Baley, C. Tensile Properties of Elementary Fibres of Flax and Glass: Analysis of Reproducibility and Scattering. Mater. Lett. 2014, 130, 289–291. [Google Scholar] [CrossRef]
  36. Chemikosova, S.B.; Pavlencheva, N.V.; Gur’yanov, O.P.; Gorshkova, T.A. The Effect of Soil Drought on the Phloem Fibre Development in Long-Fibre Flax. Russ. J. Plant Physiol. 2006, 53, 656–662. [Google Scholar] [CrossRef]
  37. Lokhande, S.; Reddy, K.R. Quantifying Temperature Effects on Cotton Reproductive Efficiency and Fibre Quality. Agron. J. 2014, 106, 1275–1282. [Google Scholar] [CrossRef]
  38. Juradin, S.; Boko, I. Possibility of cement composite reinforcement by Spanish Broom fibres. Građevinar 2018, 70, 487–495. [Google Scholar] [CrossRef]
  39. Kondo, T. The assignment of IR absorption bands due to free hydroxyl groups in cellulose. Cellulose 1997, 4, 281–292. [Google Scholar] [CrossRef]
  40. Nelson, M.L.; O’Connor, T.R. Relation of Certain Infrared Bands to Cellulose Crystallinity and Crystal Lattice Type. Part 11. A New Infrared Ratio for Estimation of Crystallinity in Celluloses I and II. J. Appl. Polym. Sci. 1964, 8, 1325–1341. [Google Scholar] [CrossRef]
  41. Nelson, M.L.; O’Connor, T.R. Relation of Certain Infrared Bands to Cellulose Crystallinity and Crystal Latticed Type. Part I. Spectra of Lattice Types I, II, III and of Amorphous Cellulose. J. Appl. Polym. Sci. 1964, 8, 1311–1324. [Google Scholar] [CrossRef]
  42. Yang, Y.P.; Zhang, Y.; Lang, Y.X.; Yu, M.H. Structural ATR-IR analysis of cellulosic fibres prepared from a NaOH complex aqueous solution. IOP Conf. Ser. Mater. Sci. Eng. 2017, 213, 012039. [Google Scholar] [CrossRef]
  43. Zhang, S.-Y.; Wang, C.-G.; Fei, B.-H.; Yu, Y.; Cheng, H.-T.; Tian, G.-L. Mechanical Function of Lignin and Hemicelluloses in Wood Cell Wall Revealed with Microtension of Single Wood Fibre. BioResources 2013, 8, 2376–2385. [Google Scholar] [CrossRef] [Green Version]
  44. Qi, J.; Xie, J.; Hse, C.Y.; Shupe, T.F. Analysis of Phyllostachys pubescens Bamboo Residues for Liquefaction: Chemical Components, Infrared Spectroscopy, and Thermogravimetry. BioResources 2013, 8, 5644–5654. [Google Scholar] [CrossRef]
  45. nHRN EN 14889-2; Fibres for Concrete—Part 2: Polymer Fibres—Definition, Specifications and Conformity. CSI: Zagreb, Croatia, 2018.
  46. HRN EN 196-1:2016; Methods of Testing Cement—Part 1: Determination of Strength. CSI: Zagreb, Croatia, 2016.
  47. HRN EN 196-9:2010; Methods of Testing Cement—Part 9: Heat of Hydration—Semi-Adiabatic Method. CSI: Zagreb, Croatia, 2010.
  48. Benmansour, N.; Agoudjil, B.; Gherabli, A.; Kareche, A.; Boudenne, A. Thermal and mechanical performance of natural mortar reinforced with date palm fibers for use as insulating materials in building. Energy Build. 2014, 81, 98–104. [Google Scholar] [CrossRef]
  49. Ozerkan, N.G.; Ahsan, B.; Mansour, S.; Iyengar, S.R. Mechanical performance and durability of treated palm fiber reinforced mortars. Int. J. Sustain. Built Environ. 2013, 2, 131–142. [Google Scholar] [CrossRef] [Green Version]
  50. Kriker, A.; Bali, A.; Debicki, G.; Bouziane, M.; Chabannet, M. Durability of date palm fibres and their use as reinforcement in hot dry climates. Cem. Concr. Compos. 2008, 30, 639–648. [Google Scholar] [CrossRef]
  51. Benaimeche, O.; Carpinteri, A.; Mellas, M.; Ronchei, C.; Scorza, D.; Vantadori, S. The influence of date palm mesh fibre reinforcement on flexural and fracture behaviour of a cement-based mortar. Compos. B 2018, 152, 292–299. [Google Scholar] [CrossRef] [Green Version]
  52. Bamaga, S.O. The Influence of Silica Fume on the Properties of Mortars Containing Date Palm Fibres. Fibres 2022, 10, 41. [Google Scholar] [CrossRef]
  53. Sedan, D.; Pagnoux, C.; Smith, A.; Chotard, T. Mechanical properties of hemp fibre reinforced cement: Influence of the fibre/matrix interaction. J. Eur. Ceram. Soc. 2008, 28, 183–192. [Google Scholar] [CrossRef]
  54. Wang, L.; He, T.; Zhou, Y.; Tang, S.; Tan, J.; Liu, Z.; Su, J. The influence of fibre type and length on the cracking resistance, durability and pore structure of face slab concrete. Constr. Build. Mater. 2021, 282, 122706. [Google Scholar] [CrossRef]
  55. Angelini, L.G.; Lazzeri, A.; Levita, G.; Fontanelli, D.; Bozzi, C. Ramie (Boehmeria nivea (L.) Gaud.) and Spanish Broom (Spartium junceum L.) fibres for composite materials: Agronomical aspects, morphology and mechanical properties. Ind. Crops Prod. 2000, 11, 145–161. [Google Scholar] [CrossRef]
  56. Angelini, L.G.; Tavarini, S.; Foschi, L. Spanish Broom (Spartium junceum L.) as New Fiber for Biocomposites: The Effect of Crop Age and Microbial Retting on Fiber Quality. Conf. Pap. Sci. 2013, 2013, 274359. [Google Scholar] [CrossRef]
  57. Katović, D.; Katović, A.; Krnčević, M. Spanish Broom (Spartium junceum L.)—History and Perspective. J. Nat. Fibre 2011, 8, 81–89. [Google Scholar] [CrossRef]
  58. Ajouguim, S.; Page, J.; Djelal, C.; Waqif, M.; Saâdi, L. Investigation on the use of ground Alfa fibres as reinforcement of cement mortars. Proc. Inst. Civ. Eng. Constr. Mater. 2021, 174, 161–171. [Google Scholar] [CrossRef]
  59. Merta, I.; Tschegg, E.K. Fracture energy of natural fibre reinforced concrete. Constr. Build. Mater. 2013, 40, 991–997. [Google Scholar] [CrossRef]
  60. Stefanou, G.; Savvas, D.; Metsis, P. Random Material Property Fields of 3D Concrete Microstructures Based on CT Image Reconstruction. Materials 2021, 14, 1423. [Google Scholar] [CrossRef]
  61. Hou, M.; Acton, P.D. Understanding the tampon density and density gradient through computed tomography imaging. Text. Res. J. 2016, 86, 573–579. [Google Scholar] [CrossRef]
  62. Juradin, S.; Mihanović, F.; Ostojić-Škomrlj, N.; Rogošić, E. Pervious Concrete Reinforced with Waste Cloth Strips. Sustainability 2022, 14, 2723. [Google Scholar] [CrossRef]
  63. Shah, I.; Li, J.; Yang, S.; Zhang, Y.; Anwar, A. Experimental Investigation on the Mechanical Properties of Natural Fiber Reinforced Concrete. J. Renew. Mater. 2022, 10, 1307–1320. [Google Scholar] [CrossRef]
  64. Kovačić, S.; Nikolić, T.; Ruščić, M.; Milović, M.; Stamenković, V.; Mihelj, D.; Jasprica, N.; Bogdanović, S.; Topić, J. Flora Jadranske Obale i Otoka—250 Najčešćih Vrsta; Školska Knjiga: Zagreb, Croatia, 2008; ISBN 978-953-0-61289-1. (In Croatian) [Google Scholar]
  65. Bezić, N.; Dunkić, V.; Radonić, A. Anatomical and Chemical Adaptation of Spartium junceum L. in Arid Habitat. Acta Biol. Cracoviensia Ser. Bot. 2003, 45, 43–47. [Google Scholar]
  66. Croatian Meteorological and Hydrological Service, Zagreb, Croatia. Available online: https://meteo.hr/index_en.php (accessed on 20 May 2023).
  67. Spano, D.; Cesaraccio, C.; Duce, P.; Snyder, R.L. Phenological Stages of Natural Species and Their Use as Climate Indicators. Int. J. Biometeorol. 1999, 42, 124–133. [Google Scholar] [CrossRef]
  68. Spano, D.; Cesaraccio, C.; Duce, P.; Botarelli, L.; Pratizzoli, W.; Sacchetti, V. Response of some Phenological Garden Species to Inter-Annual Weather Variability. In Proceedings of the 17th Conference on Biometeorology and Aerobiology, San Diego, CA, USA, 22–26 May 2006; p. 4. Available online: https://ams.confex.com/ams/BLTAgFBioA/techprogram/programexpanded_353.htm (accessed on 20 May 2023).
Figure 1. (a) Spanish Broom shrub; (b) branches; (c) branches after immersion in the 4% NaOH solution and under the tap water; (d) same Spanish Broom fibres drying on room temperature.
Buildings 13 01910 g001
Figure 2. FTIR spectrum of the BS, N15 I and N15 V Spanish Broom fibres.
Buildings 13 01910 g002
Figure 3. XRD diffraction pattern of samples N15 I and N15 V (Iα—Cellulose Iα, Iβ—Cellulose Iβ, C—CaCO3).
Buildings 13 01910 g003
Figure 4. TG/DTG recordings of the N15 I, N15 II, N15 III, N15 IV, and N15 V Spanish Broom fibres.
Buildings 13 01910 g004
Figure 5. (a) Spanish Broom fibres after treatment in 15% and 4% NaOH; (b) Stress–stroke diagram for Spanish Broom fibres.
Buildings 13 01910 g005
Figure 6. (a) Mineral composition of CEM I 42.5 R.; (b) Standard quartz sand grading curve according to EN 196-1.
Buildings 13 01910 g006
Figure 7. Broken specimens after testing flexural strength: (a) SW40-3-1.0; (b) N15-2-0.5; (c) N8-2-1.0; (d) detail of fibre/cement matrix in broken specimen SW40-3-1.0. The detail of the contact zone between the fibre and the cement matrix is enlarged in the red square.
Buildings 13 01910 g007
Figure 8. SEM images of specimens (a) N8-3-1.0; (b) N5S2-3-1.0; (c) N15-2-0.5.
Buildings 13 01910 g008
Figure 9. SEM images of specimens, mapping of specimens N15-2-0.5.
Buildings 13 01910 g009
Figure 10. 3D visualisation of selected mortar specimens: (a) CM (b) N4-1-0.5; (c) N5-3-1.0, Year B (d) N6-2-0.5; (e) N15-2-1.0; (f) N5S2-3-1.0; (g) N5-3-1.0, Year A-1 (h) N5-3-1.0, Year A-2; (i) N5-3-1.0, Year C.
Buildings 13 01910 g010aBuildings 13 01910 g010bBuildings 13 01910 g010c
Figure 11. The bending-compressive strength ratio of the control mortar and fibre cement-based material with the same amount of fibre and fibre length according to the treatment method.
Buildings 13 01910 g011
Figure 12. Flexural strength of reinforced mortar specimens in regard to fibre length and fibre amount.
Buildings 13 01910 g012
Figure 13. Compressive strength of reinforced mortar specimens regarding to fibre length and fibre amount.
Buildings 13 01910 g013
Figure 14. Flexural strength of groups of mortar mixtures regarding the fibre length and fibre amount and the harvest year.
Buildings 13 01910 g014
Figure 15. Compressive strength of groups of mortar mixtures regarding the fibre length and fibre amount and the harvest year.
Buildings 13 01910 g015
Figure 16. Average temperatures and rainfall for three observed years.
Buildings 13 01910 g016
Figure 17. Minimum and maximum monthly temperatures for the 3 observed years.
Buildings 13 01910 g017
Table 1. Fibre properties.
FibreFibre DiameterσMAX, [N/mm2]σaverage, [N/mm2]
Average Diameter, [mm]Standard Deviation, [mm]
N40.680.1163.5443.73
N50.260.09593.97314.20
N60.440.11208.90115.49
N80.320.08510.49311.77
N100.400.16338.53188.87
N150.260.05522.13291.52
N5S20.620.13159.7678.76
SW400.940.0957.1039.41
Table 2. Mortar specimen composition and labels.
MixturesCement [g]Water [g]Standard Quartz Sand [g]Fibre [g]Fibre Length [cm]
CM4502251325--
NX-1-0.5 *45022513254.81
NX-1-1.0 *9.61
NX-2-0.5 *4.82
NX-2-1.0 *9.62
NX-3-0.5 *4.83
NX-3-1.0 *9.63
N5S2-1-0.545022513254.81
N5S2-1-1.09.61
N5S2-2-0.54.82
N5S2-2-1.09.62
N5S2-3-0.54.83
N5S2-3-1.09.63
SW40-1-0.545022513254.81
SW40-1-1.09.61
SW40-2-0.54.82
SW40-2-1.09.62
SW40-3-0.54.83
SW40-3-1.09.63
* X = 4, 5, 6, 8, 10 and 15.
Table 3. Compressive and flexural tensile strengths of mortar specimens after 28 days of curing. Relative compressive and flexural tensile strengths in relation to the reference mortar specimen (CM).
MixturesFlexural Strength [MPa]Standard Deviation [MPa]Relative Flexural Strength/CMCompressive Strength [MPa]Standard Deviation [MPa]Relative Compressive Strength/CM
CM8.470.511.0053.320.511.00
N4-1-0.58.740.431.0346.910.430.88
N4-1-1.07.720.200.9141.430.640.78
N4-2-0.58.480.231.0045.881.630.86
N4-2-1.07.710.110.9138.751.810.73
N4-3-0.58.310.310.9844.681.690.84
N4-3-1.07.520.570.8940.861.300.77
N5-1-0.57.910.580.9345.320.890.85
N5-1-1.07.570.430.8940.771.310.76
N5-2-0.58.190.310.9743.682.190.82
N5-2-1.07.200.500.8539.301.360.74
N5-3-0.58.300.290.9845.552.150.85
N5-3-1.07.100.520.8438.041.250.71
N6-1-0.57.970.070.9447.101.500.88
N6-1-1.07.510.330.8941.400.870.78
N6-2-0.58.200.210.9749.101.840.92
N6-2-1.07.430.380.8842.851.850.80
N6-3-0.58.390.320.9946.161.330.87
N6-3-1.07.091.000.8441.321.760.77
N8-1-0.58.030.130.8546.800.650.88
N8-1-1.07.500.200.8940.581.600.76
N8-2-0.57.530.400.8940.111.970.75
N8-2-1.07.670.150.9139.202.110.74
N8-3-0.58.030.380.9547.661.560.89
N8-3-1.07.090.370.8440.342.760.76
N10-1-0.58.310.330.9445.471.500.85
N10-1-1.07.380.010.8740.791.330.77
N10-2-0.58.430.670.9545.960.840.86
N10-2-1.08.010.060.9441.761.370.78
N10-3-0.58.240.060.9647.930.860.90
N10-3-1.07.490.430.9242.591.540.80
N15-1-0.58.240.300.9745.320.710.85
N15-1-1.07.920.430.9441.911.570.79
N15-2-0.58.690.221.0346.281.160.87
N15-2-1.07.100.260.8438.621.930.72
N15-3-0.58.420.300.9947.111.290.88
N15-3-1.07.960.480.9442.161.330.79
N5S2-1-0.57.910.490.9342.861.140.80
N5S2-1-1.07.620.370.9040.020.570.75
N5S2-2-0.58.130.380.9644.601.370.84
N5S2-2-1.07.110.150.8436.331.700.68
N5S2-3-0.57.700.650.9140.181.110.75
N5S2-3-1.07.260.420.8634.951.160.66
SW40-1-0.58.340.320.9846.141.830.87
SW40-1-1.07.350.250.8739.640.860.74
SW40-2-0.58.080.100.9543.531.210.82
SW40-2-1.07.300.300.8639.712.200.74
SW40-3-0.57.810.650.9243.972.120.82
SW40-3-1.07.320.320.8636.942.440.69
Table 4. The obtained Hounsfield values for mortar mixtures on MSCT.
Measured ValuesCMN4-1-0.5N5-3-1.0N6-2-0.5N15-2-1.0N5S2-3-1.0N5-3-1.0N5-3-1.0N5-3-1.0
Year BYear A-1Year A-2Year C
N *9999999910
Area [cm2]6.68122.37323.49622.48124.61423.68525.70024.58621.550
Minimum [HU]496.333−103.667−171.55632.889−153.778138.778−470.889−75.111−341.500
Maximum [HU]1880.8891811.3331833.5561838.8891871.0001863.8891841.3331830.5561891.600
Mean [HU]1668.4471503.1421433.3021504.4331456.1311451.1261446.5991483.8711392.129
Median [HU]1709.0001546.2221480.6671546.2221497.0001489.5561499.6671527.2221438.300
Standard deviation [HU]142.517176.524209.291169.888191.496190.227222.528185.733248.617
N *—number of CT slices per sample.
Disclaimer/Publisher’s Note: The statements, opinions and data contained in all publications are solely those of the individual author(s) and contributor(s) and not of MDPI and/or the editor(s). MDPI and/or the editor(s) disclaim responsibility for any injury to people or property resulting from any ideas, methods, instructions or products referred to in the content.

