Article

Effects of Mixture Proportions and Levels of Vibration on the Physical Characteristics and Durability of Concrete Used in Korean Pavements

1
Carbon Neutral Materials Center, Carbon Neutrality & Materials Digitalization Division, Korea Institute of Ceramic Engineering & Technology (KICET), 100 Soho-ro, Jinju-si 52851, Republic of Korea
2
Renewable Energy Business Team, Infrastructure Division, Kolon Global Corp, 11 Kolon-ro, Gwacheon-si 13837, Republic of Korea
3
Smart City Industry Support Center, Korea Agency for Infrastructure Technology Advancement, 286 Simin-daero, Anyang-si 14066, Republic of Korea
4
Department of Civil Engineering, Inha University, 100 Inha-ro, Incheon 22212, Republic of Korea
*
Author to whom correspondence should be addressed.
Buildings 2023, 13(9), 2384; https://doi.org/10.3390/buildings13092384
Submission received: 2 August 2023 / Revised: 4 September 2023 / Accepted: 14 September 2023 / Published: 19 September 2023
(This article belongs to the Special Issue Advanced Sustainable Low-Carbon Building Materials)

Abstract

:
This study investigated the effects of mixture proportions and vibration levels on the physical properties, durability and performance of concrete used in Korean pavements. The strength and durability characteristics varied depending on the mixture proportions and level of vibration, and samples with fly ash (i.e., F-CON) did not meet the strength and durability criteria when low levels of vibration were applied. Therefore, intermediate or higher levels of vibration should be applied to satisfy strength and durability criteria. Meanwhile, there was little difference in the performance tests (i.e., skid resistance, surface abrasion, and IRI) of concrete pavements depending on the mixture proportions and vibration levels. However, the sample with an intermediate level of vibration had a relatively higher performance than the other samples.

1. Introduction

Expressways in Korea are a key infrastructure for transportation, of which about 70% consist of concrete pavement [1]. Even though technologies such as concrete pavement design, concrete mix design, and construction performance have been gradually improving, compared to the past, the rate of early failure, such as cracks, settlement, and shrinkage in concrete pavement is increasing and has become a social problem [2,3,4]. In addition, the early failure of concrete pavement affects the durability, service life and performance of the pavement, so it is important to prevent early failure.
Meanwhile, vibration is an important factor when determining the construction quality of concrete pavement because it affects not only the durability of the concrete but also the performance of the pavement, as measured by international roughness index (IRI), British Pendulum Number (BPN), and surface abrasion depth [5,6]. Excessive vibration applied to concrete pavement can cause problems such as segregation and bleeding, and insufficient vibration produces a large amount of empty space in the concrete, causing poor strength and durability problems [6,7]. Thus, ACI regulates the range of vibration of concrete pavement as 6000~12,000 vpm (vibrations per minute) varying with the mixture proportions of concrete to secure the quality of concrete pavements and to prevent early failures [5,8].
On the other hand, in Korea, concrete pavement mixture proportions considering traffic volume, local climate, service life, etc., were suggested, but an appropriate vibration range varying with the mixture proportions was not proposed [9]. Thus, levels of vibration of about 7000~9000 vpm are applied arbitrarily without considering the mixture proportions of concrete. Therefore, in order to prevent early damage to concrete pavement and to secure the service life and performance, an appropriate level of vibration range should be proposed which varies with the concrete pavement mixture proportions.
In this study, the effects of mixture proportions and levels of vibration on the physical properties, durability, and performance of concrete used in Korean pavements were identified. To verify the effect of different levels of vibration on the concrete pavement, two different concrete mixture proportions, which were suggested by the Korea Expressway Corporation, and three different levels of vibration (high, intermediate, and low) were applied to the concrete.
The effect of vibration levels on the physical characteristics and durability of concrete pavement was verified through bleeding tests, float and modified-float tests, mechanical strength tests, density and water absorption tests, and freezing and thawing tests. Furthermore, the performance change in the concrete pavement according to the level of vibration was verified through skid resistance (BPN), surface abrasion resistance tests, and surface displacement variation (IRI) tests.

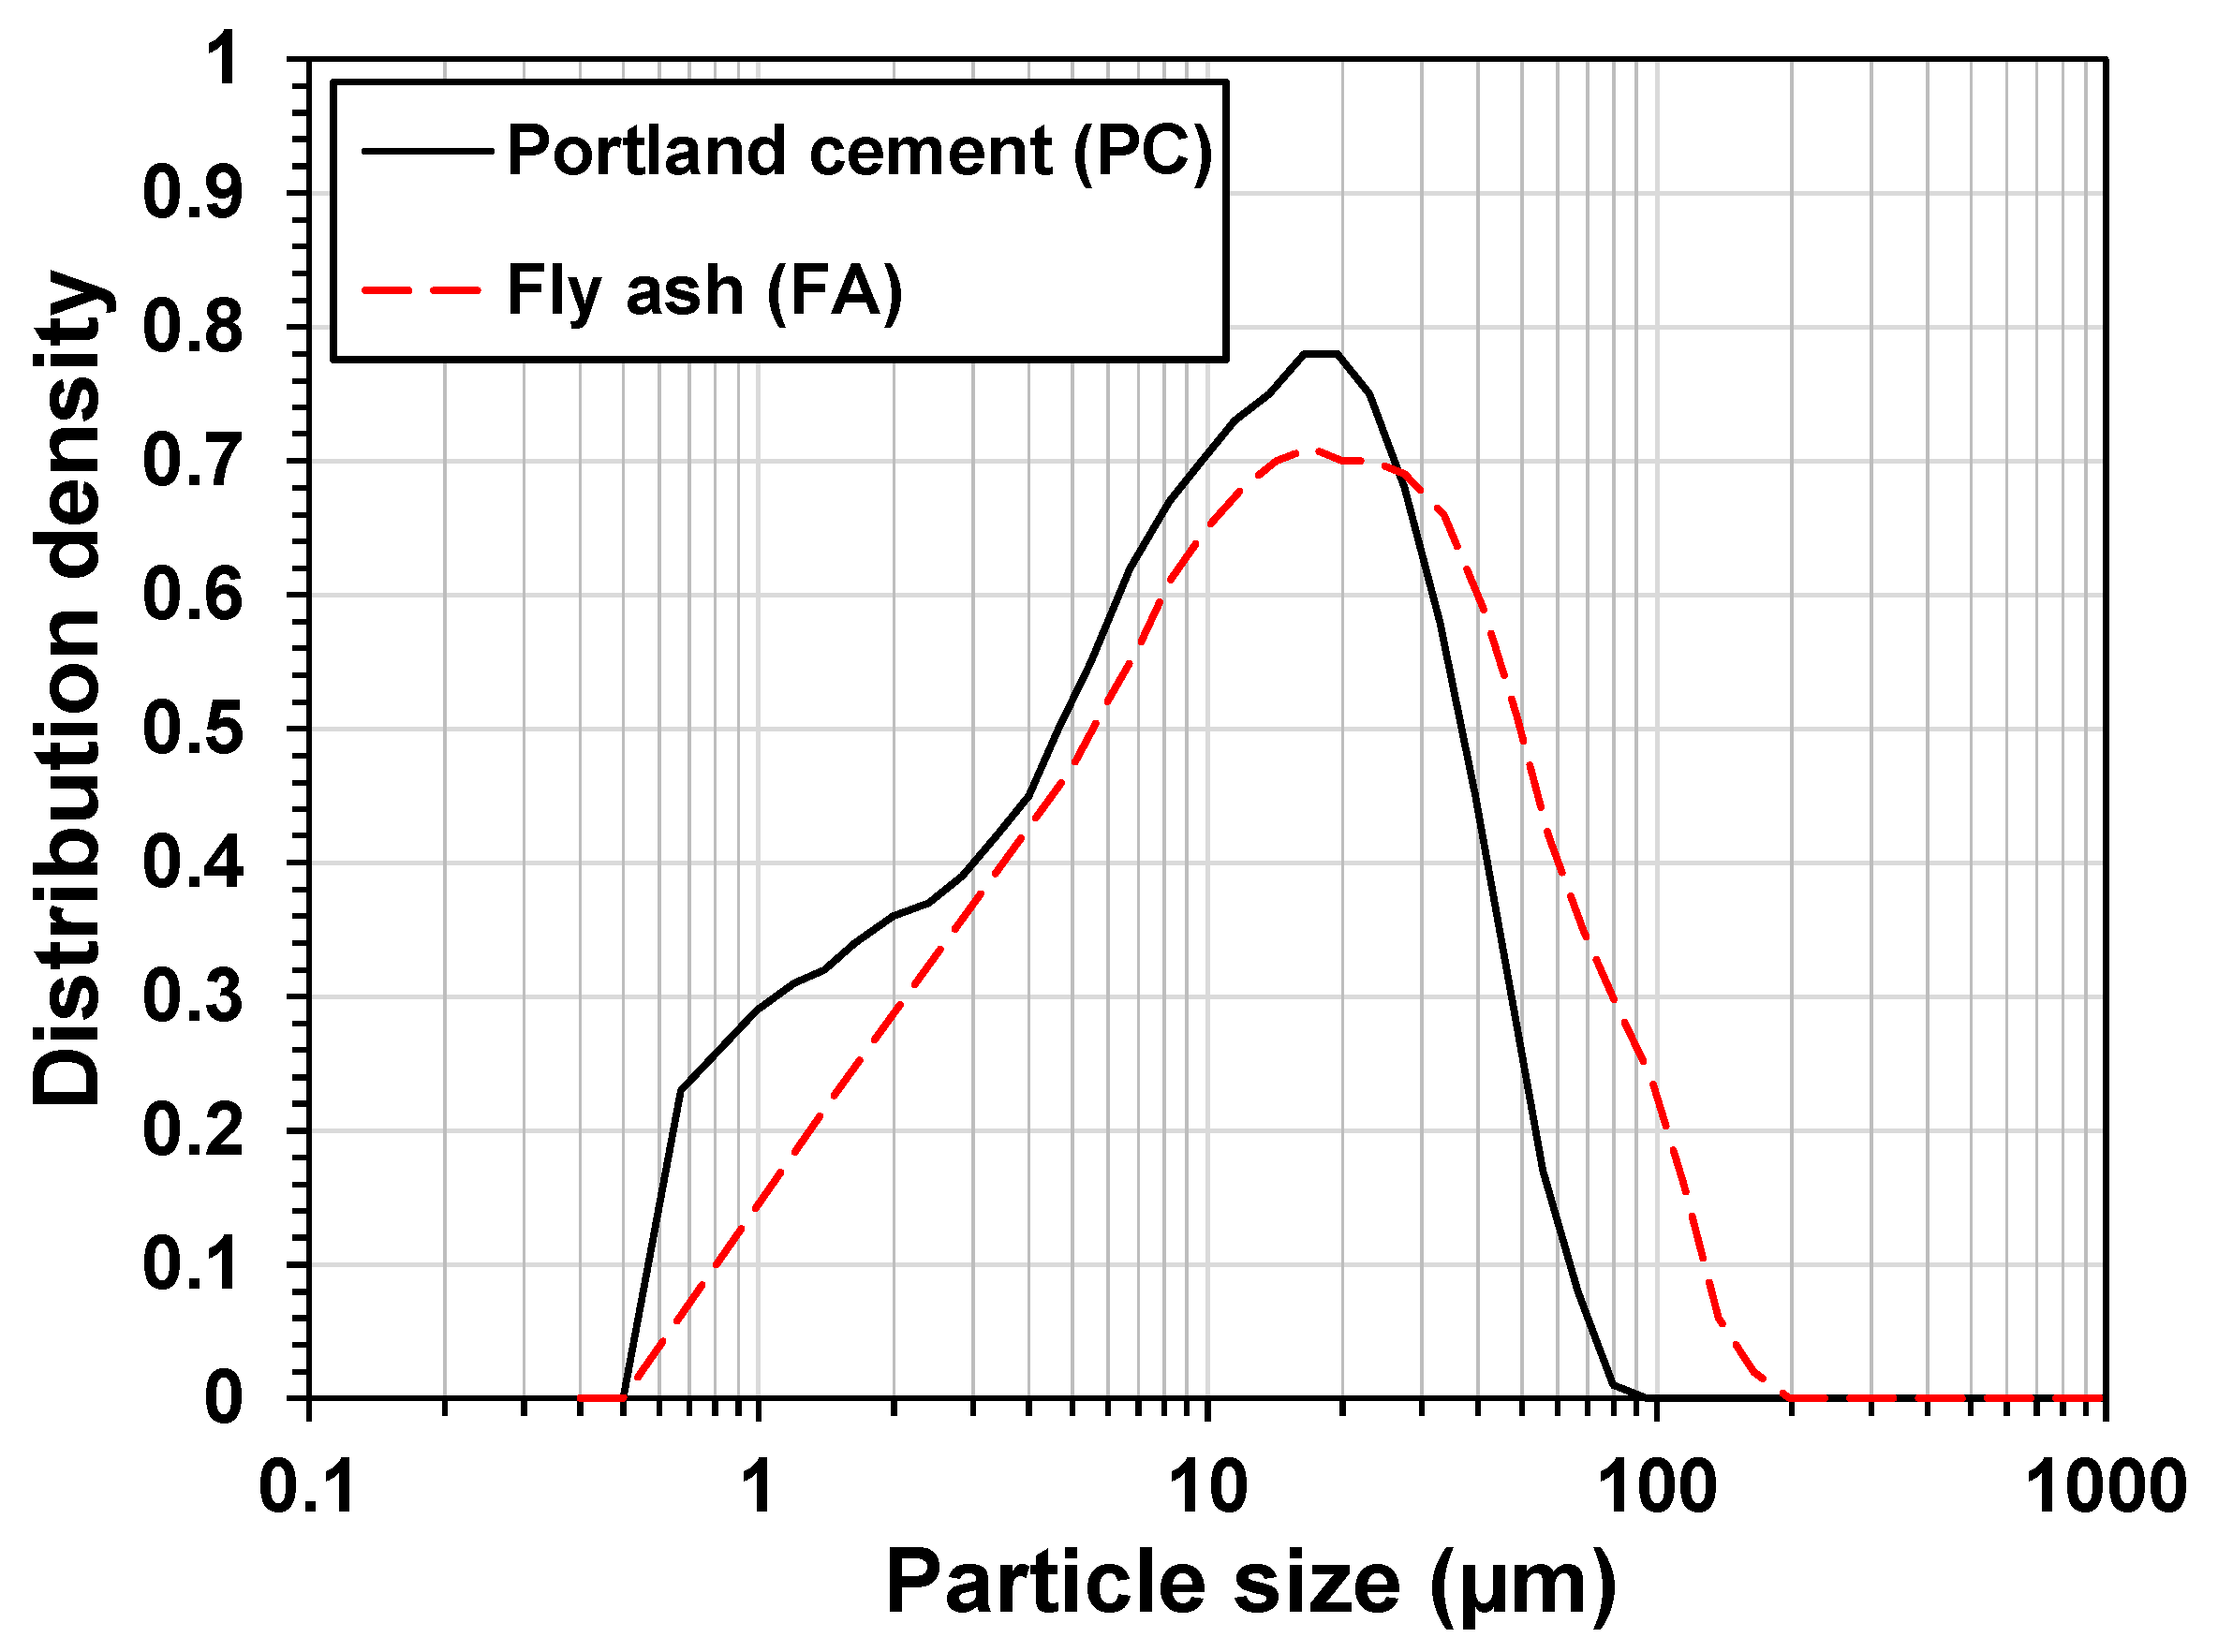
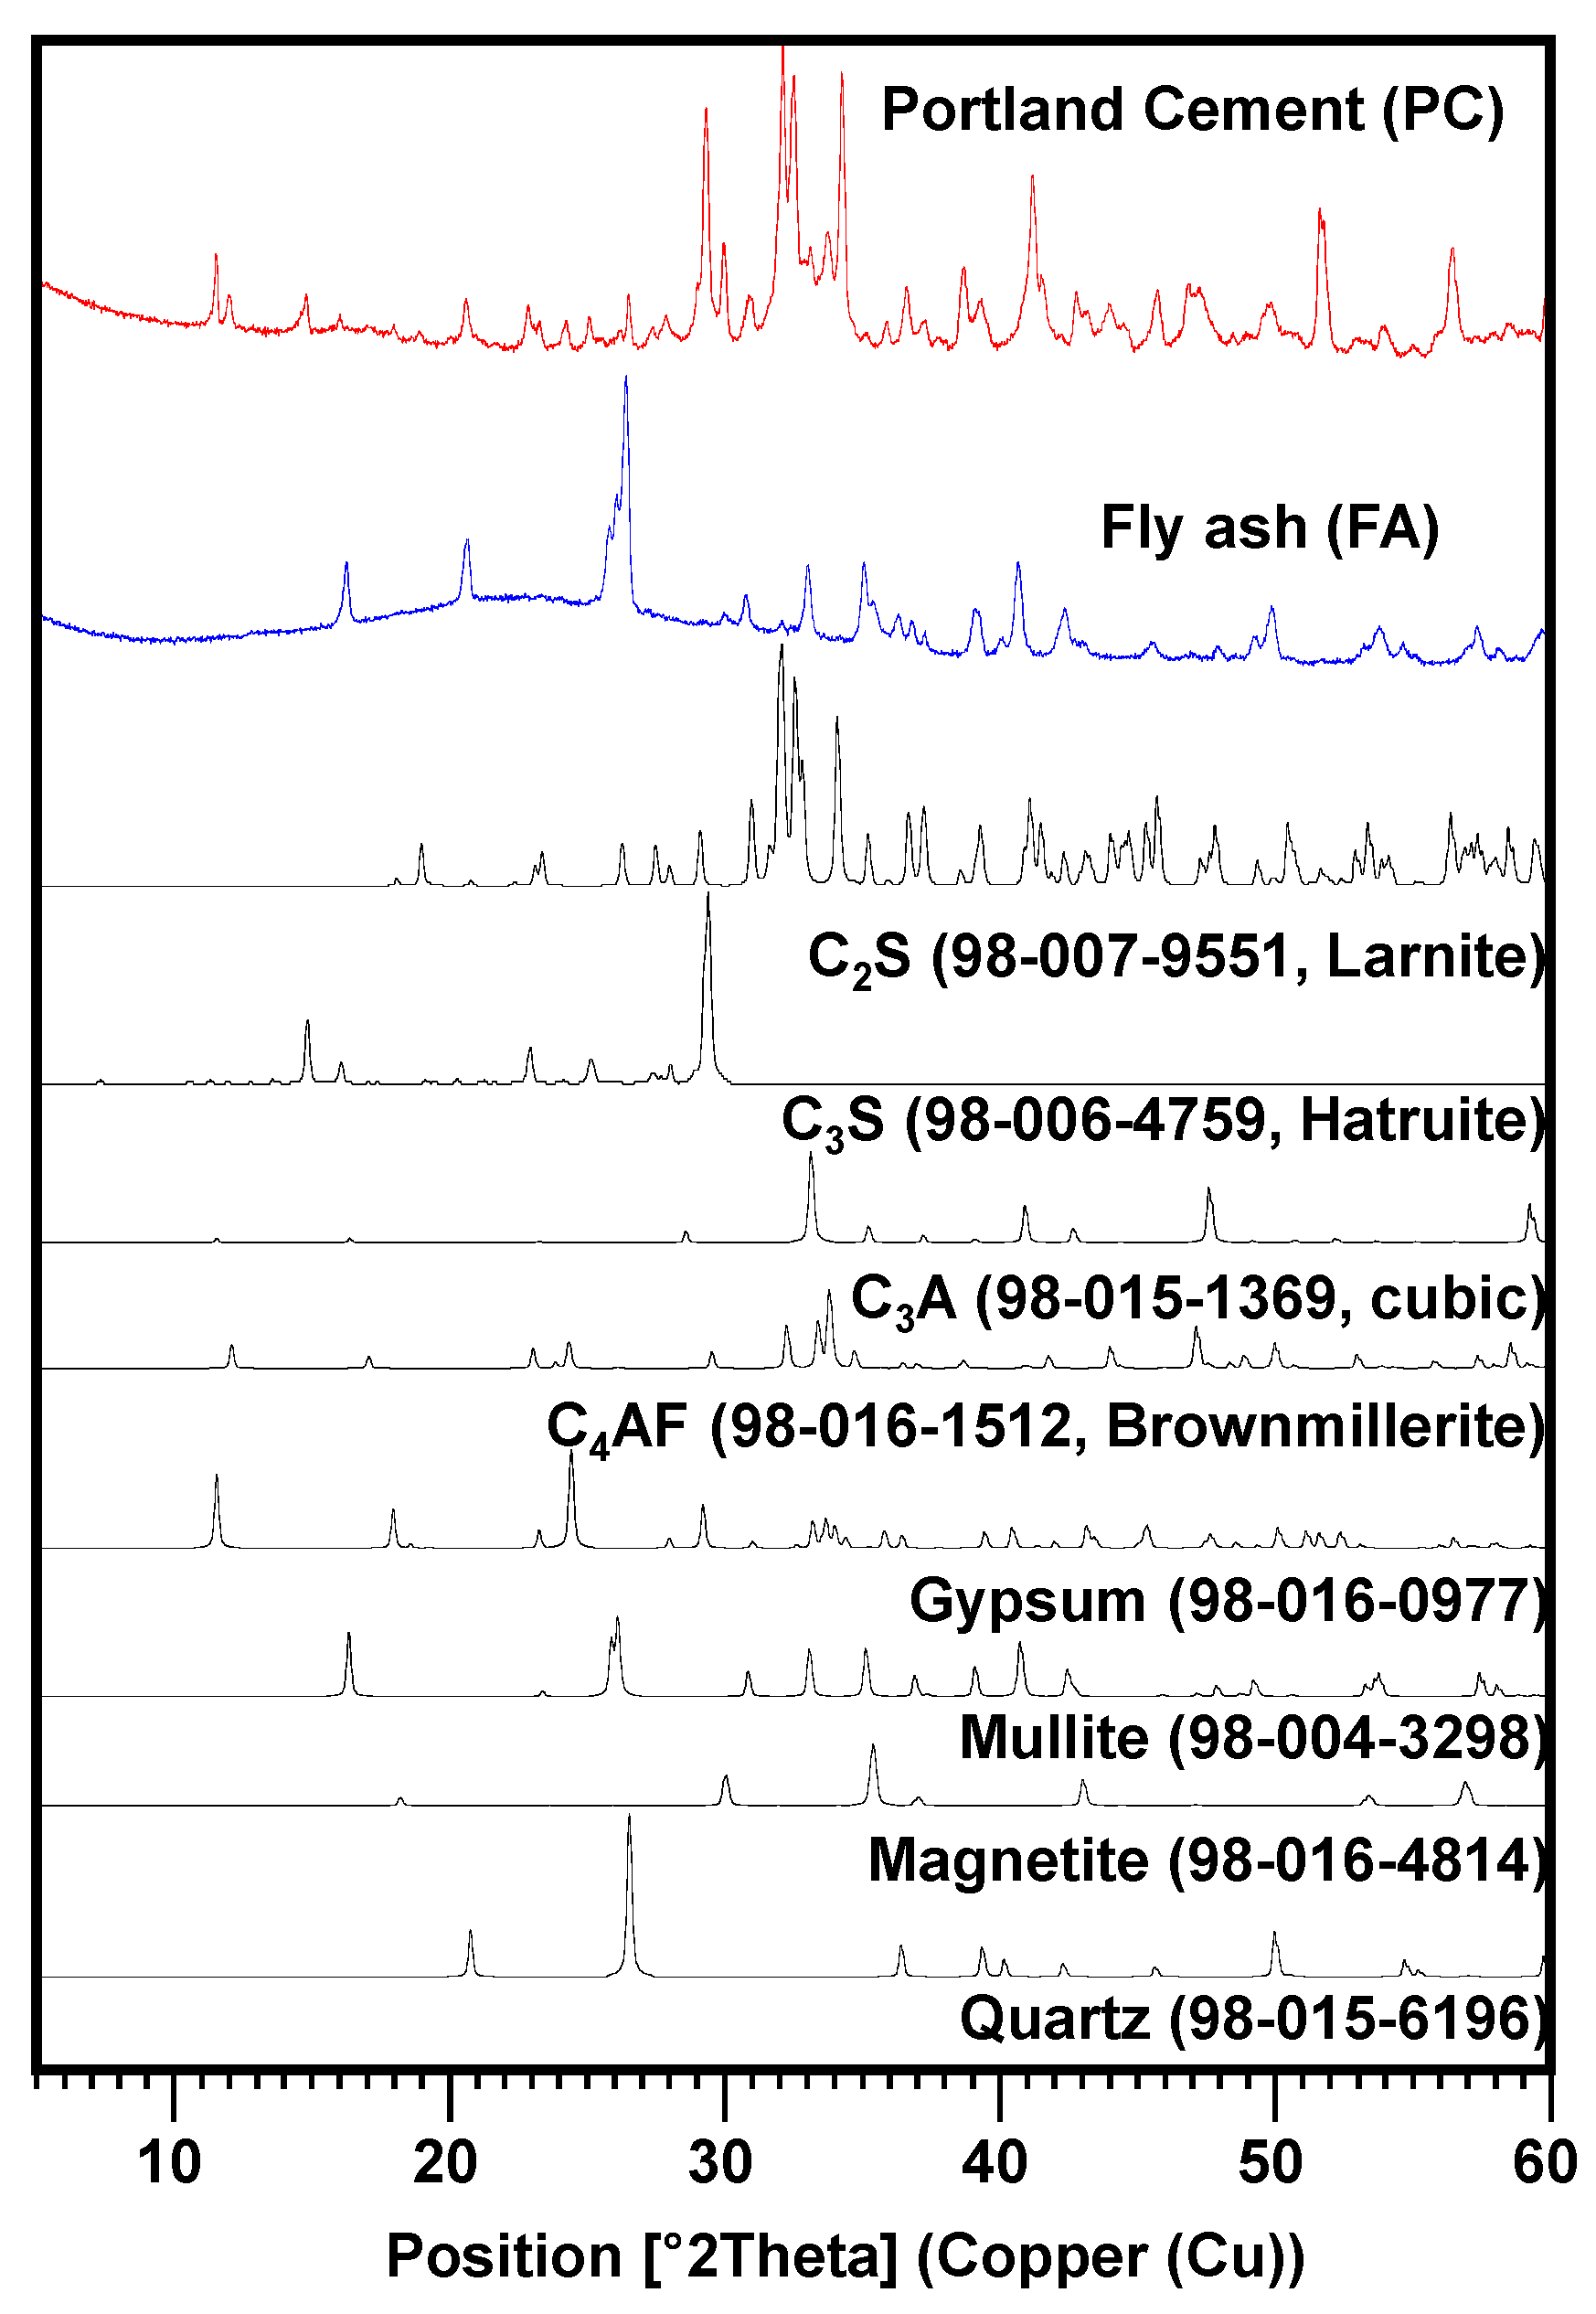
2. Materials and Experiments

Commercial Portland cement (PC) (i.e., Type Ⅰ) and fly ash (FA) were used in this study. Particle size distribution (HELOS (HI 199) and RODOS, Sympatec, Clausthal-Zellerfeld, Germany), X-ray fluorescence (XRF, S8 Tiger wavelength-dispersive XRF (WDXRF) spectrometer, Bruker, San Jose, CA, USA), and X-ray diffraction (XRD, Cu-Kα, λ = 1.5418 Å, D/Max2500V/PC, Rigaku, Tokyo, Japan) measurements were conducted to examine the characteristics of raw materials. Figure 1 shows the results of the particle size distribution analysis of PC and FA; they had almost similar particle size and their median size was about 20 µm.
XRD results are shown in Figure 2; the XRD patterns were analyzed using X’pert HighScore Plus software v3.0. with the International Center for Diffraction Data (ICDD) PDF-2 database [10,11]. PC was composed of C3S, C2S, C3A, C4AF, and gypsum was also found. On the other hand, amorphous phase mullite, magnetite, and quartz were identified in FA. The XRF results (see Table 1) showed that PC mostly consisted of CaO and SiO2. The main components of FA were SiO2 and Al2O3, and since the sum of SiO2, Al2O3, and Fe2O3 of FA exceeded 70%, the FA used in this study was classified as Class F fly ash, according to American Society for Testing and Materials (ASTM) C 618 [12].
The concrete mixture proportions used in this study are shown in Table 2 and they were designed according to the concrete pavement specification of the Korea Expressway Corporation (Gimcheon-si, Republic of Korea) [13]. The mixture proportions mainly consisted of two groups and each group had three mixture proportions. The group label was named after the binder used, and concrete group (i.e., CON-group) used 100% PC as the binder, and concrete with fly ash group (i.e., F-CON-group) used 75% PC and 25% FA as the binder. The sample label of each mixture was named after three different levels of vibration such as high (H), intermediate (I), and low (L). For instance, F-CON-H indicated that PC and FA were used as a binder, and high level of vibration was applied. Note that there are three mixture proportions in each group, but their ratio of the components is the same, only the levels of vibration is different. Granite aggregate and river sand were used as coarse aggregate and fine aggregate, respectively, and the maximum coarse aggregate size was 25 mm. In addition, all aggregate was used in surface saturated density (SSD) condition to prevent additional water absorption during mixing and a naphthalene-based commercial superplasticizer was used.
The raw materials were dry mixed for 3 min and then tap water was added for further mixing. All mixing procedures followed ASTM C 192 [14]. The fresh concrete was filled into cylindrical molds (φ 10 cm × 20 cm) for compressive strength tests, density and water absorption tests, and freezing and thawing tests, prism molds (10 cm × 10 cm × 40 cm) for flexural strength tests, rectangular molds (30 cm × 30 cm × 10 cm) for surface abrasion resistance test, and in rectangular molds (40 cm × 60 cm × 9 cm) for float tests, modified-float tests, skid resistance tests, and surface-displacement variation tests. All samples were demolded after 24 h, and then cured at a constant temperature 23 °C and 99% relative humidity until testing.
Three different levels of vibration were applied to the samples to verify the changes in the physical properties of concrete varying with the level of vibration. Vibration was applied to the upper direction of sample using a vibration table, and the levels of vibration of high, intermediate, and low were 7000, 8000, and 9000 vpm, respectively.
Bleeding experiments were carried out according to KS F 2414 [15] to check the amount of variation in bleeding with the mixture proportions and levels of vibration. Fresh concrete was filled into the bleeding measurement device (φ 250 mm × 280 mm) in three layers and each layer was tapped 25 times with a steel rod. Bleeding for each sample was measured at 10 min intervals for 1 h, and then measured at 30 min intervals until no bleeding occurred. To prevent evaporation of moisture to the outside, the lid of the bleeding device was covered except for when measuring. Bleeding tests were performed three times for each mixture proportion, and their average value was used.
Float tests were conducted to verify the finishability of concrete mixture proportions [16]. As shown in Figure 3, fresh concrete was put into a rectangular mold (40 cm × 60 cm × 9 cm) and then the surface of the fresh concrete was smoothly leveled using a board. After placing and leveling the fresh concrete, a total of 15 holes were made in the sample using a steel rod; each hole had a diameter and height of 2.54 cm (i.e., 1 inch). Then, the number of passes with a bull float was recorded until the holes that had been made disappeared.
Through modified-float test, the finishability was validated of each mixture proportion with varying levels of vibration. The procedure of making a hole in the fresh concrete sample was the same as the float test. After making the hole, the mold was subjected to three different levels of vibration using a vibration table. After applying vibration, the surface was finished using the bull float. By measuring the number of times, the surface of the fresh concrete was finished, and the effect of vibration on the concrete was verified.
A mechanical (compressive and flexural) strength test was conducted to verify the change in strength of concrete according to the mixture proportions and vibration levels. Compressive strength and flexural tests were carried out at 3, 7, and 28 days of sample curing and the average value for the triplicate samples was used for each mixture. All experimental procedures were conducted according to ASTM C 109 and ASTM C 78 [17,18].
The density and water absorption experiments were performed to determine the effect of the levels of vibration on the physical properties of the concrete. To measure the density and water absorption, three different 28-day samples were used and their average values were used as results. Samples of the SSD condition and oven-dried (OD) condition were used to measure the water absorption of the sample. To meet the SSD condition, samples were immersed in water for 24 h, and the surfaces of the samples were wiped with a towel. SSD-condition samples were kept in a drying oven at 100 °C for 24 h to achieve OD condition [19,20].
Freezing and thawing resistance experiments were conducted to verify the effect of the mixture proportions and vibration levels on the durability of concrete, and all experiments procedures followed the KS F 2456 [21]. KS F 2456 specifies that at least three different samples should be used for each mixture proportion, and samples should be cured for 14 days. Before starting tests, the initial weight and dynamic elastic modulus were measured using 14-day samples, and then they were exposed to freezing and thawing cycles.
Skid resistance, surface abrasion resistance, and IRI tests were performed to identify the performance of the concrete pavement according to the mixture proportions and vibration levels. Skid resistance tests [22,23] were conducted using 28-day-cured samples and all experimental procedures followed KS F 2375 [23]. Five repeated experiments were carried out for each sample, and their average values were used as a result. Before measuring skid resistance of a sample, tap water was sprayed on the surface of the sample and British Pendulum Number (BPN) was measured using a British Pendulum Tester (BPT).
The surface abrasion resistance test was conducted according to ASTM C 779 B [22], and three samples at 28 days were prepared for each set of mixture proportions. As shown in Figure 4, three wear wheels with a weight 7.5 kg were placed on the surface of the sample and rotated at a speed 56 rpm for 30 min. After abrasion, the wear depth was measured using a Vernier caliper (Mitutoyo, Tokyo, Japan).
In order to indirectly evaluate the IRI of the concrete samples, the surface displacement variation test was performed, varying the levels of vibration and mixture proportions. For the test, fresh concrete was cast in a plate-shaped mold (40 cm × 60 cm × 9 cm), and the surface displacement variation was measured using a laser sensor (Vchon H-60-S) (See Figure 5). The accuracy of the laser sensor was within 0.01 mm and the surface displacement variation was measured 24 h after pouring fresh concrete.

3. Results

3.1. Physical Properties

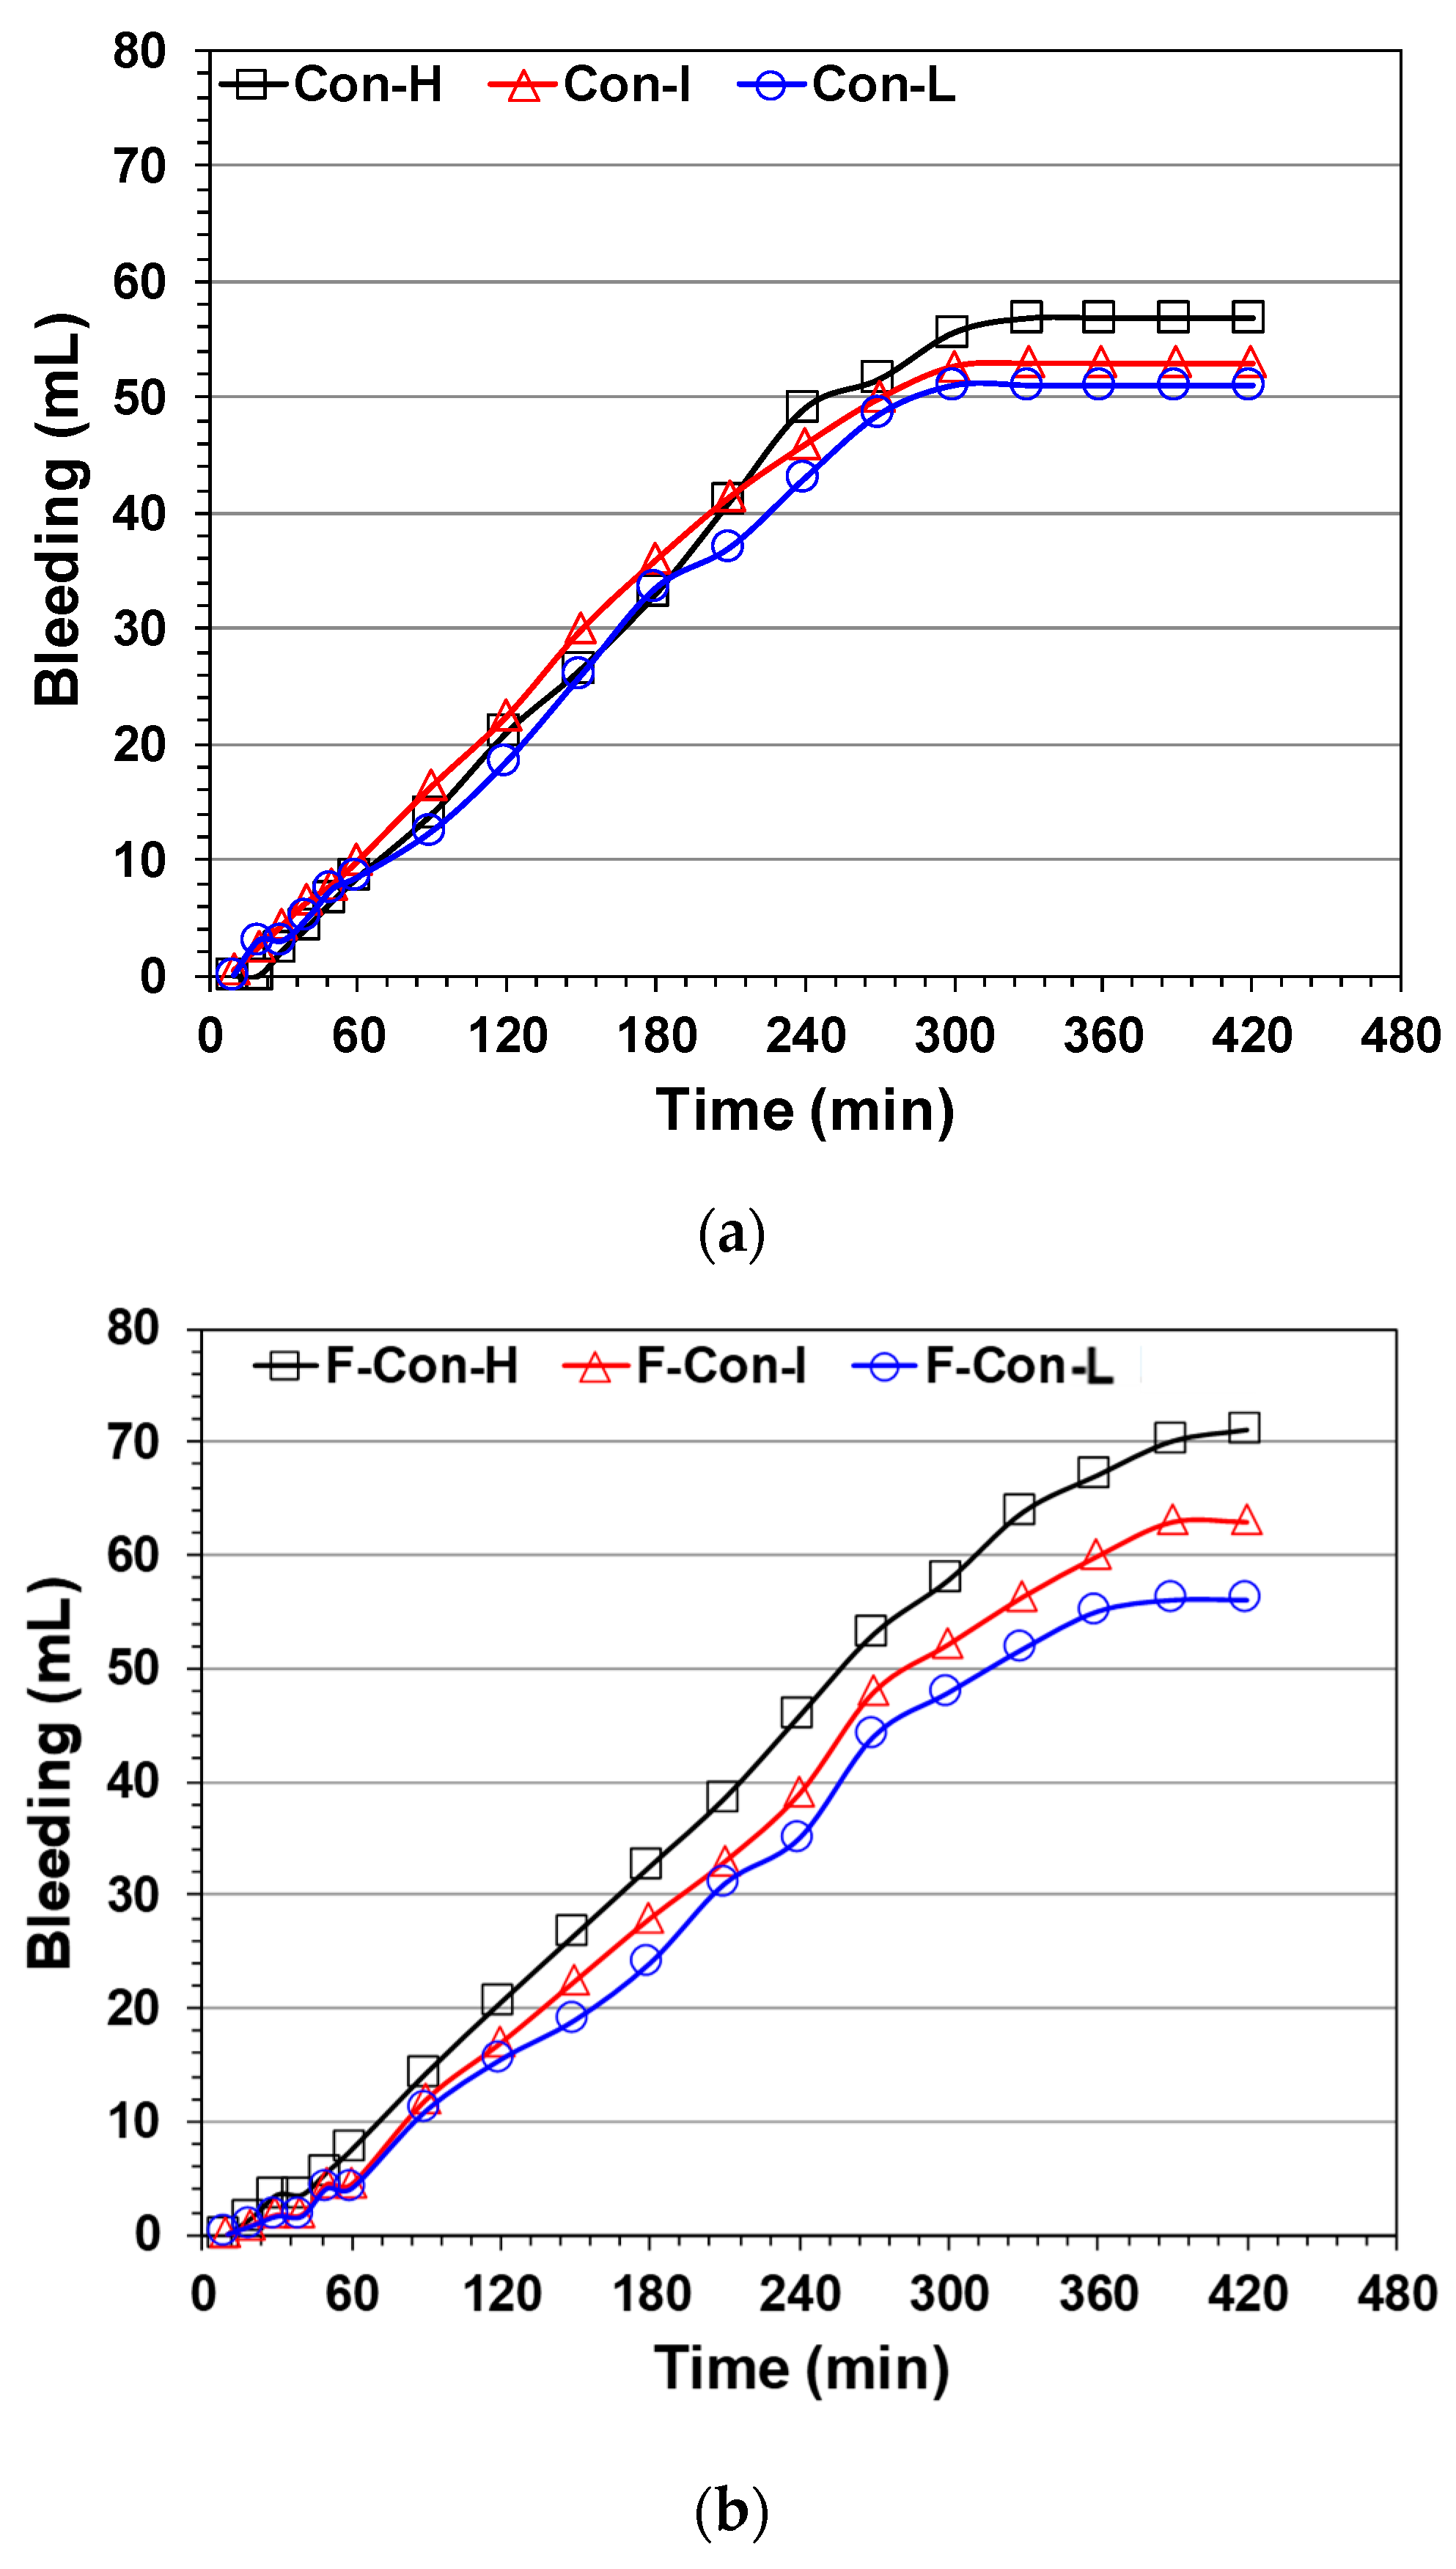
3.1.1. Bleeding Test

The results of bleeding test for each set of mixture proportions are shown in Figure 6. Overall, a greater amount of bleeding was measured in the F-CON group than the CON group under the same vibration level conditions. From this observation, it seemed that the F-CON group was more susceptible to vibration than the CON group. The reason for this tendency was that fly ash, which is lighter than PC, moved upward with the mixing water, causing excessive bleeding [24,25]. In addition, regardless of mixture proportions, the stronger the level of vibration applied to the sample, the greater the amount of bleeding occurred. This was likely due to stronger levels of vibration causing material segregation to some extent, and water, which is lighter than the other components, moving to the top of the sample [7].
On the other hand, the time at which the bleeding test finished varied by group. The CON group bleeding test ended at 300 min, but that of the F-CON group lasted up to 420 min, which seemed to be related to the setting time of the binder. It is well known that the application of fly ash to PC induces slow setting, and for this reason [7,26], the F-CON group likely had a longer bleeding time than the CON group.

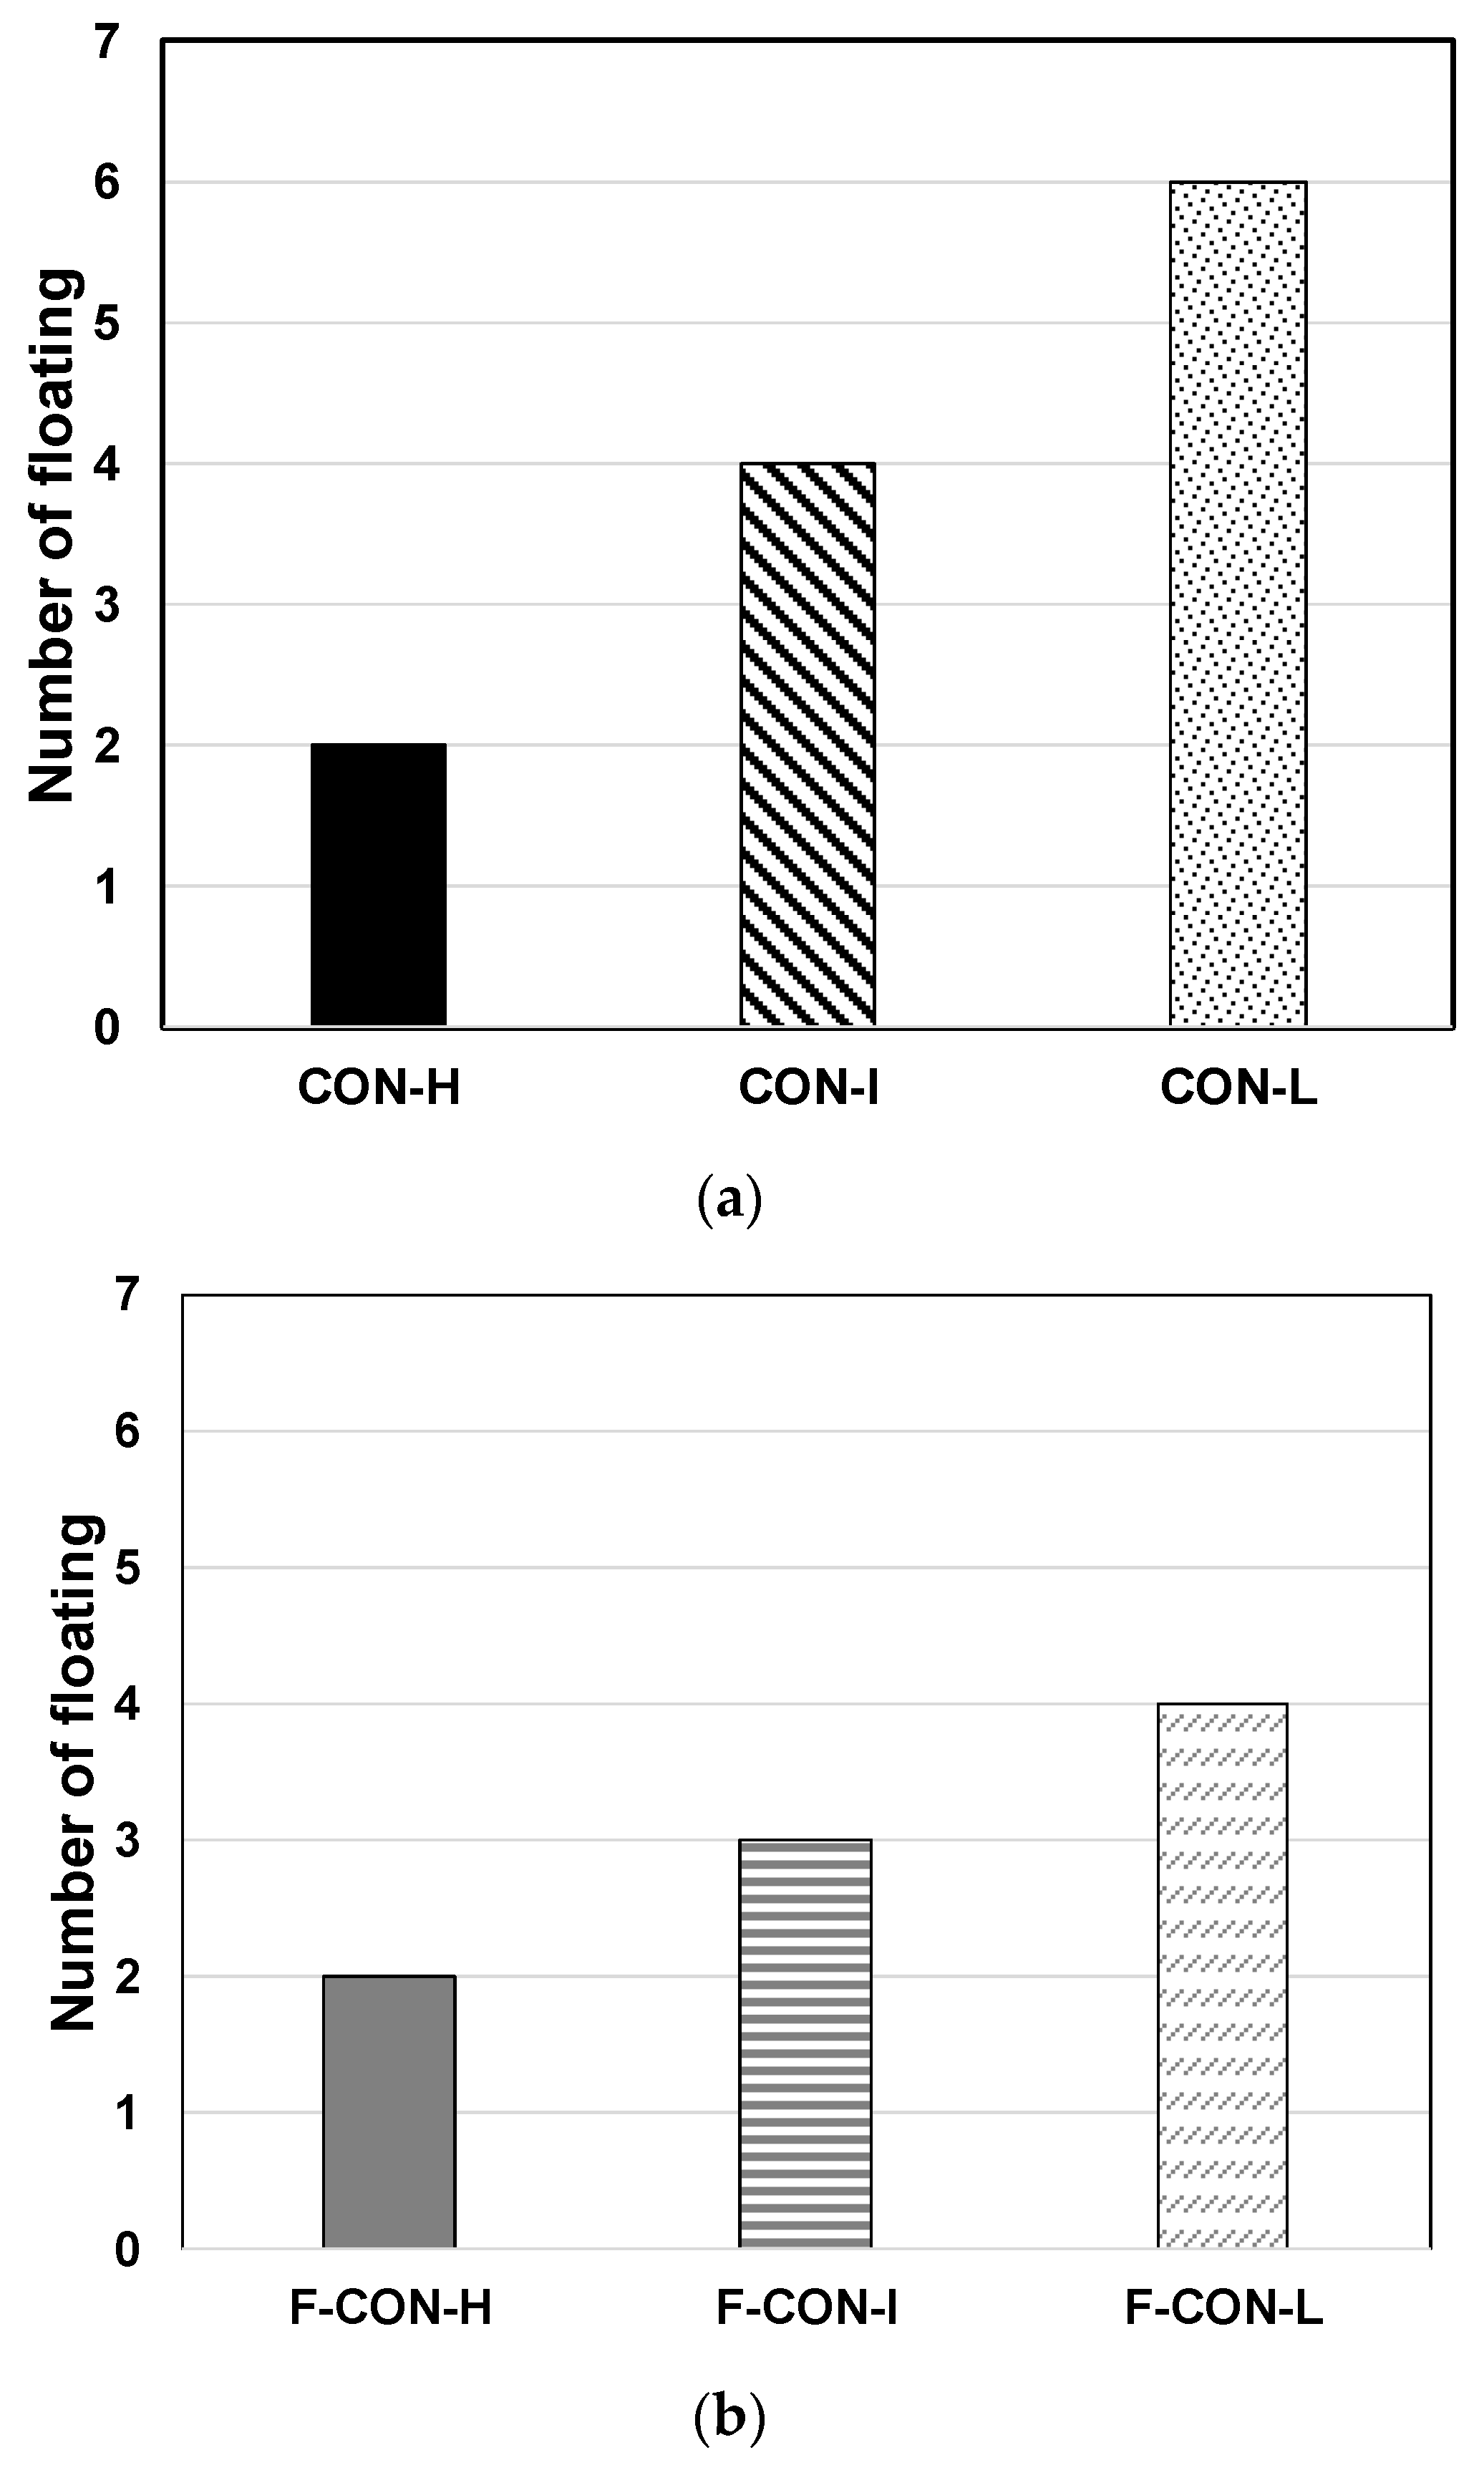
3.1.2. Float and Modified-Float Test

The float test results of the CON group and the F-CON group were six and five times, respectively, and it should be noted that the float test was carried out without vibration. There are two possible suggestions for the F-CON group producing an easier surface finish than CON group: (1) fly ash with spherical particles contributed to the easy surface finish [7]; (2) similar to the bleeding test results, fly ash moved to the surface of the sample with the mixing water, making the surface finish easy. Both suggestions are possible, but the former suggestion seemed to be more reliable because the float test did not apply vibration to the sample.
On the other hand, the results of the modified-float test are shown in Figure 7, and the surface finish was completed fewer times in the F-CON group than the CON group. This tendency was consistent with the float test, and the reason for the easy surface finish with the F-CON samples was the same as mentioned above. In addition, the stronger the vibration applied to the sample, the easier the surface finish was achieved, regardless of mixture proportions. It seemed that, to some extent, strong vibrations naturally induced compaction and an easy surface finish to fresh concrete. Furthermore, the water moved upward due to strong vibrations, ensuring an easy surface finish to the samples. These results showed that different levels of vibration could affect the surface finish of concrete pavement.

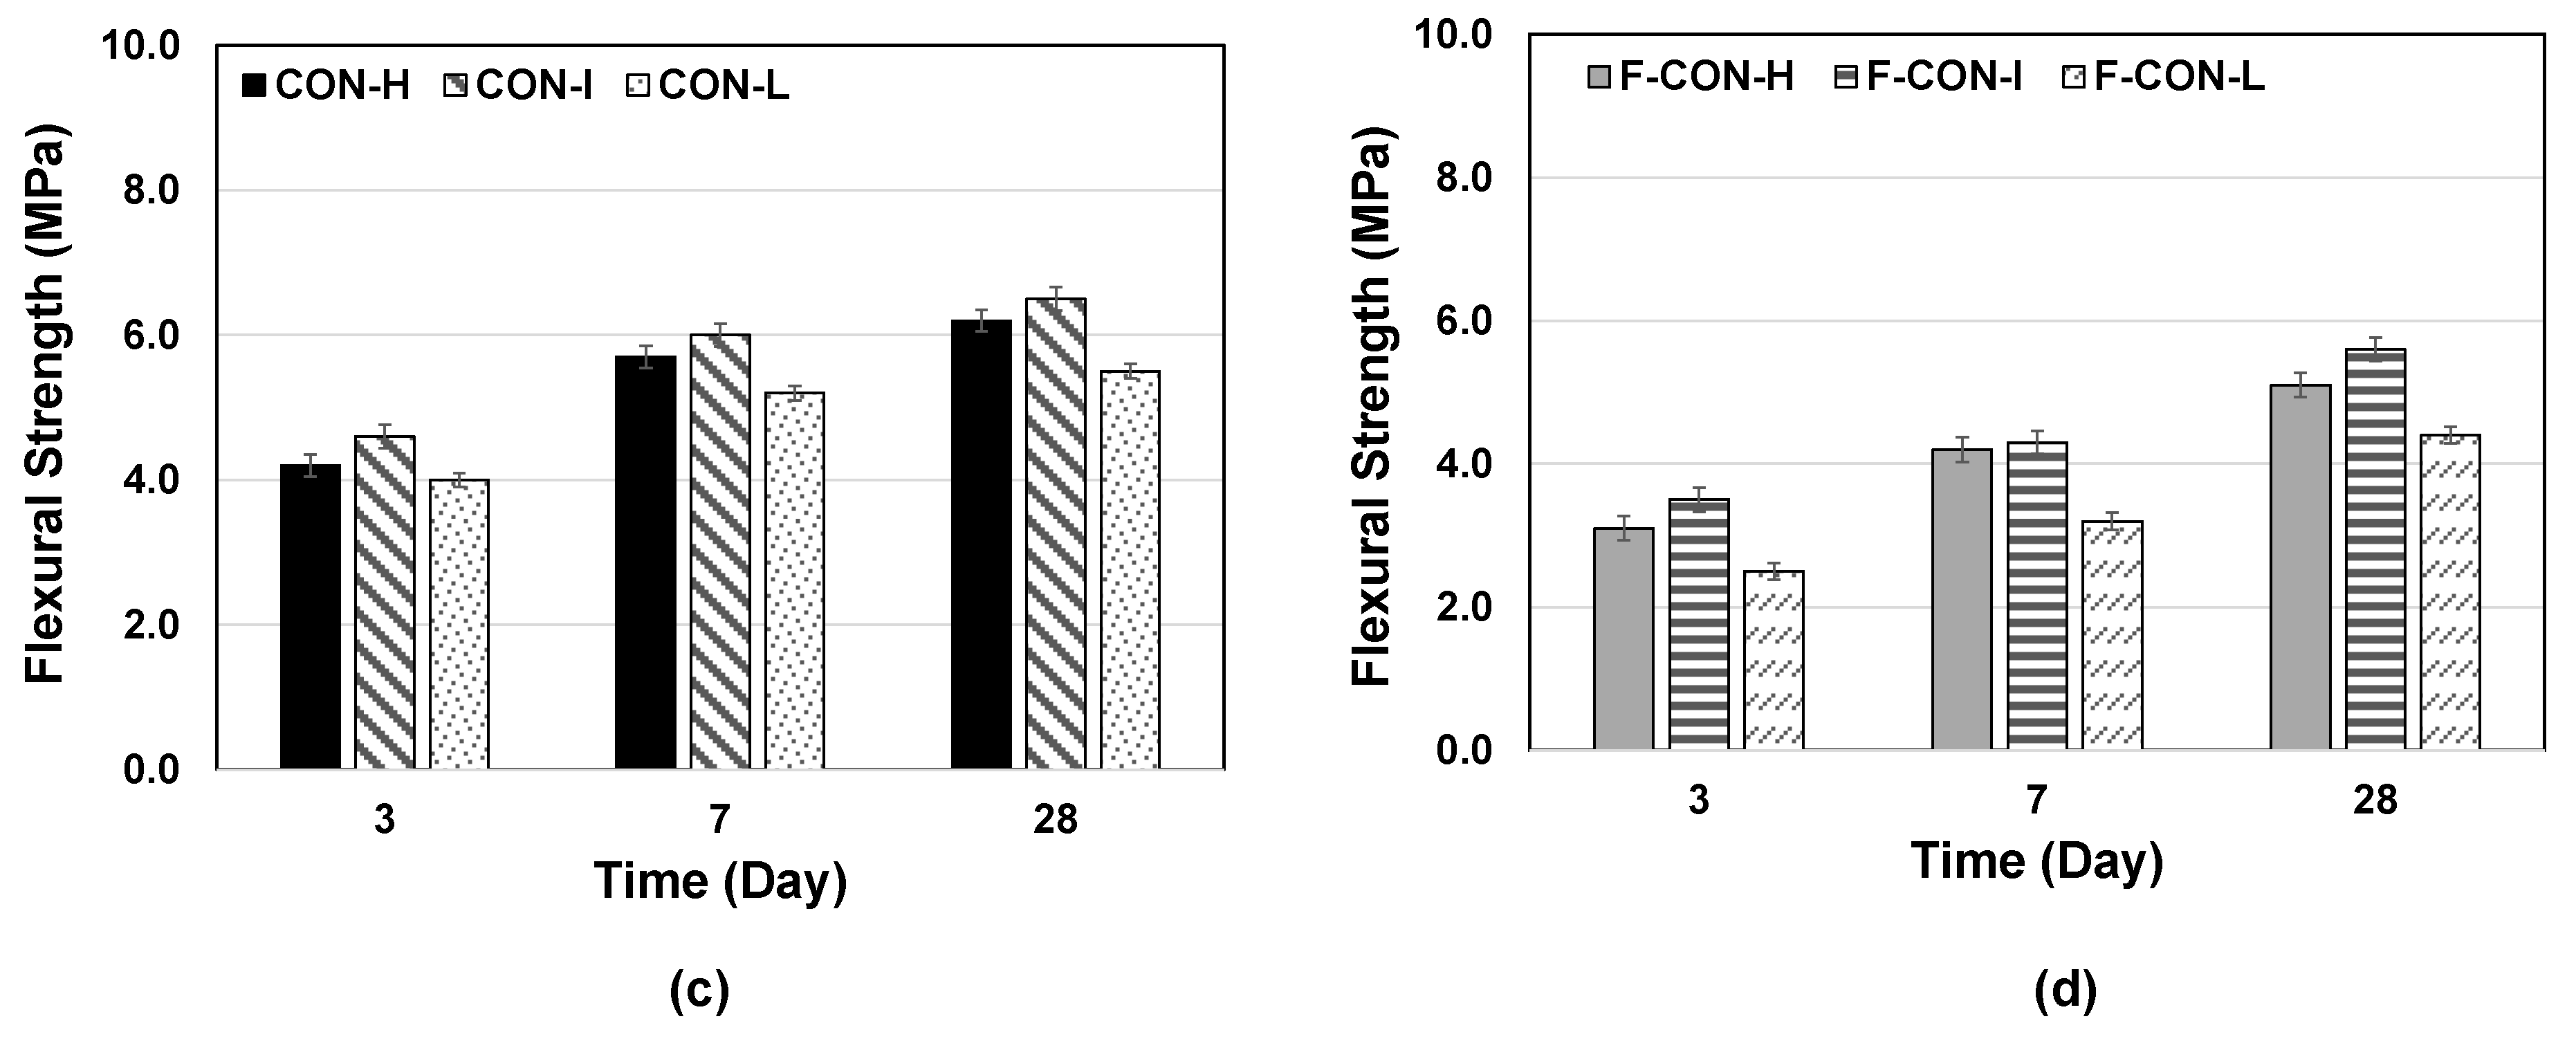
3.1.3. Mechanical Strengths

Figure 8 shows the compressive strength and flexural strength test results of hardened concrete; the strength of the samples increased with the number of curing days, regardless of mixture proportions and levels of vibration. The CON group exhibited relatively higher compressive strength than the F-CON group, and in particular, a greater difference in strength was observed at the early stage of curing, which seemed that the added fly ash delayed the hydration of the cement [27,28,29]. Many previous studies [7,27,28,29,30] have reported that the replacement of fly ash in cement decreases the early strength of concrete, and a similar trend was observed in this study.
Meanwhile, there were strength differences varying with the levels of vibration, regardless of mixture proportions, and high strength was measured in the order of intermediate, high, and low levels of vibration. The samples receiving a high level of vibration (i.e., CON-H and F-CON-H) showed slightly lower compressive strength than the samples receiving an intermediate level of vibration (i.e., CON-I and F-CON-I), which suggested that materials segregation, to some extent, could be occurring due to the excessive vibration, resulting in lower strength. In addition, the samples receiving a low level of vibration exhibited significantly lower compressive strength than the other samples, due to insufficient vibration resulting in high numbers of voids in the sample, thus lowering the strength. Furthermore, the samples with a low level of vibration showed a larger standard deviation than the other samples, which indicated that insufficient vibration did not ensure the quality and strength of the samples.
The flexural strength results showed a similar tendency to the compressive strength results and were measured at about 1/5 to 1/7 of the compressive strength. On the other hand, the Korea Expressway Corporation specification [13] specifies that the 28-day flexural strength of the concrete should exceed 4.5 MPa, but F-CON-L did not satisfy this regulation. The reason why F-CON-L did not satisfy this regulation seemed to be that it lacked vibration compared to other samples. Through the results of the flexural strength, it was verified that even if the same mixture proportion was used, the strength criteria presented in the specification was not satisfied if the vibration level was insufficient.

3.1.4. Density and Water Absorption

Density and water absorption tests were conducted using 28-day samples and the results are shown in Figure 9. Overall, the CON group had a slightly higher density than the F-CON group because fly ash, which has a relatively lower density than cement, was partially substituted for the binder. Note that the density of fly ash and PC are 2.1 g/cm3 and 3.14 g/cm3, respectively [12].
On the other hand, the samples with a high level of vibration and samples with an intermediate level of vibration had almost similar densities, but the samples with a low level of vibration had a relatively low density. It seemed that insufficient vibration caused many empty spaces in the concrete sample, resulting in lower density. It is well known that there is an inverse proportion between strength and void [31,32]. Low density indicated that there were many voids in the sample, which was a major reason for low strength. This tendency was consistent with the mechanical strength results. In addition, a relatively high level of water absorption was measured in samples with a low level of vibration than other samples, because there were many voids in the samples due to insufficient vibration, and water easily penetrated into the voids. The samples with a low level of vibration, which had high water absorption, seemed to be vulnerable to freezing and thawing as well as strength. This will be discussed in Section 3.2.1.

3.2. Durability

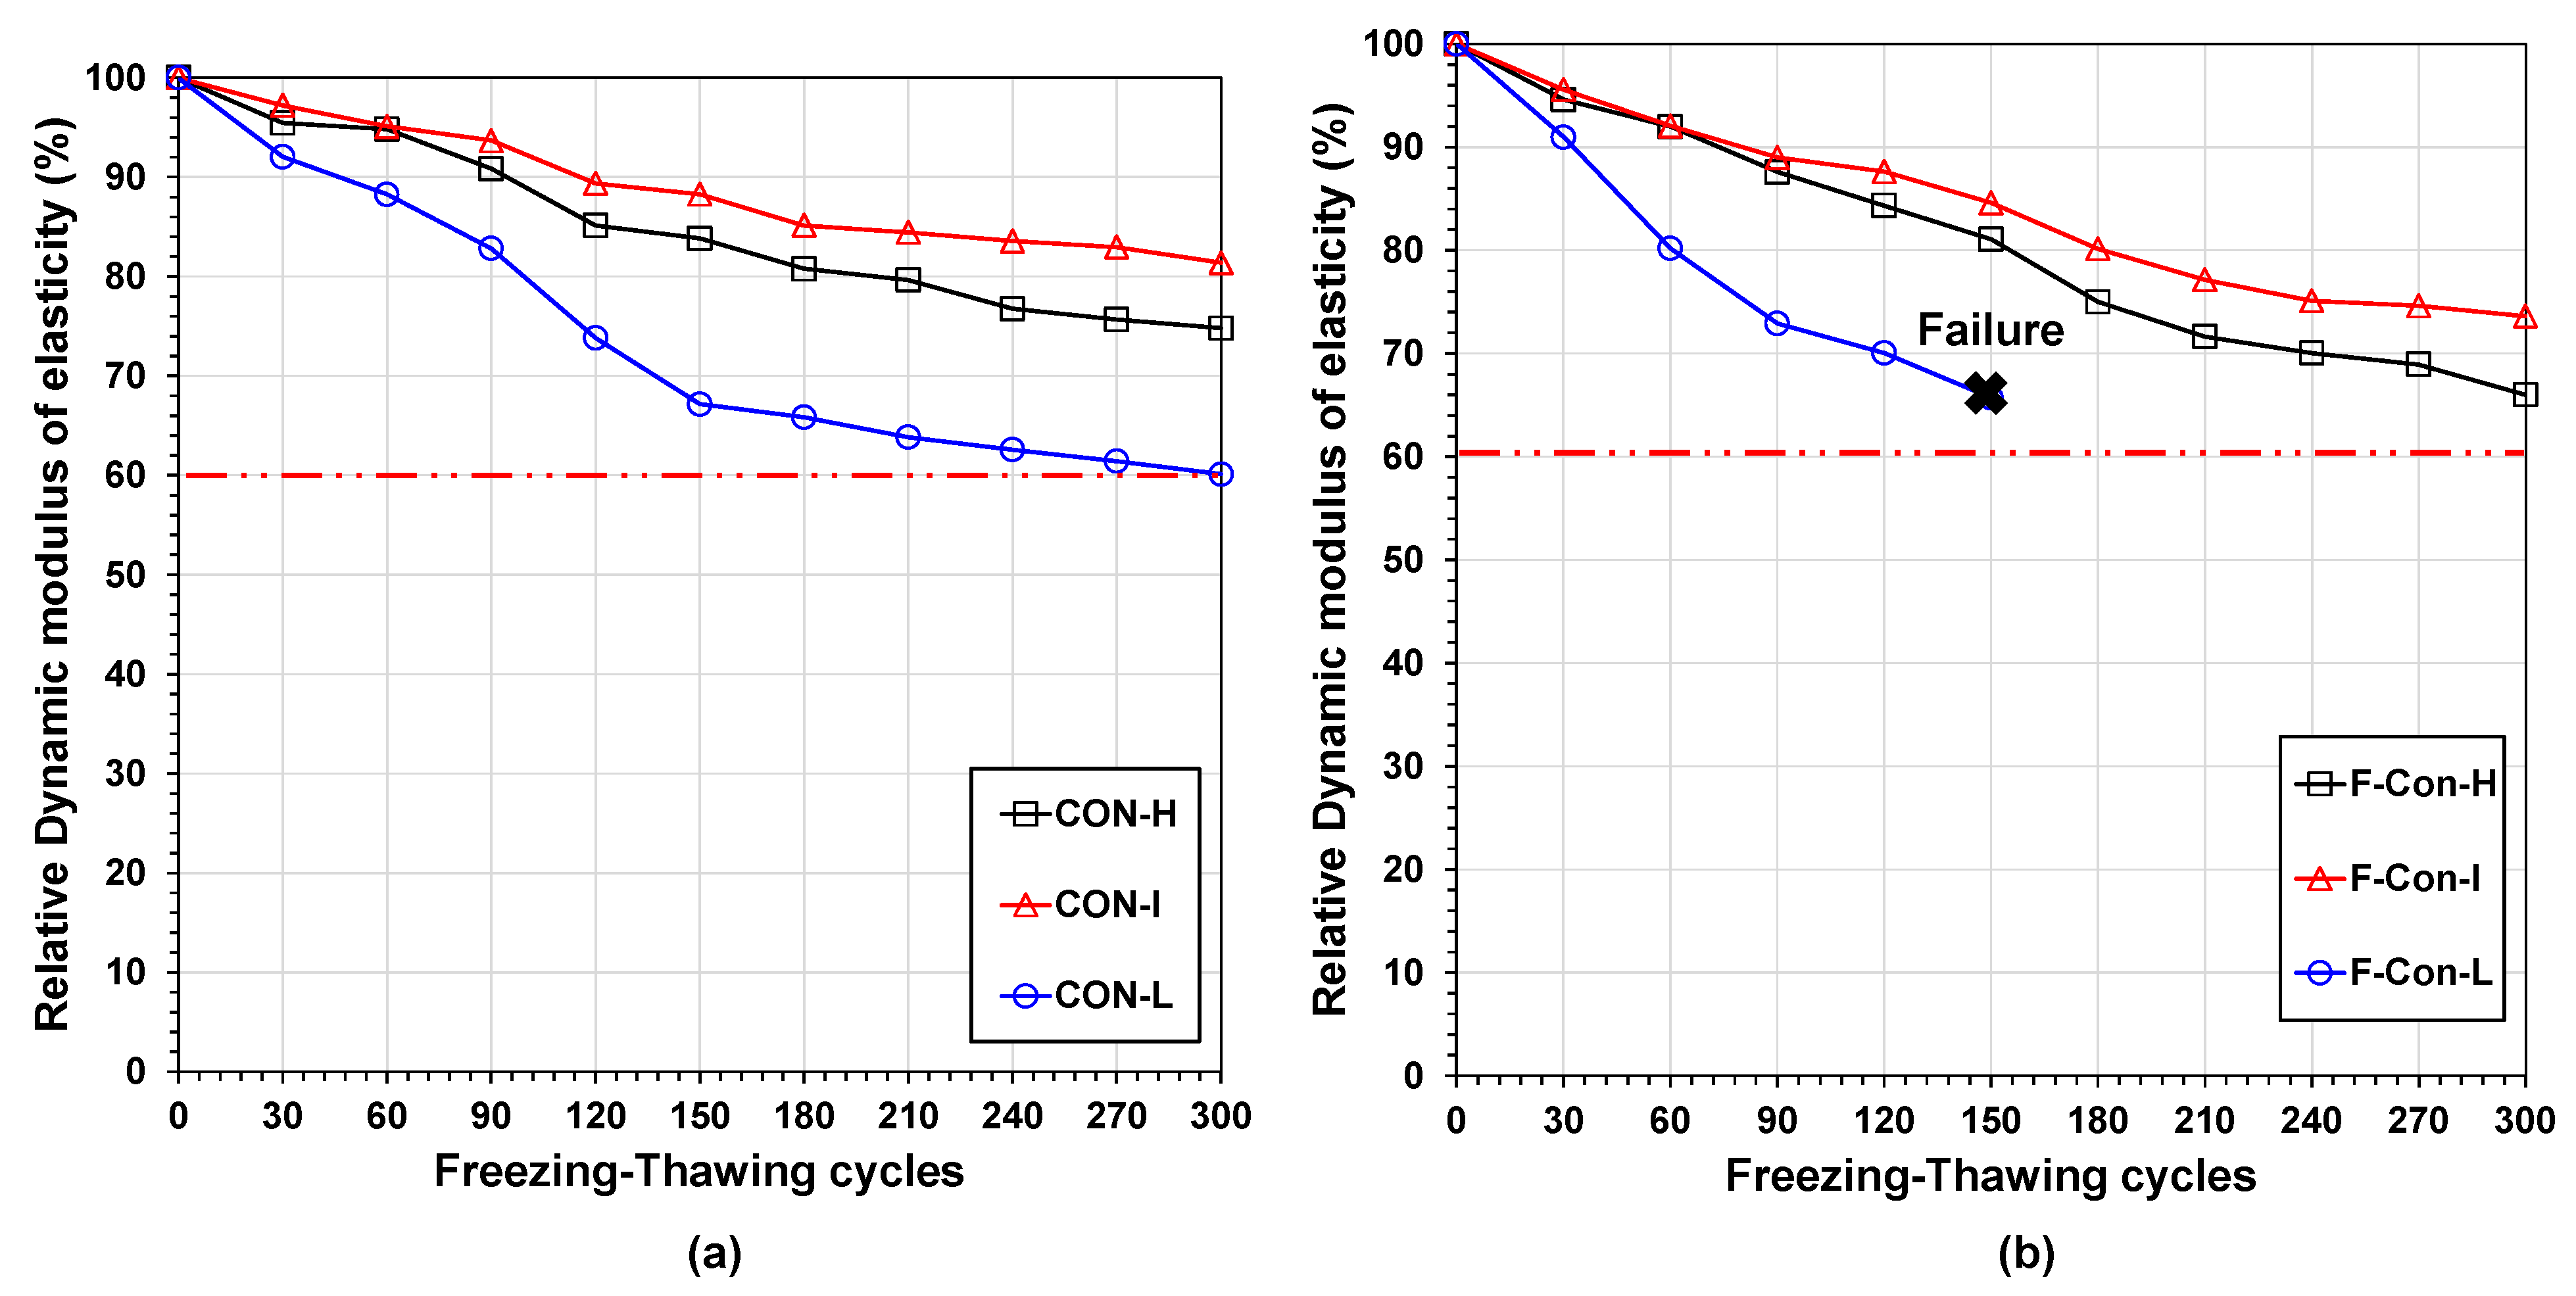
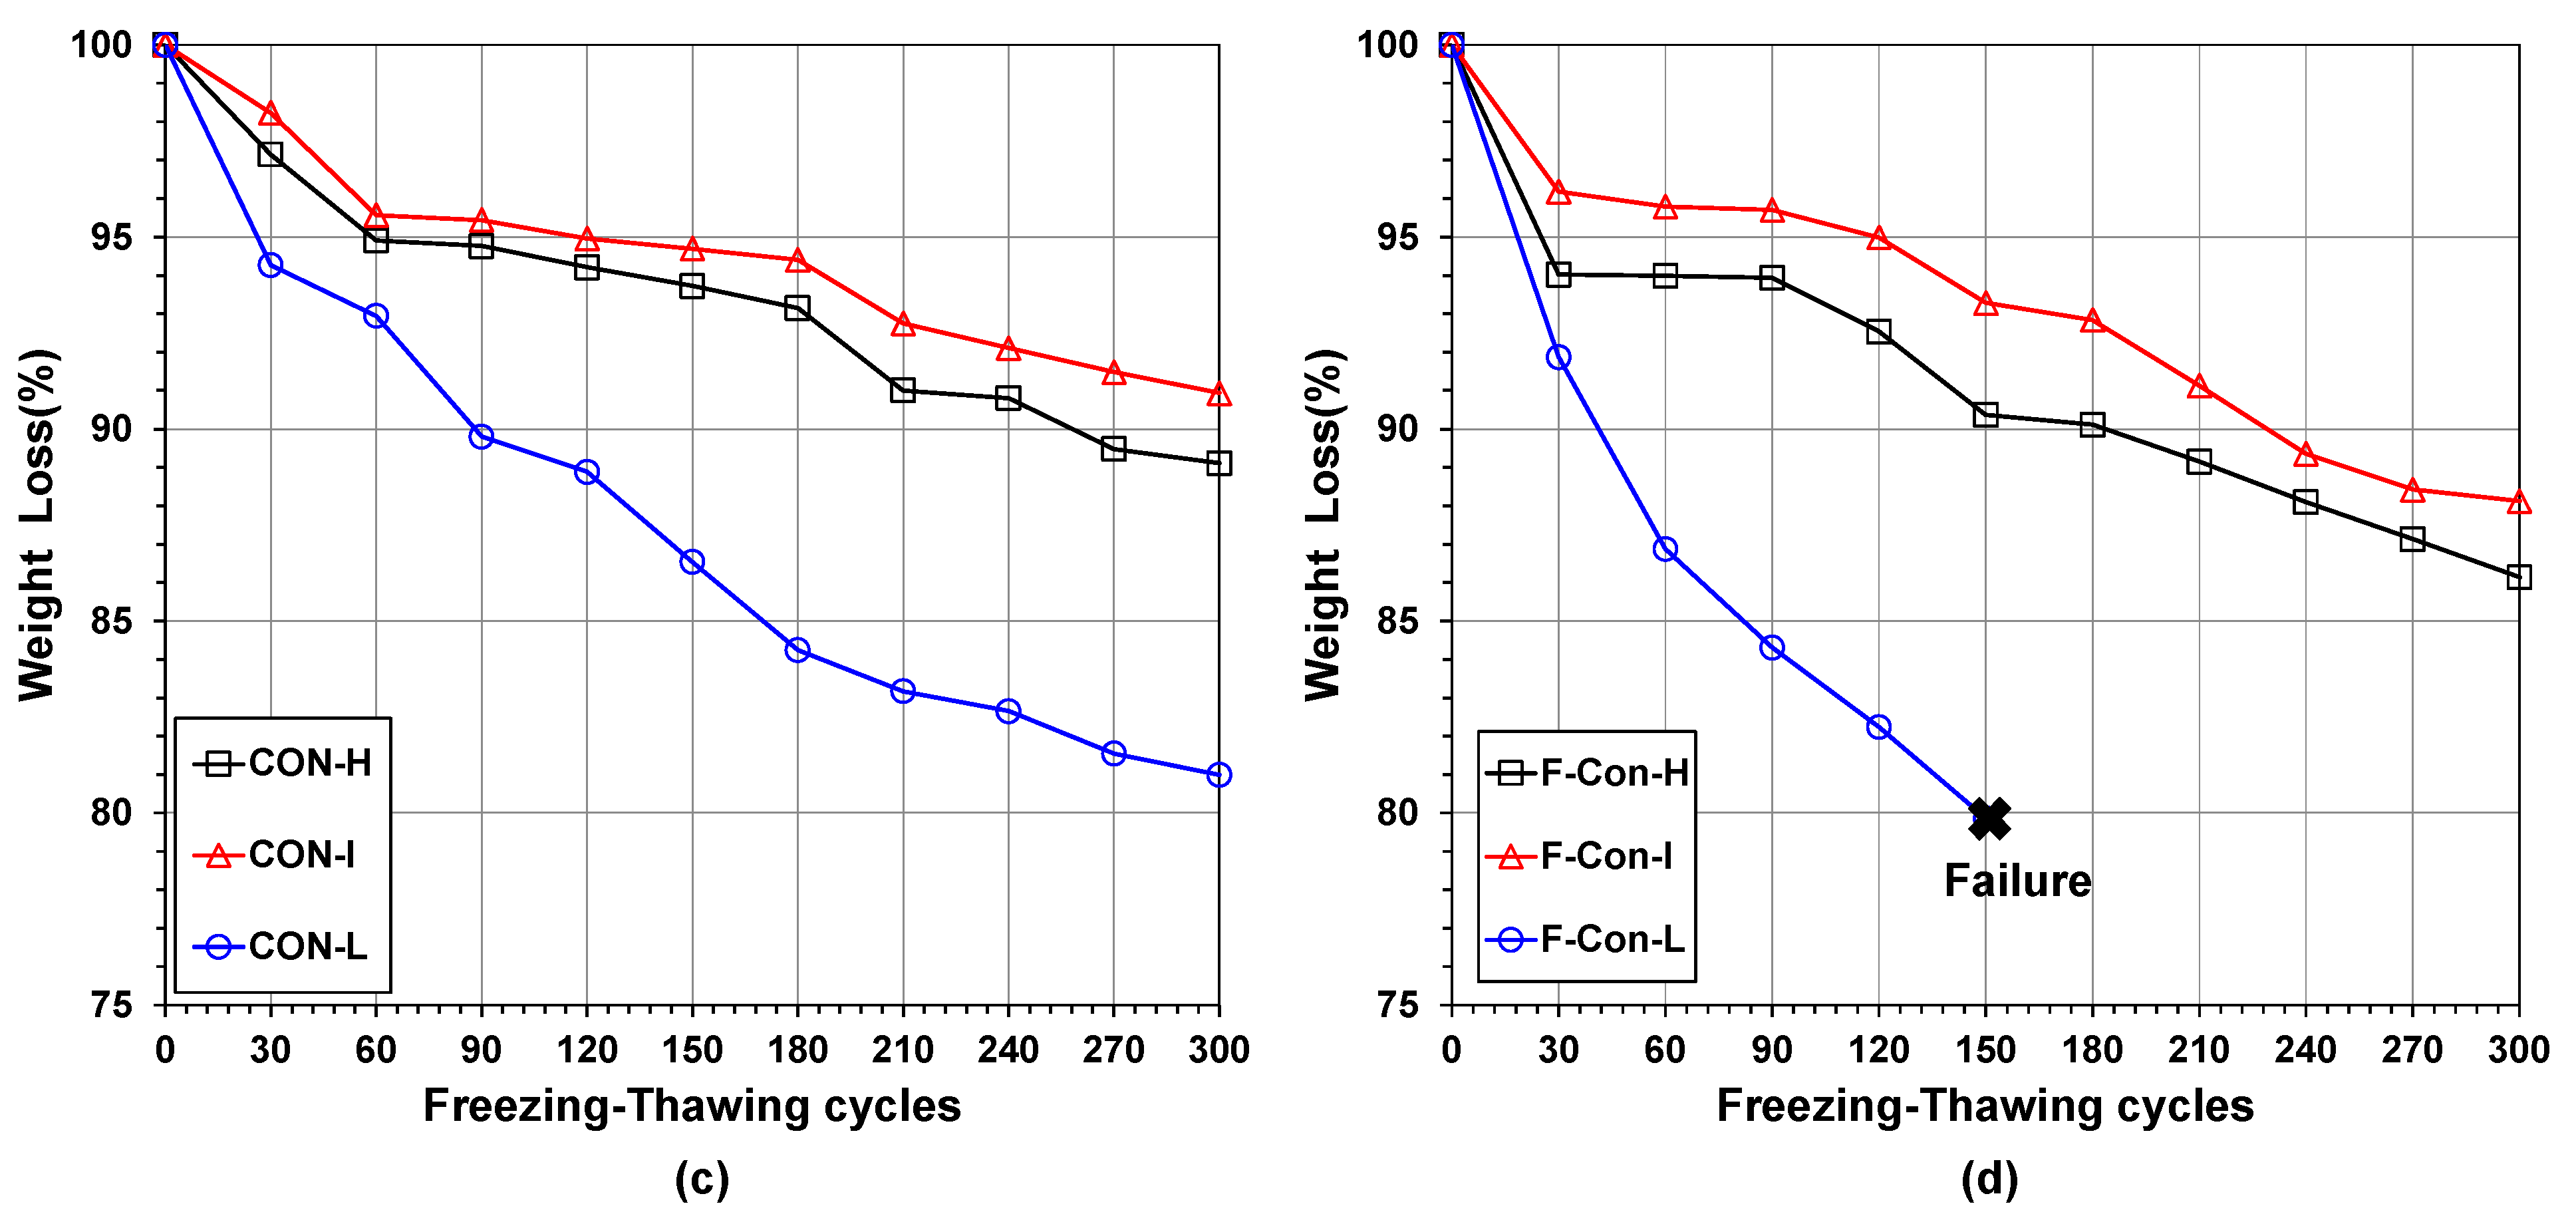
3.2.1. Freezing and Thawing

The results of the freezing and thawing experiments are shown in Figure 10; the changes in the dynamic elastic modulus and weight loss were measured every 30 cycles. It is worth noting, KS F 2456 sets the regulation that concrete should have a relative dynamic modulus of elasticity of more than 60% for 300 cycles in order to have resistance to freezing and thawing, and the red line in Figure 10 indicates that criteria.
All samples except F-CON-L satisfied the criteria presented by KS F 2456, but different tendencies were observed which varied with the levels of vibration. At the same level of vibration, the F-CON group showed a relatively lower dynamic elastic modulus than the CON group, which indicated that the F-CON group was relatively vulnerable to freezing and thawing. Moreover, even for concrete samples with the same mixture proportions, the high relative dynamic modulus of elasticity was measured in the order of intermediate, high, and low. In particular, CON-L barely satisfied the presented criteria, and F-CON-L failed to satisfy the criteria because the sample was destroyed at 150 cycles.
It is well known that freezing and thawing resistance is closely related to the presence of voids in concrete [7]. Through the density and water absorption test results, it was verified that the samples receiving a low level of vibration had many voids; it was also the main reason for being susceptible to freezing and thawing.
These observations indicate that even concrete with the same mixture proportions would be vulnerable to freezing and thawing if insufficient vibration has been applied. Furthermore, the weight-loss results showed a similar tendency to the relative dynamic modulus of the measured elasticity results.

3.3. Pavement Performance

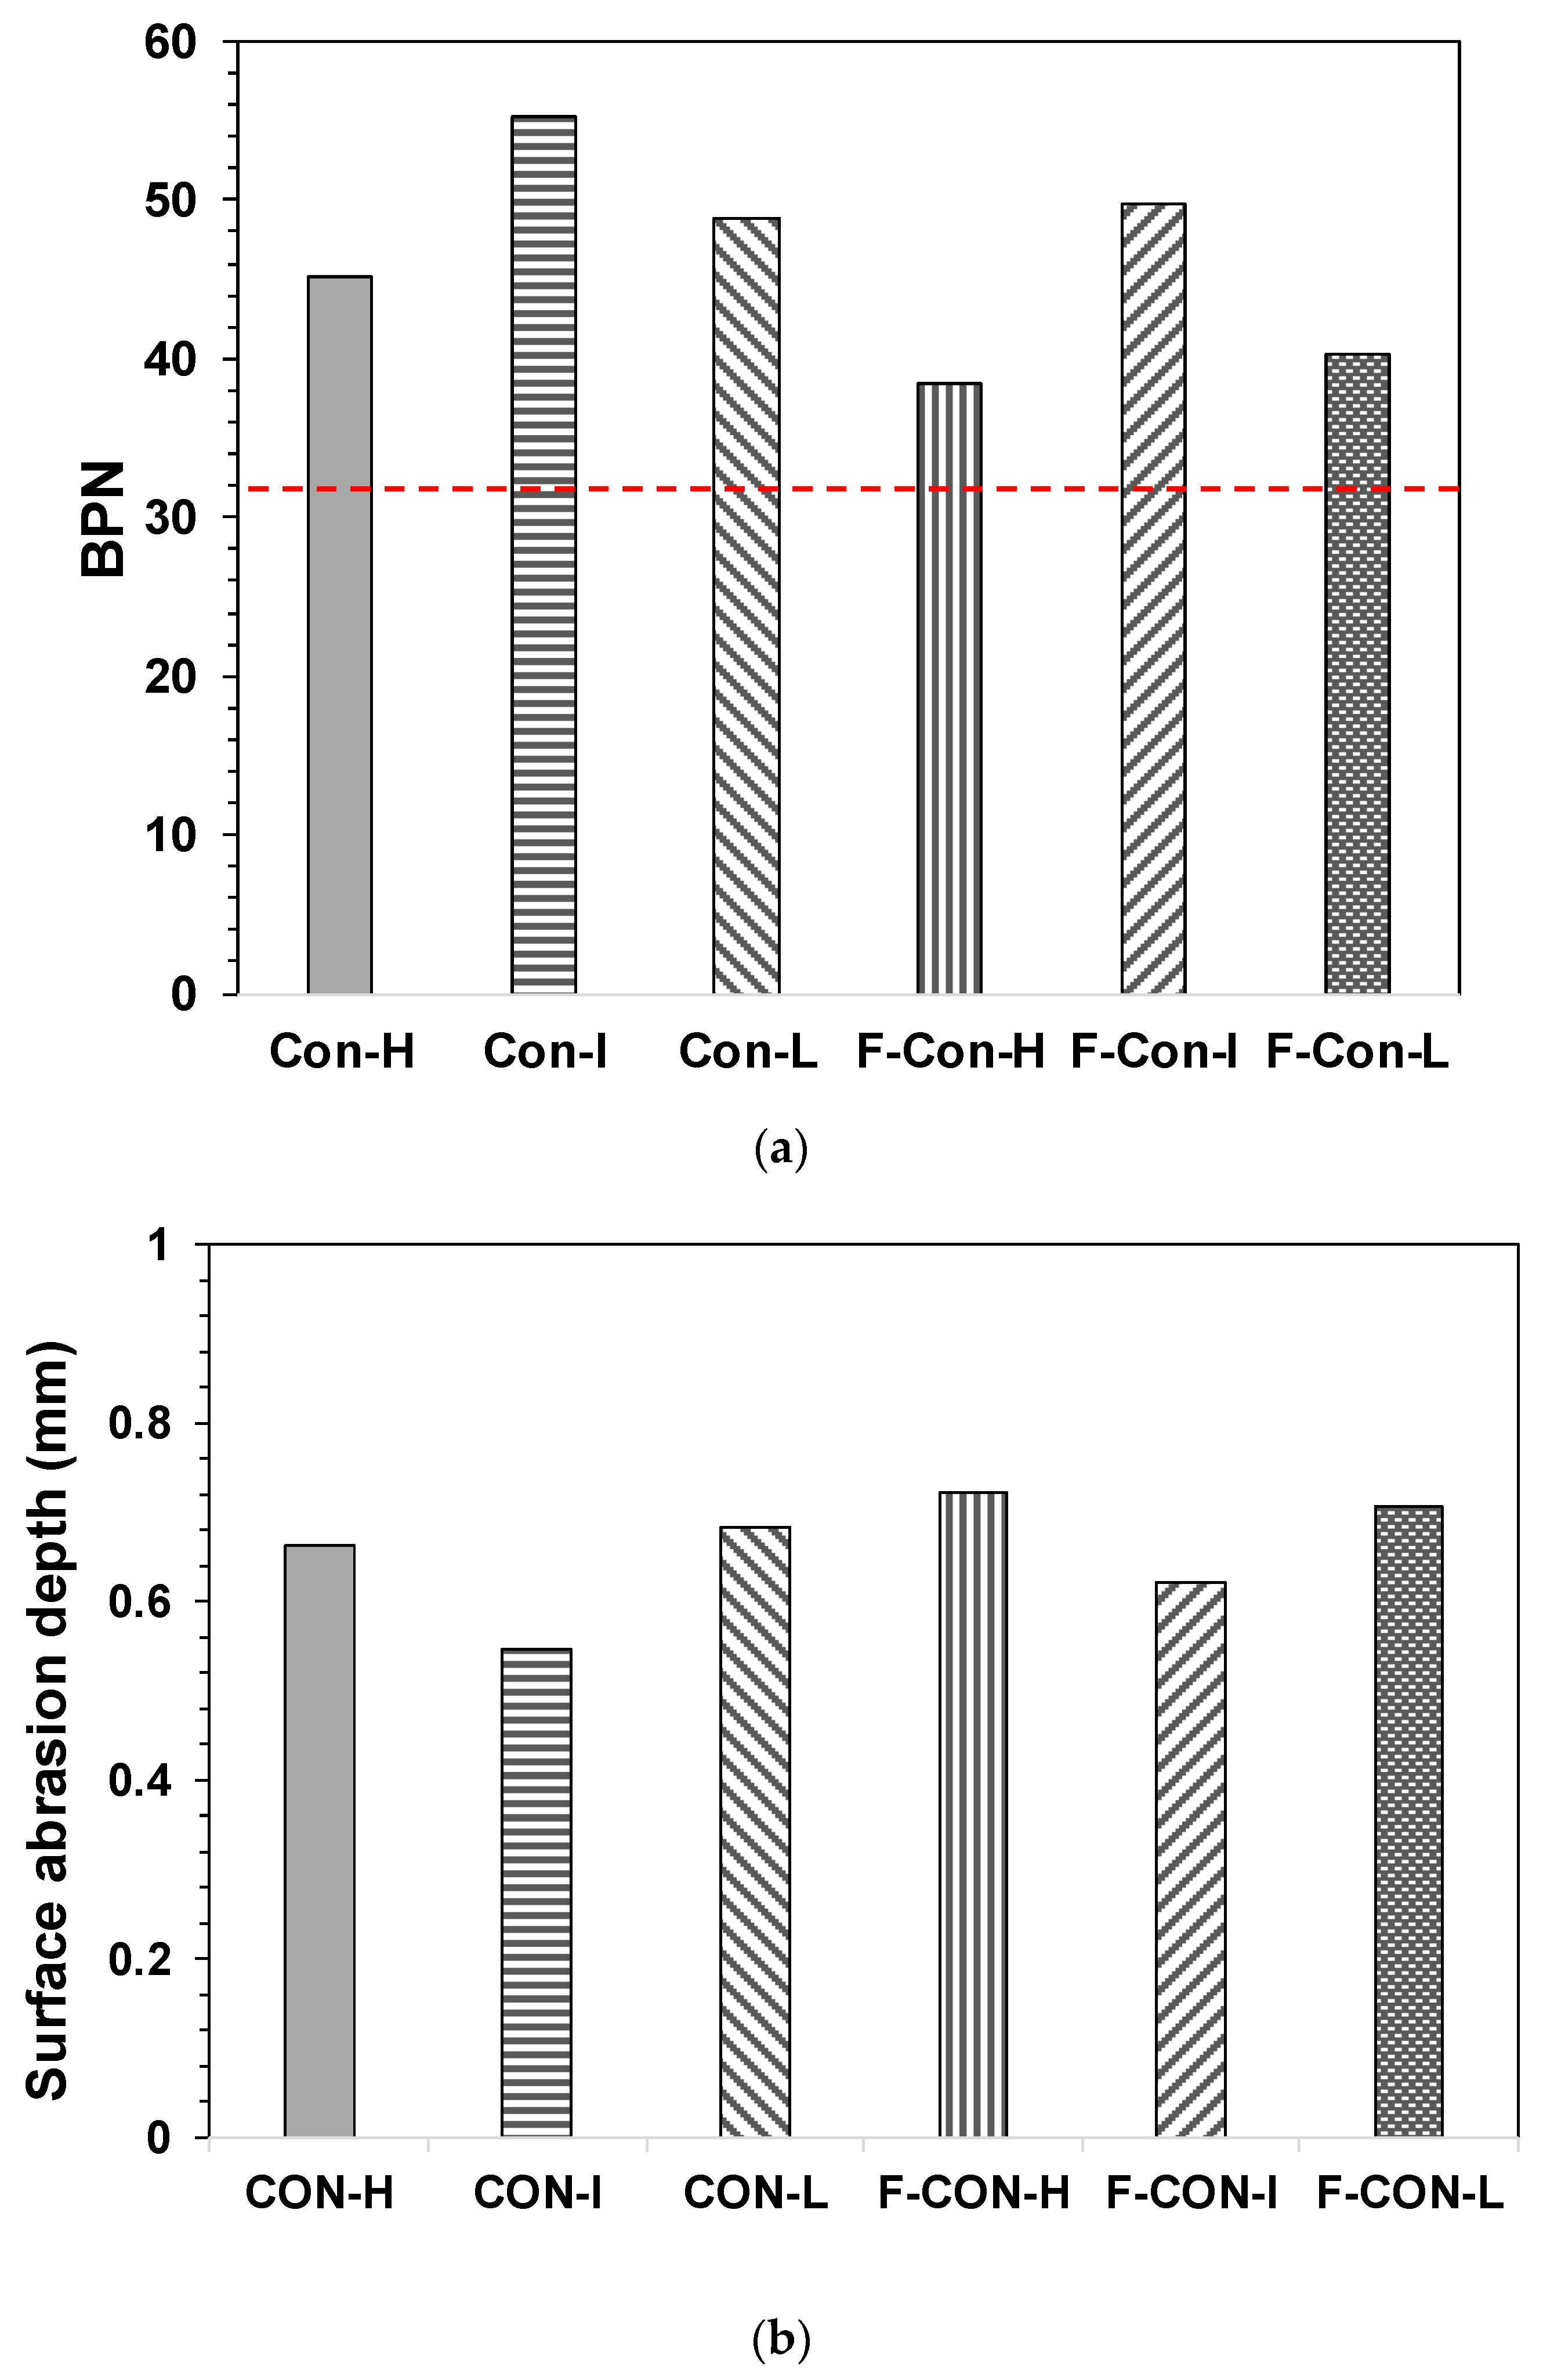
3.3.1. Skid Resistance and Surface Abrasion Resistance

Figure 11 shows the results of the skid resistance and surface abrasion resistance tests. Different BPNs were measured which varied with the levels of vibration and mixture proportions, but all samples exceeded the standard value of 32 for BPN. Regardless of the levels of vibration, the CON group had a higher BPN than the F-CON group, which suggested that the use of fly ash in the binder might decrease the BPN. In addition, high BPN was measured in the order of intermediate, low, and high level of vibration, regardless of the binder used. Interestingly, the lowest BPN was measured in the samples with a high level of vibration, which suggested that excessive vibration induced the mixing water to move to the surface of the concrete, causing excessive bleeding, resulting in laitance to some extent. This tendency was consistent with the bleeding test results.
As a result of the surface abrasion resistance test, the criteria were satisfied because the abrasion of all samples was less than 2 mm. The lowest surface abrasion was measured in samples with an intermediate level of vibration, and almost similar surface abrasion occurred in samples with high and low levels of vibration. In addition, slightly lower surface abrasion was evaluated in the CON group than in the F-CON group, which suggested that the CON group had high compressive strength and this tendency was consistent with the mechanical strength results. Interestingly, the samples with high and low levels of vibration had significantly different mechanical strengths, but almost similar surface abrasion occurred. It seemed that even though the samples that had received a high level of vibration had higher compressive strength than the samples receiving a low level of vibration, excessive vibration might induce laitance on the surface of concrete, which affects abrasion.
Meanwhile, the reason for the high surface abrasion in the samples with a low level of vibration was that they had lower strength than the other samples. Thus, although almost similar surface abrasion occurred in the samples with high and low levels of vibration, the reason for the surface abrasion seemed completely different.

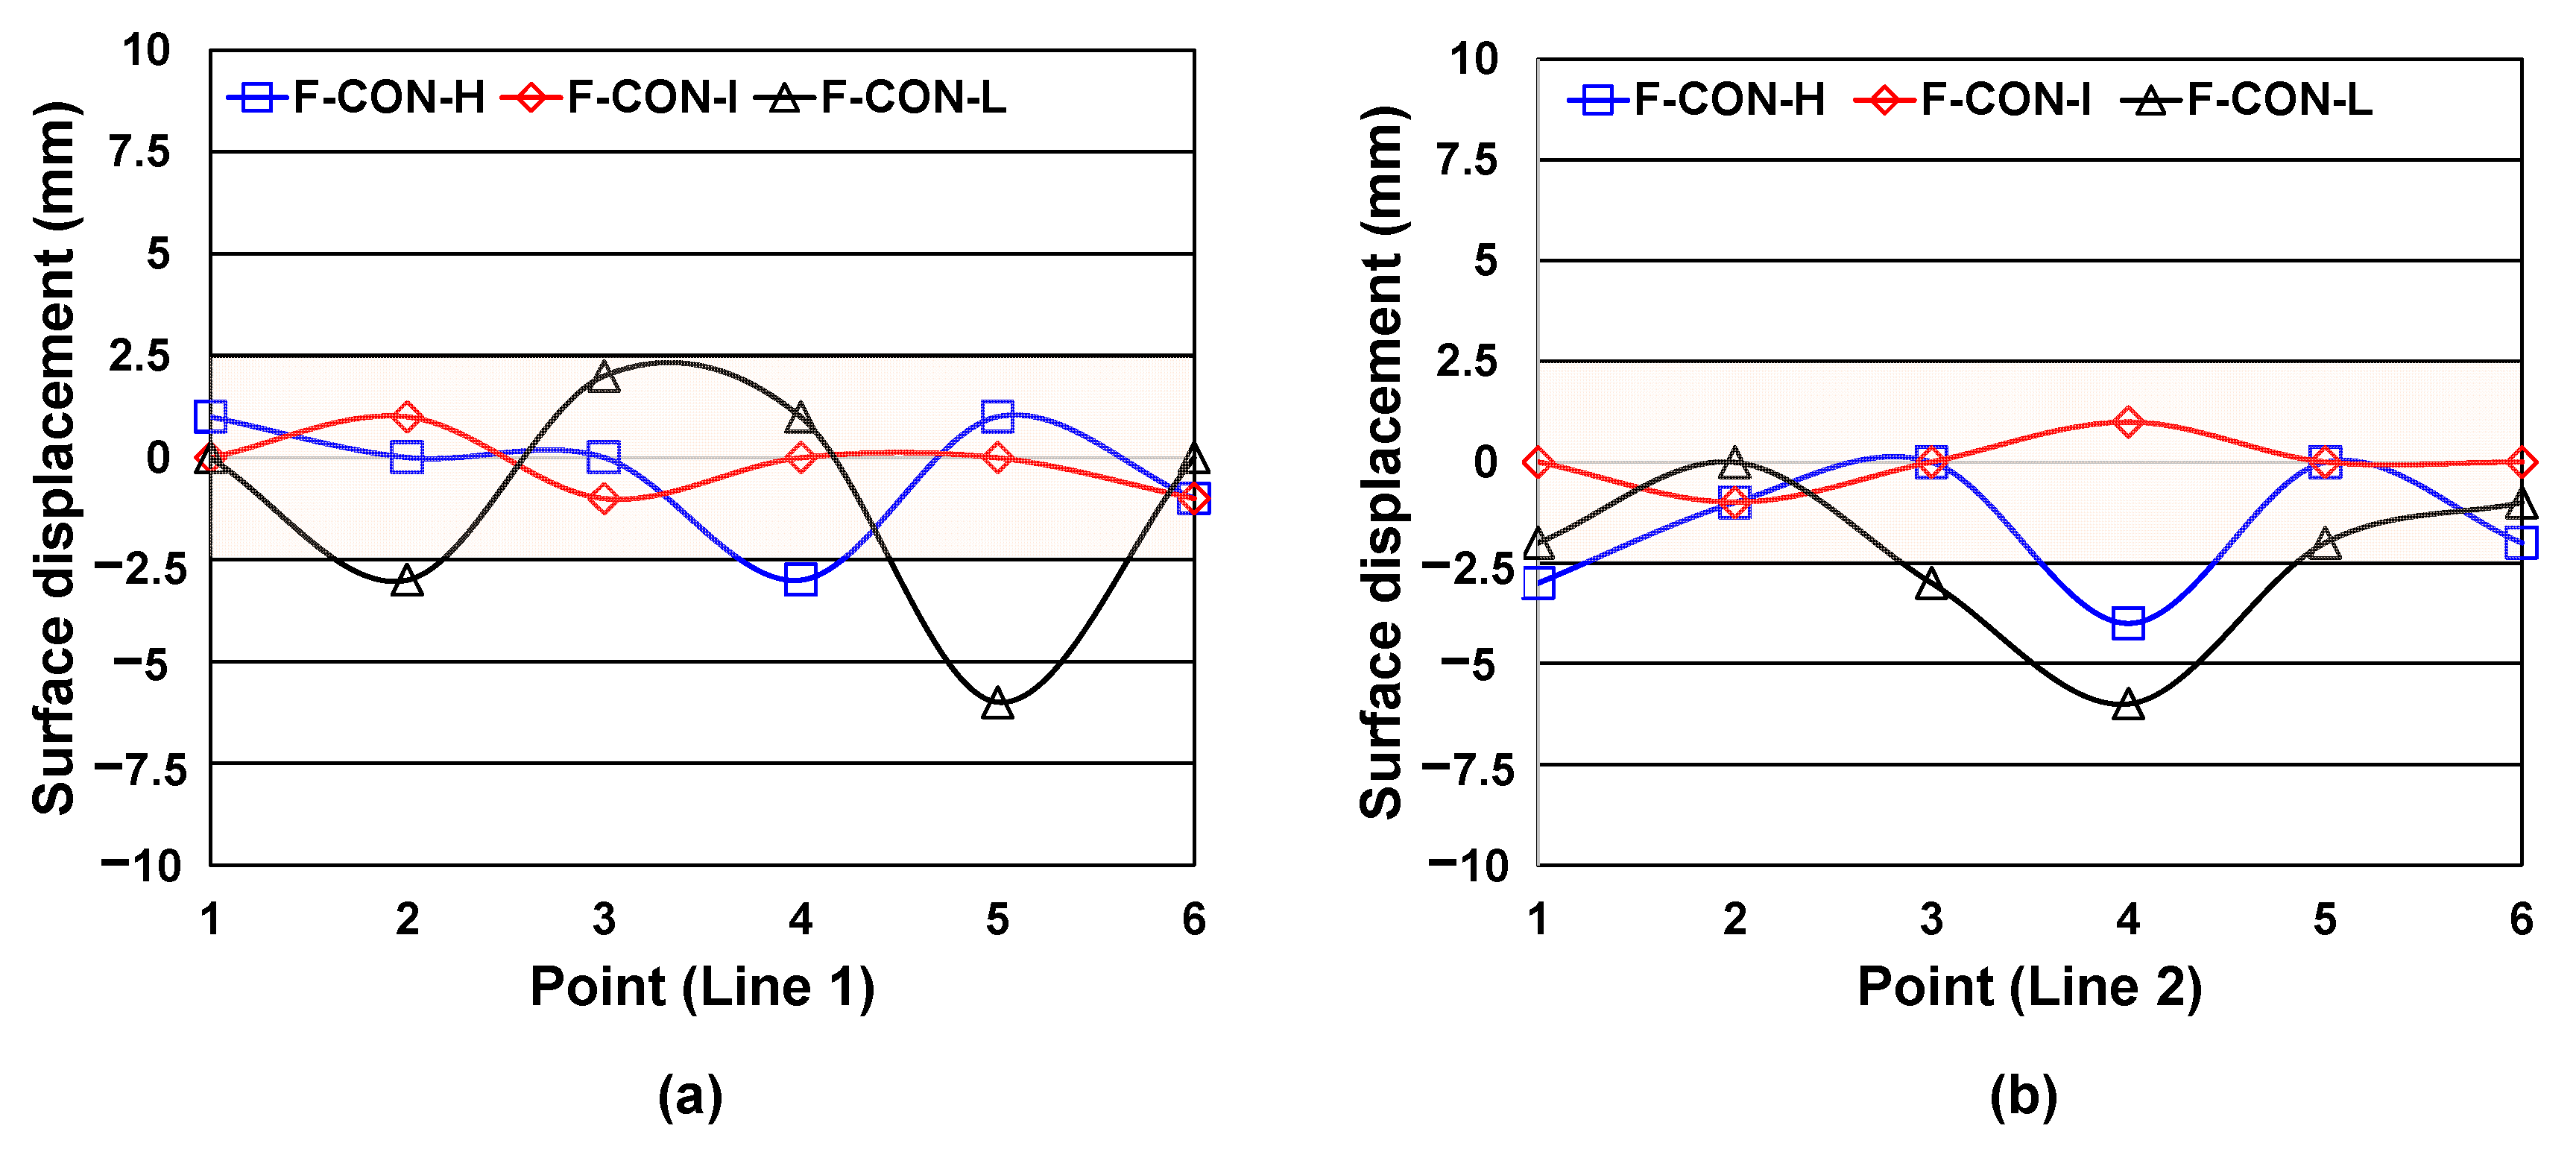
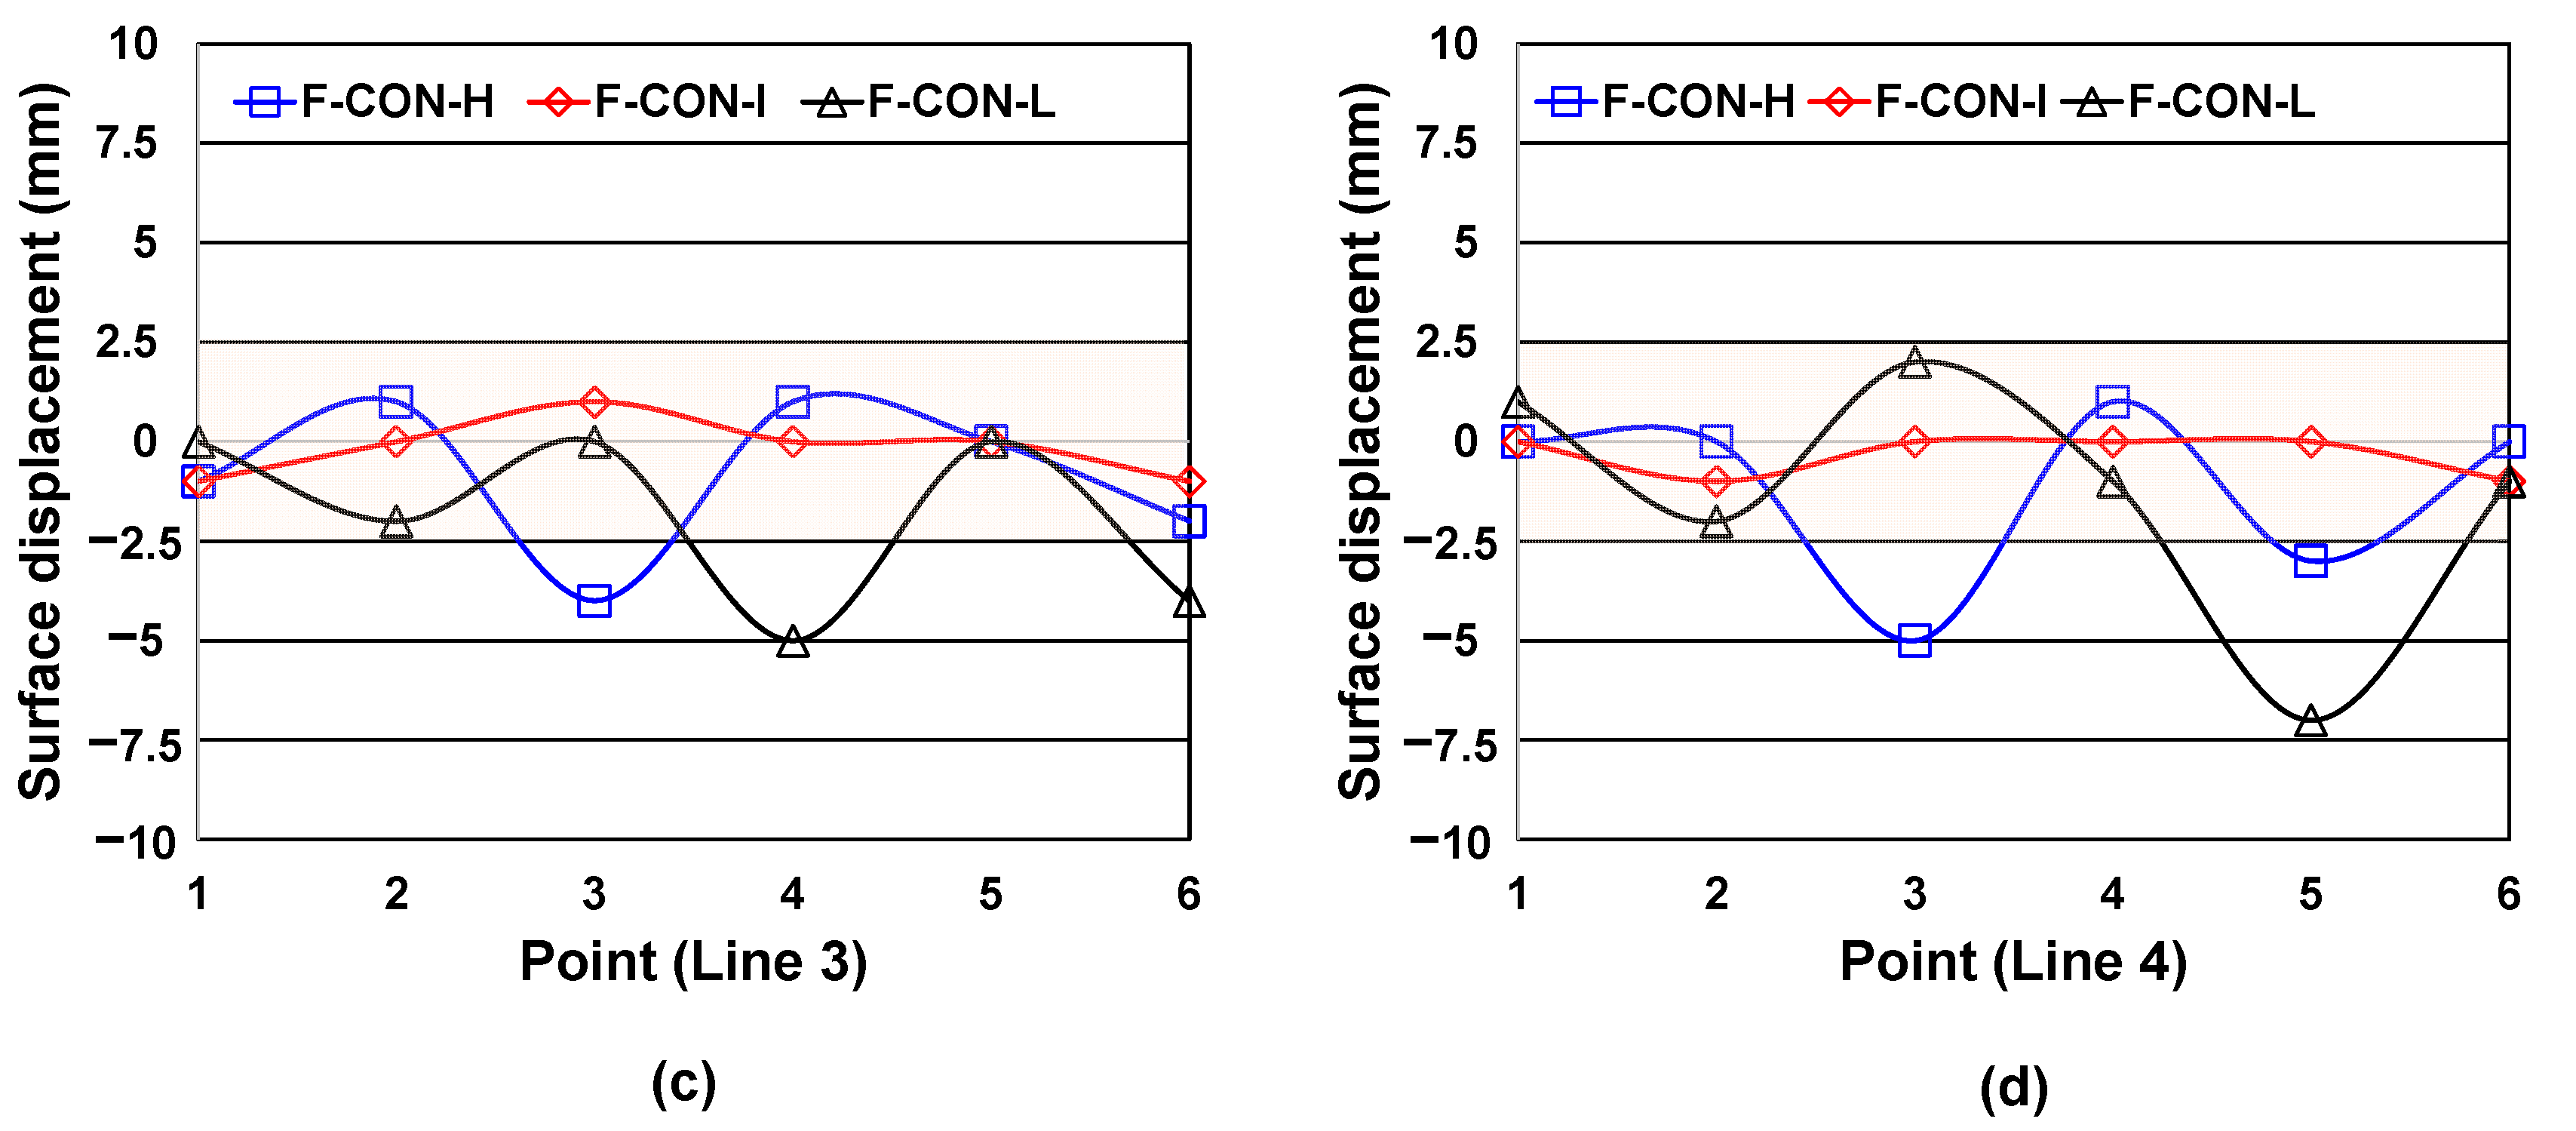
3.3.2. Surface Displacement Variation (IRI Measurement)

The effect of the mixture proportions and the levels of vibration on the surface displacement variation in the concrete pavement was verified, and through this experiment, the roughness of the concrete was indirectly evaluated. KS F 2373 [33] specifies that the roughness of concrete pavement is evaluated using a 7.6 m profile meter. If there is a difference of 2.5 mm or more from the target height of the concrete pavement, it is considered as an irregularity, and irregularities of more than 2.5 mm are summed for each section to evaluate the roughness of the concrete pavement.
The results of the surface displacement variations in the concrete are shown in Figure 12 and Figure 13, and the number of irregularities encountered are tabulated in Table 3.
Although almost the same irregularity points were observed varying with the lines, the F-CON group had slightly more total irregularity points than the CON group. This tendency indirectly indicated that it could be more difficult to manage roughness in the concrete containing fly ash than in normal concrete.
Meanwhile, the irregularity points were not observed in the samples with an intermediate level of vibration, but significantly large amounts of irregularity points were observed in the samples with high and low levels of vibration. Although the samples with low and high levels of vibration had almost similar irregularity points, the reason for the formation of irregularities seemed to be different.
In the case of the samples with low levels of vibration, the fresh concrete was not efficiently filled into the mold due to insufficient vibration, which created an empty space in the sample and consequently induced the settlement of the concrete, producing irregularity points.
On the other hand, in the samples with high levels of vibration, excessive vibration induced segregation and bleeding on the samples, and locally occurring bleeding on the surface of the concrete caused shrinkage, which seemed to be the main reason for the formation of irregularity points. Interestingly, there were slightly more irregularities in the samples with high levels of vibration than in the samples with low levels of vibration, which was consistent with the bleeding test. Thus, the explanation for the occurrence of irregularities seemed reasonable. Through the surface displacement variation test, it was verified that the levels of vibration and the mixture proportions could only affect the roughness of concrete pavement to a certain extent, but if appropriate vibration was applied, the quality of the concrete could be assured.

4. Conclusions

This study explored the effect of the mixture proportions and levels of vibration on the physical properties, durability, and performance of concrete pavement. Even with the same mixture proportions, different measurements for physical properties were achieved depending to the vibration levels. Furthermore, when a low level of vibration was applied to the sample, the mechanical property (i.e., strength) and durability criteria were not satisfied. The detailed conclusions are as follows.
(1)
Bleeding and finishability (i.e., float and modified float) results varied depending on the mixture proportions and vibration levels, and F-CON has easier finishability than CON, because the fly ash substituted in F-CON has spherical particles.
(2)
The strength of the samples varied depending on the different levels of vibration even in the samples with the same mixture proportions. In addition, the lower the vibration, the larger the standard deviation among samples, which indirectly indicated the difficulties involved in securing construction quality when a low level of vibration is applied. Furthermore, F-CON-L did not satisfy the concrete pavement strength criteria, which suggested that a low level of vibration induces many voids, lowering the strength.
(3)
The samples with low levels of vibration had relatively lower density and higher absorption than the other samples. Higher water absorption indicates that the sample has more voids, which may affect the strength and durability.
(4)
The samples with low levels of vibration were vulnerable to freezing and thawing, and F-CON-L did not satisfy the criteria suggested by KS F 2456. In addition, CON-L had lower freezing and thawing resistance than other samples, which suggested that the durability of the concrete could not be assured if inappropriate vibration was applied.
(5)
There was little difference in the performance tests (i.e., skid resistance, surface abrasion, and IRI) of the concrete pavements depending on mixture proportions and vibration levels. However, the samples with an intermediate level of vibration had a relatively higher performance than the other samples.

Author Contributions

Conceptualization, W.S.Y.; Formal analysis, W.S.Y., H.E.B. and H.-W.P.; Investigation, H.E.B.; Writing—original draft, W.S.Y.; Writing—review & editing, J.H.J. All authors have read and agreed to the published version of the manuscript.

Funding

This study was supported by INHA UNIVERSITY Research Grant (2021) and research Project (21POQW-B152690-03) funded by the Ministry of Land, Infrastructure and Transport (MOLIT) and the Korea Agency for Infrastructure Technology Advancement (KAIA).

Data Availability Statement

Not applicable.

Acknowledgments

The authors would like to thank the members of research team, MOLIT and KAIA for their guidance and support throughout the project.

Conflicts of Interest

The authors declare no conflict of interest.

References

  1. MOLIT. Yearbook of Road Statistics; MOLIT: Sejong City, Republic of Korea, 2020. [Google Scholar]
  2. Yi, Z.-J.; Yang, Q.-G.; Tang, B.-M.; Wu, G.-X.; Zhou, Z.-X. A fundamental understanding to the failure of cement concrete pavement based on the concept of fracture mechanics. Road Mater. Pavement Des. 2002, 3, 261–280. [Google Scholar] [CrossRef]
  3. Yun, C.P.K.; Han, S.; Hong, S. Review of domestic and foreign concrete pavement mix desing for the development of cement concrete pavement (1)-Analysis of construction characteristics and improvement plan. Int. J. Highw. Eng. 2009, 11, 36–45. [Google Scholar]
  4. Park, H.-W.; Kim, D.-H.; Lee, J.-H.; Yum, W.-S.; Jeong, J.-H. Influence of mix properties of concrete slabs on the performance of airport pavements. Proc. Inst. Civ. Eng. Transp. 2023, 176, 3–13. [Google Scholar] [CrossRef]
  5. Tymkowicz, S.; Steffes, R.F. Vibration study for consolidation of Portland cement concrete. Transp. Res. Rec. 1997, 1574, 109–115. [Google Scholar] [CrossRef]
  6. Huang, Y.H. Pavement Analysis and Design; Pearson Prentice Hall: Upper Saddle River, NJ, USA, 2004; Volume 2. [Google Scholar]
  7. Mehta, P.K.; Monteiro, P.J. Concrete: Microstructure, Properties, and Materials; McGraw-Hill Education: New York, NY, USA, 2014. [Google Scholar]
  8. Ozyildirim, H.C.; Miller, R.E., Jr.; Chairman, S.; Bonikowsky, D.A.; Minnich, R.A.; Cumming, N.A.; Olsen, M.P.; Dolen, T.P.; Olson, L.D.; Ford, J.H. Guide for Consolidation of Concrete; ACI Committee: Farmington Hills, MI, USA, 1997. [Google Scholar]
  9. MOLIT. On-Site Construction Quality Management Handbook for Cement Concrete Pavement; MOLIT: Sejong City, Republic of Korea, 2009. [Google Scholar]
  10. Malvern Panalytical. X’pert HighScore Plus Software. Version 3.0; Malvern Panalytical: Malvern, UK, 2012. [Google Scholar]
  11. ICDD. Joint Committee on Powder Diffraction Standards (JCPDS)-International Centre for 398 Diffraction Data (ICDD). 2008. Available online: https://www.icdd.com/ (accessed on 1 August 2023).
  12. ASTM C 618; Standard Specification for Coal Fly Ash and Raw or Calcined Natural Pozzolan for Use in Concrete. ASTM: West Conshohocken, PA, USA, 2019.
  13. Korea Expressway Corporation. Highway Construction Material Quality Standards; Korea Expressway Corporation: Gimcheon, Republic of Korea, 2018. [Google Scholar]
  14. ASTM C 192; Standard Practice for Making and Curing Concrete Test Specimens in the Laboratory. ASTM: West Conshohocken, PA, USA, 2019.
  15. KS F 2414; Standard Test Method for Bleeding of Concrete. Korean Standard & Certification: Seoul, Republic of Korea, 2020.
  16. Cook, M.D.; Seader, J.N.; Ley, T.M.; Russell, B.W. Investigation of Optimized Graded Concrete for Oklahoma-Phase 2; Oklahoma Department of Transportation: Oklahoma City, OK, USA, 2015. [Google Scholar]
  17. ASTM C 109; Standard Test Method for Compressive Strength of Hydraulic Cement Mortars. ASTM: West Conshohocken, PA, USA, 2020.
  18. ASTM C 78; Standard Test Method for Flexural Strength of Concrete (Using Simple Beam with Third-Point Loading). ASTM: West Conshohocken, PA, USA, 2010.
  19. ASTM C 1585; Standard Test Method for Measurement of Rate of Absorption of Water by Hydraulic Cement Concretes. ASTM: West Conshohocken, PA, USA, 2011.
  20. ASTM C 12; Standard Test Method for Density, Relative Density (Specific Gravity), and Absorption of Coarse Aggregate. ASTM: West Conshohocken, PA, USA, 2007.
  21. KS F 2456; Standard Test Method for Resistance of Concrete to Rapid Frezzing and Thawing. Korean Standard & Certification: Seoul, Republic of Korea, 2018.
  22. ASTM C 779; Standard Test Method for Abrasion Resistance of Horizontal Concrete Surfaces. ASTM: West Conshohocken, PA, USA, 2019.
  23. KS F 2375; Standard Test Method for Measuring Surface Frictional Properties Using the British Pendulum Tester. Korean Standard & Certification: Seoul, Republic of Korea, 2016.
  24. Ravina, D.; Mehta, P.K. Properties of fresh concrete containing large amounts of fly ash. Cem. Concr. Res. 1986, 16, 227–238. [Google Scholar] [CrossRef]
  25. Sun, Z.; Young, C. Bleeding of SCC pastes with fly ash and GGBFS replacement. J. Sustain. Cem. Based Mater. 2014, 3, 220–229. [Google Scholar] [CrossRef]
  26. Eren, O.; Brooks, J.J.; Celik, T. Setting times of fly ash and slag-cement concretes as affected by curing temperature. Cem. Concr. Aggreg. 1995, 17, 11–17. [Google Scholar]
  27. Jeong, Y.; Park, H.; Jun, Y.; Jeong, J.-H.; Oh, J.E. Microstructural verification of the strength performance of ternary blended cement systems with high volumes of fly ash and GGBFS. Constr. Build. Mater. 2015, 95, 96–107. [Google Scholar] [CrossRef]
  28. Chindaprasirt, P.; Jaturapitakkul, C.; Sinsiri, T. Effect of fly ash fineness on compressive strength and pore size of blended cement paste. Cem. Concr. Compos. 2005, 27, 425–428. [Google Scholar] [CrossRef]
  29. Bouzoubaa, N.; Foo, S. Use of Fly Ash and Slag in Concrete: A Best Practice Guide; Materials and Technology Laboratory, MTL: Ottawa, ON, Canada, 2004; p. 16. [Google Scholar]
  30. Cho, Y.K.; Jung, S.H.; Choi, Y.C. Effects of chemical composition of fly ash on compressive strength of fly ash cement mortar. Constr. Build. Mater. 2019, 204, 255–264. [Google Scholar] [CrossRef]
  31. Yum, W.S.; Jeong, Y.; Yoon, S.; Jeon, D.; Jun, Y.; Oh, J.E. Effects of CaCl2 on hydration and properties of lime (CaO)-activated slag/fly ash binder. Cem. Concr. Compos. 2017, 84, 111–123. [Google Scholar] [CrossRef]
  32. Neville, A.M. Properties of Concrete; Longman: London, UK, 1995; Volume 4. [Google Scholar]
  33. KS F 2373; Standard Test Method for Measuring Pavement Roughness Using a 7.6 m Profilograph. Korean Standard & Certification: Seoul, Republic of Korea, 2010.
Figure 1. Particle size distributions of PC and fly ash.
Buildings 13 02384 g001
Figure 2. Powder XRD patterns of PC and FA.
Buildings 13 02384 g002
Figure 3. Schematic of float and modified-float test: (a) prismatic mold and (b) plan view of prismatic mold.
Buildings 13 02384 g003
Figure 4. Surface abrasion test: (a) surface abrasion test equipment and (b) sample after surface abrasion test.
Buildings 13 02384 g004
Figure 5. Schematic of IRI measurement test.
Buildings 13 02384 g005
Figure 6. Results of bleeding test: (a) CON group and (b) F-CON group.
Buildings 13 02384 g006
Figure 7. Results of modified-float test: (a) CON group and (b) F-CON group.
Buildings 13 02384 g007
Figure 8. Mechanical strength development of the concrete: (a) compressive strength of CON group, (b) compressive strength of F-CON group, (c) flexural strength of CON group, and (d) flexural strength of F-Con group.
Buildings 13 02384 g008aBuildings 13 02384 g008b
Figure 9. Results of density and water absorption.
Buildings 13 02384 g009
Figure 10. Results of freezing and thawing: (a) relative dynamic modulus of CON group, (b) relative dynamic modulus of F-CON group, (c) weight loss of CON group, and (d) weight loss of F-CON group.
Buildings 13 02384 g010aBuildings 13 02384 g010b
Figure 11. Skid resistance (a) and surface abrasion resistance (b) related to physical properties tests of concrete pavement.
Buildings 13 02384 g011
Figure 12. Results of roughness of CON group: (a) line 1, (b) line 2, (c) line 3 and (d) line 4.
Buildings 13 02384 g012
Figure 13. Result of roughness of F-CON group: (a) line 1, (b) line 2, (c) line 3 and (d) line 4.
Buildings 13 02384 g013aBuildings 13 02384 g013b
Table 1. Chemical oxide of PC and FA.
OxidePC (wt%)FA (wt%)
CaO64.053.19
SiO218.5963.65
Al2O34.4522.38
MgO3.140.68
SO33.550.61
TiO20.291.16
MnO0.190.68
Fe2O33.615.66
K2O1.230.81
Na2O0.290.52
Others0.610.66
Sum100100
Table 2. Concrete mixture proportions used in this study.
Sample GroupSampleGmaxW/BS/aUnit Weight (kg/m3)
WPCFACFAES
CON
group
CON-H254040155388-10526790.142.71
CON-I
CON-L
F-CON
group
F-CON-H3837.51573318310616250.582.89
F-CON-I
F-CON-L
Note: Gmax = maximum coarse aggregate size, W/B = water to binder ratio, S/a = sand/aggregate ratio, W = water, PC = Portland cement, FA = Fly ash, C = coarse aggregate, F = fine aggregate, AE = air-entraining agent, S = superplasticizer.
Table 3. Results of points of irregularity.
CON GroupF-CON Group
HILHIL
Line 1101102
Line 2 102202
Line 3201102
Line 4102201
Sum506607
Note: H = high level of vibration, I = intermediate level of vibration, L = low level of vibration.
Disclaimer/Publisher’s Note: The statements, opinions and data contained in all publications are solely those of the individual author(s) and contributor(s) and not of MDPI and/or the editor(s). MDPI and/or the editor(s) disclaim responsibility for any injury to people or property resulting from any ideas, methods, instructions or products referred to in the content.

