Article

Variability Analysis of the Hysteretic Behavior of Fiber-Reinforced Polymer (FRP)-Confined Concrete Columns Based on a Secondary Development Model

1
School of Civil Engineering, Beijing Jiaotong University, Beixiaguan Street, Haidian District, Beijing 100044, China
2
School of Civil Engineering, Xuchang University, Xuchang 461000, China
3
China Railway Construction Co., Ltd., Beijing 100043, China
*
Authors to whom correspondence should be addressed.
Buildings 2023, 13(9), 2396; https://doi.org/10.3390/buildings13092396
Submission received: 24 August 2023 / Revised: 19 September 2023 / Accepted: 19 September 2023 / Published: 21 September 2023
(This article belongs to the Section Building Materials, and Repair & Renovation)

Abstract

:
A reasonable material hysteretic constitutive model has a significant influence on the seismic simulation results of structures. To better describe the hysteresis seismic performance of fiber-reinforced polymer (FRP)-constrained concrete, a new modified hysteresis constitutive model is proposed based on the existing model and with sufficient consideration of the drop section of the skeleton curve. The validity of the proposed model is verified by comparing with quasi-static experimental data of FRP-confined reinforced concrete (FRP-C RC) columns in the literature. Subsequently, the compressive strength of concrete is selected as a major variable, and a quasi-Monte Carlo method is utilized to generate random samples, which are substituted into the proposed modified model and some comparison models. Finally, the hysteretic behavior of FRP-C RC columns is analyzed from the perspective of the material strength variability. The results demonstrate that (1) The proposed hysteretic constitutive model is able to provide rational predictions of the hysteretic behavior of FRP-C RC columns, and the mean relative error of each specimen is less than 6%. It can be applied to carbon FRPs (CFRPs) and glass FRPs (GFRPs), as well as different cross-sectional forms such as cylindrical and square columns. (2) A large number of hysteretic behavior cases of FRP-C RC columns can be successfully analyzed from the perspective of concrete material variability combined with finite element software. The average and variation coefficient of the maximum horizontal force of FRP-C reinforced C30 concrete columns are 76.77 kN and 0.0488, respectively, while the average and variation coefficient of the maximum horizontal force of FRP-C reinforced C50 concrete columns are 91.14 kN and 0.0454, respectively. (3) The average value and variation coefficient of the maximum horizontal force and equivalent damping ratio of FRP-C RC columns are affected by the compressive strength, axial compression ratio and reinforcement ratio, which show a certain regularity.

1. Introduction

Advanced composites, namely fiber-reinforced polymers (FRPs), provide engineers with new opportunities to overcome several design problems that cannot be solved adequately with conventional construction materials [1]. FRP composite materials have been widely utilized for seismic reinforcement of concrete and steel structures due to their significant advantages such as their light weight, high strength-to-weight ratio, corrosion resistance and potentially high durability [2,3,4,5,6,7,8]. Traditional FRP bars include glass FRPs (GFRPs), carbon FRPs (CFRPs) and aramid FRPs [9]. Currently, FRP rods are commonly applied in engineering, including carbon-fiber-reinforced polymers (CFRPs) and glass-fiber-reinforced polymers (GFRPs) according to fiber type [10]. However, GFRP bars are the most commonly used because of their low cost, while the use of CFRP bars is still limited due to their exorbitant cost [11]. In recent years, the rapid development of CFRPs mixed with lower-cost fibers has reduced the cost significantly [12]. This also indicates that CFRPs and GFRPs will continue to be used on a large scale in the future. Due to the different natures of CFRP and GFRP materials, there will be differences in their mechanical properties, durability, etc., in different environments, so it is important to select the type of FRP material that meets the requirements of the specific environment during use [10,11,12].
The stress–strain behaviors of FRP-confined concrete under monotonic and cyclic compression are invariably research hotspots for the seismic performance and design of concrete structures [13,14,15]. Up to now, numerous studies have been carried out based on monotonic compressive loading [4,16,17,18,19,20,21,22,23] and cyclic compressive loading [24,25,26,27,28,29,30,31]. Only a few cyclic constitutive models of FRP-confined concrete have been proposed [32,33,34,35,36,37,38]. Consistent with the assessment results calibrated with a database of 730 FRP-confined concrete cylinder tests, the Lam and Teng model [18] is one of the top performing models [20]. Additionally, among the above models, Lam and Teng models [15,18,19,20] based on test databases are widely cited and revised typical models.
Meanwhile, numerical simulation analysis plays an important role in studying the seismic performance of reinforced structures. The OpenSees platform is free, funded by the National Science Foundation, led by the Pacific Earthquake Engineering Research Center, and developed by the University of California, Berkeley. OpenSees (v2.5.0) is professional software for seismic analysis of structures with a high compatibility, high simulation accuracy, and easy collaborative development. To the best of the author’s knowledge, although Liu et al. [39,40] first embedded a modified constitutive model for FRP-confined concrete based on the Lam and Teng model [18] into the OpenSees development platform, unified FRP-confined concrete hysteretic constitutive models are not available in the existing OpenSees platform. Reviews such as the one conducted by Ziaadiny and Abbasnia [33] have shown that Lam and Teng models [15,20] involve some deficiencies for the path of reloading and unloading under cyclic loading that may reduce the accuracy of the model results. In addition, for Lam and Teng models [15,18,20], the stress drop section after the ultimate strain point of the compressive envelope curve and the tensile mechanical properties of FRP-confined concrete are not considered. For these reasons, by improving the Lam and Teng models [15,18,20] and modifying the corresponding compressive and tensile hysteresis rules, in this paper, a new modified hysteretic constitutive model for FRP-confined concrete has been presented and embeded into OpenSees for structural analysis. The validity of the proposed model has been verified by comparing the results with quasi-static experimental data in the literature.
On the other hand, existing research recognizes the critical role played by proper determination of the concrete strength, which is essential for reliable modeling of the structure [41,42]. As a composite material, the mechanical properties of concrete are stochastic and variable, which results in inevitable variation in the stress–strain curve. Although extensive research has been conducted on the influence of the variation in concrete material properties on the static and dynamic performance analysis of concrete structures [43,44,45,46], there is no independent study on the effect of concrete strength variability on the hysteretic behavior of FRP-C RC columns.
Hence, in this paper, we locally improved the FRP-constrained concrete compression skeleton curve proposed by Lam and Teng by adding a tension section and modified the compression hysteretic rule. Based on the C++ programming language, the improved FRP-constrained hybrid hysteretic constitutive model was integrated into OpenSees, providing conditions for better analysis of FRP-reinforced RC columns. Additionally, in this paper, the compressive strength of concrete was selected as a major variable, and a quasi-Monte Carlo method was utilized to generate random samples which were substituted into the proposed modified model. Further research on the influence of the variation in concrete compressive strength on the hysteretic behavior and variability of FRP-C RC columns was carried out. The average value of the maximum horizontal bearing capacity and its coefficient of variation and the average value of equivalent viscous damping ratio and its coefficient of variation were compared under different compressive strengths and elastic moduli, providing a new method for the comparison of hysteretic constitutive models of concrete constrained by FRP.

2. Secondary Development of a Modified FRP-Confined Concrete Model

2.1. Uniaxial and Cyclic Constitutions of Lam and Teng

By collecting and analyzing approximately all axial compression test data and models of FRP-confined concrete columns, which cover a variety of different concrete strengths, types of FRP, parcel layers and section sizes, Lam and Teng proposed a uniaxial constitutive model (named the Lam–Teng 2003 model) for FRP-confined concrete columns. For specific mathematical expressions, the parameter values of the proposed model and the stress–strain curve, please refer to references [18,20].
The stress–strain curve of the Lam–Teng 2003 model has a monotonically ascending bi-linear shape. Additionally, the FRP-confined concrete is said to be sufficiently confined [18,20]. In practice, some researchers [47] have observed a stress drop section after passing the ultimate stress point in the tests of FRP-C RC columns. The residual strain and the drop section of the skeleton curve are neglected after the ultimate stress of the Lam–Teng model [18,20] for FRP-confined concrete. The stress drop section will be taken into account in the proposed modified model in this paper.
In 2009, Lam and Teng presented a stress–strain model (named the Lam–Teng 2009 model) for FRP-confined concrete under cyclic axial compression [15]. The following three observations are highlighted: (a) the Lam–Teng 2003 model [18,20] is employed to predict the envelope curve under cyclic compression; (b) the unloading path expressed by a polynomial consists of an exponential function which is highly non-linear; (c) the reloading path adopted in Mander et al.’s approach [48] is composed of a linear segment and a parabolic portion.
The equation which describes the unloading paths of FRP-confined concrete has the following form [15]:
σ c = a ε c η + b ε c + c
with
a = σ u n E u n , 0 ( ε u n ε p l ) ε u n η ε p l η η ε p l η 1 ( ε u n ε p l )
b = E u n , 0 η ε p l η 1 a
c = a ε p l η b ε p l
η = 350 ε u n + 3
E u n , 0 = m i n 0.5 f c 0 ε u n σ u n ε u n ε p l
and
ε p l = 0 1.4 ( 0.87 0.004 f c 0 ) 0.64 ( ε u n , e n v 0.001 ) ( 0.87 0.004 f c 0 ) ε u n , e n v 0.0016 0 < ε u n , e n v 0.001 0.001 < ε u n , e n v 0.0035 0.0035 ε u n , e n v ε c u
where Eun,0 is the slope of the unloading path at zero stress; εcn is the compressive ultimate axial strain of FRP-confined concrete; σun and εun are the stress and the strain at the starting point of unloading path, respectively; σun,env and εun,env are the stress and the strain at the starting point of envelope unloading, respectively; fc0 is the compressive strength of unconfined concrete; and εpl is the plastic strain data for envelope unloading.
The reloading path consists of a linear portion and a parabolic portion, where the specific expressions are given by:
σ c = σ r e + E r e ( ε c ε r e ) ε r e ε c ε r e f
σ c = A ε c 2 + B ε c + C ε r e f ε c ε r e t , e n v
with
E r e = ( σ n e w σ r e ) / ( ε r e f ε r e ) ε r e ε c ε r e f
B = E r e 2 A ε r e f
C = σ n e w A ε r e f 2 B ε r e f
where σre and εre are the stress and the strain at the starting point of reloading path, respectively; Ere is the slope of the linear portion; and εret,env is the envelope returning strain. The definitions and expressions of εref, σnew, εret,env, and A are illustrated in detail in reference [15].

2.2. A New Modified Model of FRP-Confined Concrete

Based on the above Lam and Teng models [15,18,20], a new hysteretic constitutive model for FPR-confined concrete under cyclic loading is proposed. The stress drop section of the compressive skeleton curve and the tensile performance under cyclic stress are taken into account and the corresponding hysteretic criterion is modified. For better understanding, here are some detailed explanation as follows:
(1)
The envelope curve under cyclic compression
A variety of concrete hysteretic constitutive models are integrated in OpenSees, while Concrete01 and Concrete02 models are the most widely available [49]. The Kent–Scott–Park model modified by Scott et al. [50] is adopted for the compression skeleton curves of these two models. Referring to the expression of the compression skeleton curves in the Concrete01 and Concrete02 models, the stress drop section after the overstress peak is added to the Lam–Teng 2003 model in this paper. Moreover, the stress remains constant when the stress drops to 20% of the ultimate stress. Hence, the compression skeleton curves are described by the following equations:
σ c = E c ε c ( E c E 2 ) 2 4 f 0 ε c 2 f 0 + E 2 ε c f c c E 3 ε c 0.2 f c c ε c ε t ε t < ε c ε c c ε c c < ε c ε c u ε c > ε c u
where the definitions of Ec, E2, ε t , and fcc are found in the Lam–Teng 2003 model [15]; εcc is the strain corresponding to the peak stress fcc; ε c u is the starting strain when the stress drops to 20% of the peak stress fcc; and E3 is the slope of the straight line of the stress descent section after passing the peak stress fcc, which is determined by points A and B.
(2)
Unloading and reloading paths under cyclic compression
An unloading path is defined as the stress–strain path that the concrete will trace as the strain reduces, and this path is independent of its terminating point [15]. The unloading path consists of two straight-line segments. After the first straight line unloads to a certain extent, the second straight line unloads to the compression residual strain point; the slope of the first line is the initial elastic modulus and the slope of the second line is a variable parameter, a multiple of the slope of the reloading line. The two straight-line segments are described by the following equations.
For the first straight-line segment of unloading path:
σ c = E c ( ε c ε u n ) + σ u n
where εun and σun are the unloading strain and unloading stress for envelope unloading [15].
For the second straight-line segment of unloading path:
σ c = λ σ u n ε u n ε p l ( ε c ε p l ) 0 < λ 1
where εpl is the plastic strain data for envelope unloading, please refer to Equation (7). It is worth noting that the value of λ in Equation (15) can be obtained by fitting the hysteretic test data of FRP-confined concrete in reference [15].
A reloading path is defined as the stress–strain path the concrete will trace as its strain increases from a starting point on an unloading path [15]. The reloading path is a straight-line segment connecting the compression residual strain point (εpl, 0) and the unloading point (εun, σun) of the compression envelope. Its expression is given by:
σ c = σ u n ε u n ε p l ( ε c ε p l )
(3)
Partial unloading and partial reloading under cyclic compression
For partial unloading cases, if unloading is carried out from the reloading path, it shall first be conducted along the line with an initial slope (i.e., Ec) until it intersects with the second straight-line segment of the unloading path, and then it shall be carried out along the second straight-line segment of the unloading path until it reaches the residual strain point under cyclic compression.
For partial reloading cases, if reloading is implemented on the second straight-line segment of the unloading path, it should be carried out along a straight line with an initial slope of Ec until it intersects with the reloading path, and then reloading is conducted along the reloading path until the unloading point of the compression envelope. Alternatively, if reloading is carried out from the first straight-line segment of the unloading path, the load is implemented directly along the original unloading path until the unloading point of the compression envelope.
(4)
The envelope curve under cyclic tension
This paper adopts the tensile stress–strain model of unconfined concrete proposed by Mohd-Yassin and Filippou [51] for a tensile envelope curve and hysteresis criterion, regardless of the FRP constraint effect under tensile stress conditions. The stress–strain model consists of two straight lines, and the expression is as follows:
σ c = E c ε c f t E t ( ε c ε t ) 0 < ε c ε t ε t < ε c ε t u
where εt and ft are the peak tensile strain and tensile strength of unconfined concrete, respectively; εtu corresponds to the strain when the stress drops to zero in the tensile loading section; and Et is the slope of the tensile descent section.
(5)
Unloading and reloading paths under cyclic tension
A hysteresis criterion under cyclic tension in the proposed model in this paper is determined according to reference [51]. If unloading from the tensile envelope curve enters the compression section through the origin, the unloading path and the reloading path are both linear segments connecting the unloading point and the origin. If the unloading is from the compression section to the tensile section, the unloading path and reloading path are straight-line segments connecting the tensile unloading point and the compressive residual strain point. Furthermore, the initial elastic modulus of the concrete from the compression section to the tension section for the first time during unloading and reloading is Ec, regardless of whether the concrete enters the compression state before or after unloading. Therefore, the elastic modulus of the concrete from the compression section to the tension section is the slope of the last unloading point from the tension unloading point to the compressive residual strain point.
The peak stress and strain of each cyclic load from the compression section into the tensile section are expressed in the following equations:
ε n = ε t + Δ ε t σ n = f t 1 + E t E c E t Δ ε t
with
ε t u = ε t + f t 1 E t + 1 E c
where Δεt is the D-value between the compressive residual strain and the tension unloading strain in the last cycle.

2.3. OpenSees Program Realization of the Modified Model

The OpenSees platform comes with a complete secondary development interface for user-defined material based on the C++ language. The inherent UniaxialMaterial model in the OpenSees abstract category was selected for the proposed modified model of FRP-confined concrete [39]. Moreover, the envelope curves of compression and tension are constructed by the C_envelope and T_envelope functions, respectively. A flow chart (i.e., Figure 1) demonstrates how to achieve hysteresis under cyclic loading by the set TrailStrain function. This process is the most critical, and needs a strain value to determine the stress, stiffness, loading state judgment, etc. Additionally, TStrain represents the intermediate strain and CStrain represents the state variable. In order to ensure that the value of the state variable will not change during each iteration step, the state variable value should first be assigned to the intermediate variable, and the intermediate variable should be used in the actual calculation. After the current iteration step converges, the intermediate variable value should be updated to the state variable.

3. Validation of the Modified FRP-Confined Concrete Model

In order to verify the applicability of the modified FRP-confined concrete model, a numerical simulation of the hysteretic behavior of an FRP-C RC column under horizontal low cycle reciprocated loading was conducted in this section. Additionally, the numerical results were compared with the experimental data in the literature. It is worth noting that the OpenSees program provides a variety of constitutive models for rebar materials; the Steel02 model was adopted for modeling the FRP-confined RC columns in this paper.

3.1. Basic Information of the FRP-C RC Column

The basic information of the five FRP-C RC column specimens was obtained from the following references [52,53,54,55] for numerical simulations, while the geometric parameters and material parameters of each specimen are shown in Table 1 and Table 2, respectively. It is worth noting that only the C1H1C3N2 specimen is wrapped with FRP within 500 mm from the bottom of the column; the other four specimens are fully wrap with FRP. The C1H1C3N2 specimen is divided into two types of elements (i.e., a reinforced zone and an unreinforced zone) according to the FRP wrapped condition. The reinforced zone consists of FRP-confined concrete and steel bar material. The unreinforced zone consists of unconfined concrete and steel bar materials. The new modified model proposed in this paper was used for FRP-confined concrete.

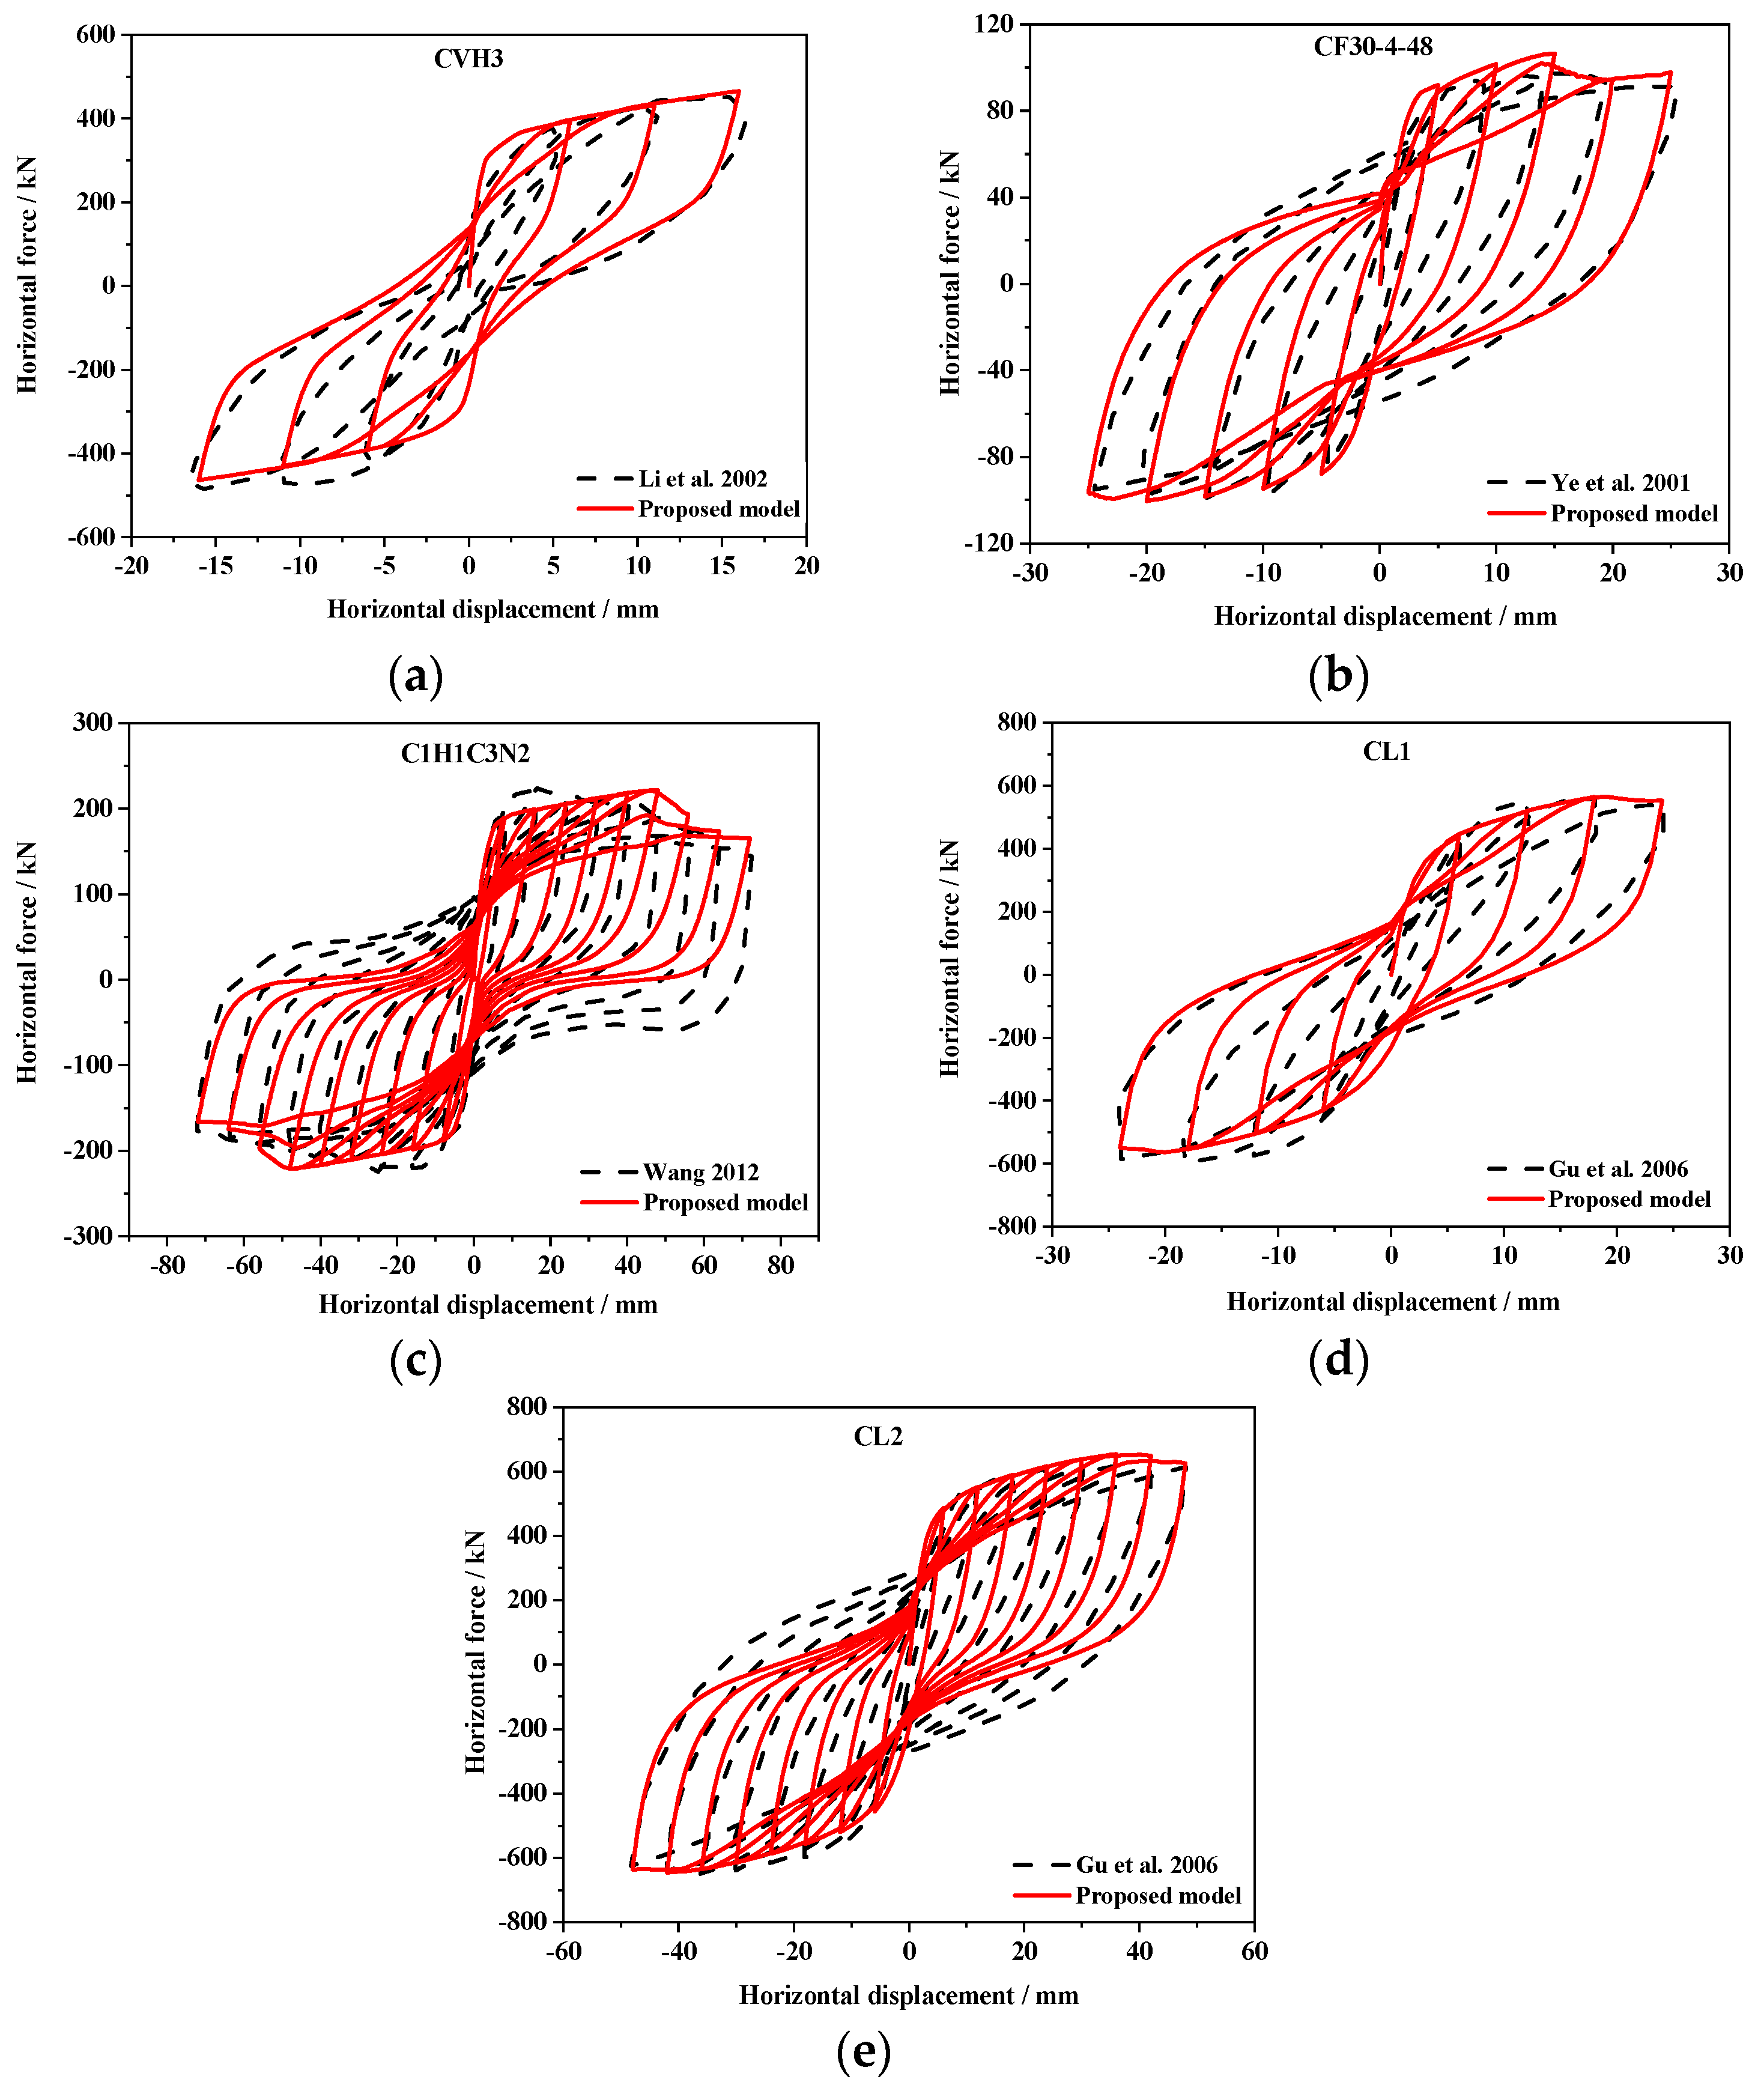
3.2. Comparison with Test Data

A quasi-static analysis of the above five specimens was performed in OpenSees, and the hysteretic displacement–force response curves determined by numerical simulation are shown in Figure 2.
As shown in Figure 2, the proposed model’s predictions for the skeleton curve, reloading curve and unloading curve are in good agreement with the test results, in particular, the maximum values of each hysteretic loop are infinitely close to the test results. Moreover, the stress drop section after the overstress peak in some specimens (e.g., CF30-D4-48 and C1H1C3N2) and the tensile cyclic response of all specimens are better simulated by the proposed model. However, some pinch effects are distinctly observed in the hysteretic loops predicted by the proposed model (e.g., Figure 2b,c,e), which may be caused by neglecting the closing and opening of cracks or debonding of the reinforcement [56].
In order to further demonstrate the accuracy and effectiveness of the proposed model, the positive and reverse maximum horizontal bearing forces (i.e., Fmax+, Fmax−) obtained from the simulation were compared with the test data, and the results are shown in Table 3. Except for the CF30-4-48 specimen, for which the relative error of the test and simulation is close to 10%, the relative error of other specimens is very small, with the minimum value only reaching 0.57%. Secondly, the mean relative error of each specimen is less than 6%. Compared with the Lam and Teng model, the new modified model proposed in this paper additionally considers the drop section of the skeleton curve, which can more accurately describe the hysteresis curve of the FRP-constrained RC column. Additionally, the model has better prediction results for both cylindrical and square columns.

4. Hysteretic Behavior Variability of FRP-C RC Columns Considering Concrete Strength Variations

In the above two sections of this paper, a new hysteretic constitutive model of FRP-confined concrete has been proposed and the rationality of the simulation has been verified. Based on this new proposed model, this section will make full use of OpenSees software and further research the influence of the variation in concrete compressive strength on the hysteretic behavior and variability of FRP-C RC columns.

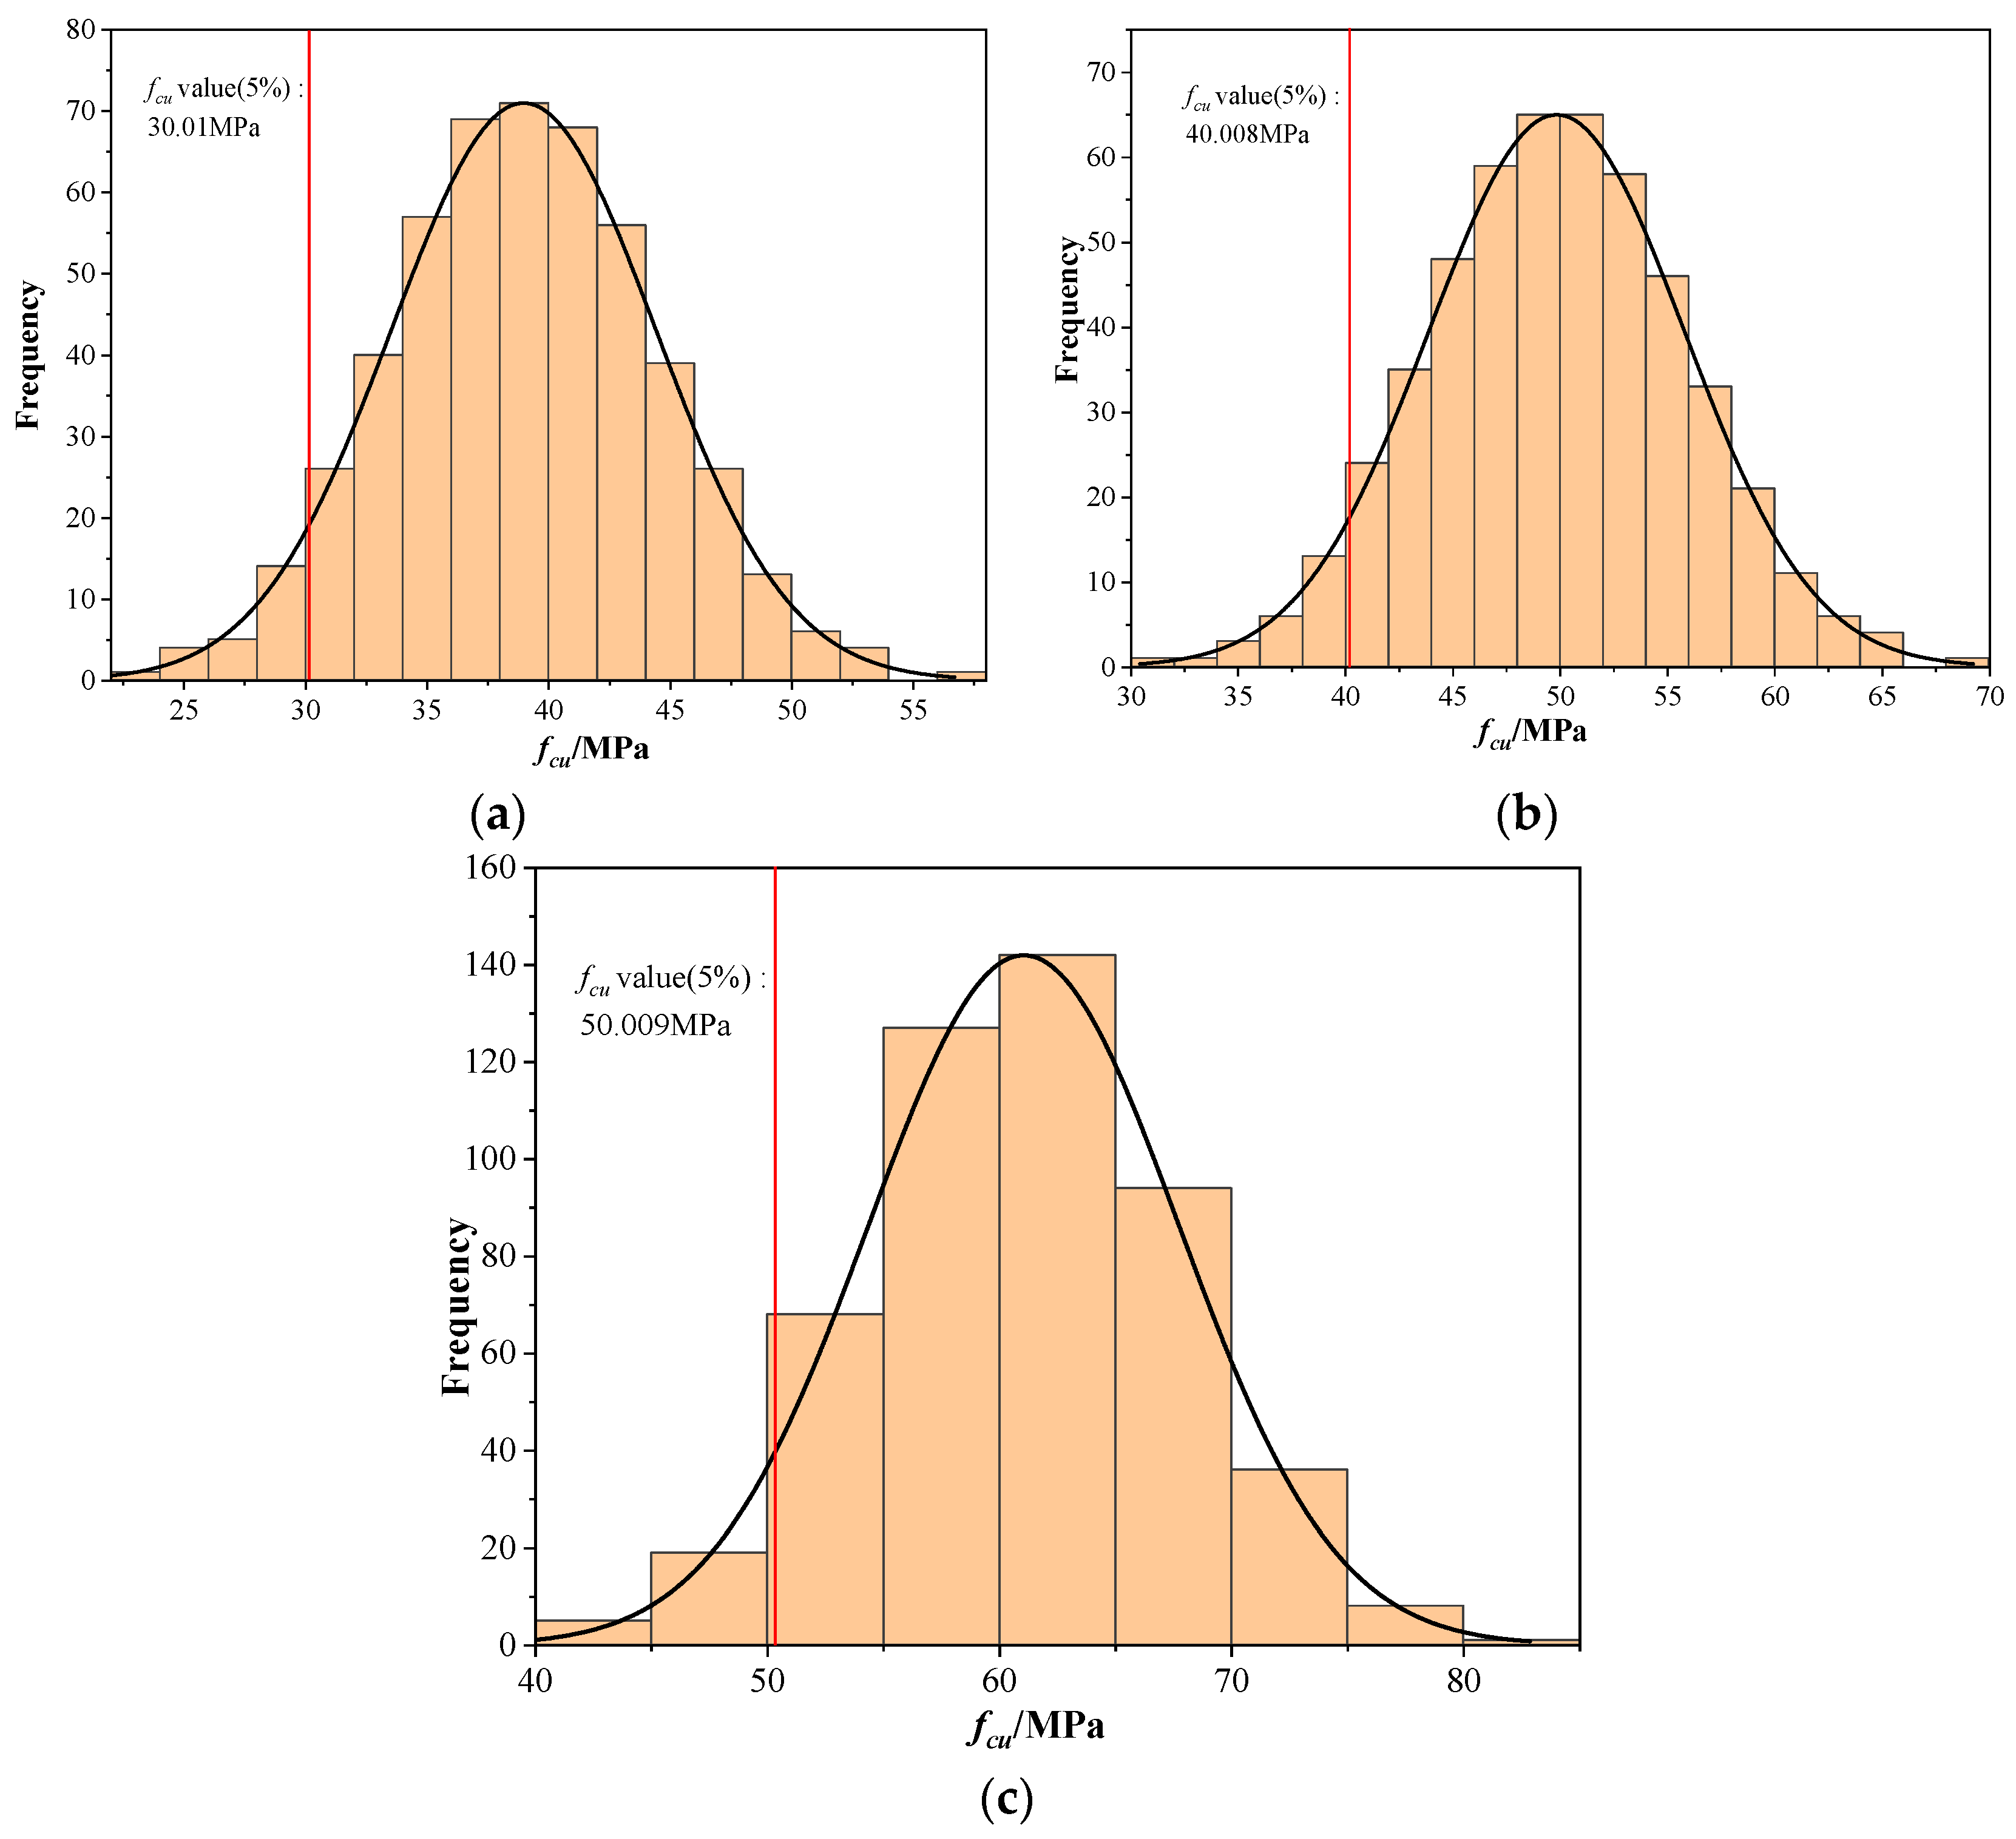
4.1. Major Random Variable for Concrete Material

This paper focuses on the influence of concrete materials on the seismic structure design. As a major design parameter, the concrete strength grade was determined according to the standard value of cubed concrete compressive strength, and it was assumed that the compressive strength of concrete obeys a normal distribution and the compressive strength of the same batch of concrete has a 95% guarantee rate [57]. When this conditions are satisfied, the average compressive strength of concrete is given by:
f c u , m = f c u 1 1.645 δ f
where fcu,m is the average compressive strength of concrete; fcu is the standard value of the compressive strength of concrete cubes; and δf is the coefficient of variation in the compressive strength of concrete cubes.
Furthermore, the longitudinal modulus of elasticity of concrete is another important parameter in the design of concrete structures. According to the conversion formula of the concrete elastic modulus to concrete cube compressive strength, the corresponding concrete elastic modulus can be obtained by the following equation:
E c , m = 100 / ( 34.7 f c u , m + 2.2 )
where Ec,m is the average elastic modulus of concrete.
To study the influence of mechanical property variability of concrete materials on the structural design, conventional methods generally assume that the parameters are independent of each other and then utilize the statistical information of each parameter to implement random sampling, which not only causes large amounts of calculations, but also generates some unreasonable samples. For instance, the compressive strength of a random concrete sample may be too large, while the corresponding elastic modulus may be very small. In order to avoid this situation, the correlation between the two main variables (i.e., the concrete compressive strength and elastic modulus) were first determined using Equations (20) and (21).

4.2. Random Sampling Methods

The Monte Carlo method, also known as the stochastic simulation method, is an approximate calculation method based on “random numbers” [58], and is often more efficient than conventional numerical methods for numerical problems in a large number of dimensions [59]. This method essentially takes advantage of probability theory to solve stochastic problems by conducting a large number of random experiments based on the established mathematical model. In recent years, the quasi-Monte Carlo method has been extensively developed [60]; its computational efficiency in solving some problems is hundreds of times higher than that of the Monte Carlo method, and the accuracy can also be calculated. The basic idea of the quasi-Monte Carlo method is utilizing the deterministic super-uniform distribution sequence (known mathematically as low discrepancy sequences) to replace the pseudo-random number sequence in the Monte Carlo method. The most common quasi-random number sequences in the quasi-Monte Carlo method include the Halton sequence, the Faure sequence and the Sobol sequence.
Firstly, in this work, the Sobol sequence was adopted to generate 500 uniformly distributed random sample points in the interval [0, 1]. Secondly, the cumulative distribution function (CDF) inverse method and Kolmogorov–Smirnov method were used to obtain the normal distribution of random samples of concrete compressive strength and carry out a K–S inspection. Finally, on the basis of being in accordance with a normal distribution, the generated concrete compressive strength random samples were input into the concrete material model in OpenSees to determine the hysteretic behavior of FRP-C RC columns. Undoubtedly, this will indirectly generate a corresponding random sample of FRP-C RC columns considering concrete strength variability. The histograms of the generated concrete compressive strength samples are shown in Figure 3, and they all obey a normal distribution. As shown in Figure 3, the average compressive strengths of C30, C40 and C50 concrete cubes are 38.98 MPa, 49.84 MPa and 61.05 MPa, respectively. According to GB50010-2010 (2010), the variation coefficients of compressive strength of C30, C40 and C50 concrete cubes are 0.14, 0.12 and 0.11, respectively. In addition, the sampling results of compressive strength satisfy the 95% guarantee, and the compressive strengths of C30, C40 and C50 at 5% of the fcu line are 30.01 MPa, 40.008 MPa and 50.009 MPa, respectively.

4.3. Variability Analysis for Hysteretic Behavior of FRP-C RC Columns

The hysteretic behavior and variability of FRP-C RC columns under different compressive strengths, axial compression ratios and reinforcement ratios were studied. The research object in this paper is a fully FRP-wrapped RC circular column; a total of 27 design cases and their basic information are shown in Table 4 below. The maximum horizontal force and the equivalent viscous damping ratio (i.e., ξe) under all working conditions, including their coefficient of variation, were obtained through numerical simulations of the hysteretic behavior of the FRP-C RC column. The equivalent viscous damping ratio ξe represents the ratio of the energy consumed in the hysteretic process to the energy input when the equivalent elastomer of the component produces the same displacement.
Considering the limitation of the article length, the authors choose only some cases to discuss and analyze.

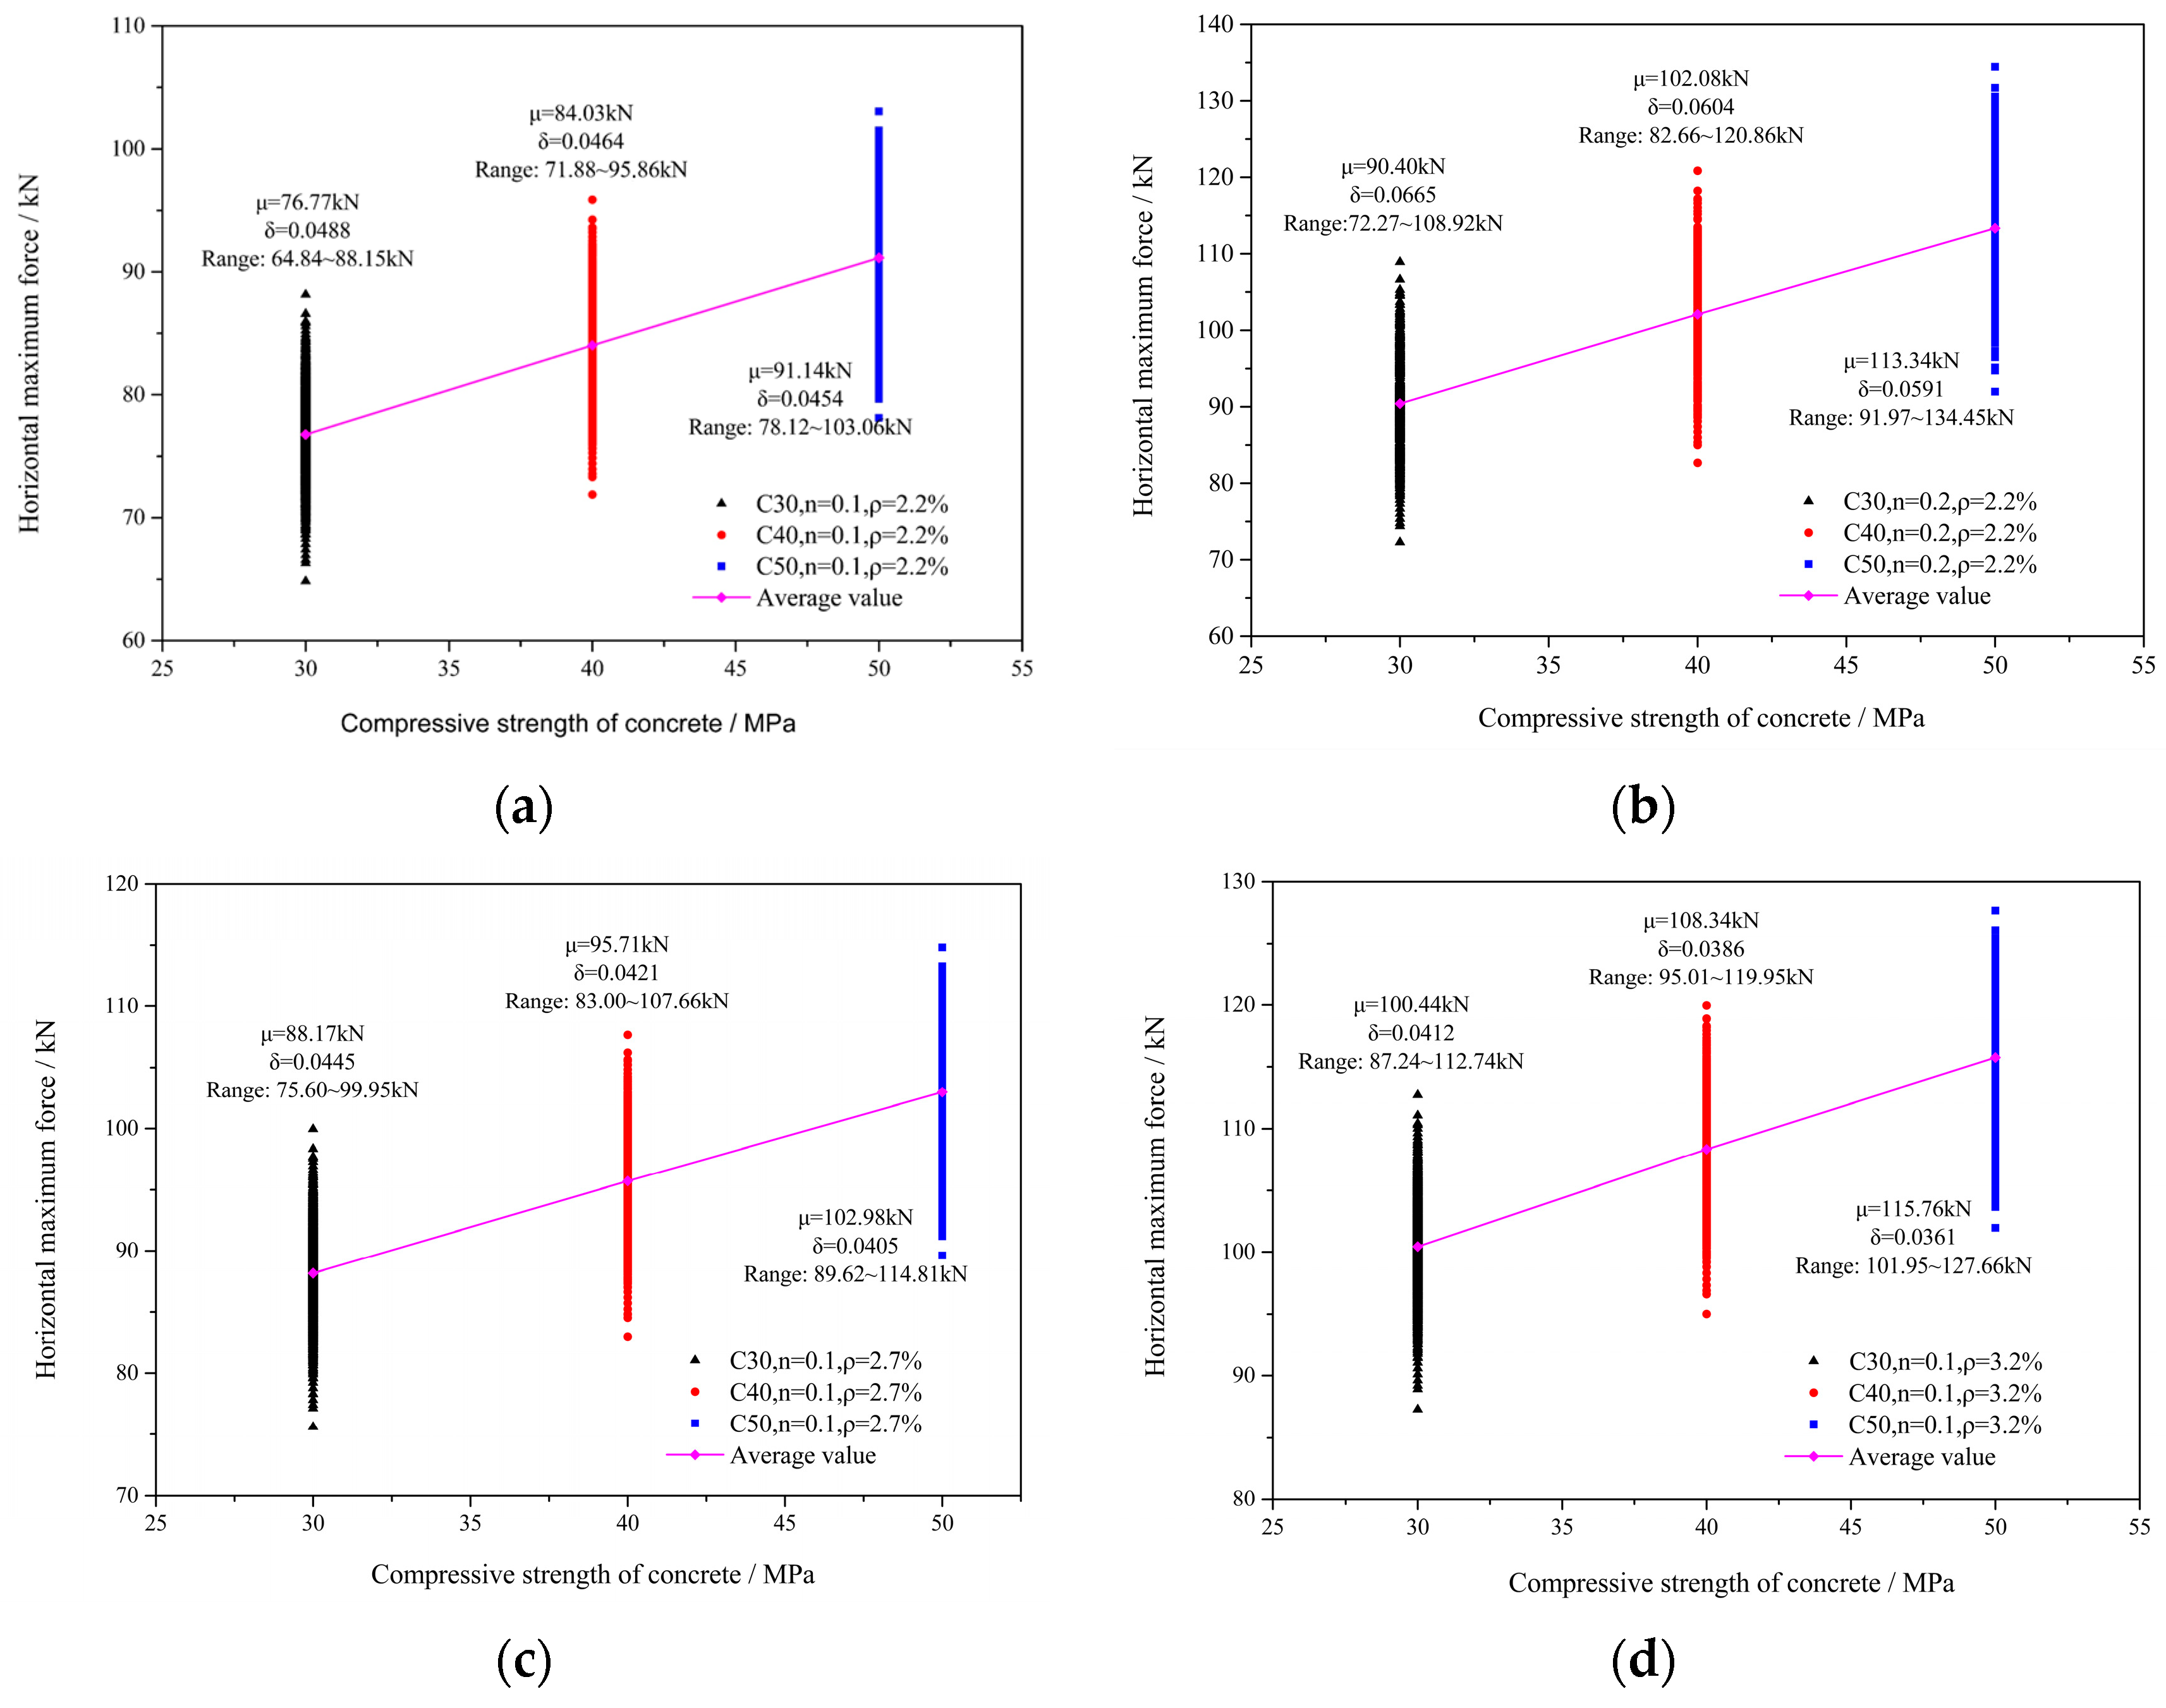
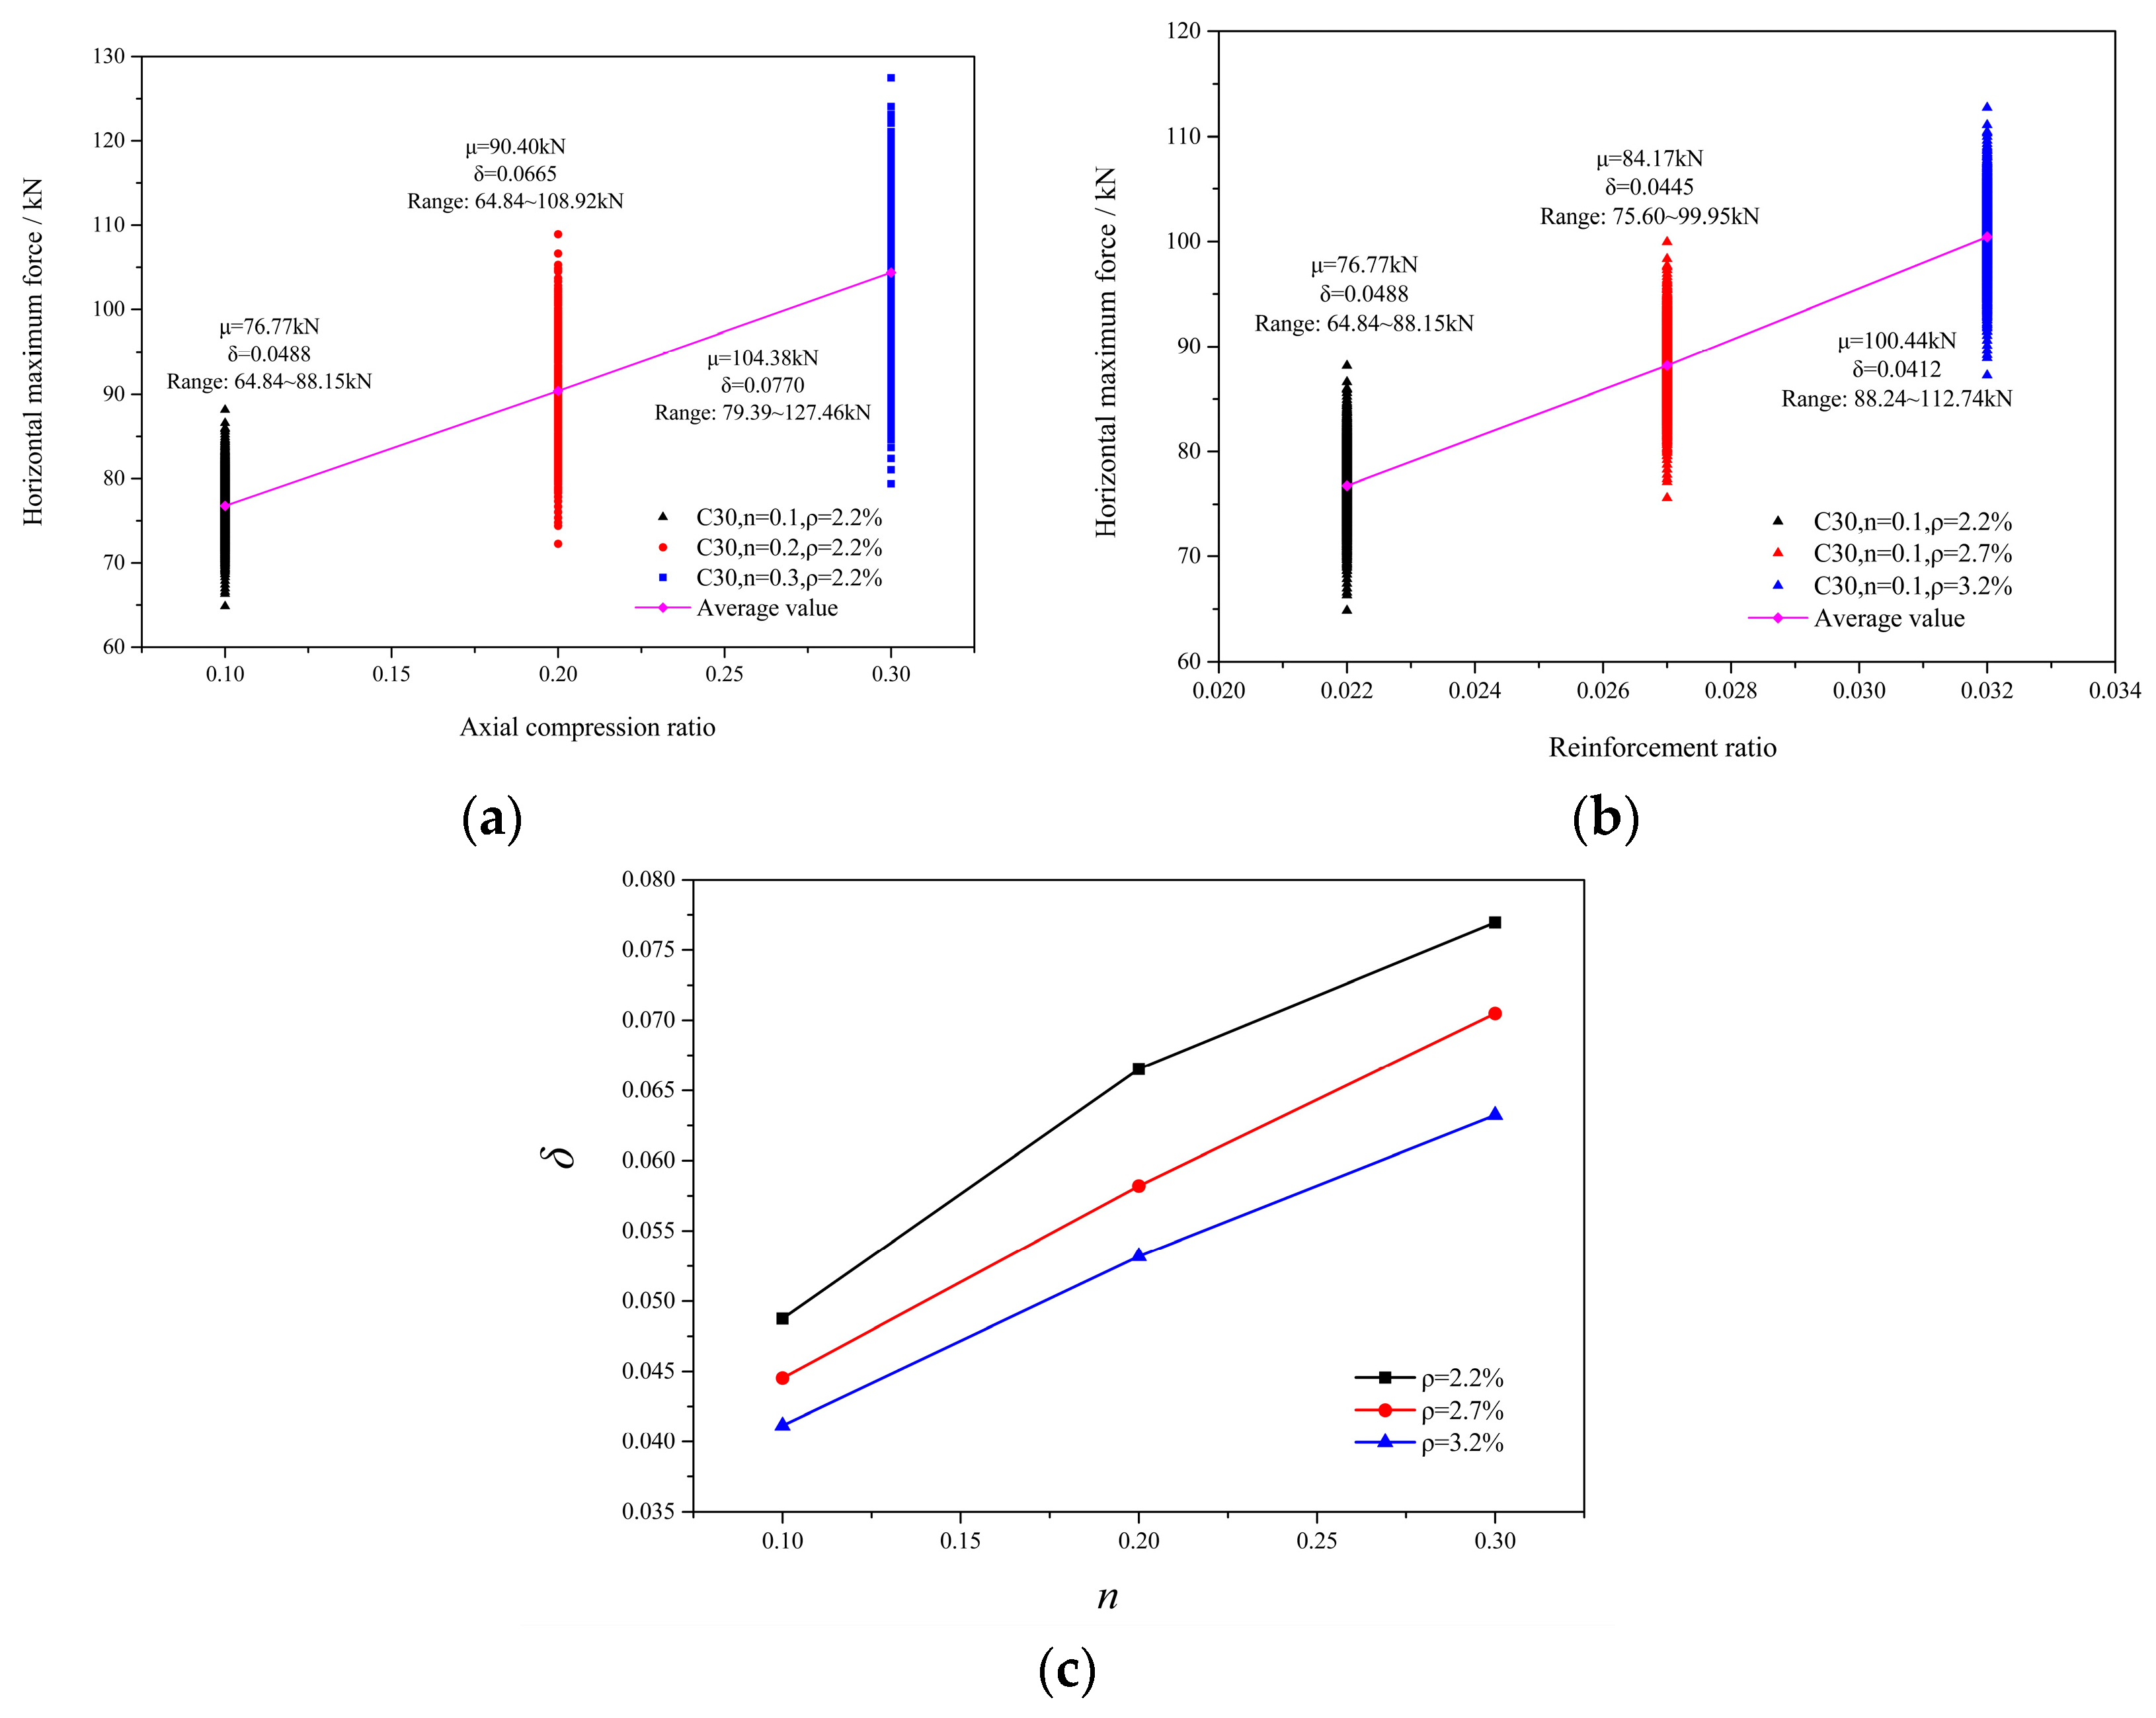
4.3.1. Variability Analysis of the Maximum Horizontal Force of FRP-C RC Columns

The variation law of the maximum horizontal force of FRP-C RC columns under the condition of different concrete strength grades is described in Figure 4, where μ is the average value of the maximum horizontal force and δ is the coefficient of variation of the maximum horizontal force.
Some interesting patterns can be seen in Figure 4. The average value of the maximum horizontal force is positively correlated with the influencing parameters (i.e., concrete strength grade, reinforcement ratio and axial compression ratio). However, the variation rule of the maximum force is different, and is positively correlated with the axial compression ratio and negatively correlated with the strength and reinforcement ratio of concrete. For example, as shown in Figure 4a, the average and variation coefficient of the maximum horizontal force of C30 concrete are 76.77 kN and 0.0488, respectively, while the average and variation coefficient of the maximum horizontal force of C50 concrete are 91.14 kN and 0.0454, respectively. As for the increase in concrete strength from C30 to C50, the average maximum horizontal force increased by 18.72% and the variation coefficient decreased by 6.97%.
To further clarify the above issues, Table 5 and Figure 5 show the average value and variation coefficient of the maximum horizontal force of FRP-C RC columns calculated with C30-series specimens.
When the axial compression ratio is 0.1, the reinforcement ratio is 2.2%, corresponding to a variation coefficient of the maximum horizontal force of 0.0488; when the reinforcement ratio is 3.2%, this corresponds to a variation coefficient of 0.0412. With the reinforcement ratio increases from 2.2% to 3.2%, the variation coefficient of the maximum horizontal force decreases by 15.57%.
When the reinforcement ratio is 2.2%, the axial compression ratio is 0.1, corresponding to a variation coefficient of the maximum horizontal force of 0.0488, and when the axial compression ratio is 0.3, this corresponds to a variation coefficient of 0.077. With the increase in the axial compression ratio from 0.1 to 0.3, the variation coefficient of the maximum horizontal force increases by 57.79%. This is mainly due to the fact that when the axial compression ratio is 0.1, the hysteretic curve calculated using the concrete hysteretic constitutive model is relatively full. With the increase in the axial compression ratio, the pinching effect of the hysteretic curve becomes increasingly obvious, and the difference between the loading section and the unloading section becomes increasingly large [61].

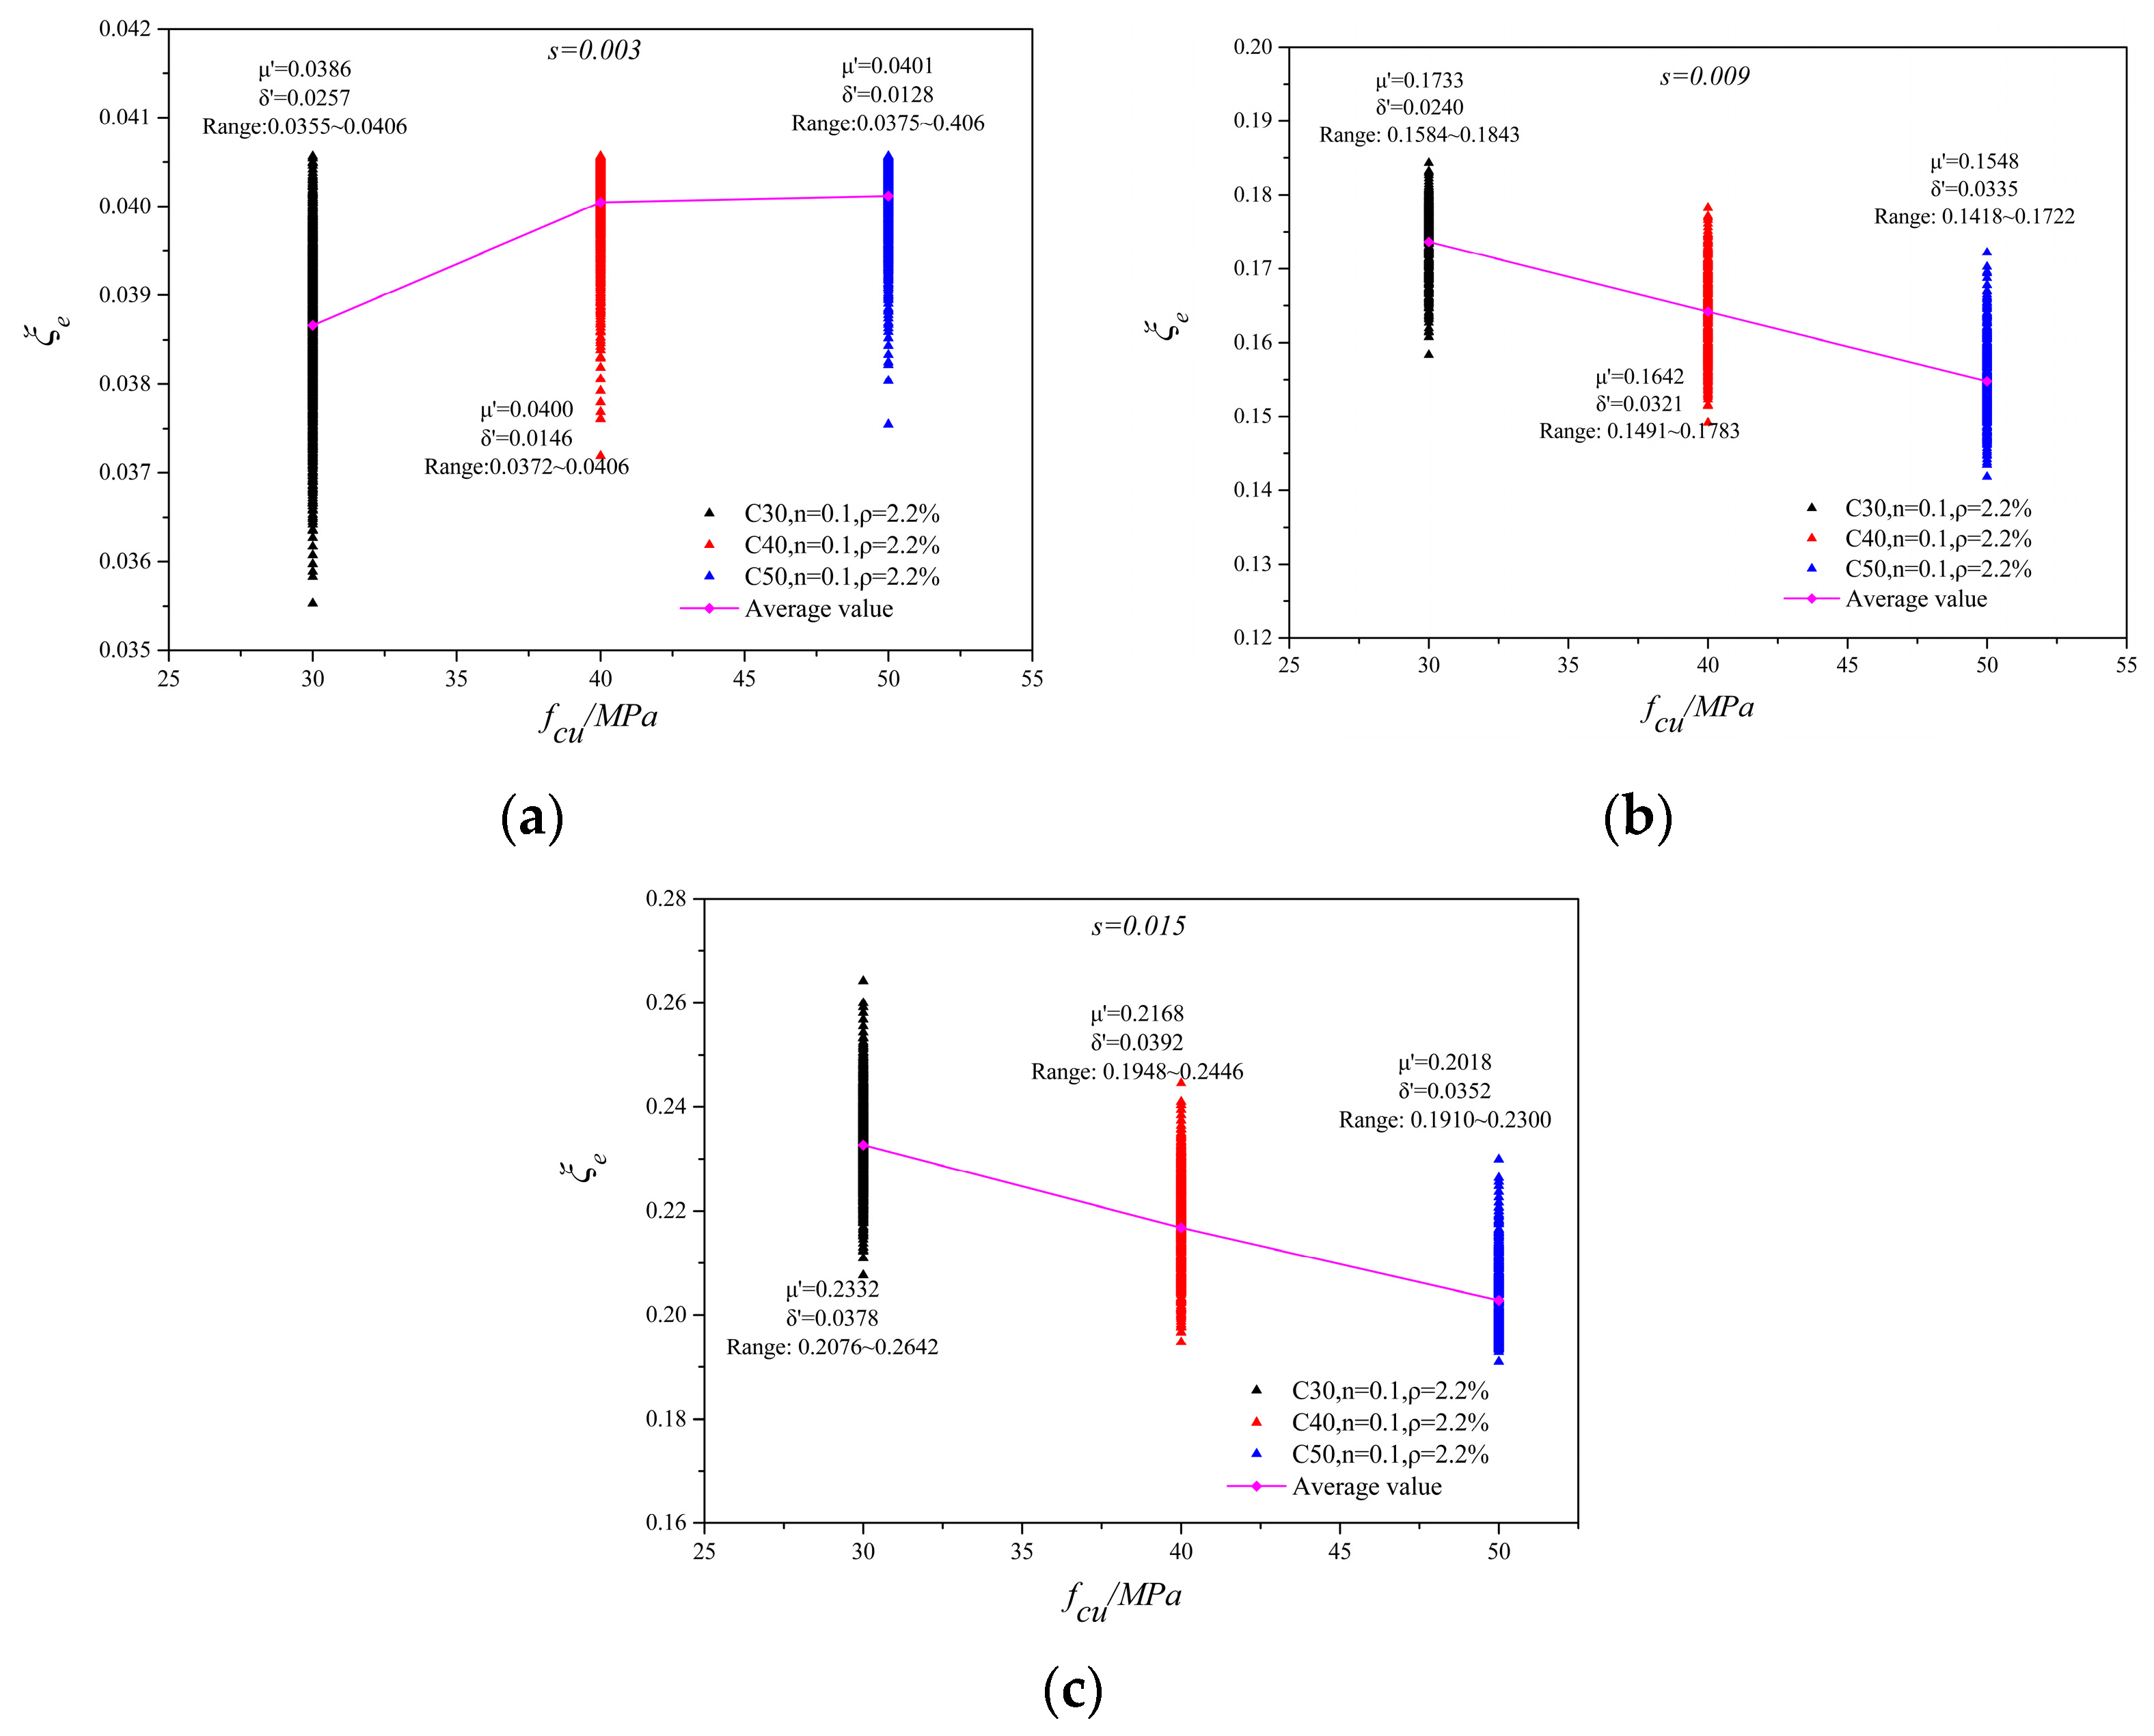
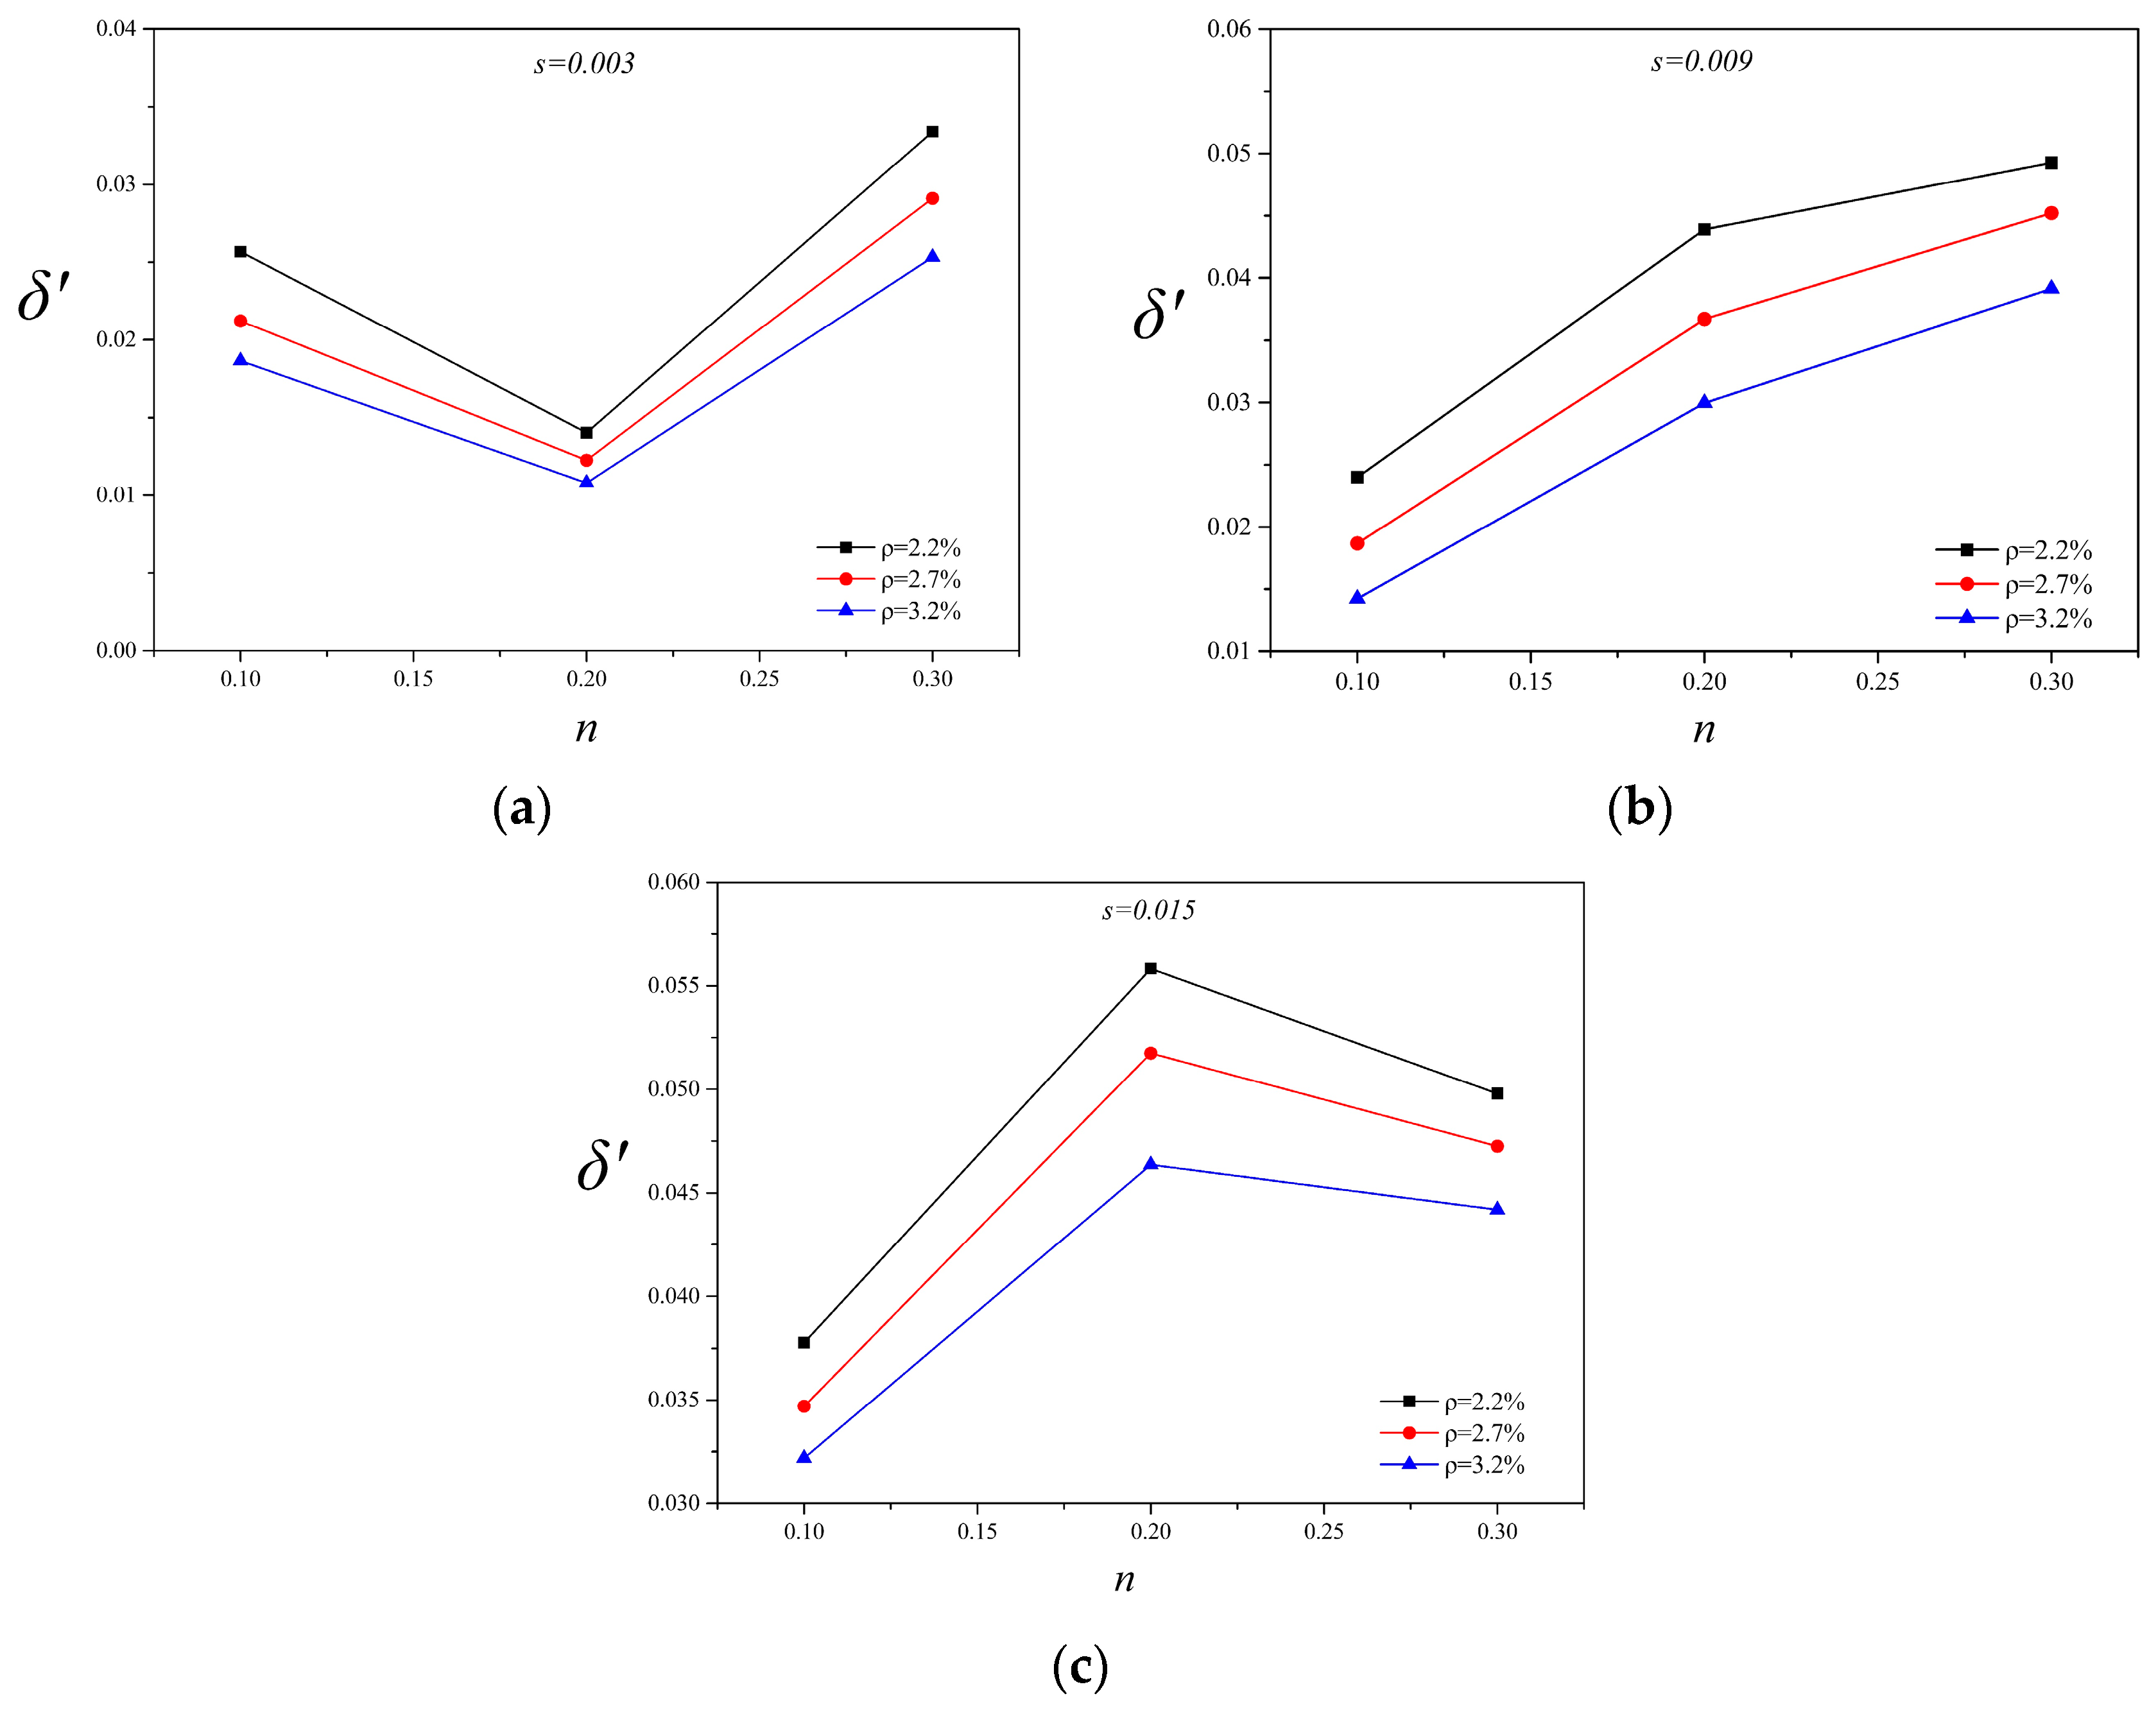
4.3.2. Variability Analysis of the Equivalent Viscous Damping Ratio of FRP-C RC Columns

Similar to the variability analysis of the maximum horizontal force for FRP-C RC columns, the variation law of the equivalent viscous damping ratio of FRP-C RC columns under the condition of different concrete strength grades is described in Figure 6, where μ′ is the average value of equivalent viscous damping ratio; δ′ is the variation coefficient of the equivalent viscous damping ratio; and s is the lateral displacement rate under cyclic behavior.
As shown from Figure 6, the axial compression ratio and reinforcement ratio are selected as fixed values, and under the condition of a low lateral displacement rate (i.e., s = 0.003), the average value of the equivalent viscous damping ratio is negatively correlated with the concrete strength grade, while the opposite is true under the conditions of a relatively large lateral displacement rate (i.e., s = 0.009 and s = 0.015). Moreover, under the condition of a low lateral displacement rate (i.e., s = 0.003), the variation coefficient of the equivalent viscous damping ratio is positively correlated with the concrete strength grade, and the opposite is true under the condition of a relatively large lateral displacement rate (i.e., s = 0.009); when the lateral displacement rate is 0.015, the variation coefficients (i.e., 0.0378, 0.0392 and 0.0352) are almost the same.
To further clarify the the positive and negative correlation between the variation coefficient of equivalent viscous damping and the other two parameters (i.e., the axial compression ratio and the reinforcement ratio), Figure 7 shows the average value and variation coefficient of the equivalent viscous damping ratio of FRP-C RC columns calculated with C30-series specimens.
As shown in Figure 7, the axial compression ratio was selected as a fixed value; regardless of whether the lateral displacement rate is small or large, the variation coefficient of the equivalent viscous damping ratio is always negatively correlated with the reinforcement ratio. For instance, as shown in Figure 7b, when the axial compression ratio is 0.1, the reinforcement ratios of 2.2% and 3.2% correspond to variation coefficients of 0.024 and 0.0142, respectively, which highlights that when the reinforcement ratio increases from 2.2% to 3.2%, the variation coefficient of the equivalent viscous damping ratio decreases by 40.83%.
When the reinforcement ratio is selected as a fixed value, regardless of whether the axial compression ratio is small or large, there is no significant positive or negative correlation between the variation coefficient of the equivalent viscous damping ratio and axial compression ratio.

5. Conclusions

Two types of research work have mainly been conducted in this paper. First, a new hysteretic constitutive model of FRP-confined concrete for the OpenSees software platform has been improved and verified. Second, based on the validity of the developed model and the quasi-Monte Carlo random sampling method, the hysteretic behavior of FRP-C RC sample columns was analyzed from the perspective of the strength variability of concrete. The following conclusions may be drawn from the present study:
  • Based on the Lam–Teng 2003 model, the mechanical tension properties and the stress drop section after the peak stress point of the compressive skeleton curve are considered in FRP-confined concrete materials. The proposed model has been verified by comparing with test data from the literature.
  • In this paper, the OpenSees secondary development function and the quasi-Monte Carlo random sampling method are first applied to study the influence of concrete material variations on the hysteretic behavior of FRP-C RC columns.
  • By analyzing the variability in hysteretic behavior of FRP-C RC columns, some interesting rules are found, which will be helpful in the optimization of seismic structure designs. For instance, the average value of the maximum horizontal force is positively correlated with the influencing parameters (i.e., the concrete strength grade, reinforcement ratio and axial compression ratio). However, the variation rule of the maximum force is different, and is positively correlated with the axial compression ratio and negatively correlated with the strength grade and reinforcement ratio of concrete. Additionally, for example, the variation coefficient of the equivalent damping ratio is almost constant with the increase in the lateral displacement rate of the specimen under cyclic loading.

Author Contributions

Methodology, W.N.; Software, K.L.; Validation, K.L.; Formal analysis, W.N.; Data curation, L.P.; Writing—original draft, K.G.; Writing—review & editing, Y.W. and L.P.; Project administration, Y.W. All authors have read and agreed to the published version of the manuscript.

Funding

This research received no external funding.

Data Availability Statement

Some or all data, models, or code that support the findings of this study are available from the corresponding author upon reasonable request.

Conflicts of Interest

The authors declare no conflict of interest.

References

  1. Poudel, P.; Belarbi, A.; Dawood, M.; Gencturk, B.; Acun, B. Prestressing bridge girders with carbon fiber-reinforced polymer: State of knowledge and research needs. Adv. Struct. Eng. 2018, 21, 598–612. [Google Scholar] [CrossRef]
  2. Xie, Q.; Sinaei, H.; Shariati, M.; Khorami, M.; Mohamad, E.T.; Bui, D.T. An experimental study on the effect of CFRP on behavior of reinforce concrete beam column connections. Steel Compos. Struct. 2019, 30, 433–441. [Google Scholar] [CrossRef]
  3. Liu, X.; Li, Y. Experimental study of seismic behavior of partially corrosion-damaged reinforced concrete columns strengthened with FRP composites with large deformability. Constr. Build. Mater. 2018, 191, 1071–1081. [Google Scholar] [CrossRef]
  4. Isleem, H.F.; Wang, D.Y.; Wang, Z.Y. Modeling the axial compressive stress-strain behavior of CFRP-confined rectangular RC columns under monotonic and cyclic loading. Compos. Struct. 2018, 185, 229–240. [Google Scholar] [CrossRef]
  5. Mugahed Amran, Y.H.; Alyousef, R.; Raizal, S.M.R.; Alabduljabbar, H.; Hung, C.C. Properties and applications of FRP in strengthening RC structures: A review. Structures 2018, 16, 208–238. [Google Scholar] [CrossRef]
  6. Tuhta, S. GFRP retrofitting effect on the dynamic characteristics of model steel structure. Steel Compos. Struct. 2018, 28, 223–231. [Google Scholar] [CrossRef]
  7. Abbassi, M.; Dabbagh, H. Seismic response of reactive powder concrete columns confined with FRP. Slovak J. Civi. Eng. 2019, 27, 12–20. [Google Scholar] [CrossRef]
  8. Pavlovic, A.; Donchev, T.; Petkova, D.; Limbachiya, M. Short- and Long-Term Prestress Losses in Basalt FRP Prestressed Concrete Beams under Sustained Loading. J. Compos. Constr. 2022, 26, 04022069. [Google Scholar] [CrossRef]
  9. Dong, Z.Q.; Wu, G.; Xu, Y.Q. Bond and flexural behavior of sea sand concrete members reinforced with hybrid steel-composite bars presubjected to wet-dry cycles. J. Compos. Constr. 2016, 19, 04016095. [Google Scholar] [CrossRef]
  10. Xian, G.J.; Guo, R.; Li, C.G. Combined effects of sustained bending loading, water immersion and fiber hybrid mode on the mechanical properties of carbon/glass fiber reinforced polymer composite. Compos. Struct. 2022, 281, 115060. [Google Scholar] [CrossRef]
  11. Wang, Z.K.; Zhao, X.L.; Xian, G.J.; Wu, G.; Raman, R.K.S.; Al-Saadi, S. Effect of sustained load and seawater and sea sand concrete environment on durability of basalt- and glass-fibre reinforced polymer (B/GFRP) bars. Corros. Sci. 2018, 138, 200–218. [Google Scholar] [CrossRef]
  12. Wu, J.Y.; Zhu, Y.Q.; Li, C.G. Experimental investigation of fatigue capacity of bending-anchored CFRP cables. Polymers 2023, 15, 2483. [Google Scholar] [CrossRef] [PubMed]
  13. Park, J.W.; Choi, S.M. Structural behavior of CFRP strengthened concrete-filled steel tubes columns under axial compression loads. Steel Compos. Struct. 2013, 14, 453–472. [Google Scholar] [CrossRef]
  14. Abbasnia, R.; Holakoo, A. An investigation of stress-strain behavior of FRP-confined concrete under cyclic compressive loading. Int. J. Civ. Eng. 2012, 10, 201–209. [Google Scholar]
  15. Lam, L.; Teng, J.G. Stress-strain model for FRP-confined concrete under cyclic axial compression. Eng. Struct. 2009, 31, 308–321. [Google Scholar] [CrossRef]
  16. Lin, G.; Teng, J.G. Advanced stress-strain model for FRP-confined concrete in square columns. Compos. B 2020, 197, 108149. [Google Scholar] [CrossRef]
  17. Berradia, M.; Kassoul, A. Ultimate strength and strain models proposed for CFRP confined concrete cylinders. Steel Compos. Struct. 2018, 29, 465–481. [Google Scholar] [CrossRef]
  18. Lam, L.; Teng, J.G. Design-oriented stress-strain model for FRP-confined concrete. Constr. Build. Mater. 2003, 17, 471–489. [Google Scholar] [CrossRef]
  19. Lam, L.; Teng, J.G. Strength models for fiber reinforced plastic confined concrete. J. Struct. Eng. 2002, 128, 612–623. [Google Scholar] [CrossRef]
  20. Lam, L.; Teng, J.G. Design-oriented stress-strain model for FRP-confined concrete in rectangular columns. J. Reinf. Plast. Compos. 2003, 22, 1149–1186. [Google Scholar] [CrossRef]
  21. Ozbakkaloglu, T.; Lim, J.C.; Vincent, T. FRP-confined concrete in circular sections: Review and assessment of stress-strain models. Eng. Struct. 2013, 49, 1068–1088. [Google Scholar] [CrossRef]
  22. Rousakis, T.C.; Karabinis, A.I. Adequately FRP confined reinforced concrete columns under axial compressive monotonic or cyclic loading. Mater. Struct. 2012, 45, 957–975. [Google Scholar] [CrossRef]
  23. Ishaqian, M.; Keramati, A. Performance of CFRP-confined pultruded GFRP-concrete composite columns subjected to cyclic and monotonic compressive loading. Sci. Iran. 2020, 27, 1685–1698. [Google Scholar] [CrossRef]
  24. Su, L.; Li, X.R.; Wang, Y.F. Experimental study and modelling of CFRP-confined damaged and undamaged square RC columns under cyclic loading. Steel Compos. Struct. 2016, 21, 411–427. [Google Scholar] [CrossRef]
  25. Abbasnia, R.; Hosseinpour, F.; Rostamian, M.; Ziaadiny, H. Cyclic and monotonic behavior of FRP confined concrete rectangular prisms with different aspect ratios. Constr. Build. Mater. 2013, 40, 118–125. [Google Scholar] [CrossRef]
  26. Abbasnia, R.; Ziaadiny, H. Behavior of concrete prisms confined with FRP composites under axial cyclic compression. Eng. Struct. 2010, 32, 648–655. [Google Scholar] [CrossRef]
  27. Sharbatar, M.K. Monotonic and cyclic loading of new FRP reinforced concrete cantilever beams. Int. J. Civ. Eng. 2008, 6, 58–71. [Google Scholar]
  28. Li, B.; Zohrevand, P.; Mirmiran, A. Cyclic behavior of FRP concrete bridge pier frames. J. Bridge. Eng. 2012, 18, 429–438. [Google Scholar] [CrossRef]
  29. Ozbakkaloglu, T.; Akin, E. Behavior of FRP-confined normal and high-strength concrete under cyclic axial compression. J. Compos. Constr. 2012, 16, 451–463. [Google Scholar] [CrossRef]
  30. Eshghi, S.; Zanjanizadeh, V. Repair of earthquake-damaged square R/C columns with glass fiber-reinforced polymer. Int. J. Civ. Eng. 2007, 5, 210–223. [Google Scholar]
  31. Li, S.; Chan, T.M.; Young, B. Cyclic compressive behavior and load-strain model of FRP-concrete double tube composite columns. Thin Wall Struct. 2023, 184, 110515. [Google Scholar] [CrossRef]
  32. Shao, Y.; Zhu, Z.; Mirmiran, A. Cyclic modeling of FRP-confined concrete with improved ductility. Cem. Concr. Compos. 2006, 28, 959–968. [Google Scholar] [CrossRef]
  33. Ziaadiny, H.; Abbasnia, R. Unified cyclic stress-strain model for FRP-confined concrete circular, square and rectangular prisms. Struct. Concr. 2016, 17, 220–234. [Google Scholar] [CrossRef]
  34. Demir, C.; Darilmaz, K.; Llki, A. Cyclic stress-strain relationships of FRP confined concrete members. Arab. J. Sci. Eng. 2015, 40, 363–379. [Google Scholar] [CrossRef]
  35. Li, P.; Wu, Y.F. Stress-strain model of FRP confined concrete under cyclic loading. Compos. Struct. 2015, 134, 60–71. [Google Scholar] [CrossRef]
  36. Li, P.; Wu, Y.F.; Zhou, Y.W.; Xing, F. Cyclic stress-strain model for FRP-confined concrete considering post-peak softening. Compos. Struct. 2018, 201, 902–915. [Google Scholar] [CrossRef]
  37. Bai, Y.L.; Dai, J.G.; Teng, J.G. Cyclic compressive behavior of concrete confined with large rupture strain FRP composites. J. Compos. Constr. 2014, 18, 04013025. [Google Scholar] [CrossRef]
  38. Lam, L.; Teng, J.G.; Cheung, C.H.; Xiao, Y. FRP-confined concrete under axial cyclic compression. Cem. Concr. Compos. 2006, 28, 949–958. [Google Scholar] [CrossRef]
  39. Liu, H.; He, M.H.; Luan, Y.Q.; Guo, J.; Liu, L.L. A modified constitutive model for FRP confined concrete in circular sections and its implementation with OpenSees programming. J. Zhejiang Univ. Sci. A 2013, 14, 856–866. [Google Scholar] [CrossRef]
  40. He, M.H.; Luan, Y.Q.; Liu, H.; Wang, Z.X. Development of FRP confined concrete constitutive models and analysis of pier/column behavior based on OpenSees. Bridge Constr. 2013, 43, 22–30. (In Chinese) [Google Scholar]
  41. De Stefano, M.; Tanganelli, M.; Viti, S. Variability in concrete mechanical properties as a source of in-plan irregularity for existing RC framed structures. Eng. Struct. 2014, 59, 161–172. [Google Scholar] [CrossRef]
  42. Stefano, M.D.; Tanganelli, M.; Viti, S. On the variability of concrete strength as a source of irregularity in elevation for existing RC buildings: A case study. Bull. Earthq. Eng. 2013, 11, 1711–1726. [Google Scholar] [CrossRef]
  43. Zelaschia, C.; Monteirob, R.; Pinho, R. Parametric characterization of RC bridges for seismic assessment purposes. Structures 2016, 7, 14–24. [Google Scholar] [CrossRef]
  44. Sengupta, S.; Ghosh, S. Influence of material variability on the seismic response of pile foundation. Civ. Environ. Res. 2012, 2, 12–18. [Google Scholar]
  45. Lu, X.; Wu, Z.Y.; Pei, L.; He, K.; Chen, J.K.; Li, Z.F.; Yang, Z. Effect of the spatial variability of strength parameters on the dynamic damage characteristics of gravity dams. Eng. Struct. 2019, 183, 281–289. [Google Scholar] [CrossRef]
  46. Kwon, O.; Elnashai, A. The effect of material and ground motion uncertainty on the seismic vulnerability curves of RC structure. Eng. Struct. 2006, 28, 289–303. [Google Scholar] [CrossRef]
  47. Karabinis, A.I.; Rousakis, T.C. Concrete confined by FRP material: A plasticity approach. Eng. Struct. 2002, 24, 923–932. [Google Scholar] [CrossRef]
  48. Mander, J.B.; Priestley, M.J.N.; Park, R. Theoretical stress-strain model for confined concrete. J. Struct. Eng. 1988, 114, 1804–1826. [Google Scholar] [CrossRef]
  49. Chen, X.W.; Lin, Z. OpenSees Principles and Examples of Structural Elastoplastic Analysis Program; China Building Industry Press: Beijing, China, 2014. [Google Scholar]
  50. Scott, B.D.; Park, R.; Priestley, M.J.N. Stress-strain behavior of concrete confined by overlapping hoops at low and high strain rates. ACI J. Proc. 1982, 79, 13–27. [Google Scholar] [CrossRef]
  51. Mohd-Yassin, M.H.; Filippou, F.C. Nonlinear analysis of prestressed concrete structures. In Structures Congress XII; ASCE: Reston, VA, USA, 1994. [Google Scholar]
  52. Wang, D.Y. Experimental and Analytical Inverstigation of Seismic Performance of Nonductile RC Frames Retrofitted with FRP. Ph.D. Dissertation, Harbin Institute of Technology, Harbin, China, 2012. (In Chinese). [Google Scholar]
  53. Li, Z.X.; Xu, C.X.; Jing, M.; Cai, W.D.; Hao, Y.C. Experimental research on seismic behavior of reinforced concrete short columns strengthened with carbon firber sheets. China J. Build. Struct. 2002, 23, 41–48. (In Chinese) [Google Scholar]
  54. Ye, L.P.; Zhang, K.; Zhao, S.H.; Feng, P. Experimental study on seismic strengthening of RC columns with wrapped CFRP sheets. Constr. Build. Struct. 2001, 17, 499–506. [Google Scholar] [CrossRef]
  55. Gu, D.S.; Wu, G.; Wu, Z.S.; Jiang, J.B.; Wei, Y. Experimental study on seismic performance of RC short circular columns strengthened with CFRP composites under high-level compression. Earthq. Resist. Engin. Retrofit. 2006, 28, 71–77. (In Chinese) [Google Scholar]
  56. Tang, X.L.; Cai, J.; Chen, Q.J.; Liu, X.P.; He, A. Seismic behaviour of through-beam connection between square CFST columns and RC beams. J. Constr. Steel. Res. 2016, 122, 151–166. [Google Scholar] [CrossRef]
  57. GB50010-2010; Code for Design of Concrete Structure. China Building Industry Press: Beijing, China, 2010.
  58. Metropolis, N.C.; Ulam, S.M. The Monte Carlo method. J. Am. Stat. Assoc. 1949, 44, 335–341. [Google Scholar] [CrossRef] [PubMed]
  59. Hastings, W.K. Monte Carlo sampling methods using Markov Chains and their applications. Biometrika 1970, 57, 97–109. [Google Scholar] [CrossRef]
  60. Zhu, P. The Studies and Applications of Quasi-Monte Carlo Methods. Ph.D. Dissertation, Zhejiang University, Hangzhou, China, 2010. (In Chinese). [Google Scholar]
  61. Weitao, N. Development and Variability Analysis of Hysteretic Constitutive Model of FRP-Confined Concrete Based on OpenSees; Beijing Jiaotong University: Beijing, China, 2018. [Google Scholar]
Figure 1. The flow chart of hysteresis criteria of the proposed model achieved in OpenSees.
Buildings 13 02396 g001
Figure 2. Comparison between proposed model predictions and test results. (a) Test data from Li et al., 2002 [53]. (b) Test data from Ye et al., 2001 [54]. (c) Test data from Wang 2012 [52]. (d) Test data from Gu et al., 2006 [55]. (e) Test data from Gu et al., 2006 [55].
Buildings 13 02396 g002
Figure 3. Statistical histogram and normal density curves of compressive strength of concrete. (a) C30, fcu,m = 38.98 MPa. (b) C40, fcu,m = 49.84 MPa. (c) C50, fcu,m = 61.05 MPa.
Buildings 13 02396 g003
Figure 4. The variation law of the maximum horizontal force of FRP-C RC columns under the condition of different concrete strength grades. (a) n = 0.1, ρ = 2.2%. (b) n = 0.2, ρ = 2.2%. (c) n = 0.1, ρ = 2.7%. (d) n = 0.1, ρ = 3.2%.
Buildings 13 02396 g004
Figure 5. The variation law of the maximum horizontal force of part of a C30 concrete specimen. (a) The maximum horizontal force (ρ = 2.2%, n = 0.1, 0.2 and 0.3). (b) The maximum horizontal force (n = 0.1, ρ = 2.2%, 2.7% and 3.2%). (c) The variation coefficients of the maximum horizontal force capacity.
Buildings 13 02396 g005
Figure 6. The variation law of the equivalent viscous damping ratio of FRP-C RC columns under the condition of different concrete strength grades. (a) The equivalent viscous damping ratio (s = 0.003). (b) The equivalent viscous damping ratio (s = 0.009). (c) The equivalent viscous damping ratio (s = 0.015).
Buildings 13 02396 g006
Figure 7. The variation law of the equivalent viscous damping ratio of C30-series FRP-C RC columns under the condition of different the axial compression ratios. (a) The equivalent viscous damping ratio (s = 0.003). (b) The equivalent viscous damping ratio (s = 0.009). (c) The equivalent viscous damping ratio (s = 0.015).
Buildings 13 02396 g007
Table 1. Geometric parameters of FRP-C RC column specimens.
SpecimenFRP TypeSectional TypeS-D/mmH/mmγ
CVH3 (Li et al., 2002 [53])CFRPSquare300 × 3004800.52
CF30-4-48 (Ye et al., 2001 [54])CFRPSquare200 × 2006000.48
C1H1C3N2 (Wang, 2012 [52])GFRPCylinder40012000.45
CL1 (Gu et al., 2006 [55])CFRPCylinder3606000.35
CL2 (Gu et al., 2006 [55])CFRPCylinder3606000.35
Note: S-D is the sectional dimension; H is the height of the specimen; γ represents the axial compressive ratio.
Table 2. Material parameters of FRP-C RC column specimens.
Specimenfc/MPafy/MPaΦ/mmfy,FRP/MPaεcu,FRPtFRP/mmnFRP
CVH3 (Li et al., 2002 [53])32.1359.642032000.01440.0861
CF30-4-48 (Ye et al., 2001 [54])343601635000.01490.1111
C1H1C3N2 (Wang, 2012 [52])343352043400.01780.1673
CL1 (Gu et al., 2006 [55])44.3382.42539500.01580.1671
CL2 (Gu et al., 2006 [55])44.3382.42539500.01580.1672.5
Note: fc is the concrete compression strength; fy is the yielding strength of the steel bars; Φ is the diameter of the steel bars; fy,FRP is the tensile strength of the FRP; εcu,FRP is the limit strain value of the FRP; tFRP is the thickness of the single-layer FRP; nFRP is the number of FRP layers.
Table 3. Comparison results of Fmax+ and Fmax− between test and simulation.
SpecimenFmax+/kNFmax−/kNError Mean
TestSimulationRe+TestSimulationRe−
CVH3 [53]451.45465.923.20%−485.19−463.834.40%3.8%
CF30-4-48 [54]97.34106.549.46%−98.98−100.451.48%5.47%
C1H1C3N2 [52]223.77221.640.95%−224.36−220.901.54%1.25%
CL1 [55]556.68564.971.49%−597.14−563.395.65%3.57%
CL2 [55]618.35654.265.81%−649.09−645.380.57%3.19%
Note: Fmax+ and Fmax− are, respectively, the positive and reverse maximum horizontal bearing force; Re+ and Re− are, respectively, the positive and reverse relative error.
Table 4. Basic information of fully FRP-wrapped RC cylinders.
Specimenfcu,m/MPafy/MPaΦ/mmρ/%H/mmD/mmnfy,FRP/MPaεcu,FRPtFRP/mmnFRP
C30-series38.98360182.2/2.7/3.210003000.1/0.2/0.335000.01490.1113
C40-series49.84360182.2/2.7/3.210003000.1/0.2/0.335000.01490.1113
C50-series61.05360182.2/2.7/3.210003000.1/0.2/0.335000.01490.1113
Note: the physical meanings of all parameters are shown in Table 1 and Table 2; ρ is the reinforcement ratio of longitudinal bars; n is the axial compression ratio.
Table 5. The average values and variation coefficients of the maximum horizontal force calculated for C30-series specimens.
ρAverage Values (kN)Variation Coefficient
n 2.2%2.7%3.2%2.2%2.7%3.2%
0.176.7788.17100.440.04880.04450.0412
0.290.40101.30113.240.06650.05820.0532
0.3104.38114.40125.550.07700.07050.0632
Disclaimer/Publisher’s Note: The statements, opinions and data contained in all publications are solely those of the individual author(s) and contributor(s) and not of MDPI and/or the editor(s). MDPI and/or the editor(s) disclaim responsibility for any injury to people or property resulting from any ideas, methods, instructions or products referred to in the content.

