
Effect of Train Vibrations on the Dynamic Response of a Multi-Span Double-Curved Brick Arch Thin-Shell Factory of Changleyuan

 ,
,
Abstract
:1. Introduction
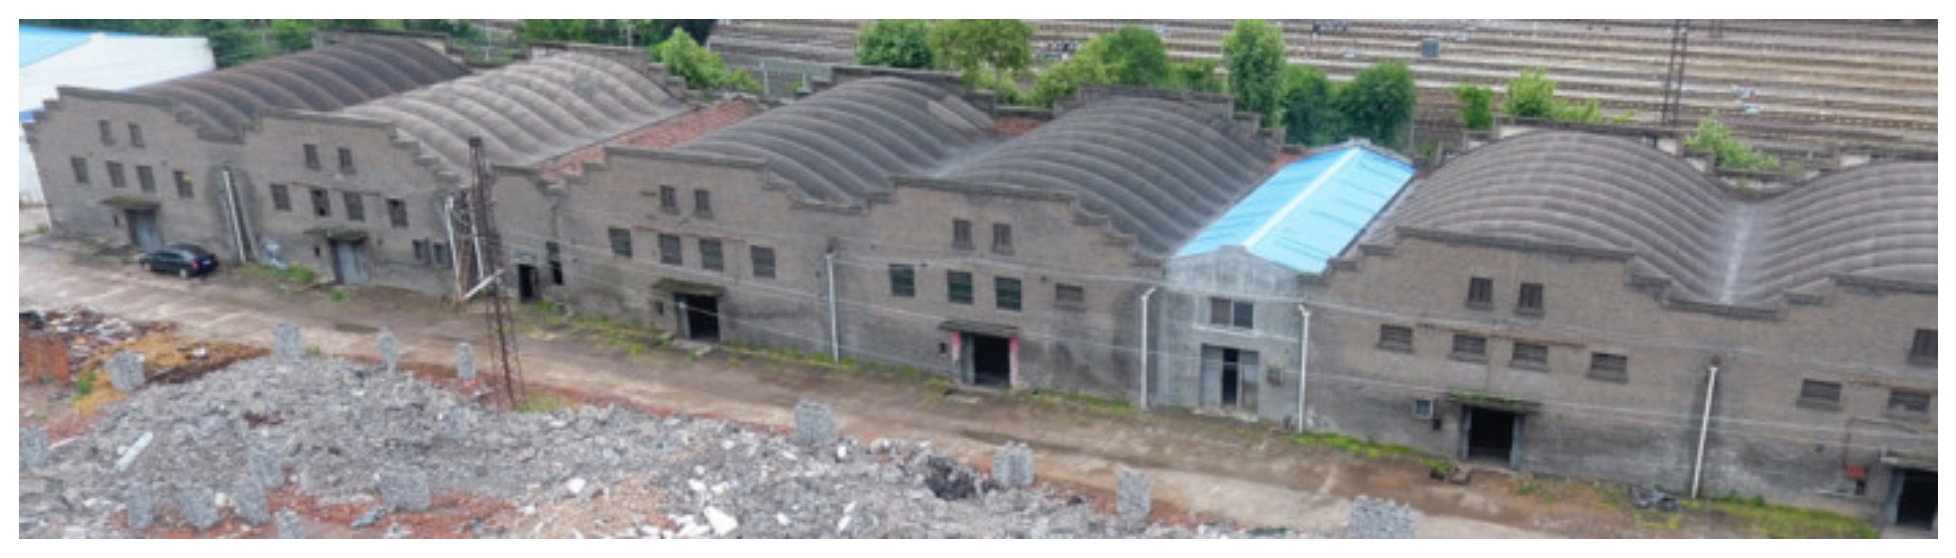
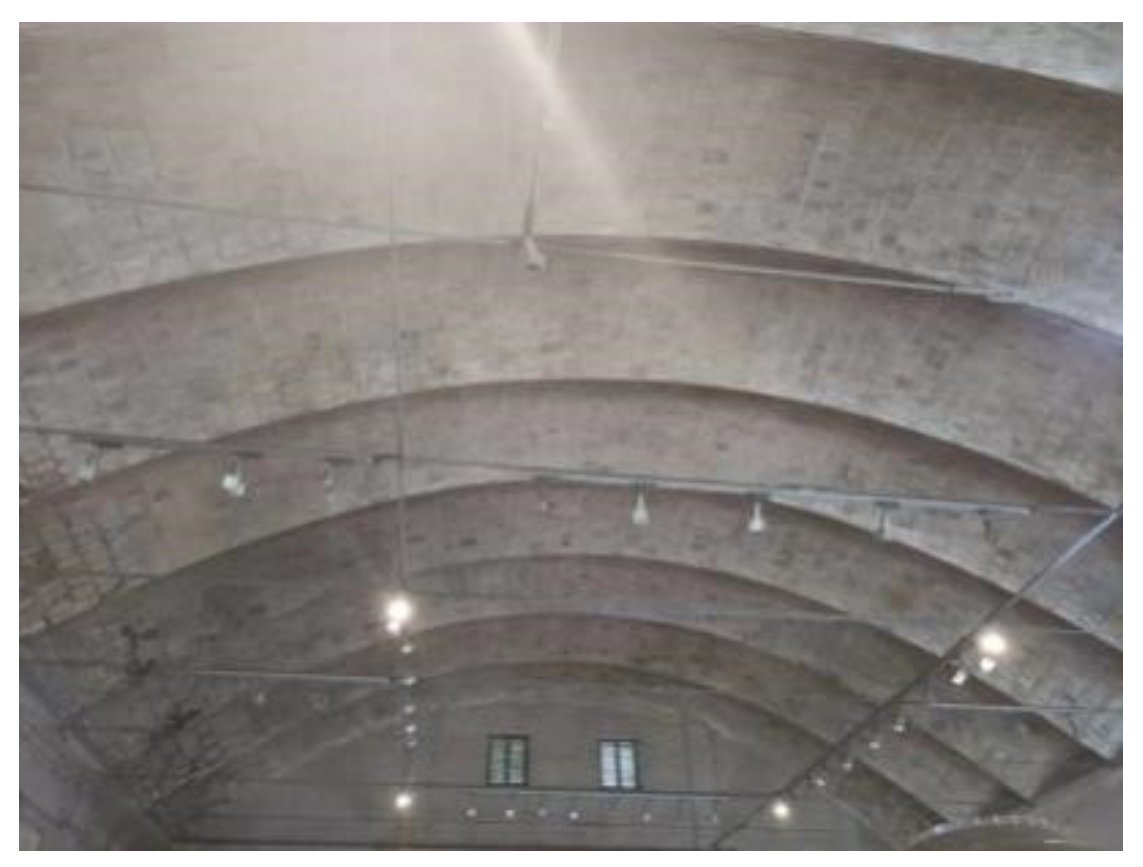
2. Project Overview
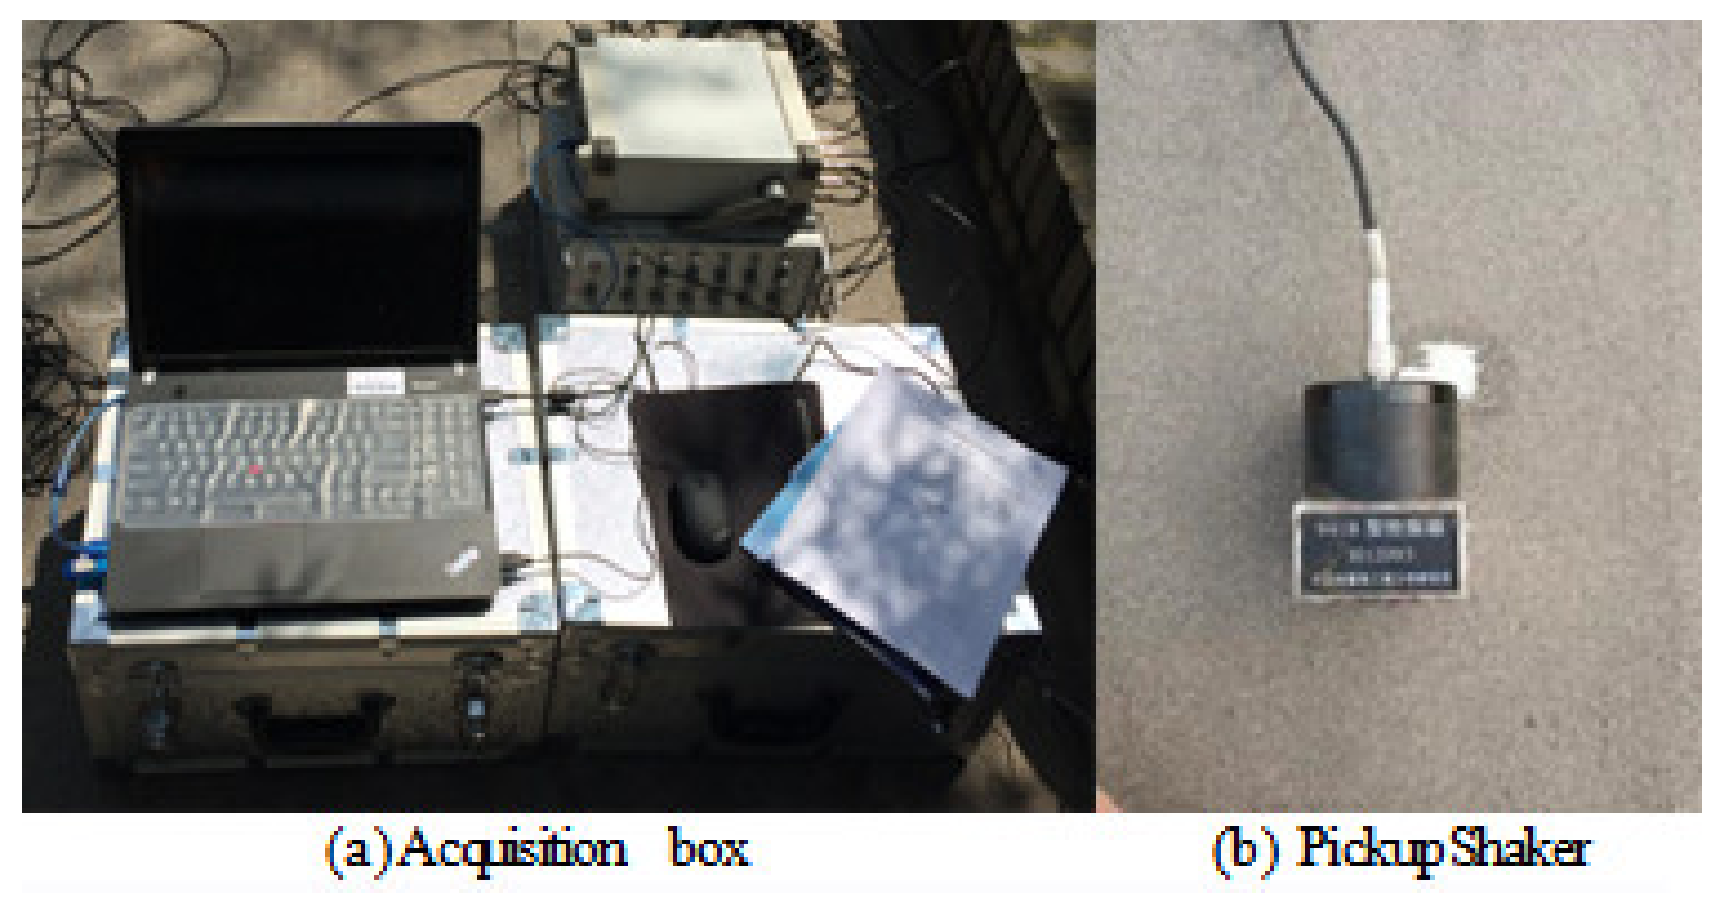
3. Field Dynamic Test
4. Test Results and Analysis
4.1. Results Pre-Processing
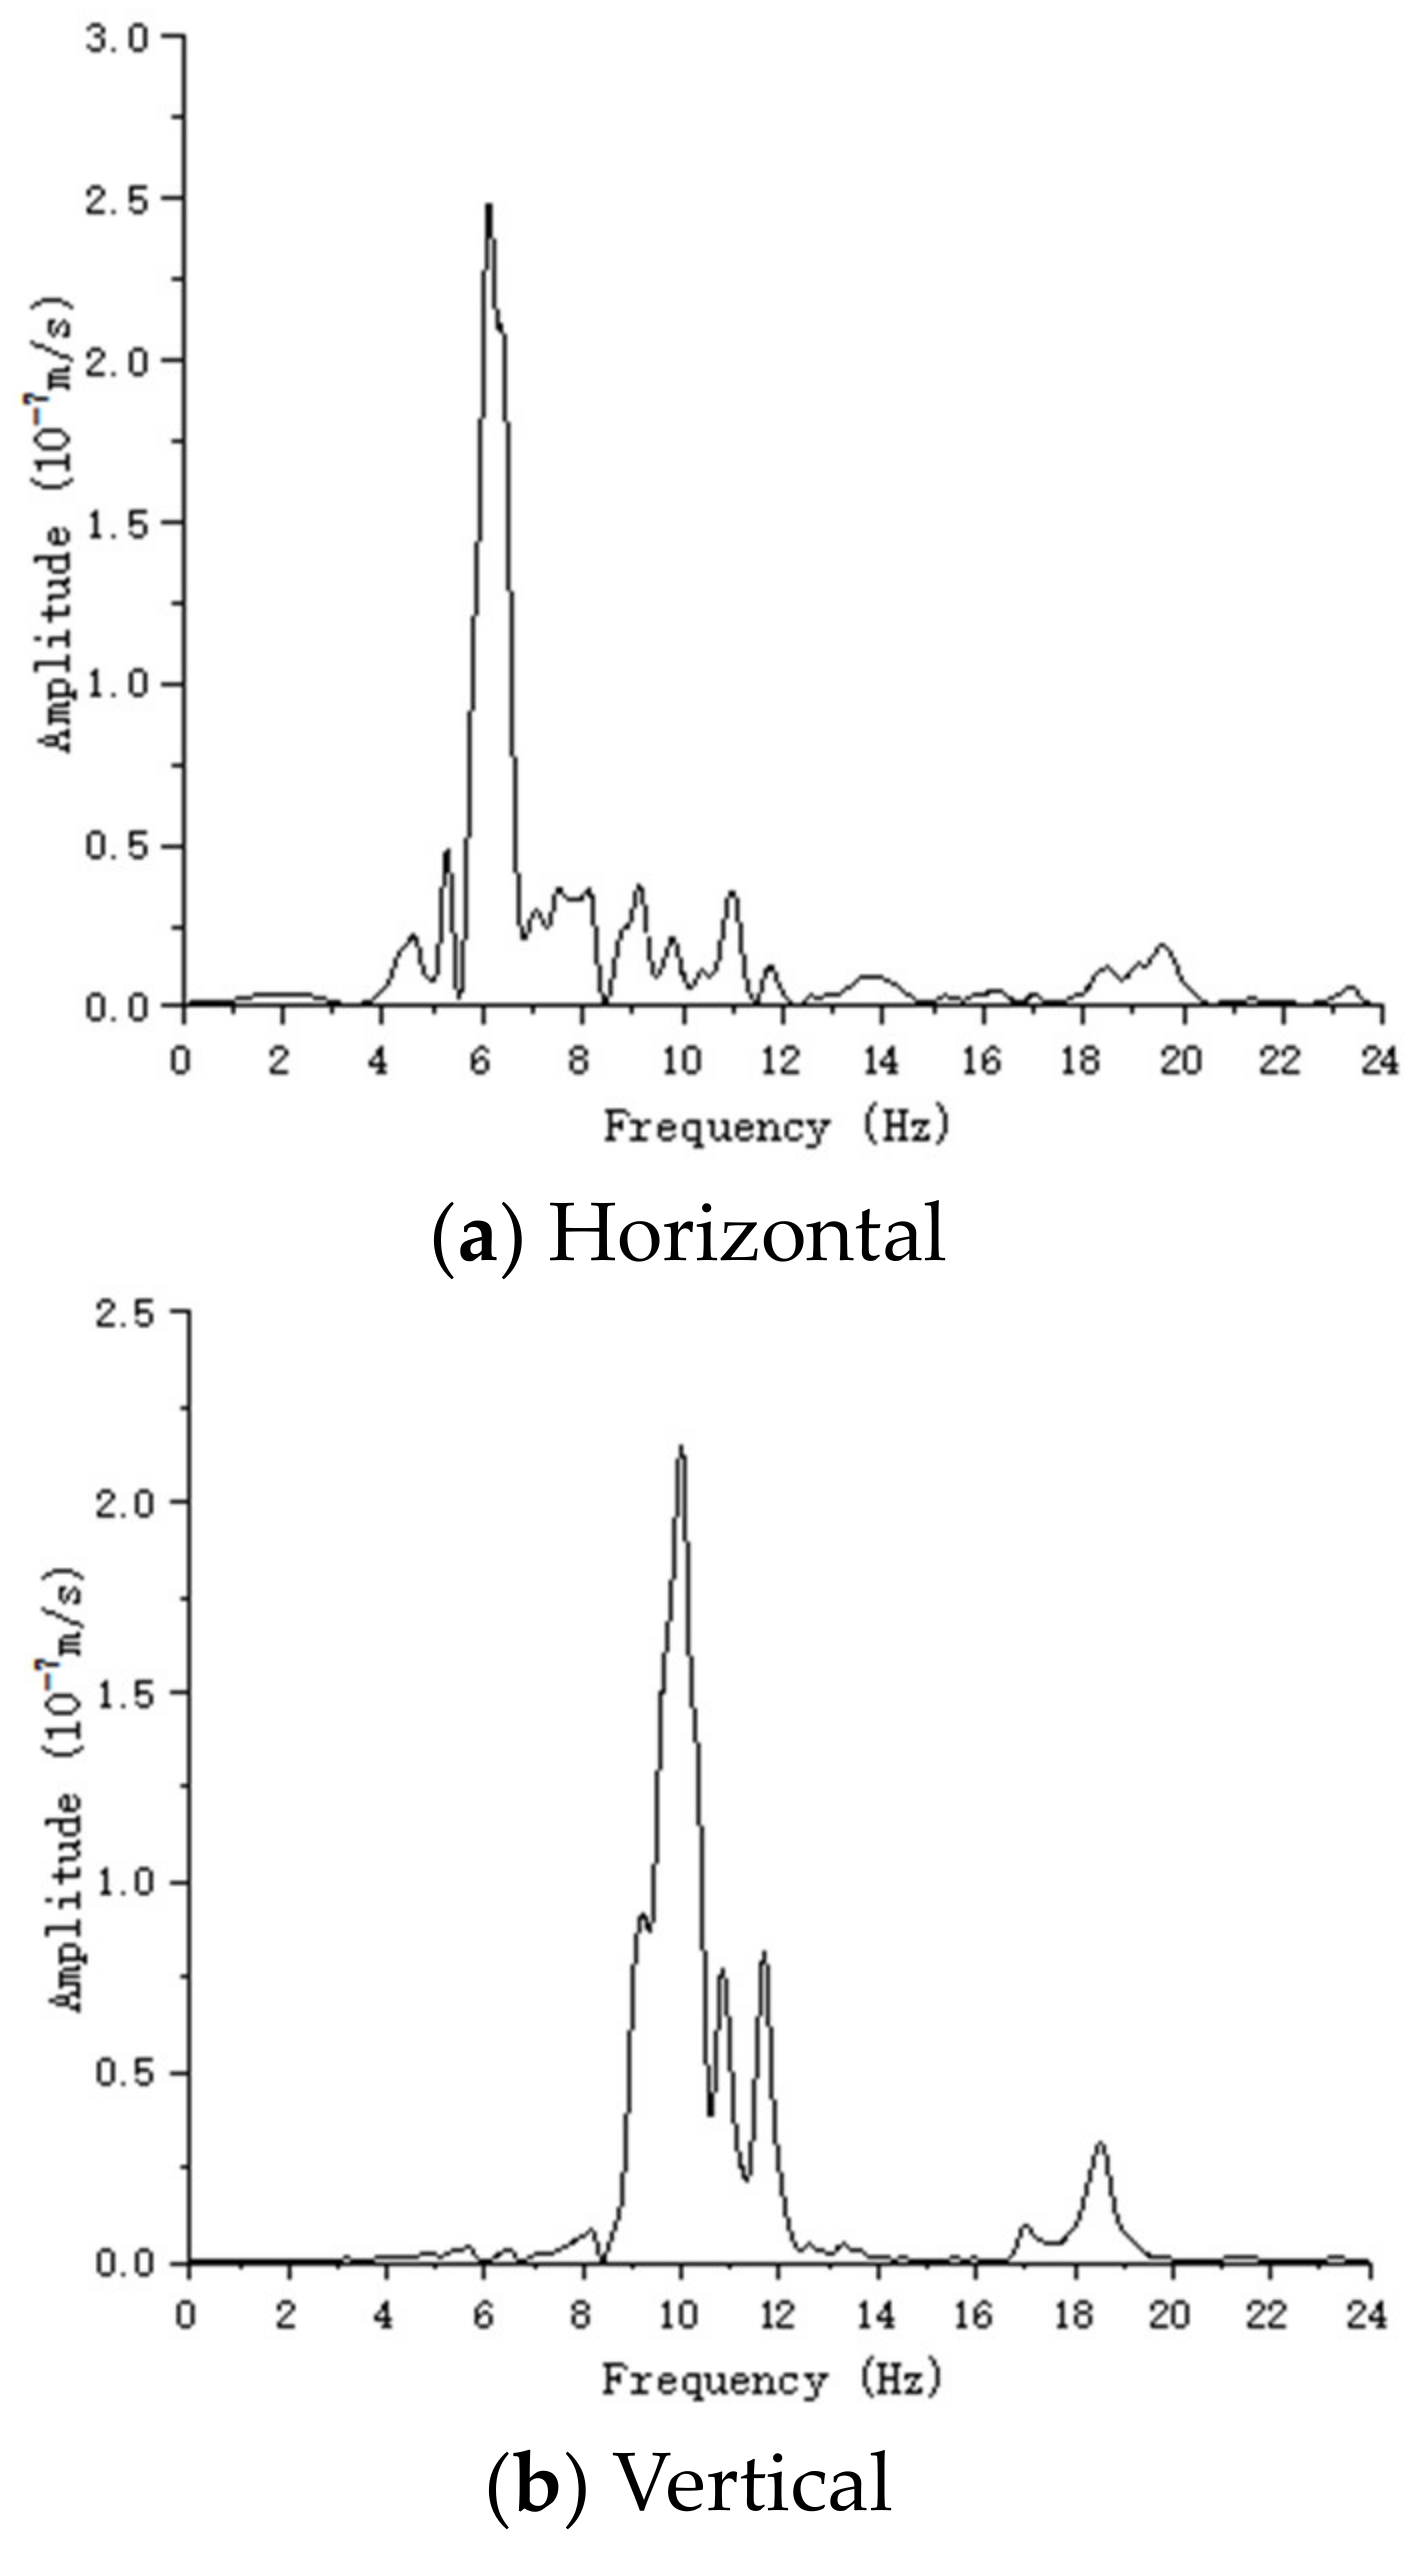
4.2. Dynamic Characteristic Analysis of the Thin-Shell Factory under the Action of Ground Pulsation
4.3. Dynamic Response Analysis of the Thin-Shell Factory under Train Vibration Load
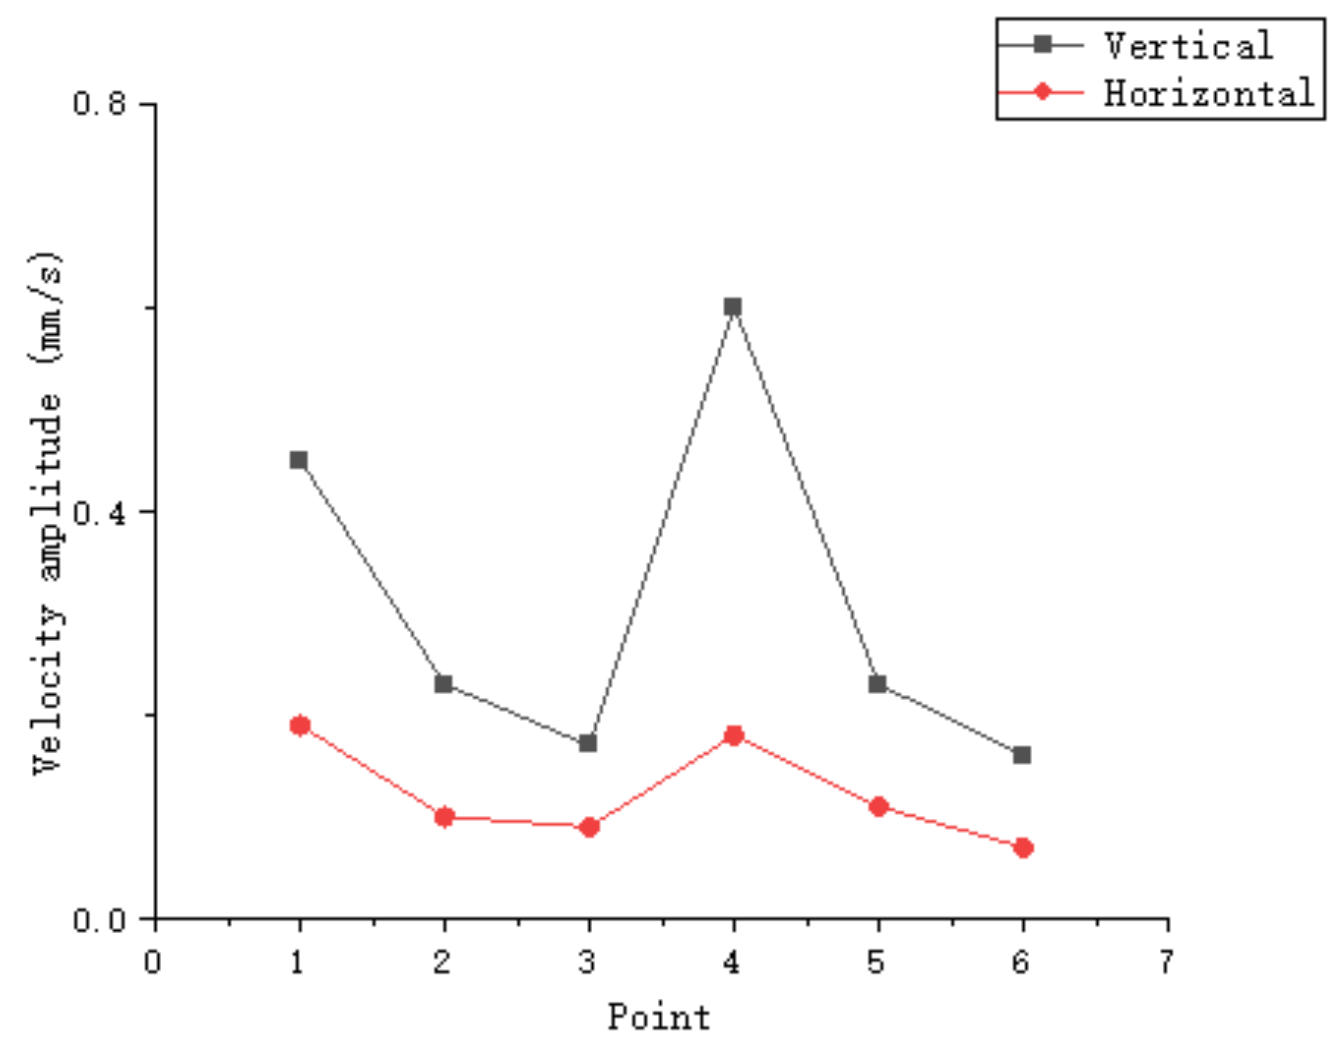
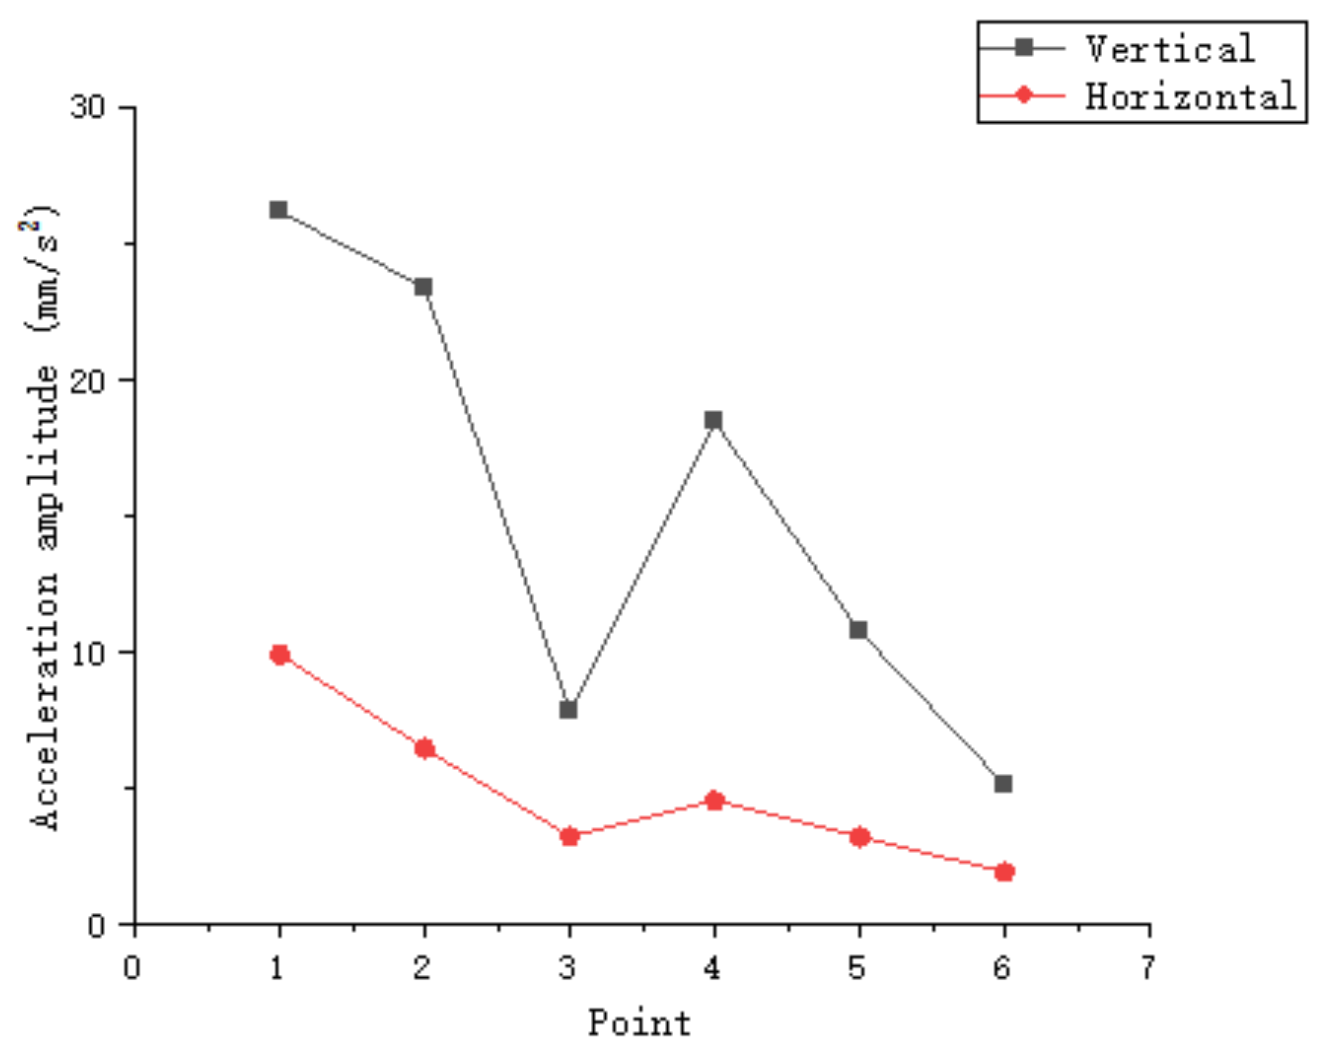
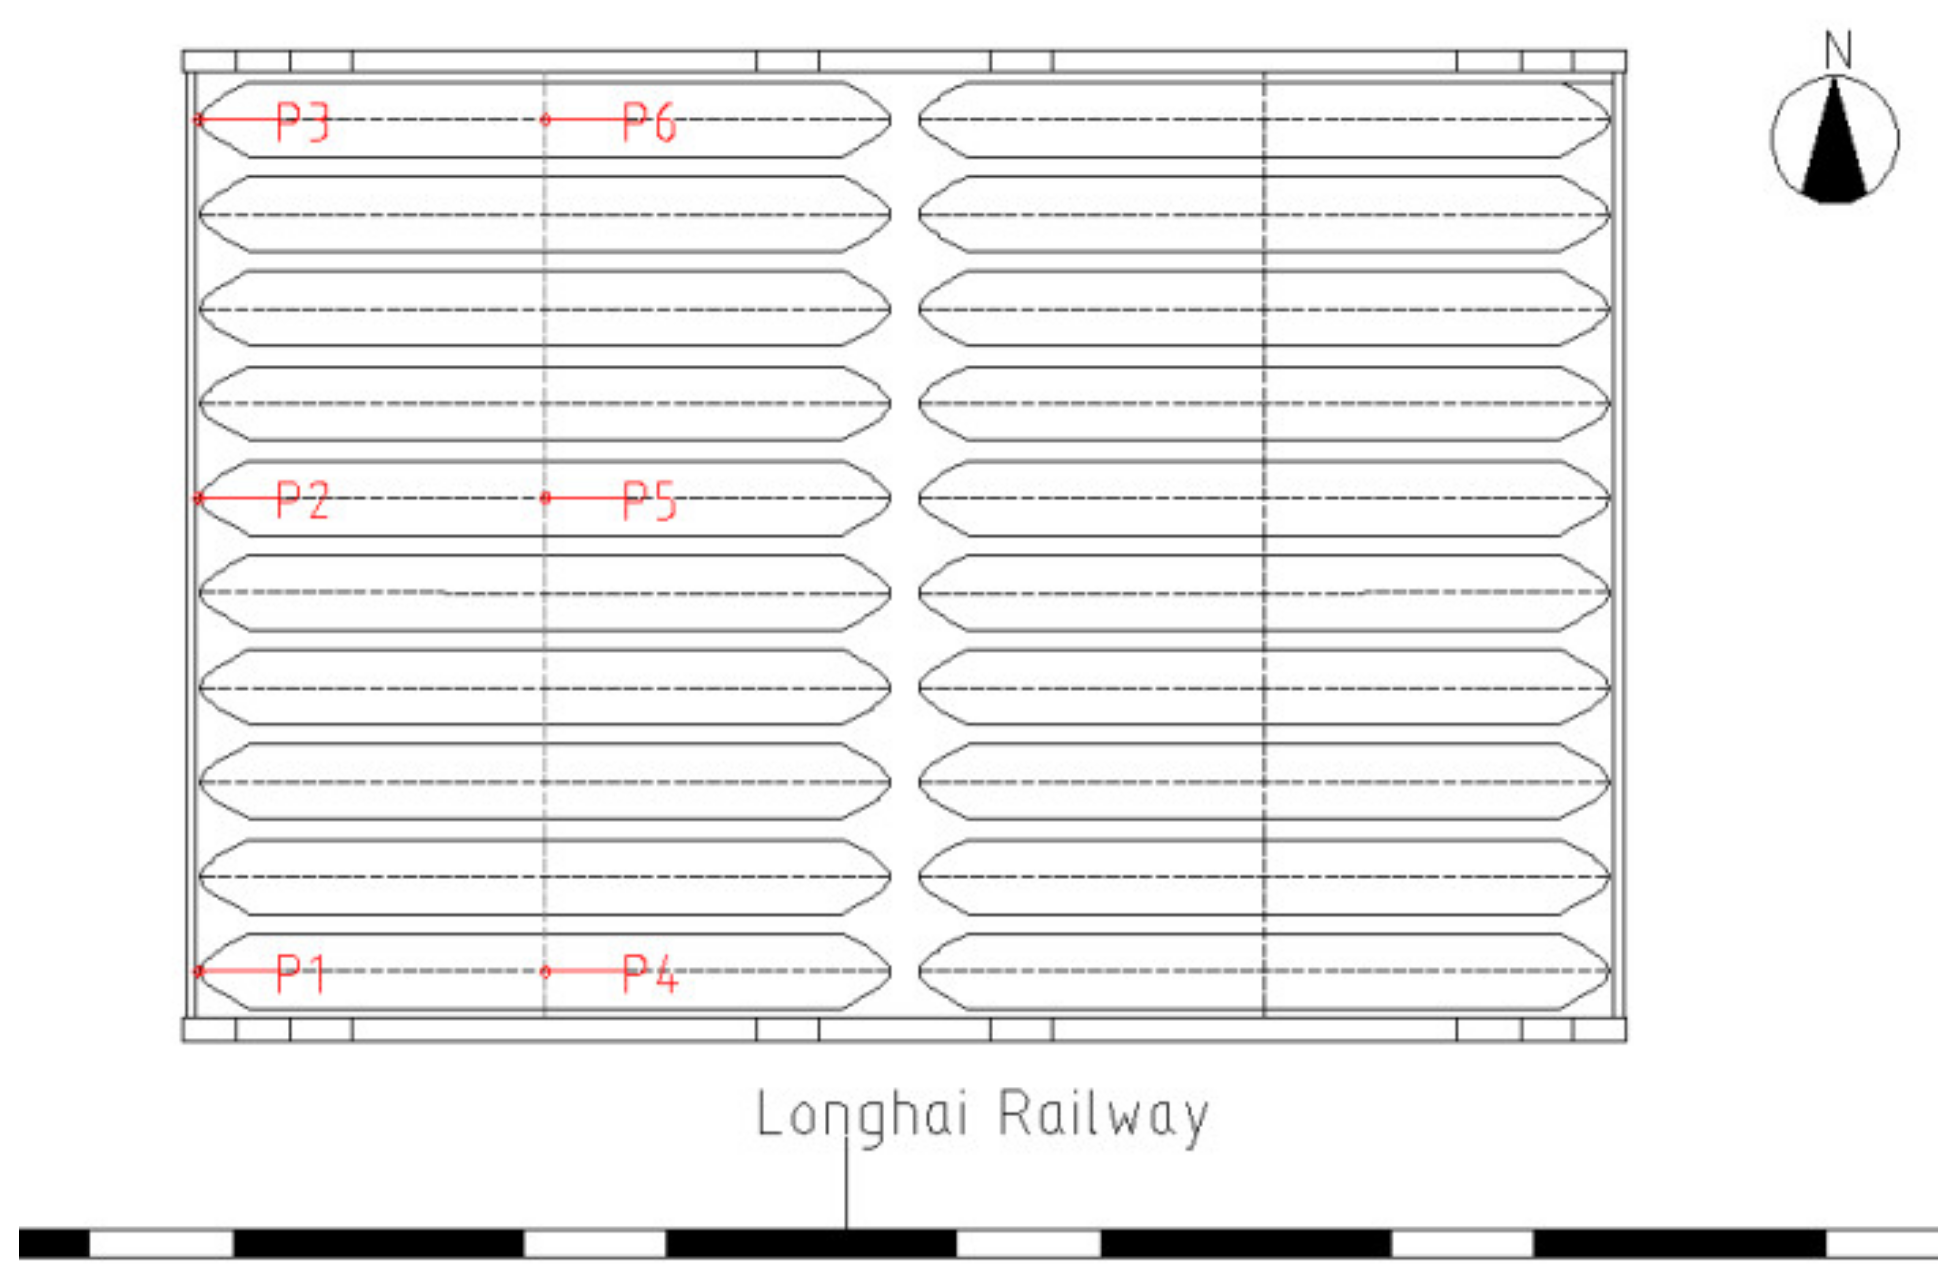
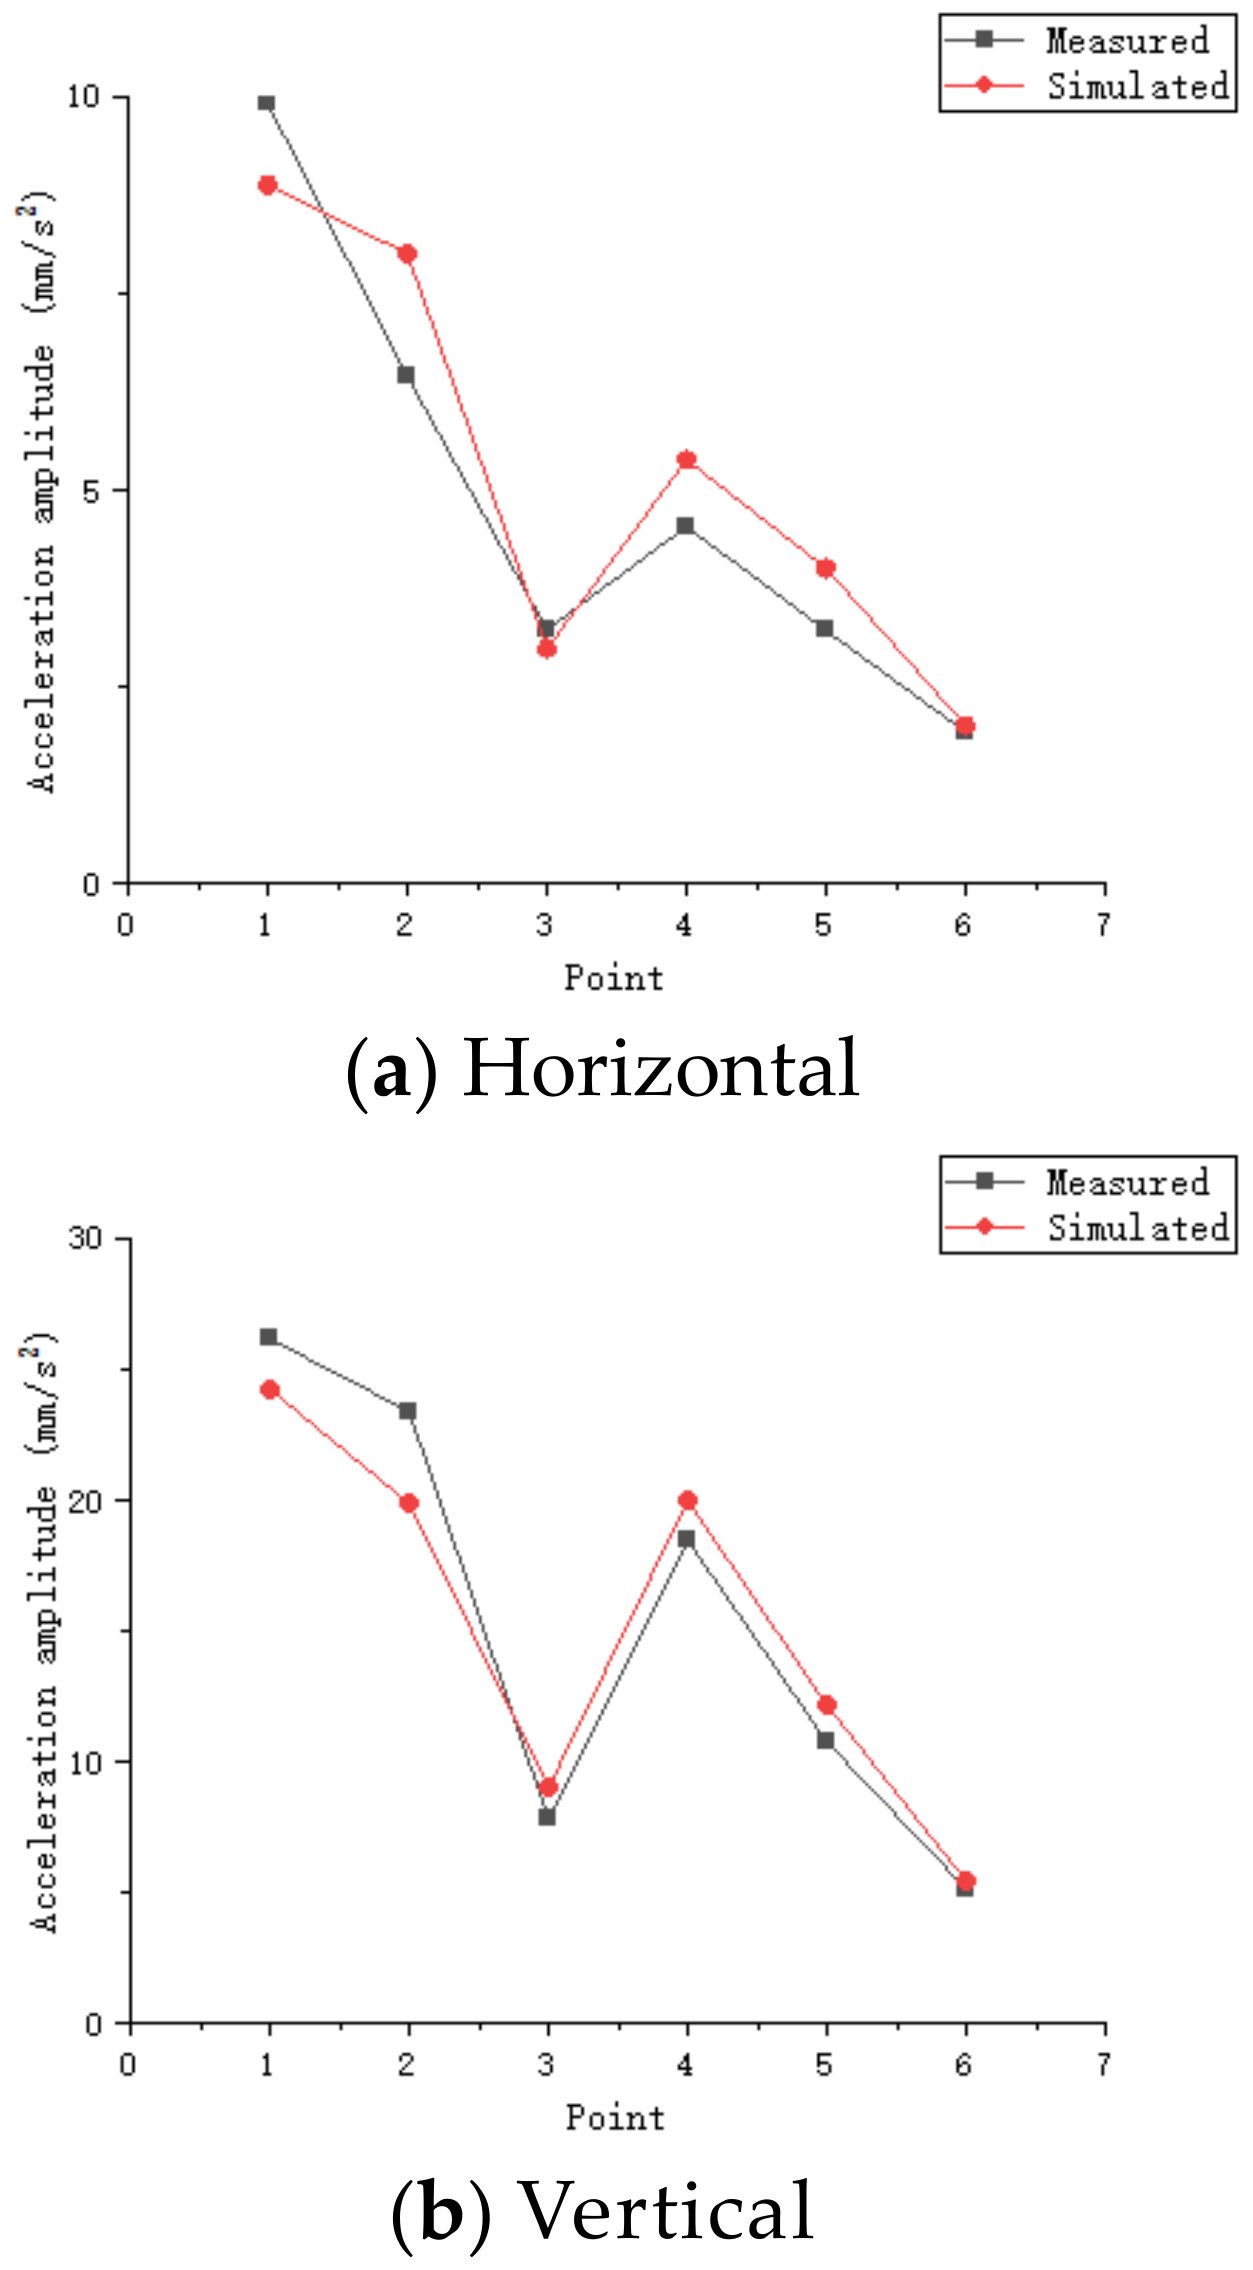
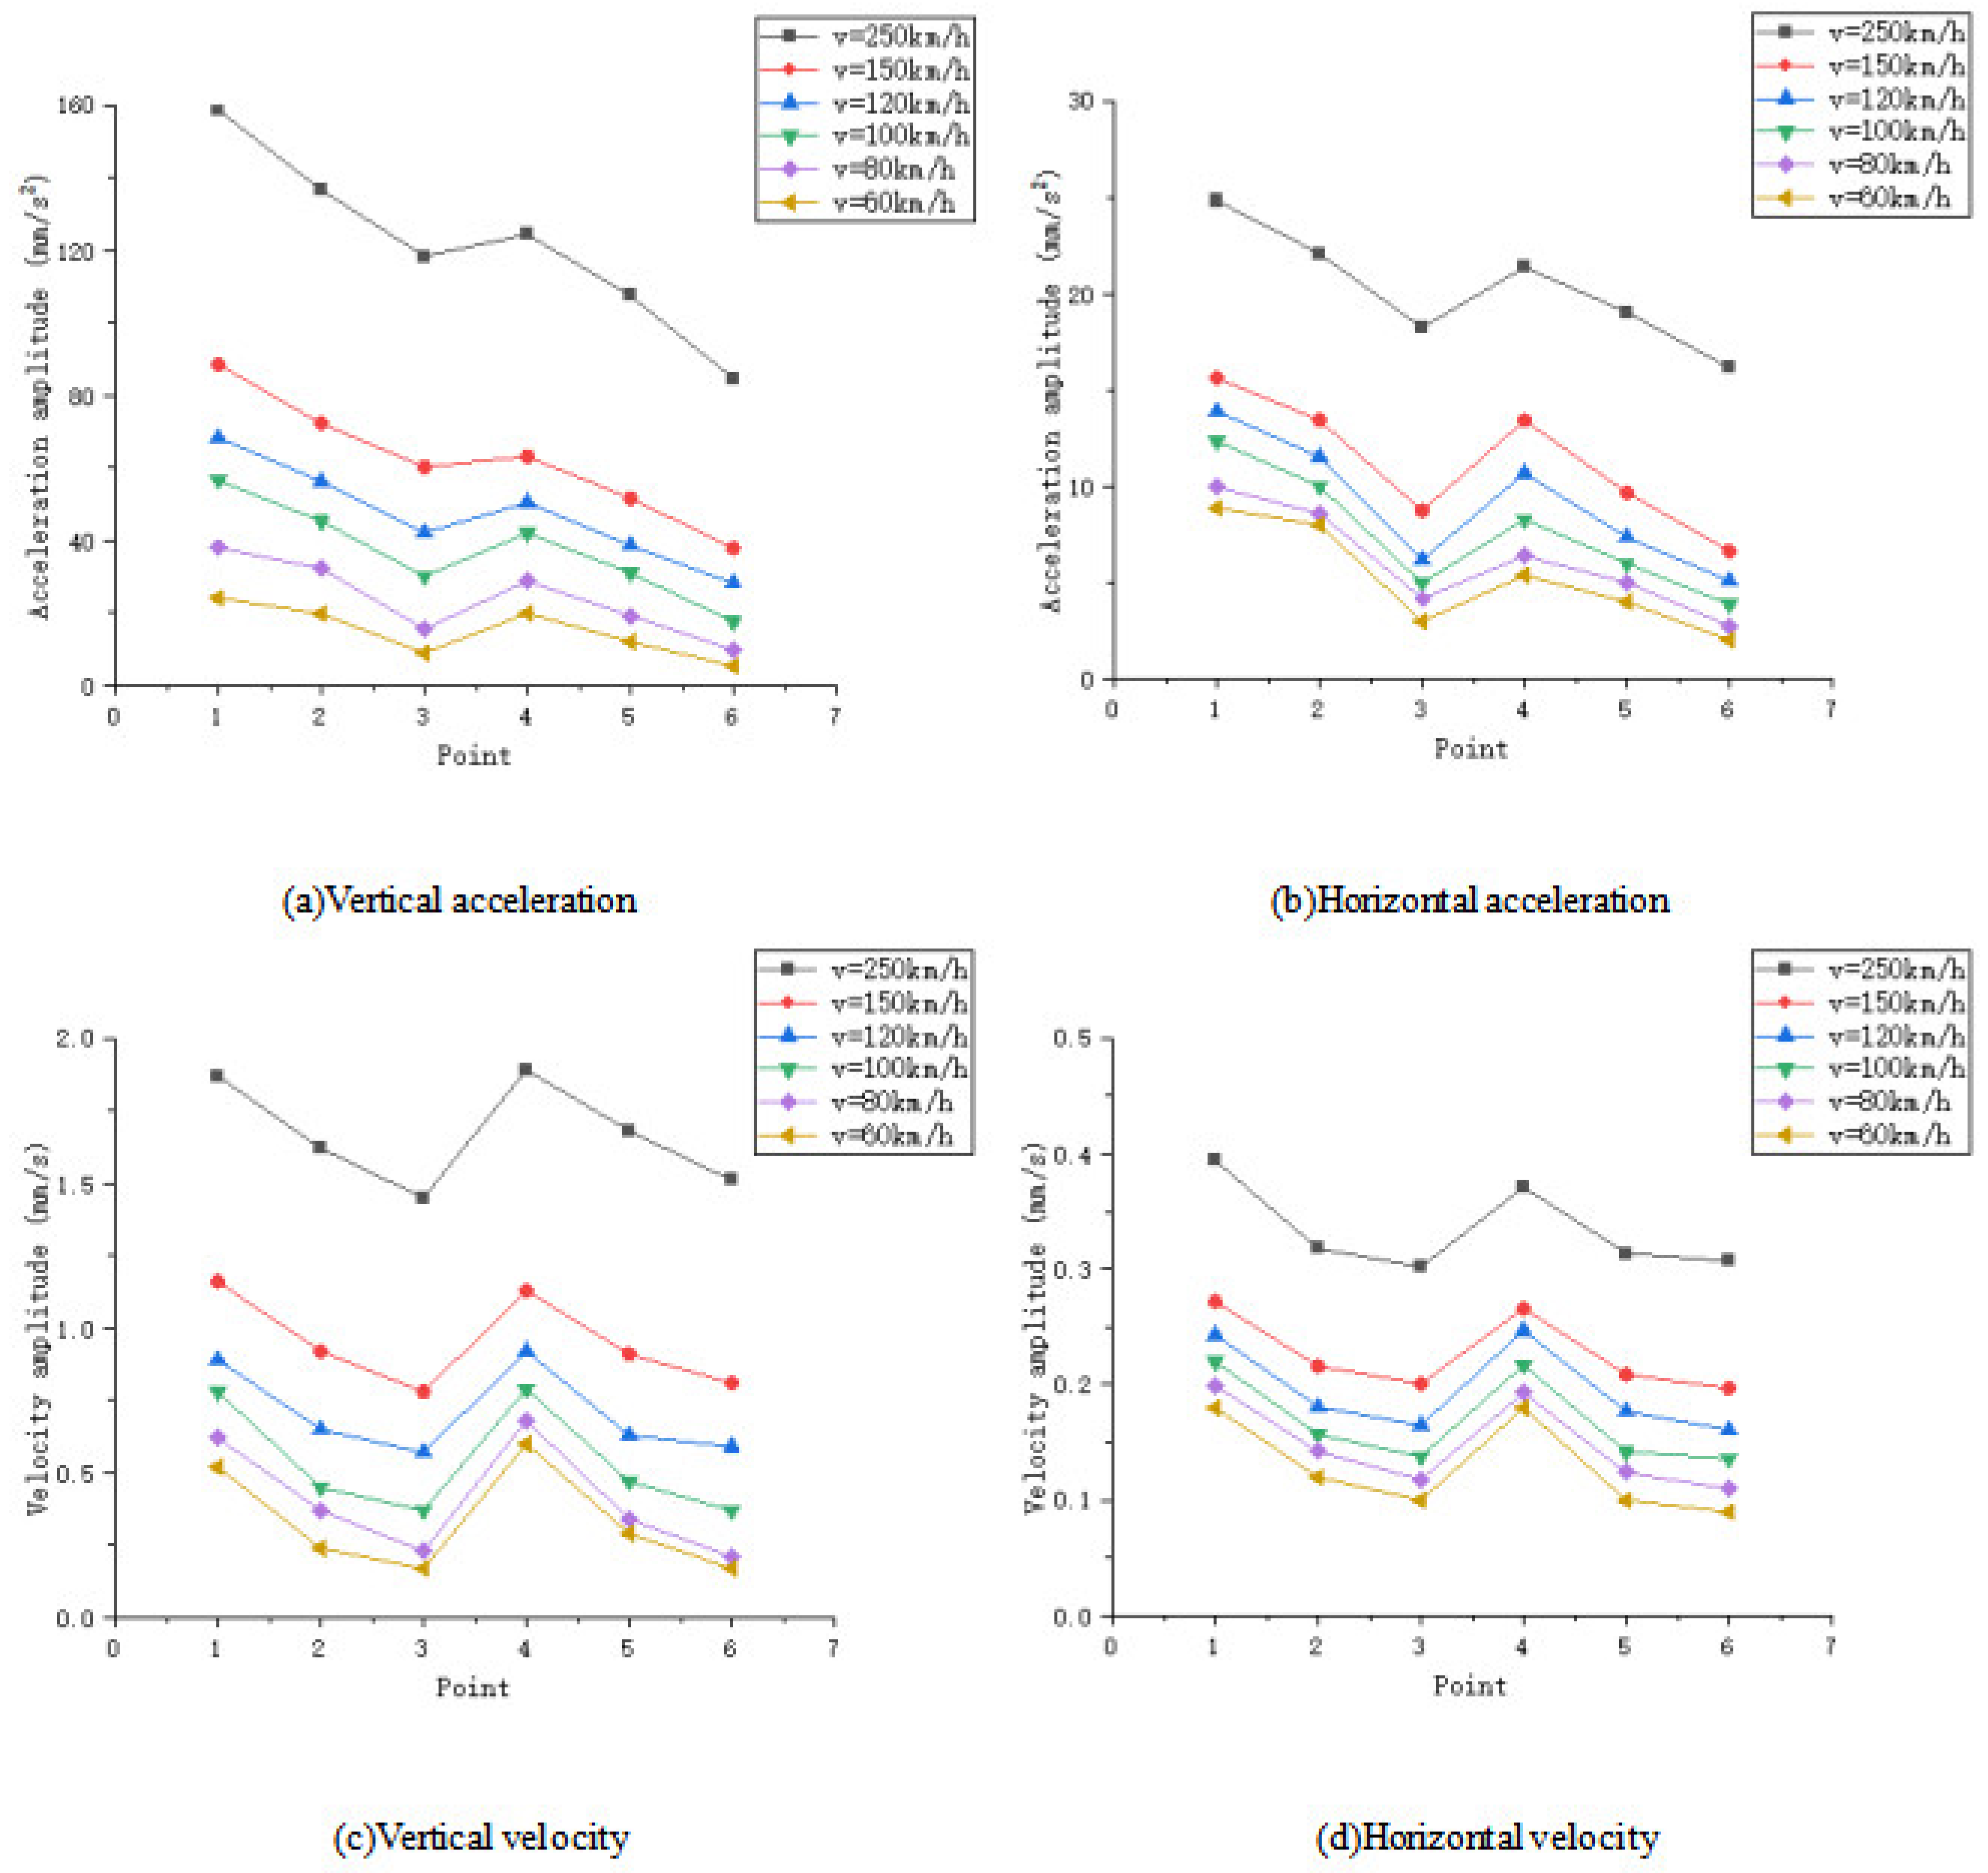
- With respect to velocity and acceleration, for all of the measurement points (P1–P6), the vertical amplitudes were larger than the horizontal amplitudes.
- With respect to velocity and acceleration, for the three measurement points at the bottom of the arch, whether horizontal or vertical, the amplitude showed a decreasing trend (P1 > P2 > P3). Similarly, for the three points at the top of the arch, the amplitude also showed a decreasing trend (P4 > P5 > P6), indicating that the farther away from the railroad, the smaller the vibration.
- When comparing the amplitude of velocity between the measurement points located at the same distance from the railroad, whether horizontal or vertical, the amplitude of the velocity was not significantly different between P1 and P4, P2 and P5, and P3 and P6, indicating that the velocity of the vibration at the bottom of the arch was basically the same as that at the top of the arch. When comparing the acceleration amplitudes of the measurement points located at the same distance from the railroad, whether horizontal or vertical, the acceleration amplitudes were as follows: P1 > P4, P2 > P5, and P3 > P6, indicating that the acceleration of the vibration at the bottom of the arch was greater than that at the top of the arch, with an average amplitude of 40.64%.
5. Finite-Element Numerical Simulation Analysis
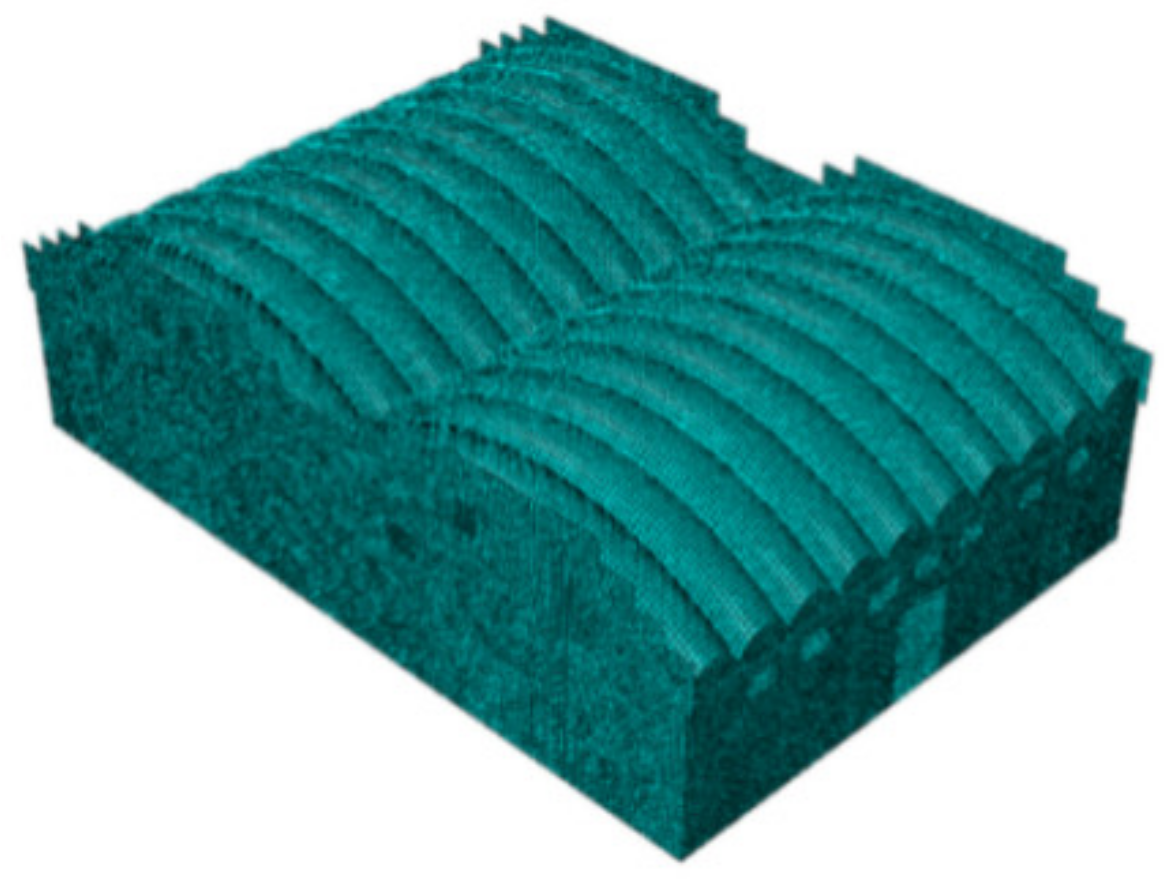
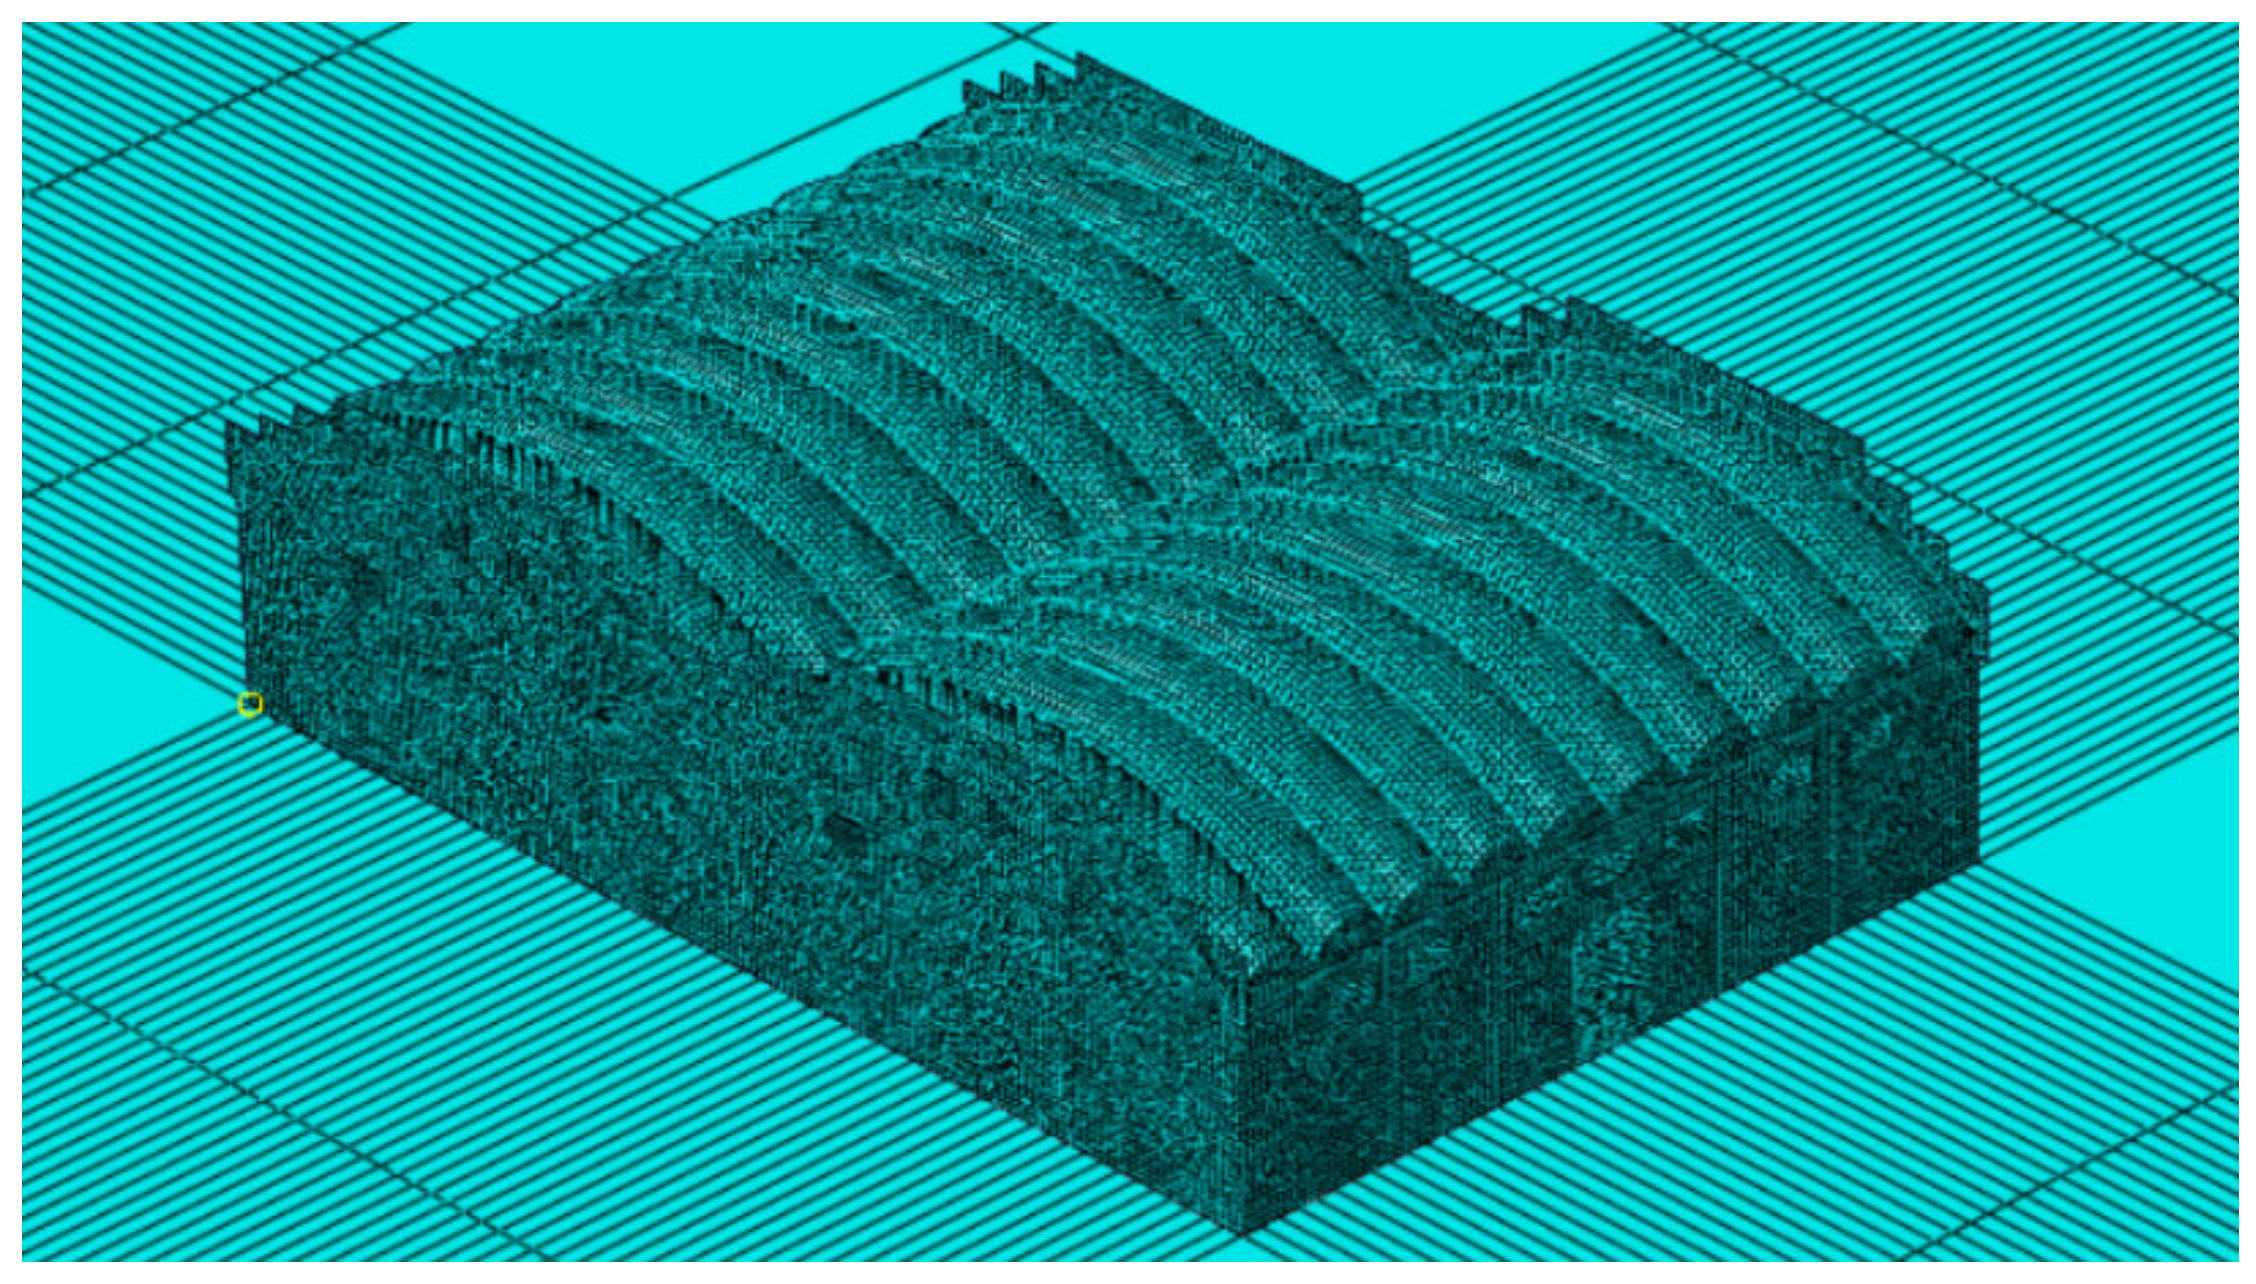
5.1. Establishment of the Finite-Element Model for the Thin-Shell Factory
5.2. Model Checking
5.3. Establishment of the Finite-Element Model for the Soil Structure
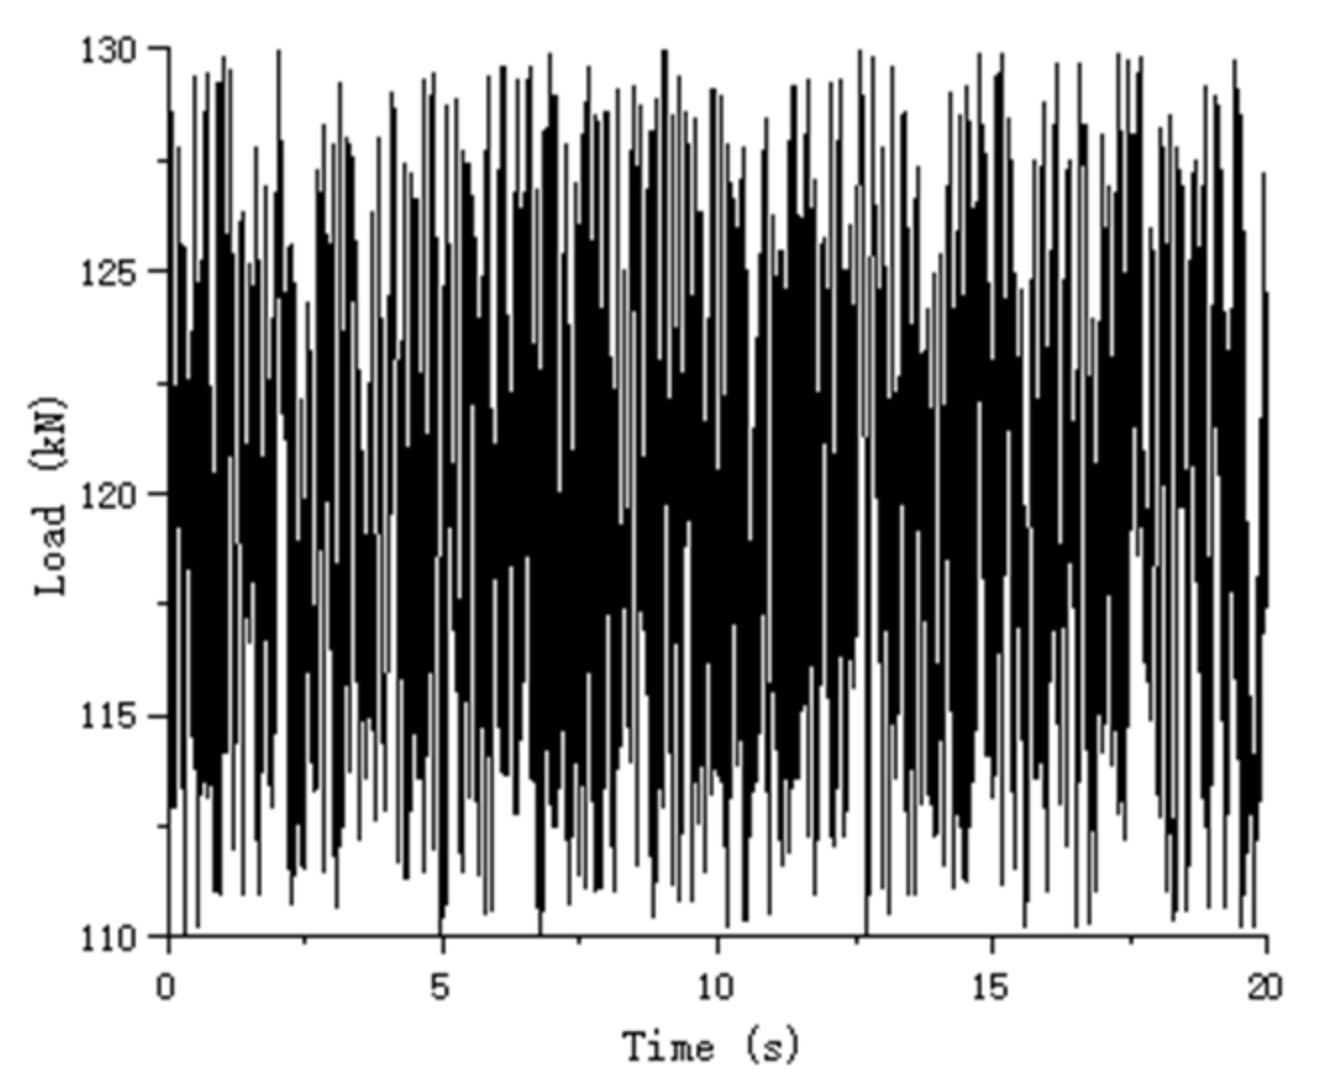
5.4. Simulation of Train Vibration Load
5.5. Dynamic Response Checking
5.6. Analysis of the Dynamic Response of the Thin-Shell Factory under Different Train Vibration Loads
6. Vibration Evaluation of the Thin-Shell Factory
7. Conclusions
- (1)
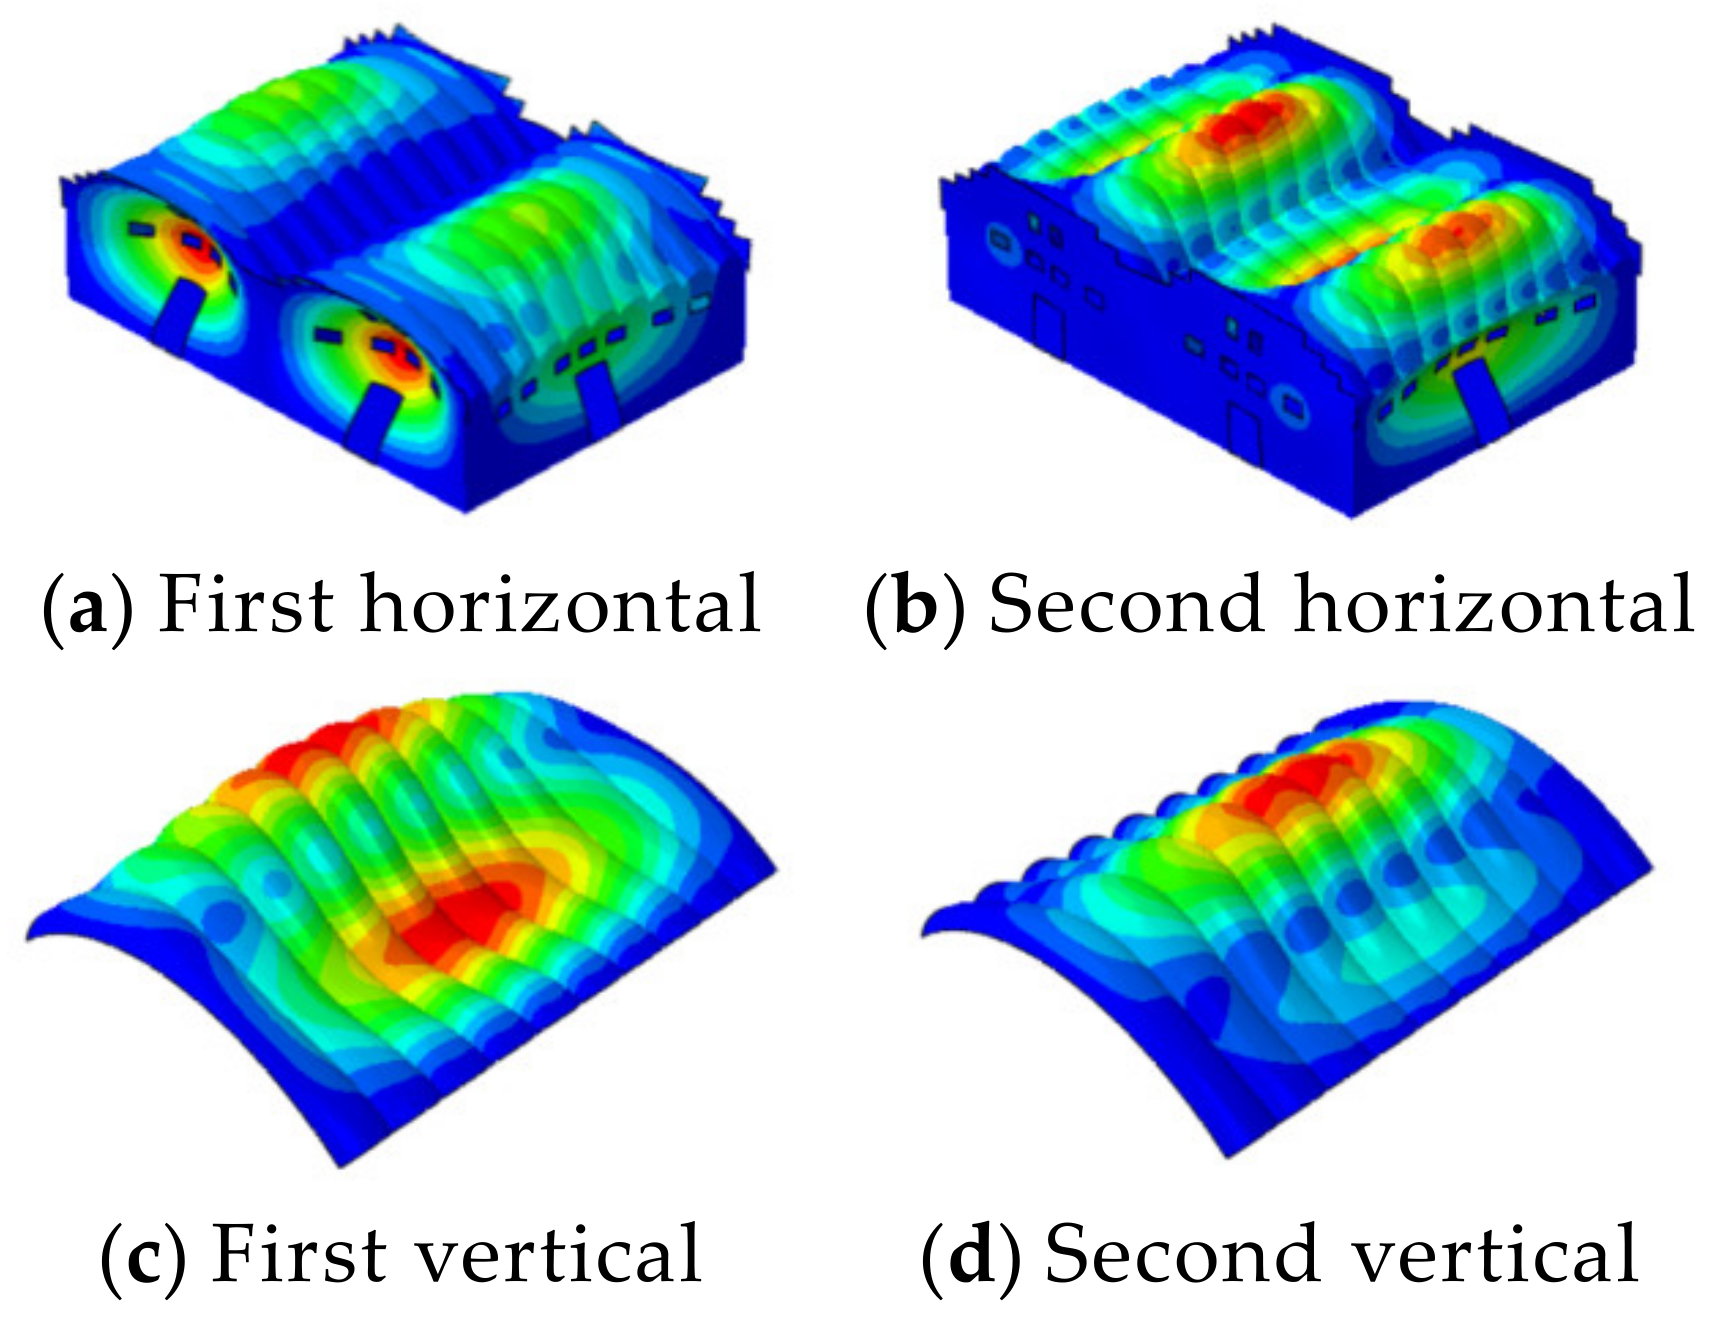
- The field dynamic test results of the thin-shell factory show that the first- and second-order frequencies in the horizontal direction of the structure were 6.24 Hz and 18.50 Hz, respectively, and that the first- and second-order frequencies in the vertical direction were 9.31 Hz and 19.28 Hz, respectively.
- (2)
- The vibration in the horizontal direction is the overall vibration of the factory, whereas the vibration in the vertical direction is the individual vibration of the double-curved brick arch.
- (3)
- The self-oscillation frequency obtained from the numerical simulation results (which were based on the assumption of complete elasticity) was greater compared with the field measurements because of the reduced structural stiffness. Additionally, the maximum error rate was only 7.14%.
- (4)
- Both in acceleration and velocity, the vertical vibration for each measurement point was larger than the horizontal vibration, and the farther away from the railroad, the smaller the vibration. The velocity of the vibration at the bottom of the arch was almost the same as that at the top of the arch, while the acceleration of the vibration at the bottom of the arch was significantly larger than that at the top of the arch, with an average amplitude of 40.64%.
- (5)
- For every 20 km/h increase in train running speed, the average increase in the vertical acceleration amplitude, vertical velocity amplitude, horizontal acceleration amplitude, and horizontal velocity amplitude for each measurement point of the thin-shell factory was 35.4%, 29.8%, 23.7%, and 12.5%, respectively.
- (6)
- When v = 150 km/h, the maximum velocity amplitude for each measurement point of the thin-shell factory was 1.163 mm/s, which is less than the security specification limit of 2.5 mm/s, such that the security of the thin-shell factory meets the requirement, and the maximum horizontal velocity amplitude was 0.272 mm/s, which is close to the integrity specification limit of 0.27 mm/s, such that the integrity of the thin-shell factory just exceeds the requirement; so it is suggested that train running speeds should not exceed 150 km/h and that the thin-shell factory needs to strengthen the monitoring and protection of its integrity.
Author Contributions
Funding
Data Availability Statement
Conflicts of Interest
References
- Zhang, Y. Influence of Urban Rail Transit Vibration on Ancient Buildings; Soochow University: Suzhou, China, 2016. [Google Scholar]
- Xia, Q.; Mao, N.; Wang, D.; Gao, H.; Zhao, J. Research and evaluation of vibration responses of ancient pagoda of Liao Dynasty under different train excitation. Noise Vib. Control 2020, 40, 199–205. [Google Scholar]
- Qiao, X.; Liu, W.; Luo, W.; Ni, W.; Yang, X.; Huang, J.; Liu, J. Field measurement and numerical analysis of influence of traffic load on vibration of Shuangjingzibao ancient city wall. J. Vib. Eng. 2023, 36, 1–13. [Google Scholar]
- Zhang, S.; Tian, P.; Zhang, F.; Lu, J.; Yuna, Z.; Mao, D. Analysis of the dynamic response for Xi’an Drum-Tower under the vibration of urban rail transit. J. Basic Sci. Eng. 2021, 29, 1292–1307. [Google Scholar]
- Tian, T.; Lei, Y.; Qi, F. Vibration response transmisson of lining arch due to tarin speed-changing vibration load. Eng. Mech. 2018, 35, 143–151. [Google Scholar]
- Karpenko, M.; Skačkauskas, P.; Prentkovskis, O. Methodology for the Composite Tire Numerical Simulation Based on the Frequency Response Analysis. Eksploat. I Niezawodn. Maint. Reliab. 2023, 25, 1–11. [Google Scholar] [CrossRef]
- Sanayei, M.; Maurya, P.; Moore, J.A. Measurement of building foundation and ground-borne vibrations due to surface trains and subways. Eng. Struct. 2013, 53, 102–111. [Google Scholar] [CrossRef]
- Hinzen, K.G. Subway-induced vibrations in cologne cathedral. Seismol. Res. Lett. 2014, 85, 631–638. [Google Scholar] [CrossRef]
- Javad Sadeghi, M. Hassan Esmaeili. Safe distance of cultural and historical buildings from subway lines. Soil Dyn. Earthq. Eng. 2017, 96, 89–103. [Google Scholar]
- Agostinacchio, M.; Ciampa, D.; Diomedi, M.; Olita, S. Parametrical analysis of the railways dynamic response at high speed moving loads. J. Mod. Transp. 2013, 21, 169–181. [Google Scholar] [CrossRef]
- Ju, S.-H.; Lin, H.-T. Experimentally investigating finite element accuracy for ground vibrations induced by high-speed trains, Engineering Structures. Eng. Struct. 2008, 30, 733–746. [Google Scholar] [CrossRef]
- Stosiak, M.; Karpenko, M.; Prentkovskis, O.; Deptuła, A.; Skačkauskas, P. Research of vibrations effect on hydraulic valves in military vehicles. Def. Technol. 2023, in press. [Google Scholar] [CrossRef]
- Du, S. Changleyuan: Exploring the “Industrial Wonders of China’s War Effort”. New West 2021, 10, 5–10. [Google Scholar]
- Liu, J.; Du, X. Structural Dynamics; Machinery Industry Press: Beijing, China, 2005. [Google Scholar]
- Wang, D. The Test Dynamic Characteristics and Analysis of Lafonce Office Building in Xi’an; Xi’an University of Technology: Xi’an, China, 2018. [Google Scholar]
- GB 50003-2011; Masonry Structure Design Code. Ministry of Housing and Urban-Rural Development: Beijing, China, 2011.
- Lu, J.; Si, J.; Tian, P.; Zhang, W. Dynamic characteristic test analysis of Jishi Pagoda of Xingjiao Temple. Build. Struct. 2017, 47, 105–108. [Google Scholar]
- Liu, J.; Huan, Y.; Li, J. Application of artificial boundary and seismic input in general finite element software. Chin. J. Undergr. Space Eng. 2011, 7, 1774–1779. [Google Scholar]
- Wang, T.; Ding, J.; Lou, M.; Yu, J. Subway-educed building vibration and its propagation. China Civ. Eng. J. 2009, 42, 33–39. [Google Scholar]
- Wang, W.; Guo, X. Stability and characteristics of landscape in Changleyuan area at the north side of the Weihe river in Baoji. Geol. Shaanxi 2021, 39, 75–83. [Google Scholar]
- Hu, B.; Wang, Y.; Ling, D. Physical essence and influence of model parameters on dynamic response of Rayleigh damping. J. Zhejiang Univ. (Eng. Sci.) 2017, 51, 1284–1290. [Google Scholar]
- Li, L.; Zhang, B.; Yang, X. Analysis of dynamic response of large cross-section tunnel under vibrating load induced by high speed train. Chin. J. Rock Mech. Eng. 2005, 24, 4259–4265. [Google Scholar]
- Mo, H.; Deng, F.; Wang, J. Analysis of dynamic response of shield tunnel during metro operation. Chin. J. Rock Mech. Eng. 2006, 25, 3507–3512. [Google Scholar]
- Liang, B.; Cai, Y. Dynamic analysis on subgrade of high speed railways in geometric irregular condition. J. China Railw. Soc. 1999, 21, 93–97. [Google Scholar]
- Hu, Z.; Li, J. Subway train load analysis methods. Subgrade Eng. 2006, 15, 18–20. [Google Scholar]
- Ding, Z.; Xie, H.; Peng, L. Dynamic Response properties of soft bedrock of high speed railway tunnel. J. Kunming Univ. Sci. Technol. (Nat. Sci.) 2013, 38, 36–41+79. [Google Scholar]
- Tian, T.; Li, G.; Qi, F.; Dong, J. Analysis on acceleration response of tunnel lining under vibration load of train with speed of 300 km/h. J. China Railw. Soc. 2020, 42, 112–120. [Google Scholar]
- ISO 2631; Mechanical Vibration and Shock-Evaluation of Human Exposure to Whole Body Vibration. International Organization for Standardization (ISO): Zürich, Switzerland, 1989.
- DIN 4150-3; Structural Vibration Part 3: Effects of Vibration on Structure. German Institute for Standards: Berlin, Germany, 1999.
- SN 640312A; Effects of Vibration on Construction. Schweizerische Normenvereinigung SNV: Zürich, Switzerland, 1992.
- FTA-VA-90-91003-06; Transit Noise and Vibration Impact Assessment. Federal Transit Administration: Washington, DC, USA, 2006.
- GB/T 50452-2008; Anti-Industrial Vibration of Ancient Buildings Technical Specification. China Construction Industry Press: Beijing, China, 2008.
- Remington, P.J.; Kurzweil, L.G. Low—Frequency Noise and Vibrations from Trains; Butterworth & Co., Ltd.: London, UK, 1987. [Google Scholar]
- Konon, W.; Schuring, J.R. Vibration criteria for historic buildings. J. Constr. Eng. Manag. 1985, 111, 209–215. [Google Scholar] [CrossRef]
- Yang, X.; Pan, F. Vibration protection of ancient buildings in environmental vibration. In Proceedings of the Seventh Academic Conference on Geomechanics and Foundation Engineering of the Chinese Civil Engineering Society; China Construction Industry Press: Beijing, China, 1994; pp. 674–678. [Google Scholar]


| First-Order Frequency | Second-Order Frequency | |
|---|---|---|
| Horizontal | 6.24 | 18.50 |
| Vertical | 9.31 | 19.28 |
| Material | Density (kg/m3) | Elasticity Modulus (MPa) | Poisson’s Ratio |
|---|---|---|---|
| Concrete | 2400 | 20,000 | 0.167 |
| Brick | 1900 | 4500 | 0.15 |
| Oder | Direction | Simulation | Measurement | Error Rate (%) |
|---|---|---|---|---|
| First | Horizontal | 6.72 | 6.24 | 7.14 |
| Vertical | 9.86 | 9.31 | 5.58 | |
| Second | Horizontal | 19.15 | 18.50 | 3.39 |
| Vertical | 20.03 | 19.28 | 3.74 |
| Condition of Control | Li (m) | αi (mm) |
|---|---|---|
| Smoothness of traffic (i = 1) | 50.00 | 16.000 |
| 20.00 | 9.000 | |
| 10.00 | 3.500 | |
| 5.00 | 2.500 | |
| Additional dynamic load applied to the line (i = 2) | 2.00 | 0.400 |
| 1.00 | 0.300 | |
| Wear of the track waveform (i = 3) | 0.50 | 0.080 |
| 0.05 | 0.005 |
| Standards/Scholars | Vibration Amplitude Limit (mm/s) | Frequency Range (Hz) | Control Standards | Note Description |
|---|---|---|---|---|
| International Standard ISO 2631 [28] | 2.5~10 | -- | Security | |
| German Standard DIN 4150-3 [29] | 2.5 | 1~10 | Security | Structures affected by continuous long-term vibration; horizontal velocity limit for the top floor of a structure |
| Swiss Standard SN 640312a [30] | 3.0 | 10~30 | Security | Vibration source for machinery, transportation, and construction equipment |
| Federal Transit Administration FTA Standard [31] | 3.08 | -- | Security | |
| Anti-Industrial Vibration of Ancient Buildings Technical Specification (GB/T50452-2008) [32] | 0.15~0.2 | -- | Integrity | National key cultural relics protection unit of ancient masonry load-bearing structures at the highest water-level velocity limit |
| Remington [33] | 2 | -- | Security | |
| Konon, Schuring [34] | 6.4~12.7 | 10~40 | Security | |
| YANG Xianjian, PAN Fulan [35] | 1.8 | -- | Security |
| V = 60 km/h | V = 80 km/h | V = 100 km/h | V = 120 km/h | V = 150 km/h | V = 250 km/h | |
|---|---|---|---|---|---|---|
| P1 | 0.522 | 0.625 | 0.786 | 0.891 | 1.163 | 1.871 |
| P2 | 0.246 | 0.374 | 0.451 | 0.659 | 0.927 | 1.623 |
| P3 | 0.178 | 0.235 | 0.377 | 0.578 | 0.780 | 1.454 |
| P4 | 0.605 | 0.689 | 0.794 | 0.921 | 1.132 | 1.896 |
| P5 | 0.293 | 0.342 | 0.478 | 0.632 | 0.918 | 1.685 |
| P6 | 0.174 | 0.214 | 0.376 | 0.598 | 0.811 | 1.518 |
| V = 60 km/h | V = 80 km/h | V = 100 km/h | V = 120 km/h | V = 150 km/h | V = 250 km/h | |
|---|---|---|---|---|---|---|
| P1 | 0.182 | 0.199 | 0.220 | 0.243 | 0.272 | 0.394 |
| P2 | 0.126 | 0.142 | 0.157 | 0.181 | 0.216 | 0.318 |
| P3 | 0.103 | 0.118 | 0.138 | 0.165 | 0.201 | 0.302 |
| P4 | 0.184 | 0.193 | 0.217 | 0.247 | 0.266 | 0.371 |
| P5 | 0.107 | 0.124 | 0.142 | 0.177 | 0.209 | 0.314 |
| P6 | 0.098 | 0.110 | 0.136 | 0.161 | 0.197 | 0.307 |
Disclaimer/Publisher’s Note: The statements, opinions and data contained in all publications are solely those of the individual author(s) and contributor(s) and not of MDPI and/or the editor(s). MDPI and/or the editor(s) disclaim responsibility for any injury to people or property resulting from any ideas, methods, instructions or products referred to in the content. |
© 2023 by the authors. Licensee MDPI, Basel, Switzerland. This article is an open access article distributed under the terms and conditions of the Creative Commons Attribution (CC BY) license (https://creativecommons.org/licenses/by/4.0/).
Share and Cite
Liu, Y.; Si, J.; Zhou, Y.; Ma, P.; Wang, Y.; Zhou, M.; Ju, J.; Niu, X. Effect of Train Vibrations on the Dynamic Response of a Multi-Span Double-Curved Brick Arch Thin-Shell Factory of Changleyuan. Buildings 2023, 13, 2400. https://doi.org/10.3390/buildings13092400
Liu Y, Si J, Zhou Y, Ma P, Wang Y, Zhou M, Ju J, Niu X. Effect of Train Vibrations on the Dynamic Response of a Multi-Span Double-Curved Brick Arch Thin-Shell Factory of Changleyuan. Buildings. 2023; 13(9):2400. https://doi.org/10.3390/buildings13092400
Chicago/Turabian StyleLiu, Yefeng, Jianhui Si, Yuan Zhou, Peiyuan Ma, Yi Wang, Ming Zhou, Junpeng Ju, and Xiaoyu Niu. 2023. "Effect of Train Vibrations on the Dynamic Response of a Multi-Span Double-Curved Brick Arch Thin-Shell Factory of Changleyuan" Buildings 13, no. 9: 2400. https://doi.org/10.3390/buildings13092400