Article

Operational Strategy of a DC Inverter Heat Pump System Considering PV Power Fluctuation and Demand-Side Load Characteristics

1
School of Environment and Architecture, University of Shanghai for Science and Technology, Shanghai 200093, China
2
Key Laboratory of Ecology and Energy Saving Study of Dense Habitat, Ministry of Education, Shanghai 200092, China
3
BSE Energy Technology (Suzhou) Co., Ltd., Suzhou 215000, China
4
Department of Architecture and Built Environment, University of Nottingham Ningbo China, Ningbo 315100, China
*
Author to whom correspondence should be addressed.
Buildings 2024, 14(4), 1139; https://doi.org/10.3390/buildings14041139
Submission received: 22 March 2024 / Revised: 7 April 2024 / Accepted: 12 April 2024 / Published: 18 April 2024
(This article belongs to the Special Issue Building Energy-Saving Technology—2nd Edition)

Abstract

:
With the increase in application of solar PV systems, it is of great significance to develop and investigate direct current (DC)-powered equipment in buildings with flexible operational strategies. A promising piece of building equipment integrated in PV-powered buildings, DC inverter heat pump systems often operate with strategies either focused on the power supply side or on the building demand side. In this regard, the aim of this study was to investigate the operational strategy of a DC inverter heat pump system for application in an office building with a PV power system. Firstly, the PV power fluctuation and demand-side load characteristics were analyzed. Then, a series of heat transfer and heat pump system models were developed. A reference building model was developed for simulating the performance of the system. A control logic of the DC inverter heat pump was proposed with a certain level of flexibility and capability considering both the characteristics of the PV power generation and the demand-side heating load. MATLAB/Simulink 2021 software was used for simulation. The simulation results show that the DC inverter heat pump is able to regulate its own power according to the change signal of the bus voltage such that the DC distribution network can achieve power balance and thus provide enough energy for a room. This study can provide a reference for developing flexible operational strategies for DC inverter heat pump systems. The proposed strategy can also help to improve the systems’ performance when they are applied in buildings with distributed PV systems.

1. Introduction

Global climate change and increasing demand for energy have led to a dramatic transformation from conventional energy to renewable energy systems [1,2,3]. Over the last 20 years, solar photovoltaics (PVs) has witnessed rapid growth as the most widely applied form of renewable energy source (RES) [4,5]. Since the building sector consumes nearly 40% of the total energy consumption and generates over 30% [6] of the carbon dioxide emissions around the world, RESs integrated with buildings have gained prominence for their capacity to mitigate building energy consumption and reduce carbon dioxide emissions. Among various RES applications, building integrated photovoltaic (BIPV) systems have become more prevalent in new building and retrofit projects as their energy conversion rate has increased and the cost of the technology dramatically reduced [7,8,9,10]. BIPV refers to photovoltaic modules and systems that can replace conventional building components [11], which is an efficient way of generating renewable energy on-site while meeting architectural requirements [12,13,14]. However, there are still some problems with BIPV systems from both the power supply side and demand side, which restricts their application.
The main problem associated with the power supply quality is the intermittence and stochastic character of PV systems, which may result in significant fluctuations in the generated power [15]. Except for long-period PV output variations due to seasonal impacts, unpleasant weather and cloud transience induce short-term variability and considerable PV output fluctuations in power supply systems. Previous researchers found that passing clouds resulted in fluctuations in 45–90% of the rated PV capacity per minute in a PV plant in Portugal [16]. The electrical energy provided by the power system responds instantaneously, transmits quickly, has no time lag or loss, and has little inertia [17]. Therefore, it is crucial to balance power supply and consumer demand and to ensure reliable power delivery to systems and equipment in buildings. Fluctuating PV power requires load-side equipment in buildings to meet flexibility demands on multiple time scales. On the other hand, solar photovoltaic systems generate direct-current (DC) distributed power supply, which triggers a significant trend towards DC power equipment and DC loads in buildings, such as LED lamps, IT equipment, and motor loads, prompting development in inverter drives [18]. Although the role of the demand side is increasingly important in PV-powered buildings, previous research mostly focused on the power grid side, such as DC microgrid architecture [19], passive solar technology [20], multi-objective optimization of dynamic voltage [21], numerical analysis [22], segmentation of photovoltaic panels [23], and comparative analysis of control strategies and current status of development [24,25]. Although research has been conducted on control strategies of DC light flicker [26] to respond to PV power output fluctuations, there is comparably little research on DC-powered heating, ventilation and air-conditioning (HVAC) systems.
HVAC systems, one of the largest energy consumers in buildings, are considered suitable equipment to respond to the fluctuations in PV output. From the perspective of demand-side load, thermal energy generated by the heat supply system is transmitted slowly and with high inertia, with some delay and heat loss [27]. As the amount of heat supply from HVAC systems changes, the room temperature can still remain stable and within a comfortable level for a long period due to the thermal inertia of the building. Among the various pieces of HVAC equipment, heat pumps have been regarded as efficient mechanical devices that produce heating energy from renewable sources such as solar energy, ambient air, geothermal energy or waste heat [28,29]. Wang et al. [30] developed a new solar–air-source heat pump building energy supply system with energy storage that maintains efficient operation during extreme weather in winter and summer. Roccatello et al. [31] analyzed the primary energy consumption of a heat pump with various control strategies, and found that the most efficient control strategies were maximizing the utilization of heat pumps. Xia L et al. [32] presented a model-based adaptive control strategy for a ground source heat pump with integrated solar photovoltaic collectors, which can improve the energy efficiency of the integrated system. Wei et al. [33] developed a matching control strategy to improve the system performance of a CO2 heat pump, and found that the overall COP of the system could be increased by using a control method: simultaneous optimal electronic expansion valve opening and regulation frequency. Lyu et al. [34] built a model of an energy storage heating system using TRNSYS and investigated the influence of the size of the air source heat pump on the energy-saving potential of the energy storage heating system. From previous research, it can be seen that the operational strategy of the heat pump system has a large impact on indoor comfort as well as on the building’s energy consumption. There is a lack of research focused on the control strategies of heat pumps considering the power supply-side characteristics, such as PV power fluctuations.
In recent years, DC inverter heat pumps have attracted increasing attention from researchers. Operational strategies of the DC inverter heat pump system considering PV power output fluctuations and demand-side characteristics have been addressed in multiple studies, with inconclusive results. Wang et al. [35] proposed an injection-assisted air source heat pump (ASHP) to improve heating performance in cold areas under various temperature conditions. They conducted an experimental study and proved that the system performed well over a wide range of temperature conditions. Zhang et al. [36] proposed a PV/T solar-assisted heat pump water heating system driven by a DC inverter compressor and evaluated its characteristics and operational performance under different operating conditions in Lanzhou. They found that the low speed of the compressor favors the continuity of the refrigerant circulation and improves the performance of the system. Despite the fact that DC inverter heat pumps have become a research focus, there are few studies on their operational strategies in terms of the characteristics of PV power characteristic and demand-side responses.
To address the above problems, this paper presents an operational strategy for a DC inverter heat pump that considers both PV power fluctuations and demand-side characteristics. The characteristics of PV power fluctuation and demand-side load for a case study building were firstly analyzed. A theoretical model of the system was then developed, including a heat pump model, an ice storage unit model, and a room model. The DC heat pump system was simulated by using MATLAB/Simulink software under both cooling and heating conditions. The operational strategy of the system takes into account the DC bus voltage of PV output and room temperature variations. This study, to some extent, can provide a reference for developing suitable operational strategies for DC inverter heat pump systems. The contribution of this study advances the field of DC-powered HVAC systems by providing a new control method to enhance the performance of heat pump systems, with potential applications in both residential and commercial settings.

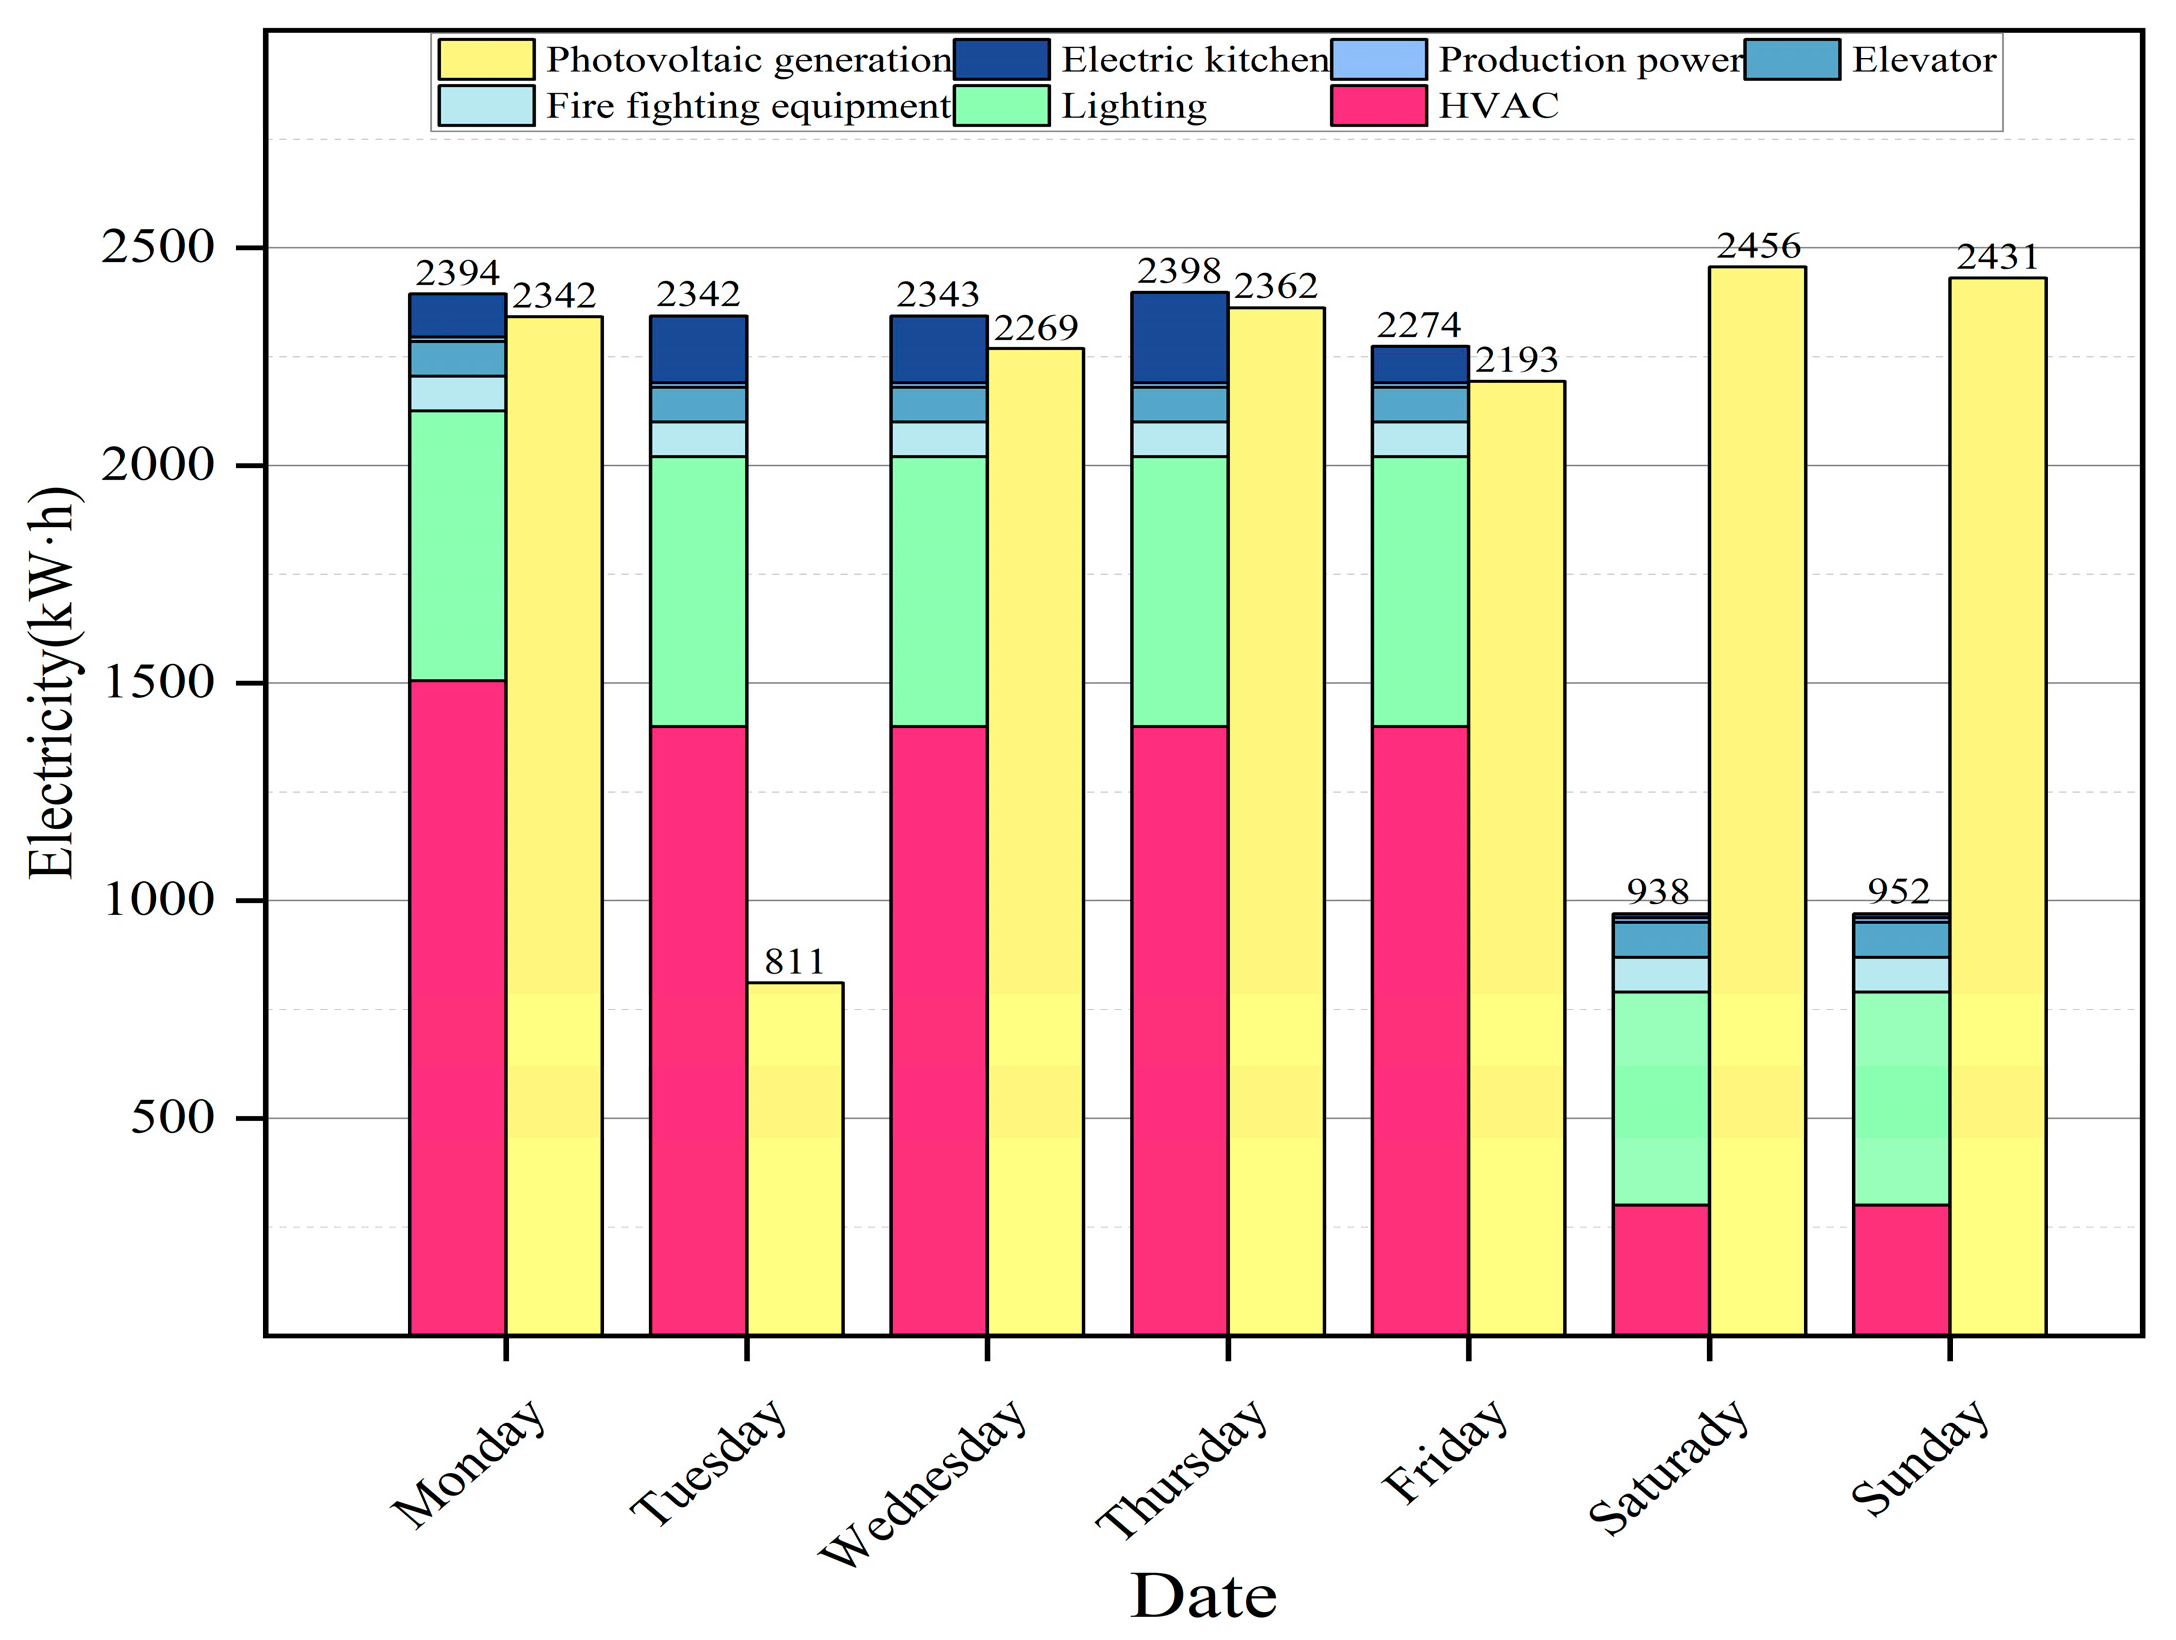
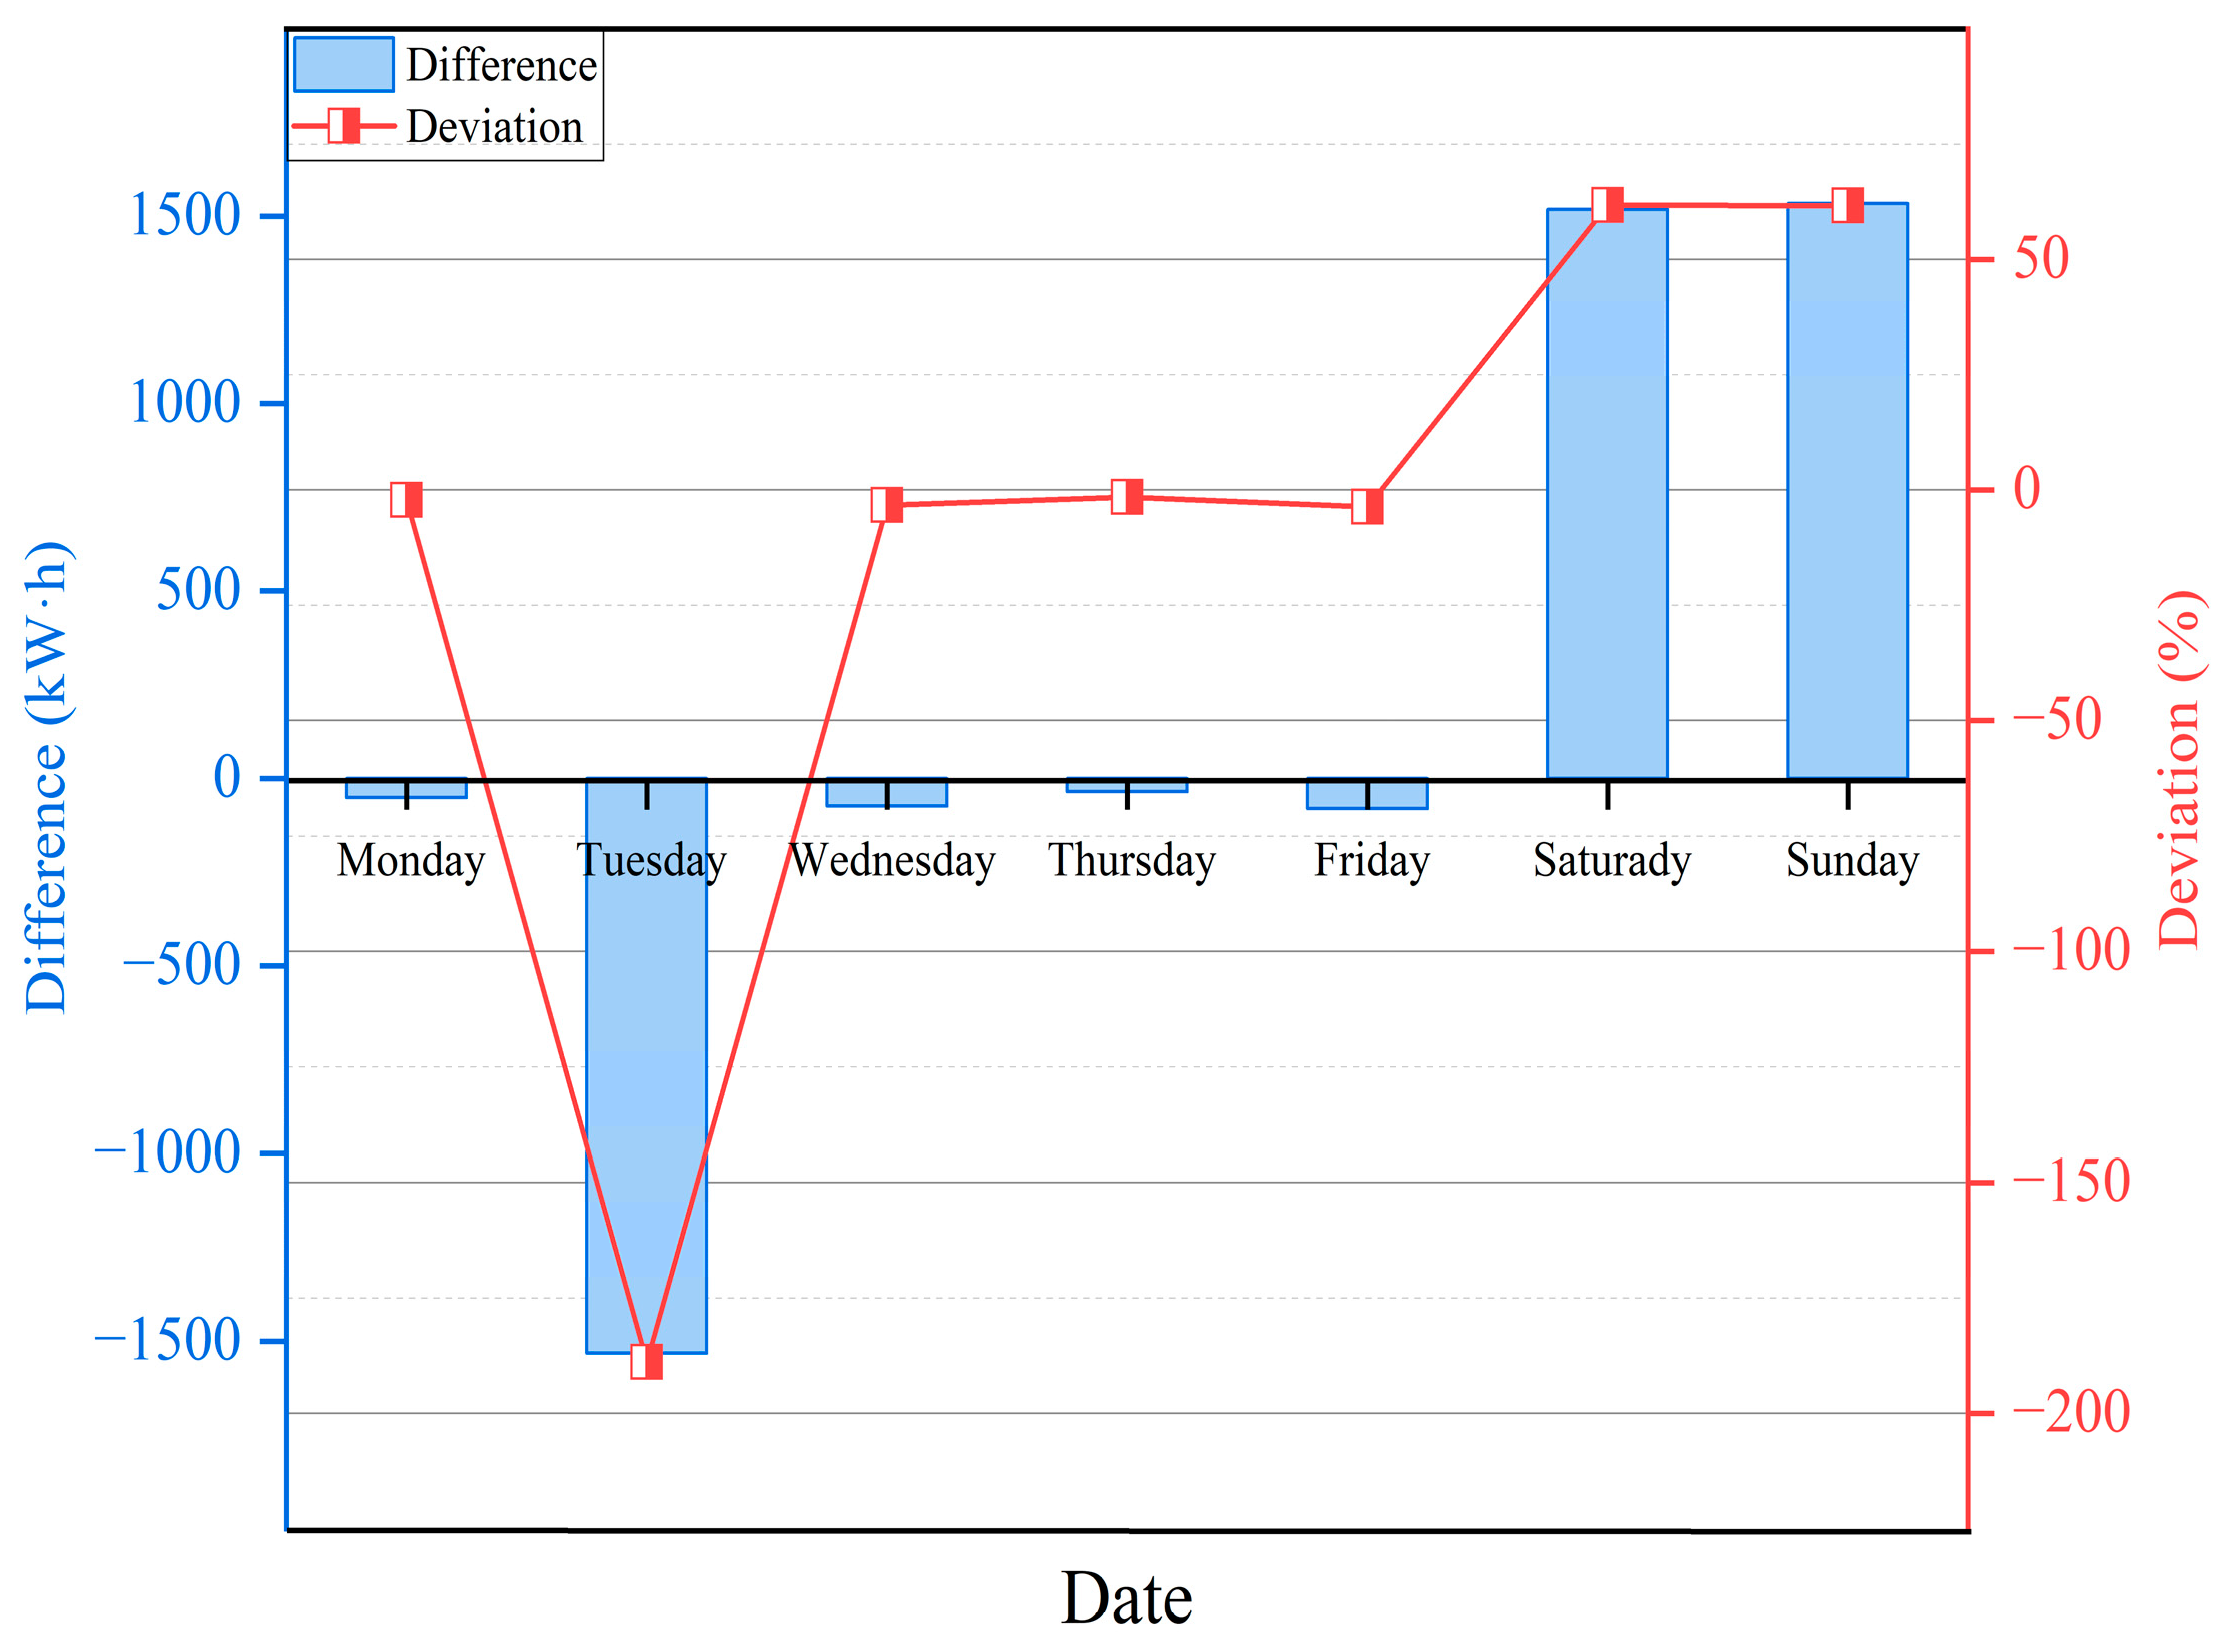
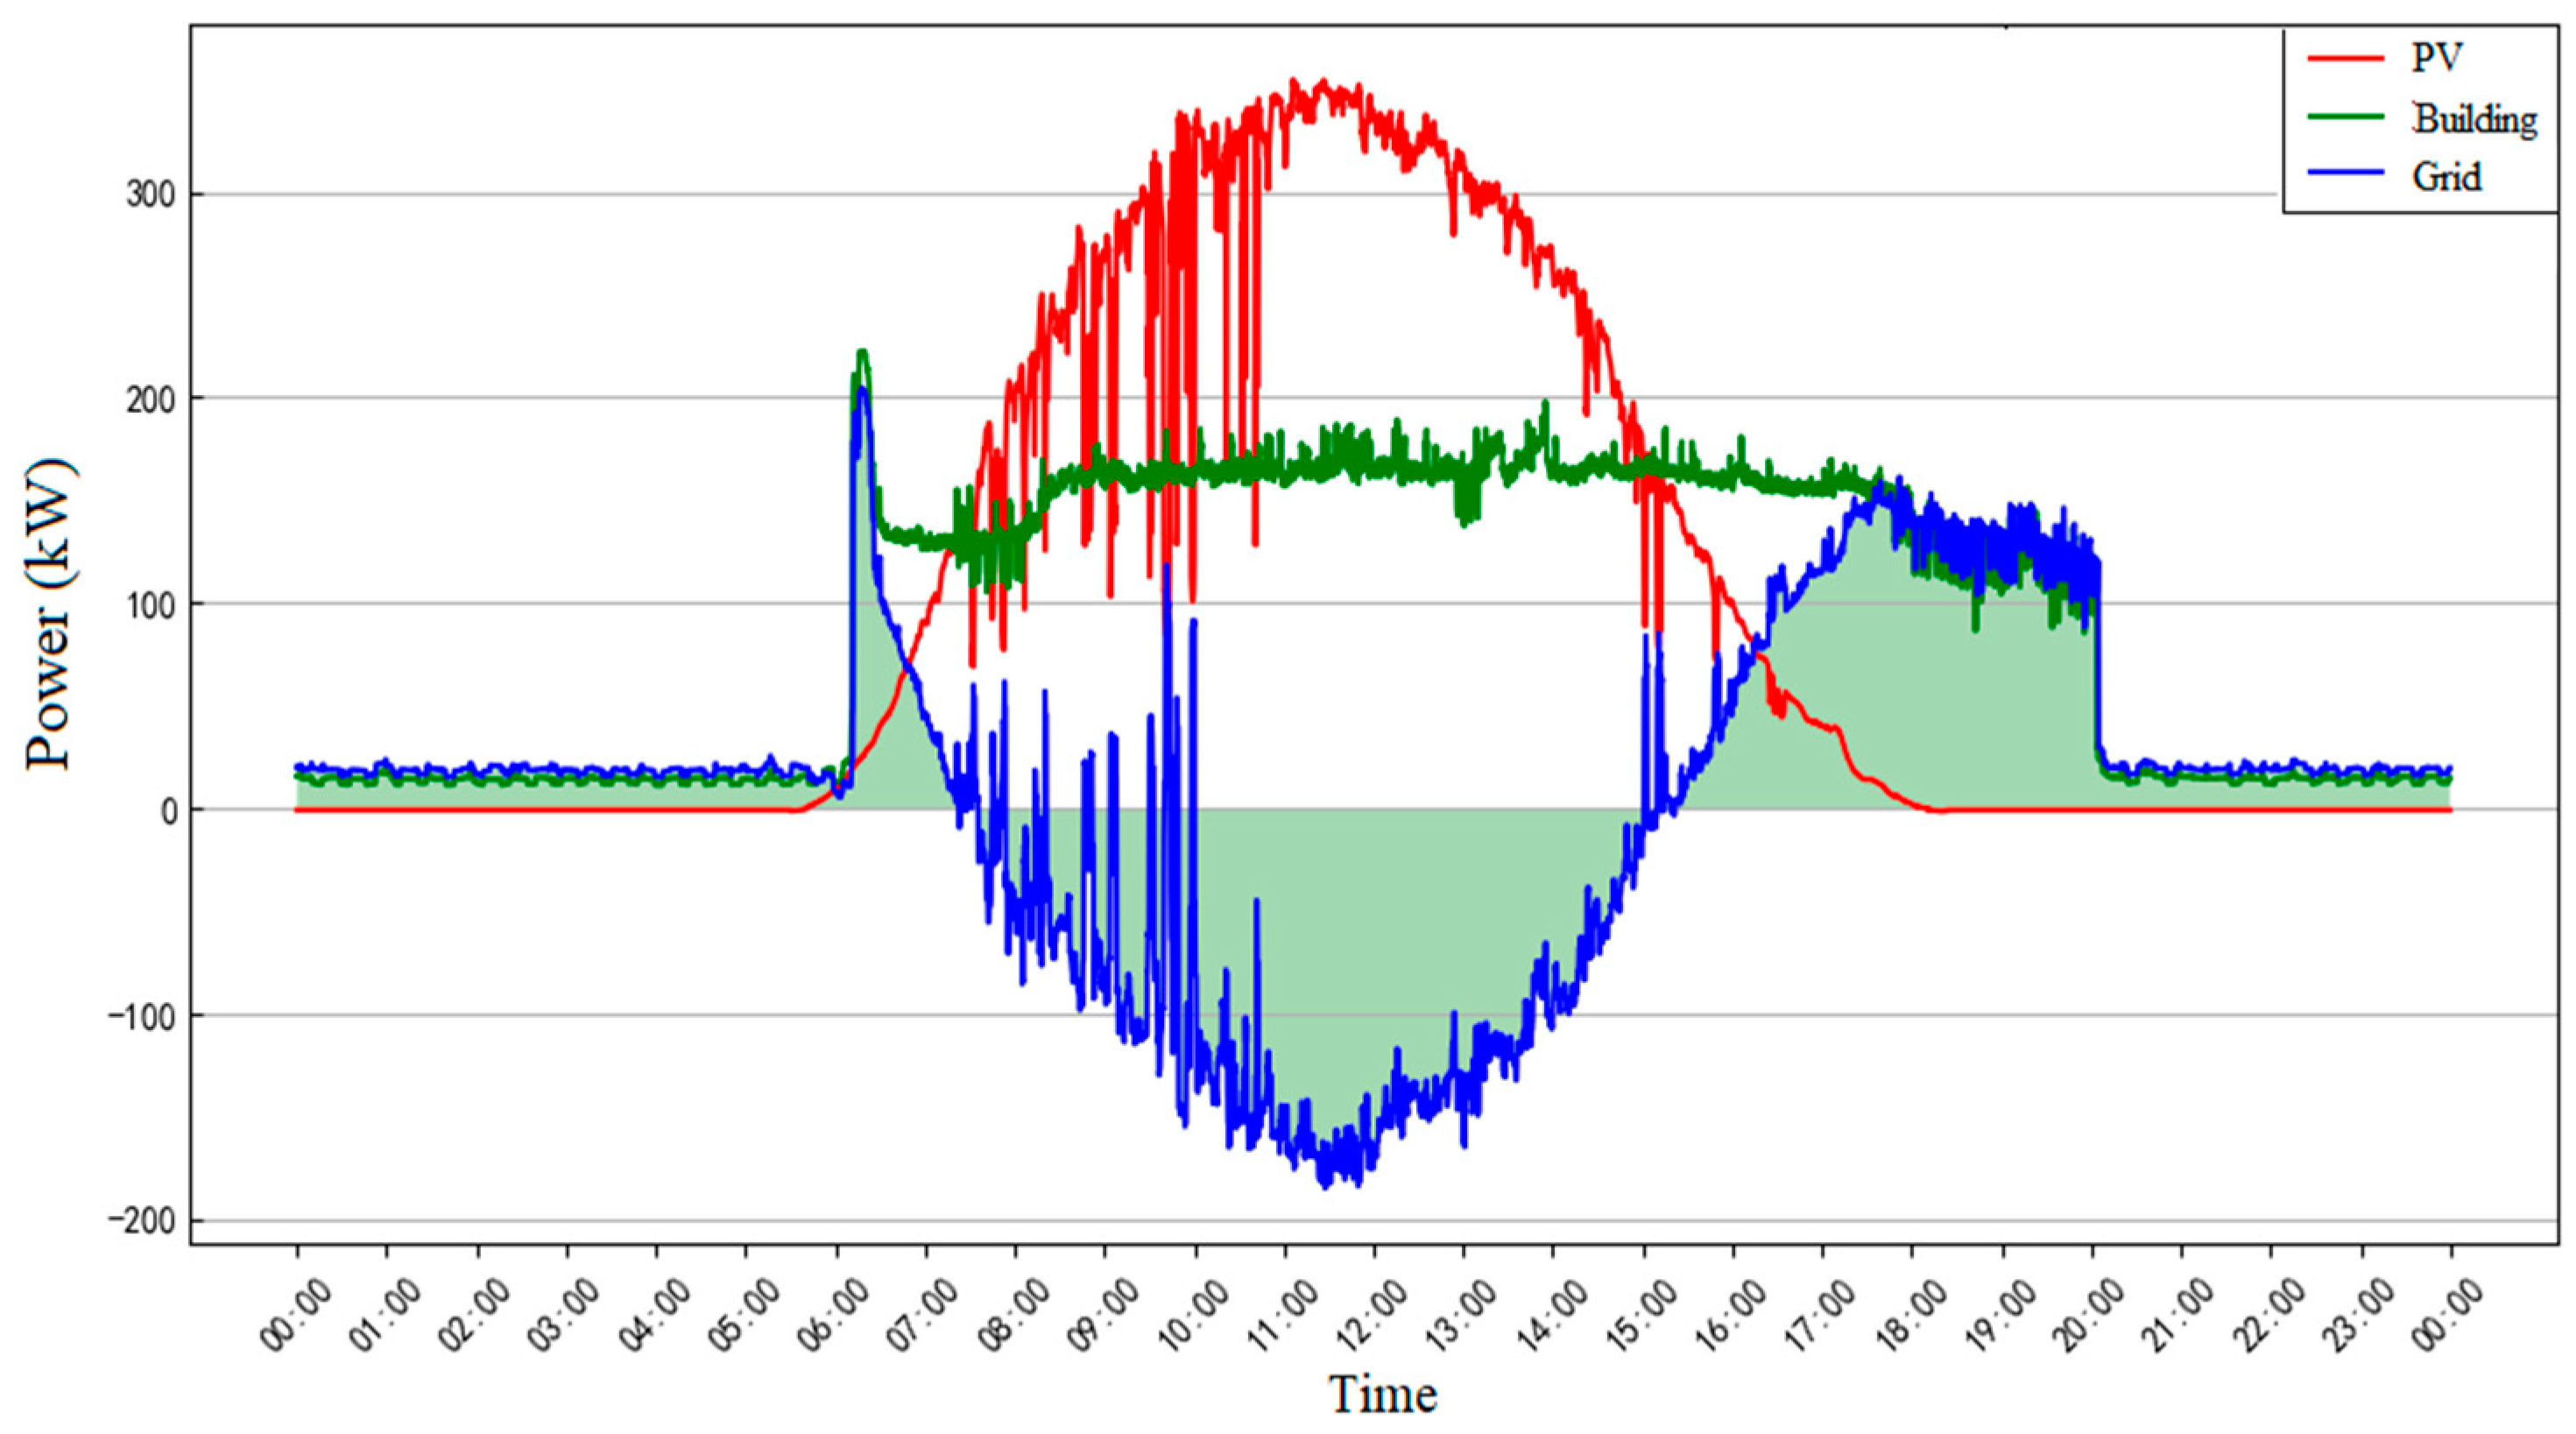
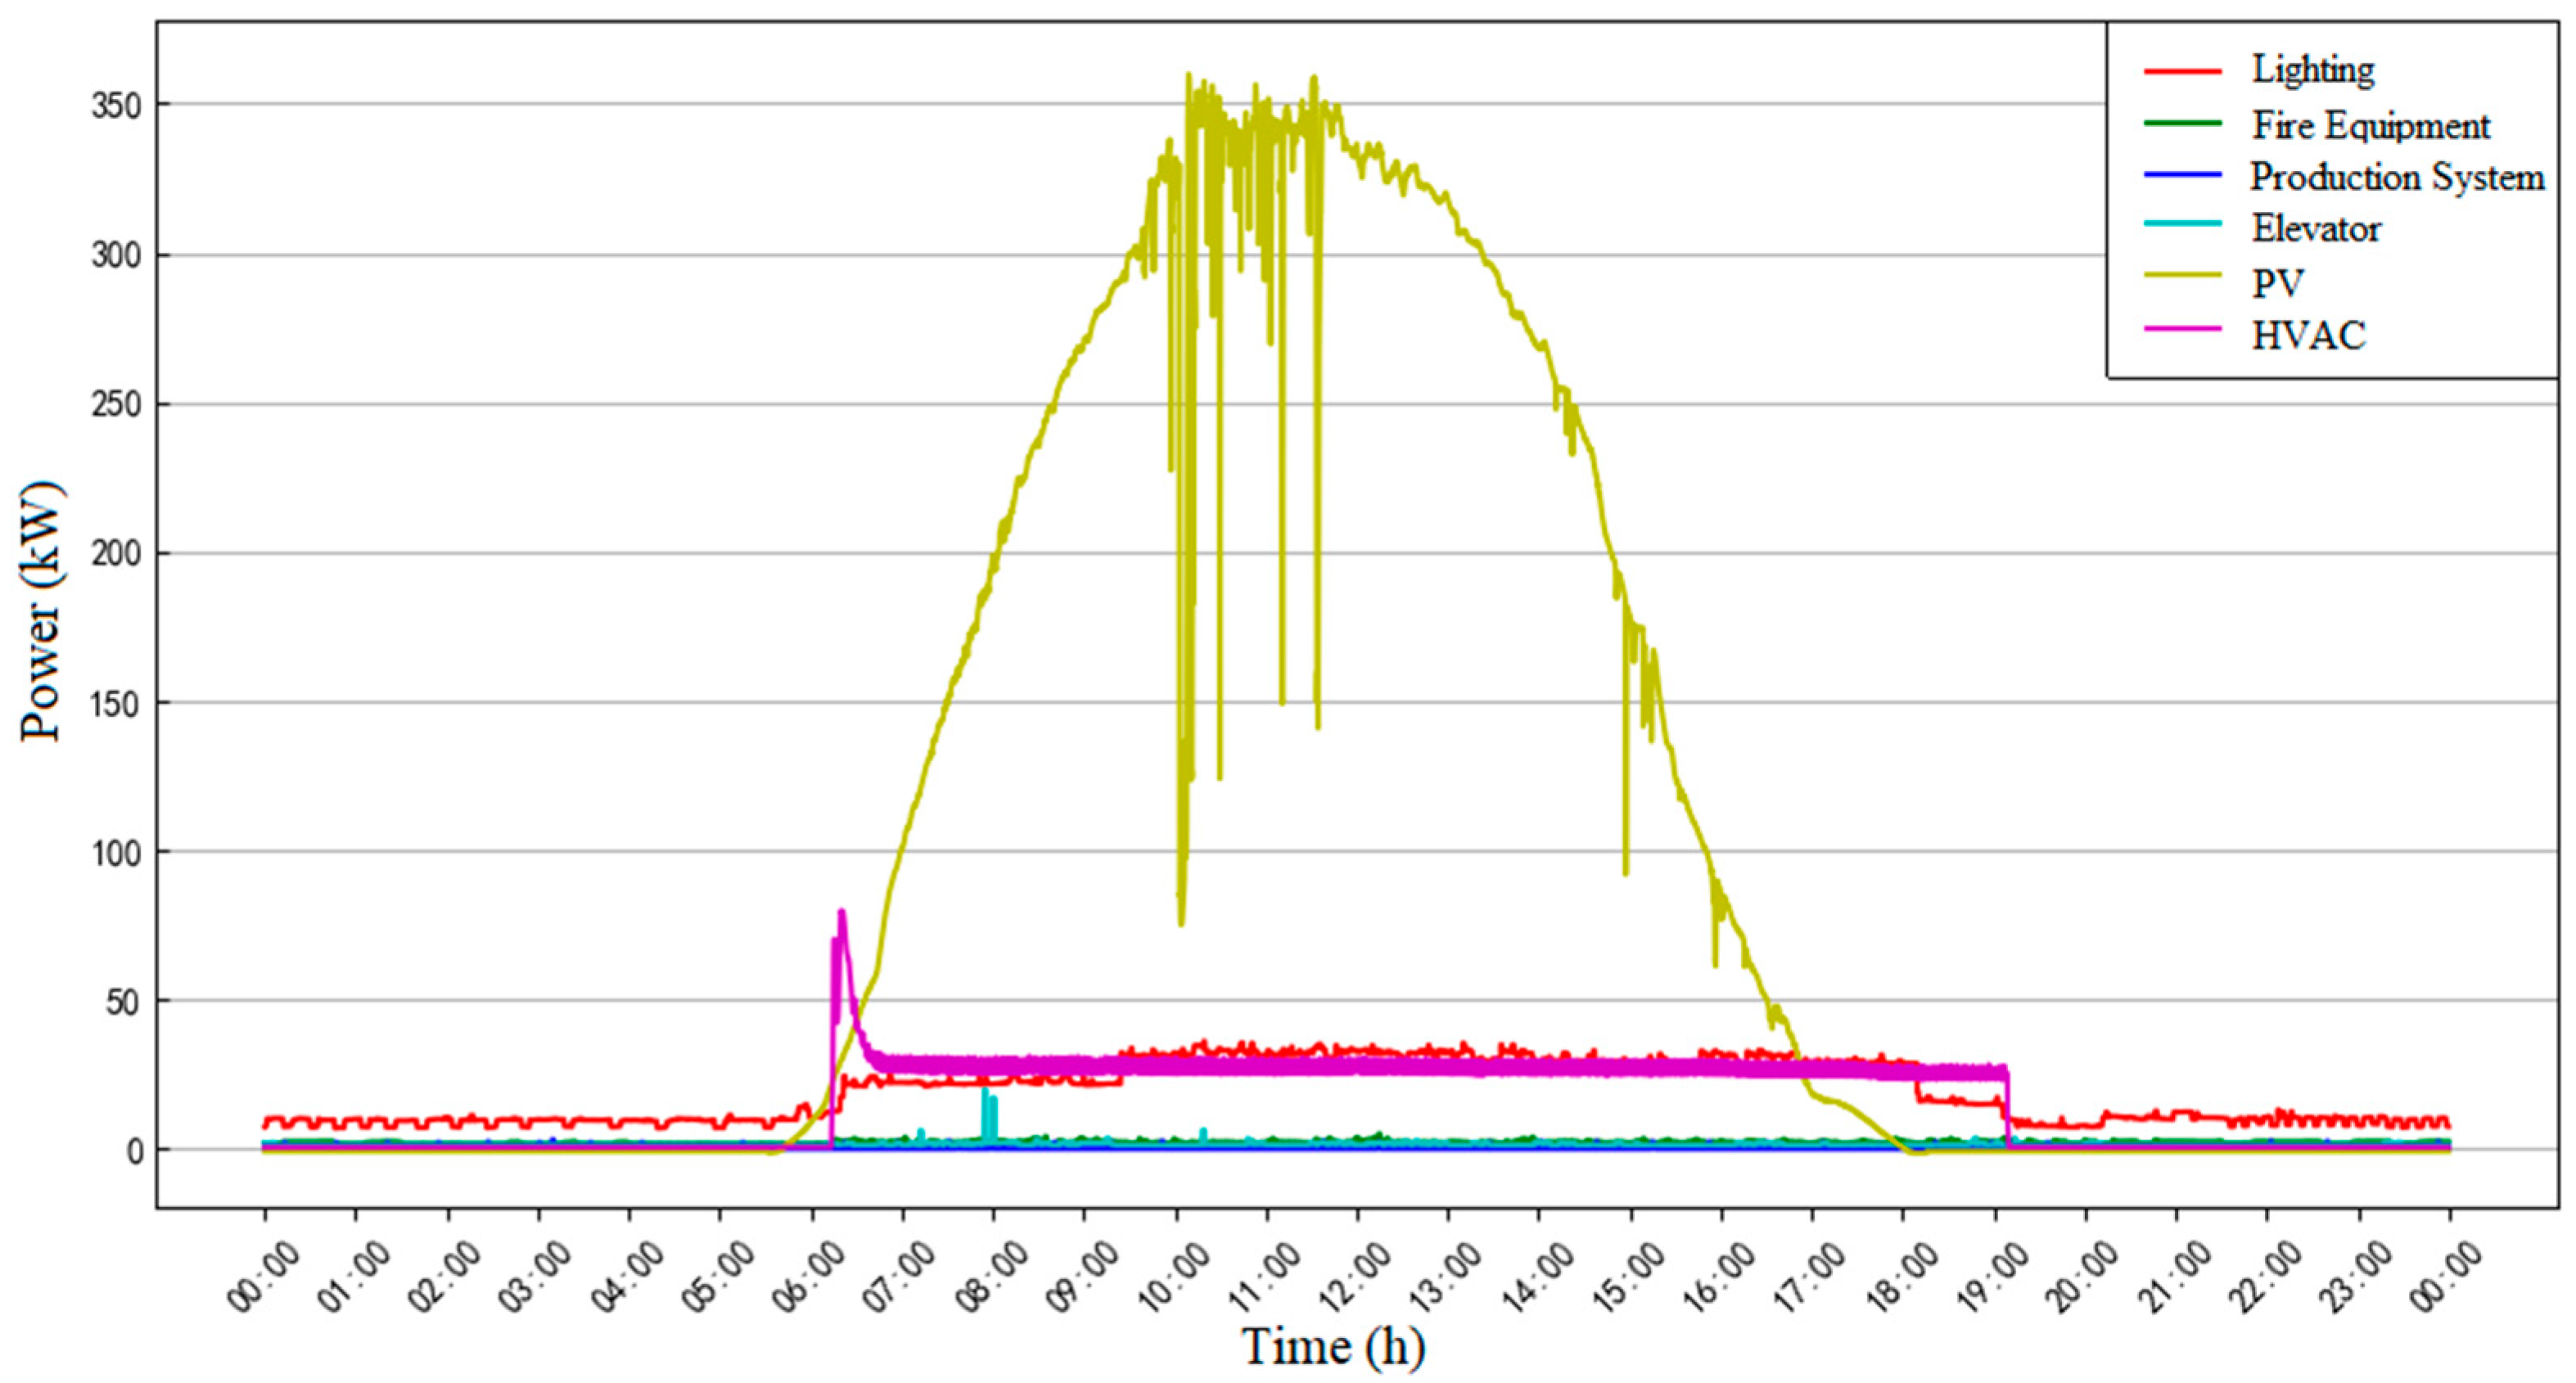
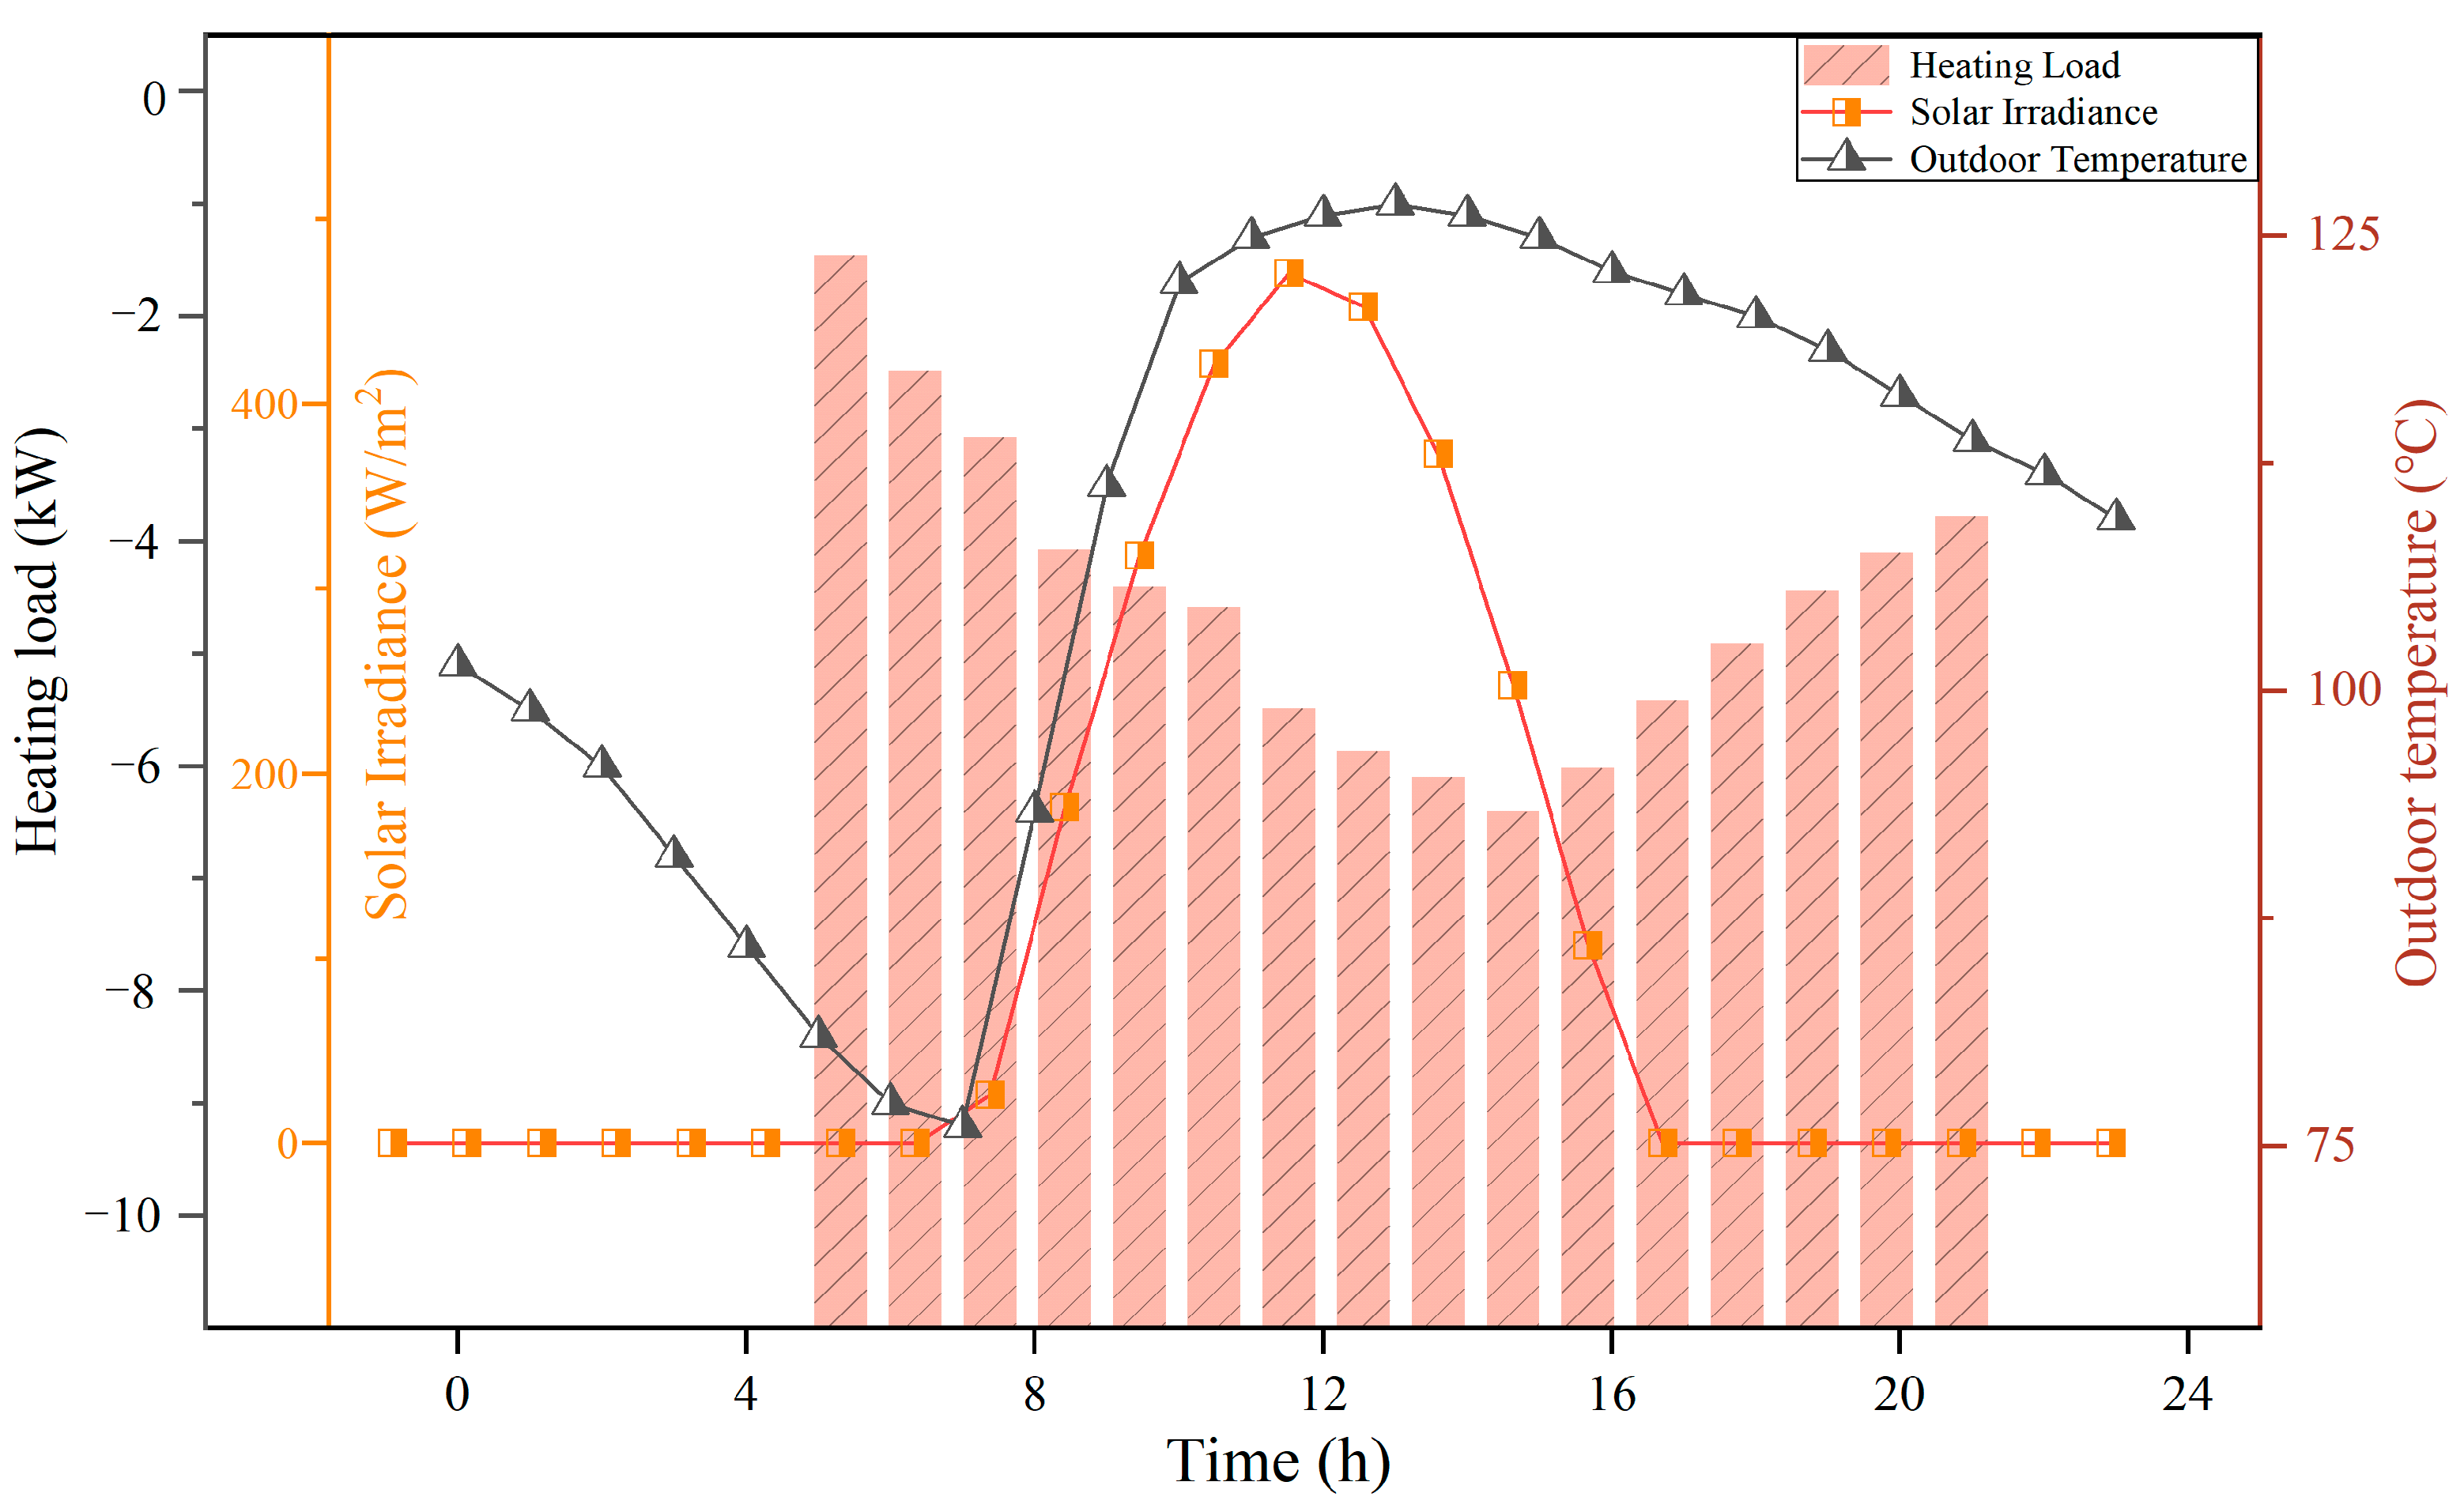
2. Analysis of Power and Load Characteristics

The power generation of a PV array is affected by many factors, such as solar radiation, permanent shading, surface temperature of the panel, and the panel’s tilt angle. The energy consumption of buildings varies depending on the weather conditions, building type, indoor occupants, and operation of equipment. Therefore, the development of an operational strategy for an HVAC system should take into account the characteristics of PV output and energy consumption in buildings. In order to analyze the power and load characteristics of a BIPV system, a typical PV-integrated building was selected as a case study. The building has three floors with a total air-conditioned area of 7000 m2.
The system architecture is demonstrated in Figure 1. On the power side, a 461.54 kW solar PV system is installed on the roof of the building with a tilt angle of 15° facing the south. It can directly supply DC power and AC power to equipment and systems in the building. The utility grid is integrated in the system as a supplement. On the load side, the HVAC for the offices and workshops is provided by a set of fan coil units and a fresh air system fed by magnetic bearing centrifugal chillers and air-to-water heat pumps. The chillers and fan coil units consume electricity directly from the DC bus, while the water pumps and fresh air systems use AC electricity that is converted from DC power. The room temperature setpoint for the heating season is 18 °C. These systems and equipment are scheduled to operate from 6:00 A.M. to 20:00 P.M. The goal of the system is to take full advantage of the PV-generated DC power using the HVAC system while maintaining stable and reliable operation.
Figure 2 presents the photovoltaic generation and load data obtained in July 2023for each piece of building equipment. It can be seen that the energy consumption on weekdays is obviously higher than at the weekends, and the PV power generation is mainly influenced by meteorological factors. The energy consumption of different systems and equipment (HVAC, lighting, and other equipment) are comparably steady, while the PV power generation profile fluctuates due to the unpleasant weather. The daily average energy consumption for HVAC and lighting are 1102.85 kWh and 583.22 kWh, respectively, during the investigated week. The daily average electricity generated by the PV system is 2123.43 kWh, which is adequate for the demand side when the weather is fine (expect for Tuesday). The mismatch values between PV generation and load-side electricity consumption are shown in Figure 3. On weekdays when the weather is fine, there is almost no gap between the supply and demand. The mismatch between the PV generation and user electricity consumption is on average 1.25%, and the shortage can be made up by the utility grid. During weekends when the solar radiation is sufficient, the PV system can generate more electricity than the demand, which can be stored by energy storage systems. It should be noticed that on Tuesdays, the difference between supply and demand can be as high as −188.90% due to the bad weather.
Figure 4 shows the power supply profiles of the building on a weekday during the cooling season. It can be seen that there is an obvious rise in electricity provided by the grid at 6:00 A.M. Due to the weak solar radiation, the PV system cannot generate adequate electricity, and thus the grid needs to make up for it and supply enough power for the crowds flooding into the building during morning rush hours. The leading role of the grid lasts about one hour until nearly 7:00 A.M., when the PV system can provide enough electricity. During 7:00 A.M. to 16:00 P.M., the electricity consumed by the building is mostly provided by the PV system. The trend in the generated electricity profile is similar to the variation in daily solar radiation, and the peak value occurs at 11:30 A.M. During this PV-dominant period, there are some fluctuations in PV-generated electricity despite the electricity supply to the building remaining steady. The PV- and grid-generated electricity profiles are almost symmetrical, and together meet the building’s demand-side electricity with a stable value of 180 kW. The PV power generation is higher than the grid supply power by about 8.23%, which indicates that the PV power is the main electricity source of the building. After 16:00 P.M., the grid power supply gradually takes the lead due to the decrease in solar radiation. The systems and equipment in the building are turned off at 20:00 P.M. and consume little energy afterwards.
Figure 5 shows the daily sub-metering PV electricity generation and building electricity consumption profiles. In general, the PV power generation profile exhibits a quadratic trend, but experiences significant fluctuations from 7:00 A.M. to 11:00 A.M. due to the varied weather conditions. The maximum difference between the maximum and minimum PV power values reaches 260 kW, which poses a significant challenge to the safety and stability of the equipment in the building. In terms of electricity consumption, apart from the HVAC system, the trends in electricity consumption of other equipment and systems remain relatively constant. The mismatch between the supply and demand sides is obvious, including the four stages, as indicated below.
During 6:00–6:30 A.M., most of the equipment in the building is turned on, and the HVAC system starts to work at its maximum capacity. In the meanwhile, the building’s cooling load increases significantly due to the influx of occupants. However, the photovoltaic system cannot generate adequate electricity since the solar radiation is not strong enough in the early morning. This mismatch between the extensive energy demand and low PV power generation needs to be optimized. During 10:00 A.M.–14:00 P.M., the amount of PV power generation peaks. The interference rate of PV power generation can reach 71.43%, which may result in a PV power abandonment problem. Between 16:00 P.M. and 20:00 P.M., the solar radiation gradually reduces, resulting in a significant difference between the electricity demand of the HVAC system and the actual PV power generation. Therefore, the power grid needs to supply the electricity for the demand side, which may lead to fluctuation problems. After 20:00 P.M., most of the equipment in the building is turned off. Although there are minimal thermal comfort requirements, the building still requires a certain amount of electricity to maintain its basic functionality for lighting, fire safety, and elevator equipment.
The above analysis of PV power generation and demand-side energy consumption provides references for setting up the input parameters.

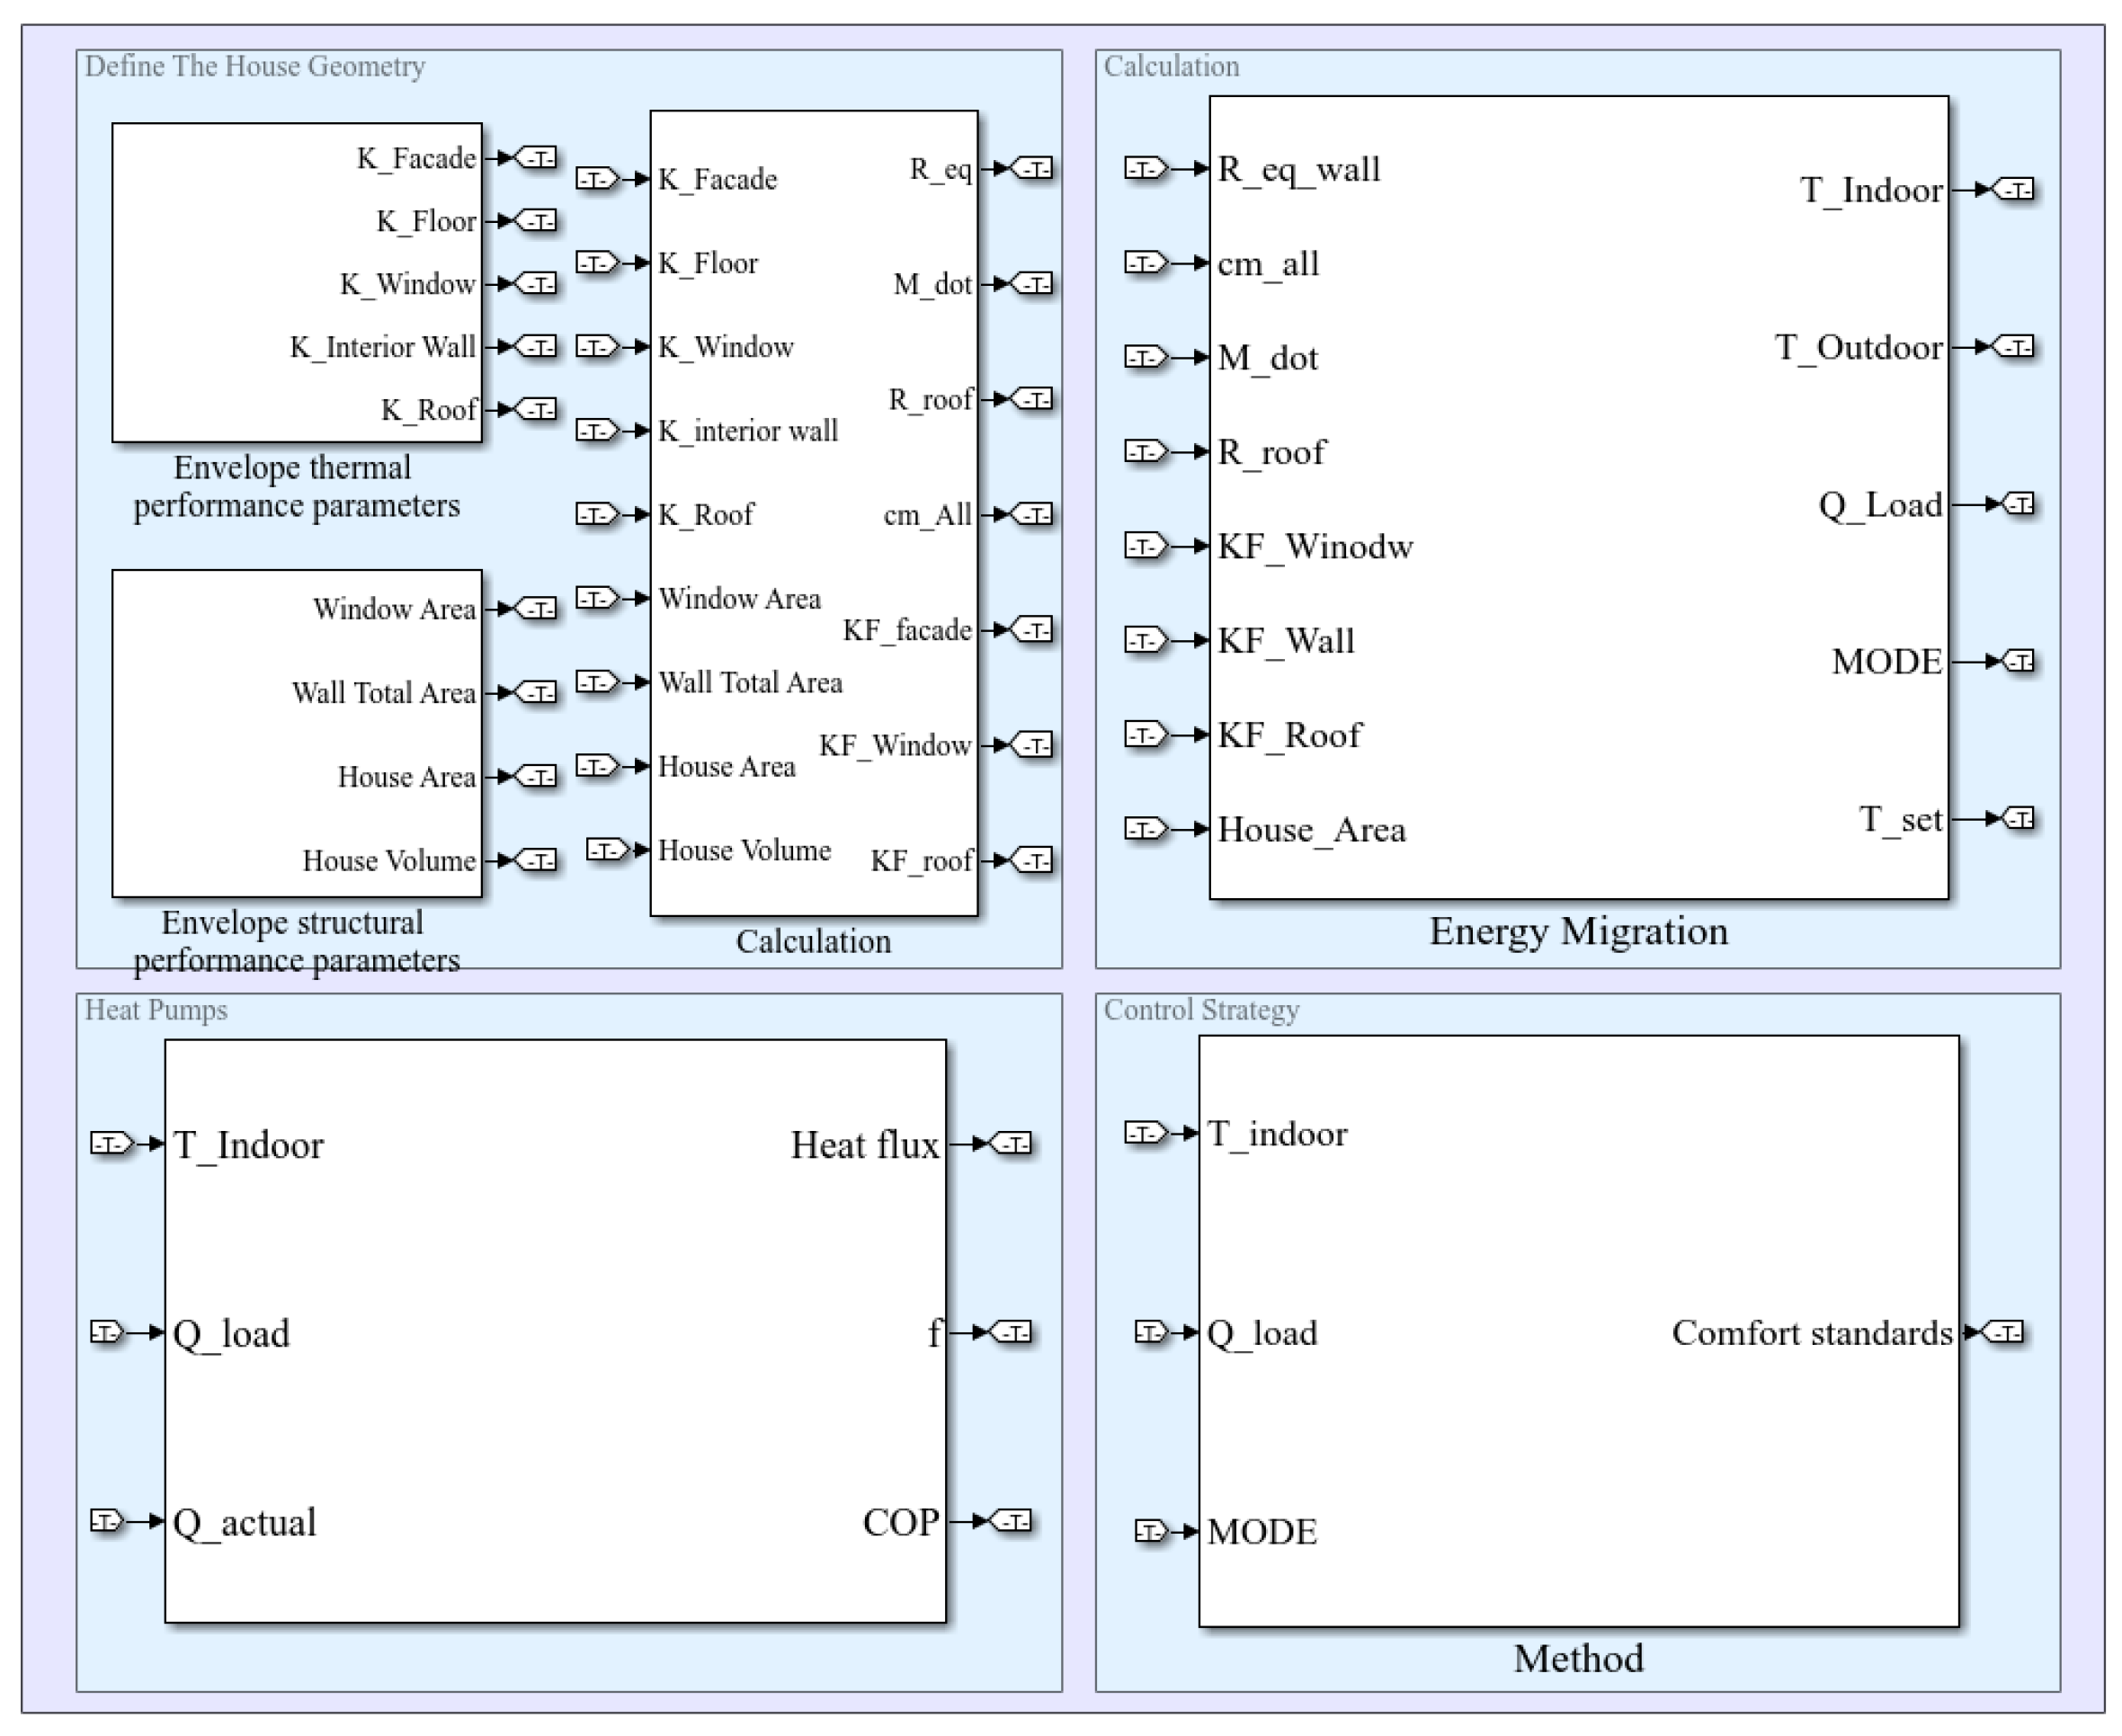
3. System Design and Modeling

A reference building situated in Shanghai serves as the building model, and its standard floor layout is depicted in Figure 6. The building has three floors above the ground and one floor underground for a total area of 2026 m2, accommodating functionality of office spaces and conference rooms. In order to mitigate the mismatch problems between supply and demand, the system demonstrated in Figure 7 was proposed. Rooftop PV arrays and an energy storage water tank are utilized in the building. The PV system, batteries, and chargers are connected to the DC bus. A DC inverter heat pump is used with the compressor, which is able to adjust its frequency and power according to the power supply voltage. The operation time for the HVAC system is 8:00 A.M.–18:00 P.M. The building model was developed in SketchUp and its envelope structure was then imported into EnergyPlus (8.9.0). Simulations were conducted to assess the heating load in winter. The input weather data adopted the typical meteorological year data of Shanghai. The indoor and outdoor environmental parameters were set up as shown in Table 1.

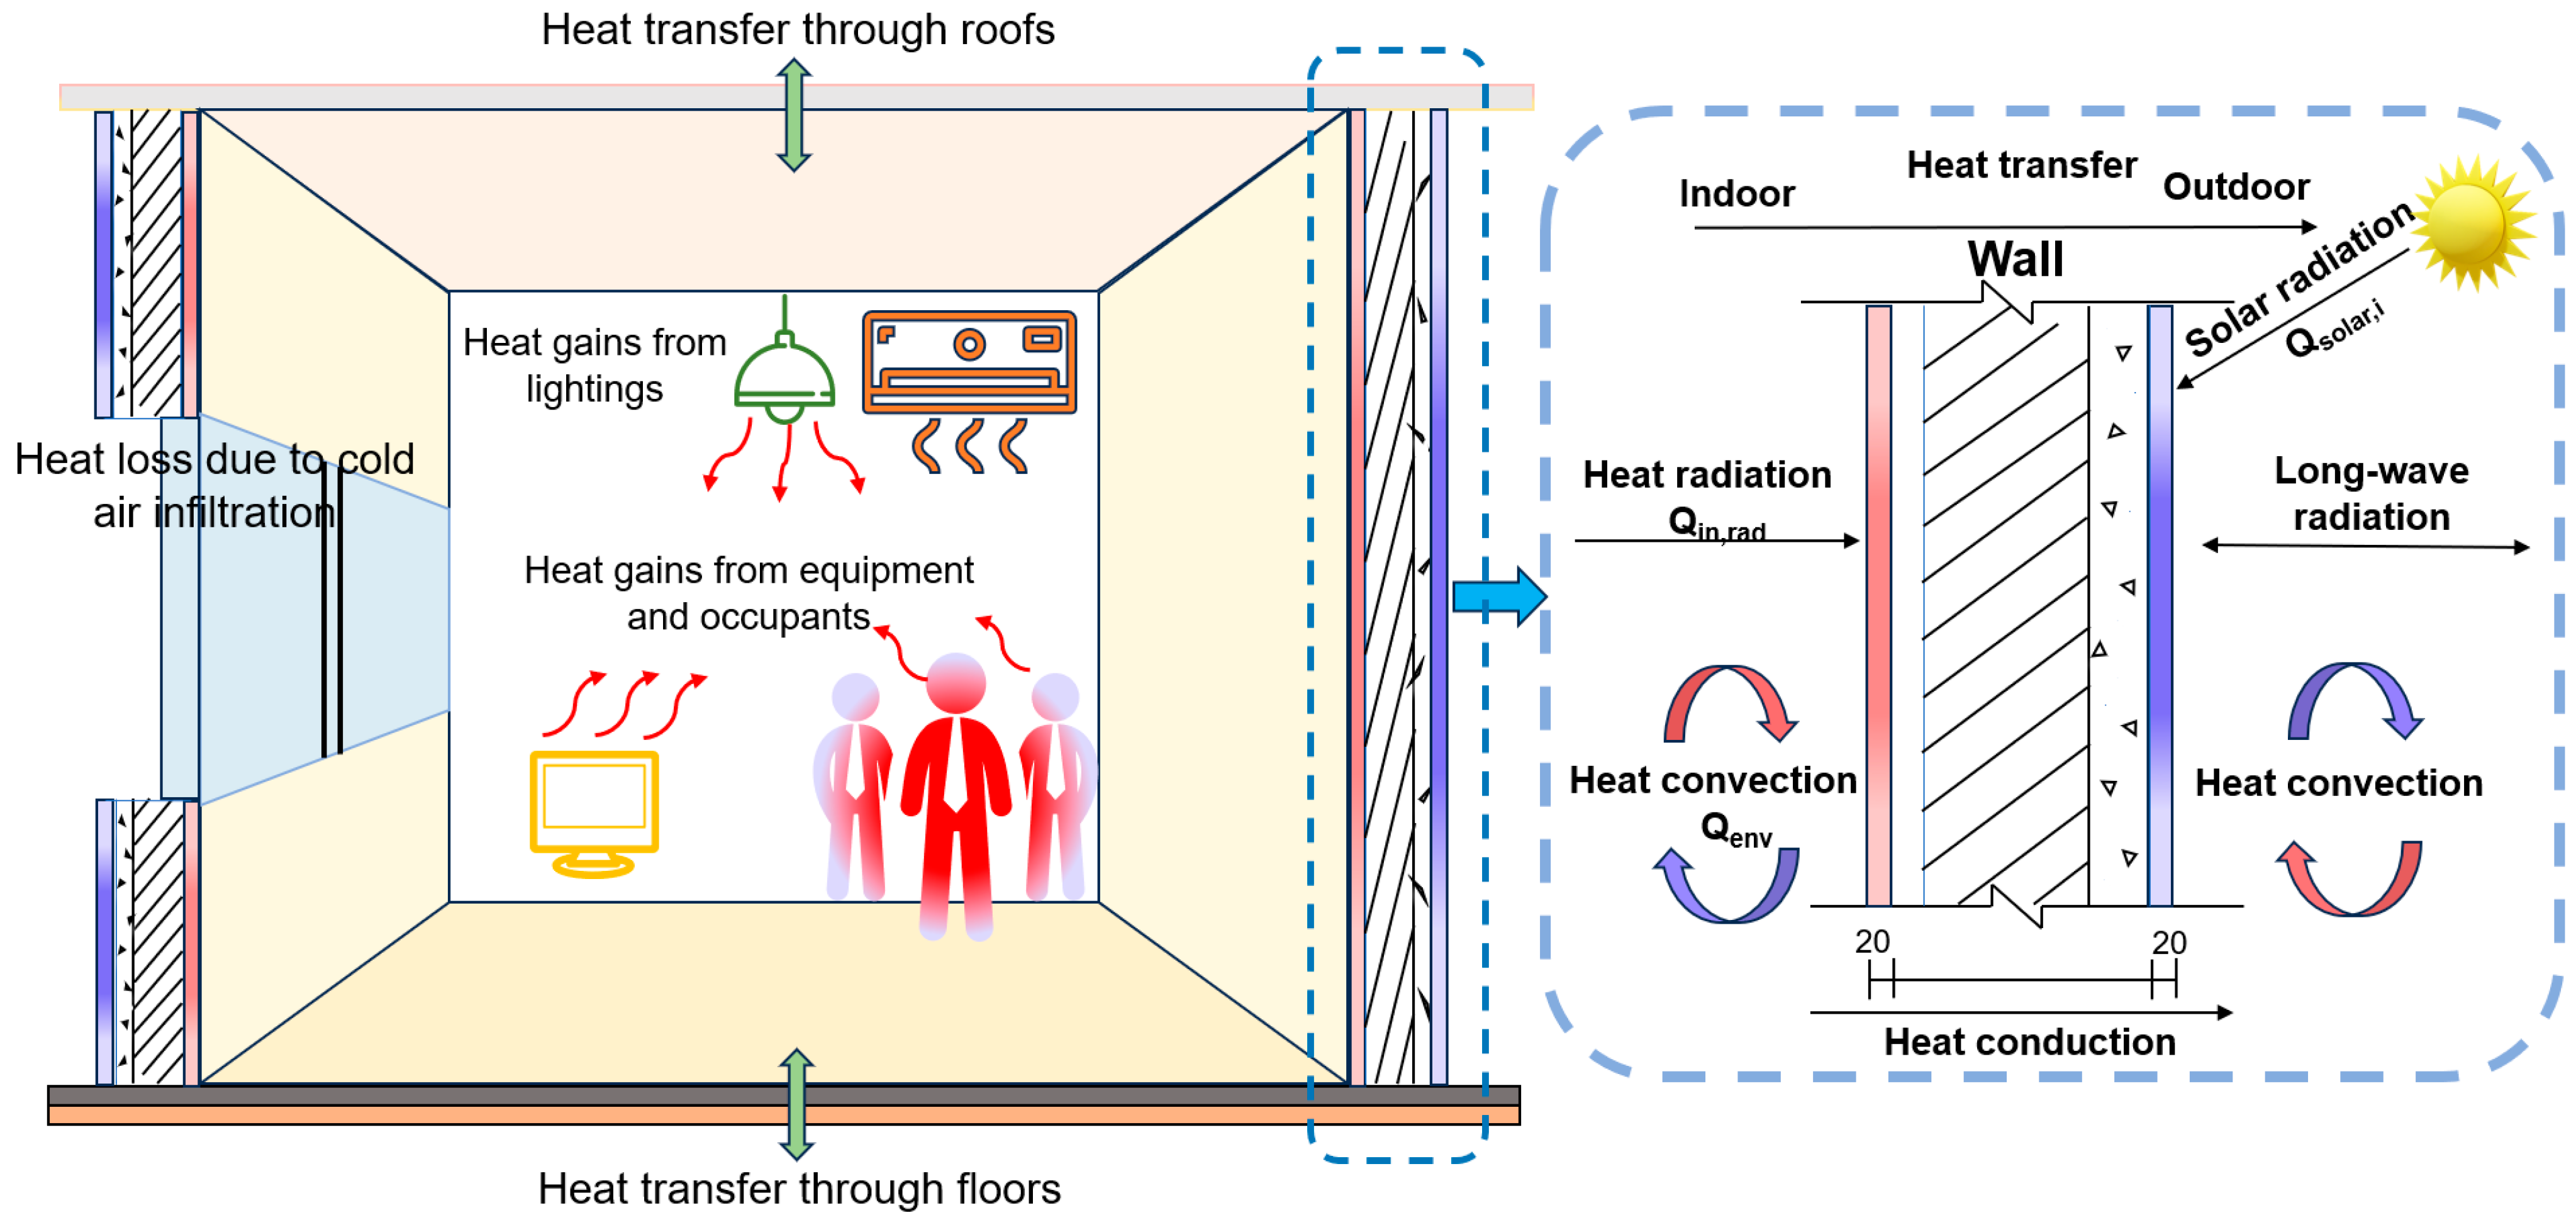
3.1. Heat Transfer Model of the Building

As shown in Figure 8, the internal heat transfer process in the building is an unsteady process involving conduction, convection, and radiation. The ambient temperature and indoor air temperature are expressed as the lumped temperature of a node. The following assumptions were made before the heat transfer model was established.
  • The heat transfer is in a one-dimensional direction.
  • The indoor air is incompressible and homogeneous, and the influence of the indoor temperature on the air density is neglected.
  • The air infiltration in the building is neglected.
  • The external heat absorbed by the building can be absorbed uniformly by the building envelope without a reflection effect.
  • The thermal storage and release from furniture and walls are neglected.
According to the law of conservation of energy, the heat transfer model of an air-conditioned room can be expressed as Equation (1) [37]:
d Q d t = T h e a t e r T r o o m M d o t c
where d Q d t represents the heat flow from the heater into the room; c is the constant specific heat capacity of air, J/(kg·k); M d o t is the hot air from heater, k g / h ; T h e a t e r is the heater air supply temperature, °C; and T r o o m is the real-time room temperature, °C:
d Q d t l o s s e s = T r o o m T o u t R e q
d T r o o m d t = 1 M a i r c d Q h e a t e r d t d Q l o s s e s d t
where M a i r is the room air quality, kg, and R e q is the room equivalent thermal resistance, K / W .

3.2. DC Heat Pump Modeling

The DC inverter heat pump consists of a compressor, condenser, expansion valve, and evaporator. The heat transfer process of each component of the heat pump is one-dimensional, steady state, and insulated. As demonstrated in Figure 9, the DC power supply is directly connected to the DC inverter heat pump. The power of the compressor is regulated by voltage fluctuations within a range of 300 V to 800 V.
The key to modeling the compressor is to establish the relationship between refrigerant flow rate and frequency of the compressor, which can be described by a fitting curve provided by the manufacturer, derived as shown in Equations (4)–(6) [38]. As expressed in Equations (7)–(10), the water-side heat exchange Qw of the condenser is equal to the heat exchange Qrc of the refrigerant side. The expansion valve regulates and reduces the pressure of the high-temperature refrigerant after it is condensed in the condenser. The mass flow rate of refrigerant through the expansion valve can be expressed by Equation (11) [39]:
W c o m = m c o m h d i s h s u c
h d i s = h d i s , i s h s u c η i s + h s u c
m ˙ c o m = 13.59 f c o m + 53.52
where m c o m is the refrigerant flow, kg/s; W c o m is the compressor heating capacity, kW; h d i s is the specific enthalpy of the refrigerant at the compressor outlet; h s u c is the specific enthalpy of the refrigerant at the suction port of the compressor, kJ/kg; h d i s , i s is the ideal specific enthalpy of the refrigerant at the compressor discharge port under isentropic compression conditions, kJ/kg; η i s is the entropic efficiency of the compressor; and f c o m is the compressor frequency, Hz.
Q w = c w m w t c w , i n t c w , o u t
where Q w represents the water-side heat exchange, kW; c w is the specific heat capacity of water at constant pressure, J/(kg·°C); m w is the water mass flow, kg/h; t c w , i n is the cooling water inlet temperature, °C; and t c w , o u t is the cooling water outlet temperature, °C.
Q r c = K c A c Δ t c = m r h c o n , i n h c o n , o u t
where Q r c represents the heat exchange heat on the refrigerant side, kW; K c is the convection heat transfer coefficient on the condenser side, W/(m2·°C); A c is the total heat exchange area of the condenser, m2; h c o n , i n is the specific enthalpy of the refrigerant at the condenser inlet, kJ/kg; h c o n , o u t is the specific enthalpy of the refrigerant at the condenser outlet, kJ/kg; and Δ t c is the heat exchange temperature on the condenser side, °C.
The heat exchange temperature on the condenser side is calculated by Equation (9):
Δ t c = t c t c w , i n + t c w , o u t 2
where t c is the condensation temperature, °C; t c w , i n is the cooling water inlet temperature, °C; and t c w , o u t is the cooling water outlet temperature, °C.
The heat transfer balance on the condenser side is:
Q w = Q r c
m e x = A e x C e x 2 ρ e x , i n P e x , i n P e x , o u t
where C e x is the flow coefficient of the expansion valve provided by the manufacturer; ρ e x , i n is the refrigerant density at the valve inlet, kg/m3; P e x , i n and P e x , o u t are the expansion valve inlet and outlet pressure, respectively, kJ; and A e x is the effective passage flow area of the expansion valve, m2.
In this study, four DC inverter heat pumps were used for heating. The setup of these is demonstrated in Table 2.

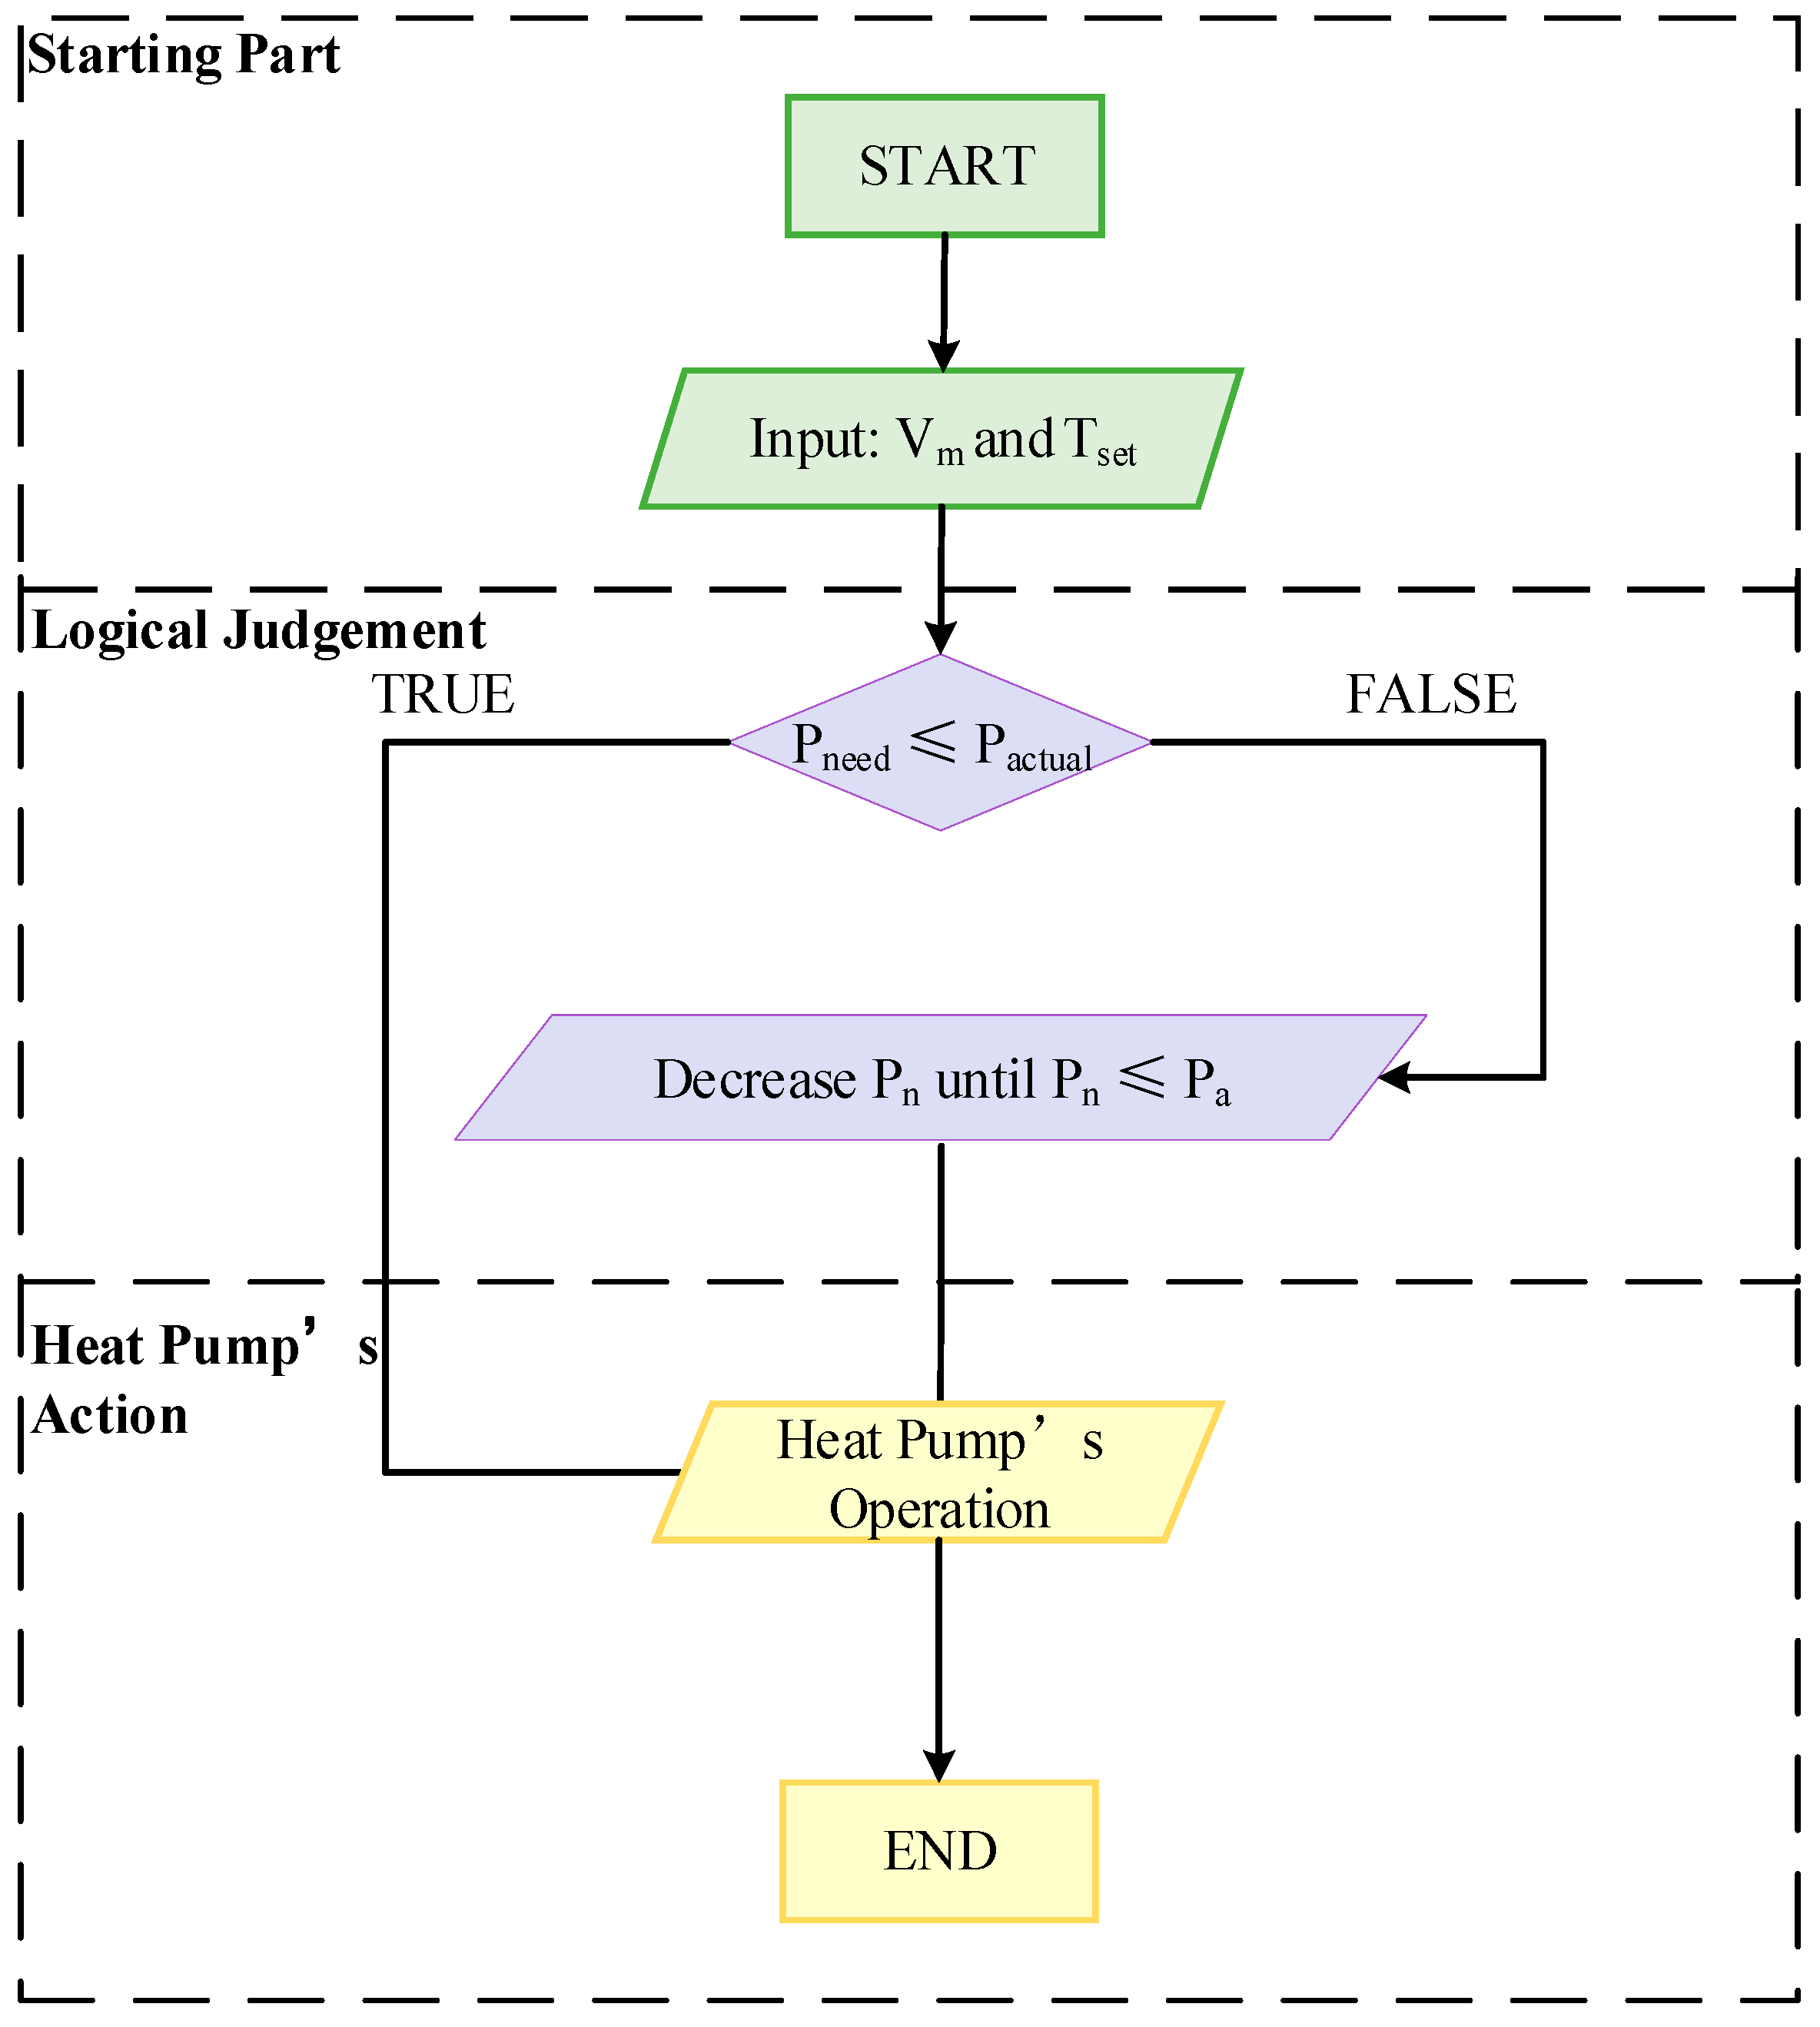
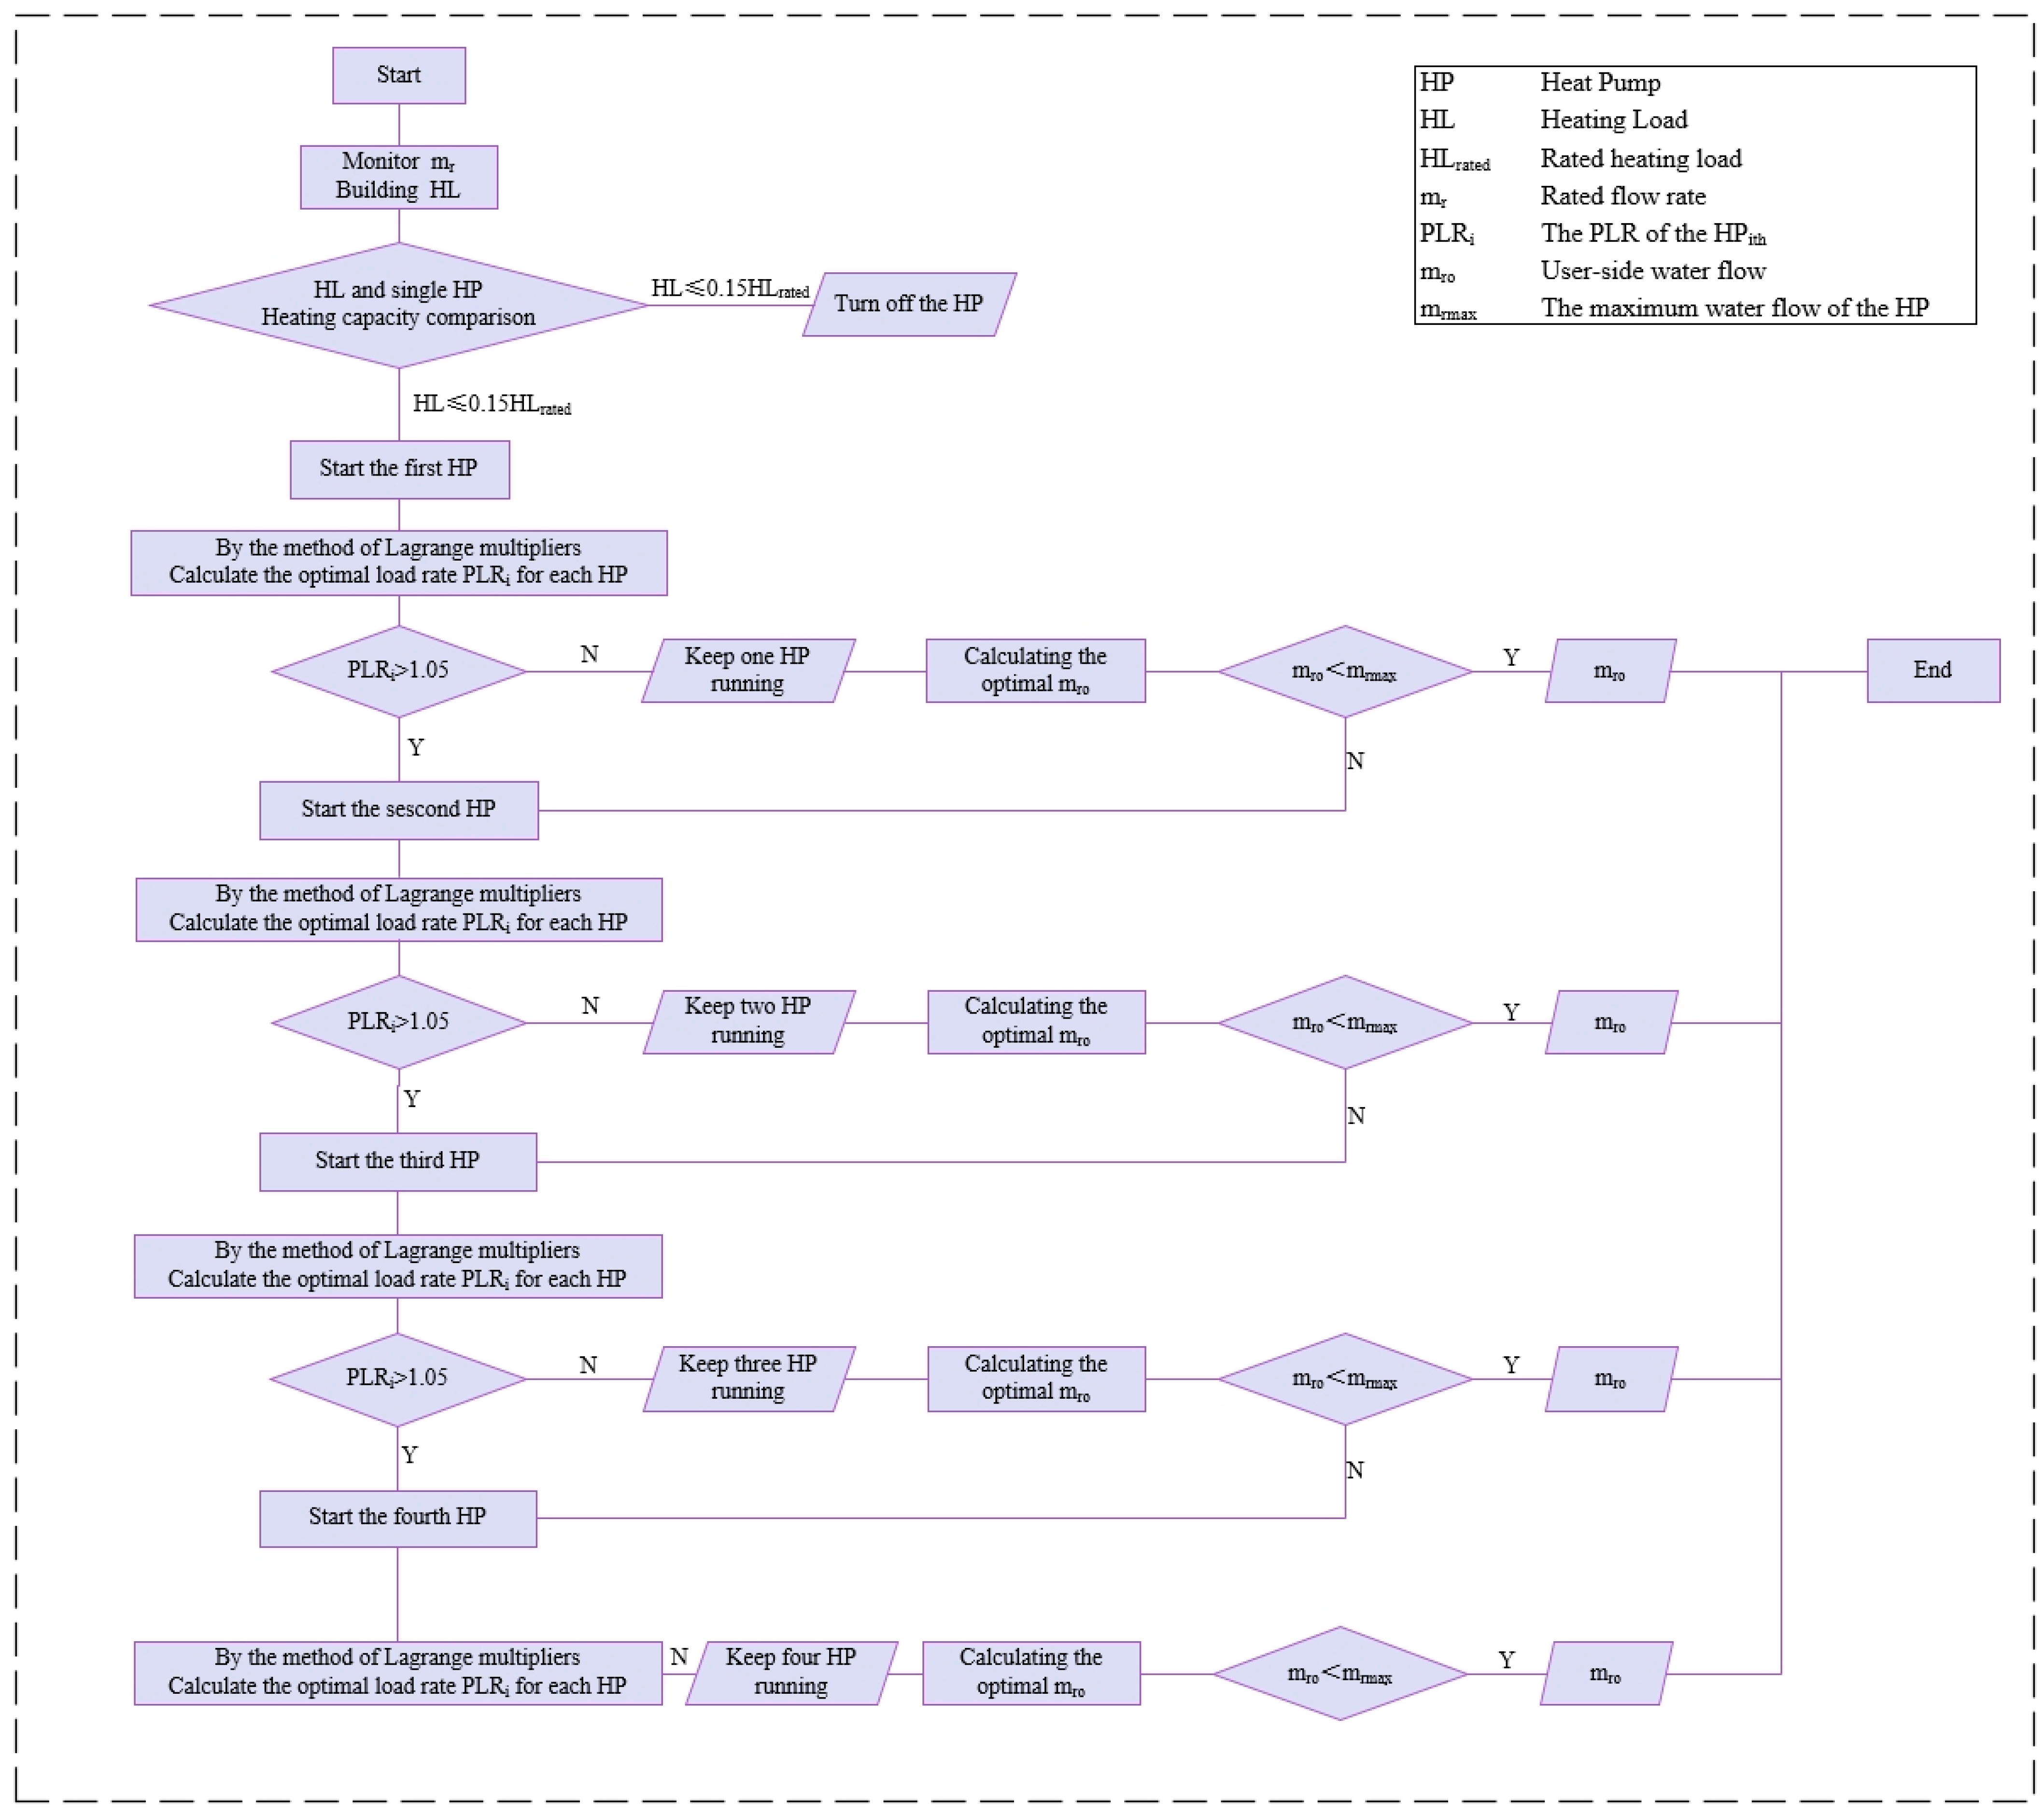
3.3. Control Strategy for Heat Pump

The traditional control methods of heat pumps include sequential control of multiple heat pumps, control of return water temperature, and control of water flow rate. In this study, the control strategy of the DC inverter heat pumps depends on both DC bus voltage and the indoor temperature setup, as shown in Figure 10. When the DC bus voltage exceeds the setpoint, the compressor operates at a higher frequency and stores the excess energy in the envelope. When the voltage falls below the setpoint, the compressor operates at a lower frequency and discharges the insufficient energy from the envelope to meet the user demand. The heating/cooling load of the building is calculated by using the indoor temperature, which determines the theoretical power value of the heat pump. When the theoretical power value Pneed is lower than the actual power value Pactual, the heat pump should be operated at the theoretical power value. If the theoretical power value Pneed is higher than the actual power value Pactual, the power of the heat pump should be decreased until the actual power value is lower than the theoretical power value.
The sequence control method for the heat pumps is presented in Figure 11. The heating load is calculated by using monitored return water temperature and the mass flow rate of the water. The sequence of heat pumps is determined by the actual heating load and the optimal load rate for each heat pump. When the actual heating load is lower than 0.15 times of the rated heating load, the heat pump system should be turned off. If the heating load is higher than 0.15 times of the rated heating load, one heat pump will be turned on. When a single heat pump is not capable of providing adequate heat for the building, the second heat pump should be turned on. The process will be continued until enough heat can be provided to the building.
Based on the developed models, MATLAB/Simulink was utilized for simulation, and the developed model is presented in Figure 12.

3.4. Setup of Supply and Demand Sides

The supply-side input parameter is mainly DC bus voltage, and the demand-side input parameters include ambient and indoor environmental conditions.
The DC bus voltage in the range of 80–107% of the rated voltage can be regarded as the working bus voltage for the heat pump system. The heat pump can achieve an optimal performance when the bus voltage is within 90–105% of the rated voltage. When the bus voltage is within 80–90% or 105–107% of the rated voltage, the heat pump should operate at reduced frequency. For safety, the heat pump should be shut down when the bus voltage is lower than 80% or higher than 105% of the rated voltage [40]. Figure 13 shows the profile of building supply power on a typical day. The DC bus voltage during the time period of 13:00–14:00 was selected as the worst operating condition to set the DC bus voltage corresponding to the normal operating voltage range (596–636 V) of the equipment. The variation in input DC bus voltage is presented in Figure 14.
The setup for an ambient environment utilized typical year weather data in EnergyPlus software. Figure 15 demonstrates the hourly ambient temperature, solar radiation intensity, and the simulated heating load of the reference building on a typical winter day. The daily average ambient temperature was −3.99 °C, while the average solar radiation during daytime was 471 W/m2. The heating load of the day peaked at 6:00 A.M., with a peak value of 123.95 kW due to the low solar radiation and the large temperature difference between indoor and ambient temperature.
The setup values for the supply and demand sides of the simulation model are presented in Table 3. Three working conditions were simulated: transfinite mode, normal mode, and energy-saving mode. When the DC bus voltage (Vm) is within the range of 596–606 V, the supply power is insufficient, and thus the indoor temperature can be operated at a lower value (18 °C) to save energy. When the DC bus voltage is within the range of 606–626 V, the energy supply is normal, and thus the indoor temperature can be operated at a medium level (21 °C). When the DC bus voltage is in the range of 626–636 V, the power supply is abundant, and the indoor temperature can be operated at a higher value (24 °C) and the excess heat can be stored in the building envelope. The range of indoor temperatures (18–24 °C) is based on the comfortable thermal value in GB50736-2016. The comfortable levels are identified as Class I (22 °C ≤ t < 24 °C) and Class II (18 ≤ t < 22 °C).

4. Results and Discussion

The daily variations in DC bus voltage, the corresponding power of the heat pumps, and outdoor and indoor temperature are demonstrated in Figure 16. Three typical change processes are analyzed: process A (normal to low), process B (low to normal), and process C (normal to high), and the detailed change points are depicted in Table 4.
As shown in Figure 16, when the DC bus voltage drops from 616 V to about 595 V at change point A1, the outdoor temperature increases gradually. The joint effect of reduced DC bus voltage and outdoor temperature results in a lowered set temperature of 18 °C. Thus, the power of the heat pump is reduced from 23.97 kW (at A2 9:31 A.M.) to 21.07 kW (at A3 9:46 A.M.), taking 21 min in total.
At point B1, the DC bus voltage increases from 595 V to 616 V. During this period of time, the outdoor temperature remains relatively constant. To fully utilize the building’s heat storage effect and prevent sudden increases in electricity consumption, the indoor temperature is raised from 18 °C to 21 °C. The power of the heat pumps is increased from 19.26 kW to 21.97 kW (the increase in DC bus voltage and the constant HL resulting in HP compressors that can be operated in normal mode). It took 6 min for the heat pumps to respond to the temperature change (at B1 10:36 A.M.) at the response startup point B2 (10:42 A.M.), and the response completion point was at 10:56 A.M. (B3).
At point C1, the DC bus voltage has increased to nearly the upper limit of the HPs’ operating range, which is 636 V. To absorb the excess photovoltaic resources, the indoor temperature has been set to from 21 °C to 24 °C. Therefore, the power of the HPs is increased from 21.97 kW to 22.88 kW (the increase in DC bus voltage and the HL resulted in HP compressors that can be operated at higher power). The initial response time was at 14:02 (C1), and the HPs’ actual change occurred at 14:08 (C2). The final actual response was at 14:13 (C3), which took 6 and 5 min, respectively.
To sum up, the average startup time for the heat pumps’ response to the DC bus voltage for the three processes is 6 min. The average response time of the first two response times is 14.5 min, and the deviation of the third response time of 5 min is 65.52%. This is because during the third response time, the outdoor irradiance is relatively sufficient, which shortens the time for the indoor temperature to reach the set value.
Figure 17a shows the simulation results of the HP standby time based on comfort criteria. The HP employs a startup and standby control strategy, adjusting its operating status based on ambient temperature changes to meet the user thermal comfort requirements. By initiating the HP before 8:00 and utilizing the building’s heat storage characteristics, the excess heat is stored within the building in advance. Once indoor temperature rises, the HP is turned off, relying on the residual heat in the building to meet the users’ heating needs, which greatly reduces the unit operating costs. Figure 17b shows the standby time deviation results of Class I/II comfort criteria, indicating a downward trend with deviation values ranging from 20% to 30%. Expanding the setting range of room temperature can significantly affect the allowable standby time of HPs, which is highly sensitive to changes in indoor heat load. The smaller the heat load demand, the longer the standby time can last.

5. Conclusions

This paper investigates the operational strategy of DC inverter heat pumps in a building integrated with a PV system. Both the PV system and utility grid were utilized for power supply. A flexible control method for DC inverter heat pumps considering varied DC bus voltage and room temperature proposed. Models of a reference building with the DC inverter heat pump were developed and simulated in MATLAB/Simulink software. The results show that the proposed strategy can achieve stable operation of a DC inverter heat pump while maintaining thermal comfort in the indoor environment under the fluctuating DC bus voltage. The specific conclusions are as follows.
(1)
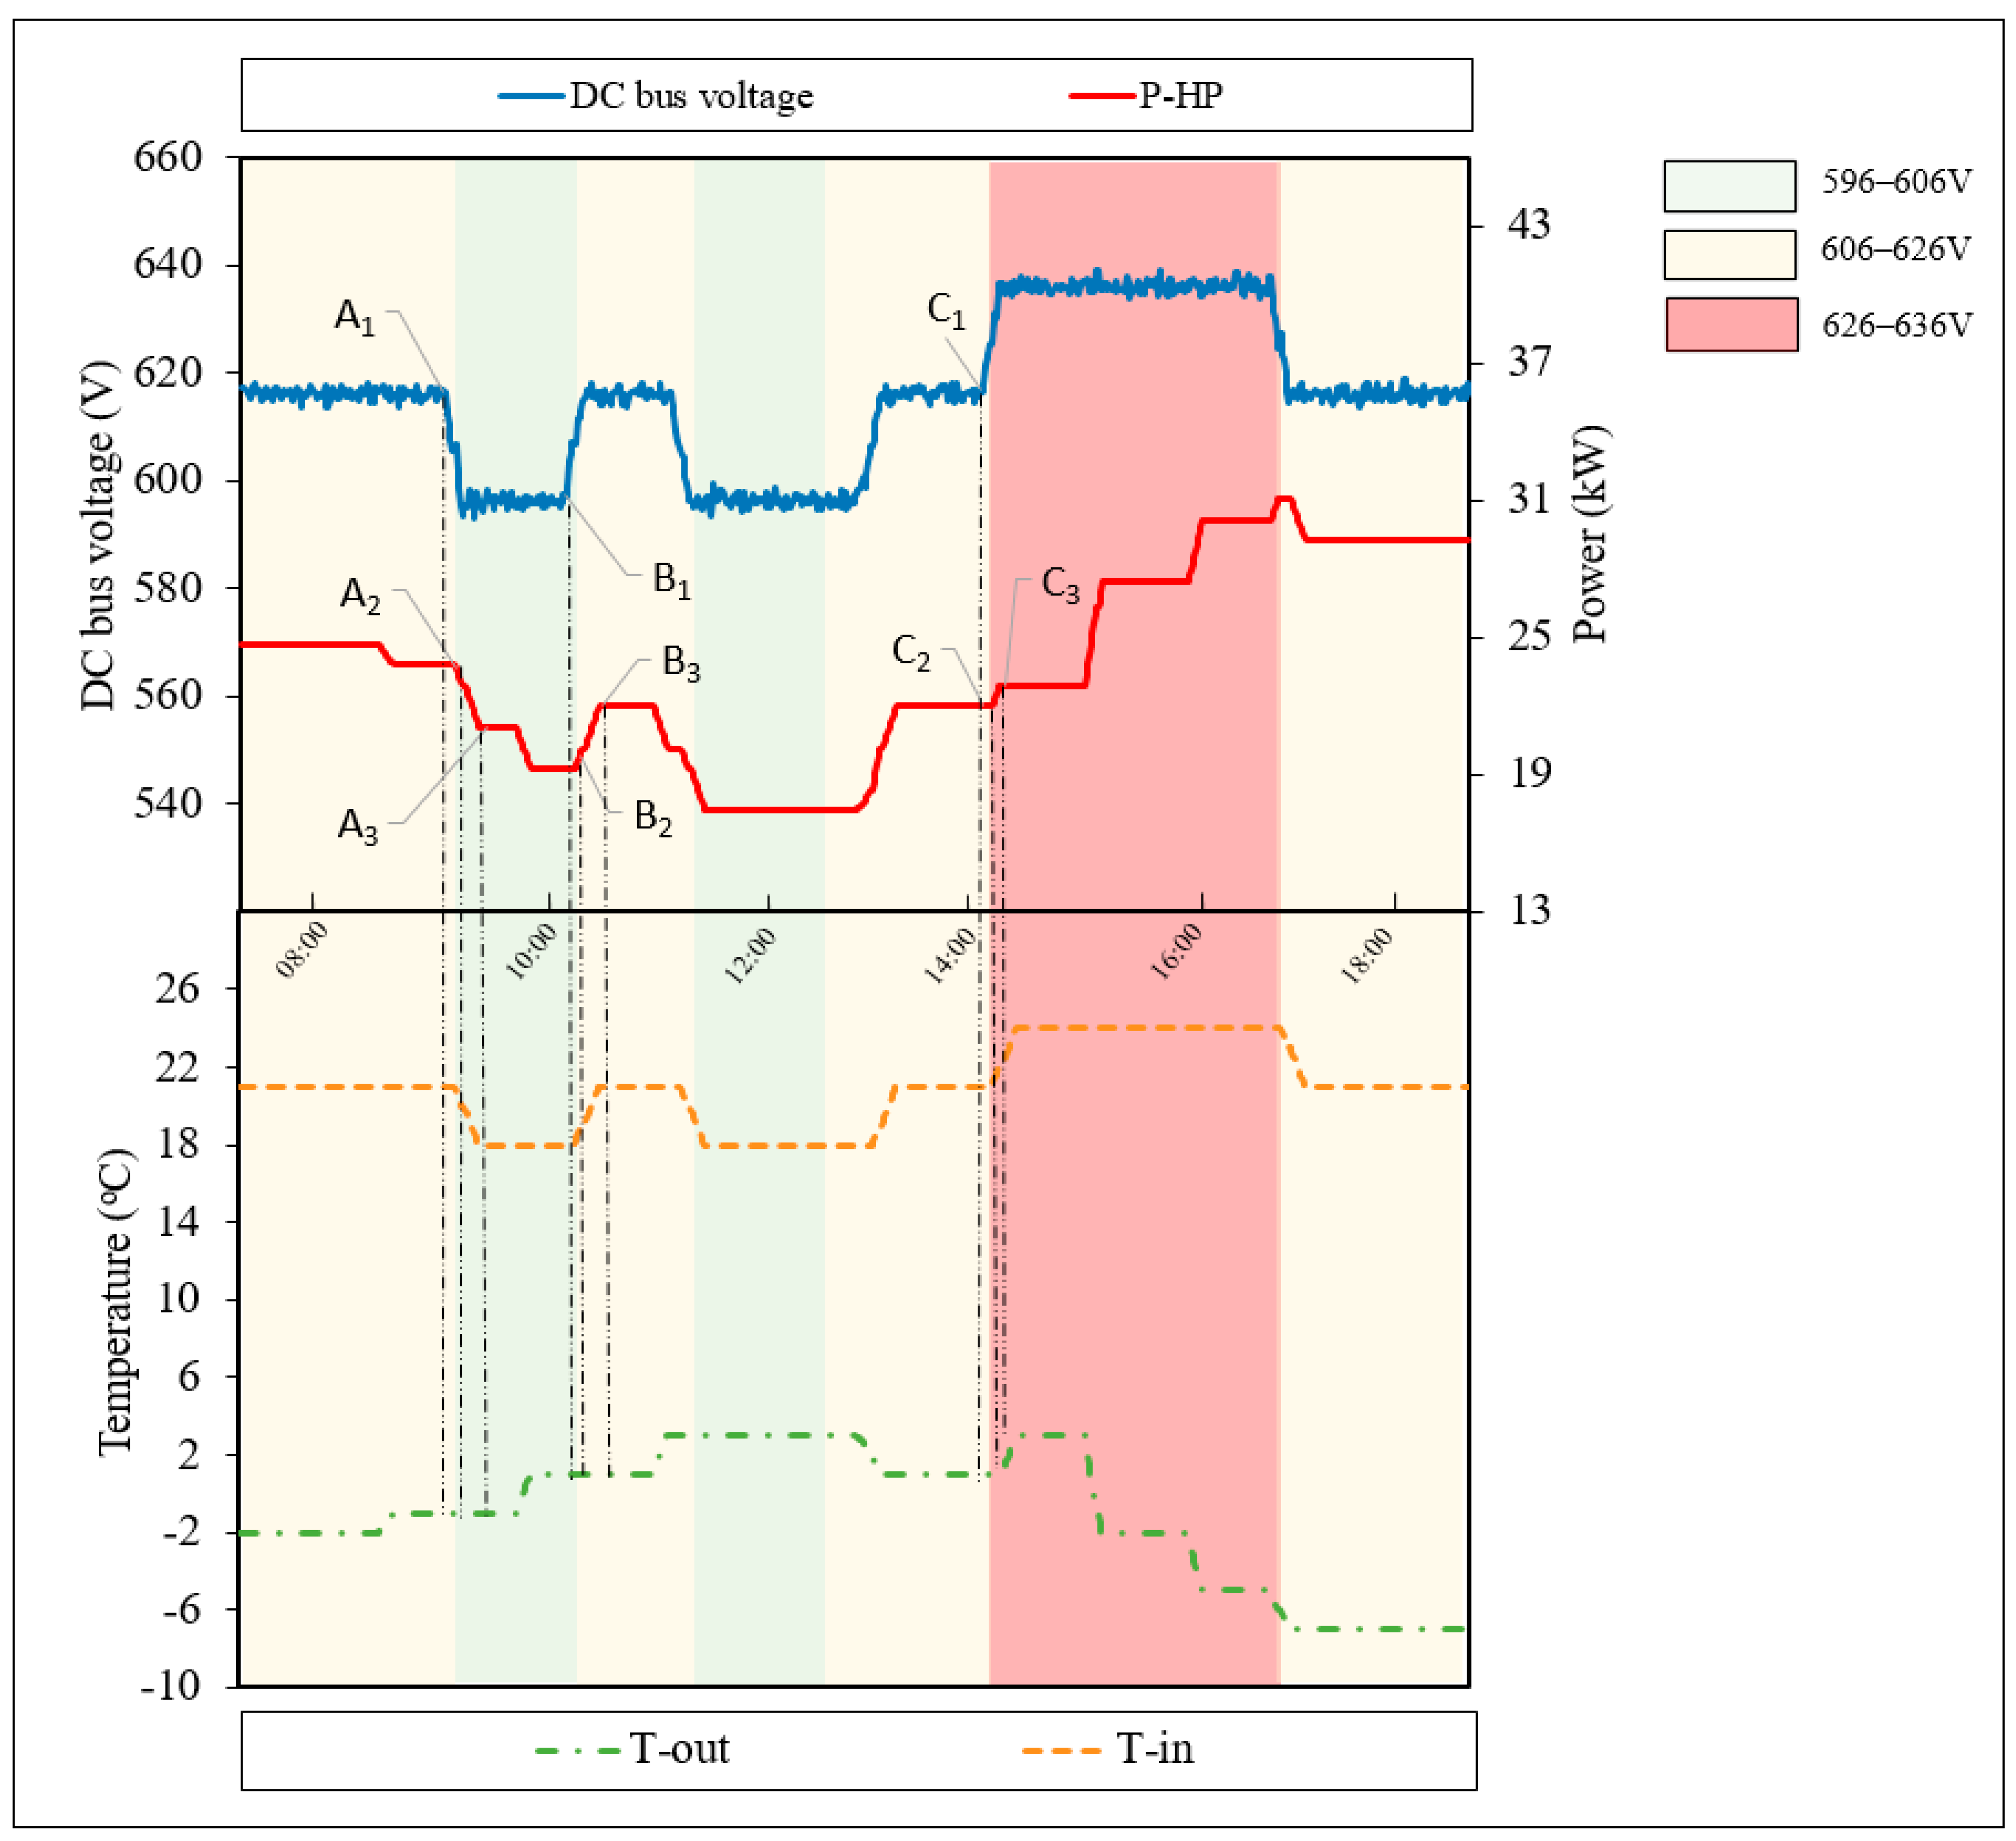
The heat pump can operate normally at 596–636 V. When the DC bus voltage is low (596–616 V), the building’s electricity is supplied by the grid, and the HP can operate at lower operating power. When the DC bus voltage is high (626–636 V), the PV system is the main power source for the building, the HP should increase its operating power, and the excess heat can be stored in the building envelope to mitigate the fluctuations in DC bus voltage. When the DC bus voltage fluctuates normally (606–626 V), the HP regulates the indoor temperature normally.
(2)
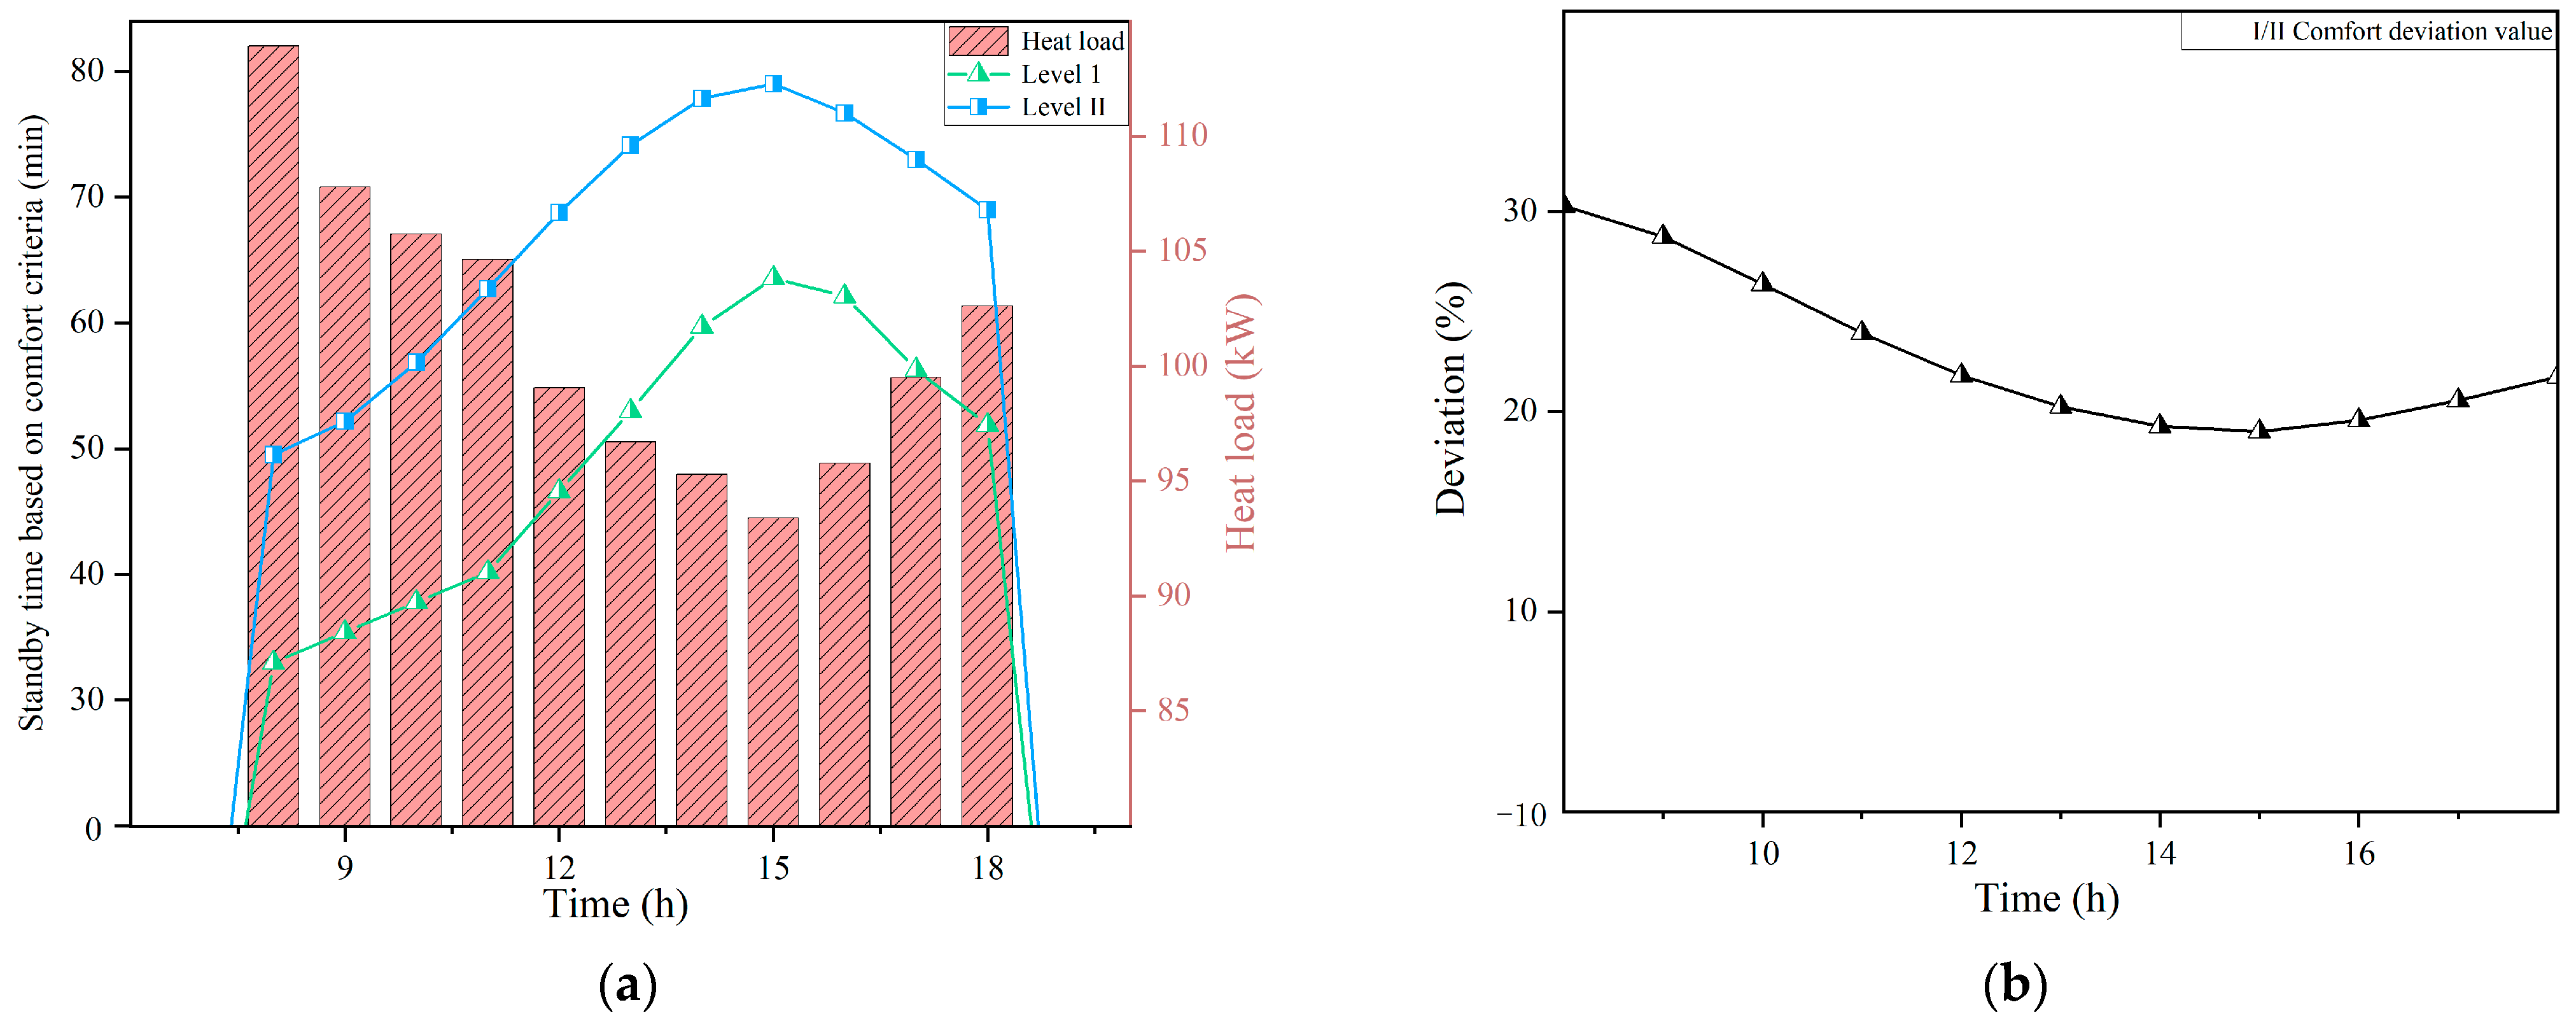
According to the data analysis of the case study, significant fluctuations in power supply may occur in the PV integrated building, which may pose negative effects on the operation of the building equipment and systems. Therefore, the heat pumps employ a startup and standby control strategy. By expanding the setting range of the room temperature, it can significantly affect the allowable standby time of heat pumps. For instance, the duration of standby time of heat pumps can extend to about 20–30% by reducing the room temperature from Class I to Class II comfort criteria.
In future, other environmental factors, such as ambient temperature and seasonal solar irradiance variations, can be further considered to evaluate the stability and adaptability of the DC inverter heat pump in practical applications.

Author Contributions

Conceptualization, Y.L. (Yilin Li); methodology, Y.L. (Yilin Li) and Y.L. (Yang Lu); software, T.Z. and Y.L. (Yang Lu); validation, Y.L. (Yang Lu) and S.Z.; formal analysis, Y.L. (Yang Lu); investigation, Y.L. (Yang Lu) and T.W.; resources, J.S.; data curation, Y.L. (Yang Lu) and S.Z.; writing—original draft preparation, Y.L. (Yilin Li) and T.W.; writing—review and editing, Y.L. (Yilin Li), S.Z. and T.Z.; visualization, S.Z.; supervision, Y.L. (Yilin Li); project administration, X.W. and J.S.; funding acquisition, Y.L. (Yilin Li) and X.W. All authors have read and agreed to the published version of the manuscript.

Funding

This research was funded by National Natural Science Foundation of China grants 52008245 and 52378103 and a Key Laboratory of Ecology and Energy Saving Study of Dense Habitat, Ministry of Education grant (20230102).

Data Availability Statement

Data available on request from the authors.

Conflicts of Interest

Jie Sun was employed by BSE Energy Technology (Suzhou) Co., Ltd. The remaining authors declare that the research was conducted in the absence of any commercial or financial relationships that could be construed as a potential conflict of interest.

Nomenclature

PVsPhotovoltaics
RESsRenewable energy sources
BIPVBuilding integrated photovoltaic
DCDirect current
HVACHeating ventilation and air-conditioning
ASHPAssisted air source heat pump
PV/TSolar photovoltaic/thermal
HLHeating load
HPHeat pump
Greek symbols
ρDensity, kg/m3
ΦOpening degree, %
ηEfficiency, %
Subscripts
ComCompressor
DisDischarge
wWater
CwCooling water
CondCondenser
rcRefrigerant side
cCondensation
exExpansion valve
mDC bus
refReference

References

  1. Lo, K.Y.; Yeoh, J.H.; Hsieh, I.Y.L. Towards Nearly Zero-Energy Buildings: Smart Energy Management of Vehicle-to-Building (V2B) Strategy and Renewable Energy Sources. Sustain. Cities Soc. 2023, 99, 104941. [Google Scholar] [CrossRef]
  2. Chen, W.H.; You, F. Sustainable building climate control with renewable energy sources using nonlinear model predictive control. Renew. Sustain. Energy Rev. 2022, 168, 112830. [Google Scholar] [CrossRef]
  3. Pramanik, A.S.; Sepasi, S.; Nguyen, T.L.; Roose, L. An ensemble-based approach for short-term load forecasting for buildings with high proportion of renewable energy sources. Energy Build. 2024, 308, 113996. [Google Scholar] [CrossRef]
  4. IRENA. Trading into a Bright Energy Future (The Case for Open, High-Quality Solar Photovoltaic Markets); World Trade Organization: Geneva, Switzerland, 2021. [Google Scholar]
  5. Du, H.; Han, Q.; de Vries, B.; Sun, J. Community solar PV adoption in residential apartment buildings: A case study on influencing factors and incentive measures in Wuhan. Appl. Energy 2024, 354, 122163. [Google Scholar] [CrossRef]
  6. Zhu, J.; Dong, H.; Zheng, W.; Li, S.; Huang, Y.; Xi, L. Review and prospect of data-driven techniques for load forecasting in integrated energy systems. Appl. Energy 2022, 321, 119269. [Google Scholar] [CrossRef]
  7. Diab, I.; Damianakis, N.; Chandra-Mouli, G.R.; Bauer, P. A shared PV system for transportation and residential loads to reduce curtailment and the need for storage systems. Appl. Energy 2024, 353, 122131. [Google Scholar] [CrossRef]
  8. Chen, Q.; Kuang, Z.; Liu, X.; Zhang, T. Optimal sizing and techno-economic analysis of the hybrid PV-battery-cooling storage system for commercial buildings in China. Appl. Energy 2024, 355, 122231. [Google Scholar] [CrossRef]
  9. Zhang, S.; He, W.; Fan, Y.; Wang, K.; Hu, Z.; Chu, W.; Yu, H. Field experimental investigation on electricity and thermal performances of a large scale photovoltaic solar-thermal direct expansion heat pump system. Energy Convers. Manag. 2022, 267, 115941. [Google Scholar] [CrossRef]
  10. Ma, J.; Fung, A.S.; Brands, M.; Moyeed, O.M.A.; Mhanna, A.; Juan, N. Effects of photovoltaic/thermal (PV/T) control strategies on the performance of liquid-based PV/T assisted heat pump for space heating. Renew. Energy 2021, 172, 753–764. [Google Scholar] [CrossRef]
  11. Ding, L.; Zhu, Y.; Zheng, L.; Dai, Q.; Zhang, Z. What is the path of photovoltaic building (BIPV or BAPV) promotion? The perspective of evolutionary games. Appl. Energy 2023, 340, 121033. [Google Scholar] [CrossRef]
  12. Aguacil, S.; Lufkin, S.; Rey, E. Active surfaces selection method for building-integrated photovoltaics (BIPV) in renovation projects based on self-consumption and self-sufficiency. Energy Build. 2019, 193, 15–28. [Google Scholar] [CrossRef]
  13. Sankar, M.M.; Chatterjee, K. A posteriori multiobjective approach for techno-economic allocation of PV and BES units in a distribution system hosting PHEVs. Appl. Energy 2023, 351, 121851. [Google Scholar] [CrossRef]
  14. Trong, T.N.; Son, H.V.X.; Do Dinh, H.; Takano, H.; Duc, T.N. Short-term PV power forecast using hybrid deep learning model and Variational Mode Decomposition. Energy Rep. 2023, 9, 712–717. [Google Scholar] [CrossRef]
  15. Notton, G.; Nivet, M.L.; Voyant, C.; Paoli, C.; Darras, C.; Motte, F.; Fouilloy, A. Intermittent and stochastic character of renewable energy sources: Consequences, cost of intermittence and benefit of forecasting. Renew. Sustain. Energy Rev. 2018, 87, 96–105. [Google Scholar] [CrossRef]
  16. Brinkel, N.B.G.; Gerritsma, M.K.; AlSkaif, T.A.; Lampropoulos, I.; van Voorden, A.M.; Fidder, H.A.; van Sark, W.G.J.H.M. Impact of rapid PV fluctuations on power quality in the low-voltage grid and mitigation strategies using electric vehicles. Int. J. Electr. Power Energy Syst. 2020, 118, 105741. [Google Scholar] [CrossRef]
  17. Hong, J.; Liang, F.; Yang, H. Research progress, trends and prospects of big data technology for new energy power and energy storage system. Energy Rev. 2023, 2, 100036. [Google Scholar] [CrossRef]
  18. Asea Brown Boveri, Z. Enviline™DCGear DC Switchgear for DC Traction Power Distribution Network. 2022. Available online: https://new.abb.com/medium-voltage/zh/switchgear/railway-switchgear/dc-traction-power-supply/dc-switchgear-and-vld/envilinetm-dcgear-GB (accessed on 1 March 2024).
  19. Han, S.; Li, X.; Zhao, W.; Wang, L.; Liang, A.; Zeng, S. Simulation Study of the Control Strategy of a DC Inverter Heat Pump Using a DC Distribution Network. Energy Eng. 2023, 120, 1421–1444. [Google Scholar] [CrossRef]
  20. Kockel, C.; Nolting, L.; Goldbeck, R.; Wulf, C.; De Doncker, R.W.; Praktiknjo, A. A scalable life cycle assessment of alternating and direct current microgrids in office buildings. Appl. Energy 2022, 305, 117878. [Google Scholar] [CrossRef]
  21. Candanedo, L.M.; Athienitis, A.K.; Kalogirou, S.A. Modeling and simulation of passive and active solar thermal systems. Compr. Renew. Energy 2012, 3, 357–417. [Google Scholar]
  22. Azaioud, H.; Farnam, A.; Knockaert, J.; Vandevelde, L.; Desmet, J. Efficiency optimisation and converterless PV integration by applying a dynamic voltage on an LVDC backbone. Appl. Energy 2024, 356, 122416. [Google Scholar] [CrossRef]
  23. Cavazzuti, M.; Bottarelli, M. Performance analysis of a multi-source renewable energy system for temperature control in buildings of varied thermal transmittance and climate zone. Renew. Sustain. Energy Rev. 2023, 187, 113725. [Google Scholar] [CrossRef]
  24. Tan, H.; Guo, Z.; Zhang, H.; Chen, Q.; Lin, Z.; Chen, Y.; Yan, J. Enhancing PV panel segmentation in remote sensing images with constraint refinement modules. Appl. Energy 2023, 350, 121757. [Google Scholar] [CrossRef]
  25. Sigounis, A.M.; Vallianos, C.; Athienitis, A. Model predictive control of air-based building integrated PV/T systems for optimal HVAC integration. Renew. Energy 2023, 212, 655–668. [Google Scholar] [CrossRef]
  26. Modu, B.; Abdullah, M.P.; Sanusi, M.A.; Hamza, M.F. DC-Based microgrid: Topologies, control schemes, and implementations. Alex. Eng. J. 2023, 70, 61–92. [Google Scholar] [CrossRef]
  27. Zhou, G.; Bai, M.; Zhao, X.; Li, J.; Li, Q.; Liu, J.; Yu, D. Study on the distribution characteristics and uncertainty of multiple energy load patterns for building group to enhance demand side management. Energy Build. 2022, 263, 112038. [Google Scholar] [CrossRef]
  28. Efkarpidis, N.A.; Vomva, S.A.; Christoforidis, G.C.; Papagiannis, G.K. Optimal day-to-day scheduling of multiple energy assets in residential buildings equipped with variable-speed heat pumps. Appl. Energy 2022, 312, 118702. [Google Scholar] [CrossRef]
  29. Walden, J.V.; Wellig, B.; Stathopoulos, P. Heat pump integration in non-continuous industrial processes by Dynamic Pinch Analysis Targeting. Appl. Energy 2023, 352, 121933. [Google Scholar] [CrossRef]
  30. Wang, Y.; Quan, Z.; Zhao, Y.; Wang, L.; Liu, Z. Performance and optimization of a novel solar-air source heat pump building energy supply system with energy storage. Appl. Energy 2022, 324, 119706. [Google Scholar] [CrossRef]
  31. Roccatello, E.; Prada, A.; Baggio, P.; Baratieri, M. Analysis of the Influence of Control Strategy and Heating Loads on the Performance of Hybrid Heat Pump Systems for Residential Buildings. Energies 2022, 15, 732. [Google Scholar] [CrossRef]
  32. Xia, L.; Ma, Z.; Kokogiannakis, G.; Wang, S.; Gong, X. A model-based optimal control strategy for ground source heat pump systems with integrated solar photovoltaic thermal collectors. Appl. Energy 2018, 228, 1399–1412. [Google Scholar] [CrossRef]
  33. Wei, D.; Cui, Q.; Qi, P.; Gao, E.; Zhang, X. Experimental study on operating characteristics and control strategy of CO2 heat pump in circulating heating mode. Appl. Therm. Eng. 2024, 236, 121719. [Google Scholar] [CrossRef]
  34. Lyu, W.; Wang, Z.; Li, X.; Deng, G.; Xu, Z.; Li, H.; Yang, Y.; Zhan, B.; Zhao, M. Influence of the water tank size and air source heat pump size on the energy saving potential of the energy storage heating system. J. Energy Storage 2022, 55, 105542. [Google Scholar] [CrossRef]
  35. Wang, J.; Qv, D.; Ni, L.; Yao, Y. Experimental study on an injection-assisted air source heat pump with a novel two-stage variable-speed scroll compressor. Appl. Therm. Eng. 2020, 176, 115415. [Google Scholar] [CrossRef]
  36. Zhang, D.; Xinyue, S.; Pengfei, L.; Bo, H.; Gang, H.; Chunyang, L.; Baorui, X.; Tao, Z.; Zhoujian, A. Experiment study on startup characteristics and operation performance of PV/T solar assisted heat pump waterheater system driven by direct current variable frequency compressor. Sol. Energy 2023, 263, 111771. [Google Scholar] [CrossRef]
  37. Ma, T.; Li, J.; Cao, X.; Ma, Y.; Cai, Y.; Lu, Z. Research on optimal dispatch strategy of electric heating load groups considering user behavior difference and distribution network power flow. J. Electr. Power Sci. Technol. 2023, 38, 77–87. [Google Scholar]
  38. Bin, Z.; Qing, M.; Daoke, T.; Ling, F. Parameter optimization and off-design operation strategy of multistage scroll heat pumps in heating station. Heat. Vent. Air Cond. 2017, 47, 125–129. [Google Scholar]
  39. Shang, Y.; Wu, A.; Fang, X.; You, Y. Dynamic Simulation of Electronic Expansion Valve Controlled Refrigeration System under Different Heat Transfer Conditions. Int. J. Refrig. 2016, 72, 41–52. [Google Scholar] [CrossRef]
  40. Yu, L.; Yi, D.; Yu, Z.; Yuan, L. Interpretation of the DC Power Distribution Design Standard for Civil Buildings. Build. Electr. 2022, 41, 25–32. [Google Scholar]
Figure 1. Schematic overview of the system architecture for the case study.
Buildings 14 01139 g001
Figure 2. The weekly electricity statistics of the case study building.
Buildings 14 01139 g002
Figure 3. The weekly mismatch values of the supply and demand electricity.
Buildings 14 01139 g003
Figure 4. Profiles of power supply on a typical day.
Buildings 14 01139 g004
Figure 5. Profiles of building consumed electricity on a typical day.
Buildings 14 01139 g005
Figure 6. The standard floor layout of the reference building.
Buildings 14 01139 g006
Figure 7. Schematic diagram of the proposed system.
Buildings 14 01139 g007
Figure 8. Heat transfer analysis of the room.
Buildings 14 01139 g008
Figure 9. Scheme of the DC inverter heat pump system.
Buildings 14 01139 g009
Figure 10. Control logic of heat pump power based on DC bus voltage and indoor temperature setup.
Buildings 14 01139 g010
Figure 11. Control flow diagram of multiple heat pumps.
Buildings 14 01139 g011
Figure 12. MATLAB/Simulink model.
Buildings 14 01139 g012
Figure 13. Profile of supply power for the building.
Buildings 14 01139 g013
Figure 14. Variation in the input DC bus voltage.
Buildings 14 01139 g014
Figure 15. Setup for ambient environment and the simulated heating load of the building.
Buildings 14 01139 g015
Figure 16. Profiles of variations in DC bus voltage, power of heat pump, and ambient and indoor temperature.
Buildings 14 01139 g016
Figure 17. Heat pump standby time based on comfort criteria. (a) Heat pump standby time; (b) standby time deviations between level I and level II.
Buildings 14 01139 g017
Table 1. Building envelopes and building information.
Building ComponentValue
External wallW/(m2·K)
Interior wall0.617 W/(m2·K)
Roof0.408 W/(m2·K)
Floor5.24 W/(m2·K)
Window WWR0.30 (South and north facades)
0.35 (East and west facades)
Occupancy gain0.1 person/m2
Air circulation30 m3/person
Lighting intensity9 W/m2
Equipment load15 W/m2
Table 2. Heat pump parameters.
ParameterValue
Evaporating temperature10 °C
Condensing temperature46.1 °C
Superheat1.1 °C
Speed range20–120 rps
Rated speed90 rps
Refrigerant mass flow rate1021 kg/h
Compressor power10.3 kW
Compressor normal operating voltage586–636 V
Rated heat capacity196.0 kW (47.2 × 4)
Type of refrigerantR410A
Table 3. Heat pump flexible adjustment characteristic parameters.
ConditionSimulation Time (h)Room Control Temperature (°C)Comfort LevelDC Bus Voltage Range (V)Heat Pump Mode
11018II596 < Vm < 606Low
221I606 ≤ Vm ≤ 626Normal
324I626 < Vm < 636High
Table 4. DC heat pump flexible adjustment characteristic parameters.
Typical Changing ProcessDC Bus Voltage Change Point
t1
Response Startup Point
t2
Response Completion Point
t3
DR1
Δ = t2 – t1
(min)
DR2
Δ = t3 – t2
(min)
AA1: 09:25 A.M.A2: 09:31 A.M.A3: 09:46615
BB1: 10:36 A.M.B2: 10:42 A.M.B3: 10:56614
CC1: 14:02 P.M.C2: 14:08 A.M.C3: 14:1365
Disclaimer/Publisher’s Note: The statements, opinions and data contained in all publications are solely those of the individual author(s) and contributor(s) and not of MDPI and/or the editor(s). MDPI and/or the editor(s) disclaim responsibility for any injury to people or property resulting from any ideas, methods, instructions or products referred to in the content.

