
Proposal of Empirical Equations for Masonry Compressive Strength: Considering the Compressive Strength Difference between Bricks and Mortar


Abstract
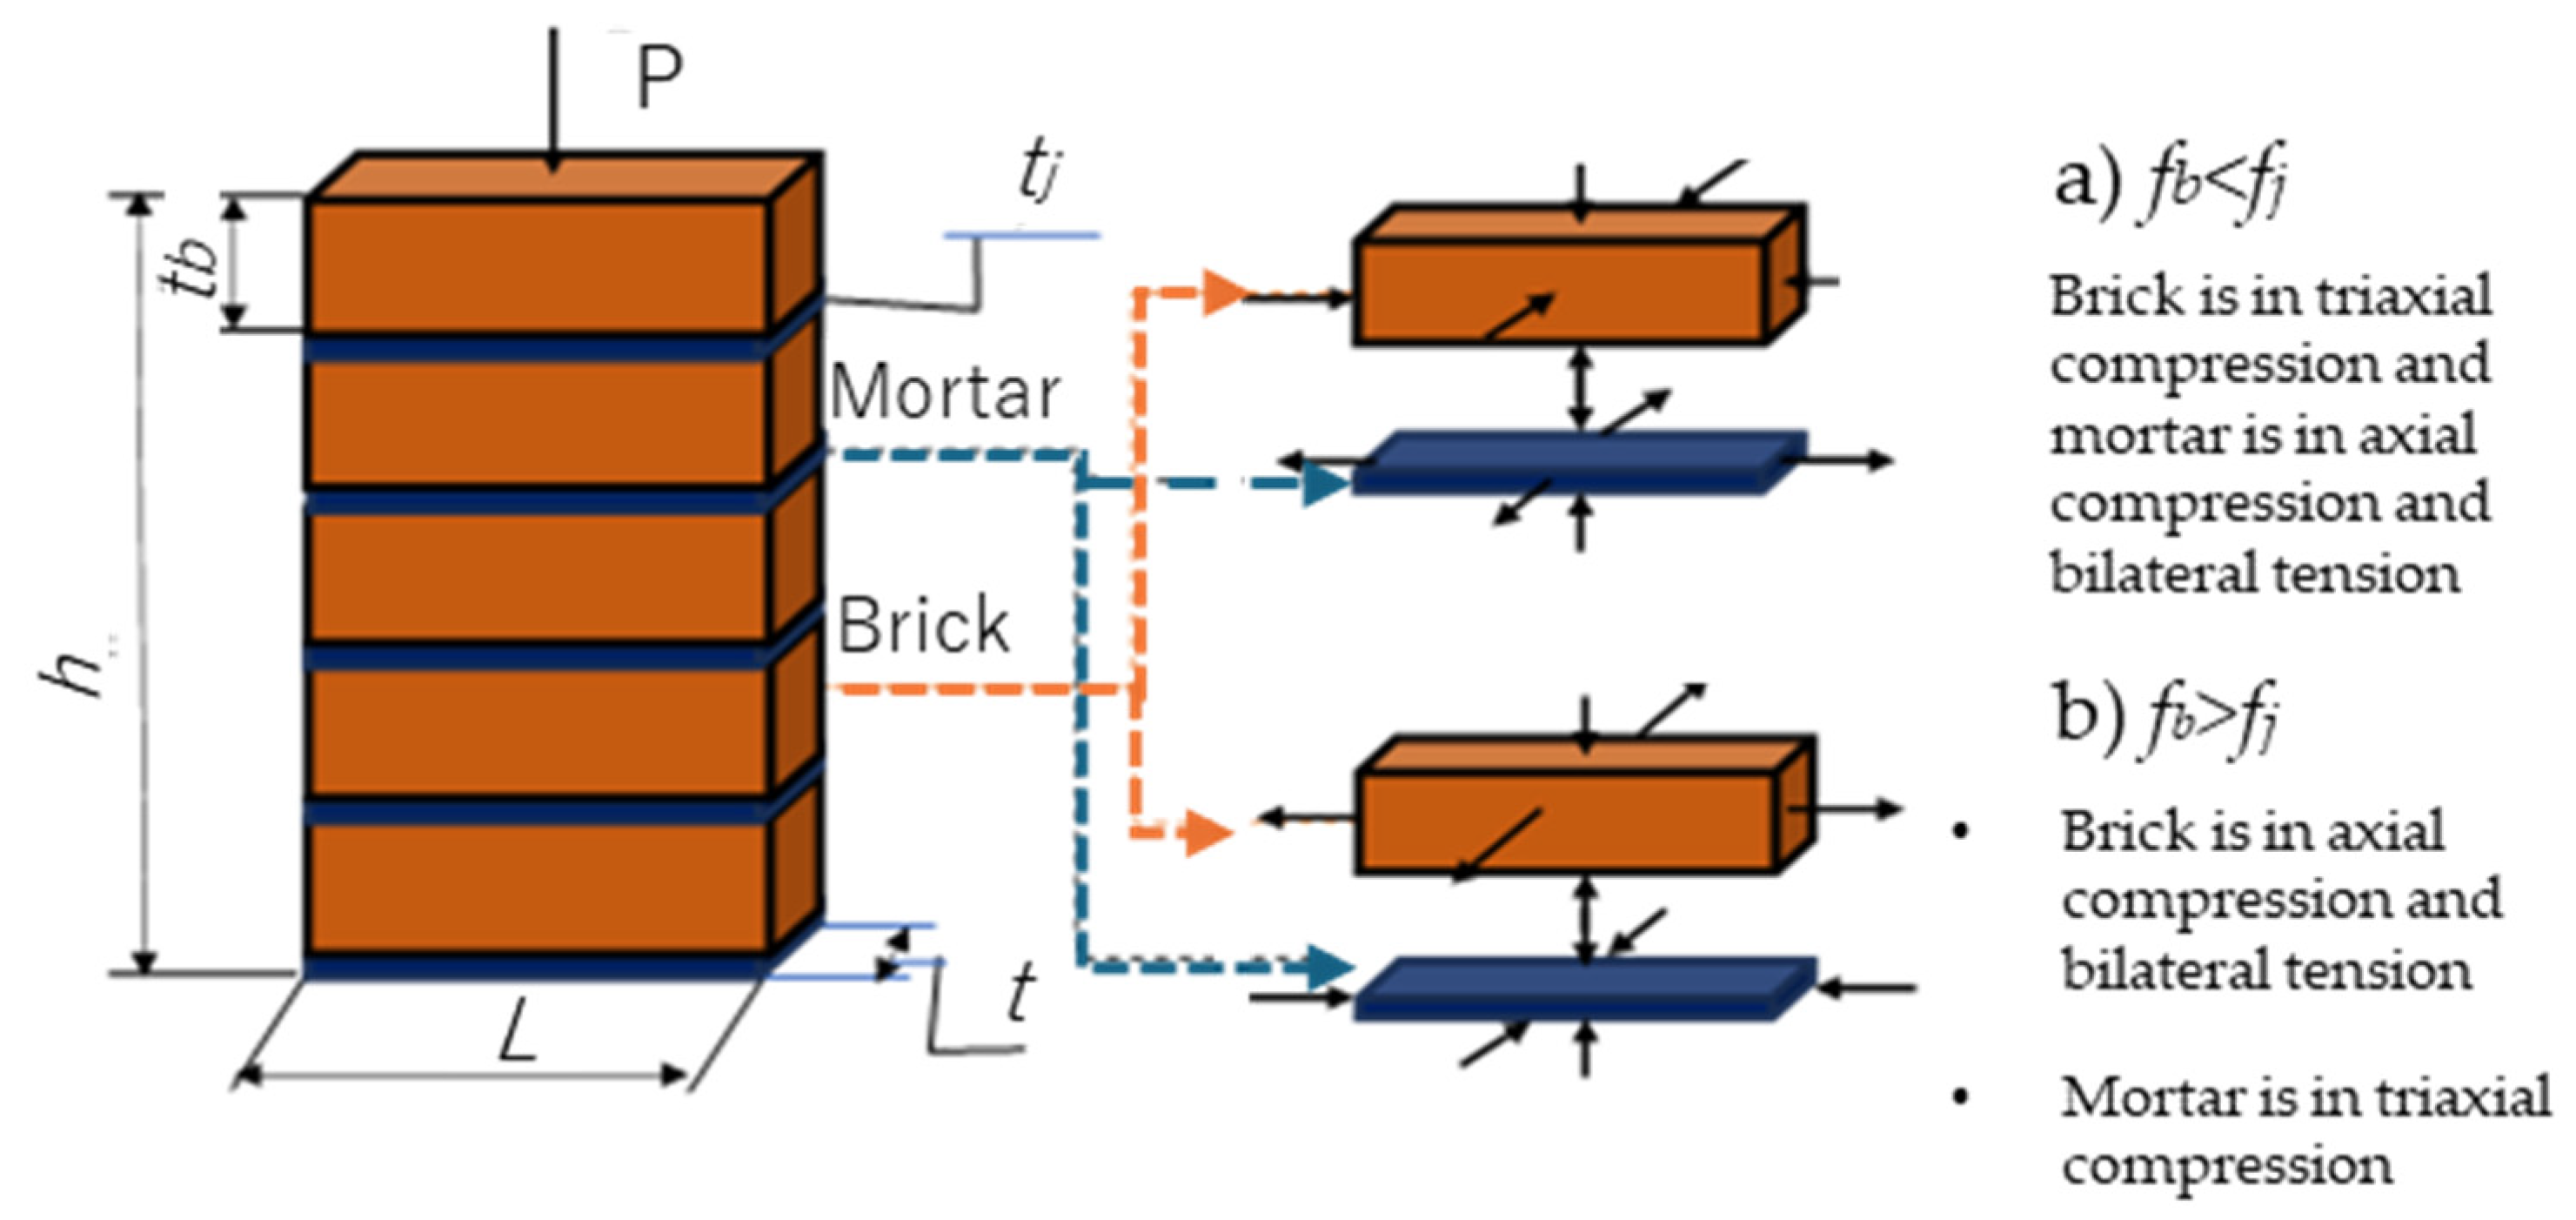
:1. Introduction
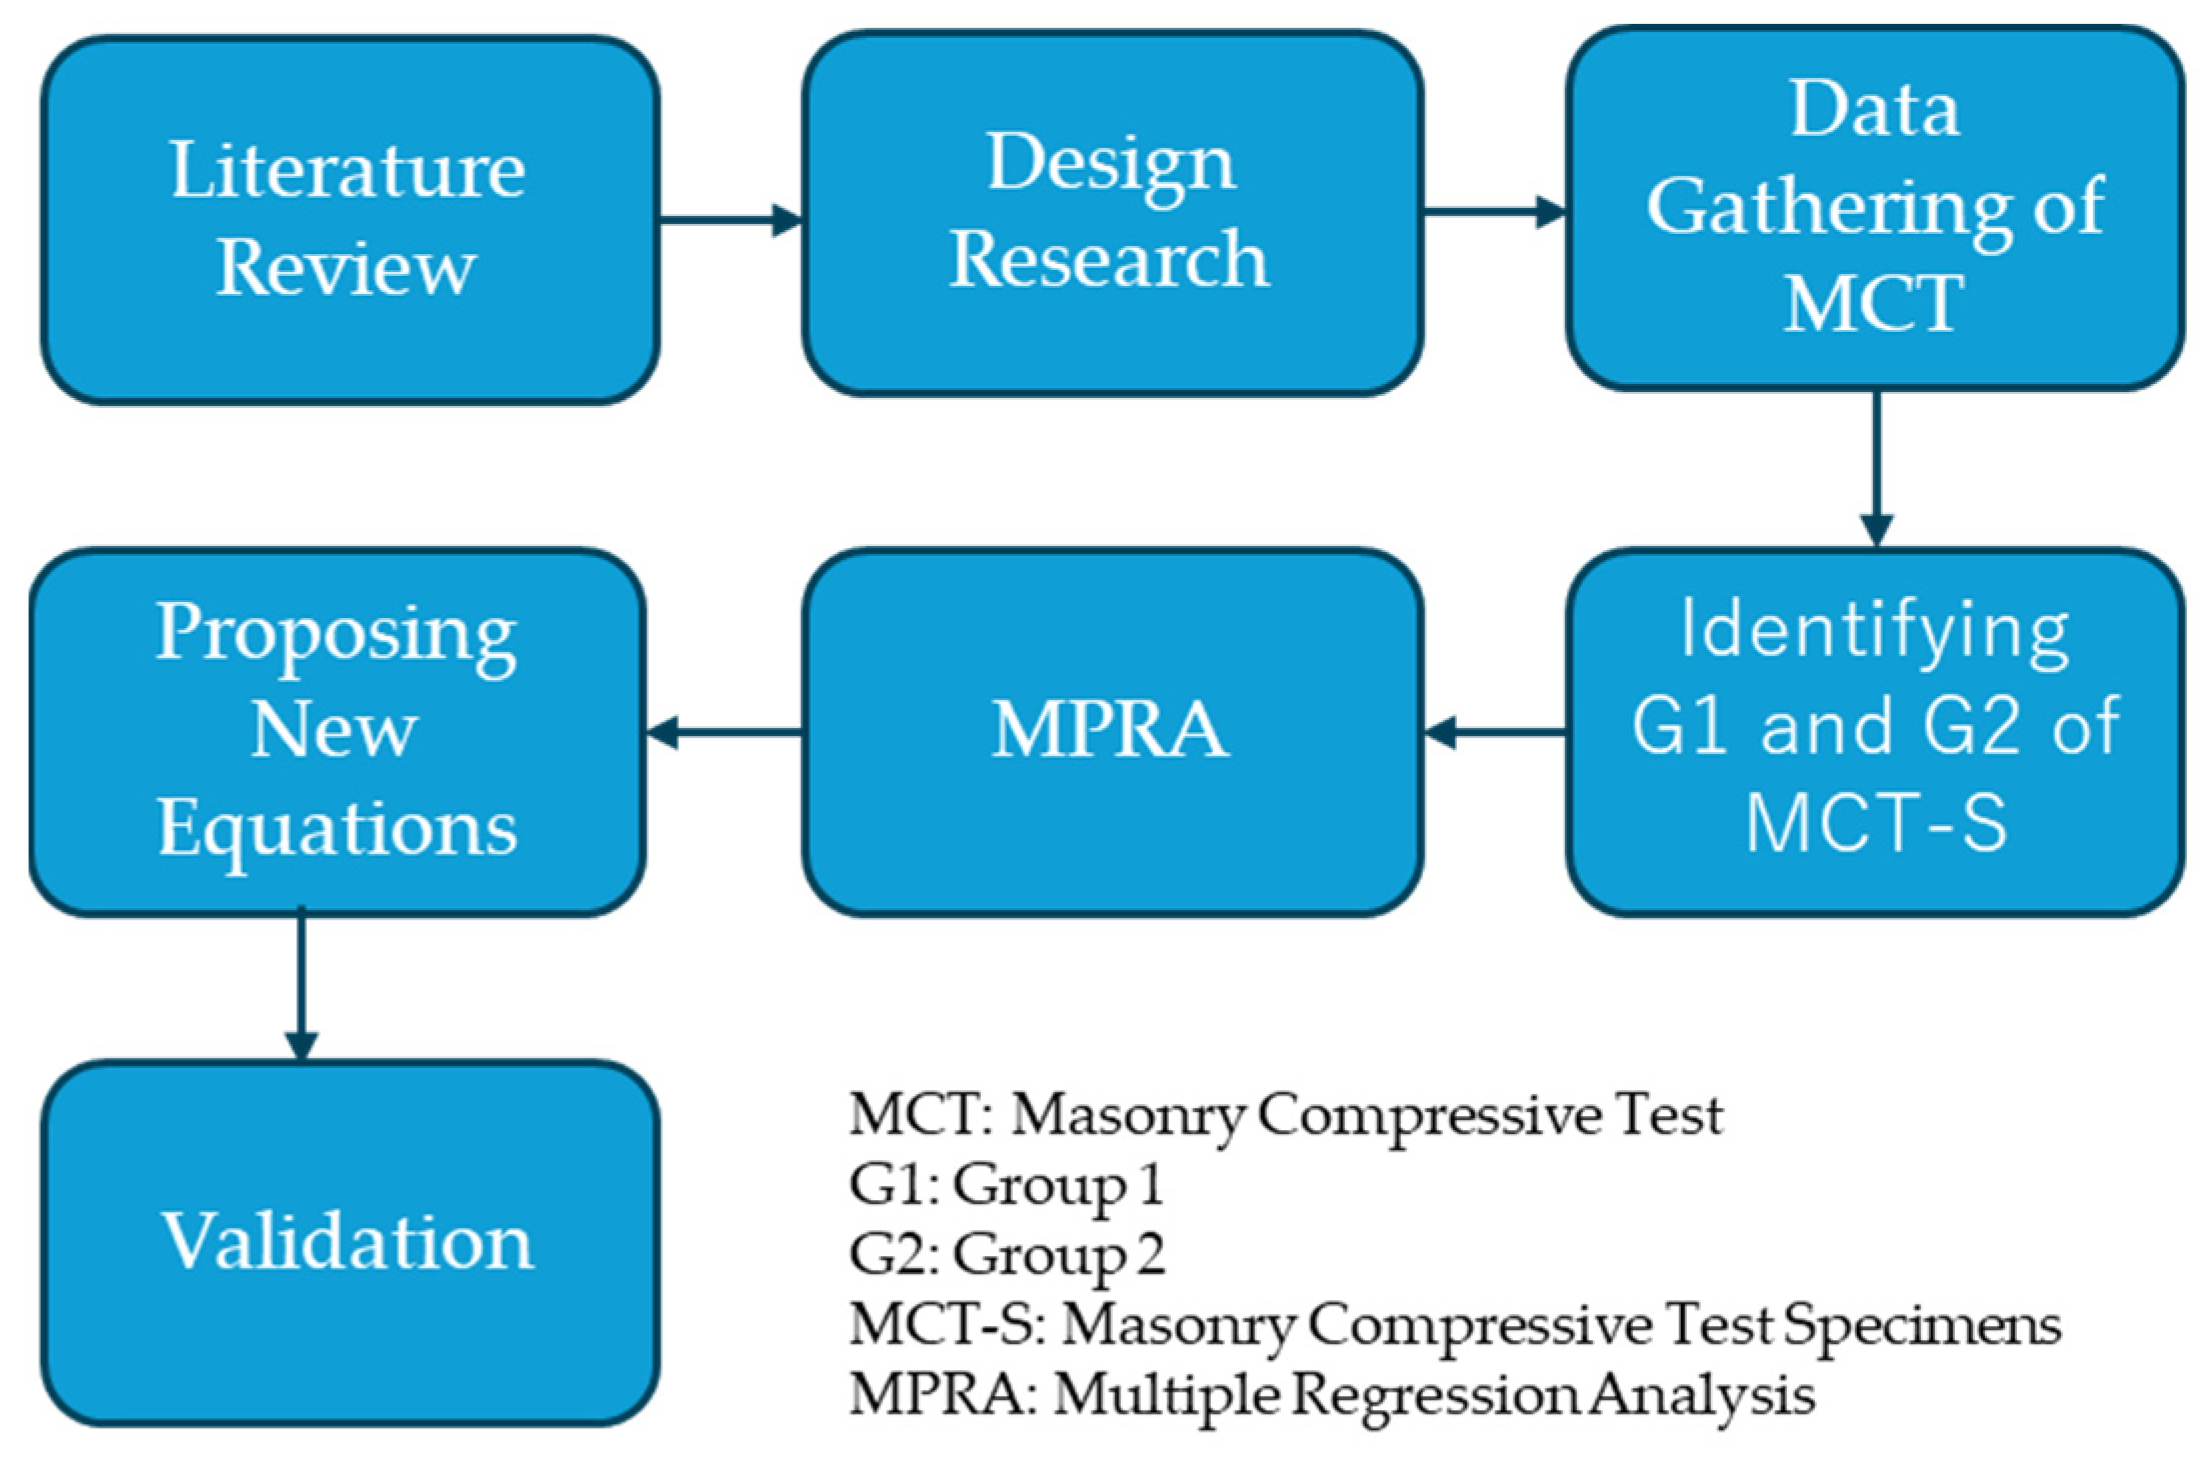
2. Methodology
3. Specimens’ Description and Material Properties
3.1. Brick Units
3.2. Mortar
4. Multiple Power Regression Analysis
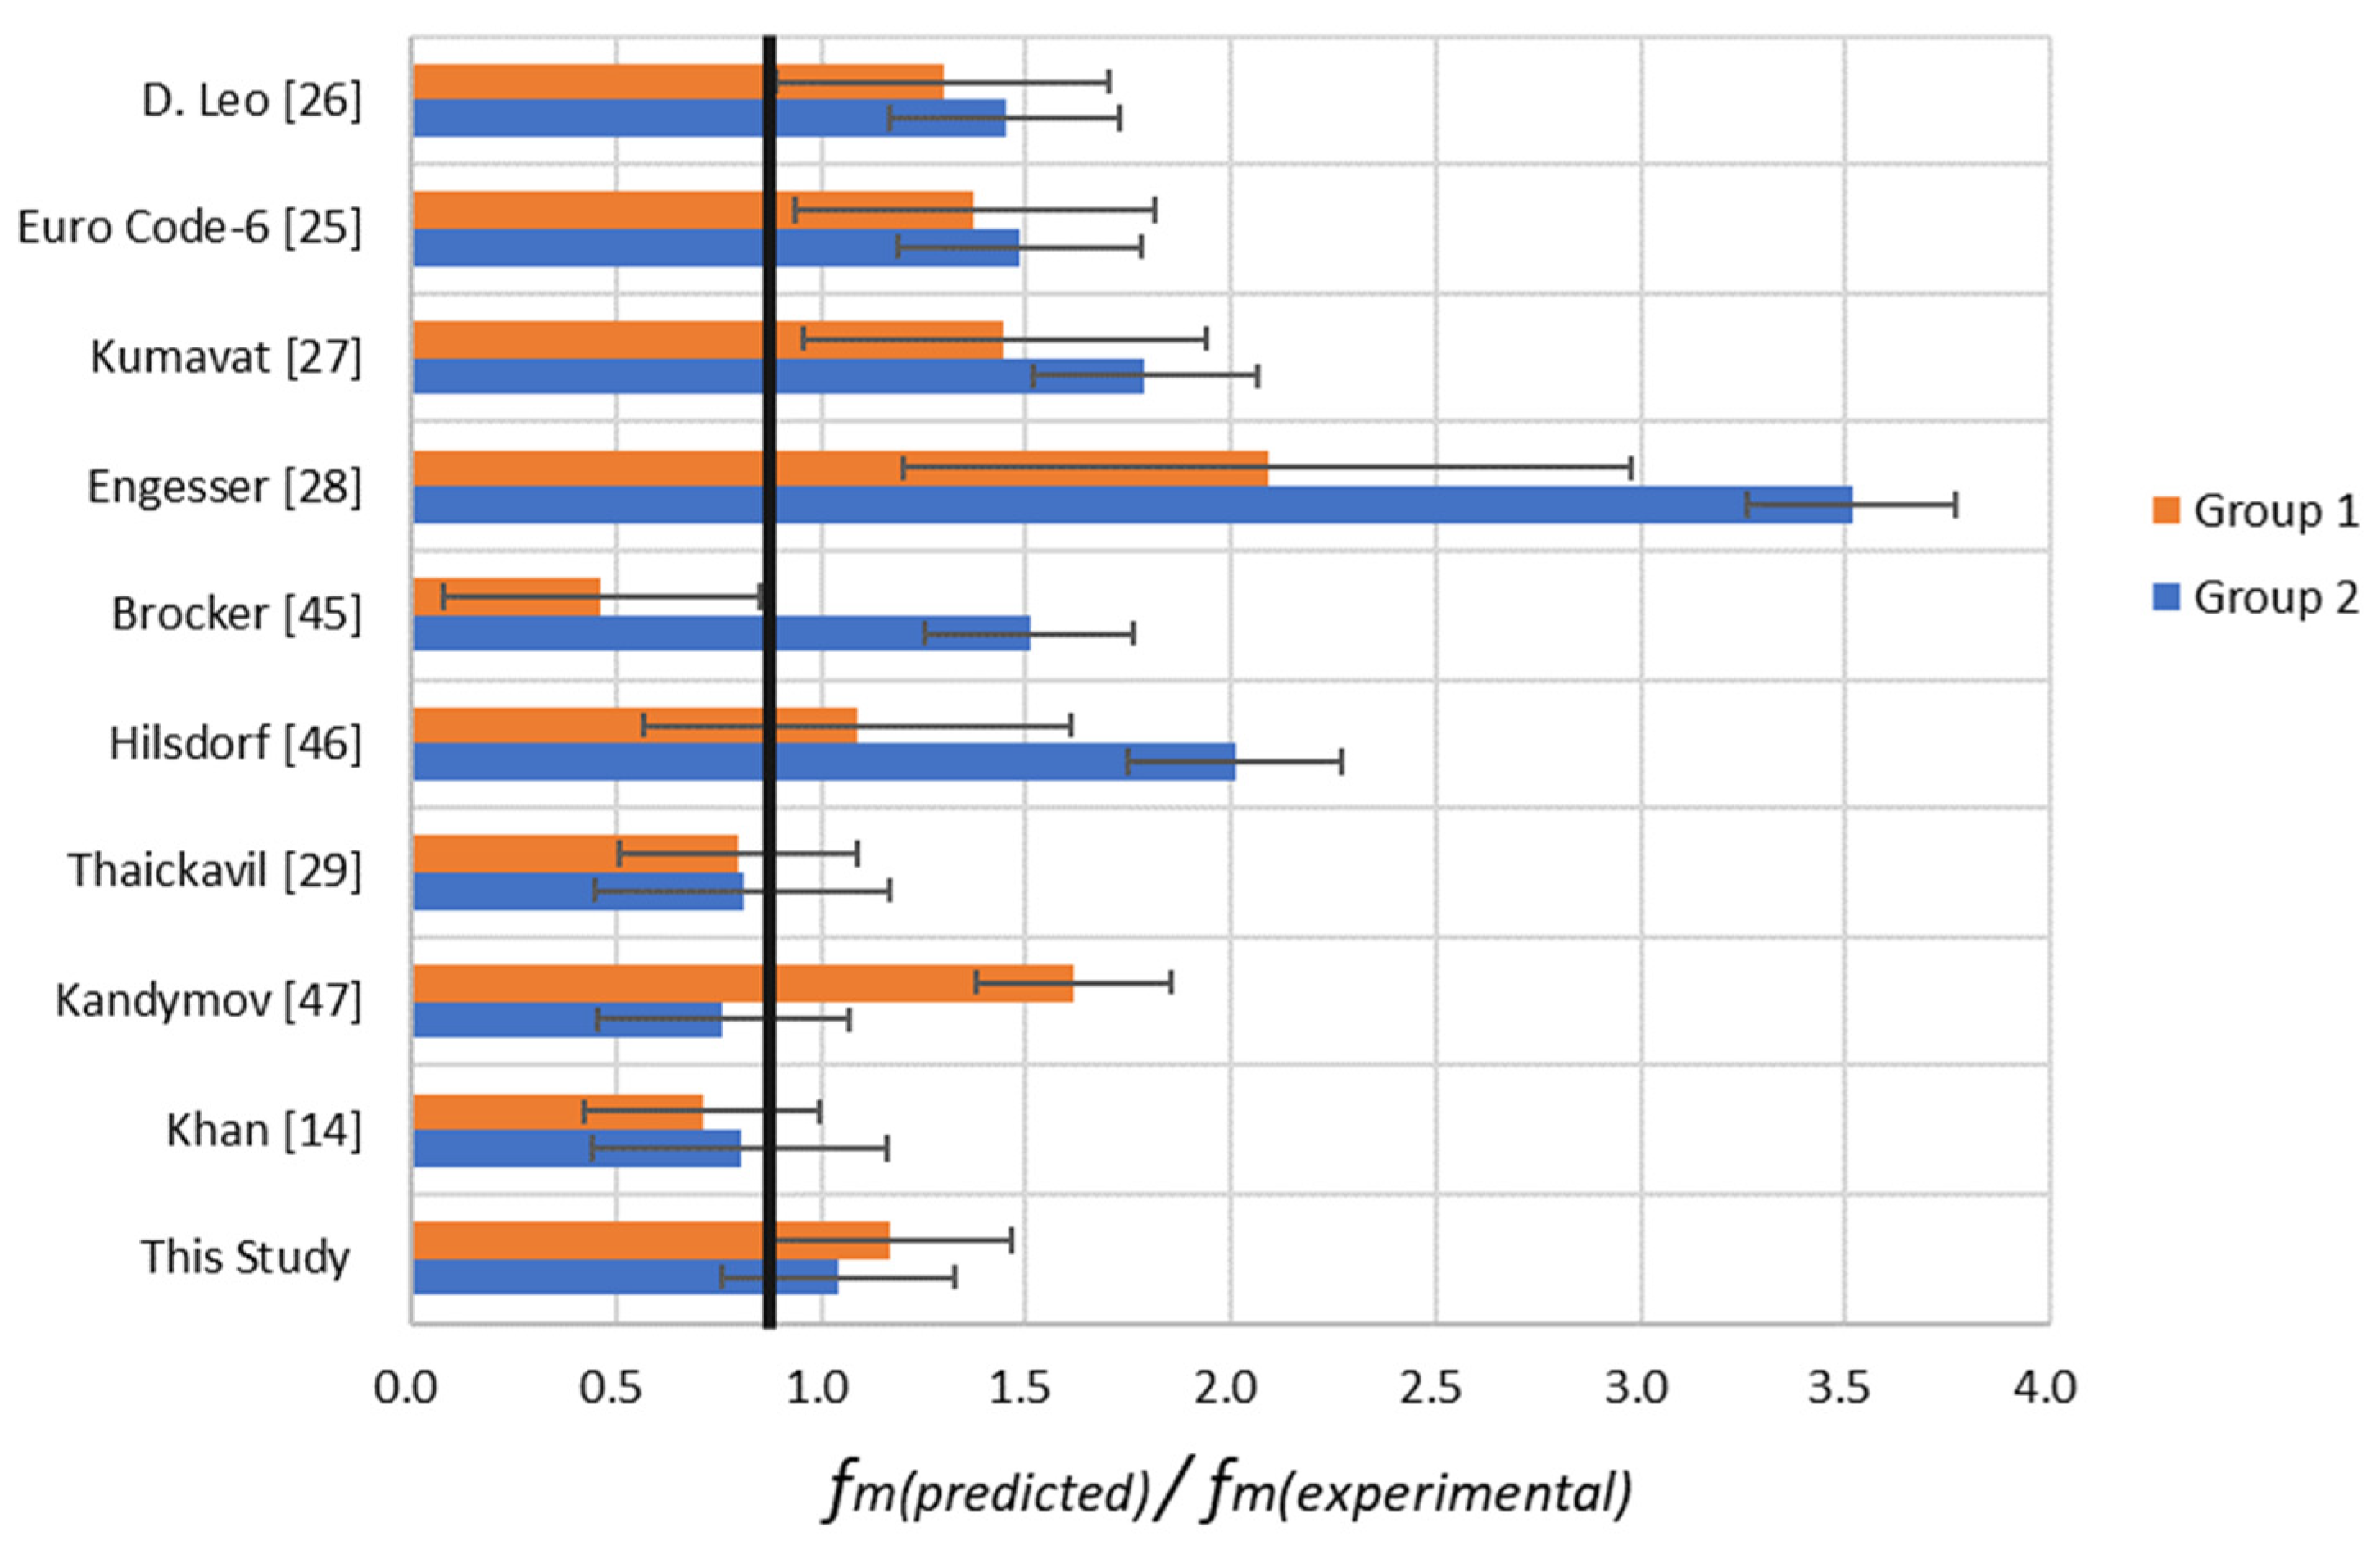
5. Results and Discussion
6. Conclusions
7. Recommendations
Author Contributions
Funding
Data Availability Statement
Acknowledgments
Conflicts of Interest
References
- Gregori, A.; Mercuri, M.; Angiolilli, M.; Pathirage, M. Simulating Defects in Brick Masonry Panels Subjected to Compressive Loads. Eng. Struct. 2022, 263, 114333. [Google Scholar] [CrossRef]
- Smith, A.; Jones, B. The Effects of Workmanship on the Compressive Strength of Masonry. Constr. Sci. J. 2020, 15, 45–58. [Google Scholar]
- Reddy, K.S.; Pasupuleti, D.; Venkatarama Reddy, B. Influence of Workmanship on the Compressive Strength of Masonry. Constr. Build. Mater. 2014, 67, 156–163. [Google Scholar] [CrossRef]
- Patel, D.; Gupta, S. Relationship between Workmanship Quality and Masonry Strength: An Experimental Analysis. Int. J. Civil. Eng. Res. 2016, 7, 22–35. [Google Scholar]
- Dewi, S.M.; Soehardjono, A. Investigation of Elasticity, Compression, and Shear Strength of Masonry Wall from Indonesian Clay Brick. Int. J. Eng. Res. Appl. (IJERA) 2013, 3, 259–263. [Google Scholar]
- Ayu, I.; Budiwati, M. Experimental Compressive Strength and Modulus of Elasticity of Masonry. J. Ilm. Tek. Sipil 2009, 13, 71–81. [Google Scholar]
- Van, T.C.; Lau, T.L. Experimental Evaluation of Reinforced Concrete Frames with Unreinforced Masonry Infills under Monotonic and Cyclic Loadings. Int. J. Civil. Eng. 2021, 19, 401–419. [Google Scholar] [CrossRef]
- NCMA Publications. Compressive Strength Evaluation of Concrete Masonry; TEK 18-1A; National Concrete Masonry Association: Herndon, VA, USA, 2004; pp. 1–6. [Google Scholar]
- Zerin, A.I.; Salem, H.; Hosoda, A.; Amanat, K.M. Verification of Masonry Properties in AEM Analysis for Brick-Infilled Reinforced Concrete Frames. Jpn. Concr. Inst. 2015, 37, 79–84. [Google Scholar]
- Asghar, R.; Shahzad, A.; Amjad, S.U.; Akhtar, A. Experimental Determination of the Mechanical Properties of Brick Masonry and Low Strength Concrete Block Masonry. In Proceedings of the 2nd Conference on Sustainability in Civil Engineering (CSCE’20), Islamabad, Pakistan, 12 August 2020; Volume 1, p. 6. [Google Scholar]
- Javed, M. Seismic Risk Assessment of Unreinforced Brick Masonry Buildings System of Northern Pakistan. Ph.D. Thesis, University of Engineering and Technology, Peshawar, Pakistan, 2009. [Google Scholar]
- Mishra, C.; Yamaguchi, K.; Endo, Y.; Hanazato, T. Mechanical Properties of Components of Nepalese Historical Masonry Buildings. In Proceedings of the International Exchange and Innovation Conference on Engineering & Science, Fukuoka, Japan, 18–19 October 2018; pp. 118–123. [Google Scholar]
- Islam, M.R. Strength Comparison of Masonry Wall Made of Clay Burnt Brick with Frog Mark and Machine-Made Brick without Frog Mark. Master’s Thesis, Bangladesh University of Engineering and Technology, Dhaka, Bangladesh, 2017. [Google Scholar]
- Khan, N.A.; Aloisio, A.; Monti, G.; Nuti, C.; Briseghella, B. Experimental Characterization and Empirical Strength Prediction of Pakistani Brick Masonry Walls. J. Build. Eng. 2023, 71, 106451. [Google Scholar] [CrossRef]
- Padalu, P.K.V.R.; Singh, Y. Variation in Compressive Properties of Indian Brick Masonry and Its Assessment Using Empirical Models. Structures 2021, 33, 1734–1753. [Google Scholar] [CrossRef]
- Alwashali, H.A. Seismic Capacity Evaluation of Reinforced Concrete Buildings with Unreinforced Masonry Infill in Developing Countries. Ph.D. Thesis, Tohoku University, Sendai, Japan, 2018. [Google Scholar]
- Soleymani, A.; Najafgholipour, M.A.; Johari, A. An Experimental Study on the Mechanical Properties of Solid Clay Brick Masonry with Traditional Mortars. J. Build. Eng. 2022, 58, 105057. [Google Scholar] [CrossRef]
- Singh, S.B.; Munjal, P. Bond Strength and Compressive Stress-Strain Characteristics of Brick Masonry. J. Build. Eng. 2017, 9, 10–16. [Google Scholar] [CrossRef]
- Kaushik, H.B.; Durgesh, R.C.; Jain, S.K.; Asce, M. Stress-Strain Characteristics of Clay Brick Masonry under Uniaxial Compression. J. Mater. Civ. Eng. 2007, 19, 728–739. [Google Scholar] [CrossRef]
- Murthi, P.; Bhavani, M.; Musthaq, M.S.; Jauhar, M.O.; Devi, V.R. Development of relationship between compressive strength of brick masonry and brick strength. Mater. Today Proc. 2021, 39, 258–262. [Google Scholar] [CrossRef]
- Mosalam, K.; Glascoe, L.; Bernier, J. Mechanical Properties of Unreinforced Brick Masonry, Section1; Lawrence Livermore National Lab.: Livermore, CA, USA, 2009. [Google Scholar]
- Brick Industry Association. Technical Notes 3A—Brick Masonry Material Properties. In Technical Notes on Brick Construction; Brick Industry Association: Reston, VA, USA, 1992; Volume 216. [Google Scholar]
- McNary, W.S.; Abrams, D.P. Mechanics of Masonry in Compression. J. Struct. Eng. 1985, 111, 857–870. [Google Scholar] [CrossRef]
- Akbarzade, A.A.; Tasnimi, A.A. Nonlinear Analysis and Modeling of Unreinforced Masonry Shear Walls Based on Plastic Damage Model. J. Seismol. Earthq. Eng. 2010, 11, 189–203. [Google Scholar]
- Morton, J. Designers’ Guides to Eurocodes 6: Design of Masonry Structures; Institute of Civil Engineers Publishing: London, UK, 1996. [Google Scholar]
- Di Leo, A. Sulla Valutazione Delle Proprietà Meccaniche Di Solidi Murari Costituenti Gli Edifici Esistenti. Ing. Archit. Costr. 1989, 44, 411–414. [Google Scholar]
- Kumavat, H.R. An Experimental Investigation of Mechanical Properties in Clay Brick Masonry by Partial Replacement of Fine Aggregate with Clay Brick Waste. J. Inst. Eng. Ser. A 2016, 97, 199–204. [Google Scholar] [CrossRef]
- Engesser, F. Über Weitgespannte Wölbbrücken. Z. Für Archit. Und Ingenieurwesen 1907, 53, 403–440. [Google Scholar]
- Thaickavil, N.N.; Thomas, J. Behaviour and Strength Assessment of Masonry Prisms. Case Stud. Constr. Mater. 2018, 8, 23–38. [Google Scholar] [CrossRef]
- Gumaste, K.S.; Rao, K.S.N.; Reddy, B.V.V.; Jagadish, K.S. Strength and Elasticity of Brick Masonry Prisms and Wallettes under Compression. Mater. Struct./Mater. Constr. 2007, 40, 241–253. [Google Scholar] [CrossRef]
- Liang, B.; Zhang, H.; Liu, Z.; Hou, J. The Influence of Different Types of Mortar on the Compressive Strength of Masonry. J. Build. Eng. 2023, 65, 105635. [Google Scholar] [CrossRef]
- Nazimi, K. Evaluation of Seismic Capacity and Proposal of Seismic Demand Index for the Existing RC with Infill Masonry School Buildings in Afghanistan. Master’s Thesis, University of the Ryukyus, Okinawa, Japan, 2018. [Google Scholar]
- Islam, M.A.; Rahman, S.M. Effect of Block Shape and Mortar Thickness on the Compressive Strength of Masonry. Int. J. Cem. Compos. Lightweight Concr. 2010, 10, 217–223. [Google Scholar]
- Cavalaro, A.A.P.; Saouma, V.; Williams, D.J.T. Effects of Masonry Unit Properties on Compressive Strength of Masonry Prisms. J. Struct. Eng. 2004, 8, 1152–1160. [Google Scholar]
- Foytong, P.; Boonpichetvong, M.; Areemit, N.; Teerawong, J. Effect of Brick Types on Compressive Strength of Masonry. Prism. Int. J. Technol. 2016, 7, 1171–1178. [Google Scholar] [CrossRef]
- Thamboo, J.A.; Dhanasekar, M. Correlation between the Performance of Solid Masonry Prisms and Wallettes under Compression. J. Build. Eng. 2019, 22, 429–438. [Google Scholar] [CrossRef]
- Knox, C.L.; Dizhur, D.; Ingham, J.M. Experimental Study on Scale Effects in Clay Brick Masonry Prisms and Wall Panels Investigating Compression and Shear Related Properties. Constr. Build. Mater. 2018, 163, 706–713. [Google Scholar] [CrossRef]
- Yap, S.H. Compressive Strength Study of Brick Masonry Subjected to Axial Loading. Ph.D. Thesis, University Technology Malaysia, Skudai, Malaysia, 1986. [Google Scholar]
- Yang, K.H.; Lee, Y.; Hwang, Y.H. A Stress-Strain Model for Brick Prism under Uniaxial Compression. Adv. Civil. Eng. 2019, 2019, 7682575. [Google Scholar] [CrossRef]
- Soundar Rajan, M.; Jegatheeswaran, D. Influence of Strength Behavior in Brick Masonry Prism and Wallette under Compression. Rev. Mater. 2023, 28. [Google Scholar] [CrossRef]
- Thamboo, J.; Navaratnam, S.; Poologanathan, K.; Corradi, M. Characteristics of CFRP Strengthened Masonry Wallettes under Concentric and Eccentric Compression. Case Stud. Constr. Mater. 2021, 14, e00472. [Google Scholar] [CrossRef]
- Stephen, O.; Michael, K.; Rodgers Bangi, M. Assessing the Effect of Different Mortar Mixes on Strength of Burnt Clay Brick Masonry Wall. Int. J. Eng. Res. Technol. 2020, 9, 337–343. [Google Scholar] [CrossRef]
- Woen, E.L.; Malek, M.A.; Mohammed, B.S.; Chao-Wei, T.; Tamunif, M.T. Experimental Study on Compressive Strength of Sediment Brick Masonry. In AIP Conference Proceedings; American Institute of Physics Inc.: College Park, MD, USA, 2018; Volume 1930. [Google Scholar] [CrossRef]
- Zach. ZACH, How to Perform Power Regression in Excel (Step-by-Step). Available online: https://www.statology.org/power-regression-in-excel/ (accessed on 22 February 2024).
- Bröcker, O. Die Auswertung von Tragfähigkeitsversuchen an Gemauerten Wänden. Betonstein-Zeitung 1963, 10, 19–21. [Google Scholar]
- Hilsdorf, H.K. Investigation into the Failure Mechanism of Brick Masonry Loaded in Axial Compression. In Designing Engineering and Constructing with Masonry Products; Gulf Publishing Co.: Houston, TX, USA, 1969; pp. 34–41. [Google Scholar]
- Kandymov, N.; Mohd Hashim, N.F.; Ismail, S.; Durdyev, S. Derivation of Empirical Relationships to Predict Cambodian Masonry Strength. Materials 2022, 15, 5030. [Google Scholar] [CrossRef] [PubMed]


| Specimen Name/Type | Number of Specimens | MSE (Average) | MSE-P/MSE-W | Proposed Correlation between Wallet and Prism Compressive Strength | |
|---|---|---|---|---|---|
| Group 1 | W | 32 | 0.3 | 0.4/0.3 = 1.3 | fm-P = 1.3 fm-W |
| P | 34 | 0.4 | |||
| Group 2 | W | 9 | 0.4 | 0.5/0.4 = 1.3 | fm-P = 1.3 fm-W |
| P | 30 | 0.5 | |||
| No. | Reference | Country of Origin | Masonry Specimen’s Type | fb (MPa) | fj, (MPa) | ρ | h/t | fm (MPa) |
|---|---|---|---|---|---|---|---|---|
| Group 1 Masonry Specimens (fb > fj) | ||||||||
| 1 | [16] | Bangladesh | P | 38.1 | 29.2 | 0.15 | 3.4 | 19.5 |
| 2 | P | 38.1 | 4.8 | 0.15 | 3.4 | 13.3 | ||
| 3 | [37] | New Zealand | P | 13.1 | 2.9 | 0.13 | 2.2 | 6.4 |
| 4 | [19] | India | P | 15.6 | 12.5 | 0.22 | 3.8 | 14.2 |
| 5 | P | 17.7 | 3.1 | 0.13 | 3.8 | 4.0 | ||
| 6 | P | 16.1 | 3.1 | 0.13 | 3.8 | 2.9 | ||
| 7 | P | 28.9 | 3.1 | 0.13 | 3.8 | 5.1 | ||
| 8 | P | 20.8 | 3.1 | 0.13 | 3.8 | 4.3 | ||
| 9 | P | 28.9 | 20.6 | 0.13 | 3.8 | 8.5 | ||
| 10 | P | 20.8 | 20.6 | 0.13 | 3.8 | 7.5 | ||
| 11 | P | 17.7 | 15.2 | 0.13 | 3.8 | 6.5 | ||
| 12 | P | 16.1 | 15.2 | 0.13 | 3.8 | 5.9 | ||
| 13 | P | 28.9 | 15.2 | 0.13 | 3.8 | 7.2 | ||
| 14 | P | 20.8 | 15.2 | 0.13 | 3.8 | 6.6 | ||
| 15 | [17] | Iran | P | 10.4 | 1.1 | 0.14 | 3.1 | 5.6 |
| 16 | P | 10.4 | 3.0 | 0.14 | 3.1 | 6.4 | ||
| 17 | P | 10.4 | 1.5 | 0.14 | 3.1 | 6.8 | ||
| 18 | P | 10.4 | 5.2 | 0.14 | 3.1 | 8.3 | ||
| 19 | [13] | Bangladesh | P | 27.6 | 17.1 | 0.24 | 4.0 | 8.7 |
| 20 | P | 27.6 | 17.1 | 0.16 | 3.8 | 8.3 | ||
| 21 | P | 25.3 | 17.1 | 0.26 | 3.6 | 7.4 | ||
| 22 | P | 25.3 | 17.1 | 0.17 | 3.3 | 5.1 | ||
| 23 | [38] | Malaysia | P | 30.2 | 5.1 | 0.11 | 3.4 | 9.7 |
| 24 | P | 30.2 | 5.1 | 0.15 | 3.6 | 7.8 | ||
| 25 | P | 30.2 | 5.1 | 0.23 | 3.8 | 6.4 | ||
| 26 | [39] | China | P | 14.1 | 6.3 | 0.17 | 3.7 | 10.0 |
| 27 | P | 14.1 | 10.8 | 0.17 | 3.7 | 7.9 | ||
| 28 | P | 14.1 | 6.3 | 0.17 | 2.2 | 10.0 | ||
| 29 | P | 14.1 | 10.8 | 0.17 | 2.2 | 8.5 | ||
| 30 | [40] | India | P | 15.8 | 8.6 | 0.17 | 4.1 | 7.5 |
| 31 | P | 5.3 | 4.2 | 0.14 | 4.9 | 2.2 | ||
| 32 | P | 15.8 | 4.2 | 0.15 | 4.1 | 6.9 | ||
| 33 | [18] | India | P | 13.3 | 12.7 | 0.16 | 3.8 | 3.4 |
| 34 | [7] | Malaysia | P | 26.1 | 8.1 | 0.11 | 4.1 | 7.4 |
| 35 | [17] | Iran | W | 9.2 | 8.3 | 0.16 | 3.6 | 2.3 |
| 36 | [9] | Bangladesh | W | 17.0 | 11.0 | 0.11 | 3.6 | 8.1 |
| 37 | [20] | Thai | W | 14.7 | 8.2 | 0.27 | 4.4 | 4.1 |
| 38 | W | 16.9 | 8.2 | 0.21 | 4.2 | 4.4 | ||
| 39 | W | 29.4 | 8.2 | 0.54 | 2.8 | 10.8 | ||
| 40 | W | 20.9 | 8.2 | 0.25 | 4.8 | 5.6 | ||
| 41 | W | 13.1 | 8.2 | 0.20 | 4.6 | 4.2 | ||
| 42 | W | 8.9 | 8.2 | 0.13 | 4.8 | 4.0 | ||
| 43 | [15] | India | W | 26.5 | 14.8 | 0.14 | 2.4 | 7.6 |
| 44 | [14] | Pakistan | W | 16.5 | 5.0 | 0.13 | 2.2 | 5.7 |
| 45 | W | 17.4 | 6.7 | 0.13 | 2.2 | 6.1 | ||
| 46 | [10] | Pakistan | W | 13.0 | 11.9 | 0.15 | 2.0 | 5.4 |
| 47 | [12] | Nepal | W | 5.1 | 1.4 | 0.17 | 3.1 | 1.7 |
| 48 | [38] | Malaysia | W | 30.2 | 5.1 | 0.11 | 3.4 | 5.0 |
| 49 | W | 30.2 | 5.1 | 0.15 | 3.6 | 4.7 | ||
| 50 | W | 30.2 | 5.1 | 0.23 | 3.8 | 4.6 | ||
| 51 | [40] | India | W | 15.8 | 8.6 | 0.17 | 4.1 | 6.7 |
| 52 | W | 5.3 | 4.2 | 0.14 | 3.3 | 1.6 | ||
| 53 | W | 15.8 | 4.2 | 0.15 | 4.1 | 6.3 | ||
| 54 | [41] | Sri Lanka | W | 17.3 | 6.6 | 0.17 | 2.6 | 6.8 |
| 55 | [42] | Uganda | W | 6.0 | 5.9 | 0.13 | 5.0 | 1.5 |
| 56 | W | 8.2 | 5.9 | 0.13 | 5.0 | 1.9 | ||
| 57 | W | 11.7 | 5.9 | 0.13 | 5.0 | 2.2 | ||
| 58 | W | 6.0 | 3.0 | 0.13 | 5.0 | 1.5 | ||
| 59 | W | 8.2 | 3.0 | 0.13 | 5.0 | 1.8 | ||
| 60 | W | 10.3 | 3.0 | 0.13 | 5.0 | 1.9 | ||
| 61 | W | 6.5 | 2.5 | 0.13 | 5.0 | 1.4 | ||
| 62 | W | 7.7 | 2.5 | 0.13 | 5.0 | 1.5 | ||
| 63 | W | 8.9 | 2.5 | 0.13 | 5.0 | 1.6 | ||
| 64 | W | 4.7 | 1.9 | 0.13 | 5.0 | 1.4 | ||
| 65 | W | 6.5 | 1.9 | 0.13 | 5.0 | 1.5 | ||
| 66 | W | 7.7 | 1.9 | 0.13 | 5.0 | 1.6 | ||
| Group 2 Masonry Specimens (fj > fb) | ||||||||
| 1 | [18] | India | P | 10.1 | 20.9 | 0.15 | 3.8 | 4.4 |
| 2 | P | 10.1 | 16.2 | 0.15 | 3.8 | 3.5 | ||
| 3 | P | 10.1 | 12.7 | 0.15 | 3.8 | 2.6 | ||
| 4 | P | 13.3 | 20.9 | 0.15 | 3.8 | 5.4 | ||
| 5 | P | 13.3 | 16.2 | 0.15 | 3.8 | 4.3 | ||
| 6 | P | 8.2 | 20.9 | 0.15 | 3.8 | 3.6 | ||
| 7 | P | 8.2 | 16.2 | 0.15 | 3.8 | 2.3 | ||
| 8 | P | 8.2 | 12.7 | 0.15 | 3.8 | 2.1 | ||
| 9 | [19] | India | P | 17.7 | 20.6 | 0.15 | 3.6 | 3.6 |
| 10 | P | 16.1 | 20.6 | 0.15 | 3.6 | 3.6 | ||
| 11 | [5] | Indonesia | P | 1.0 | 7.8 | 0.25 | 3.3 | 2.1 |
| 12 | P | 3.2 | 7.8 | 0.25 | 3.3 | 2 | ||
| 13 | P | 1.7 | 7.8 | 0.25 | 3.3 | 1.8 | ||
| 14 | P | 3.1 | 7.8 | 0.25 | 3.3 | 3.1 | ||
| 15 | [43] | China | P | 6.0 | 9.3 | 0.17 | 3.7 | 5.8 |
| 16 | P | 5.6 | 9.3 | 0.17 | 3.7 | 3.0 | ||
| 17 | P | 6.0 | 9.3 | 0.17 | 2.2 | 7.1 | ||
| 18 | P | 5.6 | 9.3 | 0.17 | 2.2 | 4.0 | ||
| 19 | P | 14.1 | 19.0 | 0.17 | 3.7 | 9.9 | ||
| 20 | P | 6.0 | 19.0 | 0.17 | 3.7 | 4.2 | ||
| 21 | P | 5.6 | 19.0 | 0.17 | 3.7 | 3.6 | ||
| 22 | P | 14.1 | 19.0 | 0.17 | 2.2 | 9.2 | ||
| 23 | P | 6.0 | 19.0 | 0.17 | 2.2 | 5.0 | ||
| 24 | P | 5.6 | 19.0 | 0.17 | 2.2 | 4.2 | ||
| 25 | [40] | India | P | 5.3 | 8.6 | 0.14 | 3.3 | 2.4 |
| 26 | P | 3.8 | 8.6 | 0.15 | 4.9 | 1.6 | ||
| 27 | P | 3.8 | 4.2 | 0.15 | 4.9 | 1.2 | ||
| 28 | [36] | Sri Lanka | P | 3.8 | 6.5 | 0.15 | 4.4 | 1.4 |
| 29 | P | 3.8 | 4.0 | 0.15 | 4.4 | 1.4 | ||
| 30 | P | 5.3 | 6.5 | 0.11 | 3.3 | 2.3 | ||
| 31 | W | 3.8 | 6.5 | 0.15 | 4.9 | 1.3 | ||
| 32 | W | 3.8 | 4.0 | 0.15 | 4.9 | 1.2 | ||
| 33 | W | 5.3 | 6.5 | 0.11 | 3.3 | 1.8 | ||
| 34 | W | 4.1 | 6.6 | 0.15 | 3 | 1.2 | ||
| 35 | [40] | India | W | 5.3 | 8.6 | 0.14 | 3.3 | 1.8 |
| 36 | W | 3.8 | 8.6 | 0.15 | 4.9 | 1.3 | ||
| 37 | W | 3.8 | 4.2 | 0.15 | 4.9 | 1.3 | ||
| 38 | [31] | China | W | 7.1 | 25.6 | 0.19 | 4.2 | 4.8 |
| 39 | W | 7.1 | 8.2 | 0.19 | 4.2 | 4.7 | ||
| Parameters | Brick Unit Size (mm) | Brick Compressive Strength (MPa) | Brick Unit Configuration | |||
|---|---|---|---|---|---|---|
| Thickness (tb) | Length (L) | Width (w) | Group 1 (fb > fj) | Group 2 (fb < fj) | ||
| Maximum | 120 | 250 | 120 | 38.1 | 20.1 |  |
| Minimum | 28 | 109.5 | 46 | 4.7 | 1.0 | |
| Average | 64.4 | 211.1 | 97.3 | 17.2 | 6.9 | |
| Type of Mortar | Minimum | Maximum | Average | |
|---|---|---|---|---|
| 1st Set C:S | 1:3 | 11.9 | 20.9 | 18.8 |
| 1:4 | 17.5 | 17.5 | 17.5 | |
| 1:5 | 12.7 | 14.2 | 13.3 | |
| 1:6 | 3.1 | 13.6 | 7.7 | |
| 1:8 | 1.5 | 1.5 | 1.5 | |
| 2nd Set L:C:S | 1:0.5:4 | 16.2 | 16.2 | 16.2 |
| 1:0.5:4.5 | 6.3 | 15.2 | 11.9 | |
| 2:1:9 | 3.0 | 3.0 | 3.0 | |
| 1:2:9 | 2.9 | 2.9 | 2.9 | |
| 3rd Set L:S | 1:3 | 1.1 | 1.1 | 1.1 |
| Gypsum | 5.2 | 5.2 | 5.2 | |
| Mud | 1.4 | 1.5 | 1.4 | |
| Parameter | Constant | fb | fj | h/t | ||
|---|---|---|---|---|---|---|
| Symbol of Exponent | ||||||
| Group 1 | Coefficient | 1.1 | 0.65 | 0.11 | −0.87 | 0.26 |
| Group 2 | Coefficient | 2.4 | 0.57 | 0.22 | −0.73 | 1.00 |
| Name of Researcher/Code | Reference | Equation | fm(pre)/fm(exp) (Means Value) | S.D. | CoV | |||
|---|---|---|---|---|---|---|---|---|
| G1 | G2 | G1 | G2 | G1 | G2 | |||
| D. Leo | [26] | 1.30 | 1.45 | 0.48 | 0.41 | 36% | 28% | |
| Euro Code-6 | [25] | 1.37 | 1.49 | 0.50 | 0.44 | 35% | 29% | |
| Kumavat | [27] | 1.45 | 1.79 | 0.55 | 0.49 | 37% | 27% | |
| Engesser | [28] | fm= 1/3fb+2/3fj | 2.09 | 3.51 | 0.81 | 0.89 | 38% | 25% |
| Brocker | [45] | 1.09 | 1.51 | 0.44 | 0.38 | 40% | 26% | |
| Hilsdorf | [46] | 1.62 | 2.01 | 0.63 | 0.52 | 38% | 26% | |
| Thaickavil | [29] | 0.80 | 0.81 | 0.36 | 0.29 | 45% | 36% | |
| Kandymov | [47] | 0.46 | 0.76 | 0.18 | 0.24 | 38% | 31% | |
| Khan | [14] | 0.71 | 0.80 | 0.24 | 0.29 | 34% | 36% | |
| This study | Equation (7) | 1.17 | - | 0.38 | - | 31% | - | |
| Equation (8) | - | 1.04 | - | 0.29 | - | 28% | ||
| Parameter | R2 | p-Values | ||||
|---|---|---|---|---|---|---|
| Constant | fb | fj | h/t | |||
| Group 1 | 0.76 | 0.003 | 0.000 | 0.025 | 0.000 | 0.096 |
| Group 2 | 0.71 | 0.004 | 0.001 | 0.192 | 0.003 | 0.009 |
Disclaimer/Publisher’s Note: The statements, opinions and data contained in all publications are solely those of the individual author(s) and contributor(s) and not of MDPI and/or the editor(s). MDPI and/or the editor(s) disclaim responsibility for any injury to people or property resulting from any ideas, methods, instructions or products referred to in the content. |
© 2024 by the authors. Licensee MDPI, Basel, Switzerland. This article is an open access article distributed under the terms and conditions of the Creative Commons Attribution (CC BY) license (https://creativecommons.org/licenses/by/4.0/).
Share and Cite
Nazimi, K.; Castro, J.J.; Omi, S.; Ali, B.S. Proposal of Empirical Equations for Masonry Compressive Strength: Considering the Compressive Strength Difference between Bricks and Mortar. Buildings 2024, 14, 1138. https://doi.org/10.3390/buildings14041138
Nazimi K, Castro JJ, Omi S, Ali BS. Proposal of Empirical Equations for Masonry Compressive Strength: Considering the Compressive Strength Difference between Bricks and Mortar. Buildings. 2024; 14(4):1138. https://doi.org/10.3390/buildings14041138
Chicago/Turabian StyleNazimi, Karishma, Juan Jose Castro, Shogo Omi, and Bimkubwa Seif Ali. 2024. "Proposal of Empirical Equations for Masonry Compressive Strength: Considering the Compressive Strength Difference between Bricks and Mortar" Buildings 14, no. 4: 1138. https://doi.org/10.3390/buildings14041138