
Research on the Effect of Aerodynamic Imbalance on Fatigue Performance of a Wind Turbine Foundation with Embedded Steel Ring
Abstract
:1. Introduction
2. Parameters of the WT
3. Effect of Aerodynamic Imbalance on Foundation Loads
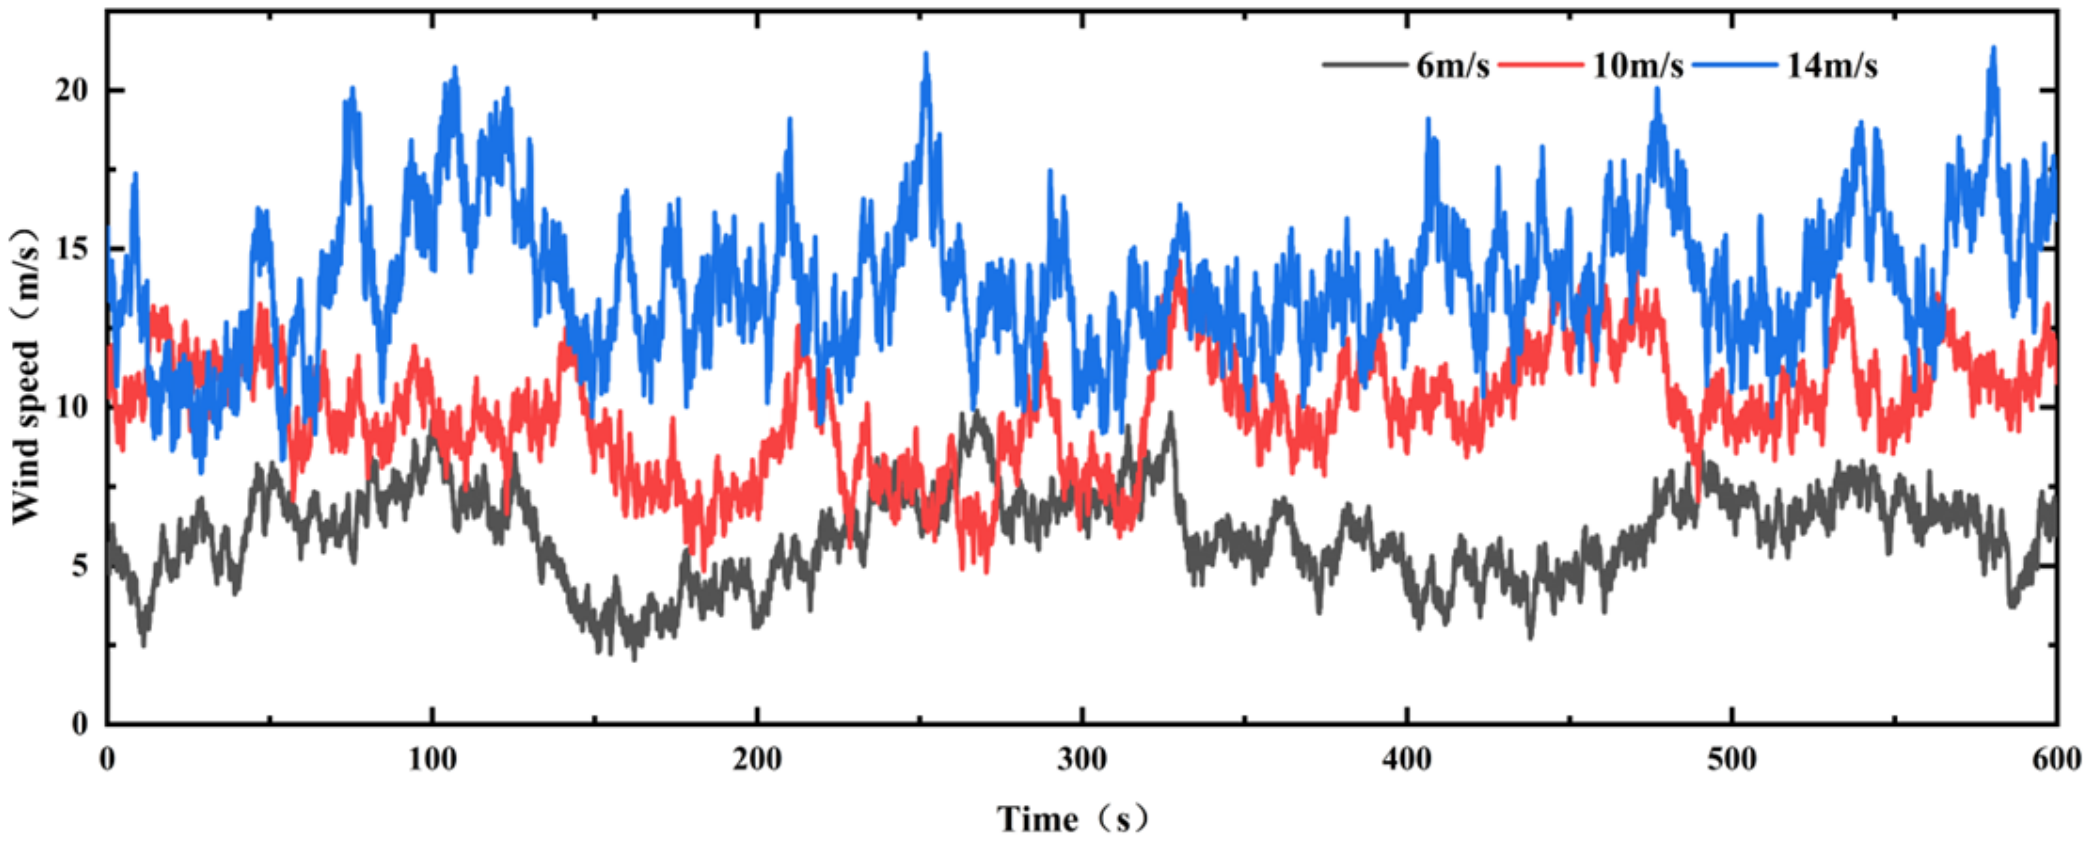
3.1. Simulation of Aerodynamic Imbalance
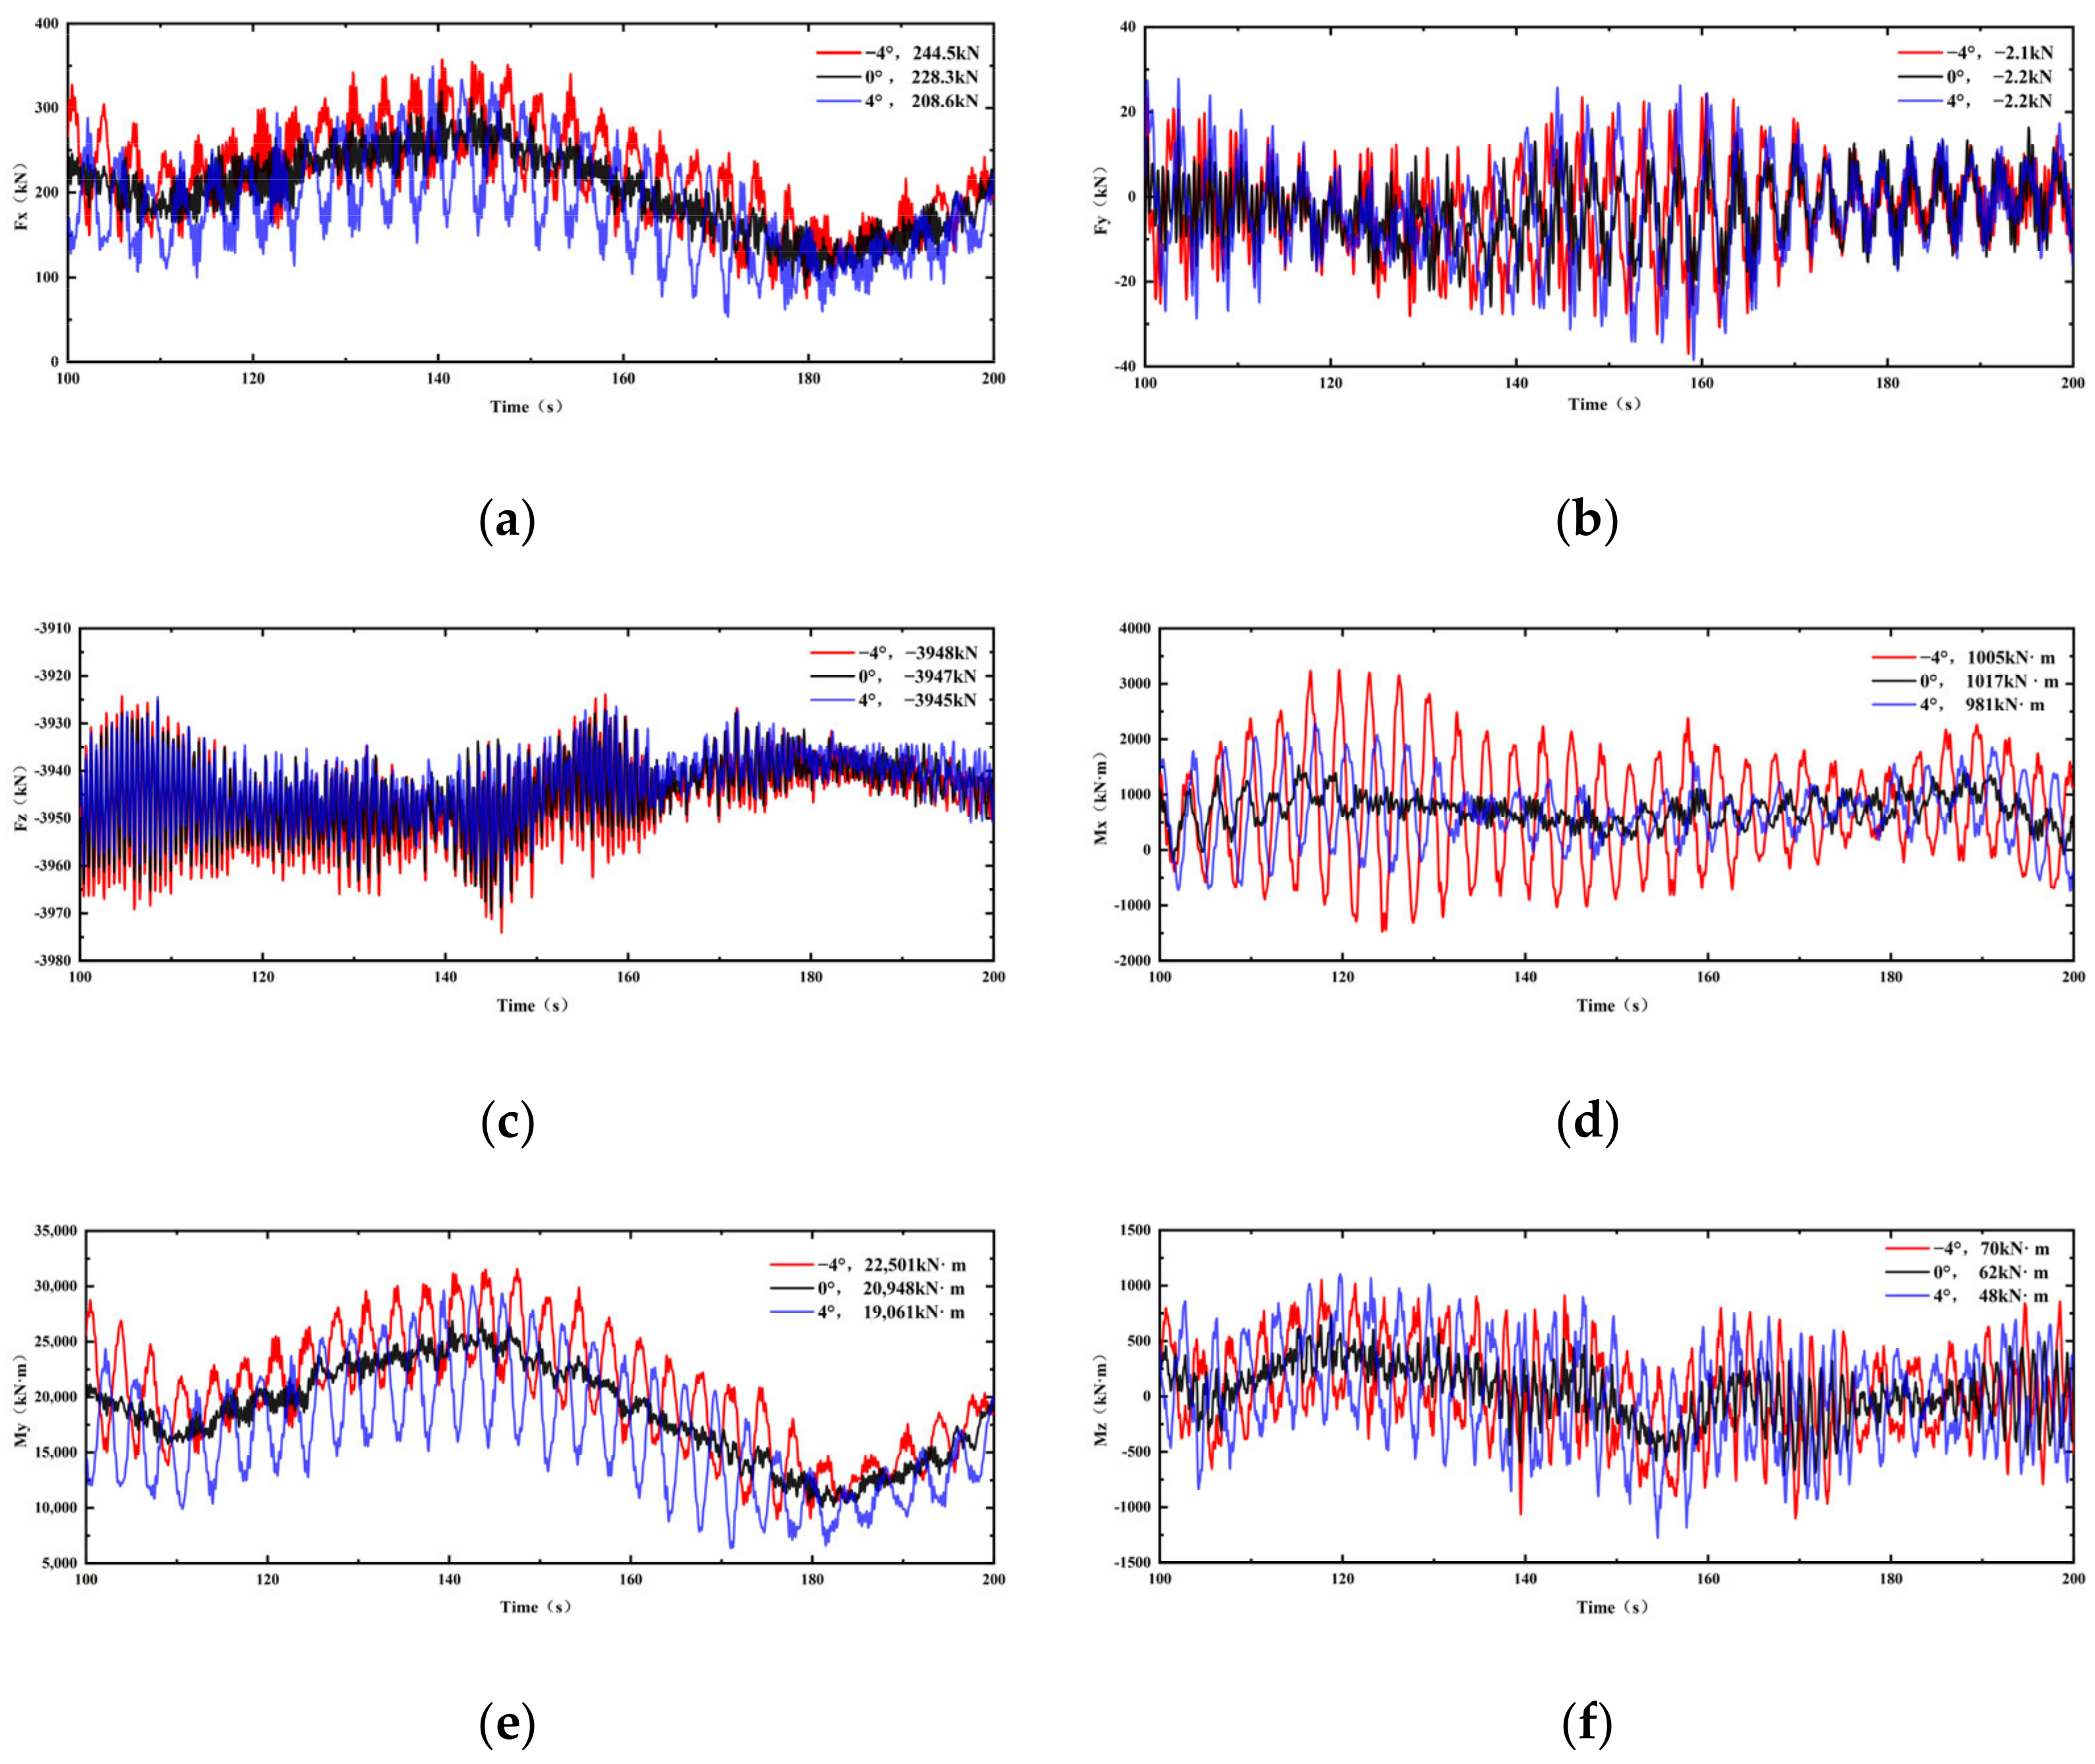
3.2. Effect of PAE and Wind Velocity on the Foundation Loads
4. Effect of Aerodynamic Imbalance on Foundation Stress
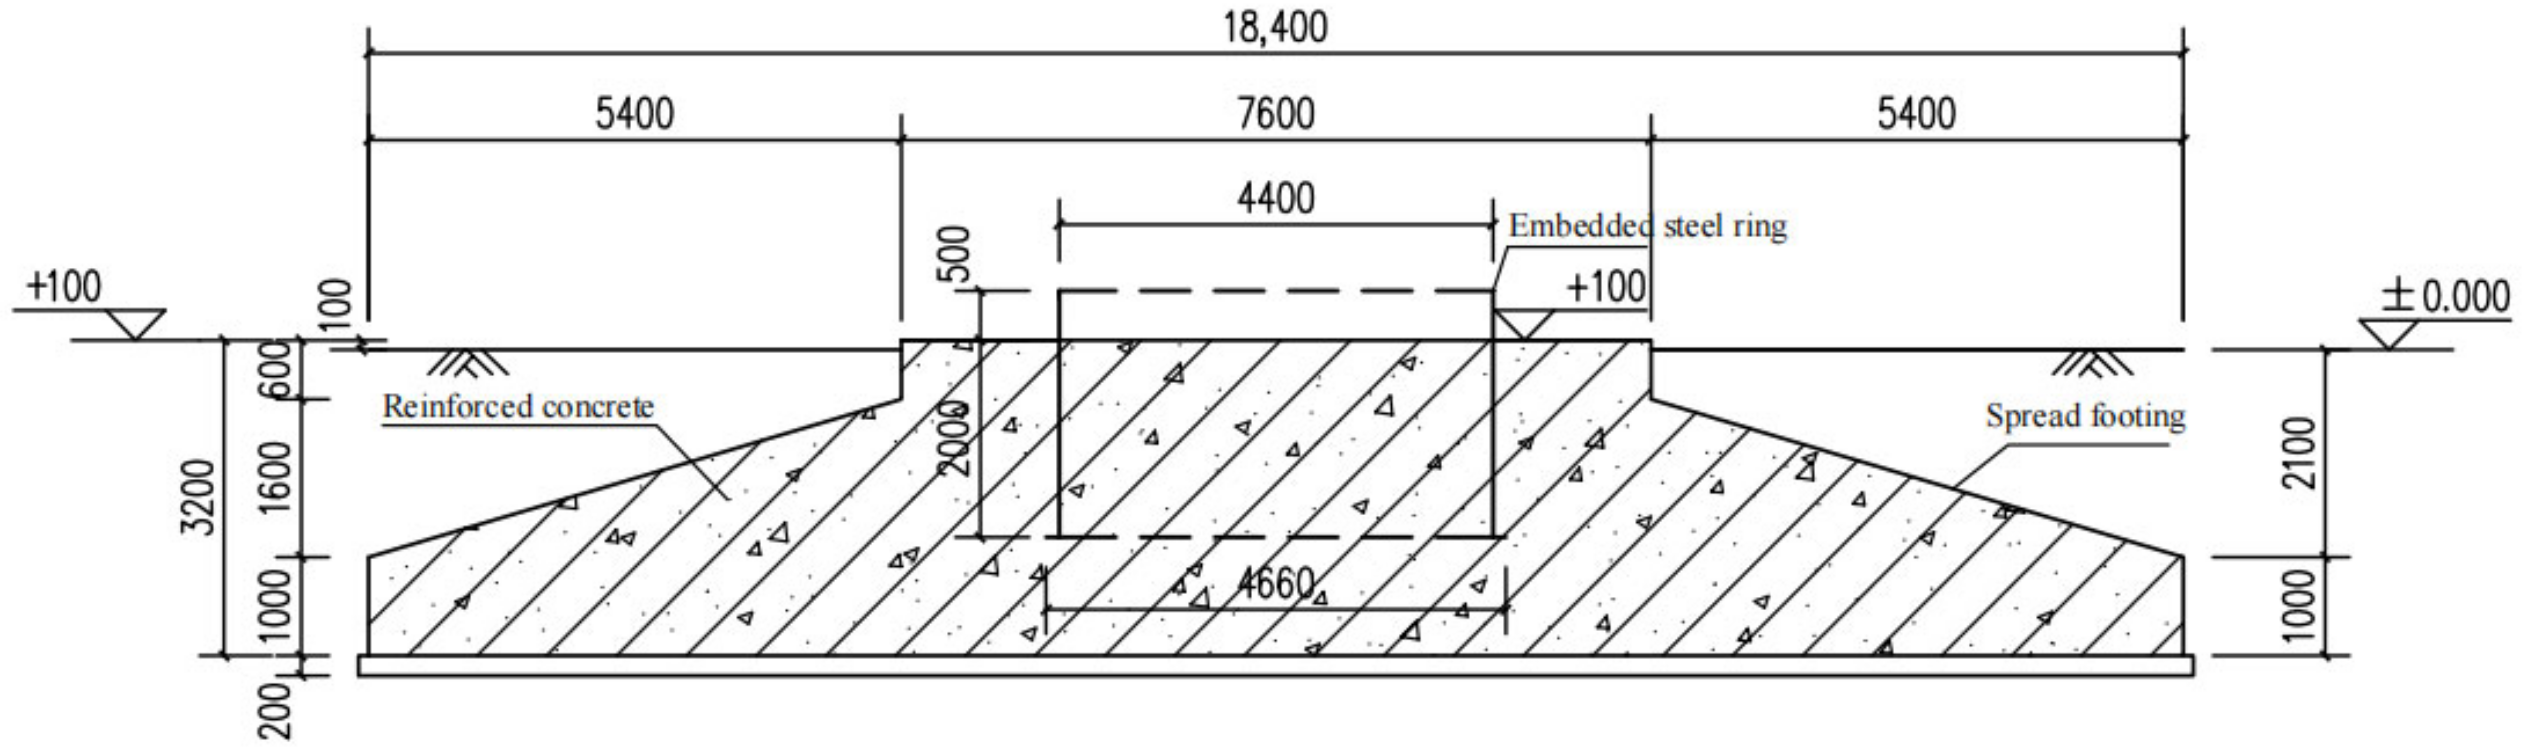
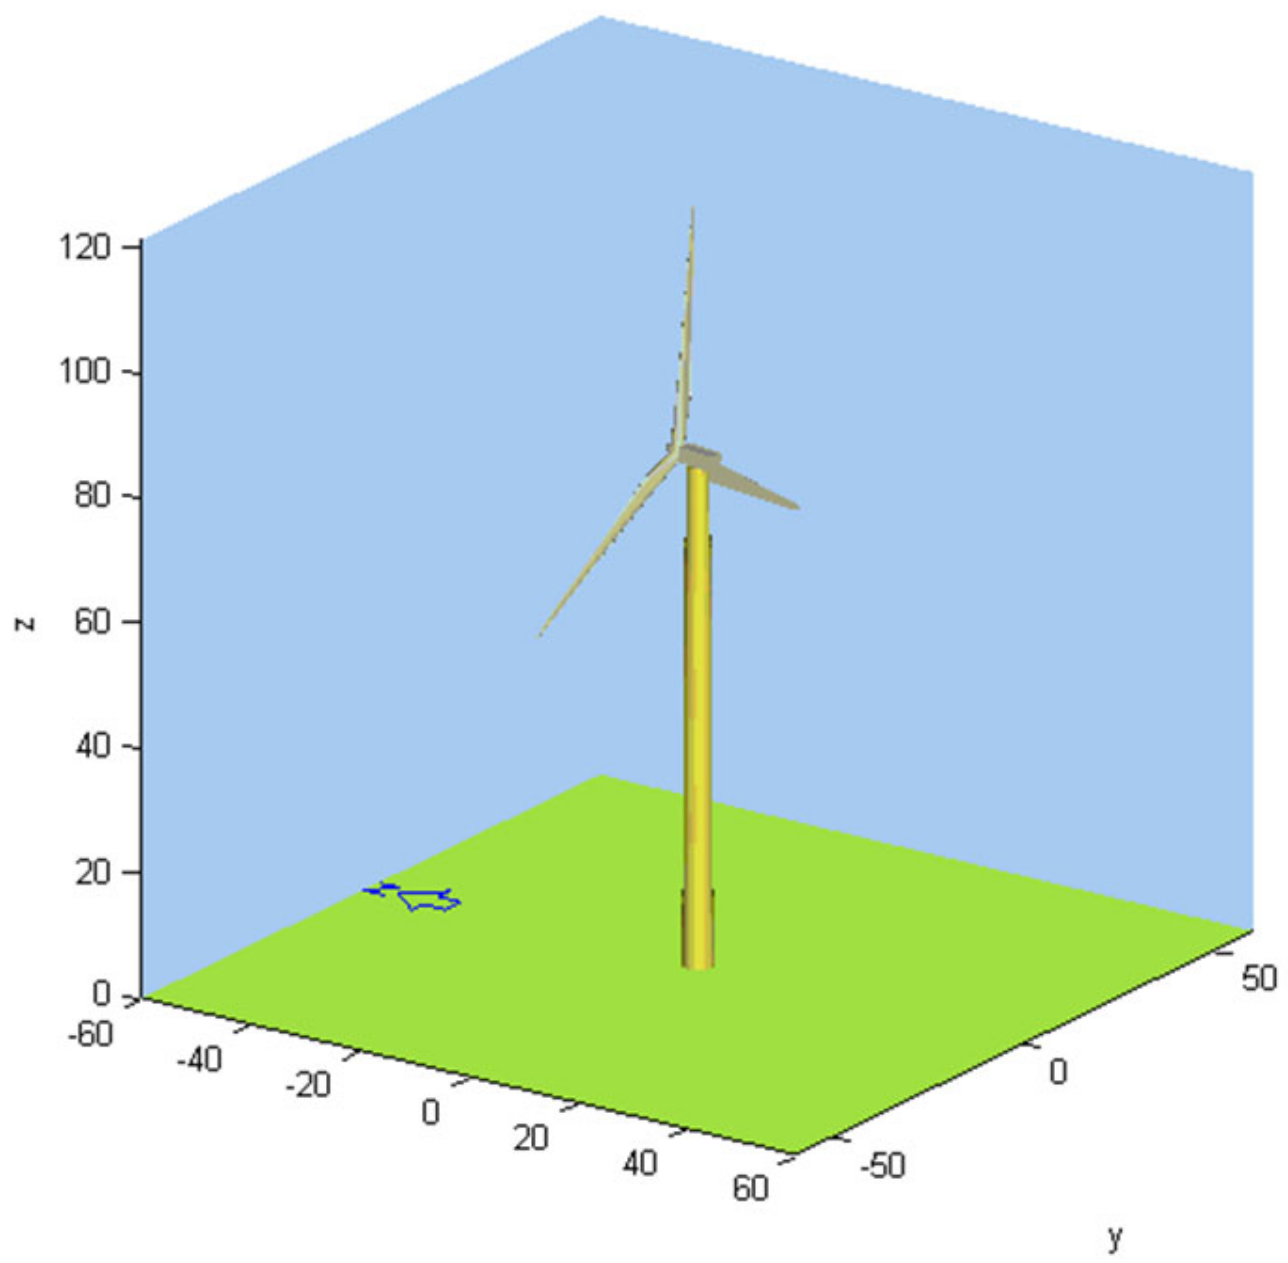
4.1. Finite Element Modeling of the WT Foundation
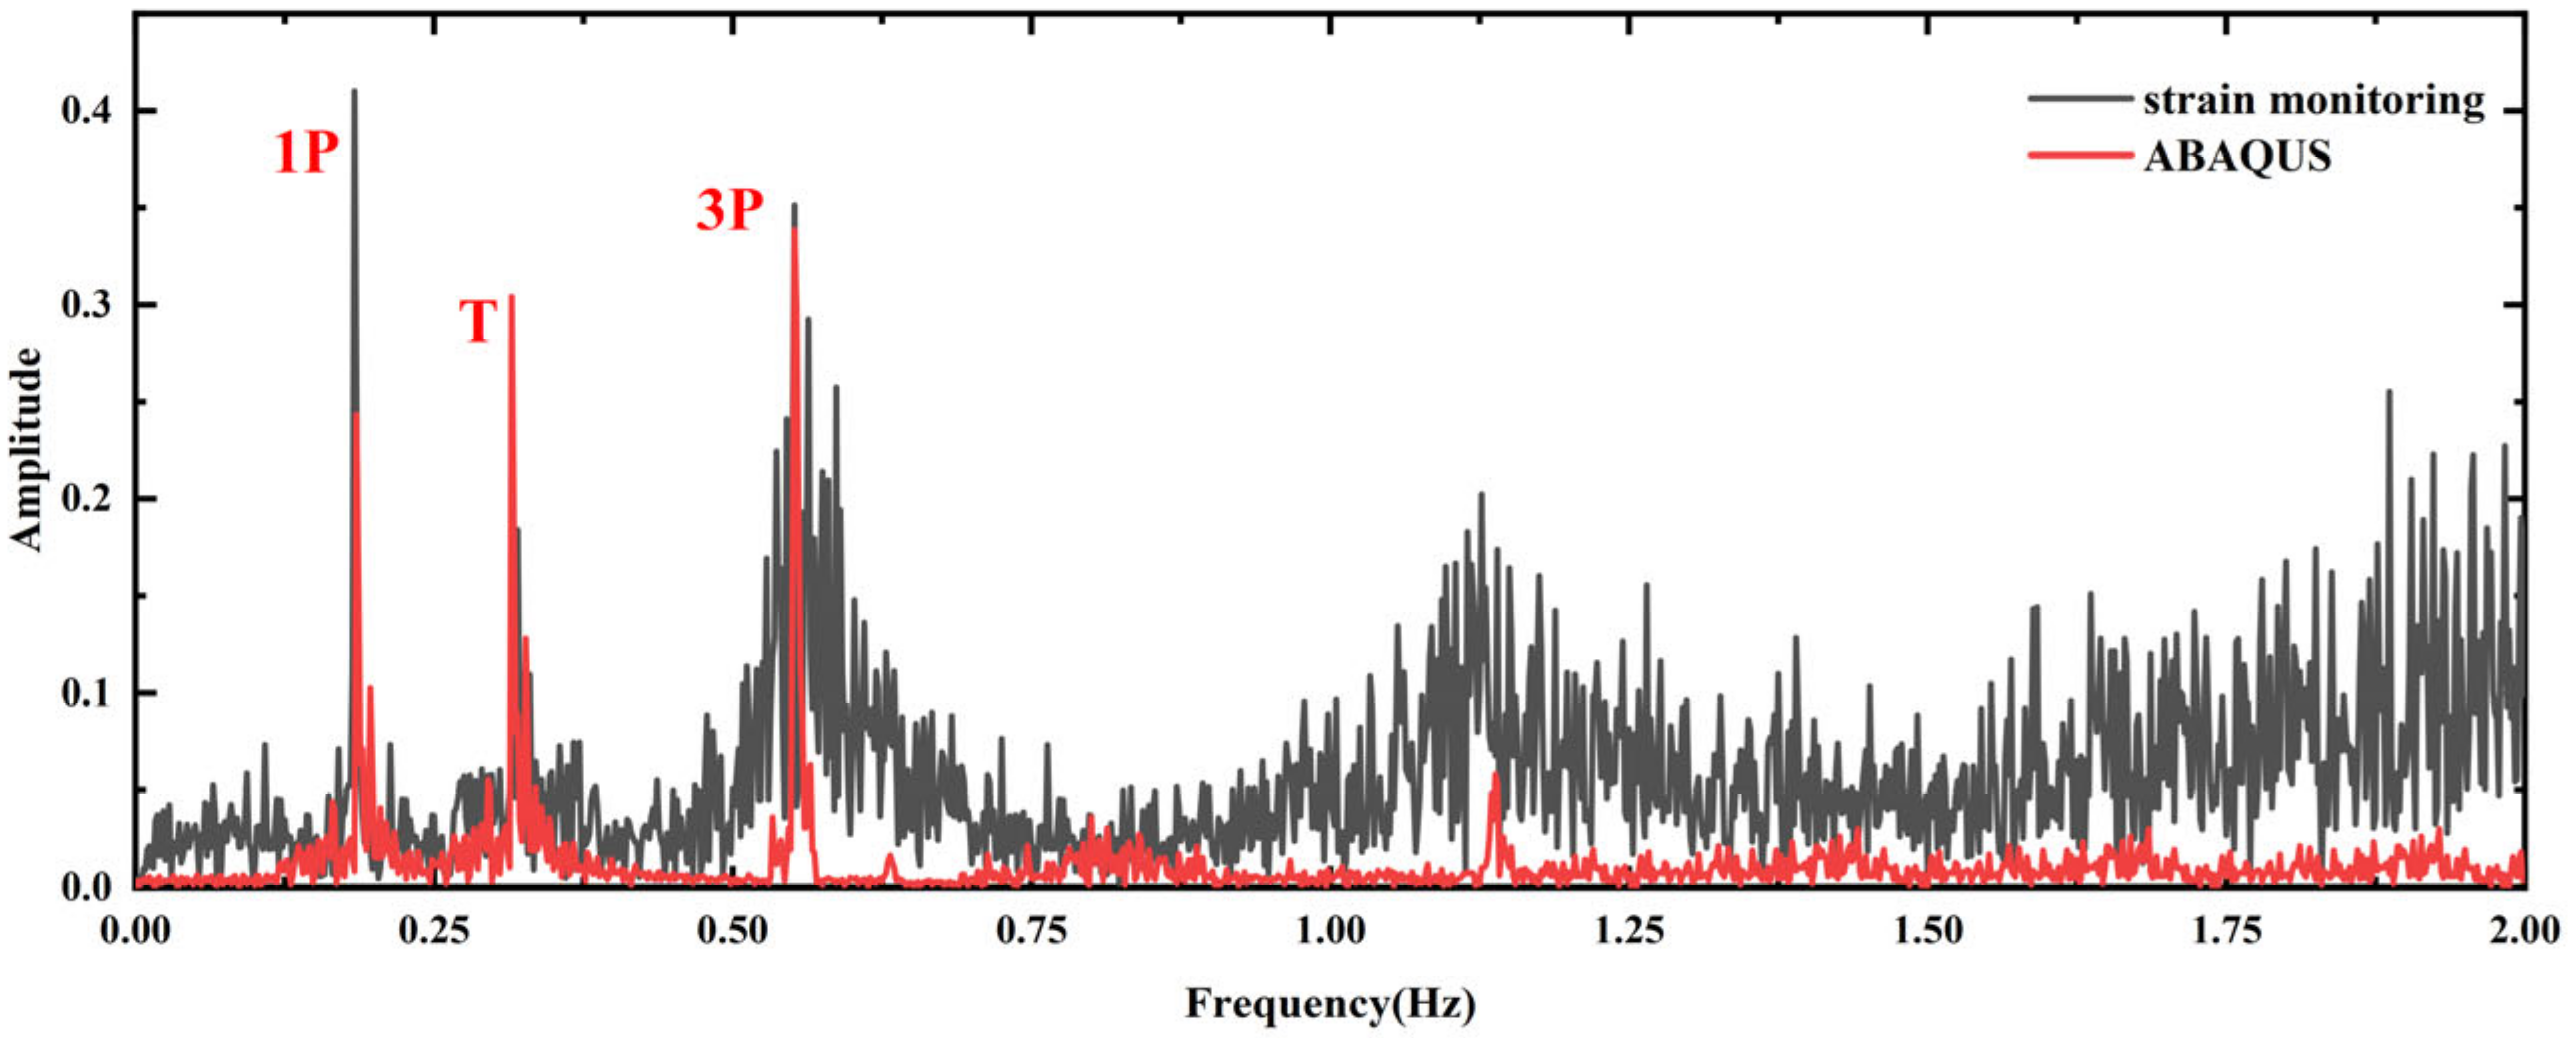
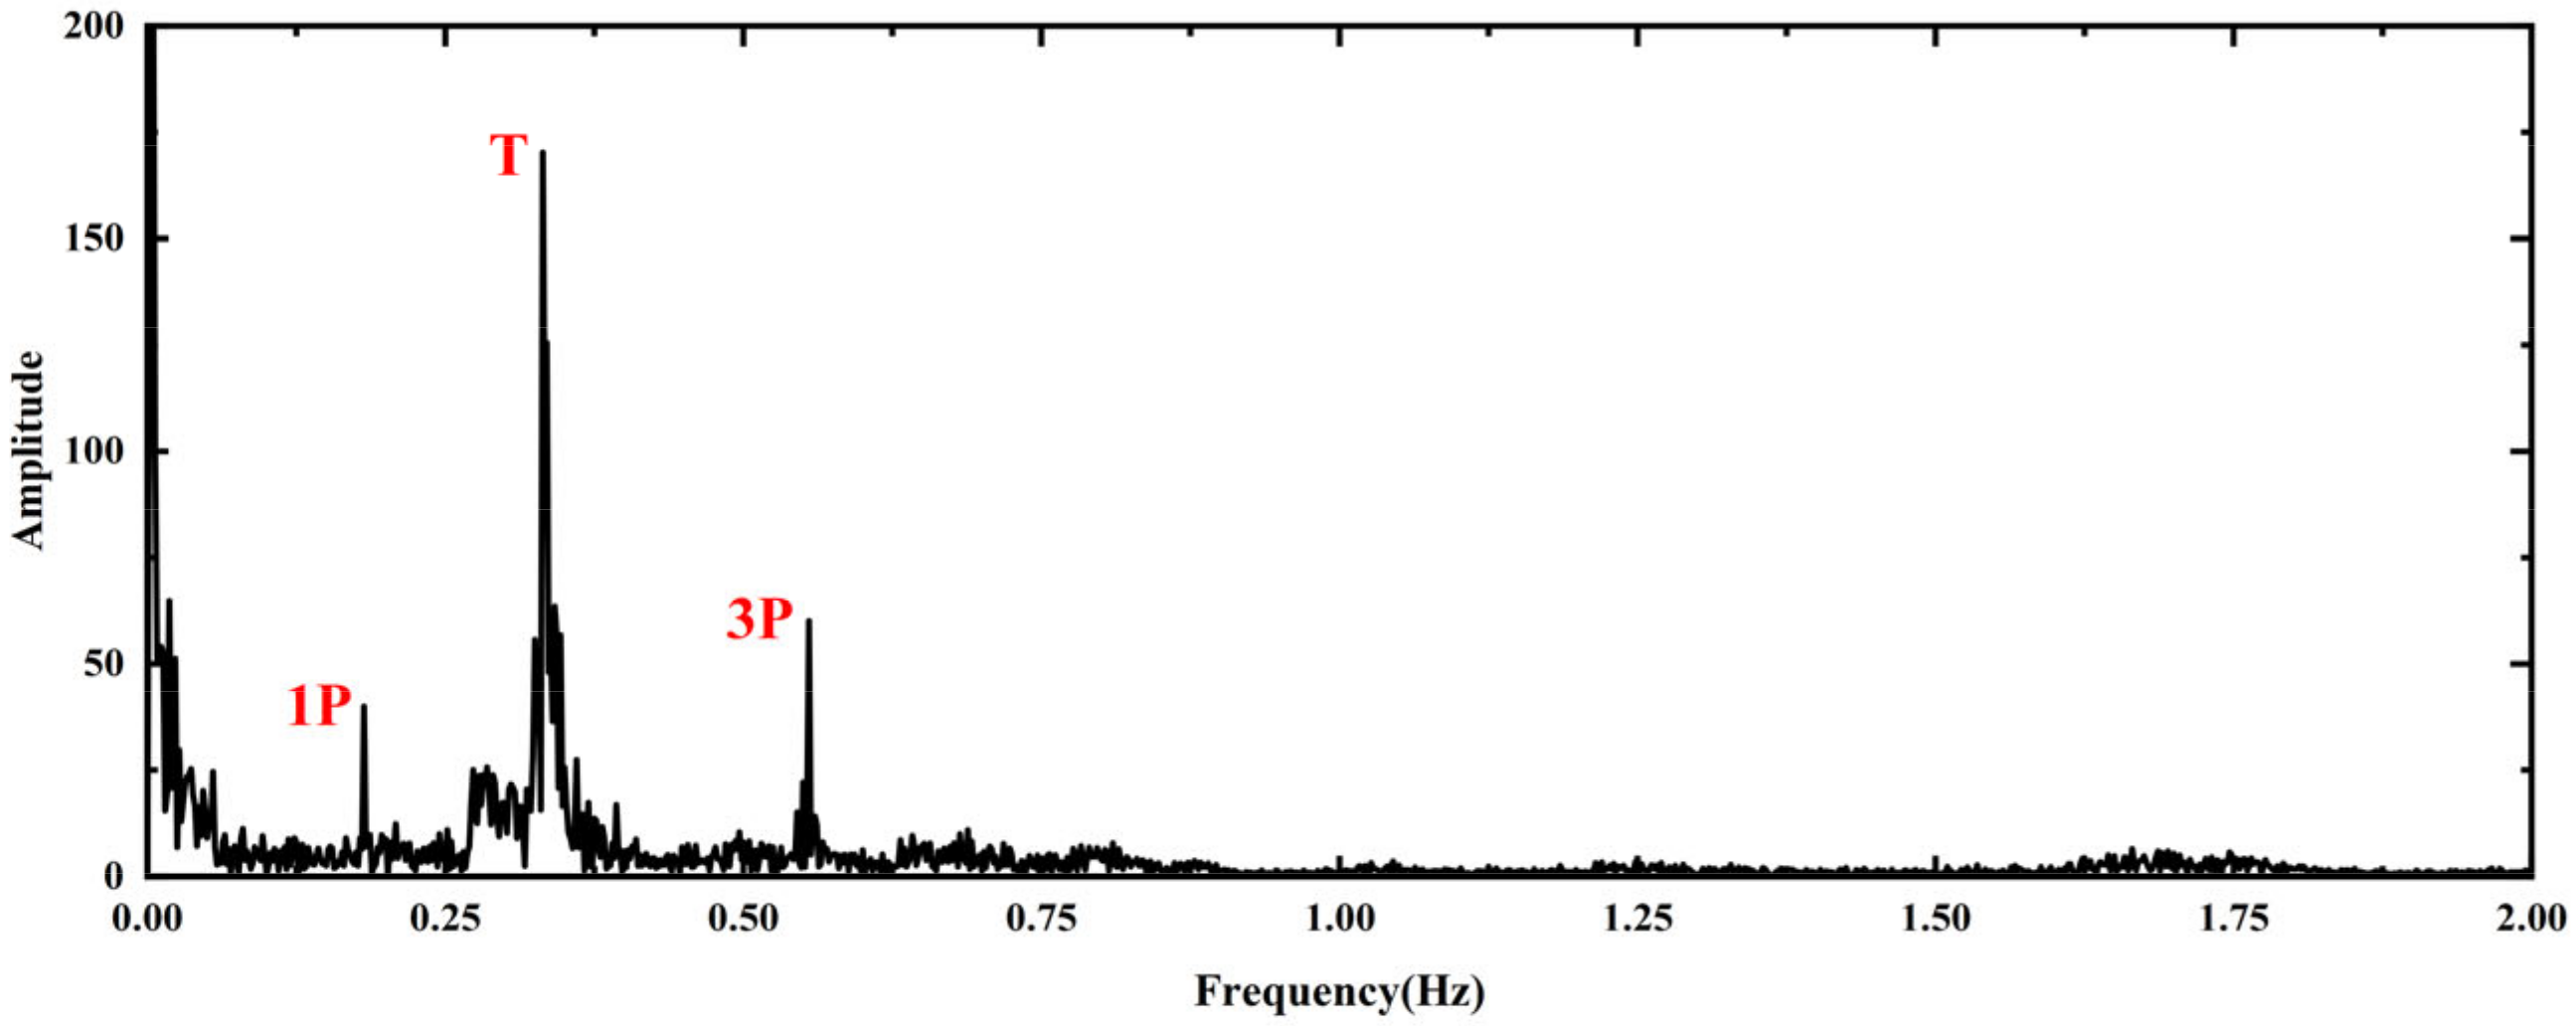
4.2. Model Validation
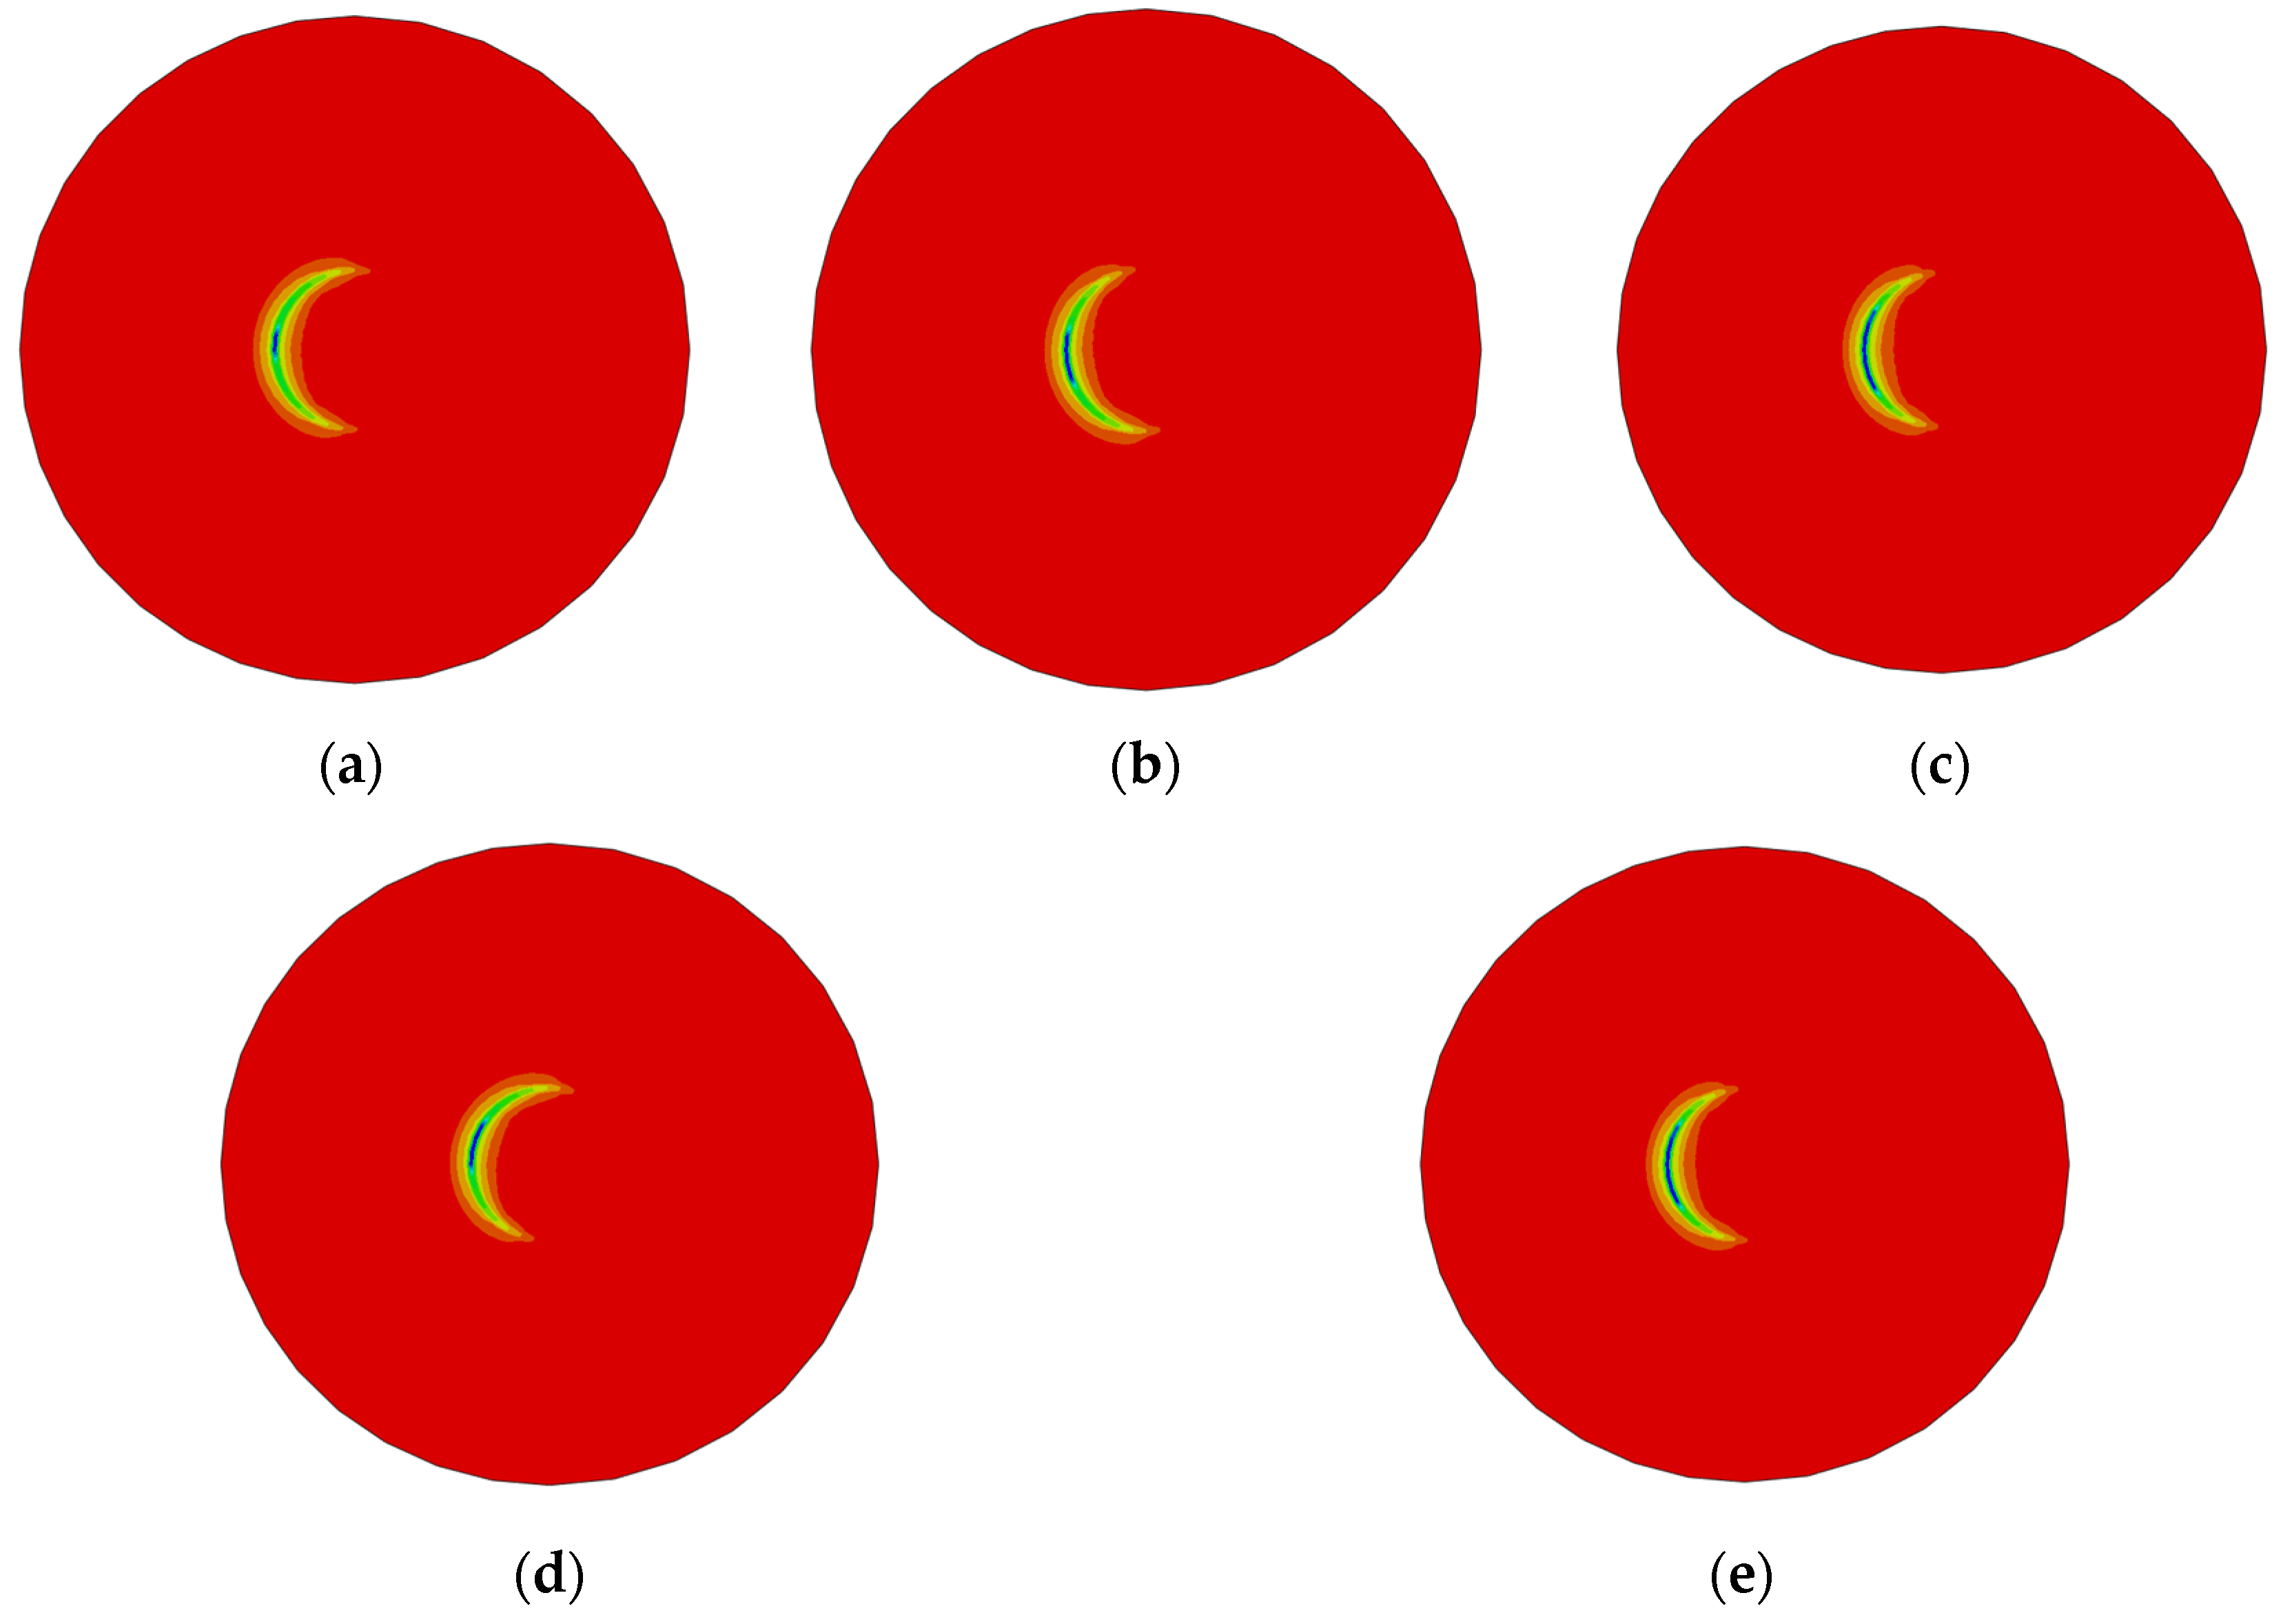
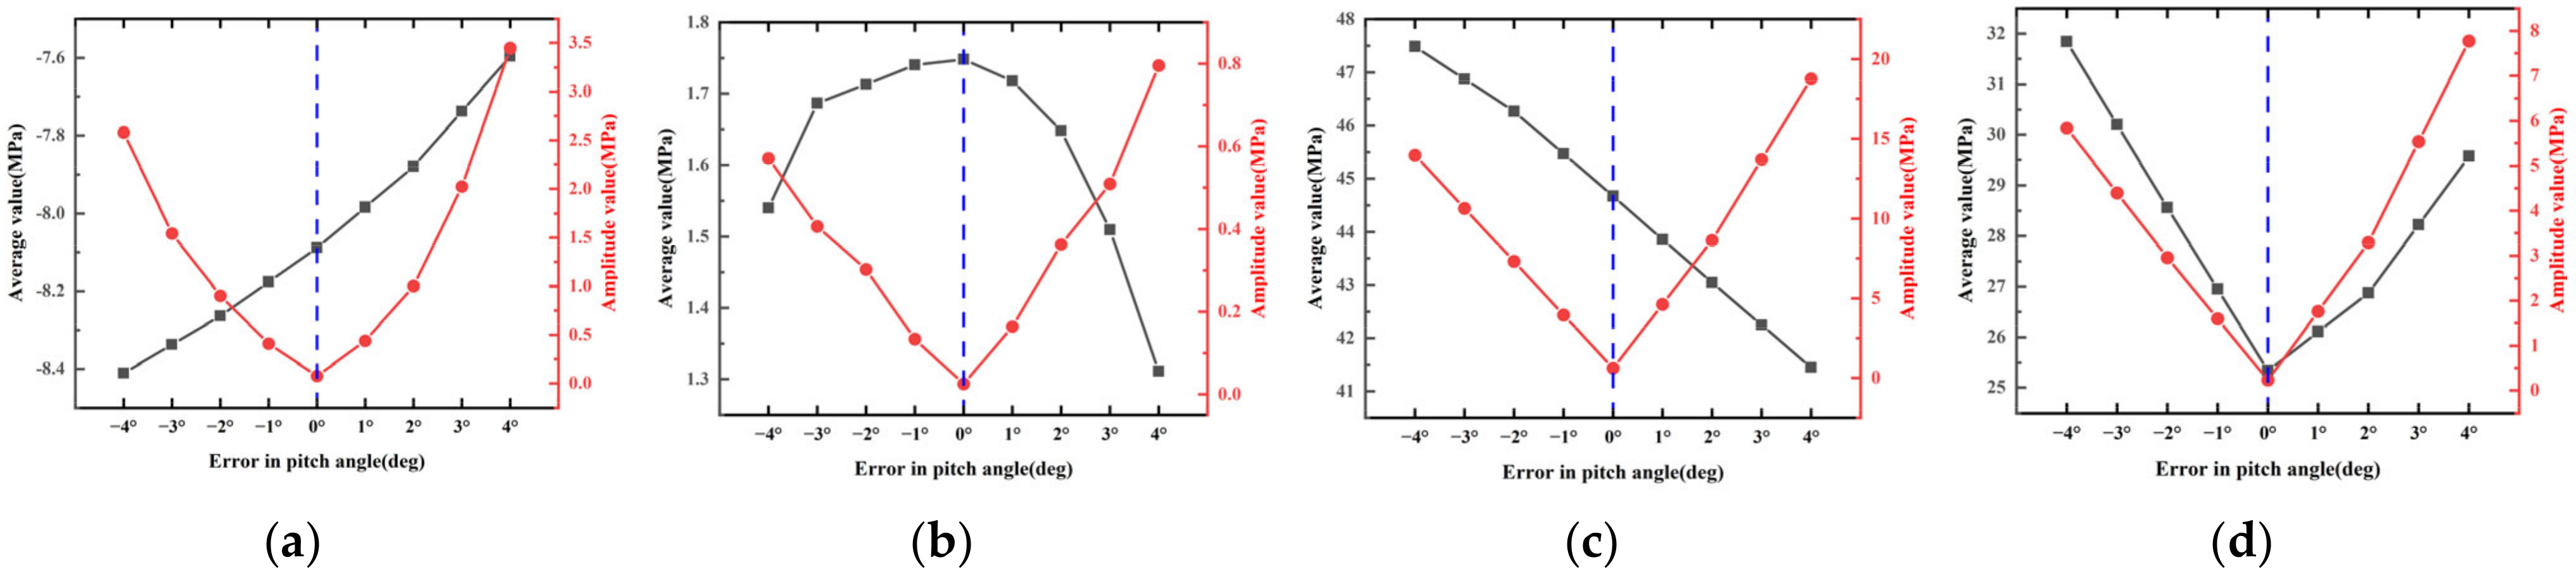
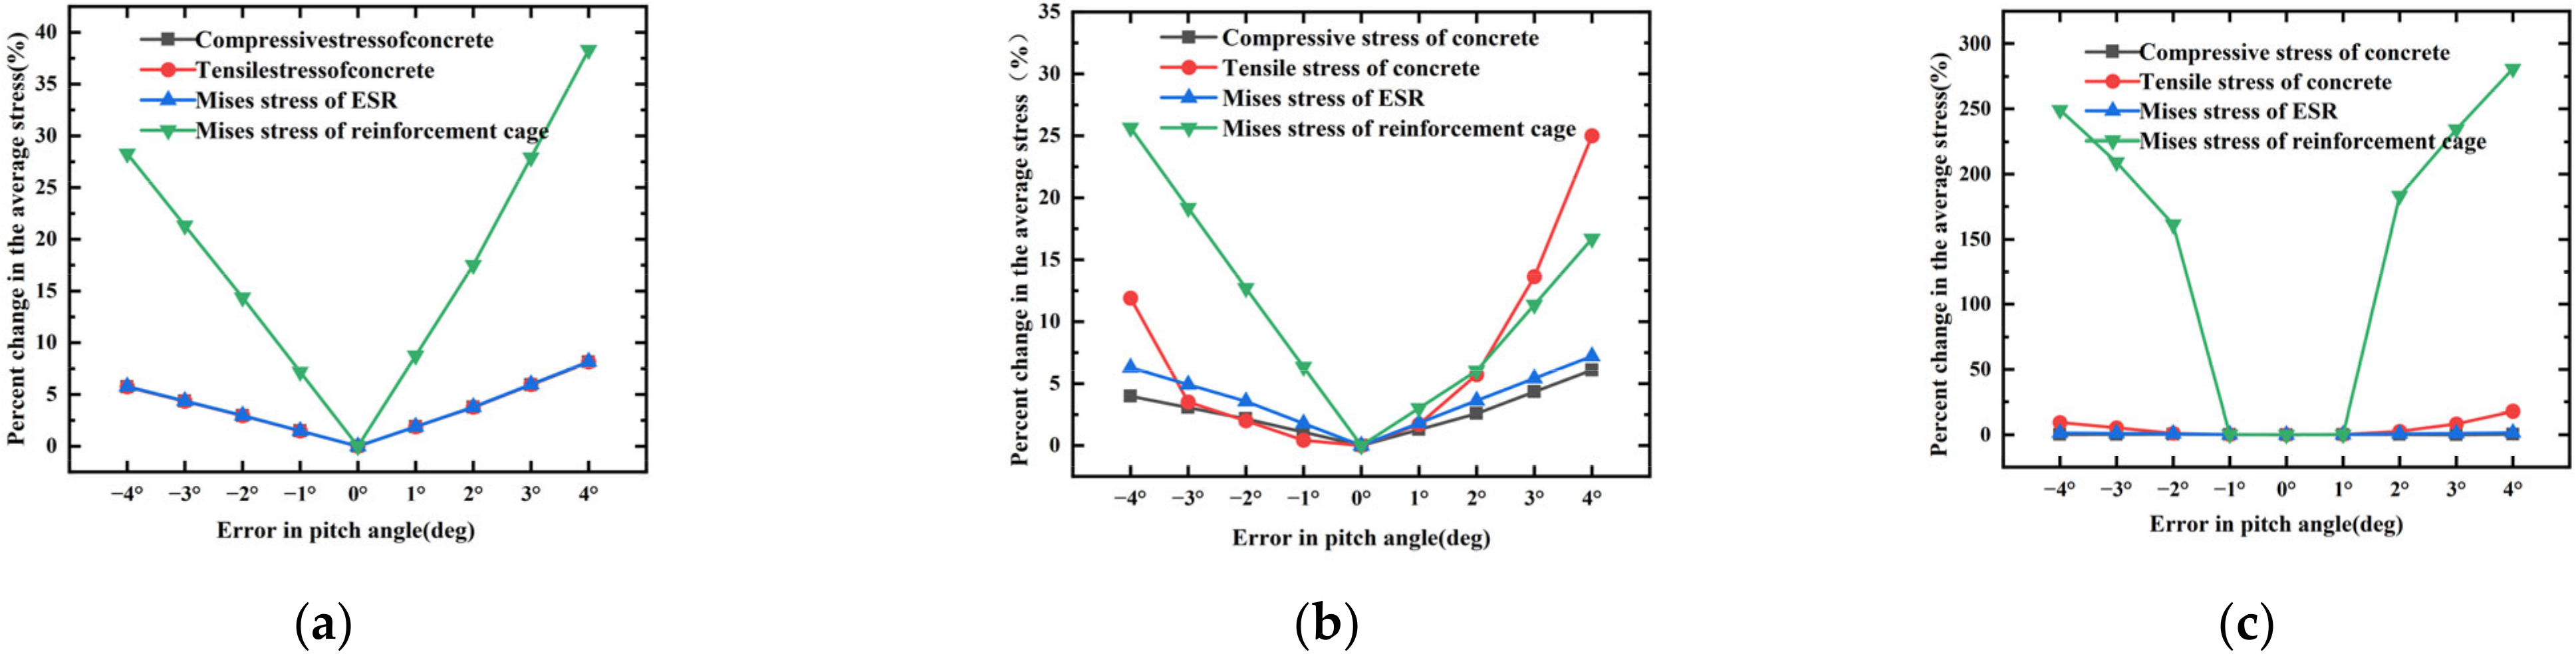
4.3. Effect of PAE and Wind Velocity on Foundation Stress
5. Analysis of the Fatigue Damage to the WT Foundation Based on Annual SCADA Data
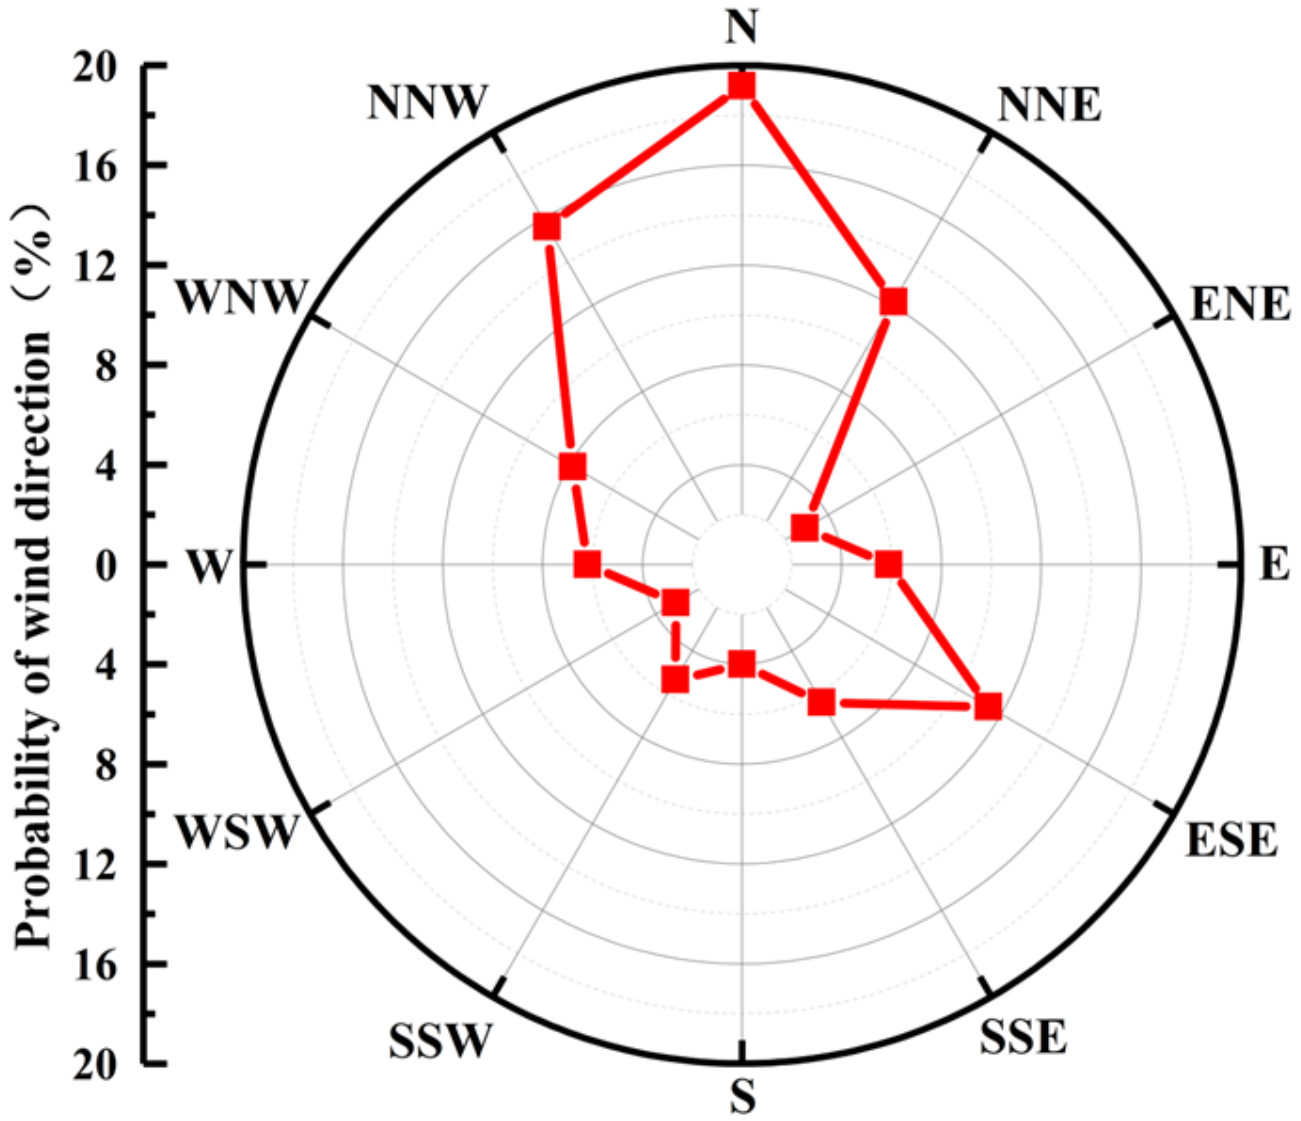
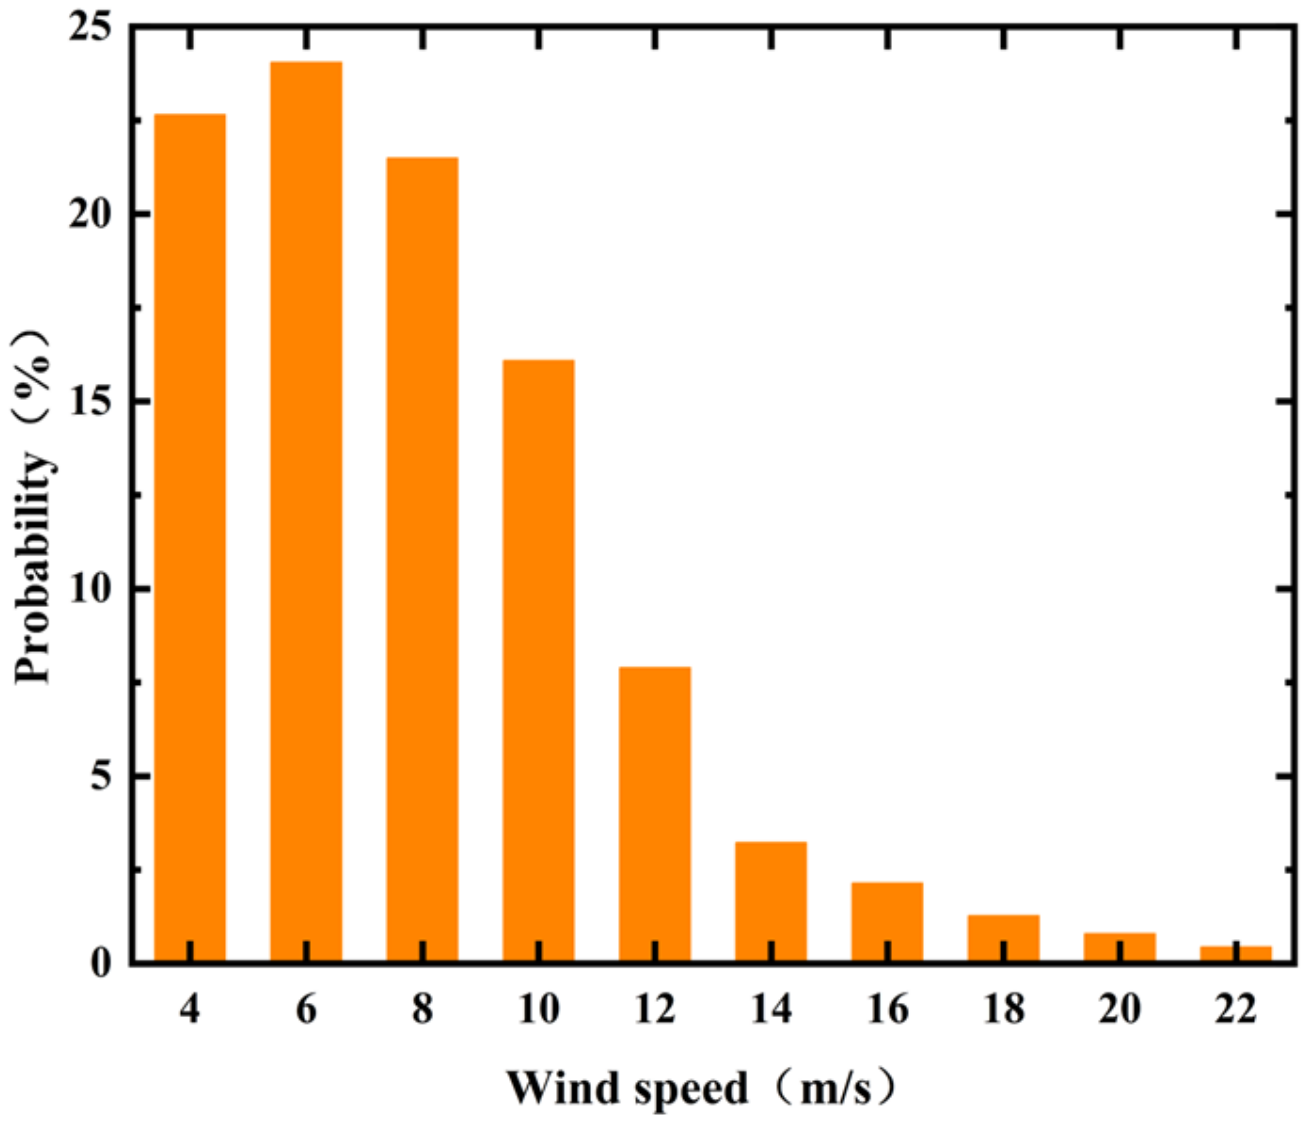
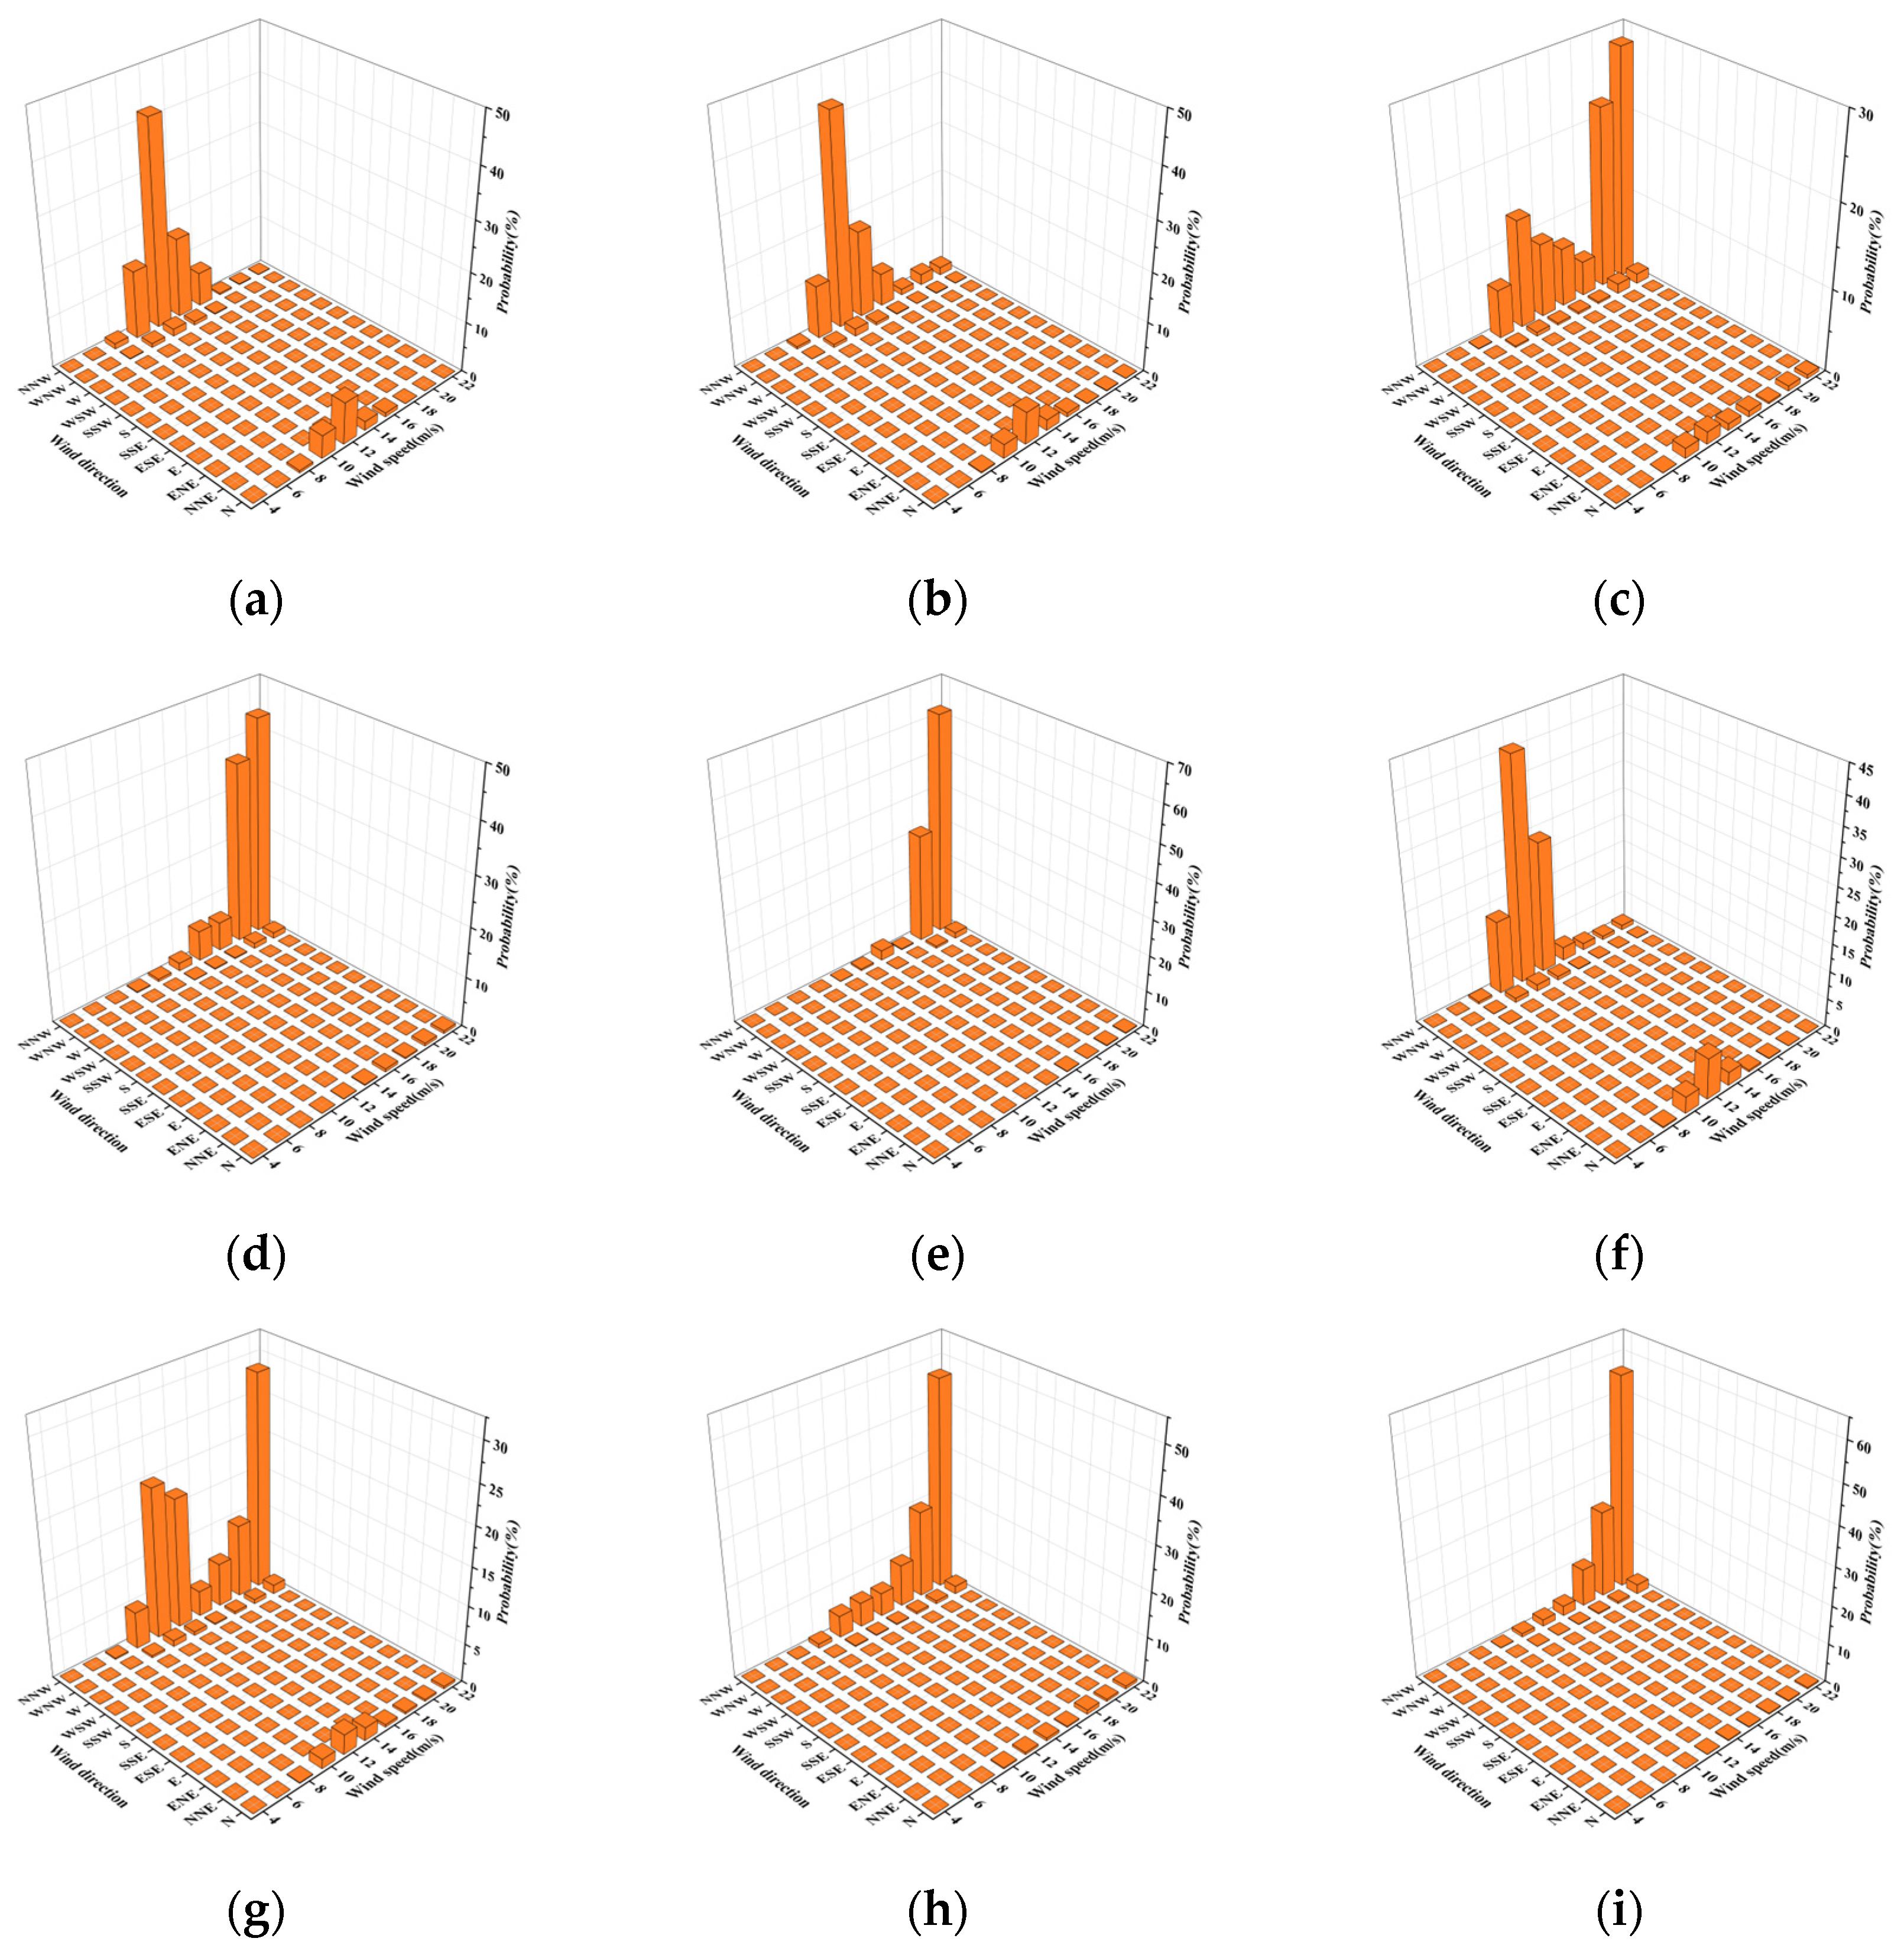
5.1. One Year of Wind Direction and Speed Analysis
5.2. S–N Curve of Concrete Fatigue Damage
5.3. Calculation Method for Fatigue Damage to the WT Foundation Concrete
5.4. Fatigue Damage to the WT Foundation Concrete Caused by PAE
5.5. Further Analysis
6. Conclusions
- (1)
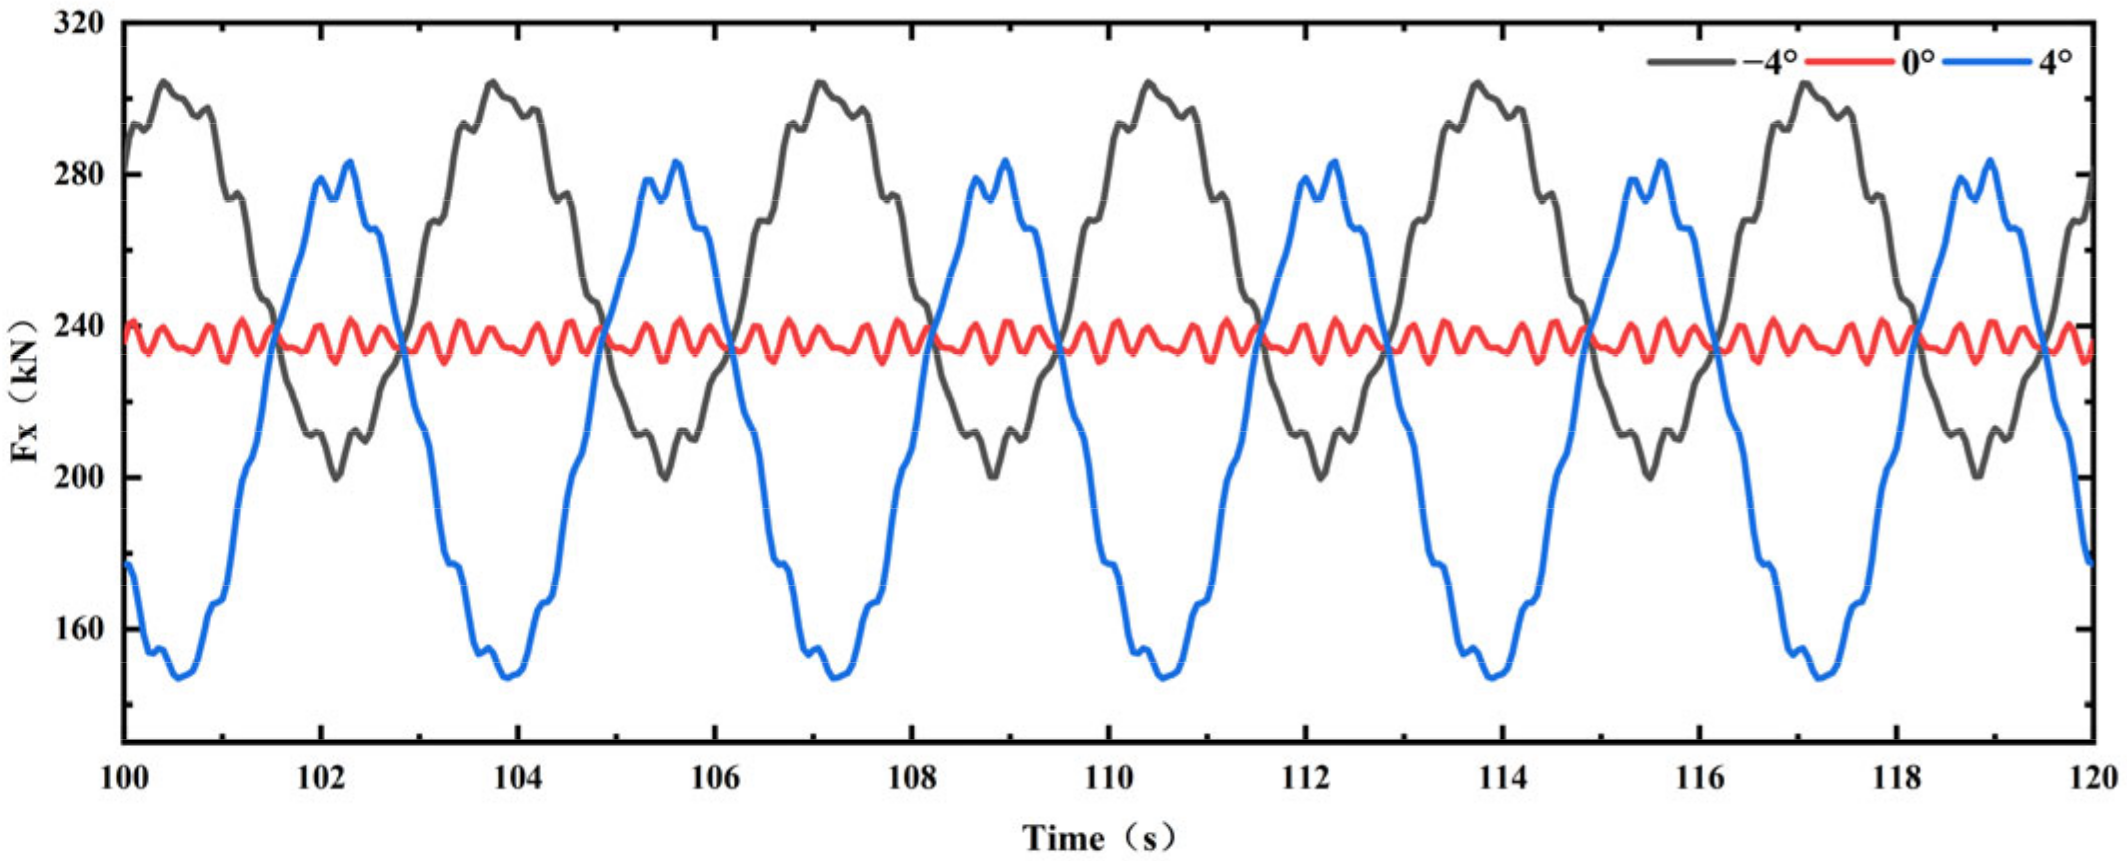
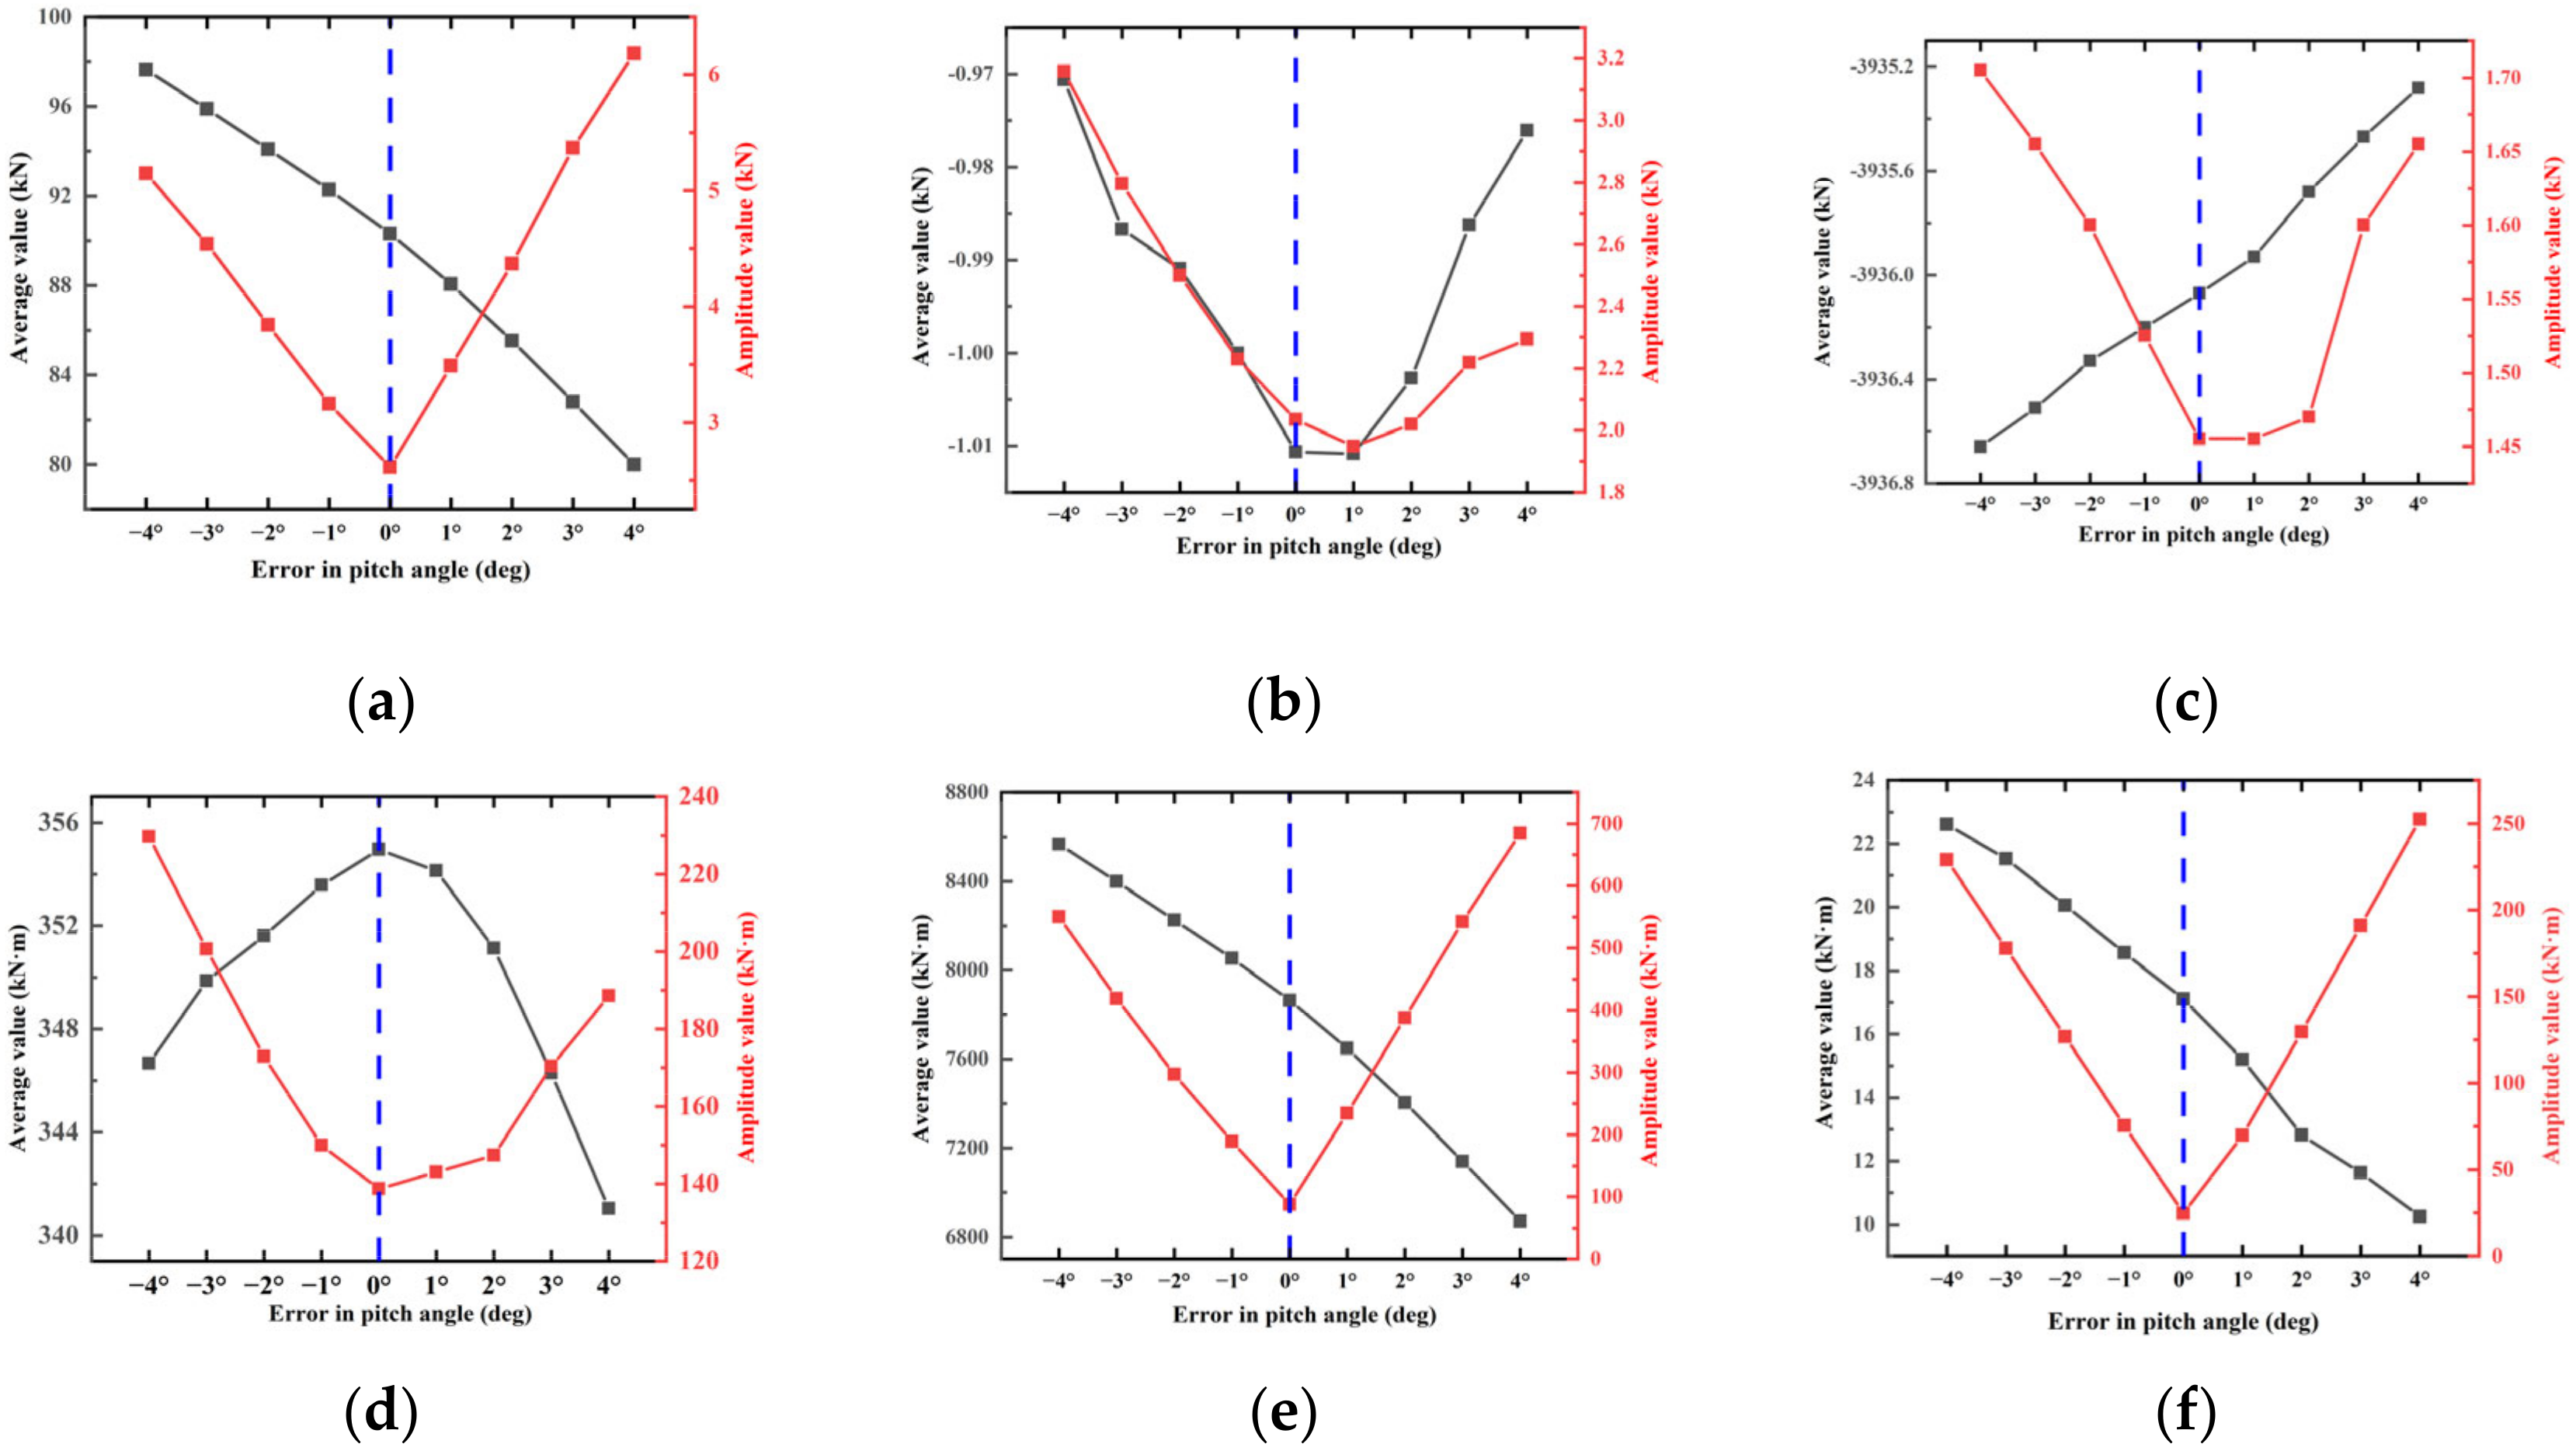
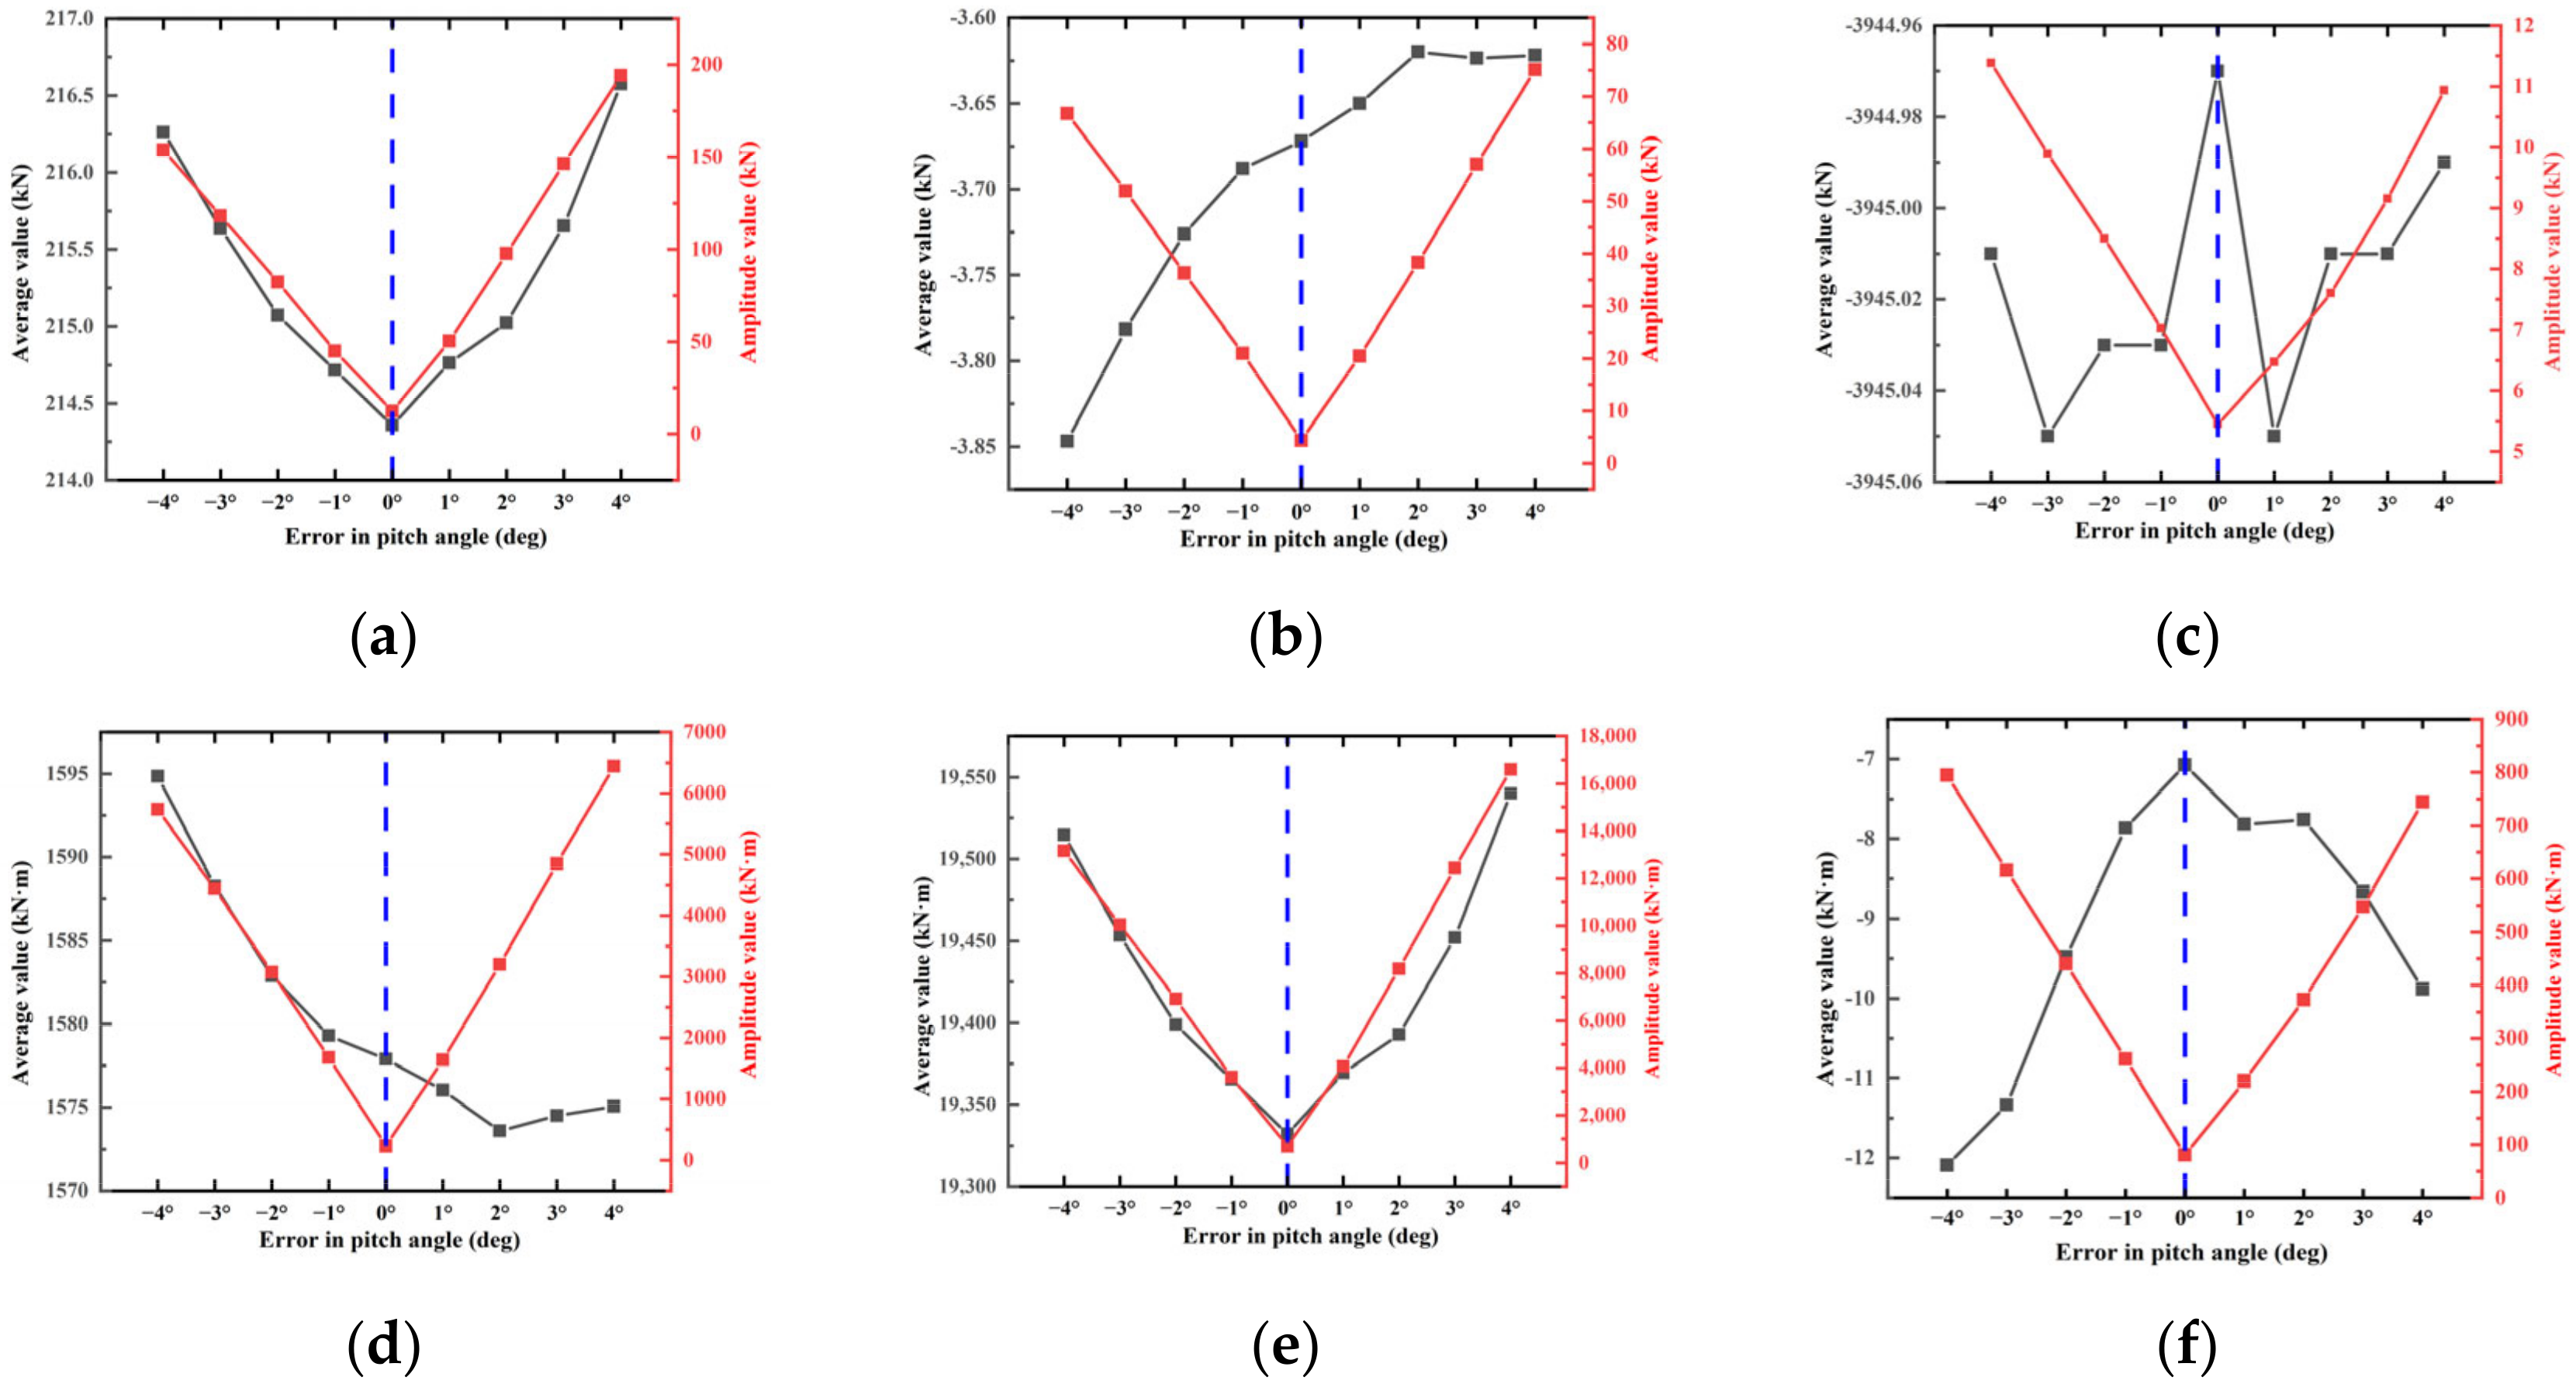
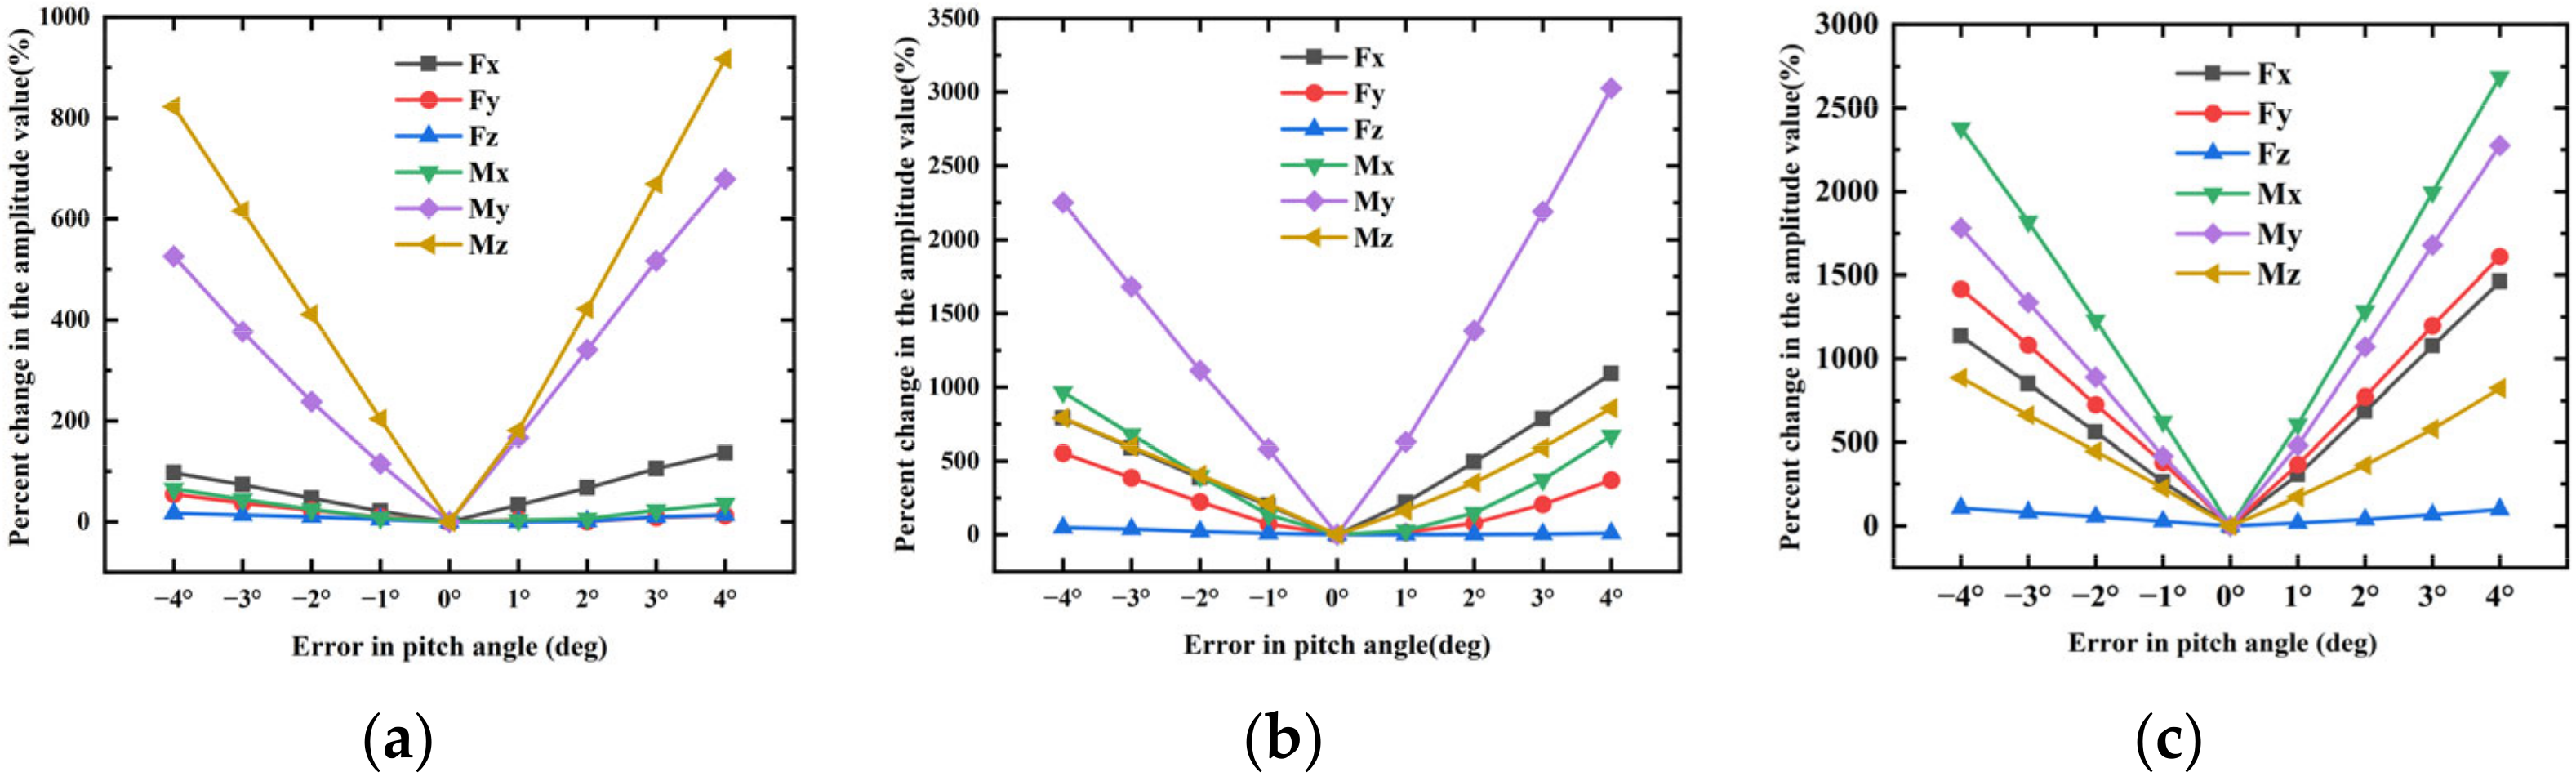
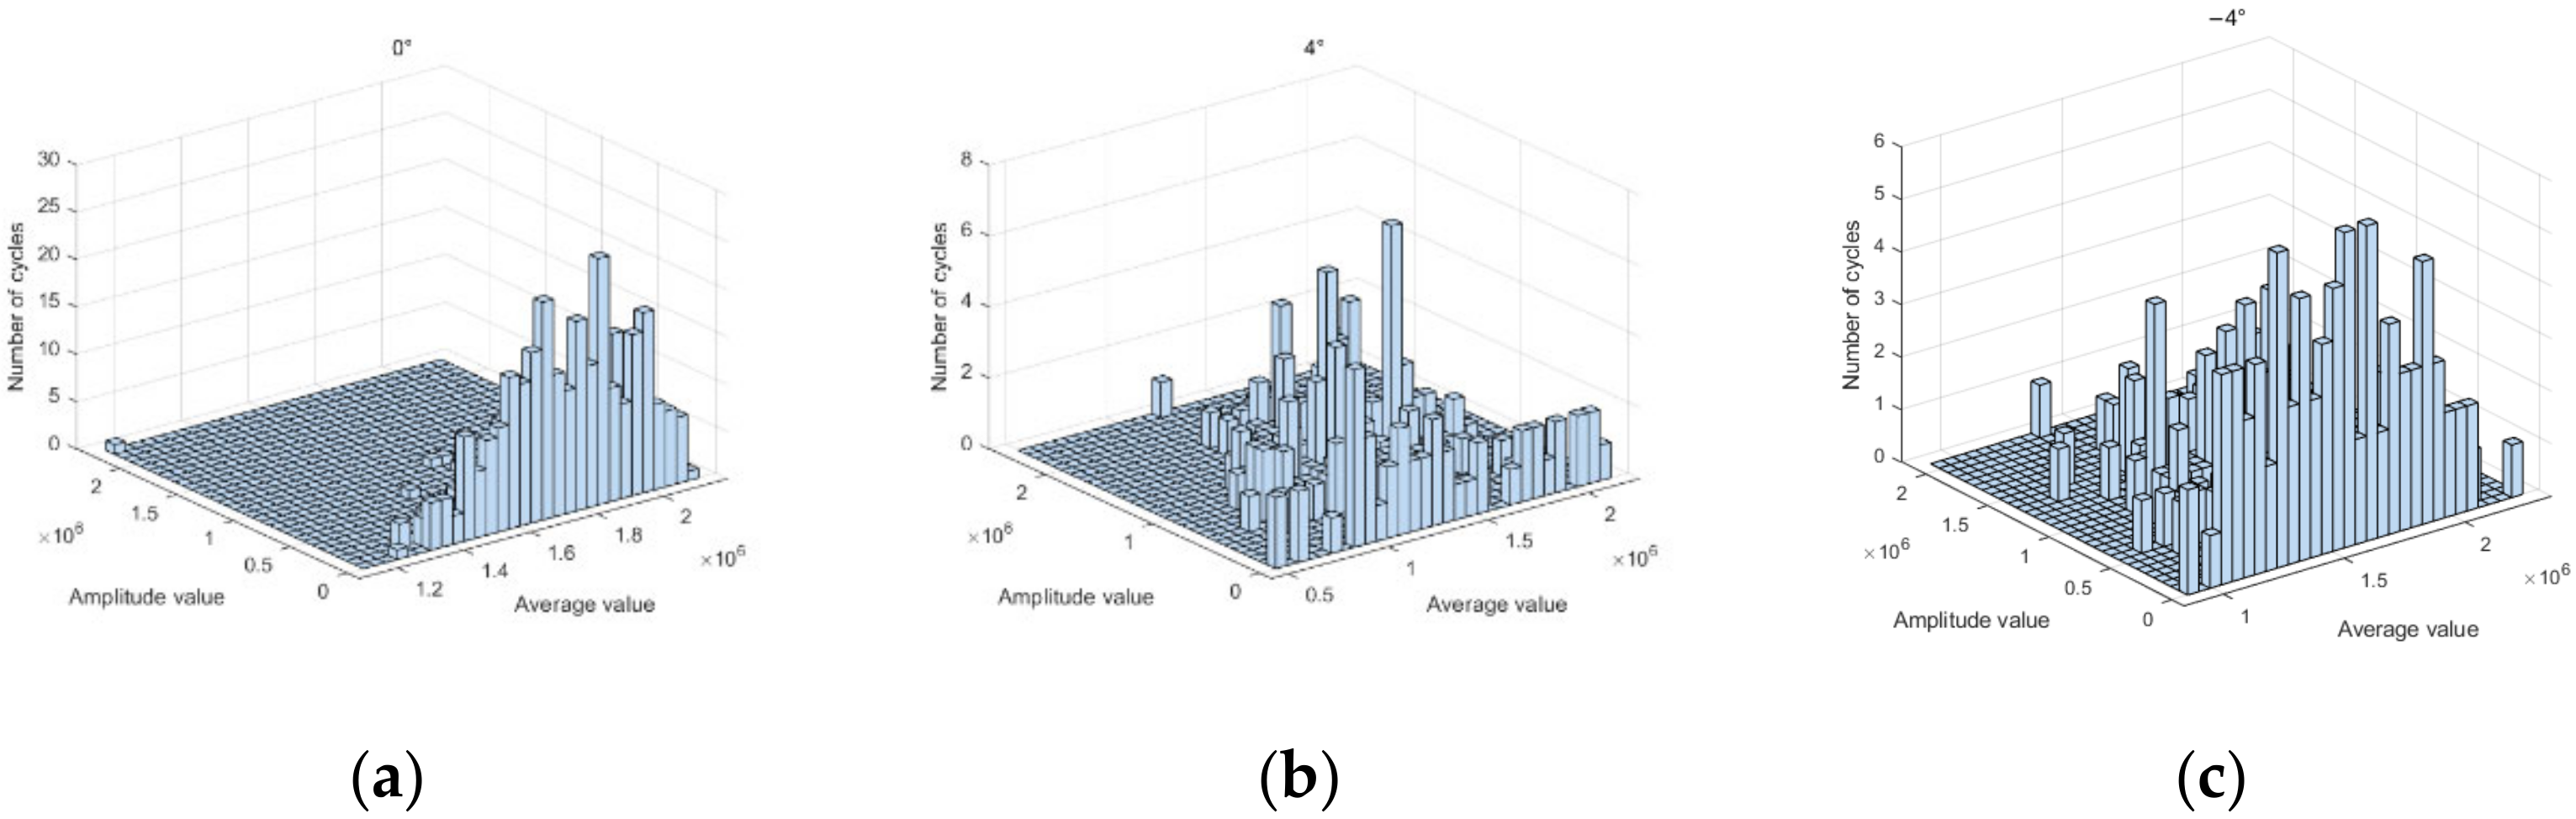
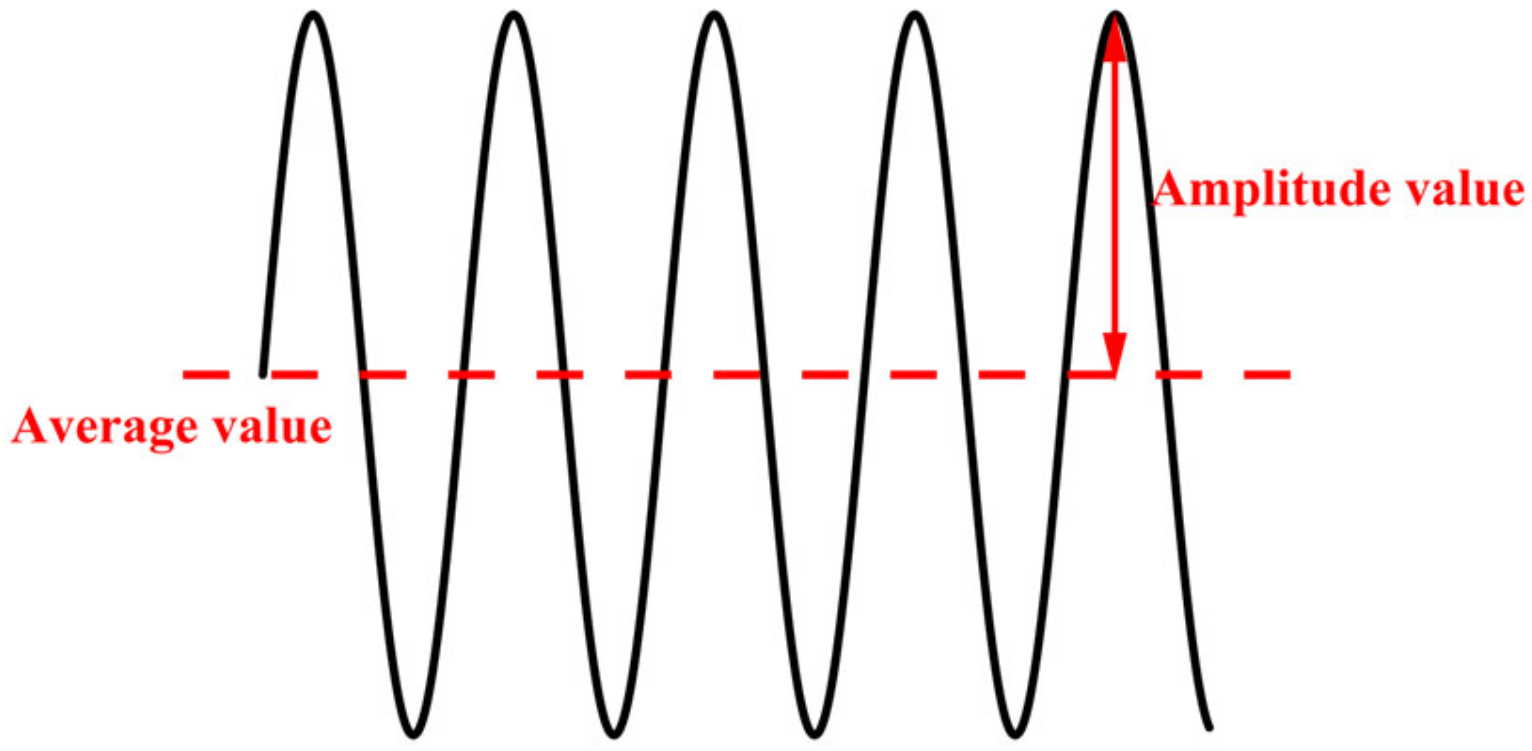
- The influence of PAE under turbulent wind conditions on WT foundation loads exhibits consistency with the patterns observed under steady-state wind conditions. The effect of the PAE on the amplitude value of the load is significantly greater than on the average value of the load. The effect of the PAE on the amplitude value of the load gradually increases with an increase in wind velocity. Among the six foundation loads, the amplitude values of Mx and My are most sensitive to PAE.
- (2)
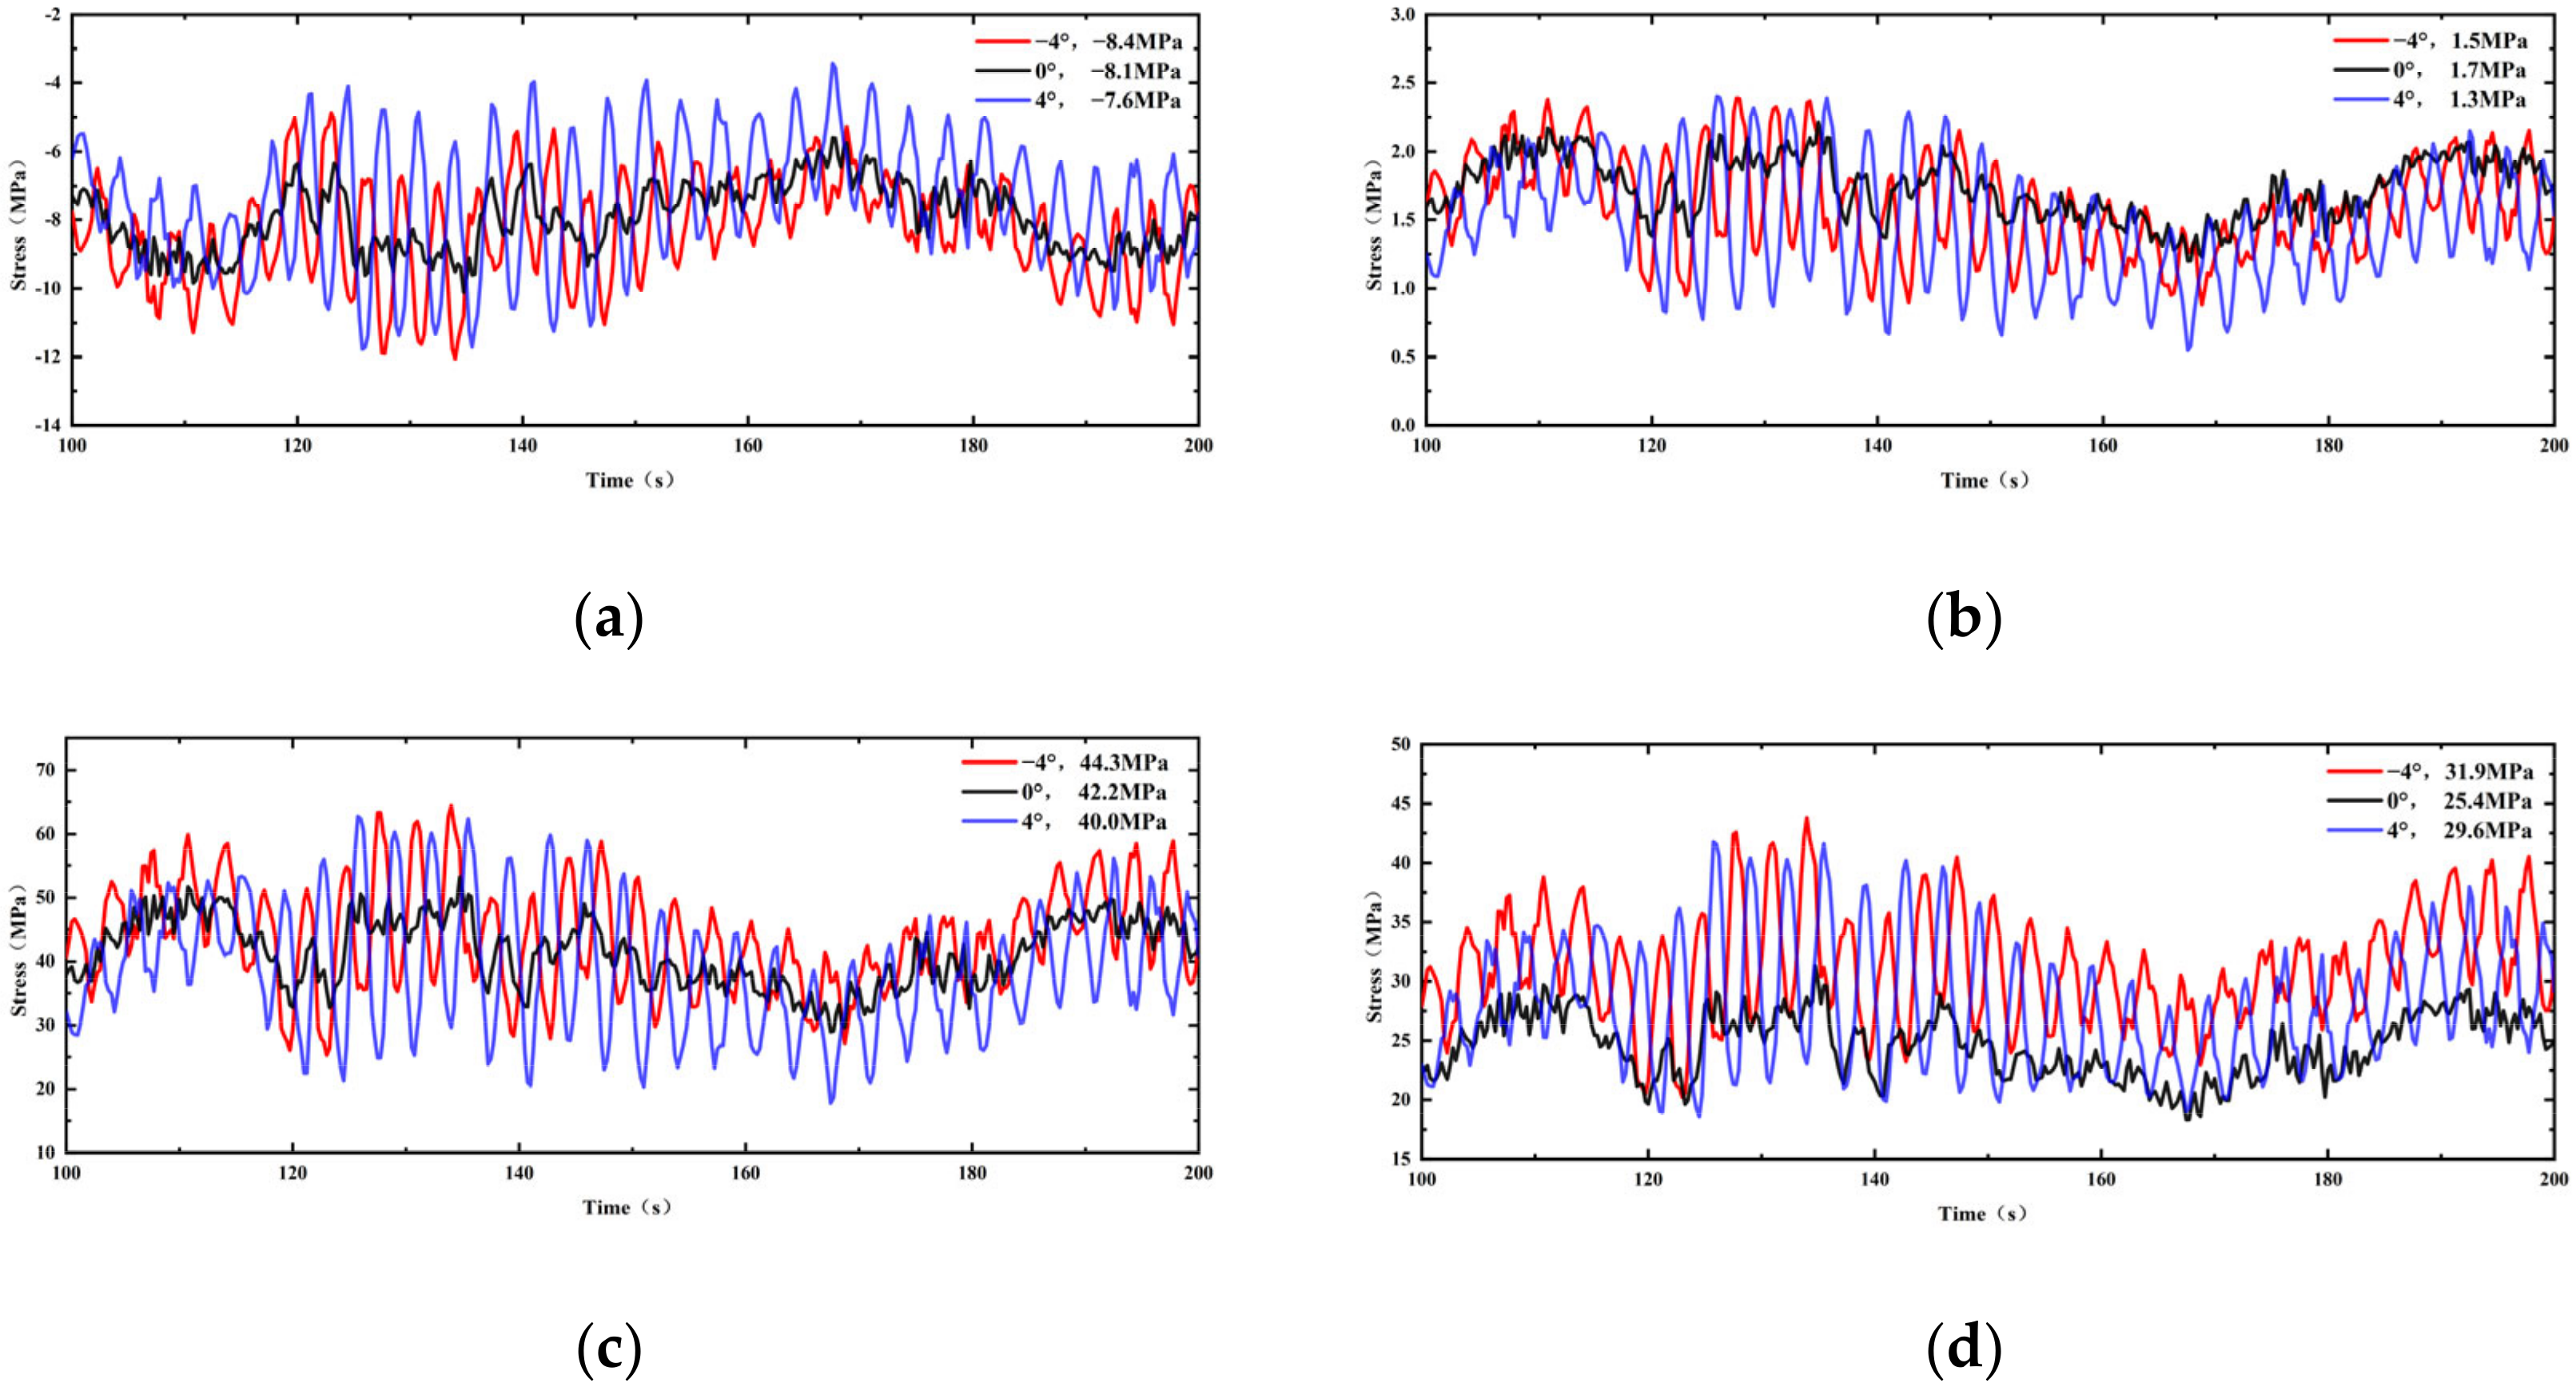
- The PAE has a significantly greater effect on the amplitude value of stress at stress concentration positions in concrete, the ESR, and the reinforcement cage than on the corresponding average value of stress. The PAE will significantly increase the amplitude value of stress at the stress concentration position. The effect of the PAE on the amplitude value of stress gradually increases with an increase in wind velocity.
- (3)
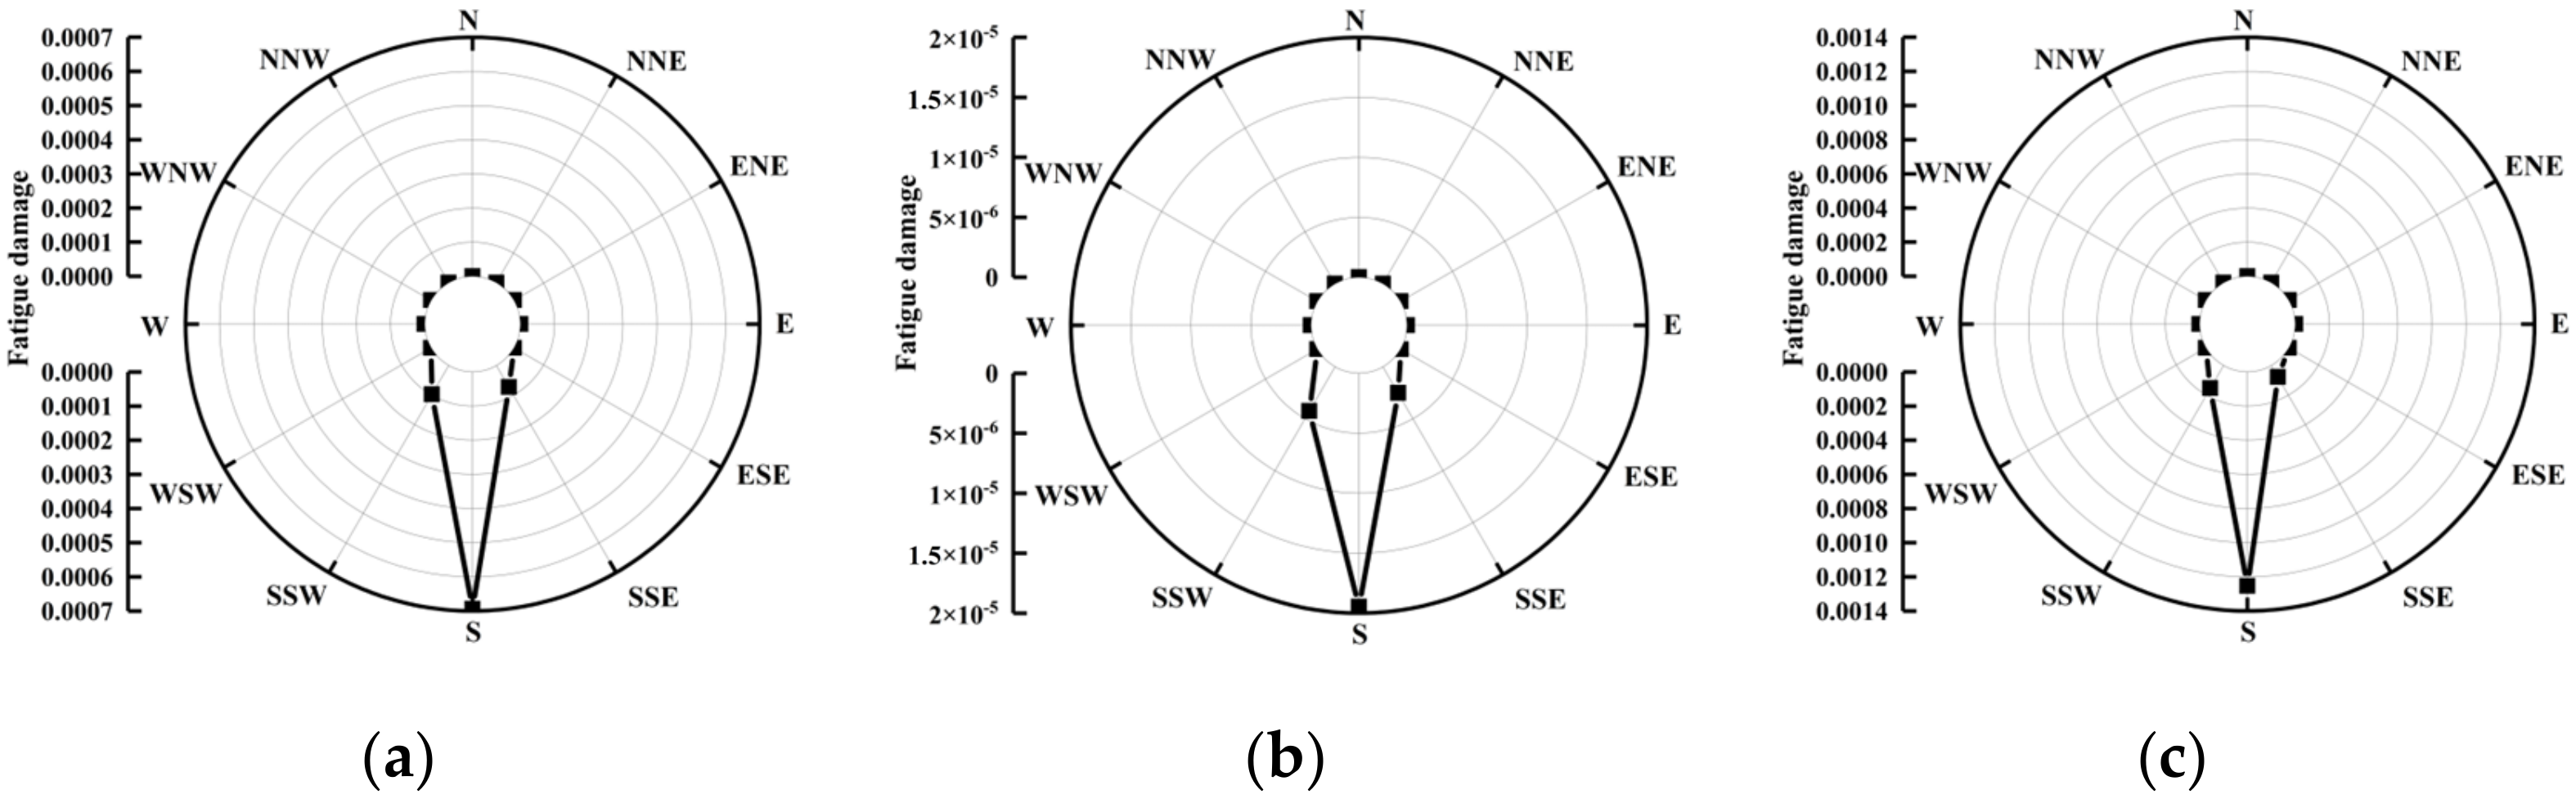
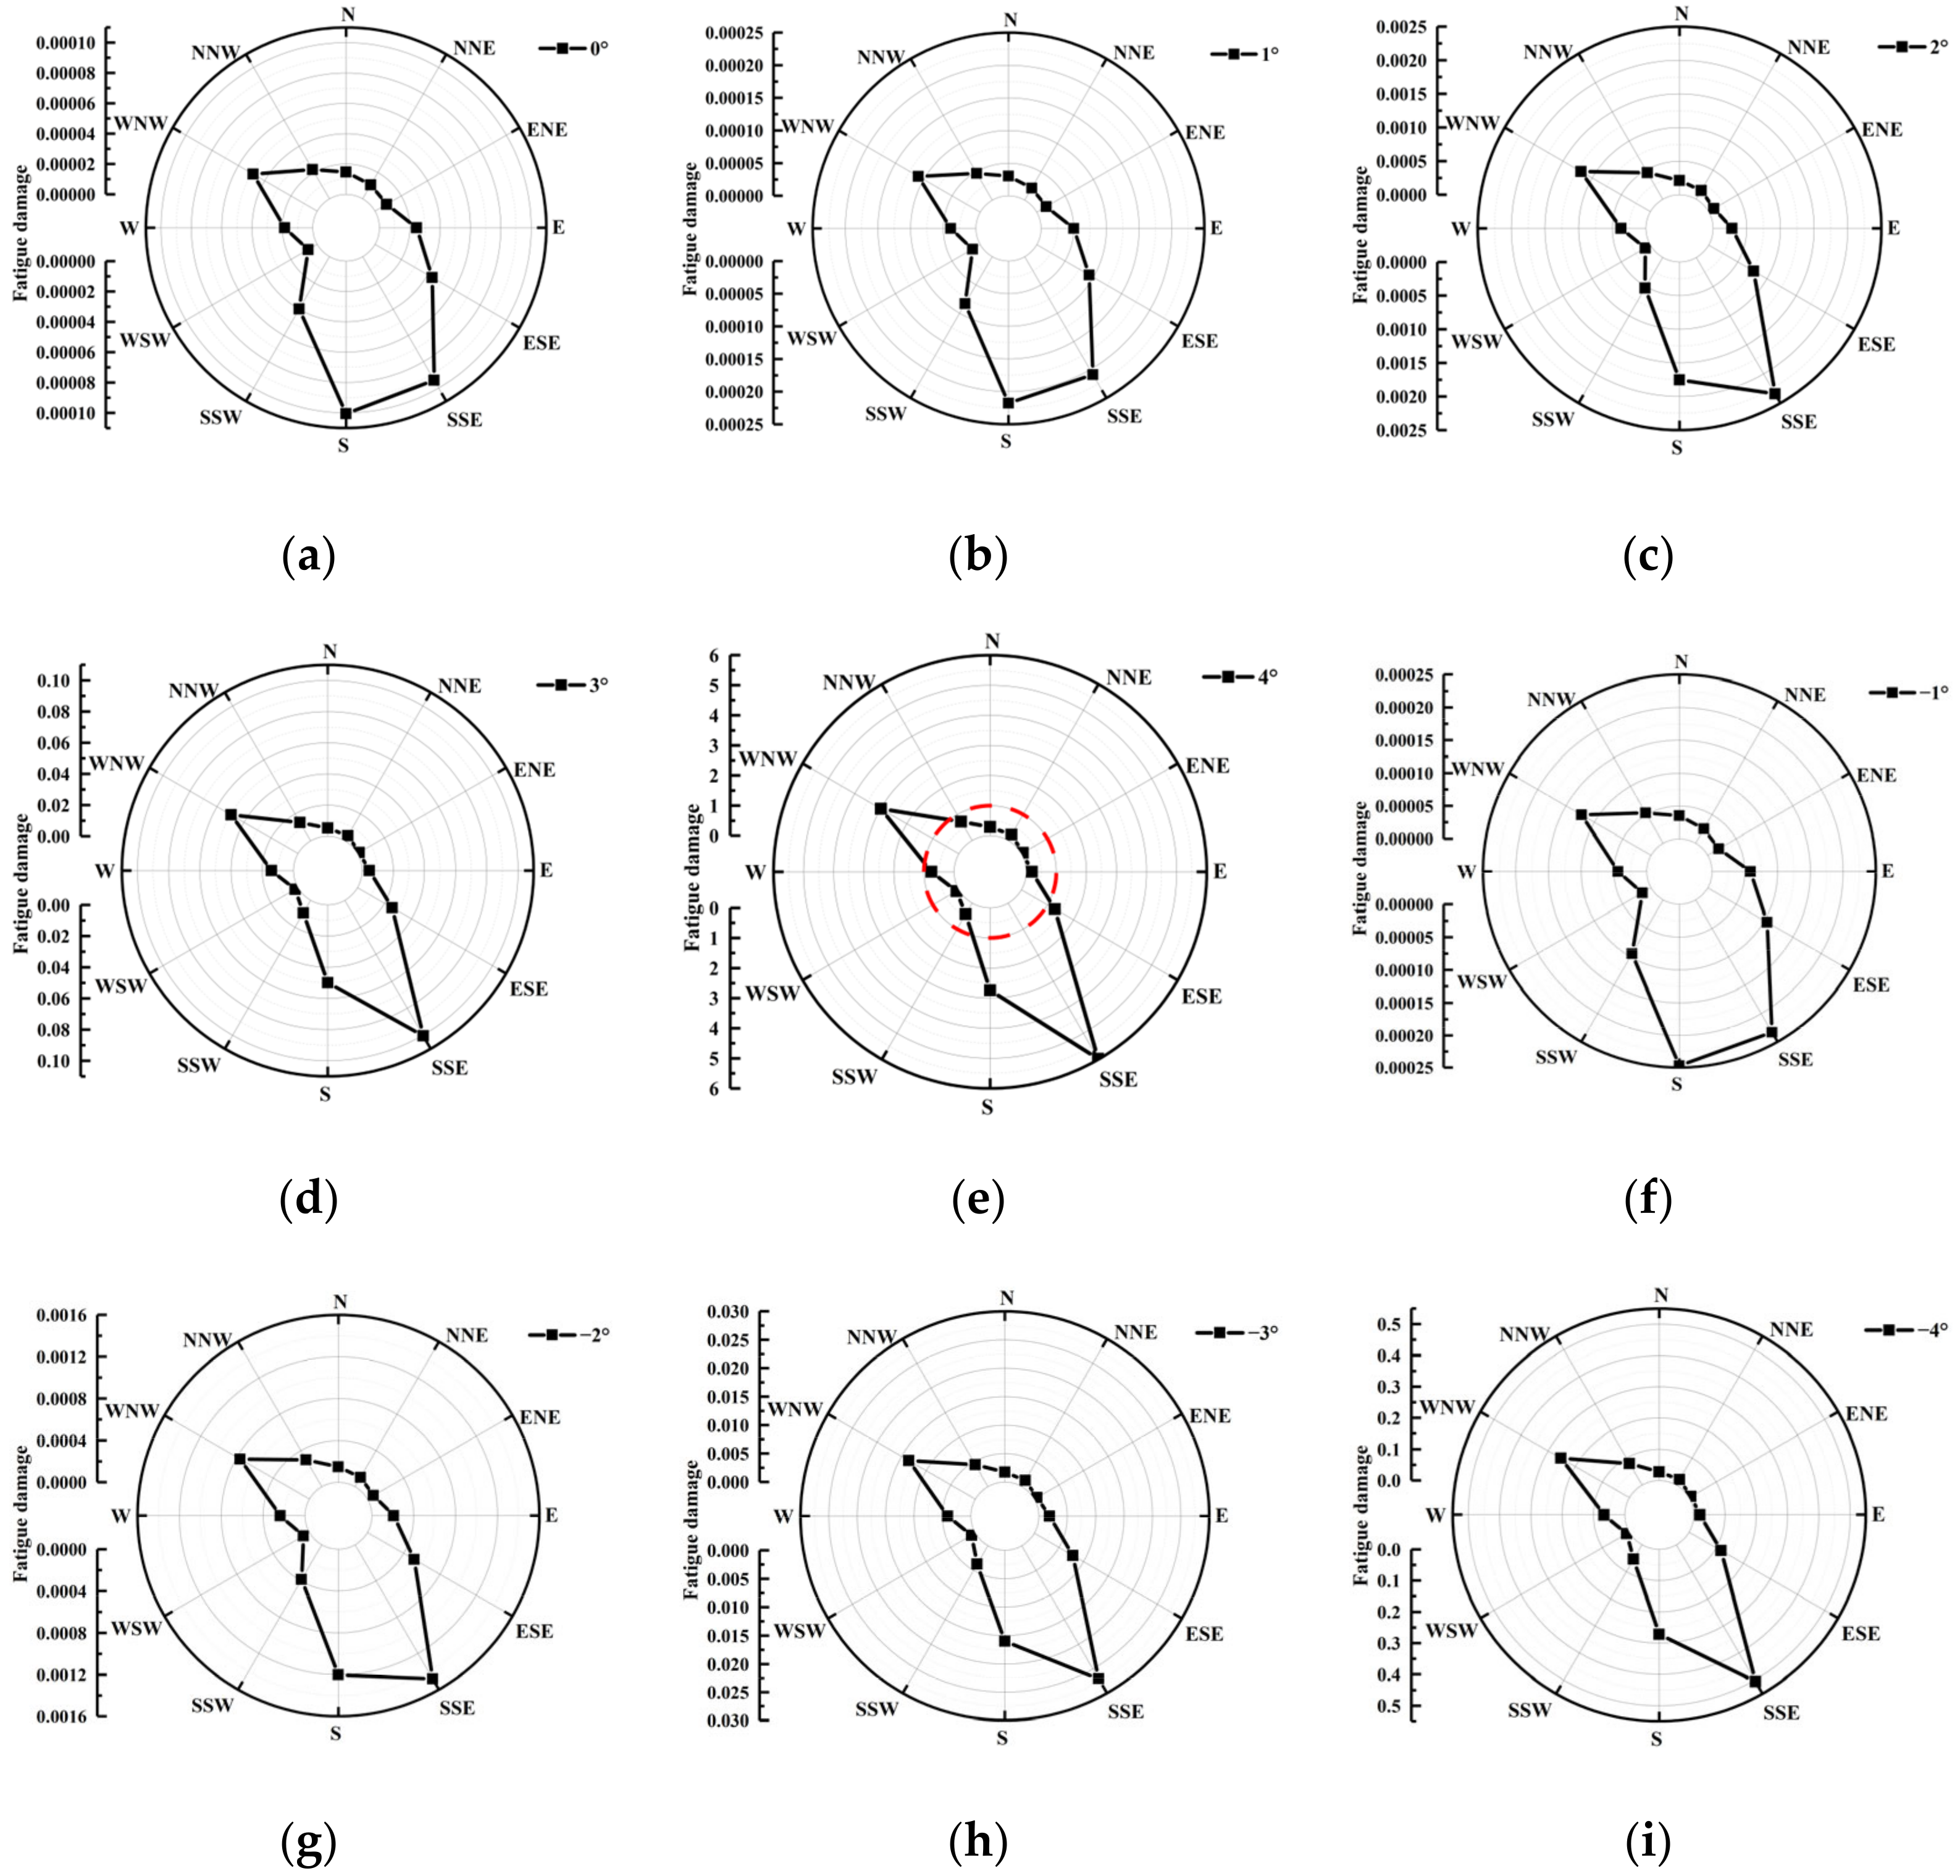
- Fatigue damage to the concrete is the most severe on the leeward side and gradually decreases on both sides. Fatigue damage increases with increasing PAE, and the fatigue damage caused by positive PAE is greater than that caused by negative PAE.
- (4)
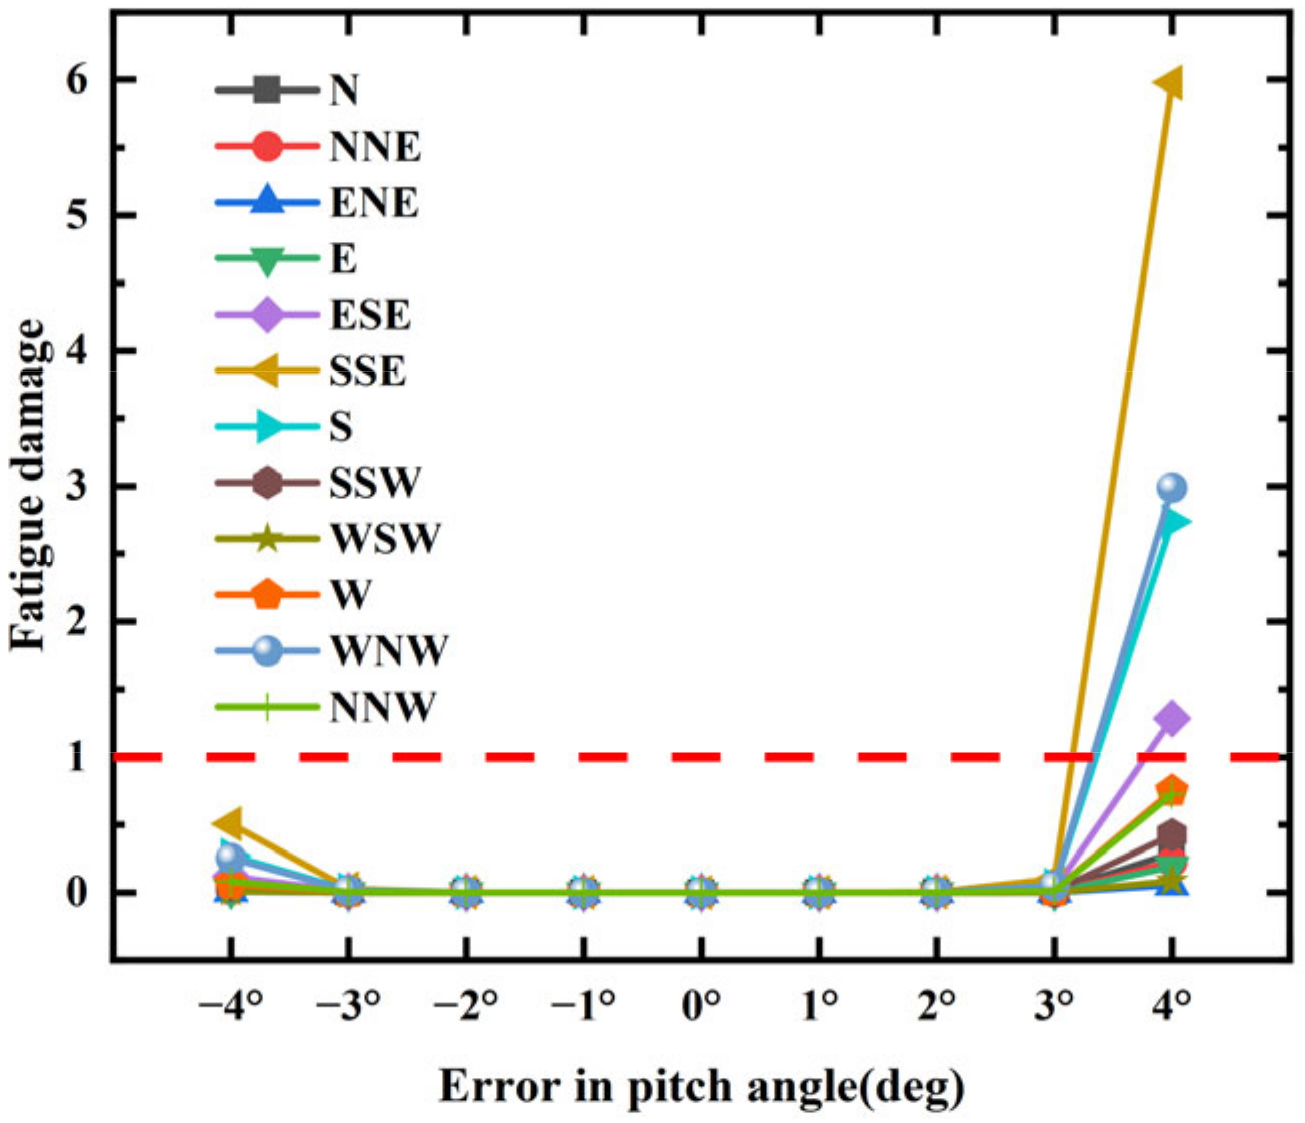
- When the PAE is within the range of −3° to 3°, the foundation fatigue damage incurred over one year is minimal, but once this limit is exceeded, the foundation fatigue damage increases dramatically. In particular, for more than 3° positive PAE, one year is enough to cause fatigue failure in the foundation concrete.
- (5)
- The peak value of fatigue damage to the foundation concrete caused by PAE does not necessarily occur in the main wind direction, but in the direction with the highest probability of the occurrence of high wind speeds, and the larger the PAE, the more significant the trend.
Author Contributions
Funding
Data Availability Statement
Conflicts of Interest
References
- Wang, J.W.; Xu, X.Y.; Zhang, D.; Tian, J. Finite Element Method Mechanical Characteristics Analysis of Tower Foundation for Wind Turbine Generator System. Adv. Mater. Res. 2012, 499, 327–330. [Google Scholar] [CrossRef]
- McAlorum, J.; Perry, M.; Fusiek, G.; Niewczas, P.; McKeeman, I.; Rubert, T. Deterioration of cracks in onshore wind turbine foundations. Eng. Struct. 2018, 167, 121–131. [Google Scholar] [CrossRef]
- Kang, M.H.; Xu, H.; Huang, X. Local damage analysis of near foundation ring in wind turbine foundation. Acta Energ. Sol. Sinnca 2014, 35, 583–588. [Google Scholar]
- Amponsah, E.; Wu, Z.; Feng, Q.; Wang, Z.; Kwame Mantey, S. Analysis of crack propagation in onshore wind turbine foundations using the double-K fracture model. Structures 2022, 41, 925–942. [Google Scholar] [CrossRef]
- Amponsah, E.; Wang, Z.; Kwame Mantey, S. Bending-bearing behaviour of embedded steel ring-foundation connection of onshore wind turbines. Structures 2021, 34, 180–197. [Google Scholar] [CrossRef]
- Stavridou, N.; Efthymiou, E.; Baniotopoulos, C.C. Verification of Anchoring in Foundations of Wind Turbine Towers. Am. J. Eng. Appl. Sci. 2015, 8, 717–729. [Google Scholar] [CrossRef]
- Bai, X.; He, M.; Ma, R.; Huang, D.; Chen, J. Modelling fatigue degradation of the compressive zone of concrete in onshore wind turbine foundations. Constr. Build. Mater. 2017, 132, 425–437. [Google Scholar] [CrossRef]
- Li, Z.; Chen, S.; Ma, H.; Feng, T. Design defect of wind turbine operating in typhoon activity zone. Eng. Fail. Anal. 2013, 27, 165–172. [Google Scholar] [CrossRef]
- He, M.; Bai, X.; Ma, R.; Huang, D. Structural monitoring of an onshore wind turbine foundation using strain sensors. Struct. Infrastruct. Eng. 2019, 15, 314–333. [Google Scholar] [CrossRef]
- Bai, X. Structural condition monitoring of wind turbine foundations. Proc. Inst. Civ. Eng.-Energy 2017, 170, 116–134. [Google Scholar] [CrossRef]
- Zhang, Z.; Liu, M.; Zhou, M.; Chen, J. Dynamic reliability analysis of nonlinear structures using a Duffing-system-based equivalent nonlinear system method. Int. J. Approx. Reason. 2020, 126, 84–97. [Google Scholar] [CrossRef]
- Zhao, J.B.; Wang, K.W.; Wang, Y.D.; Fu, B. Fatigue reliability calculation of wind turbine foundation based on probability density evolution. J. Hunan Univ. (Nat. Sci.) 2020, 47, 120–127. [Google Scholar]
- Mankar, A.; Srensen, J.D. Probabilistic fatigue design of reinforced-concrete wind turbine foundations. In Proceedings of the 13th International Conference on Applications of Statistics and Probability in Civil Engineering, Seoul, Republic of Korea, 26–30 May 2019. [Google Scholar]
- Zhu, D.; Ding, Z.; Huang, X.; Li, X. Probabilistic modeling for long-term fatigue reliability of wind turbines based on Markov model and subset simulation. Int. J. Fatigue 2023, 173, 107685. [Google Scholar] [CrossRef]
- Niebsch, J.; Ramlau, R.; Nguyen, T.T. Mass and Aerodynamic Imbalance Estimates of Wind Turbines. Energies 2010, 3, 696–710. [Google Scholar] [CrossRef]
- Jiang, D.; Huang, Q.; Hong, L. Theoretical and experimental study on wind wheel unbalance for a wind turbine. In Proceedings of the 2009 World Non-Grid-Connected Wind Power and Energy Conference, Nanjing, China, 24–26 September 2009; IEEE: Nanjing, China, 2009; pp. 1–5. [Google Scholar]
- Zhao, L.J.; Zhang, F.; Li, W.; Xing, Z.X.; Lu, X.H. Analysis on domain characteristics of imbalanced mechanical loads of wind turbine rotor. Acta Energ. Sol. Sinnca 2020, 41, 342–350. [Google Scholar]
- Wu, F.M.; Yang, C.X.; Wang, Q.; Wang, D. Research and verification of aerodynamic unbalance characteristics for large wind turbine. Acta Energ. Sol. Sinnca 2021, 42, 192–197. [Google Scholar]
- Qin, S.Y.; Li, Z.F. Analysis on frequency domain characteristics of mechanical loads on wind turbine rotor imbalance. Renew. Energy Resour. 2022, 40, 1202–1208. [Google Scholar]
- Malik, H.; Mishra, S. Application of Probabilistic Neural Network in Fault Diagnosis of Wind Turbine Using FAST, TurbSim and Simulink. Procedia Comput. Sci. 2015, 58, 186–193. [Google Scholar] [CrossRef]
- Malik, H.; Mishra, S. Artificial neural network and empirical mode decomposition based imbalance fault diagnosis of wind turbine using TurbSim, FAST and Simulink. IET Renew. Power Gener. 2017, 11, 889–902. [Google Scholar] [CrossRef]
- Tarabini, M.; Scaccabarozzi, D. Uncertainty-based combination of signal processing techniques for the identification of rotor imbalance. Measurement 2018, 114, 409–416. [Google Scholar] [CrossRef]
- Xing, Z.; Chen, M.; Cui, J.; Chen, Z.; Xu, J. Detection of magnitude and position of rotor aerodynamic imbalance of wind turbines using Convolutional Neural Network. Renew. Energy 2022, 197, 1020–1033. [Google Scholar] [CrossRef]
- Li, P.; Hu, W.; Hu, R.; Chen, Z. Imbalance fault detection based on the integrated analysis strategy for variable-speed wind turbines. Int. J. Electr. Power Energy Syst. 2020, 116, 105570. [Google Scholar] [CrossRef]
- Tang, S.; Tian, D.; Fang, J.; Liu, F.; Zhou, C. Individual pitch controller characteristics analysis and optimization under aerodynamic imbalanced loads of wind turbines. Energy Rep. 2021, 7, 6489–6500. [Google Scholar] [CrossRef]
- IEC 61400-1; Wind Energy Generation Systems-Part 1: Design Requirements. International Electrotechnical Commission: Geneva, Switzerland, 2019.
- Yao, W.X. Fatigue Life Estimation of Structures; Science Press: Beijing, China, 2019. [Google Scholar]
- Fatemi, A.; Yang, L. Cumulative fatigue damage and life prediction theories: A survey of the state of the art for homogeneous materials. Int. J. Fatigue 1998, 20, 9–34. [Google Scholar] [CrossRef]
- Zhang, Z.; Liu, Y.; Wang, L.; Li, W.; Ma, G. Probability Analysis of Duration of Stochastic Process Exceeding Fixed Threshold and Its Application on Structural Cumulative Damage and Fatigue Reliability Evaluation. ASCE-ASME J. Risk Uncertain. Eng. Syst. Part A Civ. Eng. 2024, 10, 04024007. [Google Scholar] [CrossRef]
- Miner, M.A. Cumulative Damage in Fatigue. J. Appl. Mech. 1945, 12, A159–A164. [Google Scholar] [CrossRef]
- Sonsino, C.M.; Baumgartner, J.; Breitenberger, M. Equivalent stress concepts for transforming of variable amplitude into constant amplitude loading and consequences for design and durability approval. Int. J. Fatigue 2022, 162, 106949. [Google Scholar] [CrossRef]
- Model Code 2010: First Complete Draft; International Federation for Structural Concrete: Lausanne, Switzerland, 2010; Volume 2.
- Vantadori, S.; Carpinteri, A.; Luciano, R.; Ronchei, C.; Scorza, D.; Zanichelli, A. Mean stress effect on fatigue life estimation for Inconel 718 alloy. Int. J. Fatigue 2020, 133, 105391. [Google Scholar] [CrossRef]


| Parameters | Value | Parameters | Value |
|---|---|---|---|
| Rated power | 2 MW | Fixed/Variable | Variable |
| Design service life | 20 a | Cut-in wind speed | 3.0 m/s |
| Hub height | 80 m | Rated wind speed | 10.5 m/s |
| Rotor diameter | 95.872 m | Cut-out wind speed | 25.0 m/s |
| Rated rotational speed | 16.83 rpm | Weight of first order tower | 62.9 t |
| Weight of nacelle and generator | 84.4 t | Weight of second order tower | 54.1 t |
| Weight of blades | 48.4 t | Weight of third order tower | 37.9 t |
| Wind Speed Wind Direct | 4 m/s | 6 m/s | 8 m/s | 10 m/s | 12 m/s | 14 m/s | 16 m/s | 18 m/s | 20 m/s | 22 m/s | Summary |
|---|---|---|---|---|---|---|---|---|---|---|---|
| N | 2.72 | 4.01 | 4.59 | 4.13 | 2.1 | 0.77 | 0.43 | 0.21 | 0.12 | 0.06 | 19.14 |
| NNE | 2.62 | 3.22 | 3.29 | 2.01 | 0.67 | 0.20 | 0.09 | 0.04 | 0.01 | 0.00 | 12.15 |
| ENE | 1.50 | 0.93 | 0.32 | 0.10 | 0.03 | 0.01 | 0.01 | 0.00 | 0.00 | 0.00 | 2.9 |
| E | 2.30 | 1.61 | 0.92 | 0.50 | 0.24 | 0.11 | 0.08 | 0.06 | 0.04 | 0.02 | 5.88 |
| ESE | 2.85 | 2.46 | 2.00 | 1.67 | 1.06 | 0.51 | 0.38 | 0.24 | 0.16 | 0.09 | 11.42 |
| SSE | 1.96 | 1.73 | 1.23 | 0.81 | 0.35 | 0.14 | 0.09 | 0.04 | 0.02 | 0.01 | 6.38 |
| S | 0.93 | 1.01 | 0.92 | 0.73 | 0.27 | 0.07 | 0.04 | 0.02 | 0.01 | 0.01 | 4.01 |
| SSW | 1.22 | 1.84 | 1.37 | 0.63 | 0.18 | 0.04 | 0.02 | 0.01 | 0.01 | 0.01 | 5.33 |
| WSW | 1.01 | 0.92 | 0.67 | 0.34 | 0.10 | 0.02 | 0.01 | 0.00 | 0.00 | 0.00 | 3.07 |
| W | 1.26 | 1.51 | 1.58 | 1.16 | 0.45 | 0.14 | 0.06 | 0.02 | 0.01 | 0.00 | 6.19 |
| WNW | 1.81 | 1.83 | 1.56 | 1.23 | 0.66 | 0.31 | 0.21 | 0.12 | 0.07 | 0.04 | 7.84 |
| NNW | 2.48 | 2.97 | 3.03 | 2.77 | 1.76 | 0.89 | 0.71 | 0.49 | 0.33 | 0.19 | 15.62 |
| Summary | 22.66 | 24.04 | 21.48 | 16.08 | 7.87 | 3.21 | 2.13 | 1.25 | 0.78 | 0.43 | 100 |
Disclaimer/Publisher’s Note: The statements, opinions and data contained in all publications are solely those of the individual author(s) and contributor(s) and not of MDPI and/or the editor(s). MDPI and/or the editor(s) disclaim responsibility for any injury to people or property resulting from any ideas, methods, instructions or products referred to in the content. |
© 2024 by the authors. Licensee MDPI, Basel, Switzerland. This article is an open access article distributed under the terms and conditions of the Creative Commons Attribution (CC BY) license (https://creativecommons.org/licenses/by/4.0/).
Share and Cite
Liu, Z.; Li, P.; Zhang, H.; Han, Q.; Qin, C.; Fan, S.; Xu, Z. Research on the Effect of Aerodynamic Imbalance on Fatigue Performance of a Wind Turbine Foundation with Embedded Steel Ring. Buildings 2024, 14, 1141. https://doi.org/10.3390/buildings14041141
Liu Z, Li P, Zhang H, Han Q, Qin C, Fan S, Xu Z. Research on the Effect of Aerodynamic Imbalance on Fatigue Performance of a Wind Turbine Foundation with Embedded Steel Ring. Buildings. 2024; 14(4):1141. https://doi.org/10.3390/buildings14041141
Chicago/Turabian StyleLiu, Zhefeng, Pengfei Li, Huiping Zhang, Qi Han, Chenxin Qin, Shougang Fan, and Zhijie Xu. 2024. "Research on the Effect of Aerodynamic Imbalance on Fatigue Performance of a Wind Turbine Foundation with Embedded Steel Ring" Buildings 14, no. 4: 1141. https://doi.org/10.3390/buildings14041141