
Measurements and Evaluation of Road Traffic-Induced Micro-Vibration in a Workshop Equipped with Precision Instruments


1
School of Civil Engineering, Guizhou Institute of Technology, Guiyang 550003, China
2
State Key Laboratory of Bridge Intelligent and Green Construction, Southwest Jiaotong University, Chengdu 611756, China
*
Author to whom correspondence should be addressed.
Buildings 2024, 14(4), 1142; https://doi.org/10.3390/buildings14041142
Submission received: 2 March 2024
/
Revised: 5 April 2024
/
Accepted: 10 April 2024
/
Published: 18 April 2024
(This article belongs to the Special Issue Building Vibration and Soil Dynamics)
Abstract
:Road traffic transportation has flourished in the process of urbanization due to its advantages, but concurrently it generates harmful environmental vibrations. This vibration issue becomes particularly crucial in production workshops housing precision instruments. However, limited research has been undertaken on this matter. This study aimed to investigate the influence of road traffic-induced vibration on micro-vibrations within a workshop housing precision instruments. A field test was conducted to assess the vibration levels originating from both machinery operation and vehicular traffic. The results indicated that ground-borne vibrations caused by road vehicles decrease with increasing propagation distance, peaking around 10 Hz. Machinery operation vibrations were primarily concentrated above 20 Hz, while vehicular traffic vibrations were more prominent below 20 Hz. Notably, the passage of heavy trucks significantly impacted both ground and workshop vibrations, with vertical vibrations being particularly significant. Within the workshop, the second floor experienced higher vibrations above 20 Hz due to the presence of installed instruments. Importantly, the micro-vibration levels on both floors exceeded the VC-C limit (12.5 µm/s), highlighting the need to account for road traffic and machinery vibrations in workshop design. These data can be utilized to validate numerical models for predicting road traffic-induced vibrations, aiding in vibration assessment during road planning and design.
1. Introduction
With improvements in the urbanization rate in China, the population is gathering in cities, and the urban road network system has also been upgraded [1,2]. The well-connected traffic network has brought great convenience to people’s lives and travel. However, traffic-induced vibration has become a major environmental issue in urban areas, since the distance between the buildings and the traffic lines is decreasing due to space limitations in heavily populated cities [3,4,5,6,7]. The vibration hazard caused by road traffic is thus an urgent social and engineering problem to be solved [8,9,10].
Research on the vibration and noise problems of buildings, caused by railway traffic, is quite common [11,12]. As for vibration propagation caused by road vehicles running, Watts [13] found that significant vibration responses could be observed within 50 m from the center of the road when heavy vehicles were running on an uneven road. In theoretical investigations, a simplified vibration prediction model was proposed to consider the influence of factors such as vehicle speed, vibration propagation distance, and the maximum height and depth of the uneven pavement on the road [14]. Hunt [15,16] and Lombaert [17] assumed that the effect of running vehicles on the road was a steady-state process. In their studies, the vehicle was simplified into different models, and the influence of different road surfaces on the vibration caused by the vehicle was discussed. An analytical method based on random vibration analysis was proposed to predict the power spectral density of traffic-induced ground-borne vibration by Hao and Ang [18], which showed that the ground-borne vibration was mainly caused by the propagation of the Rayleigh wave. Other numerical models were established to study the vibration response caused by the running vehicle on roads of different roughness [19,20]. In Lak’s study [20], the load weight, traffic degree, and road roughness were significant factors that affected the environmental vibration caused by road traffic. However, the pavement structure primarily affected the near-field vibration response in a high-frequency band, and the road–soil transfer function was mainly determined by soil parameters, so the accurate identification of soil dynamic parameters was the key to predicting traffic-induced environmental vibration issues. Road humps and speed cushions were used to control vehicle speeds in specific areas, whereas obvious vibrations were produced when vehicles passed over these speed bumps; in some cases, they could reach perceptible levels in adjacent buildings [21]. A theoretical analysis model was established to study the subject of vehicles passing over speed bumps, and the influences of the vehicle speed, tire stiffness, and the height and width of the unevenness were discussed [22]. Many valuable findings have been obtained from the above theoretical analysis and numerical simulation.
However, any theoretical analysis and numerical simulation cannot consider all objective factors. Prediction uncertainties and inaccuracies resulting from assumptions in modeling cannot be neglected. A site experiment is the most intuitive and accurate means of studying the vibration source excitation and the response of sensitive targets when the vehicle passes, and it is also the most rigorous way of checking and evaluating analytical and numerical solutions. A large number of field experiments have been carried out in the academic and engineering fields to provide accurate model parameters and test data for validating theoretical models [23,24,25,26,27,28,29].
To verify a numerical model of environmental vibration, a field experiment was performed by Mhanna et al. [23]. Test vehicles were used in another field test carried out by Taniguchi and Sawada [24]. It was found that the Rayleigh wave played a primary role in the vibration propagation, and its dominant frequency range was located at 10~20 Hz. The field vibration responses induced by different types of vehicles traveling at different speeds were measured, and it was observed that the vibration responses mainly dominated in 10~40 Hz and the vibration frequency induced by buses was concentrated in the relatively narrow frequency band of 10~12.5 Hz [25]. A detailed field measurement of the environmental vibration caused by road traffic in Montreal was conducted, and it was observed that the dominant frequency band of vibration caused by trucks was concentrated between 10 and 20 Hz [26]. Another field test was executed to study the vibration response of a free field beside a two-way subway line and road traffic, and the different characteristics of vibration induced by the subway trains and road vehicles were discussed [27]. To find out the influence of road traffic on ancient buildings, an experimental study on the vibration of ancient buildings caused by road traffic vehicles was performed [28]. The vibration response caused by the vehicle passing through different types of deceleration devices was researched using experiments [29]. Obvious frequency characteristics of road traffic-induced environmental vibration were discovered in the above-mentioned studies.
In contrast, most experimental studies have focused on vibration problems encountered with intensive vibration levels, and relatively little attention has been paid to the impact of micro-vibration. With the development of the social industrialization process, the problem of micro-vibration has gradually been exposed [30,31,32,33]. For workshops with precision instruments, micro-vibration may affect the normal operation and working accuracy of precision instruments [34]. An experimental study was conducted to evaluate the influence of heavy-vehicle-induced vibration on precision instruments, which found that the amplitude of heavy vehicles is about 3~5 times that of small cars [35]. Another study focused on the attenuation of ground-borne vibrations by applying isolation measures for sensitive areas with precision instruments [36,37].
In this study, a random sampling analysis was conducted to assess traffic flow conditions on the expressway. Then, a micro-vibration field test was carried out for the production workshop of microelectronics enterprises adjacent to an urban expressway in Xiamen, China. Special attention is paid to the site vibration on the ground and the micro-vibration inside the production workshop due to road traffic. This study differs from previous works primarily in two aspects: firstly, we conducted a vibration test in a workshop operating continuously, with data collected every hour capturing both production and traffic-induced vibrations; secondly, we strategically placed measurement points along the traffic–factory path to cross-verify the traffic-induced vibration characteristics in the workshop, enhancing the reliability of the analysis. To obtain a better understanding of such a complex dynamic system, the measurement data were analyzed both in the time and frequency domains, and the test results provide references for similar research.
2. Field Test Site and Experiment Scheme
2.1. Field Test Site
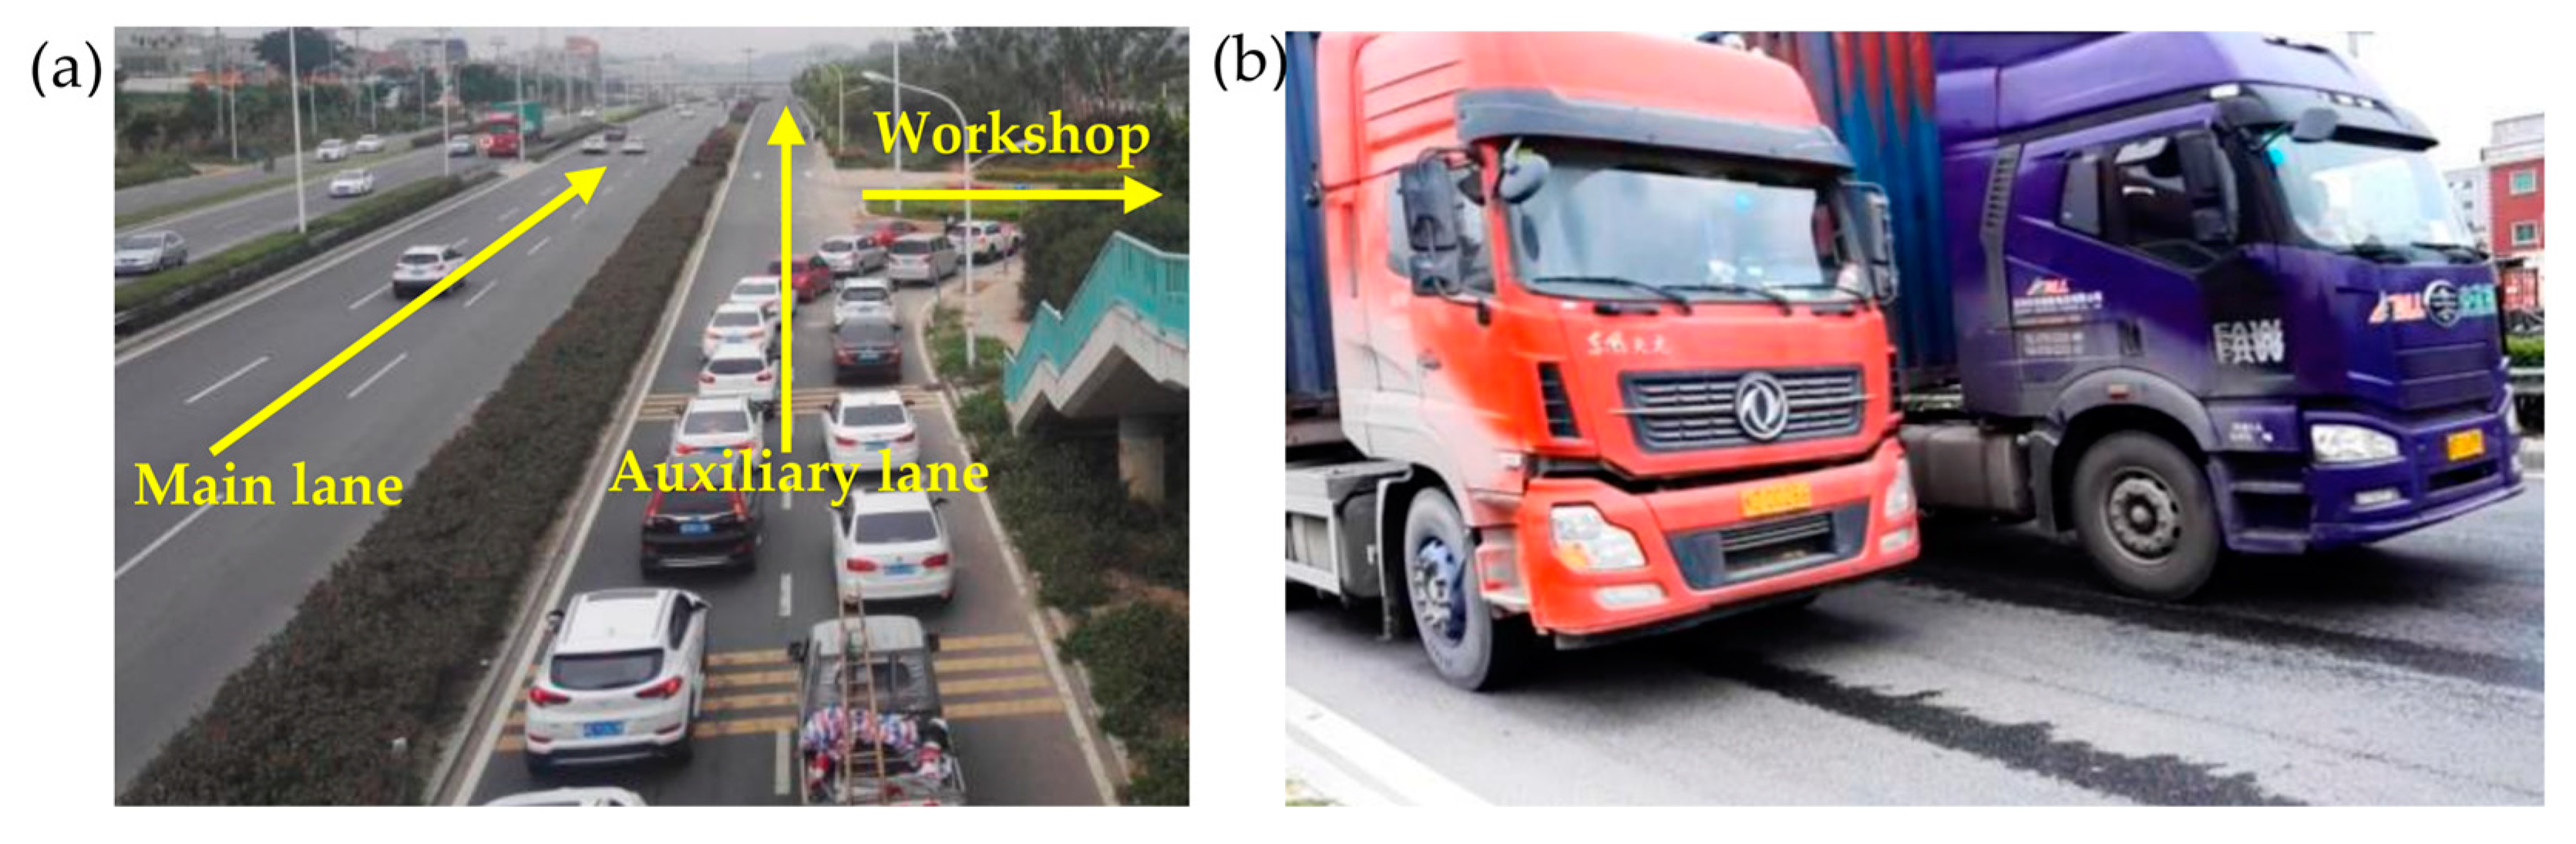
The microelectronics enterprise is located off the northern side of an urban expressway in Xiamen, China, as shown in Figure 1a, where the No. 3 production workshop is in operation. It is a high-tech workshop for the production of new-type displays and is equipped with precision instruments for the production of low-temperature polysilicon (LTPS) and color filters (CFs). The distance from the edge of the urban expressway to the production workshop is approximately 82 m. There are six lanes in both directions making up the main carriageway of the urban expressway. Additionally, on the auxiliary carriageway, there are four lanes in both directions. The design speed of the expressway is 80 km/h. To the southwest of the No. 3 production workshop, the nearest distance from the workshop to the elevated rail transit line is about 65 m (see Figure 1a).
The overall length and width of the No. 3 production workshop is 507.9 m × 252.6 m, with a building height of about 26 m. There is no production equipment in the dust-free room on the first floor of the workshop, which is used as a ventilation space. The core area in the workshop is on the second floor. There is plenty of fully automated production equipment on the second floor, which operates continuously over 24 h. Therefore, the vibration sources for precision instruments in the workshop mainly include (1) vibration generated by the operation of machinery and equipment in the production workshop; (2) vibration of air conditioning and ventilation equipment in the dust-free room; (3) instantaneous shock and vibration caused by personnel walking; (4) vibration from the nearby construction site; and (5) vibration caused by vehicles running on the road in the factory area and urban roads outside the factory area.
2.2. Measurement Scheme
Since the environmental vibration caused by road traffic is low-frequency vibration, the vibration attenuation rate is slow during the process of propagation. Micro-vibration is one of the key issues to be considered and solved in the production process of the display screen. At the same time, the elevated rail transit line under planning may also have a significant adverse impact on the normal production activities in the No. 3 production workshop after it is put into operation. At present, the primary task is to find out the micro-vibration level of the No. 3 workshop and the significant influential factors of the existing vibration sources. Therefore, three test sections were arranged in different areas of the No. 3 workshop. Meanwhile, to find out the attenuation characteristics of vibration on the propagation path, test section 4 # is set on the transmission route between test section 3 # and the expressway. The four test sections are all within the green dotted circle in Figure 1a, which is illustrated in Figure 1b in detail.
The layout of test points for the four test sections is shown in Figure 1c. Test sections 1 #, 2 #, and 3 # were located in the workshop. Each test section contained eight measuring points, of which measuring points 1 # to 4 # were arranged on the first floor, measuring points 5 # to 8 # were installed on the second floor, and the intervals between the measuring points were 20 m. Test section 4 # was located on the transmission path between the urban expressway and the workshop. Seven measuring points of test section 4 # were arranged on the ground. Measuring point 4-1 # was installed next to the urban expressway, the intervals between the adjacent measuring points 4-1 # to 4-6 # are 10 m, and the distance between the measuring points 4-6 # and 4-7 # is 15 m. Each measuring point of the four test sections was equipped with three sensors to record the vibration speed in the X, Y, and Z directions, as shown in Figure 1c.
Based on the Technical Specifications for Environmental Vibration Monitoring (HJ 918-2017) [38], the monitoring of the regional environmental vibration was divided into two periods: daytime and nighttime monitoring. Daytime refers to the period between 6:00 a.m. and 10:00 p.m. in one day, and nighttime refers to the period from 10:00 p.m. to 6:00 a.m. on the next day. The time interval between the two tests was one hour. According to the above-mentioned specifications, micro-vibration monitoring in workshop No. 3 was carried out on test sections 1 #, 2 #, and 3 # for 24 h, respectively, and the monitoring was performed each hour with a duration of 10 min. Measurement was conducted for test section 4 # in the period between 7:30 p.m. and 8:30 p.m. when a large number of vehicles were running on the urban expressway. In total, 35 groups of data were collected, and the duration of each data collection was 30 s.
For test sections 1#, 2#, and 3 # in the No. 3 workshop, sensors were installed on the first and second floors of the building. The dust-free room on the first floor has no production equipment, and the sensors were directly installed on the first floor slab, as shown in Figure 2. The core production area was on the second floor, and the production equipment was placed on the waffle board. When installing the sensors on the second floor slab, the waffle board needed to be removed first, and the sensors were installed on the floor slab under the waffle board. The second floor was equipped with ventilation holes, and the sensors were installed on the floor beside the ventilation hole, as shown in Figure 3. In Figure 3, test sections 1 # and 2 # on the second floor were located in the yellow light area; the surrounding production equipment was dense, and test section 3 # was located in the white light area, which had the least equipment of the three test sections.
The measuring points of test section 4 # were placed on the ground between the urban expressway and the workshop. The surface of the green belt is covered with weeds and low trees. The installation procedure for the sensors is shown in Figure 4. Firstly, the surface floating soil needed to be removed, and a square foundation pit was excavated to place a square steel plate with an L-shaped angle steel and four small holes at the four corners. Then, four steel drills were inserted into the soil through the holes to fix the plate. Finally, sensors were mounted on the steel plate in the X, Y, and Z directions.
In the experiment, Type 891-II low-frequency accelerometers were employed, boasting a measurement range of 0 to 4 g and an effective frequency range spanning from 0.5 Hz to 80 Hz. The data acquisition system utilized for the measurements was the INV3060S, a product of the Beijing Oriental Institute of Vibration and Noise Technology. This advanced system supports up to 16 channels and offers a sampling frequency range extending from 6.25 Hz to 102.4k Hz. The sampling frequency was 1024 Hz. Random sampling was conducted beside the road. About three to five heavy trucks passed by per minute in one direction. Regarding trucks, they typically had multiple axles, ranging from double to five axles, with axle weights varying between several tons to ten tons. The traffic condition on the expressway is shown in Figure 5.
3. Vibration on the Transmission Route
Test section 4 # was set on the site of the transmission route between the road and the workshop. Before the field test, a random sampling study of the expressway’s traffic flow condition was undertaken. From 7:30 to 8:30 p.m., three to five heavy trucks went in one direction every minute, while other vehicles, including various types of cars, passed by continuously. To examine the effects of the actual random traffic flow, the duration of each test was 30 s. Generally, during the test period, the excitation of heavy trucks and cars could be recorded. The characteristics of the vibration responses were analyzed in time and frequency domains. The heavy vehicle shown in Figure 5b represents trucks.
3.1. Time History Analysis of Ground Vibration
The background vibration responses on the ground were quite minimal when there were no moving vehicles on the road. With the excitation of road traffic vehicles, the vibration responses on the ground increased to some extent, and while the heavy vehicles passed by, the ground-borne vibration responses were magnified significantly. The vibration responses of the measuring points decreased gradually with the increase in the distance from the road. Figure 6 shows the time histories of velocity responses in the vertical, X, and Y directions at locations 4-1 #, 4-5 #, and 4-7 #.
The comparison of time histories in the three directions in Figure 6 shows that the vertical vibration response was the largest, and the vibration response in the Y direction was the smallest. In Figure 6, both the background vibration and traffic-induced vibration can be observed in response to the three directions. The vibration responses of the ground measurement points in the periods of 7 s to 23 s and 27 s to 30 s were generated by the passage of road vehicles (except for heavy trucks) and were greater than those of background vibration. The vibration response from 23 s to 27 s increased significantly due to the passage of heavy trucks. Additionally, the closer to the road, the more the vibration response increased. From Figure 6a, the peak response caused by heavy vehicles passing by can be observed at locations 4-1 # and 4-5 #, corresponding to 23.77 s and 24.48 s, respectively, from which the time lag phenomenon can be observed.
3.2. Fourier Spectrum Analysis of Ground Vibration
The dominant frequency band of ground-borne vibration in the vertical, horizontal, X, and Y directions caused by road traffic was concentrated within 20 Hz. The peak frequency of the vertical vibration appeared at 12 Hz, and the peaks of the horizontal vibration responses in the X and Y directions appeared around 6 Hz and 12 Hz. During the propagation of vibration, the response amplitude gradually attenuated with the increase in distance from the road. The fast Fourier transform (FFT) spectra of vibration velocity in the vertical, horizontal, X, and Y directions at locations 4-1 #, 4-3 #, 4-5 #, and 4-7 # are given in Figure 7.
It can be seen from Figure 7 that the vertical vibration amplitude was greater than that in the horizontal X and Y directions, and the vibration amplitude in the horizontal Y direction showed the smallest response, which is consistent with the conclusion of the analysis from Figure 6. The vibration responses in the three directions decreased gradually with the increase in the propagation distance.
3.3. 1/3 Octave Spectrum of Ground Vibration
Based on the description in Section 2.2, 35 groups of test data were recorded for test section 4 # during the period of 7:30 p.m. to 8:30 p.m., when there were a large number of vehicles passing through the urban expressway. The duration of each test was 30 s. According to the 35 groups of test data, a 1/3 octave analysis was carried out. Due to the differences in the test data, a 95% confidence interval was employed for 1/3 octave spectra. The 95% confidence limits of vertical vibration responses at measuring points 4-1, 4-3, 4-5, and 4-7 # are shown in Figure 8. It can be seen from Figure 8 that the dominant frequency band of the ground-borne vibration response was within 20 Hz, and the peak frequency of the vibrations at 4-1 # and 4-3 # was located at 10~20 Hz. With the increase in propagation distance, the peak frequency of the vibration responses at 4-5 # and 4-7 # shifted to 10 Hz, and the vibration amplitude decreased, which was especially evident in the dominant frequency band.
3.4. Vibration Level of Ground Vibration
To further investigate the ground-borne vibration induced by road traffic, the vibration was evaluated by use of the speed vibration level Lv in decibels, expressed as
where Lv is the velocity level in decibels, is the effective value (root mean square value) of vibration velocity in m/s, and is reference velocity, of which the value is m/s, according to the regulations of the Department of Railway Transportation in the U.S. [39].
For 35 groups of test data, the vertical velocity vibration level Lv was calculated using Equation (1). Due to the differences that exist in the test data, a 95% confidence interval was employed, as shown in Figure 9. In Figure 9, the total vibration levels at all test points on the ground are exhibited. The vertical velocity vibration level decreased gradually with the increase in distance from the road, indicating that the vibration energy gradually decreased during the vibration propagation, which follows the vibration propagation rule in Ref. [40].
4. Vibration in the Workshop
The production workshop is located near the urban expressway. The road traffic-induced micro-vibration may affect the normal operation of the instruments and equipment in the workshop. Therefore, it was necessary to conduct a detailed study on the influence of road traffic on the workshop.
4.1. Time History Analysis of Workshop Vibration
The road traffic-induced vibration in the workshop was attenuated during the vibration propagation from the first floor to the second floor. The vibration of the second floor was significantly affected by the operation of the production equipment. The time histories of the vertical vibration velocity at locations 2-4 # and 2-8 # are shown in Figure 10. Test point 2-4 # is on the first floor, and 2-8 # is on the second floor.
It can be observed from Figure 10 that the response increased significantly during the period of 348 s to 354 s when heavy trucks passed by. However, the response amplitude of the second floor was smaller than that of the first floor in this period, which indicates that the traffic-induced vibration was attenuated with the vibration propagation from the first floor to the second floor. Compared to the responses in the other periods (335 s to 348 s and 354 s to 365 s), it can be observed that the vibration amplitude in Figure 10b is greater than that in Figure 10a. Since the production equipment on the second floor operated continuously for 24 h, the most likely reason for the increase in vibration on the second floor slab in the periods of 335 s to 348 s and 354 s to 365 s is the contribution of vibration due to the operation of production machinery and equipment.
4.2. Fourier Spectrum Analysis of Workshop Vibration
The peak frequency of workshop vibrations in the vertical direction caused by the road traffic was concentrated around 10 Hz. The vibration in this frequency range was attenuated with the vibration propagation from the first floor to the second floor in the workshop. The vibration of the second floor slab was affected by the excitation induced by the production equipment, which resulted in localized peaks in the frequency band above 20 Hz. FFT spectra of vibration velocity in the vertical direction at all locations of test section 2 # are shown in Figure 11.
For the vertical vibration response of the workshop in Figure 11, the FFT spectrum waveforms of the vibration response at the test locations on the first and second floors were similar, and the vibration peaks appeared around 10 Hz. The vibration amplitude of the second floor slab was smaller than that of the first floor in frequencies around 10 Hz, suggesting that the dominant frequency range of road traffic-induced vibration was around 10 Hz, which agrees with Refs. [24,25,26]. The traffic-induced vibration decreased when it was transmitted from the first floor to the second floor. In addition, the localized vibration peaks of the second floor can be observed at 30 Hz, 50~60 Hz, and 70~80 Hz in Figure 11b. The amplitudes of the localized vibration peaks increased compared with Figure 11a, and the most likely reason for this phenomenon is the vibration effects generated by the operation of the equipment on the second floor.
4.3. 1/3 Octave Spectrum of Workshop Vibration
During the normal operation of sensitive equipment, the vibration at the placement position of the equipment was quite severe. There is a special vibration criterion for the evaluation of micro-vibration which takes a 1/3 octave spectrum of the effective value of velocity as the evaluation index [41]. Seven vibration levels of vibration criterion (VC) curves from VC-A to VC-G were used for the evaluation of micro-vibration, and the limit value was reduced step by step (VC-G had the most rigorous standard and the smallest vibration limit) [41]. Table 1 shows the vibration limit from VC-A to VC-G in VC standard [41]. A detailed description can be found in the work of Amick [42]. According to the precision requirements of the production equipment in this study, the vibration in the workshop needed to be kept within the VC-C limit.
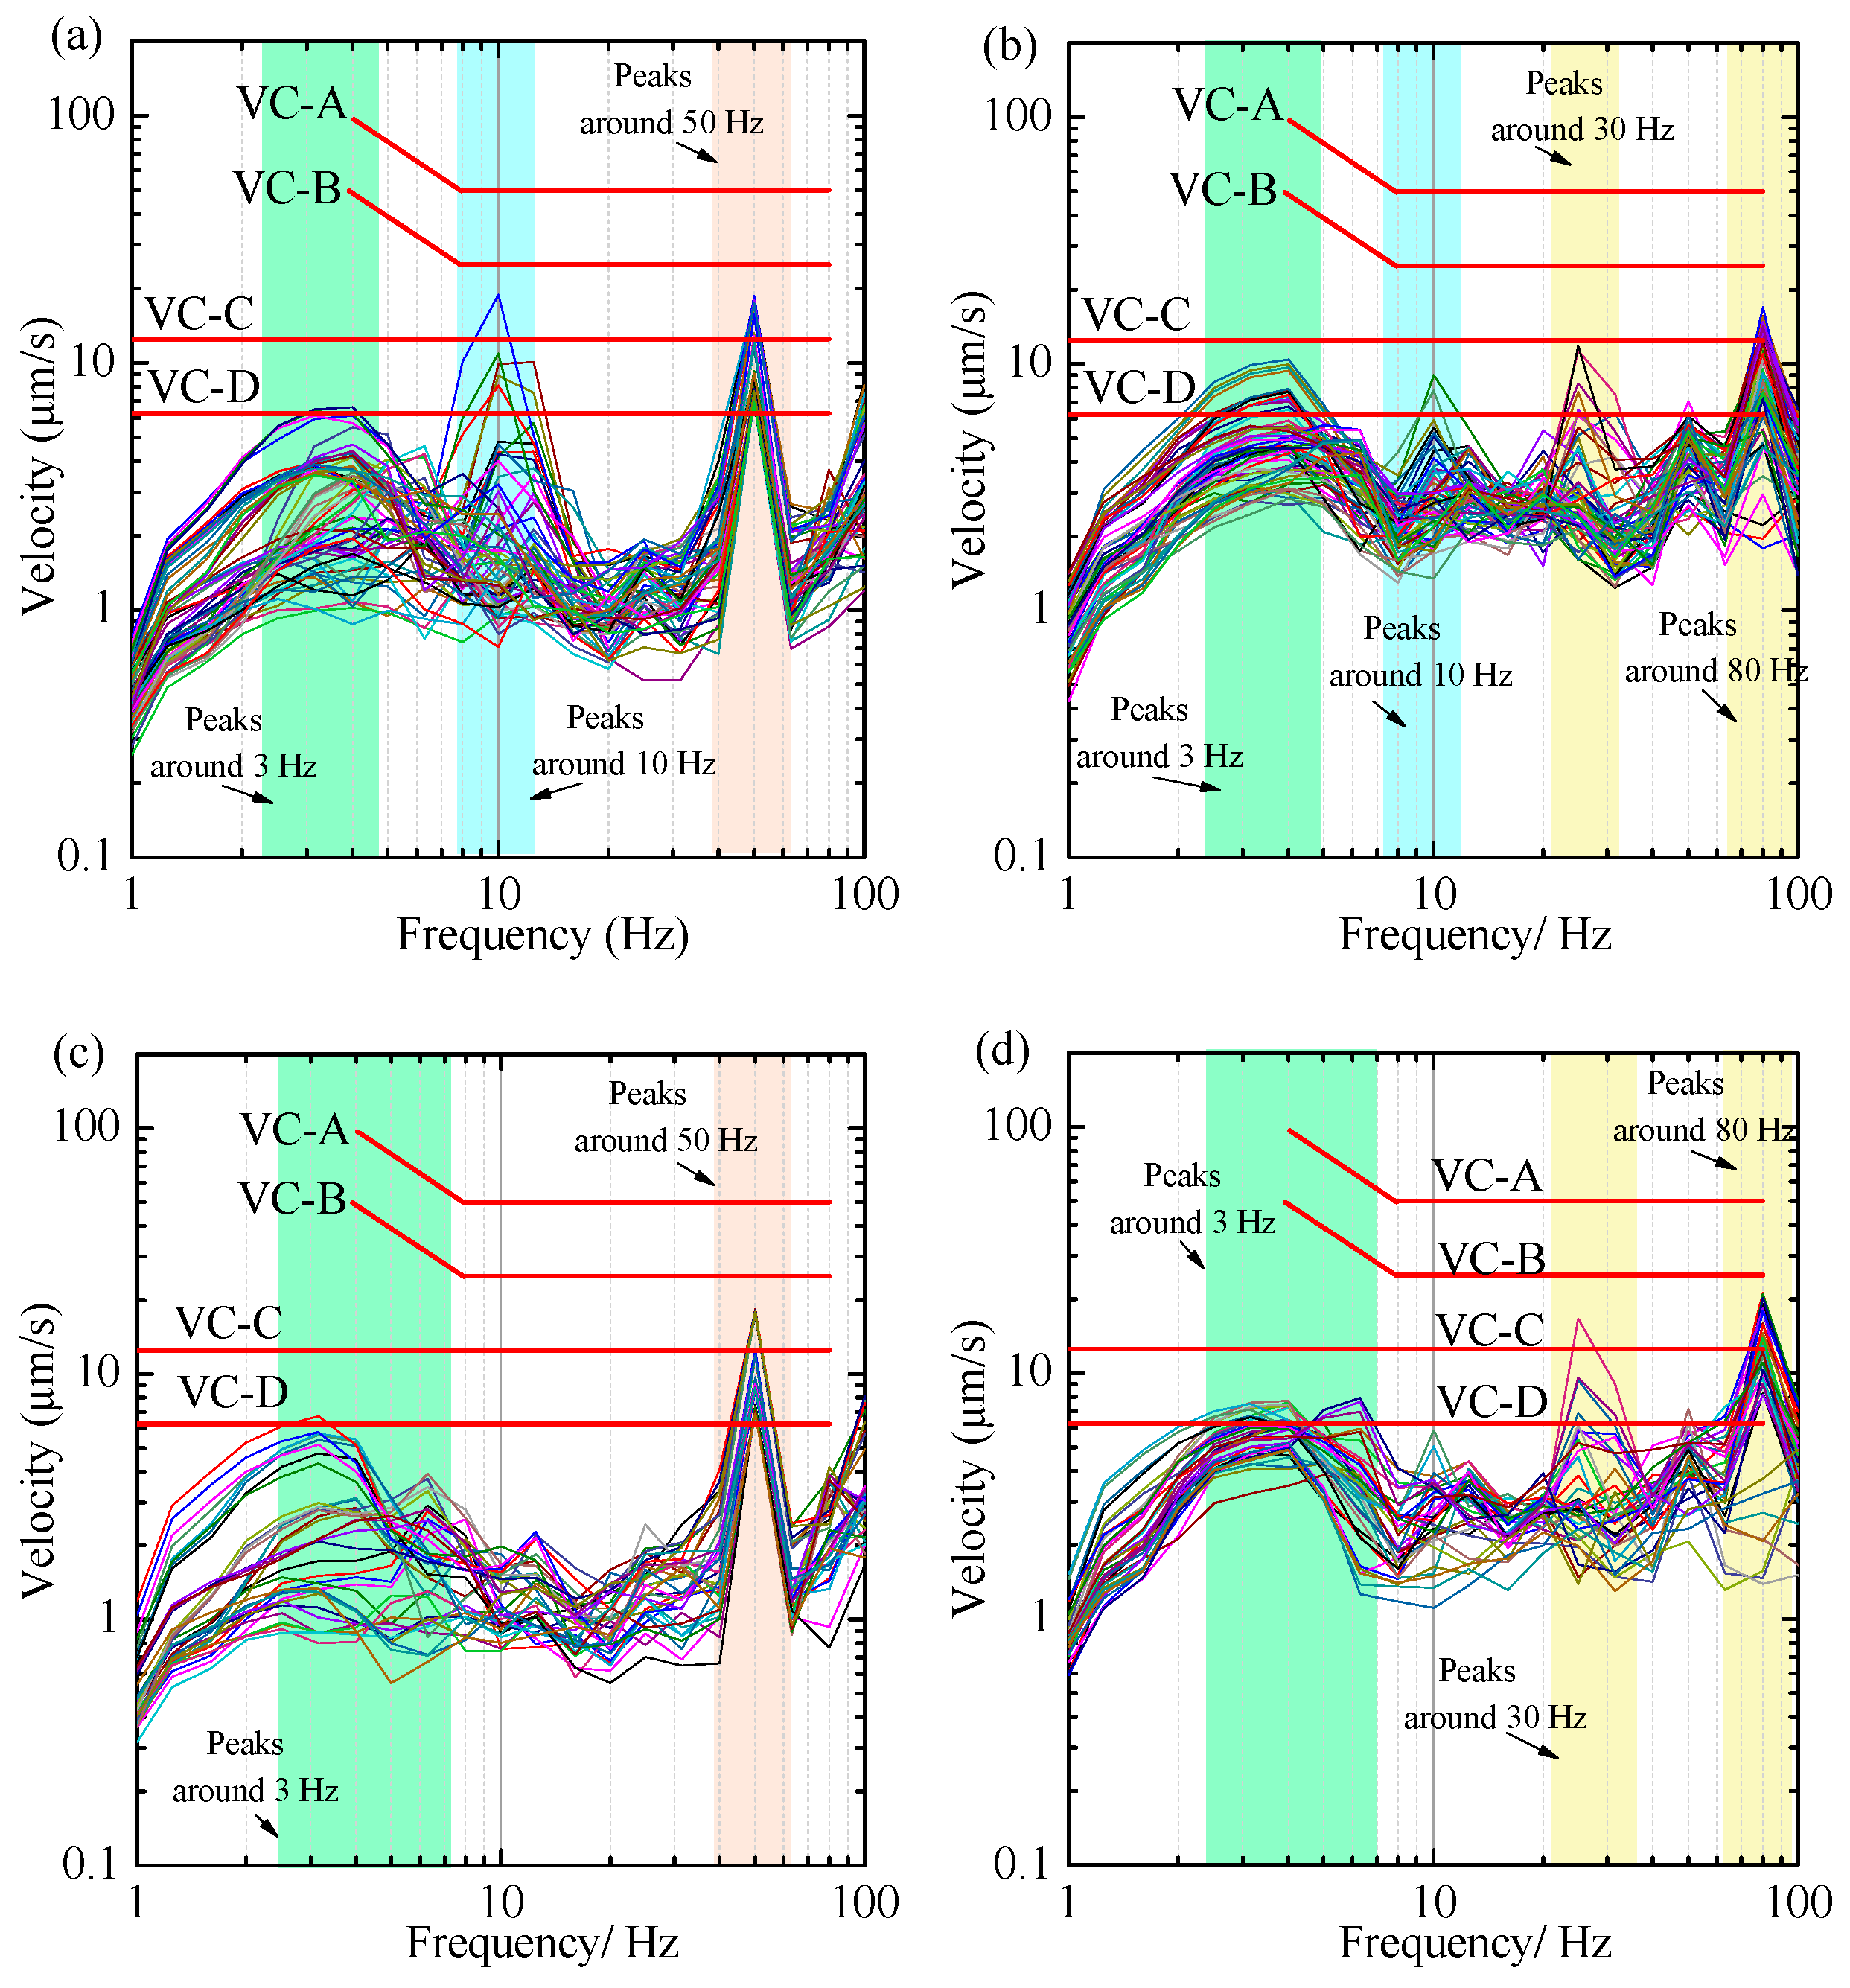
On the second floor slab, the area of test section 2 # was densely populated with production machinery, the vibration response of which was analyzed in detail to explore the vibration characteristics in the workshop. The 1/3 octave spectra of the vibration velocity at each measurement point in the vertical, horizontal X, and Y directions on the first and second floors are illustrated in Figure 12, Figure 13 and Figure 14, respectively. The test results have obvious discreteness. The reasons for this are two. On one hand, the vibrations of different measurement points caused by the operation of equipment were different. On the other hand, random traffic flow on the expressway contributed to significant differences in vibration responses.
Figure 12a,b show the 1/3 octave spectra of vertical vibration at the measuring points on the first and second floors in the daytime (6:00 a.m. to 10:00 p.m), and the nighttime spectra (10:00 p.m. to 6:00 a.m. on the next day) are presented in Figure 12c,d. In the daytime, the vertical vibration response of the measuring points on the first and second floors far exceeded the VC-C limit in a wide frequency range. At night, some test conditions of the vertical vibration response on the first floor exceeded the VC-C limit of around 6 Hz, while the vertical vibration response on the second floor in the peak frequency band of around 30 Hz and 80 Hz also exceeded the VC-C limit.
Considering the effects of the road vehicles, part of the test results shows response peaks around 6 Hz in Figure 12a–d, and a larger response peak appears around 10 Hz in Figure 12a,b. The reason is primarily due to the large traffic flow and rapid passage of heavy vehicles during the daytime, resulting in a peak response near 10 Hz. While there was relatively less traffic flow and few heavy vehicles at night, no response peaks around 10 Hz were observed. In the frequency ranges around 30 Hz and 80 Hz, obvious vibration response peaks can be observed in Figure 12b,d, and response amplitudes are significantly higher than those in Figure 12a,c. This is likely due to the 24 h uninterrupted operation of the production facilities on the second floor. So, for the daytime and nighttime, no significant differences in vibration responses around 30 Hz and 80 Hz can be observed in Figure 12b,d. It can be seen from Figure 12d that the vibration generated by the operation of the production facilities at night even exceeded the contribution of road vehicles to the vibration on the second floor slab.
The 1/3 octave spectra of vibration in the X direction at the measuring points on the first and second floors during the daytime are illustrated in Figure 13a,b, and the nighttime spectra are presented in Figure 13c,d. The X-direction vibration response of test section 2 # in the production workshop was smaller than that in the vertical direction. In the daytime, only a few test data on the first and second floors exceeded the VC-C limit in the peak frequency band. At night, the vibration responses on the first floor were very small, and all of them failed to reach the VC-C limit. Additionally, X-direction vibration responses on the second floor were only greater than the VC-C limit in the peak frequency band around 80 Hz.
The 1/3 octave spectra of vibration in the Y direction at the measuring points on the first and second floors during the daytime are indicated in Figure 14a,b, and the nighttime spectra are presented in Figure 14c,d. The Y-direction vibration response of test section 2 # was similar to the vibration in the X direction and much smaller than that in the vertical direction. In the daytime, very few test data on the first floor exceeded the VC-C limit in the peak frequency ranges around 10 and 50 Hz, and vibrations on the second floor only exceeded the VC-C limit at the peak frequency of 80 Hz. At night, only individual data on the first floor exceeded the VC-C limit at the peak frequency of 50 Hz, while partial vibration responses on the second floor exceeded the VC-C limit at 30 and 80 Hz.
4.4. Vibration Level of Workshop Vibration
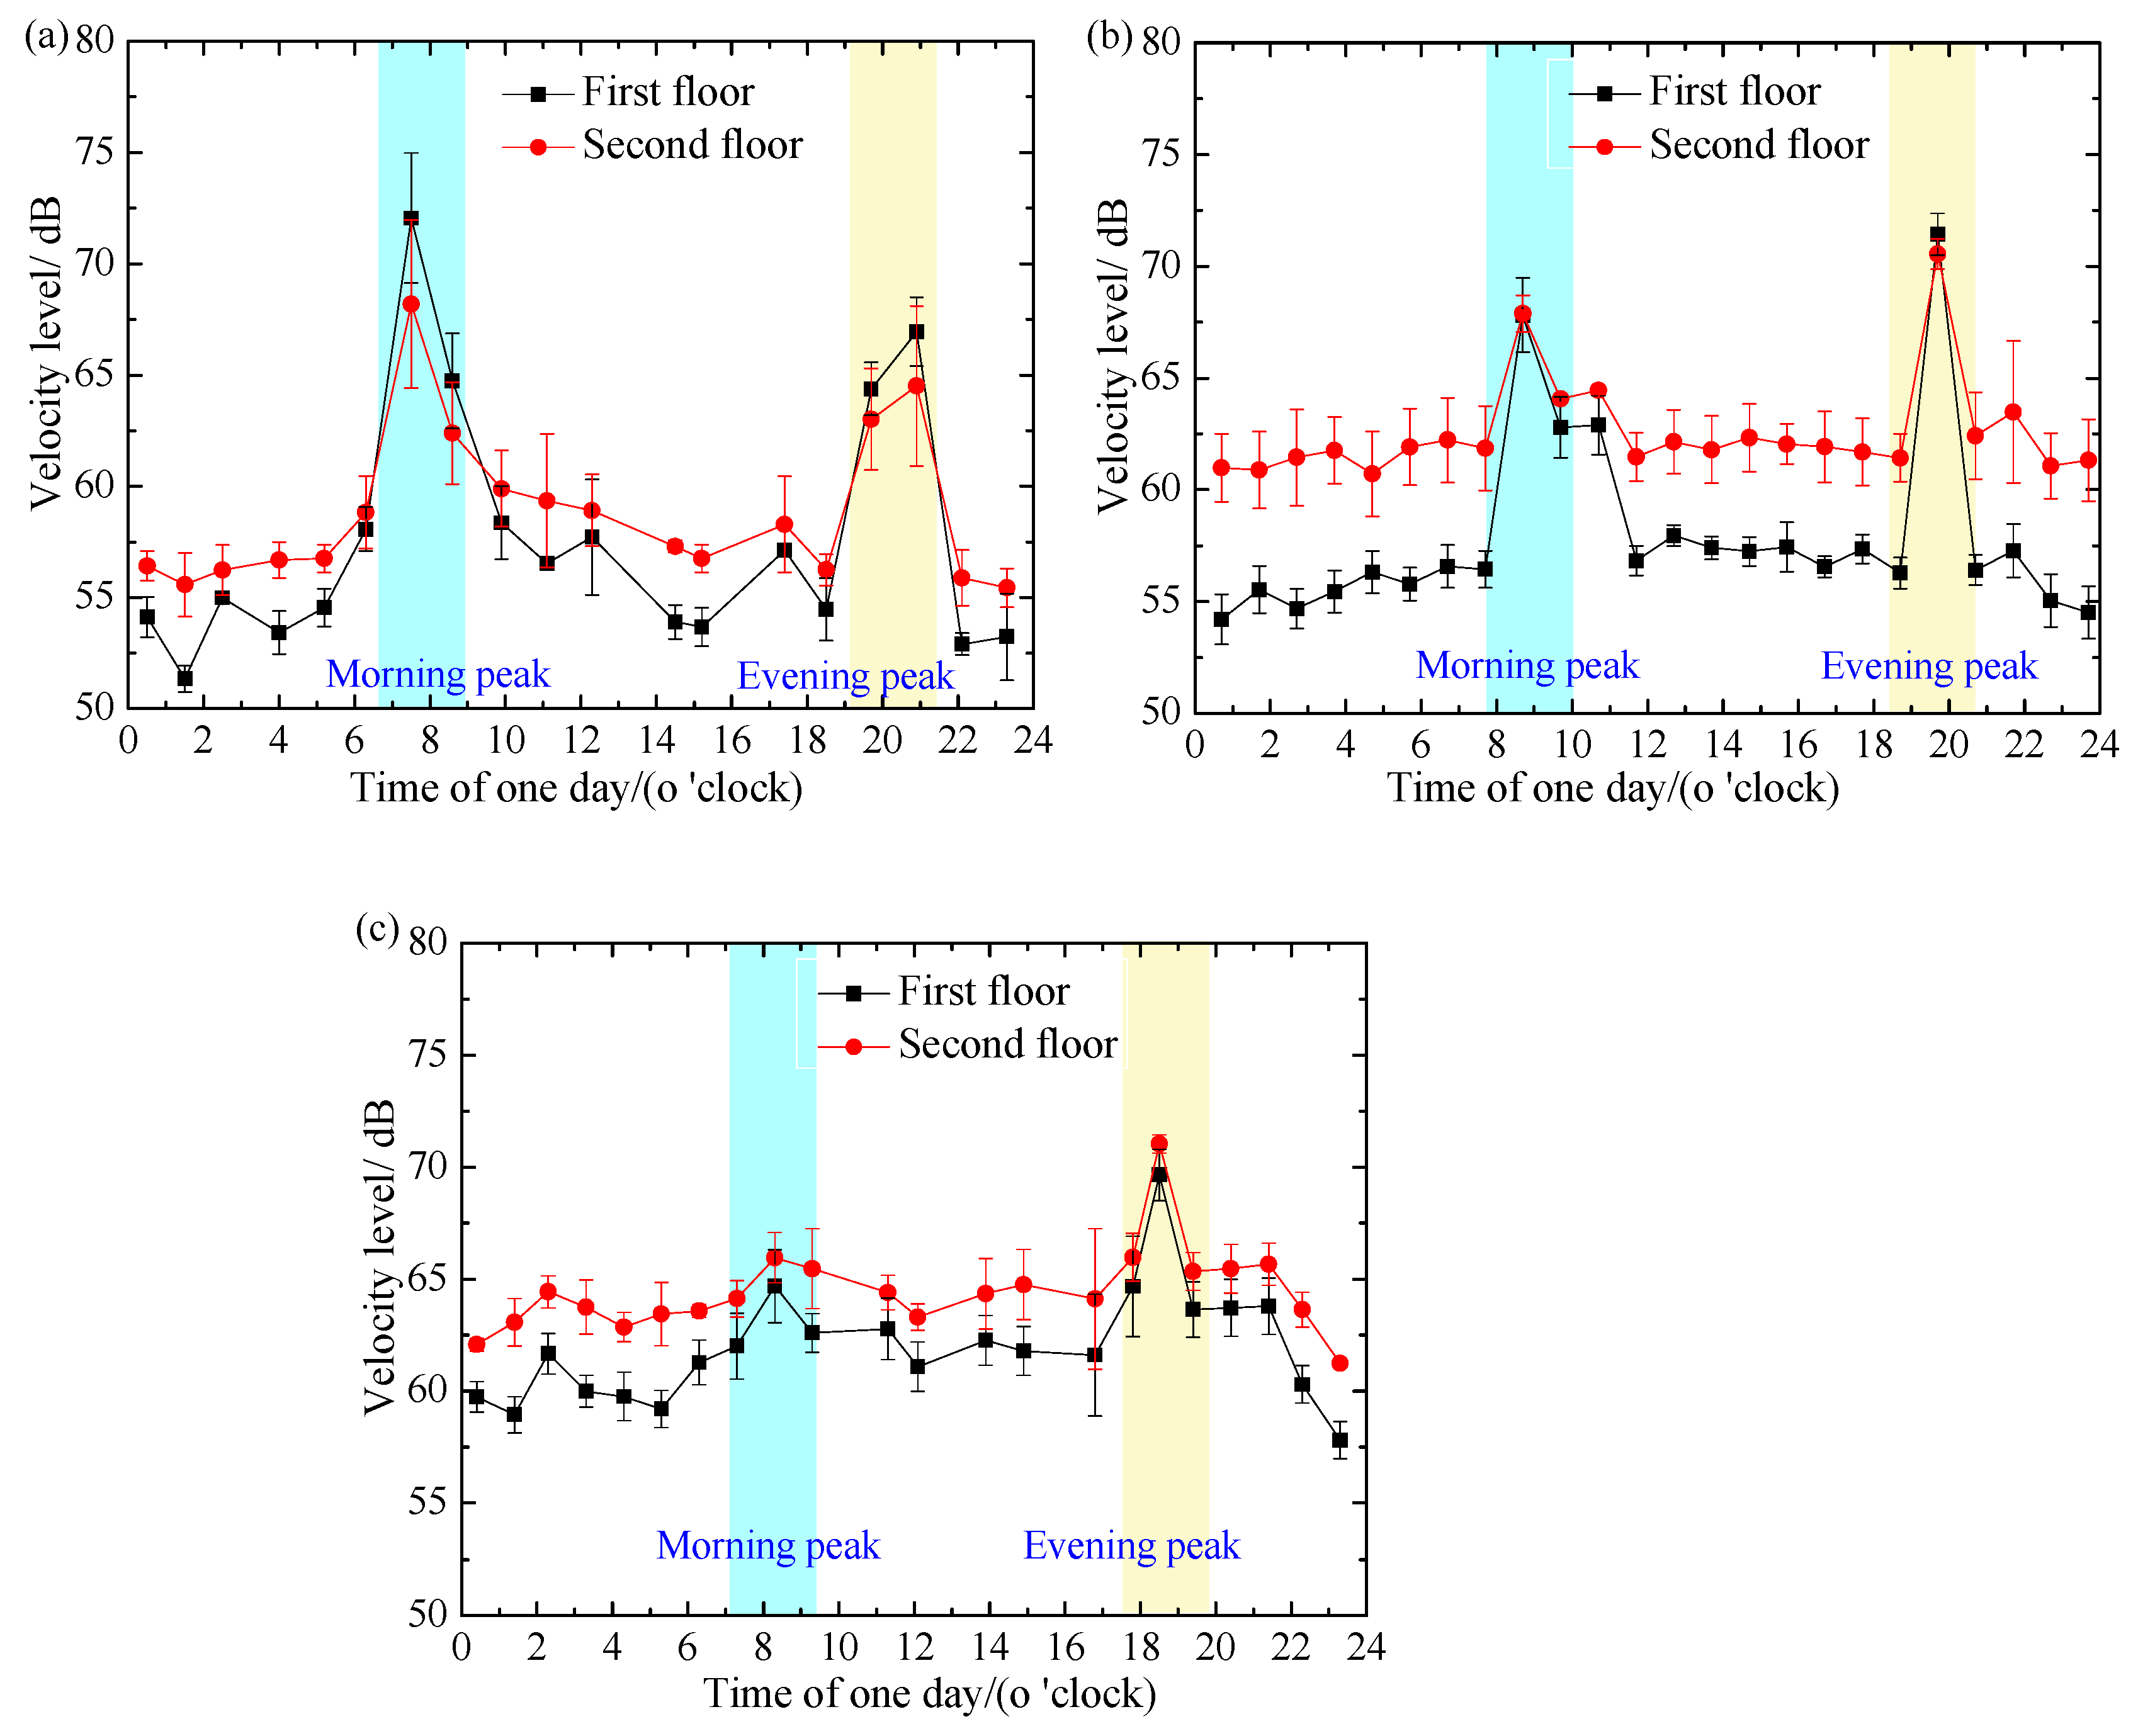
To study the vibration level of the first- and second floor slabs in the workshop at different moments, Equation (1) is used to obtain the velocity vibration level of the responses in the workshop. The mean and standard deviation of the vibration levels at the four measurement points on the same floor are then found. Taking test section 1 # as an example, the mean and standard deviation of the vibration response on the first floor are calculated according to the responses of the measuring points 1-1 # to 1-4 #, and the mean value and standard deviation of the responses on the second floor are obtained according to the responses of measuring points 1-5 # to 1-8 #. The mean and standard deviation of vibration responses on the first- and second floor slabs at the three test sections in the workshop are shown in Figure 15.
As shown in Figure 15, the square and circular dots represent the means of the vibration responses, and the vertical short line represents the standard deviation of the vibration responses. It can be seen from Figure 15 that the mean value and standard deviation of the vibration levels in the workshop have obvious variations at different moments, mainly due to the random road traffic flow on the expressway. However, it can be observed that the mean values of the vibration level magnify with the increased traffic flow in the morning and evening peak periods. During the three days when the three test sections were measured, respectively, the morning peak periods were uniform, which appeared in the period of 8:00 a.m. to 9:00 a.m., while the evening peaks primarily appeared in the period of 7:00 p.m. to 9:00 p.m.
Comparing the vibration characteristics of the first and second floor slabs at the three test sections, it can be found that except for the morning and evening peak periods, the velocity vibration level of the second floor slab is greater than that of the first floor slab, which is due to the vibration excitation caused by the operation of production facilities on the second floor. However, during the morning and evening peak periods, due to the increase in the road traffic flow, the contribution of vibration induced by road traffic increases, and the differences in vibration levels between the first and second floors decrease. It can even be observed in Figure 15a that the vibration level on the first floor slab exceeds that on the second floor slab due to the dominant increase in road traffic flow during the morning and evening peak periods. Therefore, it is necessary to take measures to control the vibration response caused by running vehicles, such as limiting the load capacity of heavy vehicles, controlling the vehicle speed, improving the pavement grade, and reducing the pavement’s roughness.
5. Conclusions
The rapid construction of urban roads improves people’s travel, yet it may cause environmental vibration issues. In the current study, we conducted field measurements to investigate the effect of road traffic-induced vibration on the micro-vibration of a workshop equipped with precision instruments. The test equipment was divided into two groups. One group was set on the ground to measure the vibration response on the propagation path. The other group was arranged in the workshop to collect the velocity signals on the first and second floors. The test results were analyzed in the time and frequency domains. Relevant data and findings can not only guide the design of vibration reduction schemes for road traffic environmental vibration but also validate potential numerical model predictions of traffic-induced micro-vibration. Our main conclusions are listed as follows:
The traffic-induced ground-borne vibration on the transmission route attenuates with the distance from the road and shows peak responses around 10 Hz. The passage of heavy vehicles causes remarkable vibration response both on the ground and in the workshop, among which the vertical vibration is the most significant.
The workshop is subject to vibration excitation from the operation of production equipment (above 20 Hz) in addition to vibration stimulation from vehicles (below 20 Hz). In the daytime, the vertical vibration responses on the first and second floors in the workshop far exceed the VC-C limit, but only a few test conditions of the vibration responses in the horizontal X and Y directions exceed the VC-C limit in the peak frequency range. At night, only individual test conditions of the vibration responses on the first and second floors exceed the VC-C limit in the peak frequencies.
During the periods of morning and evening peaks with heavy road traffic flow, the vertical vibration responses on the first and second floors in the workshop increased significantly. However, the second floor vibrates more than the first floor above 20 Hz, which can be attributed to the stimulation of instruments installed there.
Due to the heavy traffic flow in the daytime, the vertical vibration response of the floor slab in the workshop can easily exceed the VC-C limit. In addition, the vibration generated by the operation of the production equipment in the workshop cannot be ignored, which, in turn, has an obvious impact on the normal running of the production equipment. Therefore, it is necessary to explore vibration reduction measures for the production equipment. Moreover, due to the planning of a metro line, in the future, there will be an elevated metro line located 65 m away from the workshop, which, after it is completed and put into operation, will have adverse impacts on the workshop. It is necessary to further study the impacts of vibration induced by the subway line. Apart from this effect, we did not delve into specific details such as the axle weight, vehicle speed, or model information of the passing vehicles. Future research should aim to quantify these factors and conduct a more nuanced analysis of the building’s vibration response to specific sources of vehicle-induced vibration.
Author Contributions
Conceptualization, Z.Z. and X.L.; methodology, X.L.; investigation, Z.Z. and X.Z.; writing—original draft preparation, Z.Z. and G.X.; writing—review and editing, Z.Z., X.L. and X.Z.; visualization, A.W. All authors have read and agreed to the published version of the manuscript.
Funding
This research was funded by the National Natural Science Foundation of China (Grant Nos. 52008123 and 52368059) and the Startup Project for High-Level Talents of Guizhou Institute of Technology (No. XJGC20190651).
Data Availability Statement
The original contributions presented in the study are included in the article, further inquiries can be directed to the corresponding author.
Acknowledgments
Thanks are extended to the anonymous reviewers whose suggestions improved this manuscript.
Conflicts of Interest
The authors declare no conflicts of interest.
References
- Khajehdezfuly, A.; Shiraz, A.A.; Sadeghi, J. Assessment of vibrations caused by simultaneous passage of road and railway vehicles. Appl. Acoust. 2023, 211, 109510. [Google Scholar] [CrossRef]
- Li, Z.; Cao, Y.; Ma, M.; Xiang, Q. Prediction of ground-borne vibration from random traffic flow and road roughness: Theoretical model and experimental validation. Eng. Struct. 2023, 285, 116060. [Google Scholar] [CrossRef]
- Czech, K.R. The impact of the type and technical condition of road surface on the level of traffic-generated vibrations propagated to the environment. Procedia Eng. 2016, 143, 1358–1367. [Google Scholar] [CrossRef]
- Hao, H.; Ang, T.C.; Shen, J. Building vibration to traffic-induced ground motion. Build. Environ. 2001, 36, 321–336. [Google Scholar] [CrossRef]
- Guo, M.; Ni, M.Y.; Shyu, R.; Ji, J.S.; Huang, J. Automated simulation for household road traffic noise exposure: Application and field evaluation in a high-density city. Comput. Environ. Urban Syst. 2023, 104, 102000. [Google Scholar] [CrossRef]
- Zhang, Z.; Li, X.; Zhang, X.; Fan, J.; Xu, G. Semi-analytical simulation for ground-borne vibration caused by rail traffic on viaducts: Vibration-isolating effects of multi-layered elastic supports. J. Sound Vib. 2022, 516, 116540. [Google Scholar] [CrossRef]
- He, C.; Zhou, S.; Guo, P. An efficient three-dimensional method for the prediction of building vibrations from underground railway networks. Soil Dyn. Earthq. Eng. 2020, 139, 106269. [Google Scholar] [CrossRef]
- Ertugrul, O.L.; Ozkan, M.Y.; Ulgen, D. Attenuation of Traffic Induced Ground Borne Vibrations Due to Heavy Vehicles. In Proceedings of the Fifth International Conference on Recent Advances in Geotechnical Earthquake Engineering and Soil Dynamics and Symposium in Honor of Professor I. M. Idriss, San Diego, CA, USA, 24–29 May 2010. [Google Scholar]
- Hajek, J.J.; Blaney, C.T.; Hein, D.K. Mitigation of Highway Traffic-Induced Vibration. In Proceedings of the 2006 Annual Conference of the Transportation Association of Canada, Charlottetown, PEI, Canada, 17–20 September 2006. [Google Scholar]
- Hu, Z.; Tian, L.; Zou, C.; Wu, J. Train-induced vibration attenuation measurements and prediction from ground soil to building column. Environ. Sci. Pollut. Res. 2023, 30, 39076–39092. [Google Scholar] [CrossRef] [PubMed]
- Qiu, Y.; Zou, C.; Hu, J.; Chen, J. Prediction and mitigation of building vibrations caused by train operations on concrete floors. Appl. Acoust. 2024, 219, 109941. [Google Scholar] [CrossRef]
- Li, X.; Chen, Y.; Zou, C.; Wang, H.; Zheng, B.; Chen, J. Building structure-borne noise measurements and estimation due to train operations in tunnel. Sci. Total Environ. 2024, 926, 172080. [Google Scholar] [CrossRef]
- Watts, G.R. Traffic-Induced Ground-Borne Vibrations in Dwellings; Transport and Road Research Laboratory: Crowthorne, UK, 1987. [Google Scholar]
- Watts, G.R. The generation and propagation of vibration in various soils produced by the dynamic loading of road pavements. J. Sound Vib. 1992, 156, 191–206. [Google Scholar] [CrossRef]
- Hunt, H. Modelling of road vehicles for calculation of traffic-induced ground vibration as a random process. J. Sound Vib. 1991, 144, 41–51. [Google Scholar] [CrossRef]
- Hunt, H. Stochastic modelling of traffic-induced ground vibration. J. Sound Vib. 1991, 144, 53–70. [Google Scholar] [CrossRef]
- Lombaert, G.; DeGrande, G. The experimental validation of a numerical model for the prediction of the vibrations in the free field produced by road traffic. J. Sound Vib. 2003, 262, 309–331. [Google Scholar] [CrossRef]
- Hao, H.; Ang, T.C. Analytical Modeling of Traffic-Induced Ground Vibrations. J. Eng. Mech. 1998, 124, 921–928. [Google Scholar] [CrossRef]
- Agostinacchio, M.; Ciampa, D.; Olita, S. The vibrations induced by surface irregularities in road pavements—A Matlab® approach. Eur. Transp. Res. Rev. 2014, 6, 267–275. [Google Scholar] [CrossRef]
- Lak, M.A.; Degrande, G.; Lombaert, G. The effect of road unevenness on the dynamic vehicle response and ground-borne vibrations due to road traffic. Soil Dyn. Earthq. Eng. 2011, 31, 1357–1377. [Google Scholar] [CrossRef]
- Watts, G.R.; Krylov, V.V. Ground-borne vibration generated by vehicles crossing road humps and speed control cushions. Appl. Acoust. 2000, 59, 221–236. [Google Scholar] [CrossRef]
- Ducarne, L.; Ainalis, D.; Kouroussis, G. Assessing the ground vibrations produced by a heavy vehicle traversing a traffic obstacle. Sci. Total Environ. 2018, 612, 1568–1576. [Google Scholar] [CrossRef]
- Mhanna, M.; Sadek, M.; Shahrour, I. Numerical modeling of traffic-induced ground vibration. Comput. Geotech. 2012, 39, 116–123. [Google Scholar] [CrossRef]
- Taniguchi, E.; Sawada, K. Attenuation with distance of traffic-induced vibrations. J. Jpn. Soc. Soil Mech. Found. Eng. 1979, 19, 15–28. [Google Scholar] [CrossRef] [PubMed]
- Al-Hunaidi, M.O.; Rainer, J.H. Remedial measures for traffic-induced vibrations at a residential site. Part 1: Field tests. Can. Acoust. 1991, 19, 3–13. [Google Scholar]
- Al-Hunaidi, M.O.; Rainer, J.H.; Tremblay, M. Control of traffic-induced vibration in buildings using vehicle suspension systems. Soil Dyn. Earthq. Eng. 1996, 15, 245–254. [Google Scholar] [CrossRef]
- Qu, S.; Yang, J.; Zhu, S.; Zhai, W.; Kouroussis, G.; Zhang, Q. Experimental study on ground vibration induced by double-line subway trains and road traffic. Transp. Geotech. 2021, 29, 100564. [Google Scholar] [CrossRef]
- Crispino, M.; D’Apuzzo, M. Measurement and prediction of traffic-induced vibrations in a heritage building. J. Sound Vib. 2001, 246, 319–335. [Google Scholar] [CrossRef]
- Astrauskas, T.; Janueviius, T.; Grubliauskas, R. Vehicle speed influence on ground-borne vibrations caused by road transport when passing vertical traffic calming measures. Promet-Traffic Transp. 2020, 32, 247–253. [Google Scholar] [CrossRef]
- Ding, D.Y.; Liu, W.N.; Gupta, S.; Lombaert, G.; Degrande, G. Prediction of vibrations from underground trains on Beijing metro line 15. J. Cent. South Univ. Technol. 2010, 17, 1109–1118. [Google Scholar] [CrossRef]
- Ding, D.Y.; Gupta, S.; Liu, W.N.; Lombaert, G.; Degrande, G. Prediction of vibrations induced by trains on line 8 of Beijing metro. J. Zhejiang Univ. Sci. A 2010, 11, 280–293. [Google Scholar] [CrossRef]
- Qu, S.; Yang, J.; Zhu, S.; Zhai, W.; Kouroussis, G. A hybrid methodology for predicting train-induced vibration on sensitive equipment in far-field buildings. Transp. Geotech. 2021, 31, 100682. [Google Scholar] [CrossRef]
- He, C.; Zhou, S.; Di, H.; Guo, P.; Xiao, J. Analytical method for calculation of ground vibration from a tunnel embedded in a multi-layered half-space. Comput. Geotech. 2018, 99, 149–164. [Google Scholar] [CrossRef]
- Wang, Y.; Zhang, H.; Ji, Y.; Xiong, M.; Shen, Z. Micro-vibration prediction and evaluation analysis of the structural foundation of a precision instrument plant across the reservoir. In Proceedings of the 8th International Conference on Hydraulic and Civil Engineering: Deep Space Intelligent Development and Utilization Forum (ICHCE), Xi’an, China, 25–27 November 2022; pp. 1287–1291. [Google Scholar]
- Chen, X.; Jiang, J.; Hu, Y.; Sheng, T.; Tang, K. Experimental study on the influence of precision instruments caused by heavy vehicles vibration. J. Phys. Conf. Ser. 2021, 2044, 12113. [Google Scholar] [CrossRef]
- Zhang, Y.; Wang, X.; Lu, C.; Liu, K.; Song, B. Influence of road traffic vibration on micro-dynamic response of precision instrument vibration isolation platforms. Eng. Proc. 2023, 36, 48. [Google Scholar] [CrossRef]
- Ulgen, D.; Ertugrul, O.L.; Ozkan, M.Y. Measurement of ground borne vibrations for foundation design and vibration isolation of a high-precision instrument. Measurement 2016, 93, 385–396. [Google Scholar] [CrossRef]
- HJ918-2017; Technical Specifications for Environmental Vibration Monitoring. Ministry of Environmental Protection of the People’s Republic of China: Beijing, China, 2017.
- Hanson, C.E.; Towers, D.A.; Meister, L.D. Transit Noise and Vibration Impact Assessment (FTA-VA-90-1003-06); Department of Transportation Federal Transit Administration (FTA): Washington, DC, USA, 2006. [Google Scholar]
- Li, H.; He, C.; Gong, Q.; Zhou, S.; Li, X.; Zou, C. TLM-CFSPML for 3D dynamic responses of a layered transversely isotropic half-space. Comput. Geotech. 2024, 168, 106131. [Google Scholar] [CrossRef]
- Gordon, C. Generic criteria for vibration-sensitive equipment. In Proceedings of the SPIE—The International Society for Optical Engineering, San Jose, CA, USA, 4–6 November 1991; Volume 1619, pp. 71–85. [Google Scholar]
- Amick, H.; Gendreau, M.; Busch, T.; Gordon, C. Evolving criteria for research facilities: I-Vibration. In Proceedings of the SPIE Conference 5933: Buildings for Nanoscale Research and Beyond, San Diego, CA, USA, 31 July–4 August 2005. [Google Scholar]
Figure 1.
Test scheme for the microelectronics enterprise beside the urban expressway: (a) plan of the microelectronics enterprise; (b) locations of the four test sections; and (c) illustration of measuring points.
Figure 1.
Test scheme for the microelectronics enterprise beside the urban expressway: (a) plan of the microelectronics enterprise; (b) locations of the four test sections; and (c) illustration of measuring points.

Figure 2.
Installation of sensors on the first floor slab.

Figure 3.
Placement of test points on the second floor: (a) test section 1 #; (b) test section 2 #; (c) test section 3 #; and (d) installation of sensors on the second floor slab.
Figure 3.
Placement of test points on the second floor: (a) test section 1 #; (b) test section 2 #; (c) test section 3 #; and (d) installation of sensors on the second floor slab.

Figure 4.
Vehicles on the urban expressway beside the workshop.

Figure 5.
Vehicles on the urban expressway beside the workshop: (a) traffic flow on the expressway and (b) heavy trucks on the road.
Figure 5.
Vehicles on the urban expressway beside the workshop: (a) traffic flow on the expressway and (b) heavy trucks on the road.

Figure 6.
Time histories of vibration velocity at test section 4 # in the (a) vertical direction; (b) X direction; and (c) Y direction.
Figure 6.
Time histories of vibration velocity at test section 4 # in the (a) vertical direction; (b) X direction; and (c) Y direction.

Figure 7.
Spectra of vibration velocities at test section 4 # in the (a) vertical direction; (b) X direction; and (c) Y direction.
Figure 7.
Spectra of vibration velocities at test section 4 # in the (a) vertical direction; (b) X direction; and (c) Y direction.

Figure 8.
The 1/3 octave spectra of vertical velocity at the following test points: (a) 4-1 #; (b) 4-3 #; (c) 4-5 #; and (d) 4-7.
Figure 8.
The 1/3 octave spectra of vertical velocity at the following test points: (a) 4-1 #; (b) 4-3 #; (c) 4-5 #; and (d) 4-7.

Figure 9.
Vertical velocity levels of test points from 4-1 # to 4-7 # at test section 4.

Figure 10.
Time histories of vertical vibration at test points 2-4 # and 2-8 #: (a) first floor and (b) second floor.
Figure 10.
Time histories of vertical vibration at test points 2-4 # and 2-8 #: (a) first floor and (b) second floor.

Figure 11.
Spectra of vertical vibration at test section 2 # on the (a) first floor and (b) second floor.
Figure 11.
Spectra of vertical vibration at test section 2 # on the (a) first floor and (b) second floor.

Figure 12.
The 1/3 octave spectra of vibration velocities in the vertical direction (a) on the first floor in the daytime; (b) on the second floor in the daytime; (c) on the first floor at night; and (d) on the second floor at night.
Figure 12.
The 1/3 octave spectra of vibration velocities in the vertical direction (a) on the first floor in the daytime; (b) on the second floor in the daytime; (c) on the first floor at night; and (d) on the second floor at night.

Figure 13.
The 1/3 octave spectra of vibration velocity in the X direction (a) on the first floor in the daytime; (b) on the second floor in the daytime; (c) on the first floor at night; and (d) on the second floor at night.
Figure 13.
The 1/3 octave spectra of vibration velocity in the X direction (a) on the first floor in the daytime; (b) on the second floor in the daytime; (c) on the first floor at night; and (d) on the second floor at night.


Figure 14.
The 1/3 octave spectra of vibration velocity in the Y direction (a) on the first floor in the daytime; (b) on the second floor in the daytime; (c) on the first floor at night; and (d) on the second floor at night.
Figure 14.
The 1/3 octave spectra of vibration velocity in the Y direction (a) on the first floor in the daytime; (b) on the second floor in the daytime; (c) on the first floor at night; and (d) on the second floor at night.

Figure 15.
Vertical vibration levels of the workshop during one day at (a) test section 1 #; (b) test section 2 #; and (c) test section 3 #.
Figure 15.
Vertical vibration levels of the workshop during one day at (a) test section 1 #; (b) test section 2 #; and (c) test section 3 #.


Table 1.
Vibration limits from VC-A to VC-G.
| Vibration Level | Frequency Range (Hz) | Vibration Limit |
|---|---|---|
| VC-A | 4~8 | The acceleration does not exceed 260 . |
| 8-80 | The velocity does not exceed 50 . | |
| VC-B | 4~8 | The acceleration does not exceed 130 . |
| 8~80 | The velocity does not exceed 25 . | |
| VC-C | 1~80 | The velocity does not exceed 12.5 . |
| VC-D | 1~80 | The velocity does not exceed 6.25 . |
| VC-E | 1~80 | The velocity does not exceed 3.12 . |
| VC-F | 1~80 | The velocity does not exceed 1.56 . |
| VC-G | 1~80 | The velocity does not exceed 0.78 . |
Disclaimer/Publisher’s Note: The statements, opinions and data contained in all publications are solely those of the individual author(s) and contributor(s) and not of MDPI and/or the editor(s). MDPI and/or the editor(s) disclaim responsibility for any injury to people or property resulting from any ideas, methods, instructions or products referred to in the content. |
© 2024 by the authors. Licensee MDPI, Basel, Switzerland. This article is an open access article distributed under the terms and conditions of the Creative Commons Attribution (CC BY) license (https://creativecommons.org/licenses/by/4.0/).
Share and Cite
MDPI and ACS Style
Zhang, Z.; Li, X.; Zhang, X.; Xu, G.; Wu, A. Measurements and Evaluation of Road Traffic-Induced Micro-Vibration in a Workshop Equipped with Precision Instruments. Buildings 2024, 14, 1142. https://doi.org/10.3390/buildings14041142
AMA Style
Zhang Z, Li X, Zhang X, Xu G, Wu A. Measurements and Evaluation of Road Traffic-Induced Micro-Vibration in a Workshop Equipped with Precision Instruments. Buildings. 2024; 14(4):1142. https://doi.org/10.3390/buildings14041142
Chicago/Turabian StyleZhang, Zhijun, Xiaozhen Li, Xun Zhang, Guihong Xu, and Anjie Wu. 2024. "Measurements and Evaluation of Road Traffic-Induced Micro-Vibration in a Workshop Equipped with Precision Instruments" Buildings 14, no. 4: 1142. https://doi.org/10.3390/buildings14041142
Note that from the first issue of 2016, this journal uses article numbers instead of page numbers. See further details here.