
Improved Evidence Fusion Theory for the Safety Assessment of Prestressed Concrete Bridges
College of Civil Engineering and Architecture, Zhejiang University, Hangzhou 310058, China
*
Author to whom correspondence should be addressed.
Buildings 2024, 14(4), 1144; https://doi.org/10.3390/buildings14041144
Submission received: 2 March 2024
/
Revised: 8 April 2024
/
Accepted: 14 April 2024
/
Published: 18 April 2024
(This article belongs to the Section Building Structures)
Abstract
:The safety condition assessment of prestressed concrete bridges is currently subject to great uncertainty due to the subjectivity of data collection and data types. This study proposes an improved evidence fusion method, improving the conventional Dempster–Shafer fusion method to reduce assessment inaccuracies caused by data uncertainty. Firstly, the uncertain analytic hierarchy process was applied to construct a three-level safety assessment model for 15 different indicators with their initial weights. Secondly, the fuzzy matter element theory was proposed to obtain basic probability assignments required for the evidence fusion. Finally, an improved evidence fusion method was proposed based on the evidence credibility and preprocessing corrections for highly conflicting evidence. In this study, a prestressed concrete bridge in eastern China was used as a case study to perform a comprehensive safety assessment and verify the effectiveness and practicality of the proposed method. The assessment results demonstrate that the improved fusion method in this study can deal with conflicting evidence better than existing fusion methods. Compared with conventional fuzzy AHP method, it has greater sensitivity to certain indicators with severe damages, which prevents those indicators from being overshadowed by other well-performing ones in the overall assessment.
1. Introduction
Since their first appearance in France in 1950, prestressed concrete bridges have become one of the most promising types of concrete bridges [1]. In China, continuous prestressed concrete bridges were constructed in the late 1970s [2]. Since the 1970s, many theoretical and experimental studies on these bridges have been conducted in different countries [3]. It is inevitable that concrete structures will gradually deteriorate over time due to the natural environment and the internal factors of the material, resulting in the degradation and damages [4,5,6]. A large number of prestressed concrete bridges in China have been in service for many years and have suffered varying degrees of damage. Some bridges have major problems with serious damage, whereas others have not yet developed problems but have hidden hazards. Therefore, further research in this area is urgently needed.
Preventive maintenance is increasingly becoming a fundamental strategy in the bridge industry, as it ensures the sustainable maintenance of the structure throughout its service life [7]. For prestressed concrete bridges, the damage to the bridge mainly manifests itself in the corrosion of the prestressing tendons, a reduction in the effective prestressing force, and the development of structural cracks. To date, various load test methods [8,9,10], theoretical analysis methods [11,12,13], and expert systems assessment methods [14,15,16] have been developed to assess the safety conditions of prestressed concrete bridges. These methods are beneficial in bridge damage assessment. However, they also have several limitations and shortcomings in application practice. For example, Cai pointed out that although the load test method was reliable and intuitive, it was performed on a large scale and may lead to more serious structural damage [17]. In addition, load tests do not always fully reflect the actual working performance of a structure. The specificity of each bridge in service leads to inadequacies in the direct assessment of the structure based on the available theoretical analysis results. According to Vries, the limitations of the application of reliability theory were mainly reflected in the fact that most of the research focused on the influence of individual factors, and the research results were scattered and had not formed a comprehensive system [18]. Results obtained by theoretical calculations differ significantly from measured values. Expert system evaluation methods are prone to errors in judgment in complex decision-making problems, and existing expert systems usually only provide assistance in evaluation decisions.
The safety assessment of prestressed concrete bridges can be considered a multi-criteria decision making (MCDM) problem due to the various influencing factors [19]. During data-collection, the collected information may be imprecise and uncertain. In addition, different types of data have been collected, which could be classified as objective data (quantitative indicators) and subjective data (qualitative indicators). The fusion of all the assessment indicators forms the final assessment decision result for this MCDM problem. The Dempster–Shafer (D-S) theory of evidence is an important method for deducing uncertainty [20]. The advantages of D-S evidence theory are that it satisfies weaker conditions than Bayes probability theory and can directly express uncertainty. However, although D-S evidence theory works well in some cases, when highly conflicting evidence appears in the evidence, the fusion results may be inconsistent with the facts. The most common conflict types are total conflict paradox, 0-belief paradox, and 1-belief paradox. The fusion law of D-S evidence theory has significant disadvantages in dealing with such conflicting data [21]. Therefore, to expand the application of D-S evidence theory, it is important to improve its fusion law. In addition, the validity of D-S evidence theory depends heavily on the construction of the basic probability assignments (BPAs). In the D-S evidence theory, a BPA assigns a belief degree to each possible subset of hypotheses in a frame of discernment. It represents the degree of belief or support for each hypothesis based on available evidence. Therefore, the efficient and reasonable construction of the initial BPAs is also a significant problem. Yager’s study concluded that conflicting evidence did not provide useful information and assigned all the basic probability assignments of the conflicting part to the full set of uncertainty focal elements [22]. Lefevre proposed the concept of a unified confidence function [23]. Another reasonable approach is to modify the original data source. Murphy proposed an arithmetic averaging method of evidence sources [24]. Capelle considered the distance relationship between two pieces of evidence and proposed a new method for weighting evidence [25]. Jousselme defined a Jousselme distance to measure the distance between two basic probability assignments and distinguish the proximity of evidence [26]. Deng proposed a weighted average weighting correction method based on Murphy’s method [27]. The aforementioned fusion methods all suffered from high uncertainty. Although Deng’s method made improvements over previous methods, the idea of the weighted average he adopted was based on normalizing the credibility for each piece of evidence. When the quantity of evidence increases, the normalized confidence level assigned to each piece of evidence will become extremely low, adversely affecting the fusion results.
To effectively construct the initial BPAs required for the D-S evidence theory, the fuzzy matter element theory (FME) and uncertain analytic hierarchy process (UAHP) are presented in this study. FME is a data processing method proposed by Chinese scholar Cai, which can represent fuzzy and incompatible information in knowledge representation, acquisition, and inference and is an effective method for evaluating multiple factors [28]. According to this theory, correlation is the measure of the degree to which each indicator is related to a standard [29]. Correlation can quantify each indicator, which is conducive to analyzing indicator factors from a changing perspective and better reflecting the status of each indicator. Uncertain analytic hierarchical analysis (UAHP) is a practical MCDM method that presents a complex problem as an ordered recursive hierarchy and ranks the merits of decision options based on expert judgment [30]. For the complex assessment problem in this study, the intervals can be used to characterize the relative importance of each assessment index by conducting a two-by-two comparison [31].
In this study, a comprehensive safety assessment framework for prestressed concrete bridges was proposed. The initial BPAs required for evidence fusion were constructed by combining UAHP and FME, and the evidence fusion was completed by preprocessing the conflicting evidence using improved evidence fusion method (IDS). The feasibility of this method was demonstrated by a safety assessment of a prestressed concrete bridge in eastern China. This study verified the advantages of this method by comparing its results with those of conventional assessment methods.
2. Methods
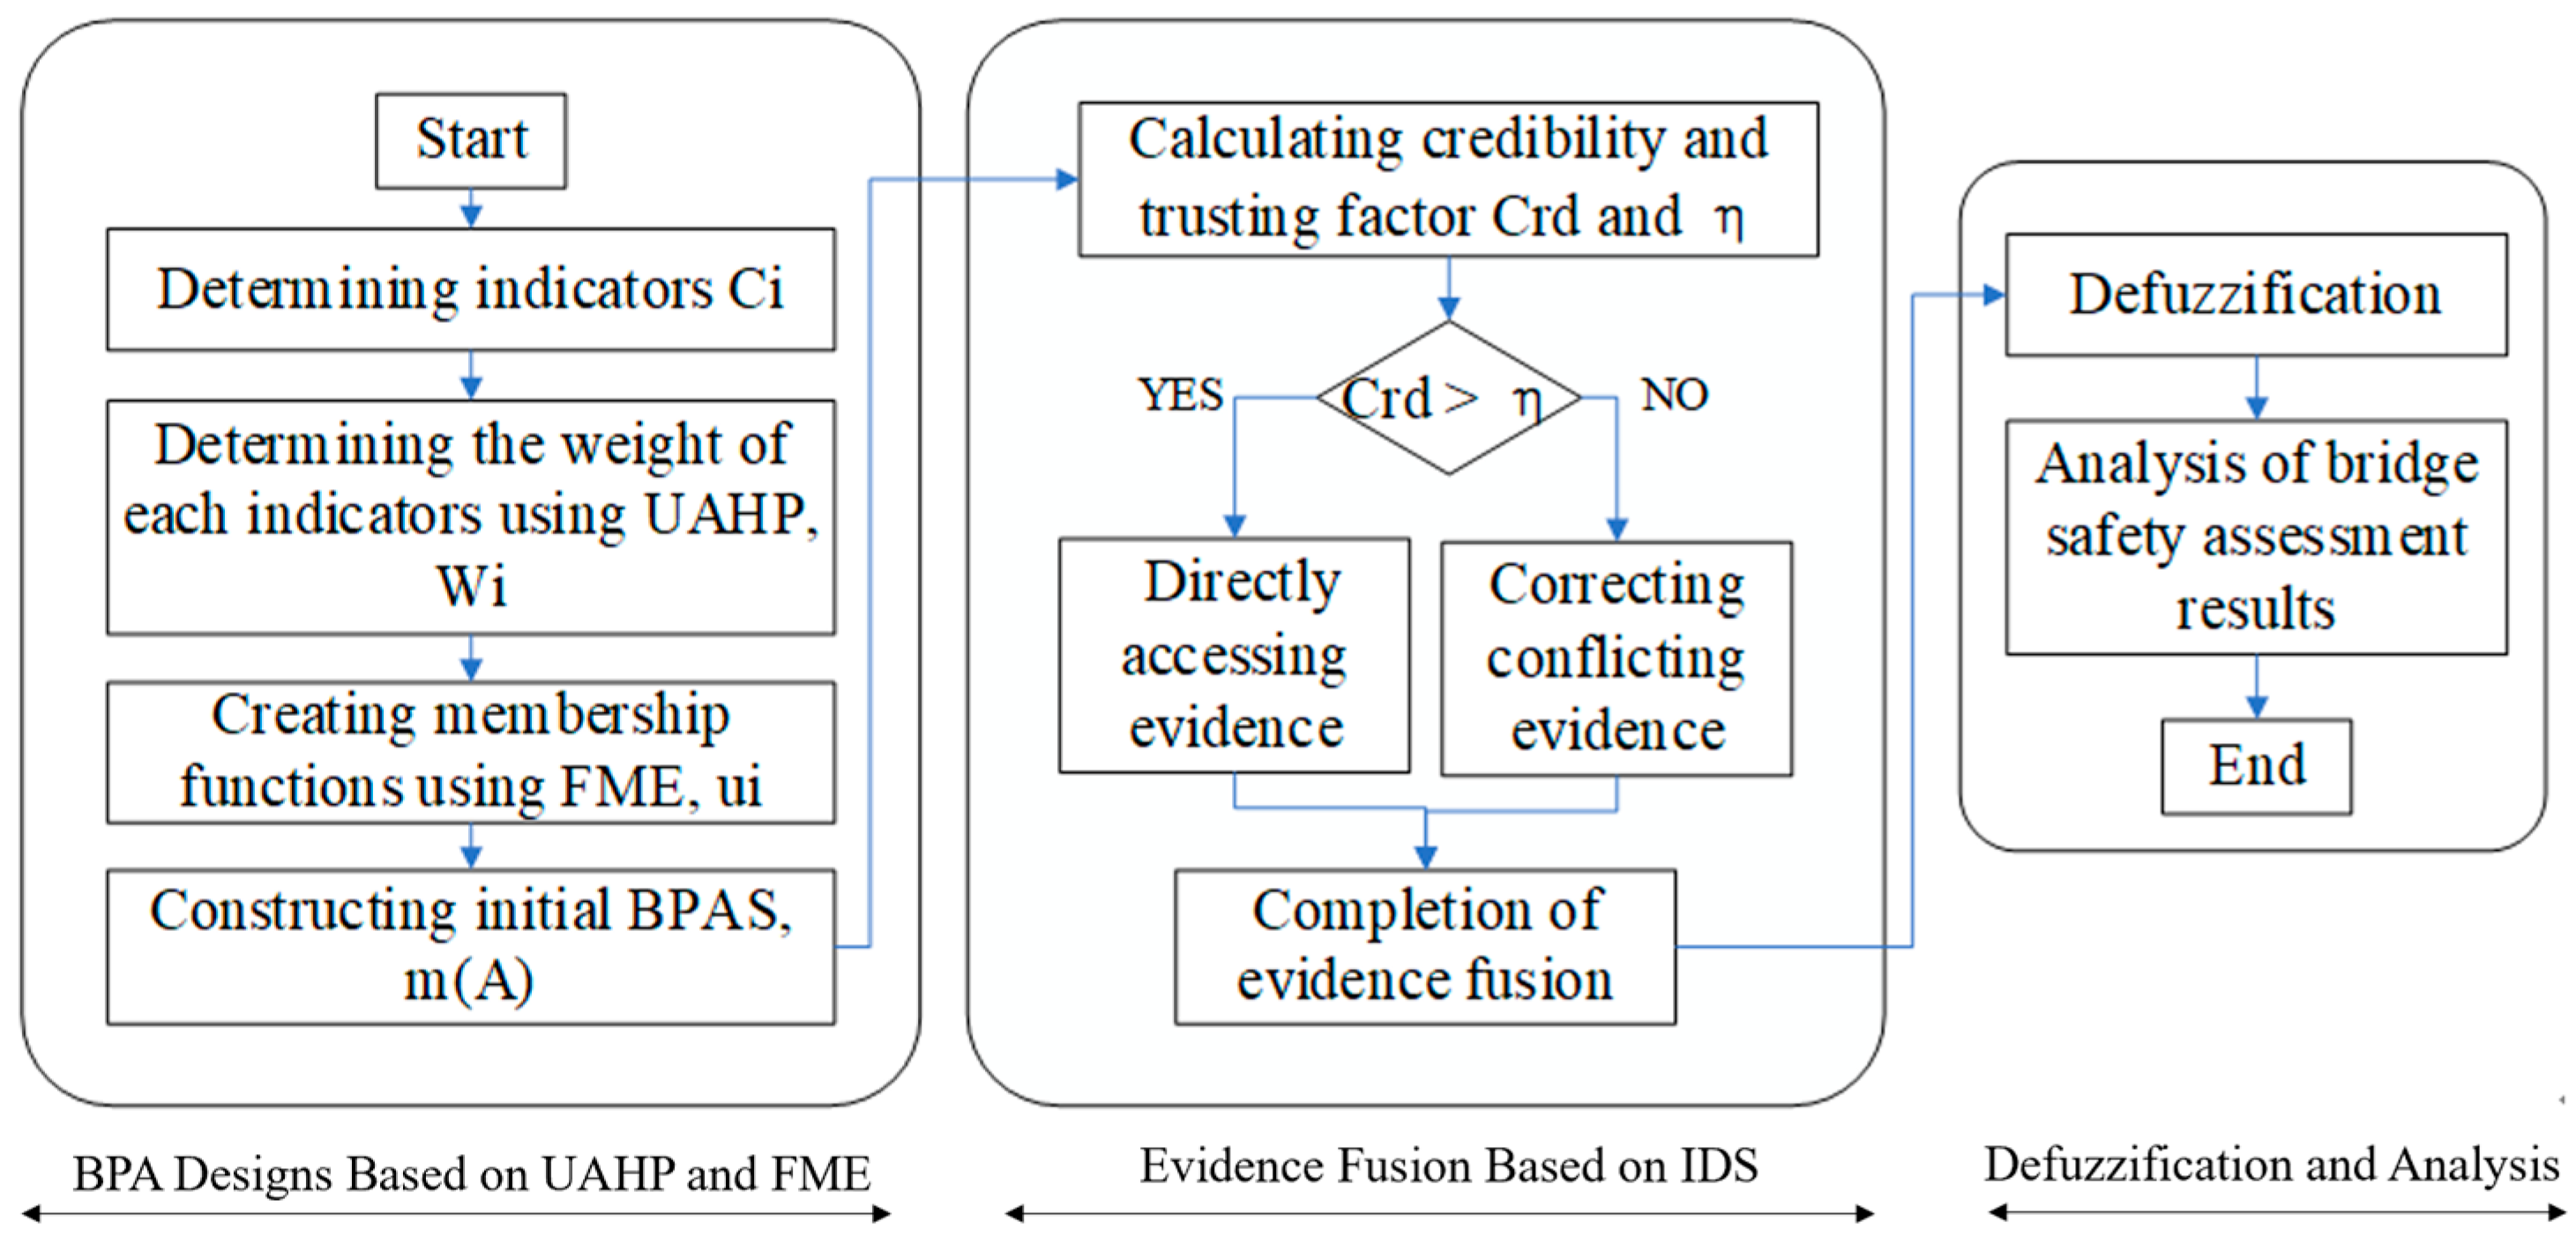
The full-bridge safety assessment of prestressed concrete bridges is a complex MCDM problem. Due to its multiple uncertainties in the evidence, the Dempster–Shafer (D-S) evidence theory is well suited for dealing with this type of problem. In this study, the initial basic probability assignments (BPAs) required for the D-S evidence theory were constructed by combining uncertain analytic hierarchy process (UAHP) method and the fuzzy matter element theory (FME), so that the initial BPAs could fully account for the ambiguity and subjectivity of each indicator in the assessment process. An improved D-S evidence fusion method (IDS) was proposed to solve the problem of high-conflict evidence that the conventional D-S theory cannot deal with. After obtaining the final correlation results, the defuzzification formula was used to convert the correlation vector into clear assessment values to obtain the corresponding safety assessment results. Figure 1 shows the entire process of the safety assessment framework for prestressed concrete bridges.
2.1. BPA Designs Based on Fuzzy Matter Element and Uncertain AHP
2.1.1. Obtaining Initial Weight Based on UAHP
Prestressed concrete bridges’ safety assessments are subject to different factors. Some of these factors cannot be expressed quantitatively by functional relationships. Therefore, to facilitate the assessment, the analytic hierarchy process (AHP) was used to hierarchize and rationalize the various factors. Due to the complexity and uncertainty of the objective factors involved in the assessment, it was difficult for experts to make precise judgments about the relative importance of the assessment indicators, i.e., to express the importance of the two indicators with precise numbers. Therefore, the uncertain AHP method (UAHP) was used for bridge assessment in this study. The interval number was used to define the relative importance of each assessment indicator when comparing two indicators.
The procedure of UAHP in this study could be simply divided into three parts. First, the interval number judgment matrix was constructed according to the importance of each assessment indicator. Second, the consistency was checked. A consistency test was performed using CI and CR as two indicators [32]. Finally, after passing the consistency test, the geometric mean values of each indicator were calculated and normalized to obtain the weight of the corresponding assessment indicator.
2.1.2. Obtaining Initial BPAs Based on FME
The matter element model is defined by with three basic components: a matter element (A), n indicators of matter , and the corresponding values of n indicators . If the measured values of the indicators are fuzzy, the model is called a fuzzy matter-element model. A specific indicator can be divided into different assessment levels if necessary for an engineering assessment. In particular, for the prestressed bridge assessment framework used in this study, each indicator will have five different levels: very good (I), good (II), average (III), poor (IV), and very poor (V). In this case, a matter element A with n dimensions indicator elements in m dimensions levels form the final composite fuzzy matter element , as shown in Equation (1):
where represents the fuzzy matter element, is the matter indicator (), represents the different matter levels (), and is the fuzzy membership value of indicator at level .
To translate the specific measured values of the different indicators into fuzzy membership levels, a number between zero and one is needed to express the probability of each level . The material properties of the structure and other factors follow a normal distribution, whereas the damage indicators are mainly determined by the material properties. Based on the work of Liu [33], the damage indicators were approximately normally distributed. Therefore, the following normal correlation function as Figure 2 is constructed to calculate the correlation membership of each assessment level, as shown in Equation (2):
where stands for the specific value of indicator in level , and and represent the mean and standard deviation of the indicator , satisfying .
According to the quadratic function, must be an intermediate value in the interval []. As the boundary value represents the transition value from one level to the next, it should belong to two adjacent levels at the same time. Moreover, the sum of the memberships of all levels should be one, and the membership of the boundary value should be 0.5. Therefore, we can derive the formulae for the constant parameters a and b, as given in Equations (3) and (4):
where and represent the lower and upper bounds, respectively, of the interval for indicator at level .
According to Zhang, the indicator weights obtained by UAHP and the correlation membership of each indicator obtained by FME can be combined as initial BPAs [34]. In this study, the BPAs for different assessment indicators were constructed at different levels, as expressed in Equation (5):
where represents the basic probability assignment of indicator in level . represents the uncertain probability of the indicator level, which means that the level to which this probability belongs cannot be determined.
2.2. Evidence Fusion Based on the Improved Dempster–Shafer Evidence Theory
The D-S evidence theory was proposed by Dempster in 1968 and popularized by Shafer in 1976. This theory can effectively integrate multiple sources of evidence with high assessment accuracy and reflect the degree of consistency between the evidence. Shafer named the set of possible answers to the problem as a discernment framework, which can be expressed as , with the elements in being mutually exclusive. The discernment framework in the safety assessment of this study corresponds to the five levels (I–V) mentioned in Section 2.1. In the discernment framework , the basic probability assignment is a mapping of the set to [0, 1] and satisfies Equation (6):
where is a subset of the discernment framework , , and is the BPA function of , indicating the degree of evidence supporting .
In practical problems, different BPAs are obtained for the same problem due to different assessment indicators. Let all be BPAs in the same discernment framework . As evidence is diverse and different, the fusion of different types of evidence is required. The conventional D-S theory for evidence fusion is shown in Equation (7):
where represents the evidence conflict factor, which reflects the degree of conflict between evidence. The value of is between [0, 1]; when , the D-S fusion rule cannot be used; when , there is no conflict between the evidence, and the D-S fusion rule can produce the best results.
In practical problems, the results of conventional evidence fusion may be contradictory to the facts because of conflicting evidence. There are two main ways to deal with evidence conflicts: the first is to directly modify the D-S fusion rule, taking into account that the original normalization operation is unsuitable. The alternative is to modify the original data source, assuming that the D-S fusion rule is reasonable, and the fusion problems are because of evidence source itself, which requires the pre-processing of the evidence before using the D-S fusion rule. In this study, the second method was used to improve the conventional D-S fusion theory. In addition, an improved D-S evidence fusion method (IDS) was proposed that integrates both credibility and trust factors.
The procedure of IDS method in this study could be simply divided into three parts:
(1) First, the credibility of the evidence was calculated, which described the degree to which one piece of evidence was supported by the total. The credibility of a piece of evidence could be determined by calculating the degree of similarity, which had a value in the range [0, 1]. The larger value could lead to greater similarity and lower degree of conflicts. The corresponding formula for calculating credibility was shown in Equation (8):
where represented a similarity matrix composed of all similarities among evidence. represented the credibility of each piece of evidence .
(2) Based on the credibility of the evidence, sources of evidence could be classified into three types: “credible evidence”, “general evidence”, and “conflicting evidence”. Credible evidence refers to evidence that ranks in the top 25 percent of credibility, conflict evidence refers to the bottom 25 percent, and the remaining middle half is general evidence. The trust factor was set as the mean value of credibility for all the credible evidence. Evidence whose credibility was greater than need not be pre-processed, and the weights of the remaining evidence were assigned according to Equation (9):
where represented the weight to be used for pre-processing the evidence.
(3) After the weights were calculated, the weight discounting correction of the evidence was given as in Equation (10):
where was the value of the j-th set of focal elements of the i-th evidence, and represented the evidence after pre-processing correction. Due to the effect of , the basic probability assignment of uncertaint was assigned entirely to the unknown part , which significantly reduced the degree of conflict among all evidence. After completing the evidence correction, the evidence fusion was performed using the conventional D-S fusion rule shown in Equation (10).
2.3. Defuzzification of the Assessment Results
The results obtained by fusing multiple sources of evidence with conflicts using the IDS method represent the correlation distribution of the final assessment levels. As the result of the IDS method is a probability distribution vector, the final probability distribution result must be transformed into a crisp value to make the assessment results more intuitive. This process is called defuzzification. There are many defuzzification methods, such as the maximum correlation method (MCM), center of gravity method (COG), and middle of maximum (MOM) method [35]. In this study, the direct weighted average calculation method was used for the project. The following defuzzification formula was used in fusion with the standard JTG TH21-2011 [36], as shown in Equation (11):
where represented the assessment scale of different bridge structures, which was calculated using the probability-weighted average corresponding to the correlation vector. represented the correlation results of indicator at assessment level . represented the safety assessment score of the entire bridge, where represented the initial weights of the different indicators calculated using the UAHP method in Section 2.1.
According to the JTG TH21-2011 standard, the assessment scale for prestressed concrete bridges in this study was divided into five categories, as shown in Table 1. The full-bridge safety score was also divided into five categories, as shown in Table 2. The final bridge assessment level was obtained from the classifications listed in Table 1 and Table 2. It is worth noting that one should not only focus on the final bridge levels but also on the assessment levels of the individual structural components. For example, the safety score may also be associated with some components that have an assessment scale It is important not to neglect the repair of defective components only because the overall assessment results are good.
3. Safety Assessment Model for Prestressed Concrete Bridges
3.1. Establishment of Damage Indicators for Prestressed Concrete Bridge
To evaluate the safety risk of prestressed concrete bridges, it is necessary to analyze the damage to different bridge elements. A safety assessment model for prestressed concrete bridges based on external defects and the design load-bearing capacity was established, as shown in Figure 3. The first level of bridge assessment indicators was divided into superstructure (B1), substructure (B2), and accessory structure (B3). Based on this, the second level of assessment indicators C1–C8 was further refined according to the construction categories. Certain assessment elements had a certain degree of influence on the load-bearing capacity of the bridge and were difficult to calculate quantitatively or evaluate comprehensively. Therefore, a third level of indicator classification (D1–D15) was conducted, where D1–D6 from the main girder were quantitative indicators, and the rest were qualitative indicators.
The assessment indicators for the main girder were categorized as D1–D6. The presence of flexural cracks (D1) in the positive section led to a reduction of the compressed area, which increased the stress in the compressed area and compromised the structural safety. Because the concrete and reinforcement were integrated to resist the shear force, the deterioration of concrete and corrosion of reinforcement could destroy the bond between the reinforcement surface and concrete, resulting in a decrease in the shear capacity and concrete strength (D3) of the cross-section. There was a strong correlation between the reduction in the co-working shear capacity and the width of the concrete shear cracks (D2). As a direct result of the general corrosion of the reinforcement (D4) and the corrosion of the prestressed reinforcement (D5), the cross-sectional area of the reinforcement was reduced, and uneven corrosion led to an uneven reinforcement surface, which would cause stress concentration phenomena that degrade the mechanical properties of the reinforcement. If the prestress loss (D6) was significantly increased, the stress might not reach its design strength if the structure was damaged, i.e., the high strength of the prestressing tendons was not fully developed. This prevented the ultimate load-carrying capacity of the structure from attaining the design level of the designed beam, which compromised the safety of the bridge.
The assessment indicators for pier foundations were categorized as D9–D11, as foundation scour, tilt and slide, and uneven settlement, respectively. These three indicators were qualitative indicators, which would be assessed through on-site inspection and scoring.
3.2. Classification of the Assessment Levels
In this study, the safety ratings of prestressed concrete bridges were classified into five levels: very good (I), good (II), average (III), poor (IV), and very poor (V). As shown in Figure 2, fifteen third-level indicators (D1–D15) were required to obtain the initial measurement data. Of these 15 indicators, D1–D6 were quantitative indicators that must be obtained from actual bridge measurements, whereas the remining indicators were qualitative parameters could be directly scored by the experimenter’s empirical observations to obtain a score between 0 and 100 as their measured values.
Flexural and shear cracks were evaluated by the crack width. The concrete strength indicator was determined by the rebound method, which was expressed as the average strength homogeneity coefficient of concrete. The corrosion indicator of ordinary and prestressed steel bars was expressed by section loss rate. The prestress loss index was expressed and measured as a percentage change in the concrete structure design. Due to the complexity of prestressed bridge members, there was a high degree of uncertainty in determining these indicators. Based on a large amount of literature research and referring to the JTG TH21-2011 standard, five different level classifications were finally established for each indicator [37], as shown in Table 3.
4. Case Study
4.1. Project Overview
A bridge in Lishui City, Zhejiang Province, was completed in 2015. The span of the bridge is 10 × 25 m, the structure type is prestressed concrete continuous T-beam, and the supports are plate supports. The piers and the bridge foundation of the substructure are pile-type piers and foundation. The bridge deck system is equipped with continuous prestressed tendons throughout its length. The bridge deck is paved with bracket deck pavement. The reinforced concrete anti-collision guardrails and modular-type expansion joints are used for this bridge. The road grade of the bridge is Class-II highway, the design load is Class-I highway, and it is designed to be a two-lane road. The width of the bridge is 10 m, of which the lane width is 9 m and the left and right guardrails are 0.5 m each. The elevation and front view of the bridge for case study are presented in Figure 4. During testing, the bridge components were found to have some degree of deficiency and potential damage. In this case study, the safety conditions of a bridge were evaluated and based on the assessment results, further inspection or repair techniques were proposed to provide a technical basis for the repair and reinforcement of the bridge.
After inspection, the damage to the main girder was as follows: seven vertical cracks with a total length of 7.50 m and a maximum crack width of 0.36 mm; one oblique crack with a total length of 1.6 m and a maximum crack width of 0.3 mm. The steel bars were rusty with a total length of 0.2 m. The damage to the supports was as follows: one shear deformation; one age-related cracking. The main damage to the substructures was as follows: two areas of corrosion on the bridge piers, local water damage on the bridge foundation, and local erosion on the riverbed. The main damage to the bridge deck pavement was a pit with a total area of 0.04 m2. The expansion joint was damaged with two areas of cracks. There were two U-shaped cracks on the guardrails with a total length of 3.6 m and a maximum crack width of 0.15 mm. No obvious damage was found in other areas including sidewalks, drainage systems, lighting systems, signs, etc.
The load tests on the bridge mainly included the testing of concrete strength and prestress loss. The actual concrete strength of the main beam measured using the rebound method was 48.5 MPa, and the design strength of the concrete was 50 MPa. For the prestress loss test, magnetic flux sensors were pre-installed on the steel tendons during construction, and the changes in magnetic flux were used to conduct effective stress testing. The measured prestress value obtained was 110 KN, and the theoretical permanent prestress value was 130 KN.
4.2. Bridge Safety Assessment and Results
According to the method proposed in Section 2.1, the UAHP and FME methods were used to construct the initial BPAs required for the D-S evidence theory. The initial weights obtained by the UAHP calculations are shown in Table 4. The values of the constant parameters and for the 15 indicators at different ranges were calculated using Equations (3) and (4). The measured values of the 15 indicators and their corresponding initial BPAs were calculated using Equation (5), as listed in Table 5.
After obtaining the initial BPAs of all indicators, the IDS method outlined in Section 2.2 was applied in the evidence fusion process. The credibility and trust factors of each piece of evidence were obtained using Equations (8)–(10). The evidence that needed to be corrected was weighted and corrected on this basis to complete the pre-processing process. After correcting the evidence, the conventional D-S evidence fusion method in Equation (7) was used to fuse the evidence and complete the final assessment of the entire bridge. Finally, the defuzzification process was used to evaluate the correlation vectors using Equation (11) to obtain the final safety scores for the components and the entire bridge. The final evidence fusion results for the bridge superstructure, substructure, accessory structure, and the entire bridge are listed in Table 6.
From the safety score , and it could be initially determined that the bridge had a Level III safety assessment result, which required maintenance. The final correlation vector for the entire bridge showed that there was a relatively large amount of degree of correlation for Levels I (0.6908) and IV (0.2427). This indicated that some of the bridge components were in good condition, but some were compromised in terms of safety. The assessment level of superstructure and substructure was Level II, and for the accessory structure, it was Level I. The assessment correlations of the three basic components and their corresponding scale values also showed that although the bridge accessory structure was in good condition, the superstructure and substructure were damaged to some extent.
5. Discussion
5.1. Accuracy Verification
The IDS evidence fusion method proposed in this study can accurately reflect the fuzziness and uncertainty of the assessment process, and it is a more rigorous uncertainty reasoning method. In order to ensure the accuracy of the IDS method in this paper, a conventional fuzzy AHP method was used to evaluate the safety condition of the bridge for the case study. The safety assessment results of the bridge using the conventional fuzzy AHP method are shown in Table 7, and the level distribution figures of the results by these two methods are shown in Figure 5. Comparing Table 6 and Table 7, there was consistency between the assessment results of IDS method and the conventional fuzzy AHP method. Both assessment results showed the final assessment level of the bridge as Level III. The assessment results of the superstructure, substructure, and accessory structure were all consistent. As shown in Figure 5, the assessment results of both methods had two peaks at Levels I and IV, which showed that some elements of the structure were in good condition, while others were severely deficient. The original inspection and monitoring data showed that the superstructure of the bridge, especially the main girder, had obvious cracking damage, with the cracking indicator reaching Level IV. The monitored effective stress was only 85% that of the structural design, which also reached Level IV. Therefore, the results obtained with both methods correspond to the reality.
However, the assessment results of three main components and the whole bridges obtained by the IDS method were all worse than those obtained by the conventional fuzzy AHP method. When using the conventional fuzzy AHP method, the correlations of Levels I and IV for the superstructure were 0.4273 and 0.2018, and the assessment scale was , which led to a safety assessment result of Level II. When using the IDS method, the correlations of Level I and Level IV for the superstructure were 0.3763 and 0.4293, and the assessment scale was , leading to a safety assessment result that was Level II but was very close to Level III. This is because the conventional fuzzy AHP method is not sensitive to the degree of deficiency of a single indicator when a certain indicator is severely damaged. However, the IDS method in this paper increases the weight of those indicators with severe damage and reduces the weight of indicators that perform well through evidence fusion. This method makes those indicators with severe damage more obvious in the final assessment results, which also meets the actual structural assessment requirements. Therefore, compared with the conventional fuzzy AHP method, the IDS method in this paper can better handle indicators with severe damages and produces more reasonable assessment results.
5.2. Comparison of IDS Method with Other Fusion Methods
The IDS evidence fusion method proposed in this study can effectively address the multi-source evidence problem in bridge safety assessment The IDS method applied a discount factor , and pre-processed the evidence according to the conflicting factors to make the fusion results more reasonable. Using the superstructure of the bridge in this study as an example, the assessment results obtained by different evidence fusion methods are shown in Table 8. Figure 6 shows the level distribution obtained by different evidence fusion methods.
According to Table 8 and Figure 6, when there were significant conflicts in the evidence, the conventional D-S evidence fusion method was unable to effectively fuse the evidence, and the final correlation degree of Level I was 1, which was obviously not the case. This was caused by the fact that the initial BPA of the D5 indicator in Table 5 was too extreme, and the conventional D-S fusion rule could not manage such extreme evidence. Yager’s method resulted in to increased uncertainty due to the more conservative assignment of the conflicting parts to the focal element , with the final result . Because of excessive uncertainty, the fusion results could not provide a reliable result of the safety condition. Deng’s fusion method applied the concept of a weighted average, and the trend of fusion results was more closely consistent with that of the IDS method used in this study, with peaks at both Levels I and IV. However, the fusion results of Deng’s method had a similar drawback to that of the fuzzy AHP method, i.e., they were not sensitive to the overall result caused by a particularly severely damaged indicator. This was because Deng’s method normalized the individual pieces of evidence into a weighted average based on credibility. As the quantity of evidence increased, the normalized credibility of each assigned piece of evidence became extremely low, thereby substantially diminishing the effect of certain severely damaged indicators.
In contrast, the IDS method in this study did not normalize credibility during pre-processing but utilized the trust factor . Evidence pre-processing was not required for those pieces of evidence with credibility greater than . This local correction method is superior to Deng’s global correction method in assessing bridge safety because it fully accounts for severely damaged indicators to make sure they are not overshadowed by other well-performing indicators.
In summary, the proposed safety evaluation model is more sensitive to indicators with serious damage compared with the conventional fuzzy AHP method. In addition, compared with other evidence fusion methods, the IDS method in this paper can effectively deal with the problem of high-conflict evidence fusion. Therefore, for the safety assessment of prestressed concrete bridges, the initial measurement values can be obtained by practicing engineers according to the 15 assessment indicators and 5 assessment levels. Then, all indicators should be fused and defuzzified according to the IDS fusion method mentioned in Section 2 to complete the overall safety assessment of prestressed concrete bridges.
6. Conclusions
In this study, a comprehensive bridge safety assessment system was developed to solve the problems of uncertainty during the process of safety assessment of prestressed concrete bridges. An improved Dempster–Shafer fusion method (IDS) was proposed to improve the accuracy of assessment results by resolving the problem of uncertainty of evidence sources in bridge assessment. The assessment method was proposed on an actual prestressed concrete bridge to validate the realizability and accuracy.
- In this paper, a three-level safety assessment model for prestressed concrete bridges was constructed and 15 assessment indicators related were determined. Six quantitative indicators and nine qualitative indicators were considered in the assessment process, combined with the assessment indicators of external defects and the design load-bearing capacity of prestressed concrete bridges, to obtain results that better reflected the safety conditions of bridges.
- In this paper, an improved Dempster–Shafer fusion method (IDS) was proposed to deal with the safety assessment of prestressed concrete bridges with multiple uncertainties. UAHP and FME methods were combined to construct initial weights of indicators and their basic probability assignments, which fully accounted for the ambiguity and subjectivity of each indicator in the assessment process. The IDS method was better able to handle conflicting evidence that arose during the assessment process than existing fusion methods. In addition, it was more sensitive to certain indicators with high degrees of defects, ensuring that indicators of severe damage were not obscured in the final assessment results.
- The full-bridge safety assessment model for prestressed concrete bridges was applied to an actual bridge in eastern China. Through calculation comparison and analysis, the superiority of this model had been well verified. Compared with conventional fuzzy AHP method, the IDS method was proven to have higher accuracy and feasibility.
Author Contributions
Conceptualization, J.S. and H.M.; methodology, H.M.; software, W.D.; validation, H.M. and Z.J.; formal analysis, J.S.; investigation, J.S.; resources, H.M.; data curation, J.S.; writing—original draft preparation, H.M.; writing—review and editing, J.S.; visualization, H.M.; supervision, J.S.; project administration, J.S.; funding acquisition, J.S. All authors have read and agreed to the published version of the manuscript.
Funding
This research was funded by National Key R&D Program of China (2023YFE0115000), Zhejiang Provincial Natural Science Foundation (LQ22E080004), and Key R&D Program of Zhejiang (2024C01132).
Data Availability Statement
The raw data supporting the conclusions of this article will be made available by the authors on request.
Conflicts of Interest
The authors declare no conflicts of interest.
References
- Jiang, R.J.; Au, F.T.K. Prestressed Concrete Girder Bridges with Corrugated Steel Webs: Review. J. Struct. Eng. 2015, 141, 04014108. [Google Scholar] [CrossRef]
- Xiang, Y.; Tang, G.; Liu, C. Cracking Mechanism and Simplified Design Method for Bottom Flange in Prestressed Concrete Box Girder Bridge. J. Bridge Eng. 2011, 16, 267–274. [Google Scholar] [CrossRef]
- Sousa, H.; Bento, J.; Figueiras, J. Construction Assessment and Long-Term Prediction of Prestressed Concrete Bridges Based on Monitoring Data. Eng. Struct. 2013, 52, 26–37. [Google Scholar] [CrossRef]
- Barr, P.J.; Stanton, J.F.; Eberhard, M.O. Effects of Temperature Variations on Precast, Prestressed Concrete Bridge Girders. J. Bridge Eng. 2005, 10, 186–194. [Google Scholar] [CrossRef]
- Klaiber, F.W.; Wipf, T.J.; Kempers, B.J. Repair of Damaged Prestressed Concrete Bridges Using CFRP. In Proceedings of the 2003 Mid-Continental Transportation Research Symposium, Ames, IA, USA, 21–22 August 2003. [Google Scholar]
- Tong, T.; Liu, Z.; Zhang, J.; Yu, Q. Long-Term Performance of Prestressed Concrete Bridges under the Intertwined Effects of Concrete Damage, Static Creep and Traffic-Induced Cyclic Creep. Eng. Struct. 2016, 127, 510–524. [Google Scholar] [CrossRef]
- Xia, H.W.; Ni, Y.Q.; Wong, K.Y.; Ko, J.M. Reliability-Based Condition Assessment of in-Service Bridges Using Mixture Distribution Models. Comput. Struct. 2012, 106–107, 204–213. [Google Scholar] [CrossRef]
- Robertson, I.N. Prediction of Vertical Deflections for a Long-Span Prestressed Concrete Bridge Structure. Eng. Struct. 2005, 27, 1820–1827. [Google Scholar] [CrossRef]
- DelGrego, M.R.; Culmo, M.P.; DeWolf, J.T. Performance Evaluation through Field Testing of Century-Old Railroad Truss Bridge. J. Bridge Eng. 2008, 13, 132–138. [Google Scholar] [CrossRef]
- Huth, O.; Feltrin, G.; Maeck, J.; Kilic, N.; Motavalli, M. Damage Identification Using Modal Data: Experiences on a Prestressed Concrete Bridge. J. Struct. Eng. 2005, 131, 1898–1910. [Google Scholar] [CrossRef]
- Oh, B.H.; Lew, Y.; Choi, Y.C. Realistic Assessment for Safety and Service Life of Reinforced Concrete Decks in Girder Bridges. J. Bridge Eng. 2007, 12, 410–418. [Google Scholar] [CrossRef]
- Omar, T.; Nehdi, M.L. Condition Assessment of Reinforced Concrete Bridges: Current Practice and Research Challenges. Infrastructures 2018, 3, 36. [Google Scholar] [CrossRef]
- Hanif, M.U.; Ibrahim, Z.; Ghaedi, K.; Hashim, H.; Javanmardi, A. Damage Assessment of Reinforced Concrete Structures Using a Model-Based Nonlinear Approach—A Comprehensive Review. Constr. Build. Mater. 2018, 192, 846–865. [Google Scholar] [CrossRef]
- Contreras-Nieto, C.; Shan, Y.; Lewis, P.; Hartell, J.A. Bridge Maintenance Prioritization Using Analytic Hierarchy Process and Fusion Tables. Autom. Constr. 2019, 101, 99–110. [Google Scholar] [CrossRef]
- Jakiel, P.; Fabianowski, D. FAHP Model Used for Assessment of Highway RC Bridge Structural and Technological Arrangements. Expert Syst. Appl. 2015, 42, 4054–4061. [Google Scholar] [CrossRef]
- Zhang, L.; Ding, L.; Wu, X.; Skibniewski, M.J. An Improved Dempster–Shafer Approach to Construction Safety Risk Perception. Knowl.-Based Syst. 2017, 132, 30–46. [Google Scholar] [CrossRef]
- Cai, C.S.; Shahawy, M. Understanding Capacity Rating of Bridges from Load Tests. Pract. Period. Struct. Des. Constr. 2003, 8, 209–216. [Google Scholar] [CrossRef]
- de Vries, R.; Lantsoght, E.O.L.; Steenbergen, R.D.J.M.; Fennis, S.A.A.M. Time-Dependent Reliability Assessment of Existing Concrete Bridges with Varying Knowledge Levels by Proof Load Testing. Struct. Infrastruct. Eng. 2023, 1–15. [Google Scholar] [CrossRef]
- De Domenico, D.; Messina, D.; Recupero, A. Quality Control and Safety Assessment of Prestressed Concrete Bridge Decks through Combined Field Tests and Numerical Simulation. Structures 2022, 39, 1135–1157. [Google Scholar] [CrossRef]
- Shafer, G. A Mathematical Theory of Evidence. In A Mathematical Theory of Evidence; Princeton University Press: Princeton, NJ, USA, 2020; ISBN 978-0-691-21469-6. [Google Scholar] [CrossRef]
- Zadeh, L.A. A Simple View of the Dempster-Shafer Theory of Evidence and Its Implication for the Rule of Combination. AI Mag. 1986, 7, 85. [Google Scholar] [CrossRef]
- Yager, R.R. On the Dempster-Shafer Framework and New Combination Rules. Inf. Sci. 1987, 41, 93–137. [Google Scholar] [CrossRef]
- Lefevre, E.; de Rouen, I.; Blondel, P.E.; Cedex, M.-S.-A.; Lefevre, E.; Vannoorenberghe, P.; de Rouen, I.; Blondel, P.E.; Cedex, M.-S.-A.; Vannoorenberghe, P. A Generic Framework for Resolving the Con Ict in the Combination of Belief Structures. In Proceedings of the Third International Conference on Information Fusion, Paris, France, 10–13 July 2000. [Google Scholar]
- Murphy, C.K. Combining Belief Functions When Evidence Conflicts. Decis. Support Syst. 2000, 29, 1–9. [Google Scholar] [CrossRef]
- Capelle, A.-S.; Fernandez-Maloigne, C.; Colot, O. Introduction of Spatial Information within the Context of Evidence Theory. In Proceedings of the 2003 IEEE International Conference on Acoustics, Speech, and Signal Processing, Hong Kong, China, 6–10 April 2003; Proceedings. (ICASSP ’03). IEEE: Hong Kong, China, 2003; Volume 2, p. II–785. [Google Scholar]
- Jousselme, A.-L.; Grenier, D.; Bossé, É. A New Distance between Two Bodies of Evidence. Inf. Fusion 2001, 2, 91–101. [Google Scholar] [CrossRef]
- Deng, Y. Generalized Evidence Theory. Appl. Intell. 2015, 43, 530–543. [Google Scholar] [CrossRef]
- Cai, W. The Extension Set and Incompatibility Problem. J. Sci. Explor. 1983, 1, 81–93. [Google Scholar]
- Sasmal, S.; Ramanjaneyulu, K.; Gopalakrishnan, S.; Lakshmanan, N. Fuzzy Logic Based Condition Rating of Existing Reinforced Concrete Bridges. J. Perform. Constr. Facil. 2006, 20, 261–273. [Google Scholar] [CrossRef]
- Janowska-Renkas, E.; Jakiel, P.; Fabianowski, D.; Matyjaszczyk, D. Optimal Selection of High-Performance Concrete for Post-Tensioned Girder Bridge Using Advanced Hybrid MCDA Method. Materials 2021, 14, 6553. [Google Scholar] [CrossRef] [PubMed]
- Pan, N.-F. Fuzzy AHP Approach for Selecting the Suitable Bridge Construction Method. Autom. Constr. 2008, 17, 958–965. [Google Scholar] [CrossRef]
- Vaidya, O.S.; Kumar, S. Analytic Hierarchy Process: An Overview of Applications. Eur. J. Oper. Res. 2006, 169, 1–29. [Google Scholar] [CrossRef]
- Liu, D.; Zou, Z. Water Quality Evaluation Based on Improved Fuzzy Matter-Element Method. J. Environ. Sci. 2012, 24, 1210–1216. [Google Scholar] [CrossRef]
- Zhang, M.-J.; Wang, Y.-M.; Li, L.-H.; Chen, S.-Q. A General Evidential Reasoning Algorithm for Multi-Attribute Decision Analysis under Interval Uncertainty. Eur. J. Oper. Res. 2017, 257, 1005–1015. [Google Scholar] [CrossRef]
- Tóth-Laufer, E.; Takács, M. The Effect of Aggregation and Defuzzification Method Selection on the Risk Level Calculation. In Proceedings of the 2012 IEEE 10th International Symposium on Applied Machine Intelligence and Informatics (SAMI), Herl’any, Slovakia, 26–28 January 2012; pp. 131–136. [Google Scholar] [CrossRef]
- JTG TH21-2011; Standards for Technical Condition Evaluation of Highway Bridges. MOT (Ministry of Transport of the People’s Republic of China): Beijing, China, 2011. (In Chinese)
- Huang, Q.; Lin, Z.Y.; Ren, Y. Evaluation method research on prestressed concrete bridges. J. Harbin Inst. Technol. 2008, 2, 155–159. [Google Scholar]
Figure 1.
Flowchart of the safety assessment framework for prestressed concrete bridges.

Figure 2.
Normal membership function of each assessment level.

Figure 3.
Safety assessment indicators of prestressed concrete bridges.

Figure 4.
(a) Elevation view of the bridge; (b) front view of the bridge.

Figure 5.
Assessment results of the bridge for case study using: (a) conventional fuzzy AHP method; (b) IDS method in this paper.
Figure 5.
Assessment results of the bridge for case study using: (a) conventional fuzzy AHP method; (b) IDS method in this paper.

Figure 6.
Assessment results of the superstructure for a case study using: (a) the conventional D-S method; (b) Yager’s method; (c) Deng’s method; (d) IDS method in this paper.
Figure 6.
Assessment results of the superstructure for a case study using: (a) the conventional D-S method; (b) Yager’s method; (c) Deng’s method; (d) IDS method in this paper.


Table 1.
Meaning and classification scales of bridge components.
| Component Conditions | Levels | |
|---|---|---|
| [0, 0.5] | Very good | I |
| (0.5, 2] | Good | II |
| (2, 3] | Average | III |
| (3, 4] | Poor | IV |
| (4, 5] | Very Poor | V |
Table 2.
Meaning and classification scales of the entire bridge.
| Conditions | Levels | Maintenance Recommendations | |
|---|---|---|---|
| [90, 100] | Very good | I | Normal |
| [80, 90) | Good | II | Minor maintenance |
| [60, 80) | Average | III | Medium maintenance, traffic control if needed |
| [40, 60) | Poor | IV | Major maintenance with traffic control |
| [0, 40) | Very Poor | V | Traffic closed, special maintenance or rebuild |
Table 3.
Assessment levels and intervals of each damage indicator.
| Indicators | Measured | Assessment Levels and Intervals | |||||
|---|---|---|---|---|---|---|---|
| I | II | III | IV | V | |||
| D1 | Flexural cracks | 0 | (0, 0.1) | [0.1, 0.3) | [0.3, 0.6) | ||
| D2 | Shear cracks | 0 | (0, 0.05) | [0.05, 0.2) | [0.2, 0.4) | ||
| D3 | Concrete strength | [0.95, 1.00) | [0.90, 0.95) | (0.85, 0.9) | |||
| D4 | Reinforcement corrosion | Section change | (0, 0.015) | [0.015, 0.05) | [0.05, 0.12) | [0.12, 0.2) | |
| D5 | Prestressed reinforcement corrosion | Section change | (0, 0.01) | [0.01, 0.03) | [0.03, 0.1) | [0.1, 0.15) | |
| D6 | Prestress loss | Percentage | (0, 0.05) | [0.05, 0.1) | [0.1, 0.15) | [0.15, 0.2) | |
| D9 | Foundation scour | Score | (80, 100] | (60, 80] | (40, 60] | (20, 40] | (0, 20] |
| D10 | Tilt and slide | Score | (80, 100] | (60, 80] | (40, 60] | (20, 40] | (0, 20] |
| D11 | Uneven Settlement | Score | (80, 100] | (60, 80] | (40, 60] | (20, 40] | (0, 20] |
| D7, D8, D12–D15 | Conditions | Score | (80, 100] | (60, 80] | (40, 60] | (20, 40] | (0, 20] |
Table 4.
Initial weight of different indicators for prestressed concrete bridges.
| First-Level Indicators | Second-Level Indicators | Third-Level Indicators |
|---|---|---|
| B1 (0.44) | C1 (0.74) | D1 (0.05) |
| D2 (0.08) | ||
| D3 (0.16) | ||
| D4 (0.14) | ||
| D5 (0.30) | ||
| D6 (0.27) | ||
| C2 (0.26) | D7 (1.00) | |
| B2 (0.42) | C3 (0.55) | D8 (1.00) |
| C4 (0.36) | D9 (0.31) | |
| D10 (0.37) | ||
| D11 (0.32) | ||
| C5 (0.09) | D12 (1.00) | |
| B3 (0.15) | B6 (0.30) | D13 (1.00) |
| B7 (0.15) | D14 (1.00) | |
| B8 (0.55) | D15 (1.00) |
Table 5.
Measured values and their initial BPAs of the indicators.
| Indicators | Measured Values | Initial BPAs Based on FME and UAHP | |||||
|---|---|---|---|---|---|---|---|
| m (I) | m (II) | m (III) | m (IV) | m (V) | m () | ||
| D1 | 0.36 | 0 | 0 | 0.0520 | 0.1849 | 0 | 0.7631 |
| D2 | 0.3 | 0 | 0 | 0 | 0.3534 | 0 | 0.6466 |
| D3 | 0.03 | 0 | 0.6876 | 0.0192 | 0 | 0 | 0.2932 |
| D4 | 0.001 | 0.5903 | 0 | 0 | 0 | 0 | 0.4097 |
| D5 | 0 | 1 | 0 | 0 | 0 | 0 | 0 |
| D6 | 0.15 | 0 | 0 | 0.3514 | 0.3514 | 0 | 0.2971 |
| D7 | 75 | 0.1101 | 0.5809 | 0 | 0 | 0 | 0.3090 |
| D8 | 85 | 0.4895 | 0.0217 | 0 | 0 | 0 | 0.4888 |
| D9 | 88 | 0.6025 | 0.0042 | 0 | 0 | 0 | 0.3933 |
| D10 | 70 | 0 | 0.1351 | 0 | 0 | 0 | 0.8649 |
| D11 | 97 | 0.1191 | 0 | 0 | 0 | 0 | 0.8809 |
| D12 | 82 | 0.5367 | 0.0631 | 0 | 0 | 0 | 0.4002 |
| D13 | 88 | 0.2333 | 0.0016 | 0 | 0 | 0 | 0.7651 |
| D14 | 94 | 1 | 0 | 0 | 0 | 0 | 0 |
| D15 | 90 | 1 | 0 | 0 | 0 | 0 | 0 |
Table 6.
Final results of the safety assessment of the whole bridge.
| Indicators | Correlation of Each Assessment Level | () | Assessment Level | ||||
|---|---|---|---|---|---|---|---|
| m (I) | m (II) | m (III) | m (IV) | m (V) | |||
| Superstructure | 0.3763 | 0.1012 | 0.0812 | 0.4293 | 0.0119 | 2.00 | II |
| Substructure | 0.5047 | 0.1000 | 0.1016 | 0.1982 | 0.0955 | 1.56 | II |
| Accessory structure | 0.9175 | 0.0309 | 0.0172 | 0.0172 | 0.0172 | 0.23 | I |
| Whole Bridge | 0.6908 | 0.0346 | 0.0279 | 0.2427 | 0.0039 | 68.85 | III |
Table 7.
Safety assessment results using the conventional fuzzy AHP method.
| Indicators | Correlation of Each Assessment Level | () | Assessment Level | ||||
|---|---|---|---|---|---|---|---|
| m (I) | m (II) | m (III) | m (IV) | m (V) | |||
| Superstructure | 0.4273 | 0.2750 | 0.0959 | 0.2018 | 0 | 1.34 | II |
| Substructure | 0.4993 | 0.2959 | 0.024 | 0.1822 | 0 | 1.11 | II |
| Accessory structure | 0.9647 | 0.0353 | 0 | 0 | 0 | 0.04 | I |
| Whole bridge | 0.5358 | 0.2487 | 0.0519 | 0.1641 | 0 | 78.76 | III |
Table 8.
Assessment results obtained by different evidence fusion methods.
| Fusion Method | Correlation Results of the Superstructure | Assessment Level | ||||||
|---|---|---|---|---|---|---|---|---|
| m (I) | m (II) | m (III) | m (IV) | m (V) | m () | |||
| D-S method | 1 | 0 | 0 | 0 | 0 | 0 | 0 | I |
| Yager’s method | 0.1781 | 0.0791 | 0.0981 | 0.1691 | 0.0523 | 0.4233 | 1.23 | II |
| Deng’s method | 0.6313 | 0.0070 | 0.0187 | 0.3426 | 0.0005 | 0 | 1.34 | II |
| IDS method in this study | 0.3938 | 0.0594 | 0.0850 | 0.4493 | 0.0125 | 0 | 2.03 | III |
Disclaimer/Publisher’s Note: The statements, opinions and data contained in all publications are solely those of the individual author(s) and contributor(s) and not of MDPI and/or the editor(s). MDPI and/or the editor(s) disclaim responsibility for any injury to people or property resulting from any ideas, methods, instructions or products referred to in the content. |
© 2024 by the authors. Licensee MDPI, Basel, Switzerland. This article is an open access article distributed under the terms and conditions of the Creative Commons Attribution (CC BY) license (https://creativecommons.org/licenses/by/4.0/).
Share and Cite
MDPI and ACS Style
Shu, J.; Ma, H.; Ding, W.; Jin, Z. Improved Evidence Fusion Theory for the Safety Assessment of Prestressed Concrete Bridges. Buildings 2024, 14, 1144. https://doi.org/10.3390/buildings14041144
AMA Style
Shu J, Ma H, Ding W, Jin Z. Improved Evidence Fusion Theory for the Safety Assessment of Prestressed Concrete Bridges. Buildings. 2024; 14(4):1144. https://doi.org/10.3390/buildings14041144
Chicago/Turabian StyleShu, Jiangpeng, Haibo Ma, Wei Ding, and Zhenfen Jin. 2024. "Improved Evidence Fusion Theory for the Safety Assessment of Prestressed Concrete Bridges" Buildings 14, no. 4: 1144. https://doi.org/10.3390/buildings14041144
Note that from the first issue of 2016, this journal uses article numbers instead of page numbers. See further details here.