

A Field Investigation to Quantify the Correlation between Local and Overall Thermal Comfort in Cool Environments


Abstract
:1. Introduction
2. Materials and Methods
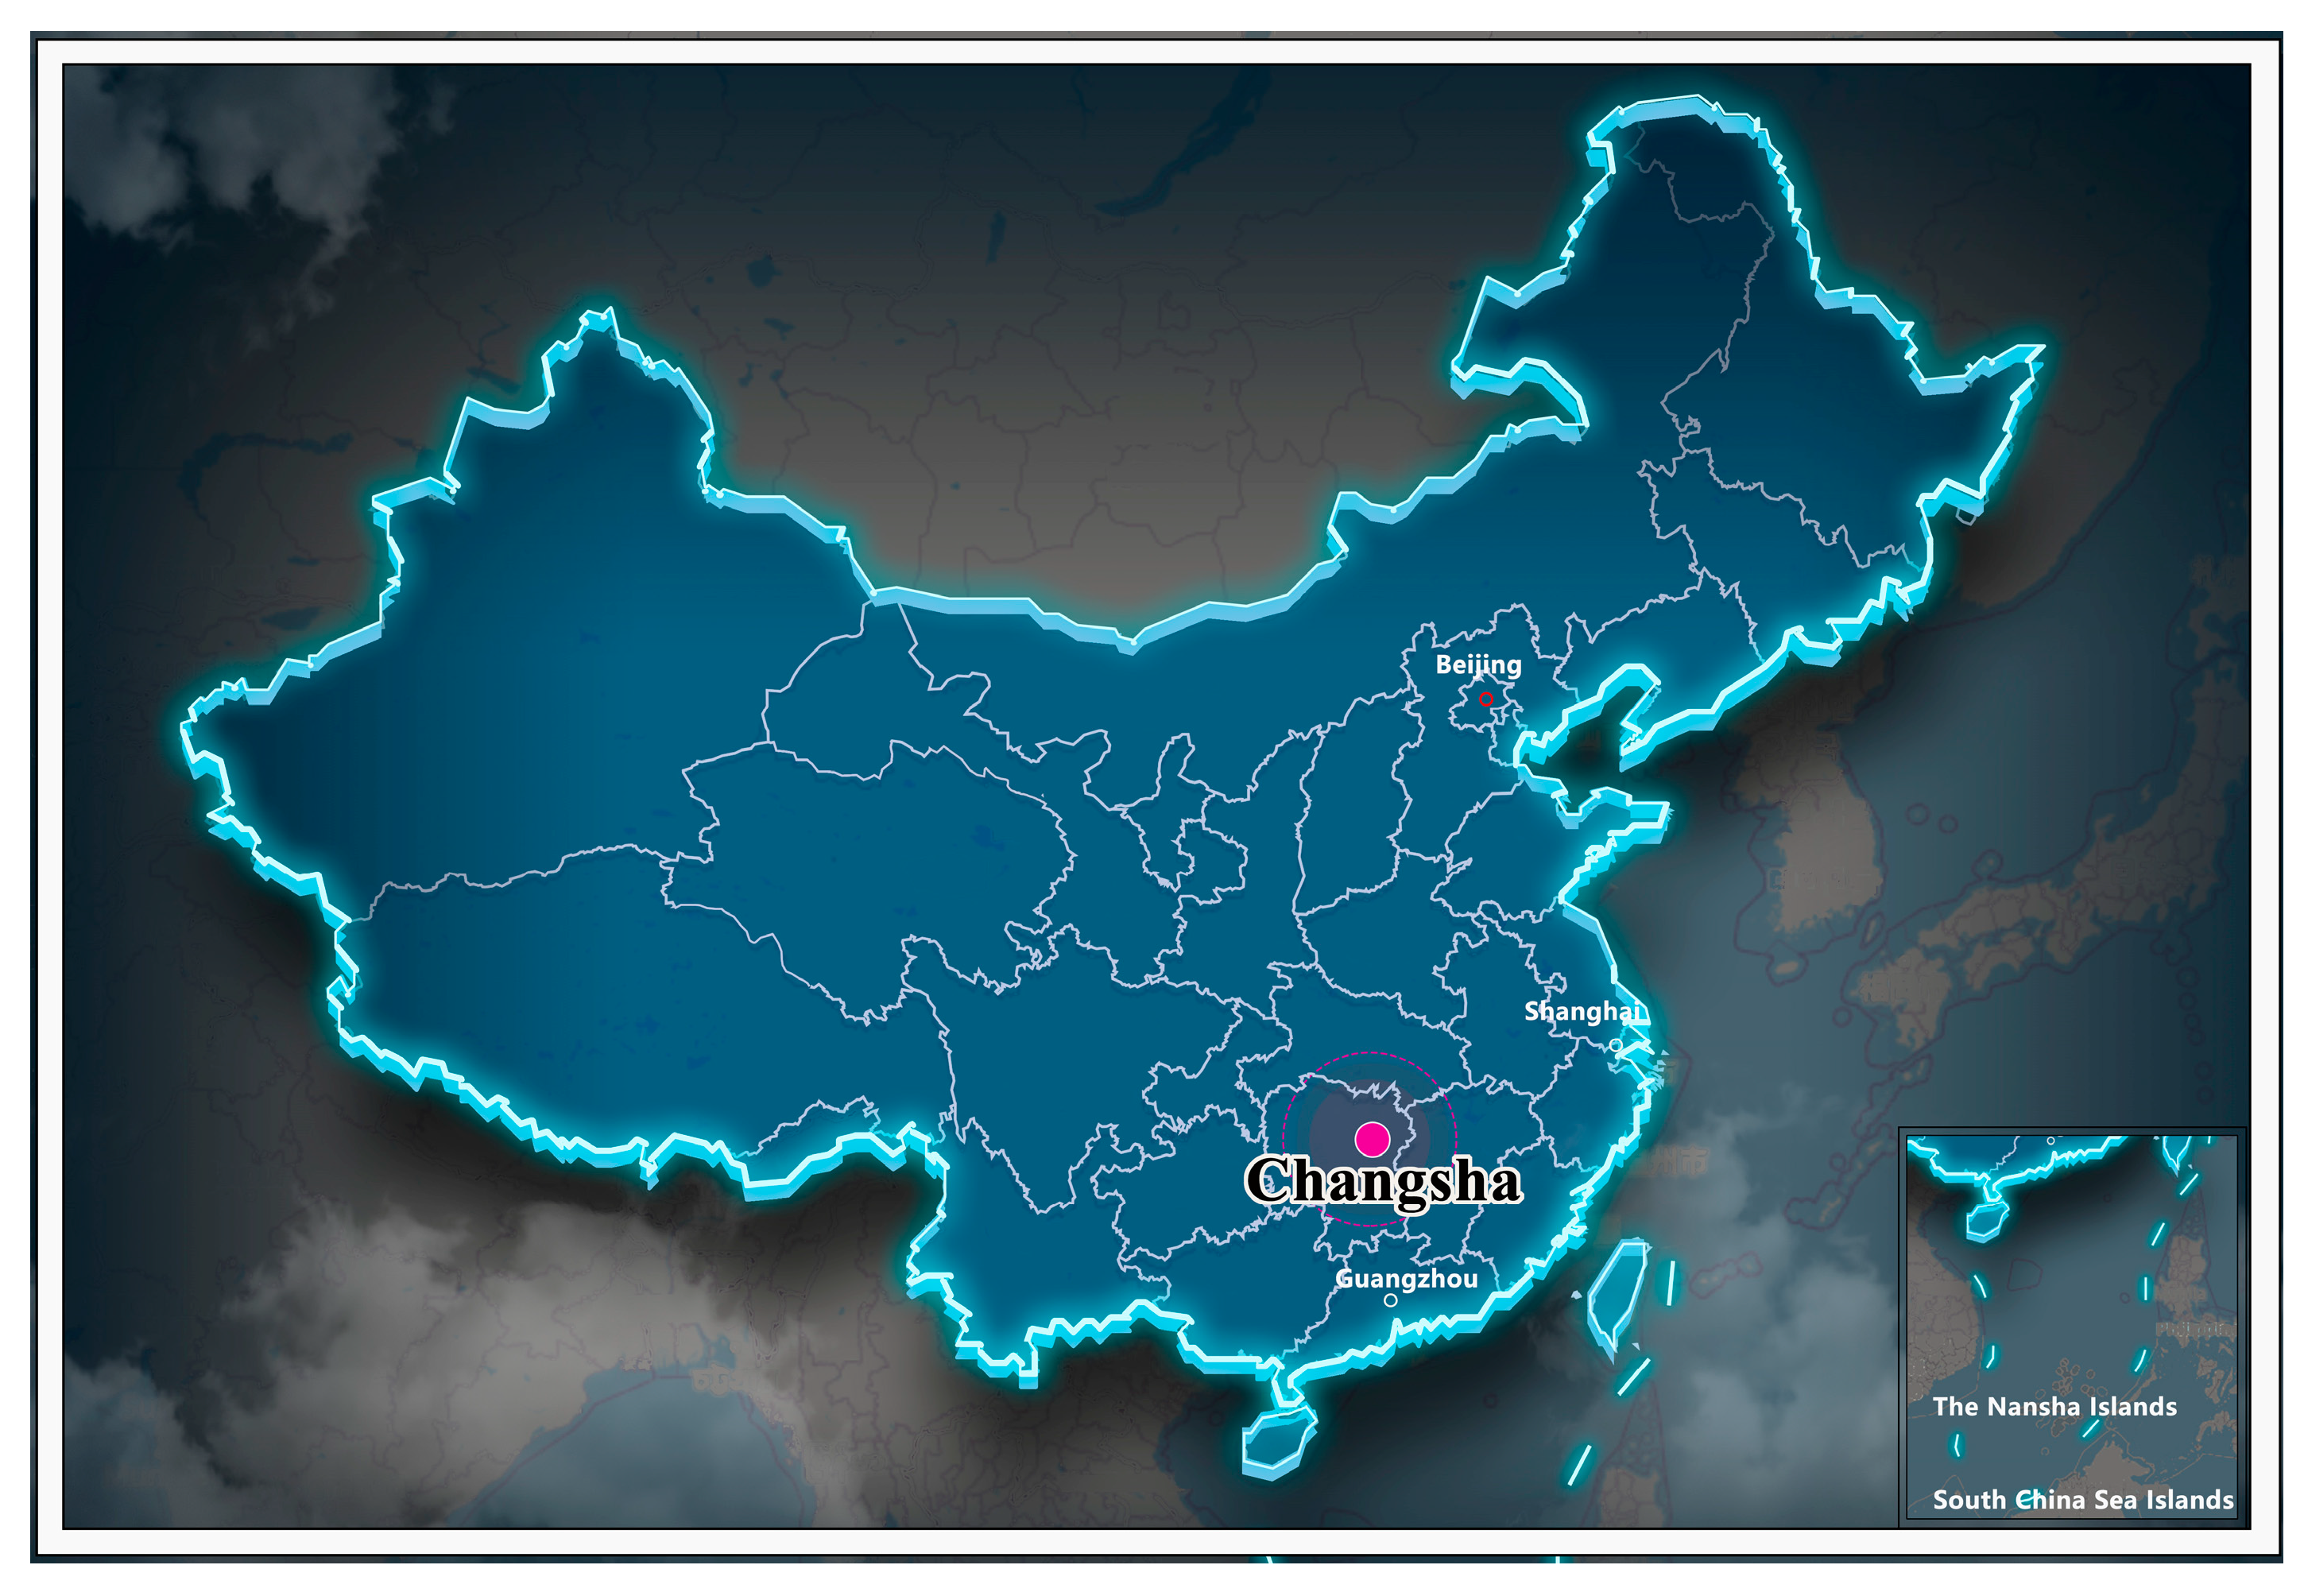
2.1. Geography and Climate
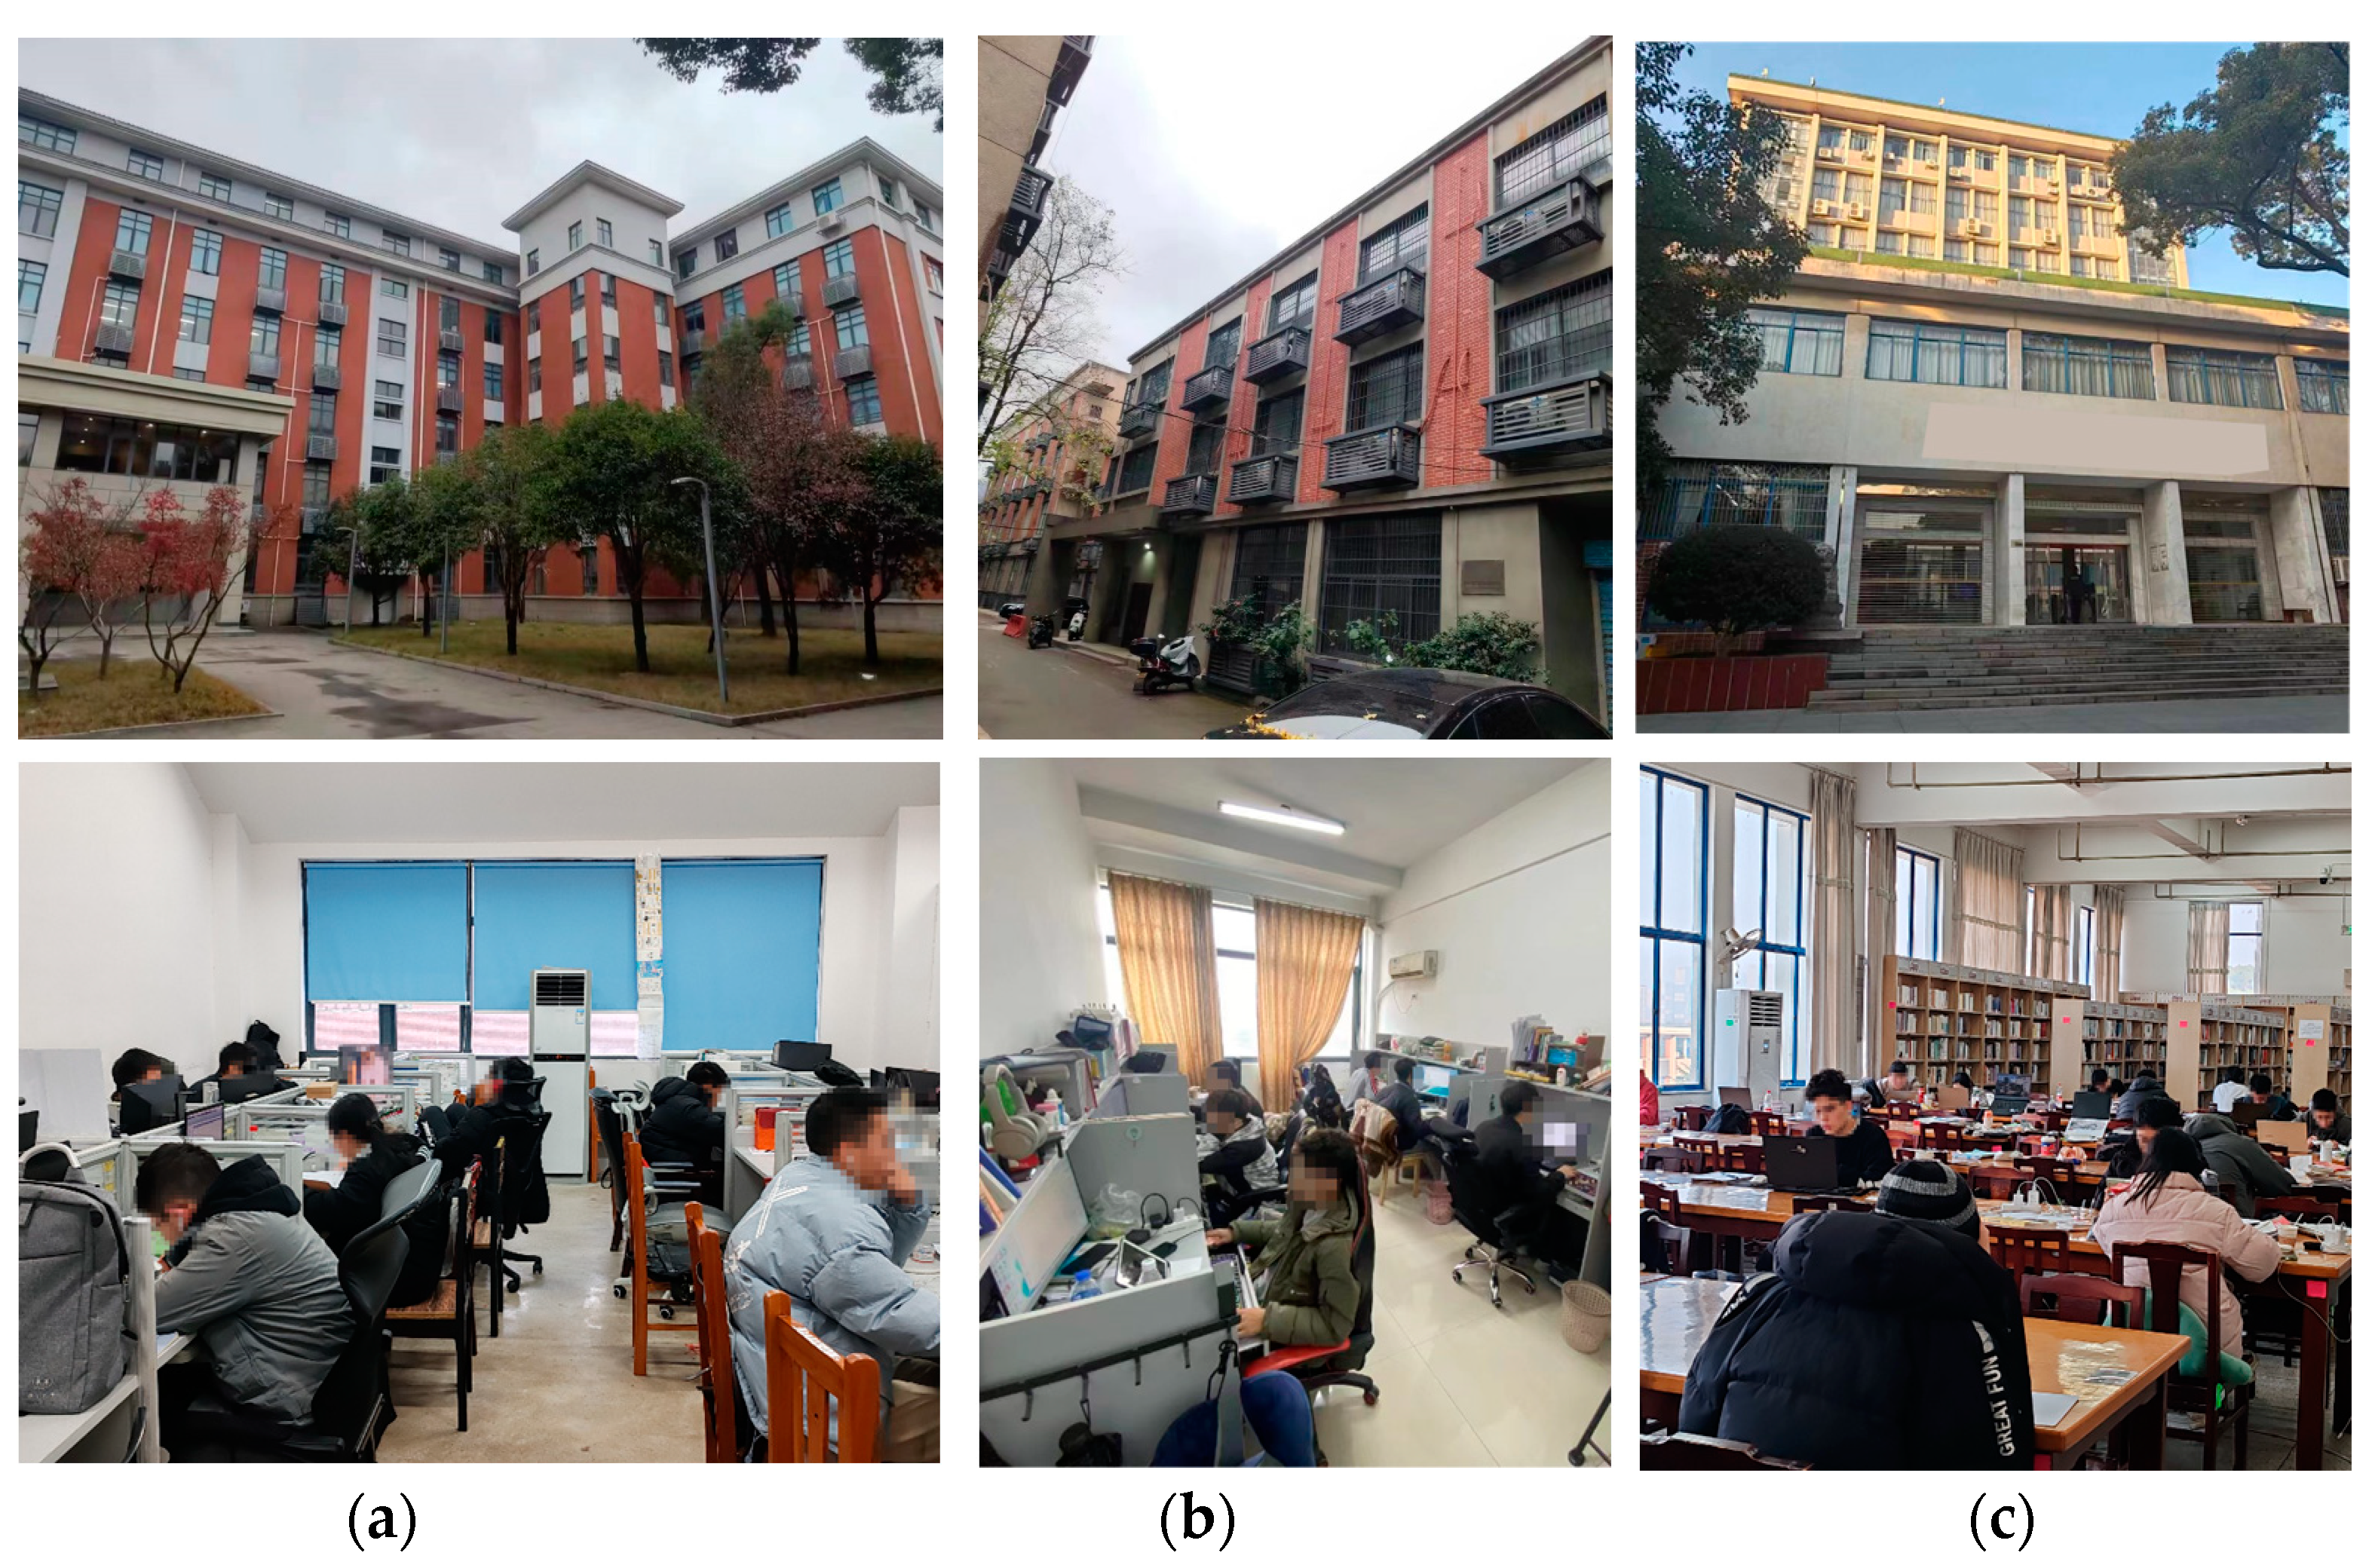
2.2. Investigated Buildings
2.3. Measurement
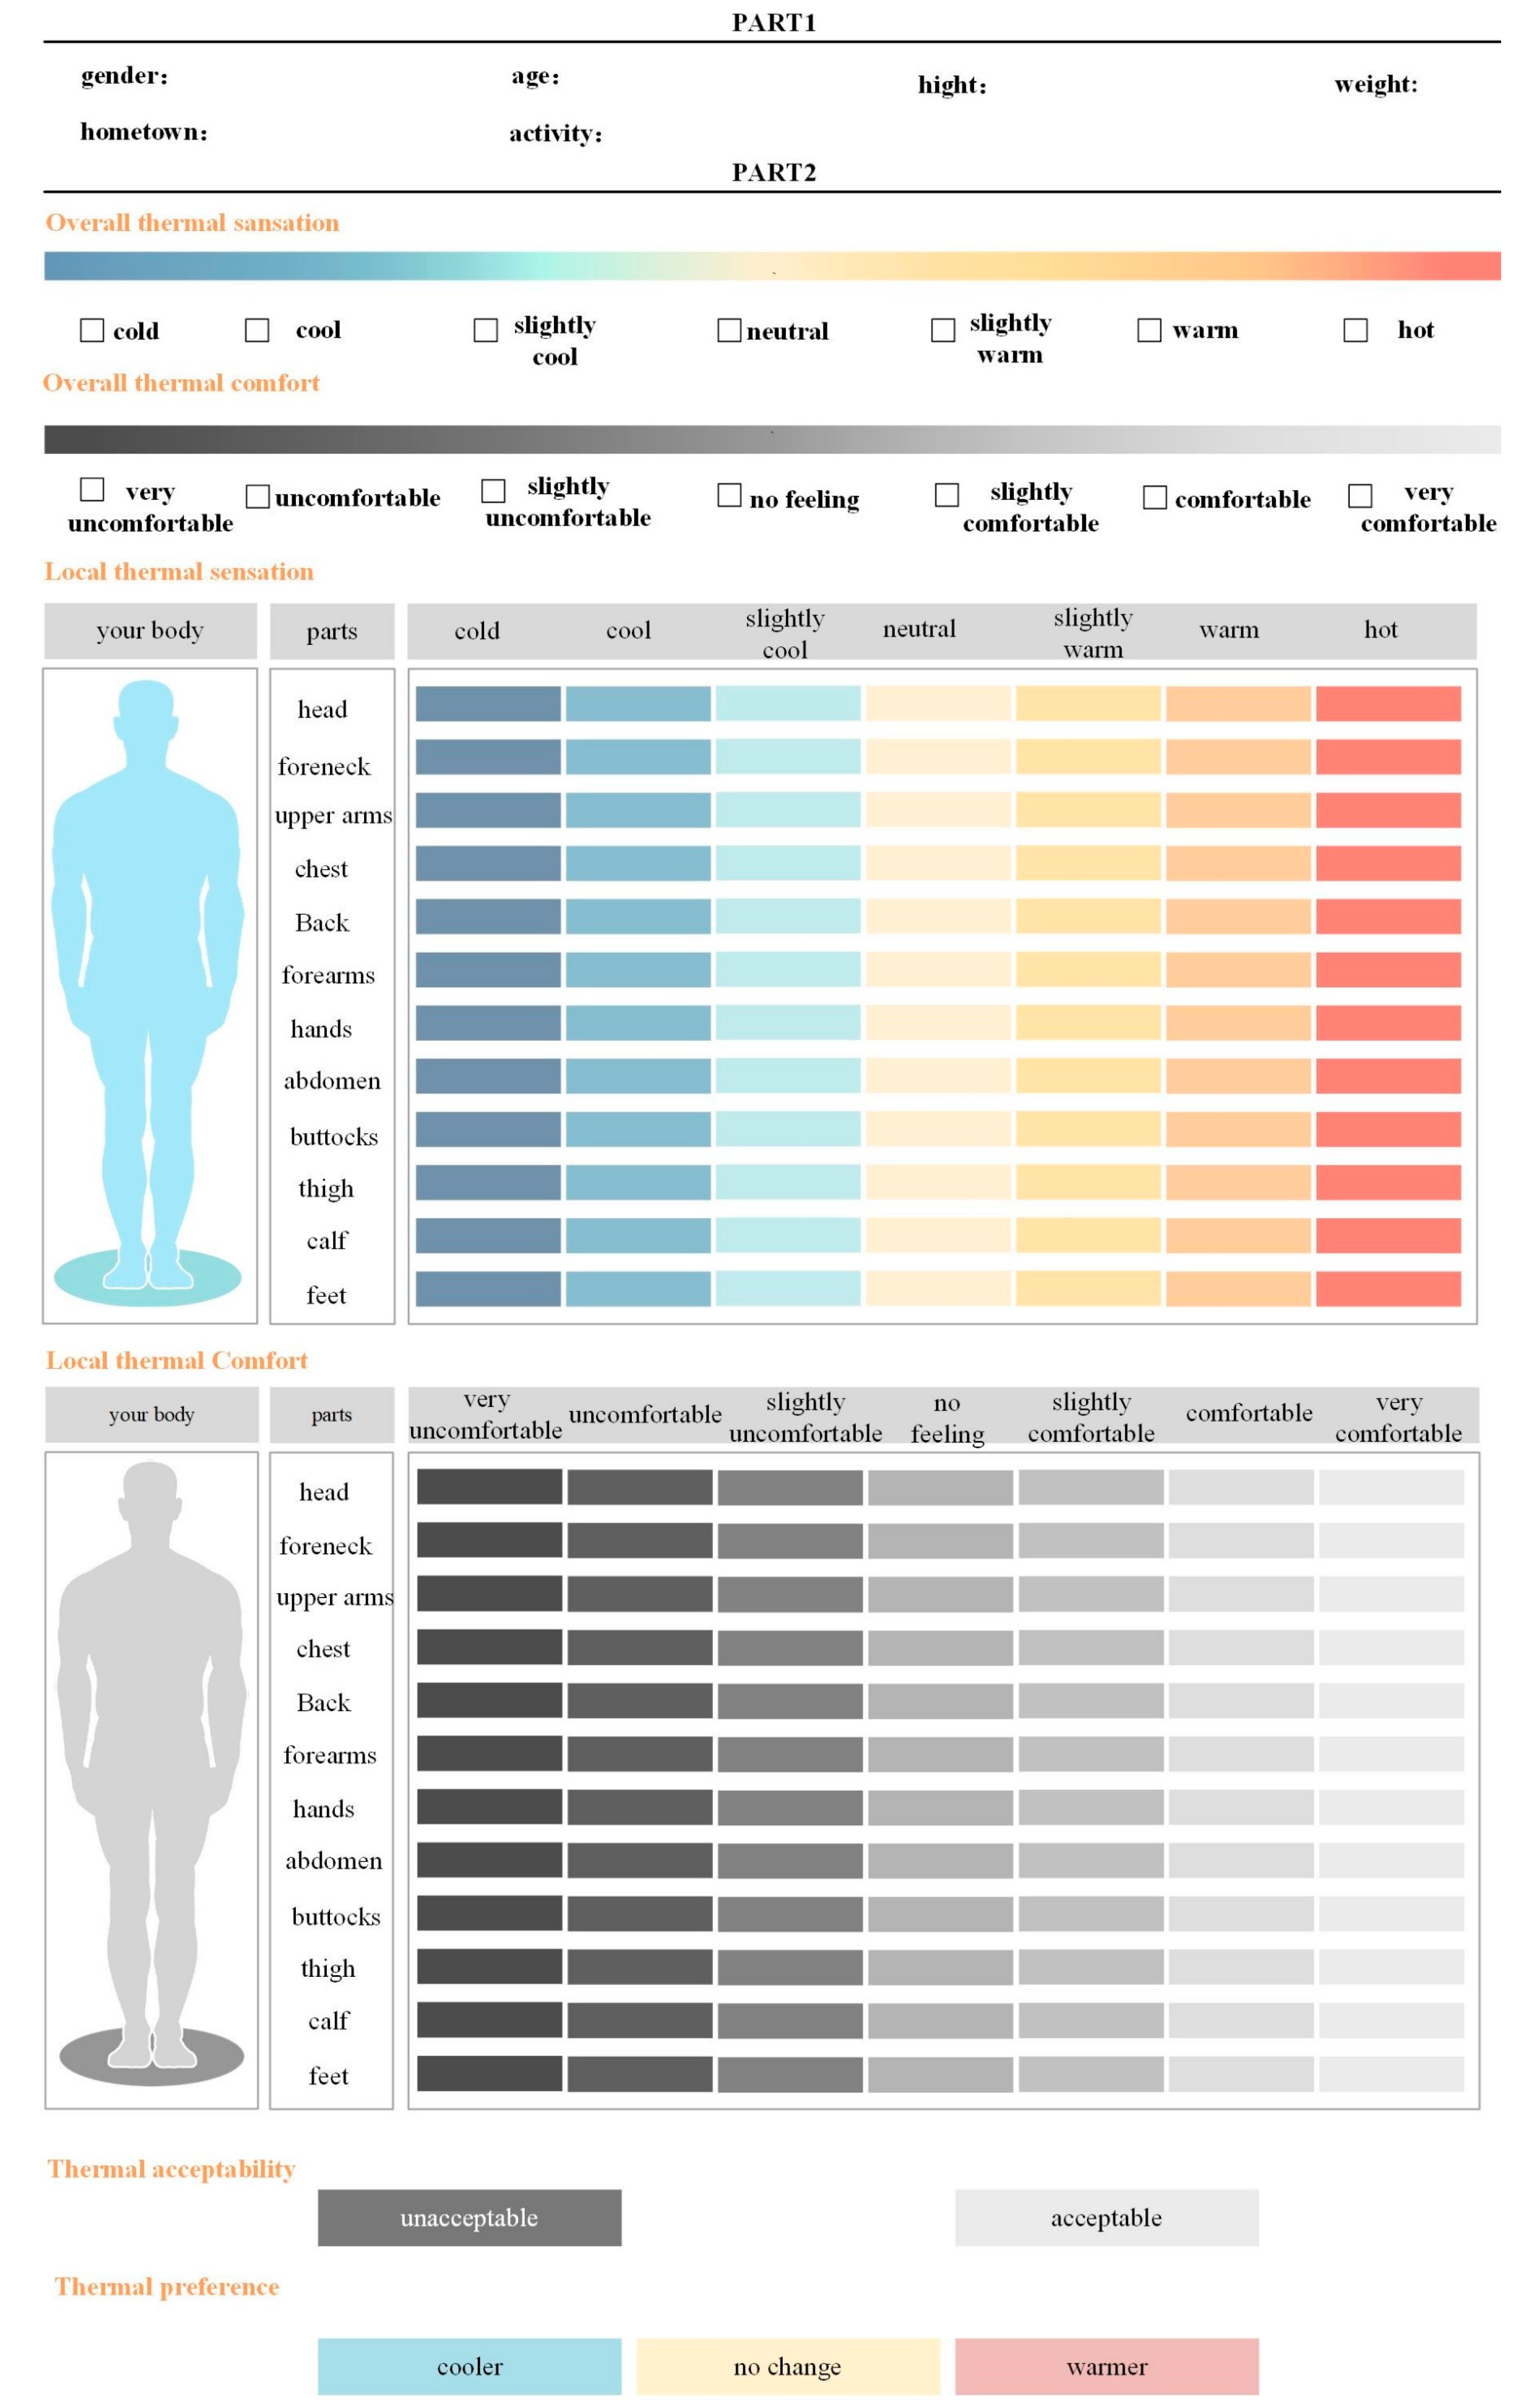
2.4. Survey
2.5. Participants
2.6. Data Filtration and Analysis
- (1)
- Rule 1: The amount of local body parts on the comfortable side (n+) was less than that on the uncomfortable side (n−). In this case, the relationship between the overall thermal comfort (OTC) and the local thermal comfort (LTC) was modeled as follows:where LTC1st, discomfort is the local thermal comfort of the most uncomfortable body segment on the uncomfortable side; LTC2nd, discomf is the local thermal comfort of the second most uncomfortable body segment on the uncomfortable side; and LTC1st, comf is the local thermal comfort of the most comfortable body segment on the comfortable side.
- (2)
- Rule 2: The amount of local body parts on the comfortable side (n+) was greater than that of the body parts on the discomfort side (n−). In this case, the relationship between the overall thermal comfort (OTC) and the local thermal comfort (LTC) was modeled as follows:where LTS2nd, comf is the local thermal comfort of the second most comfortable body segment on the comfortable side.
3. Results
3.1. Overview of the Subjects
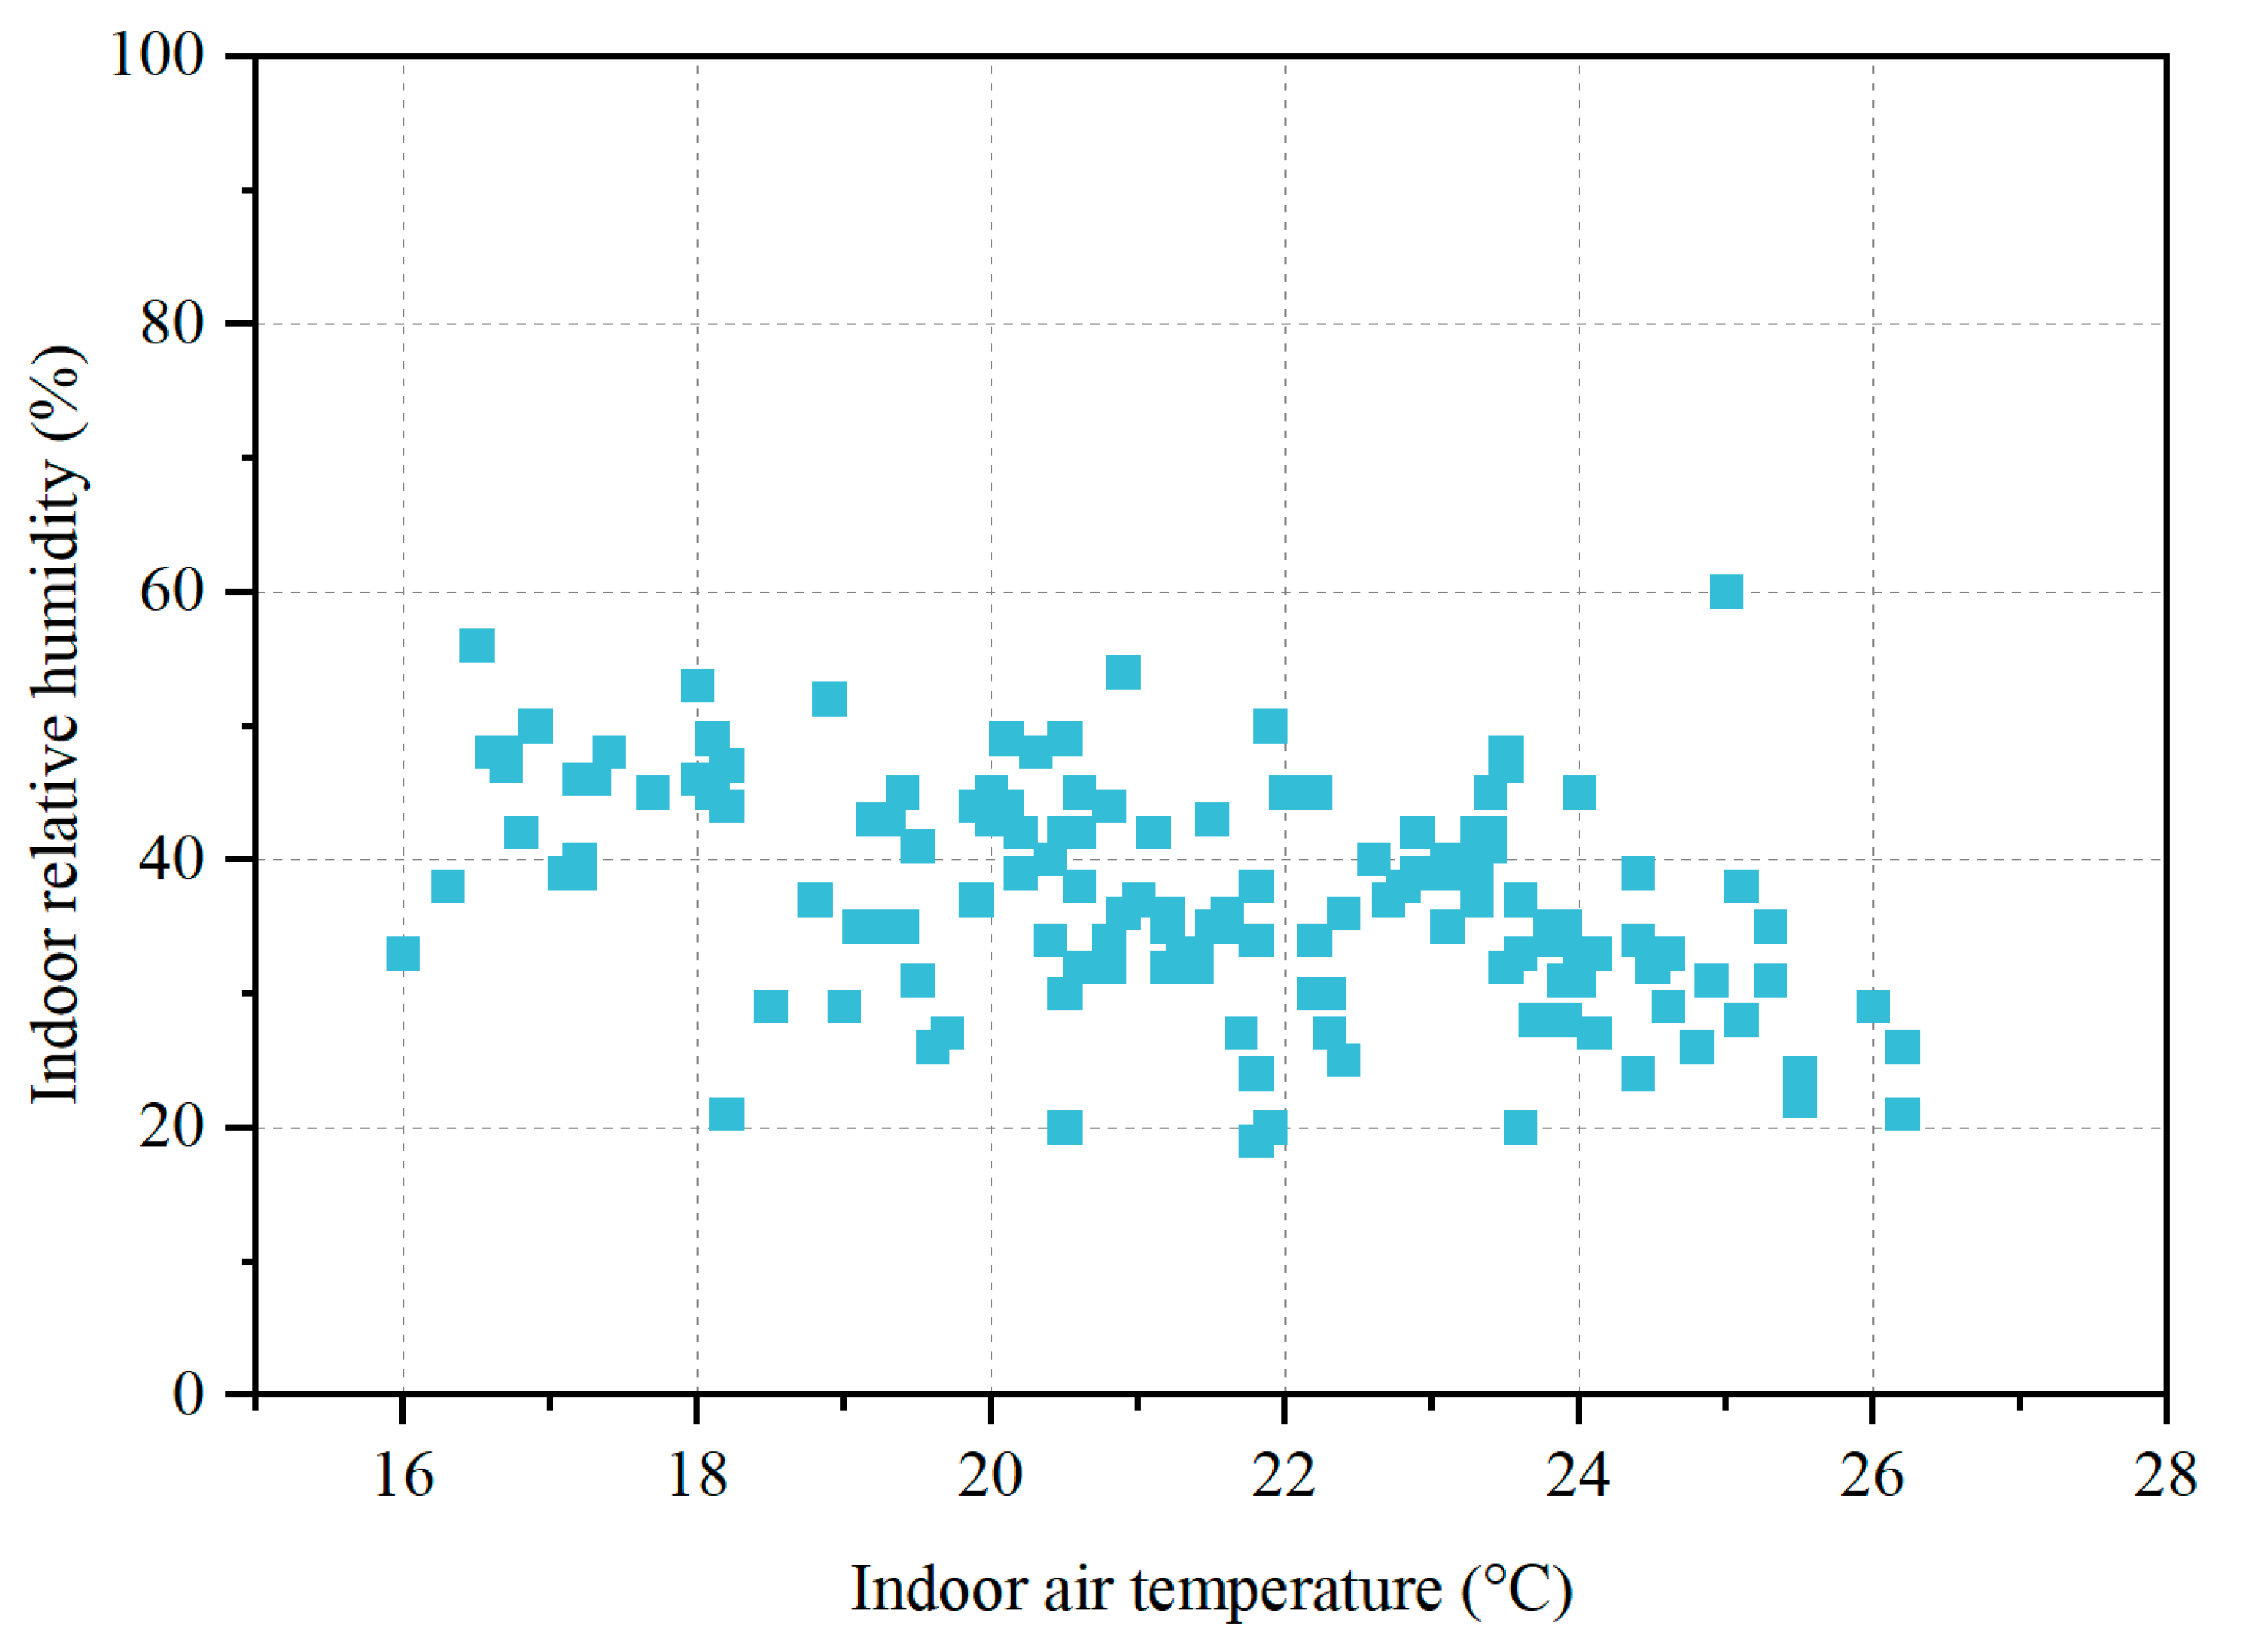
3.2. Environmental Parameters
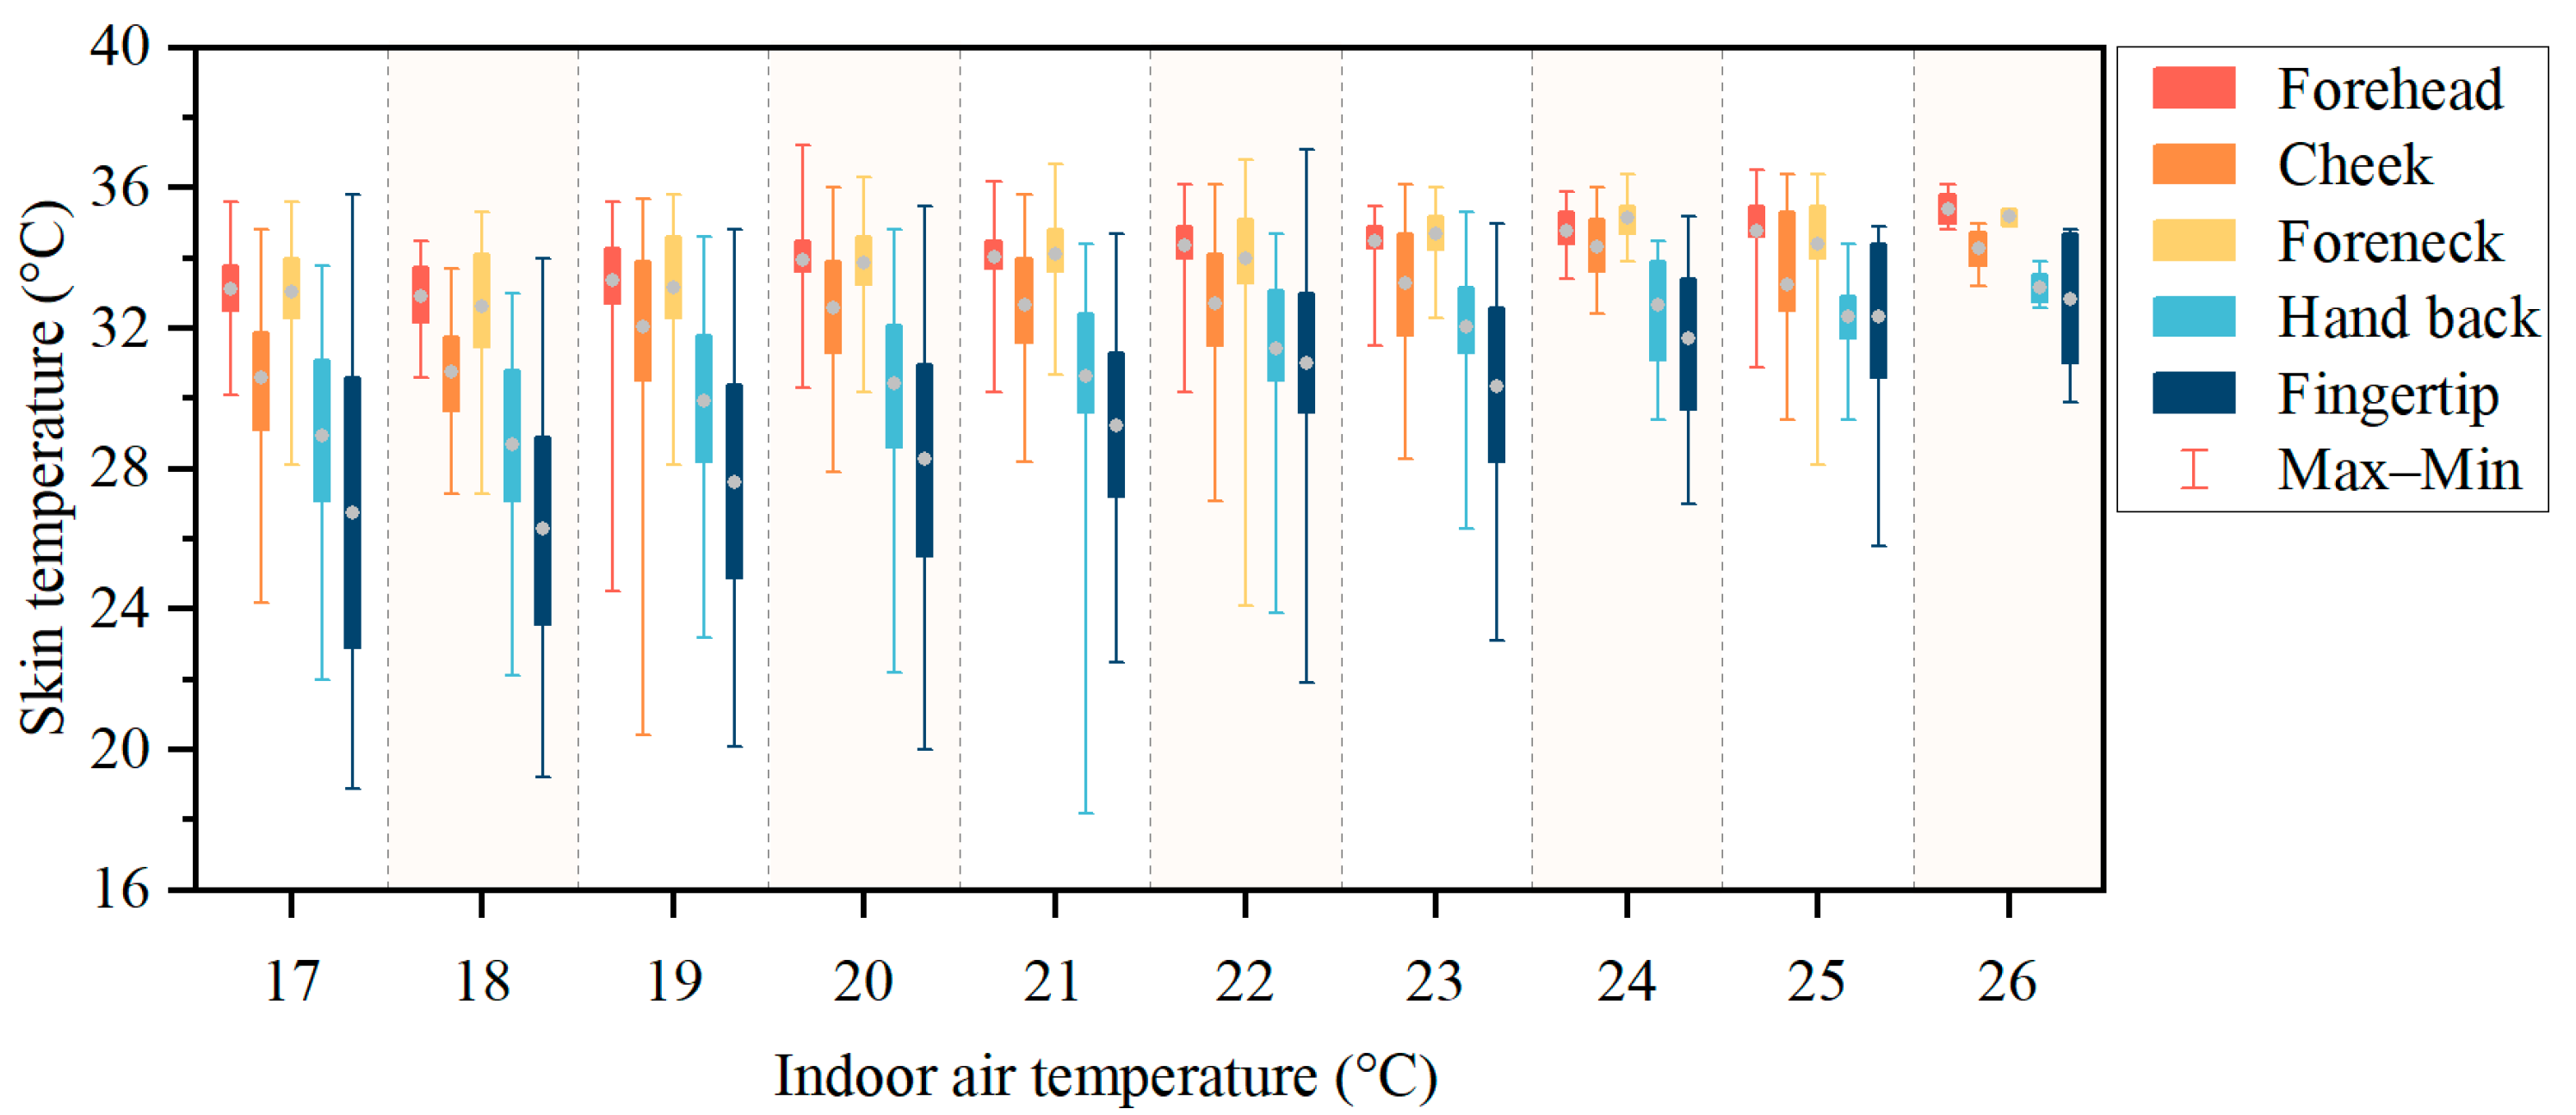
3.3. Physiological Parameters
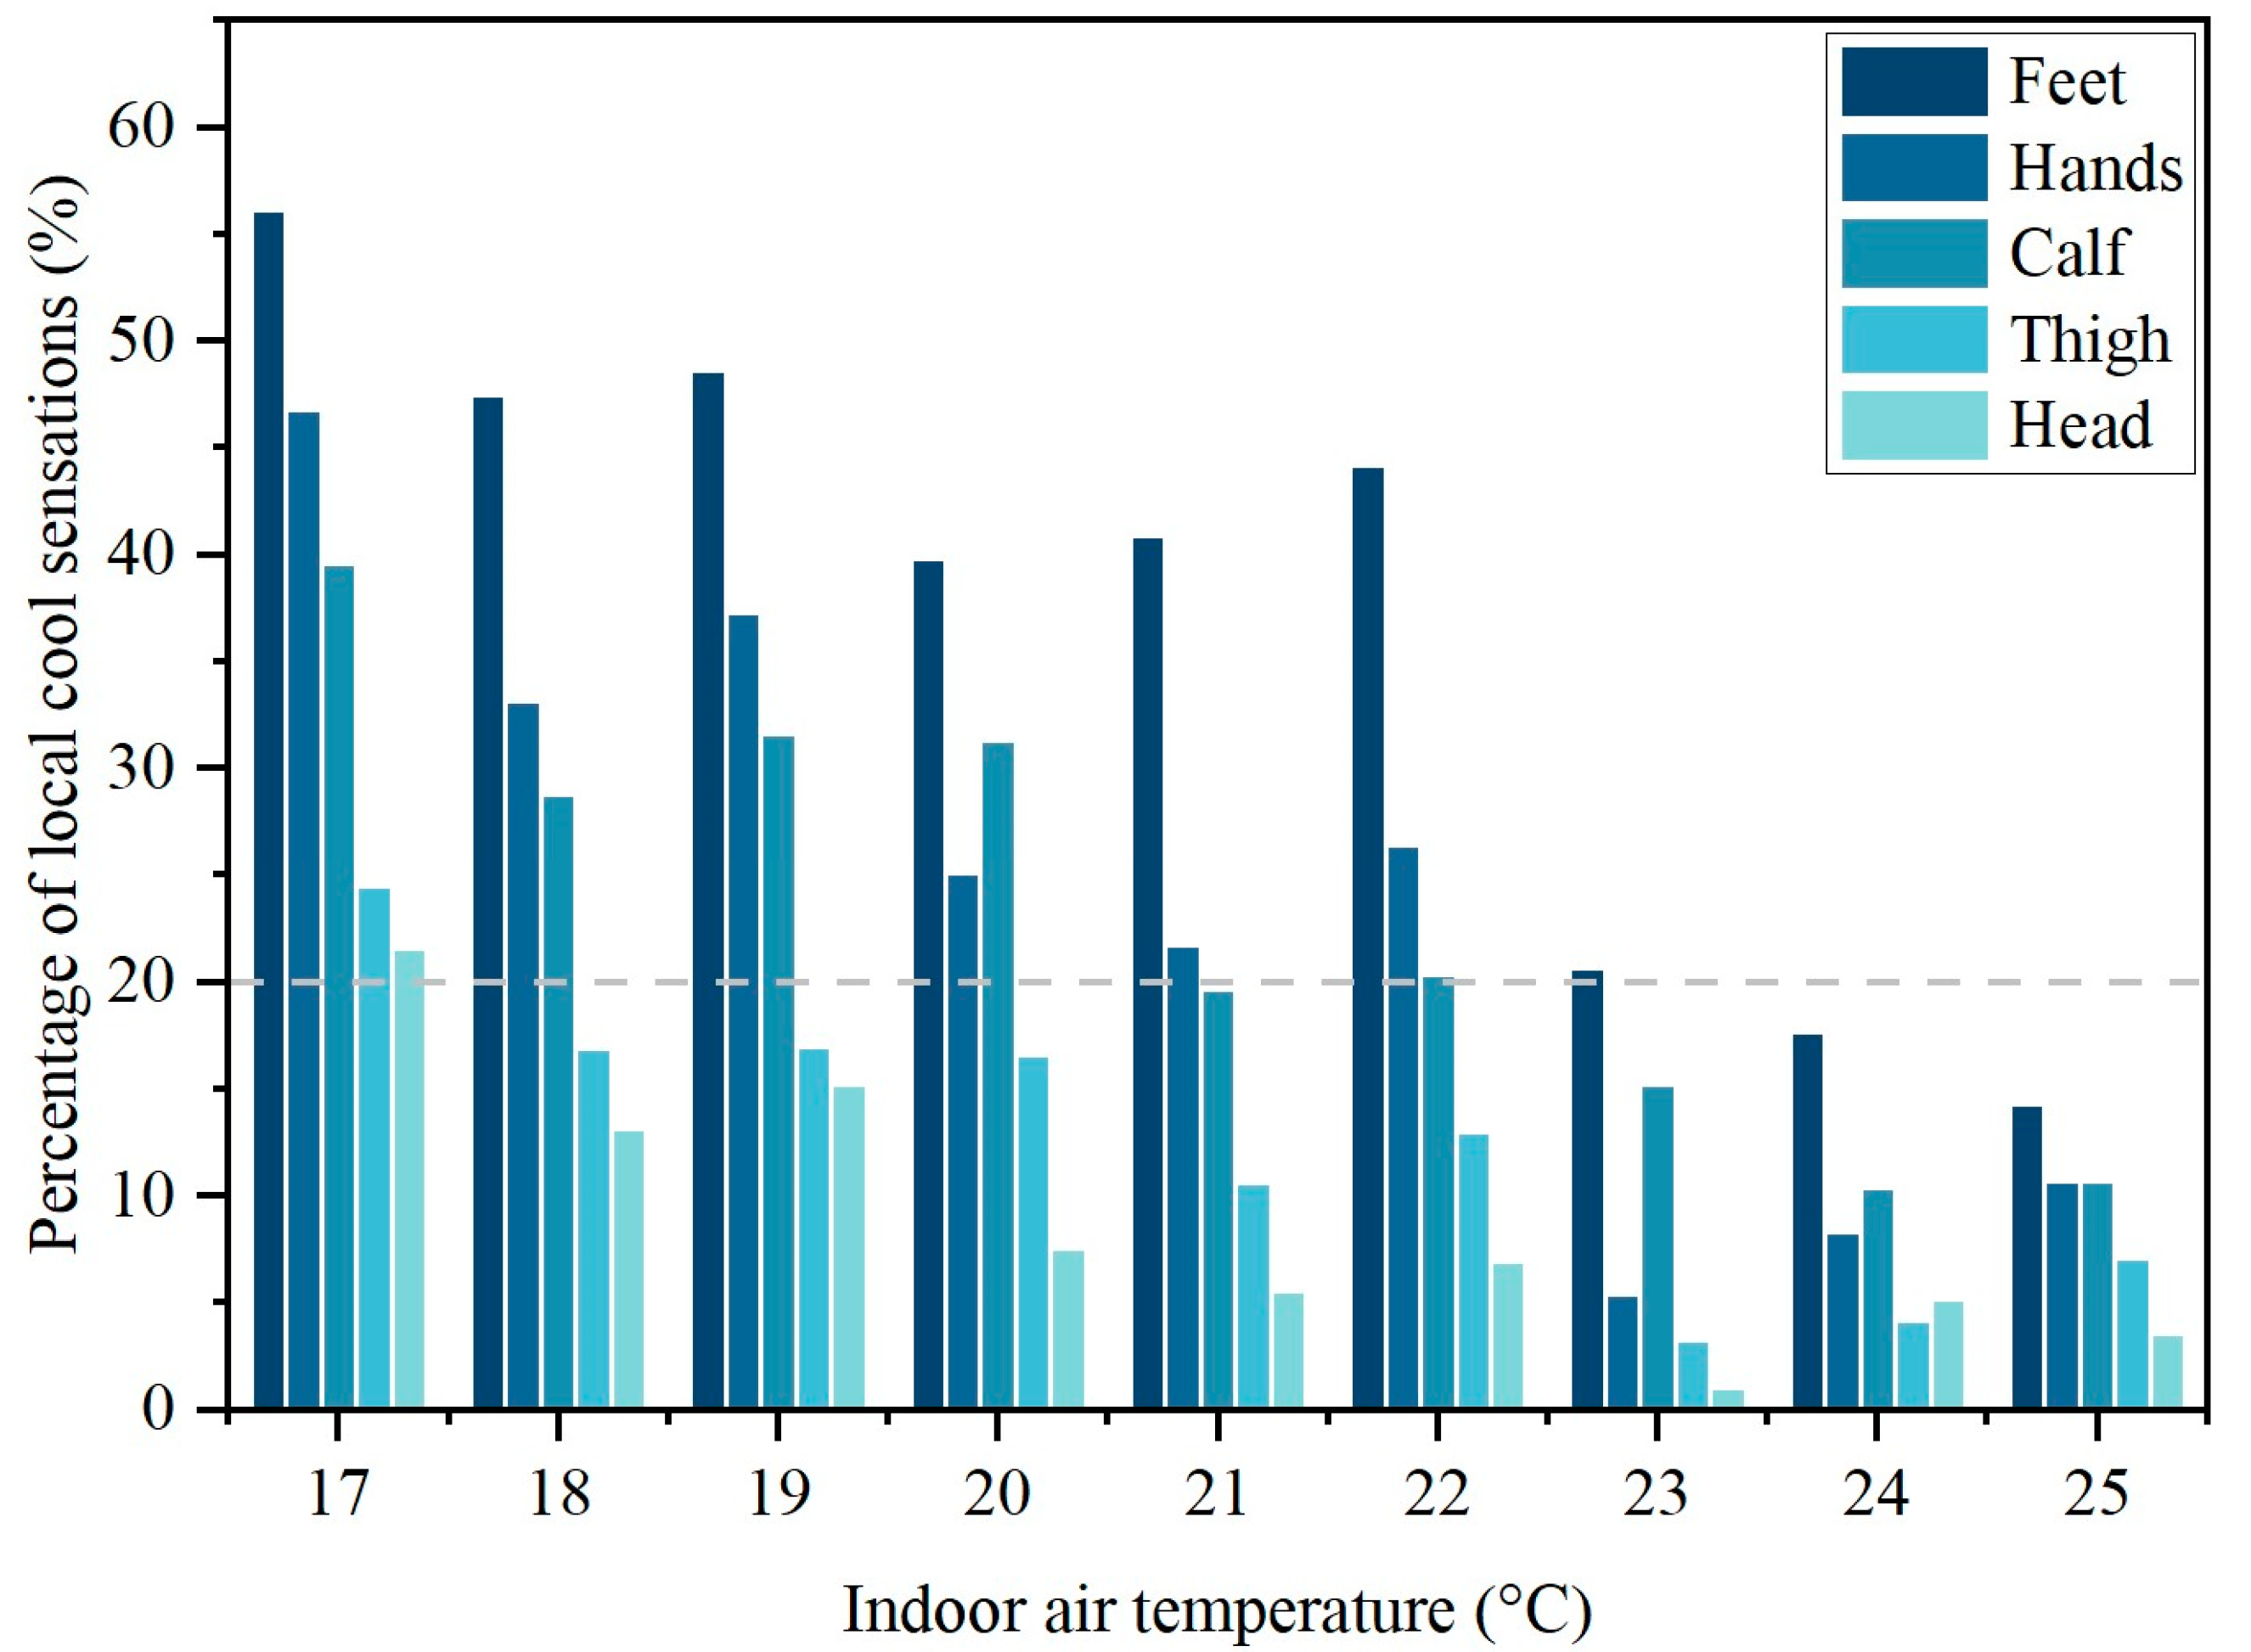
3.4. Ranking of Local Cool Sensations
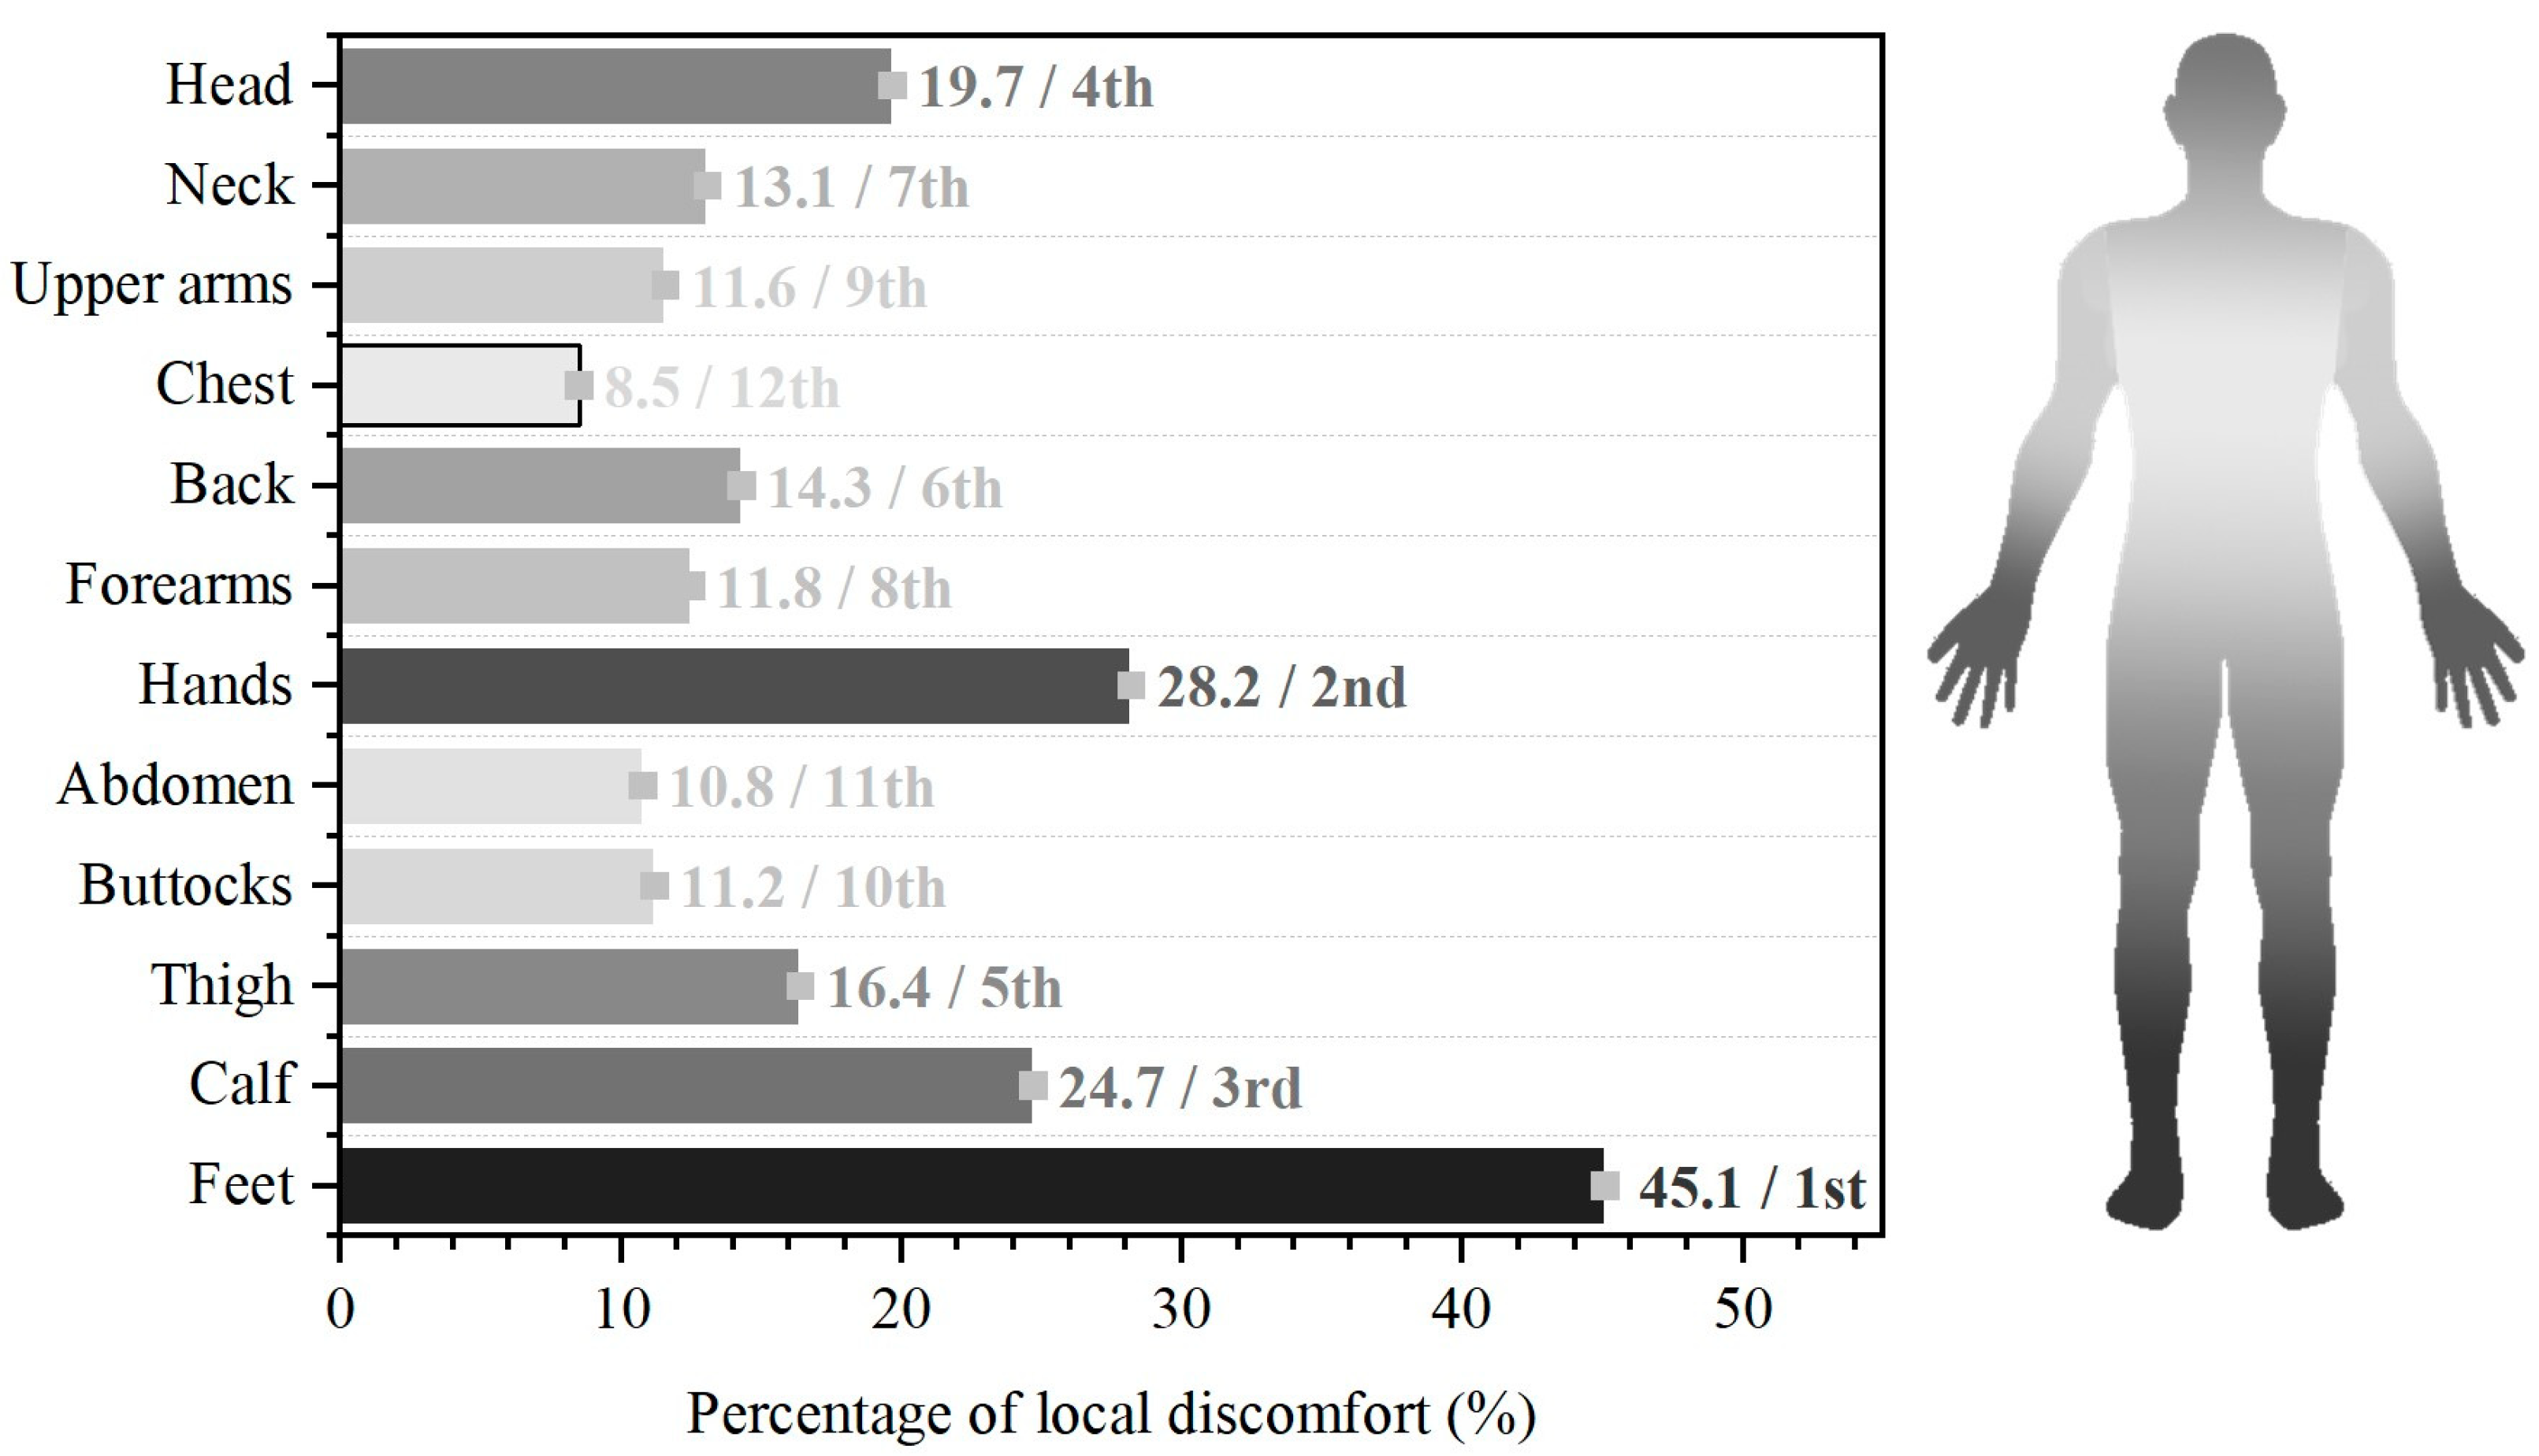
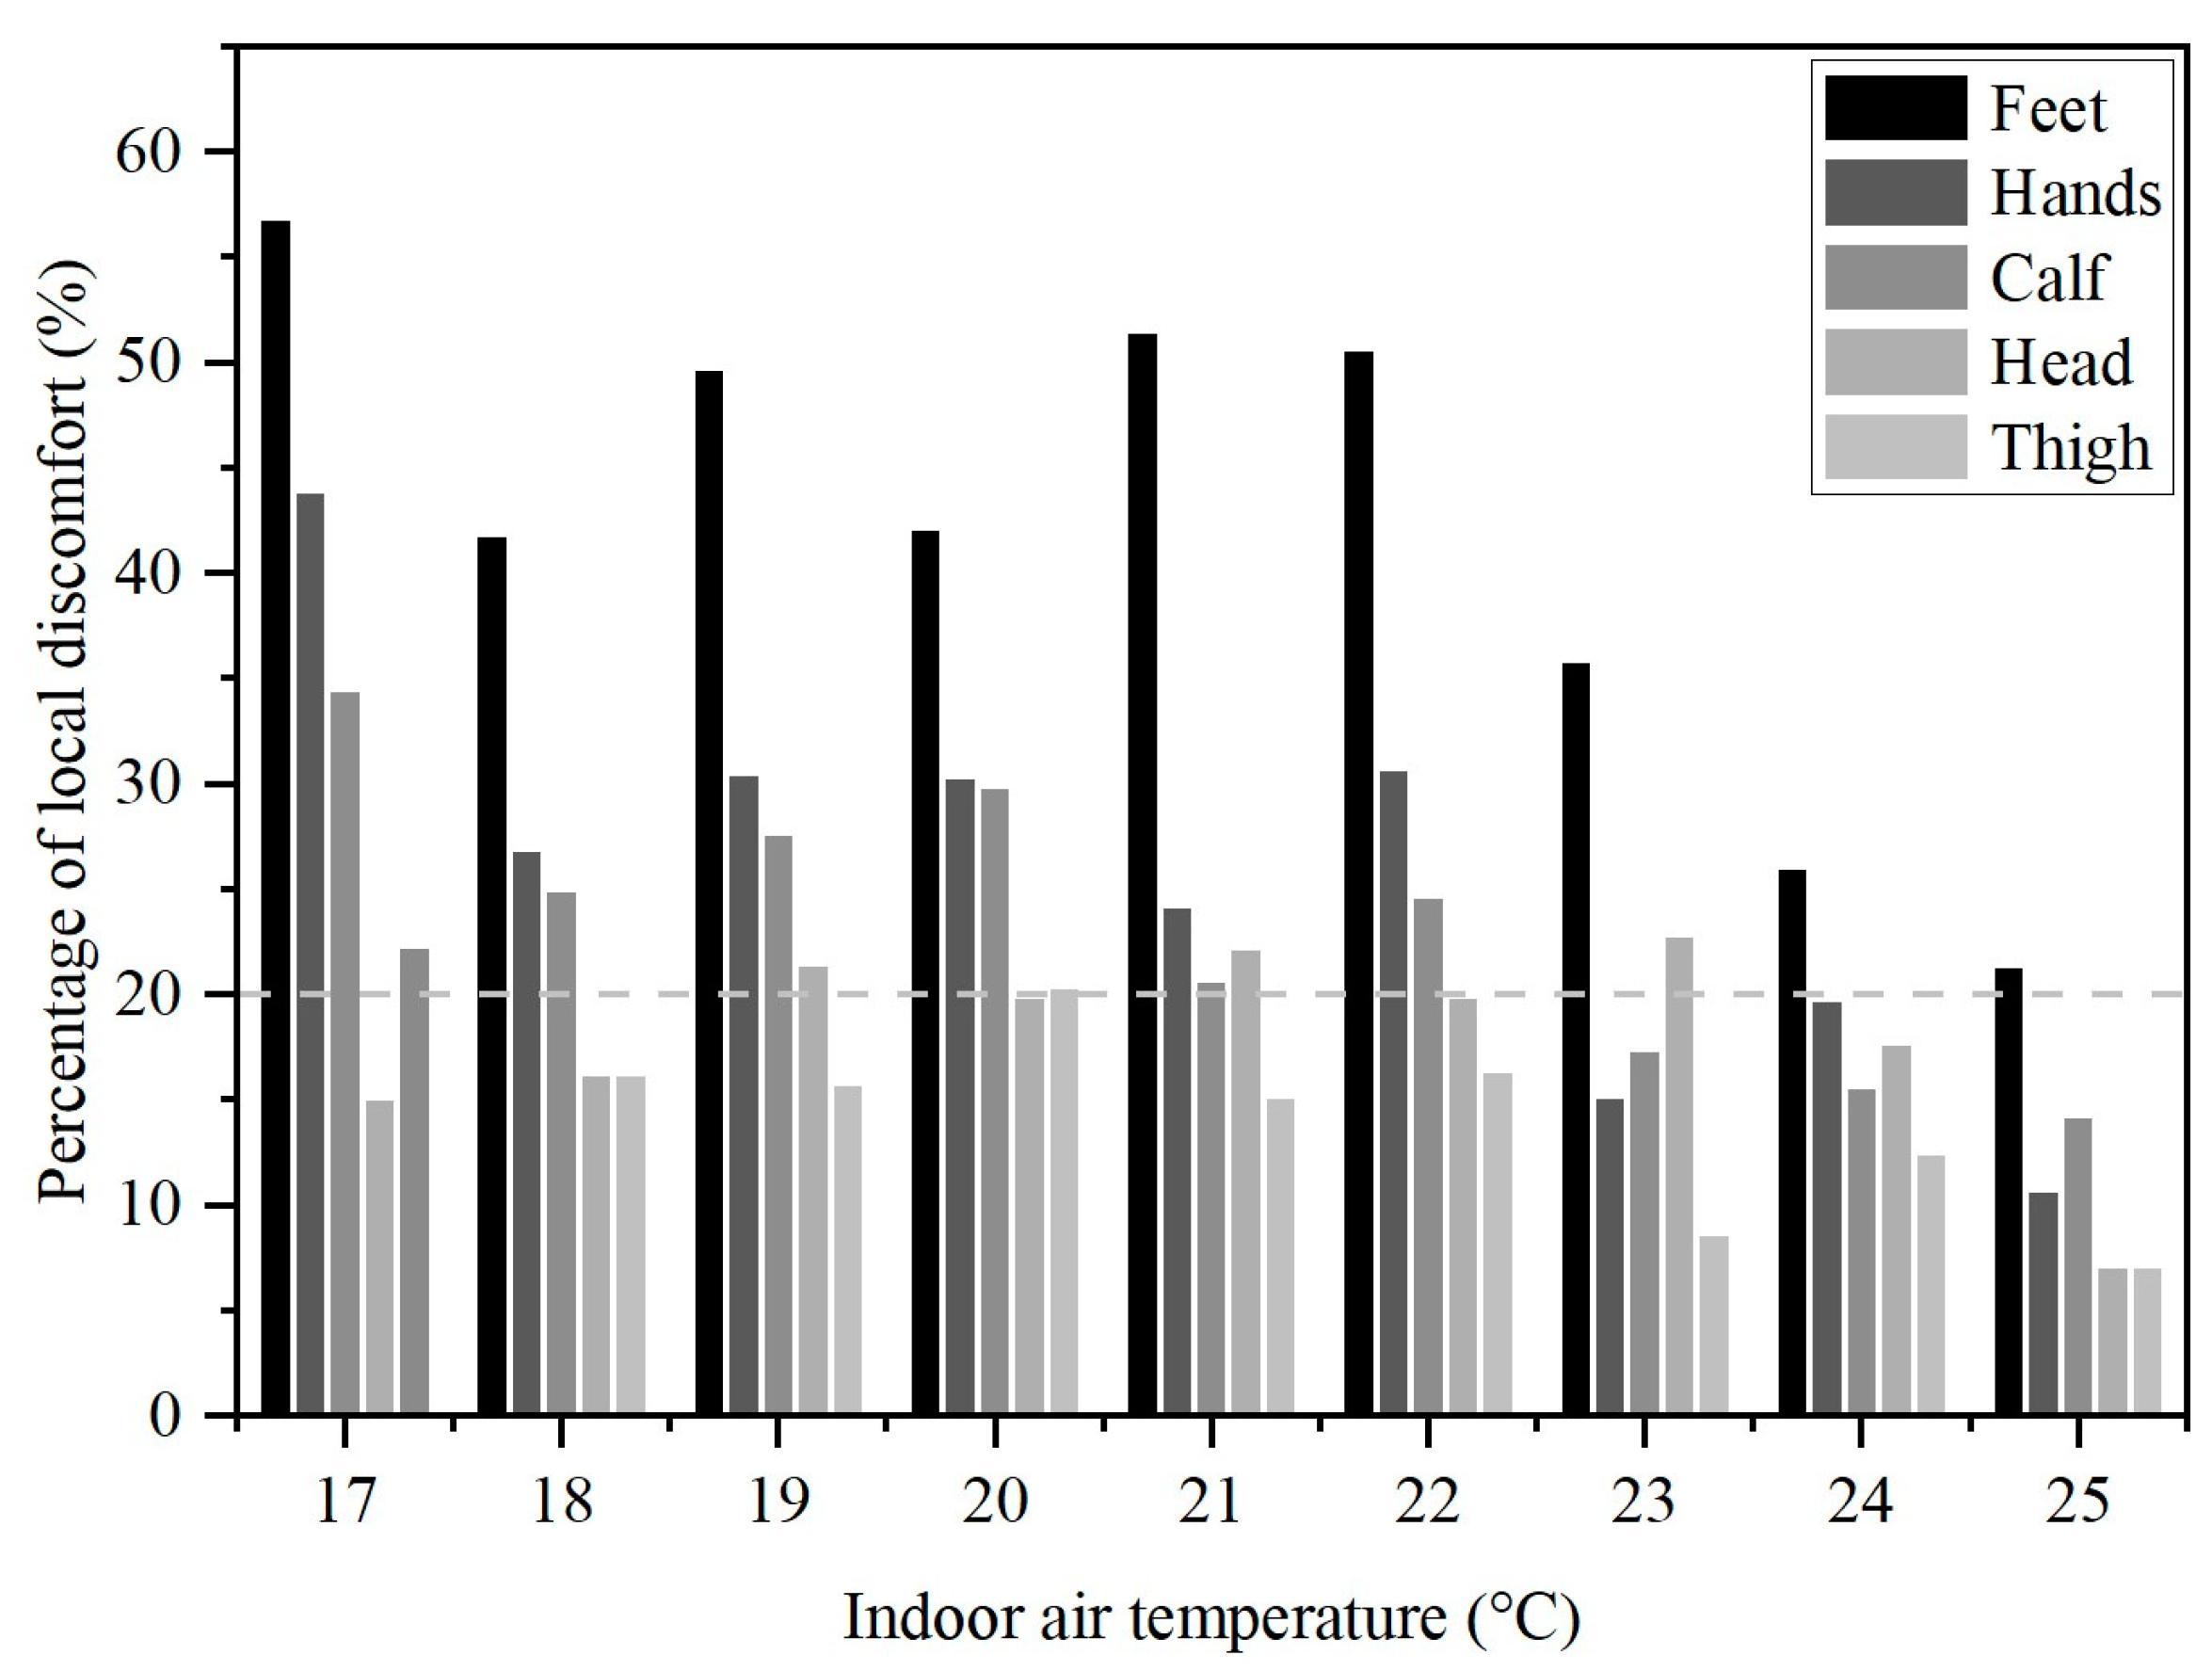
3.5. Ranking of Local Discomfort
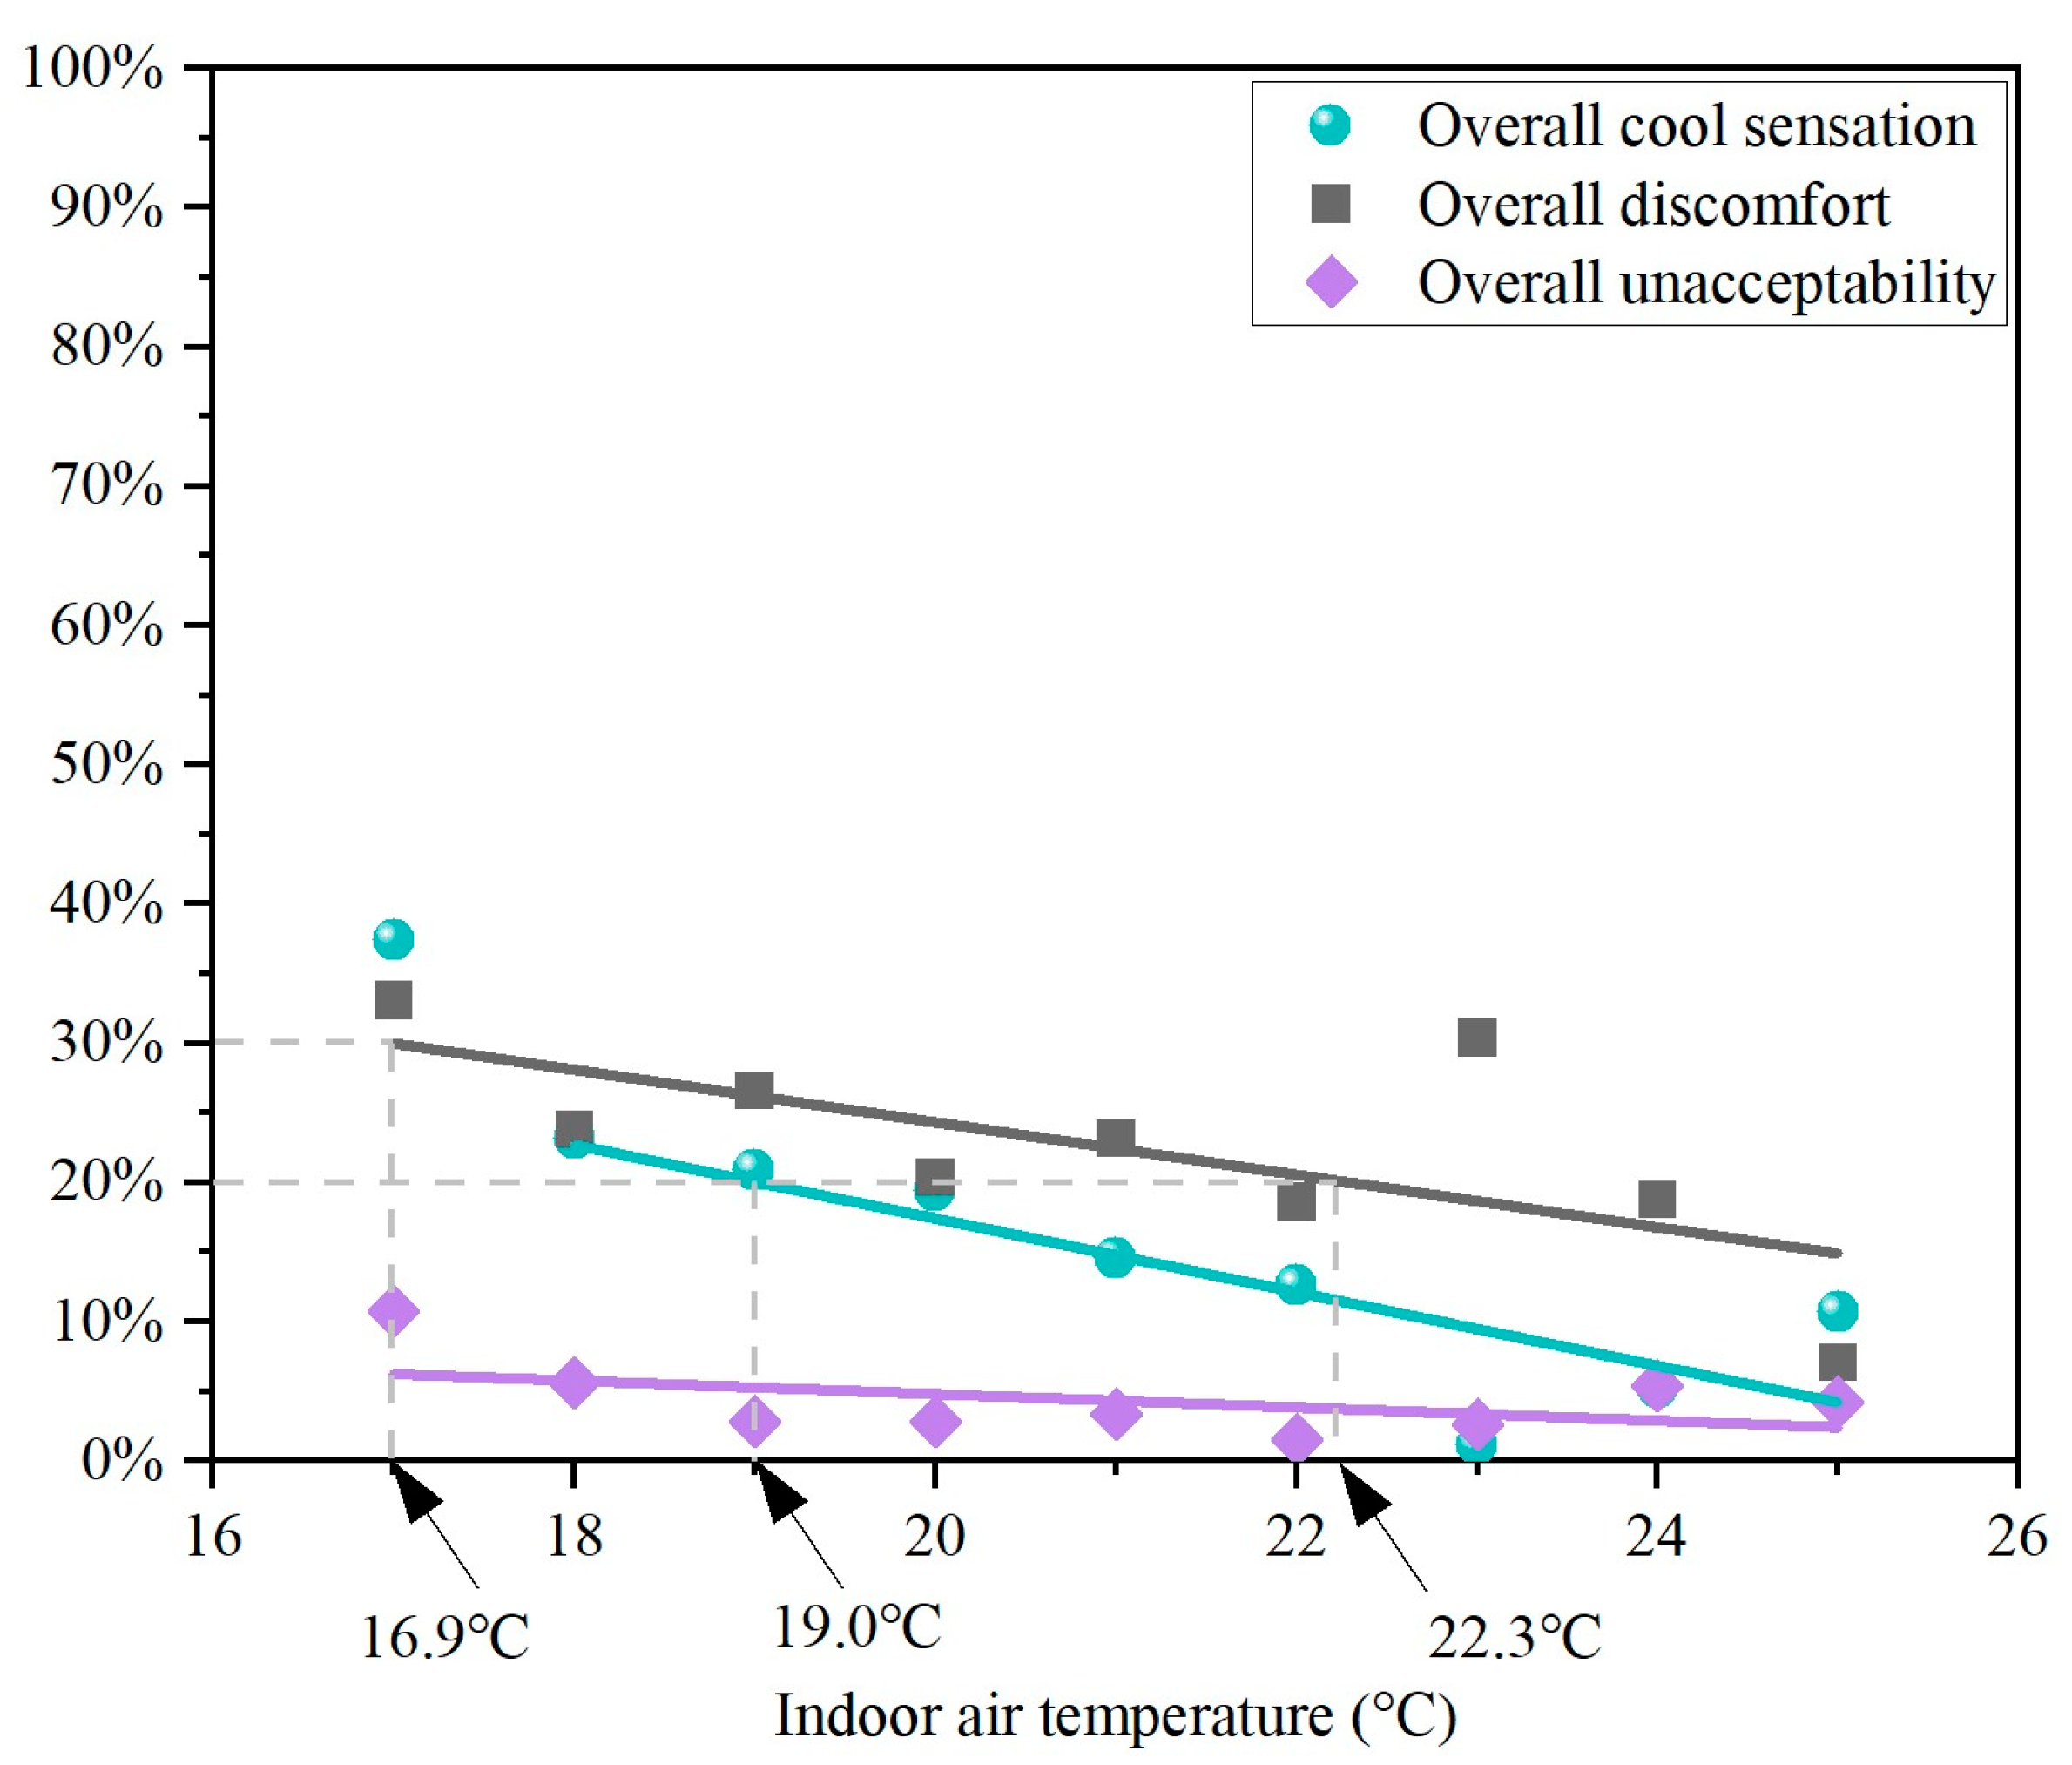
3.6. Correlation between the Percentages of Local and Overall Thermal Status
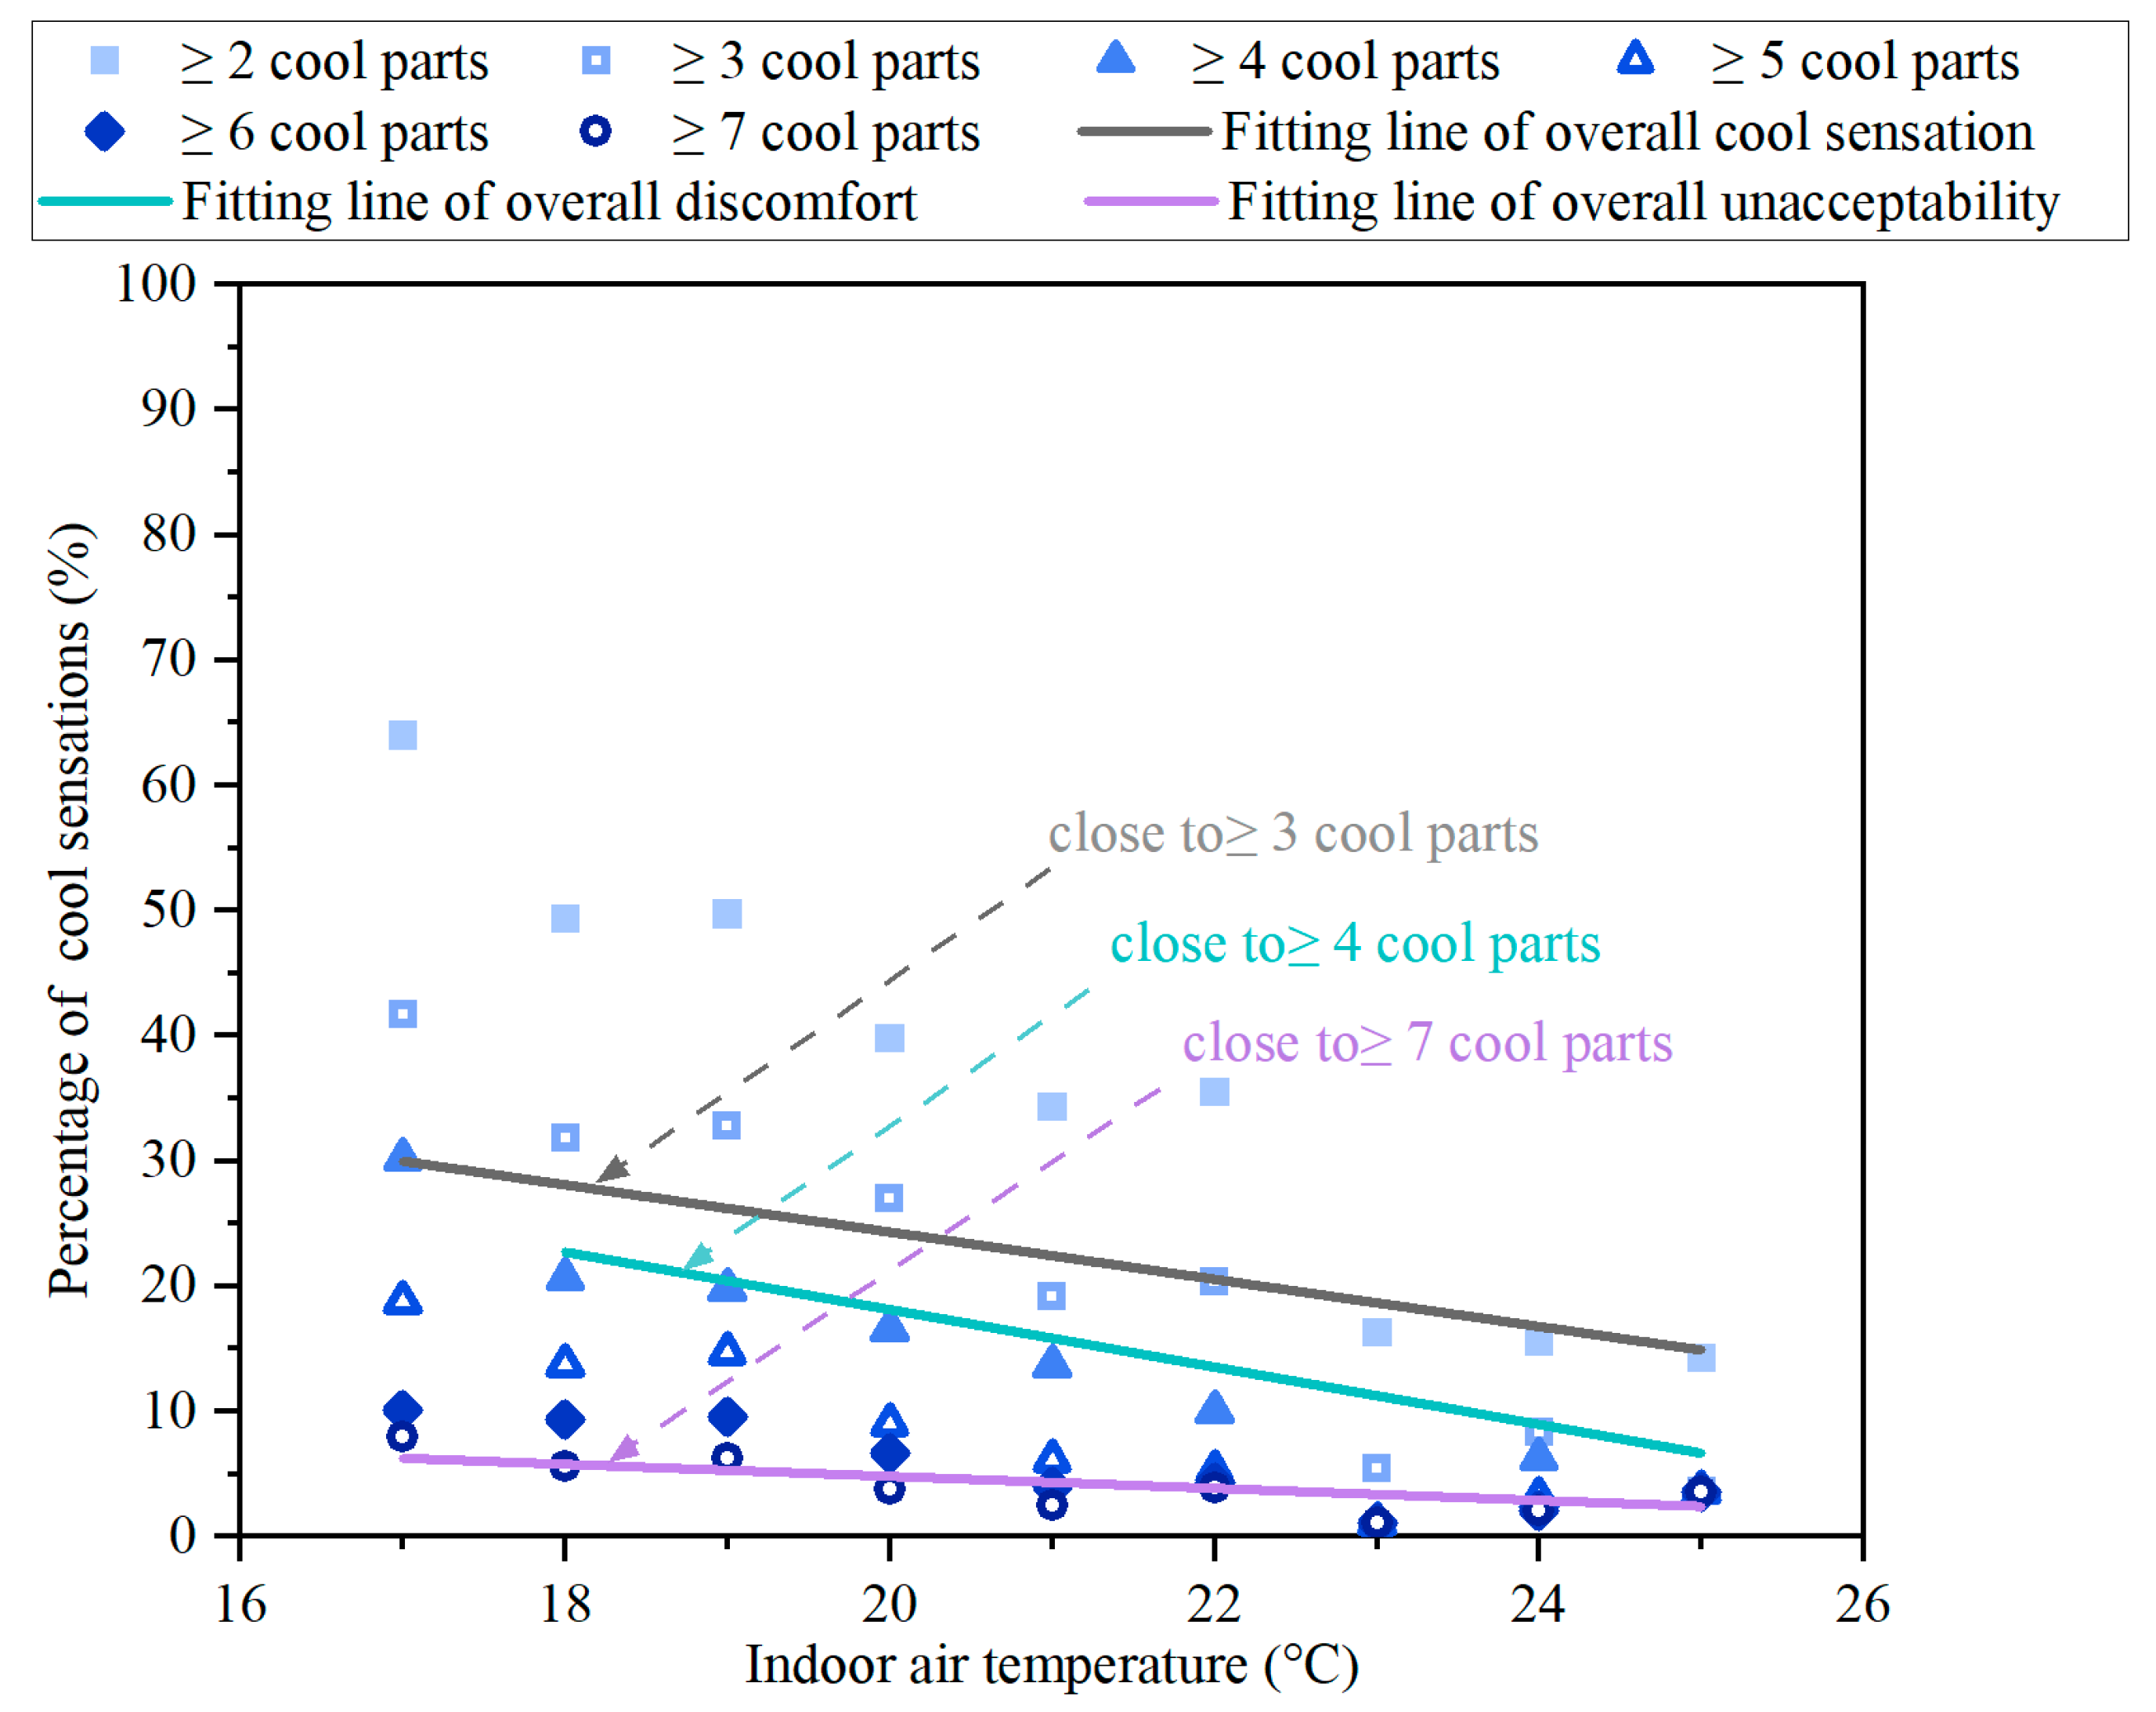
3.6.1. Amount of Cool Body Parts and Overall Subjective Responses
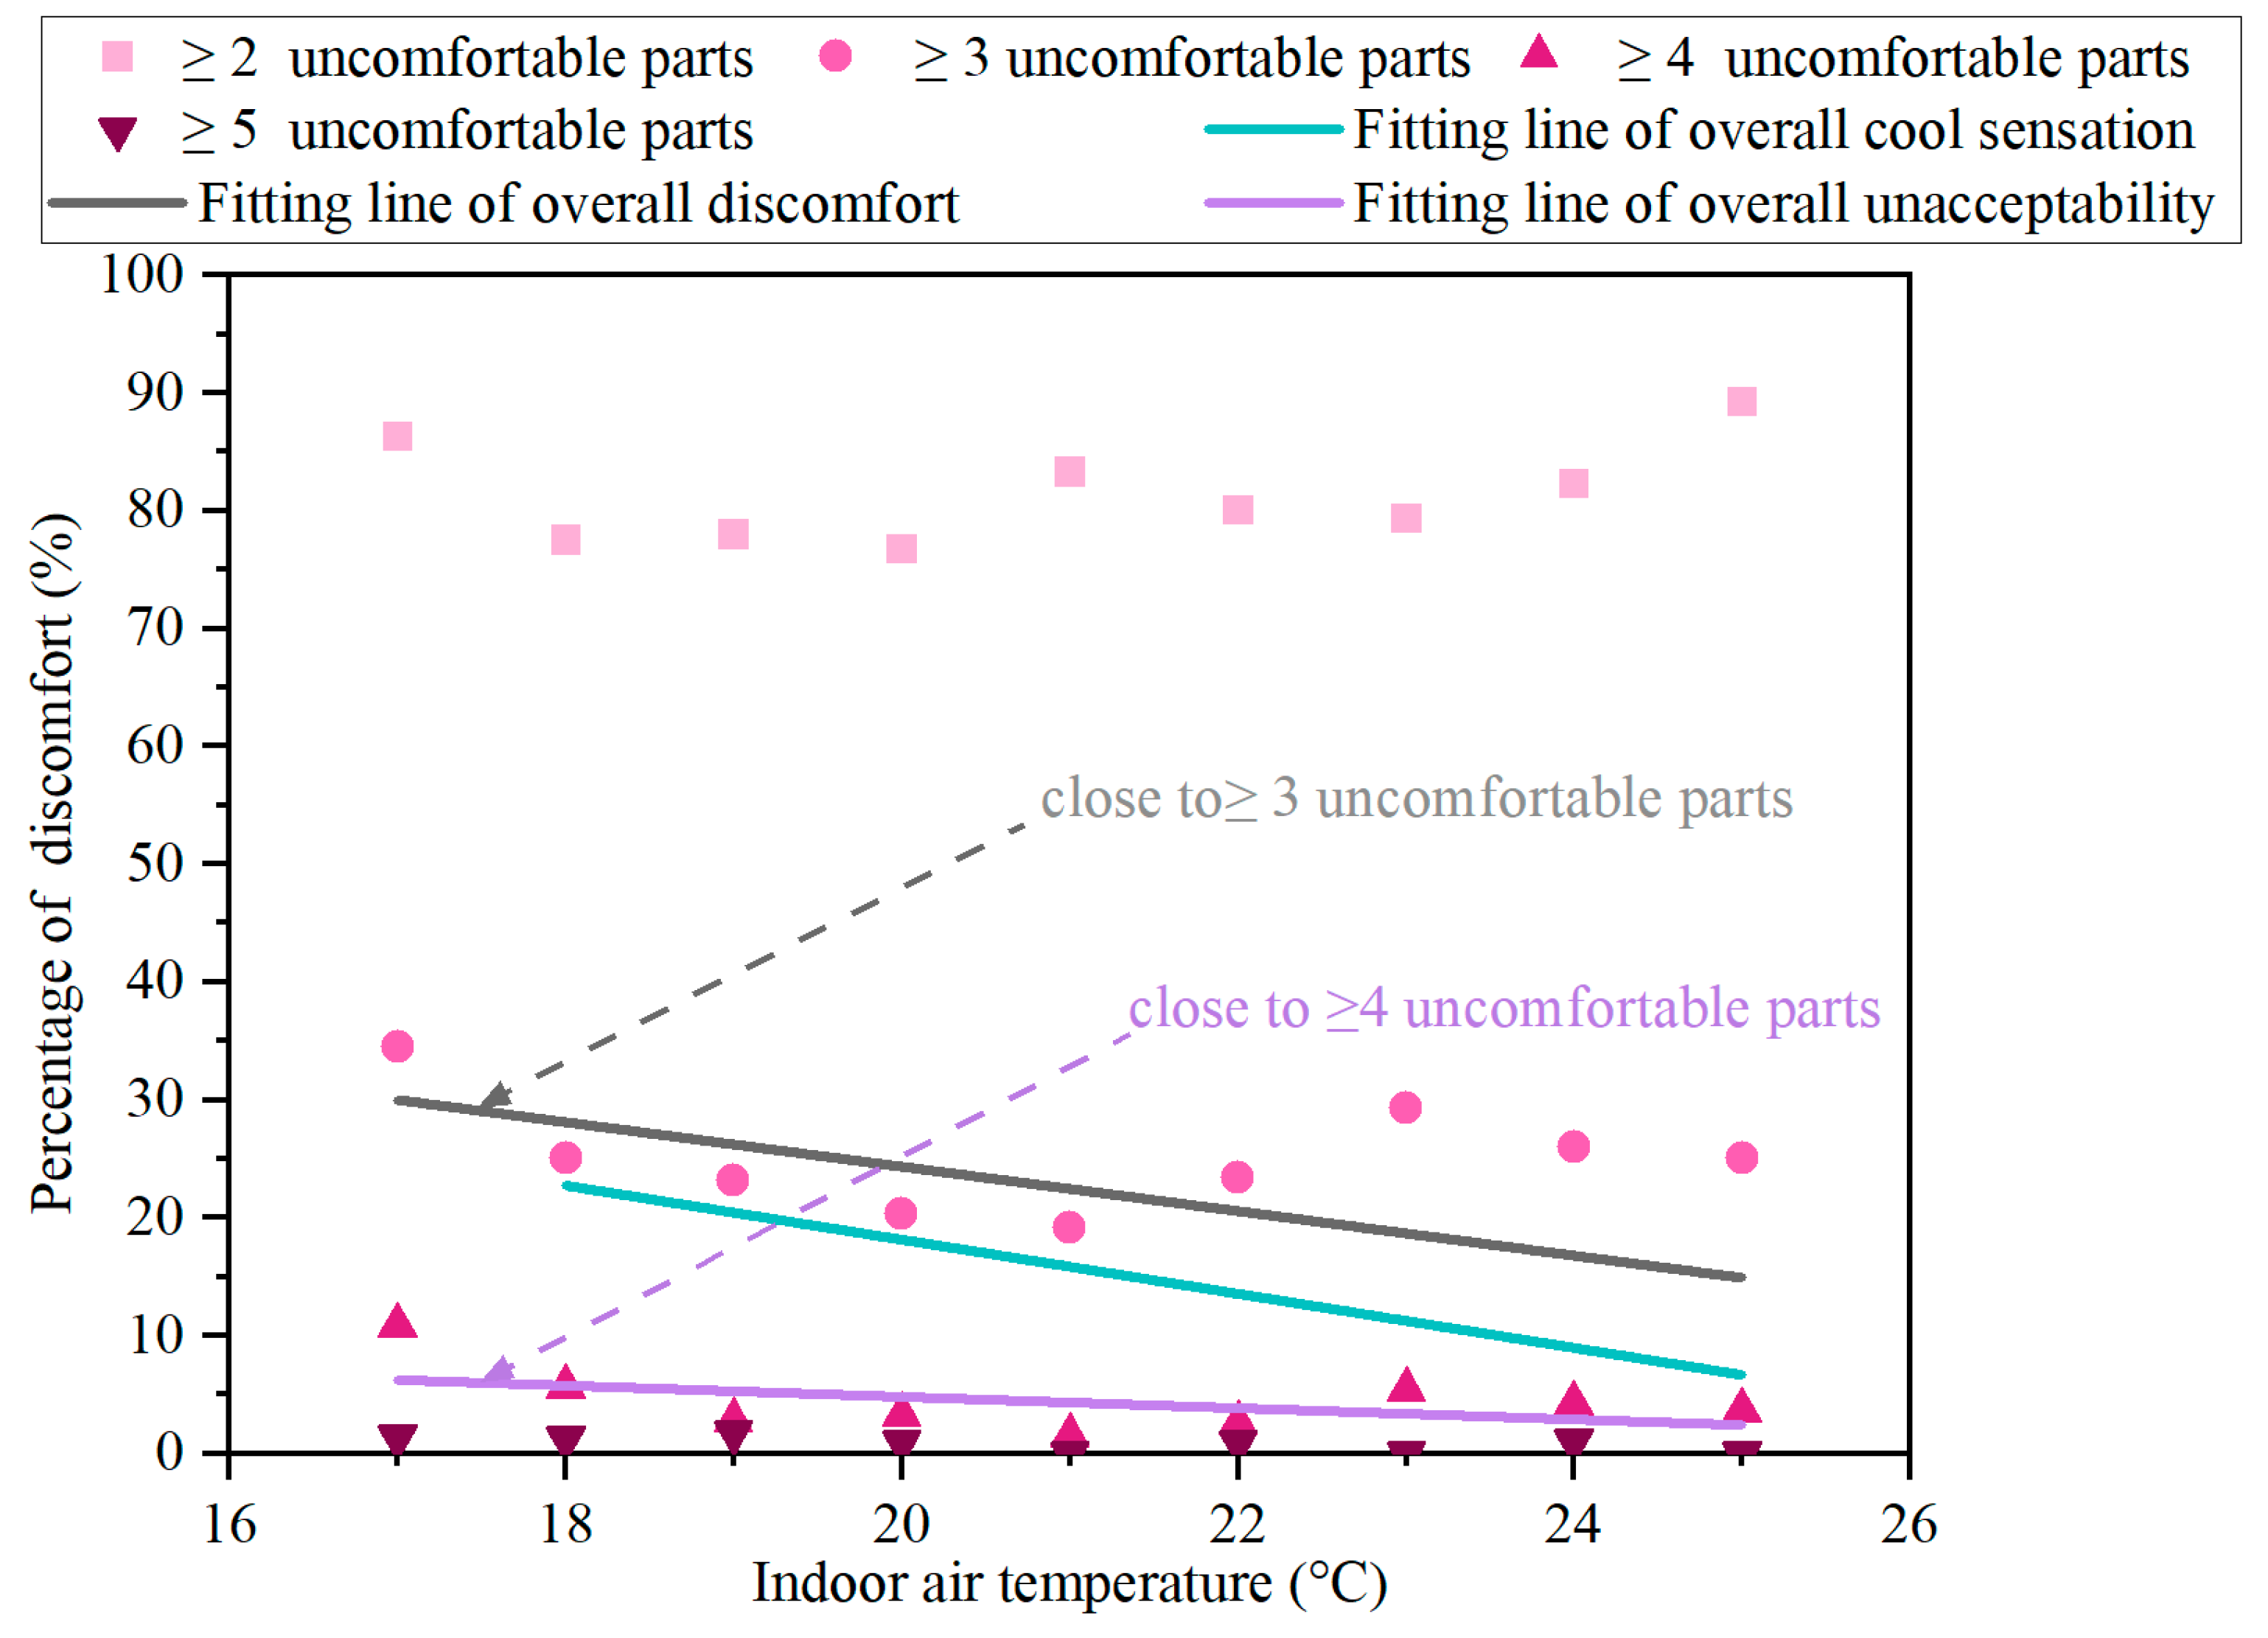
3.6.2. Number of Uncomfortable Body Parts and Overall Subjective Responses
3.7. Validation of Local–Overall Thermal Comfort Model
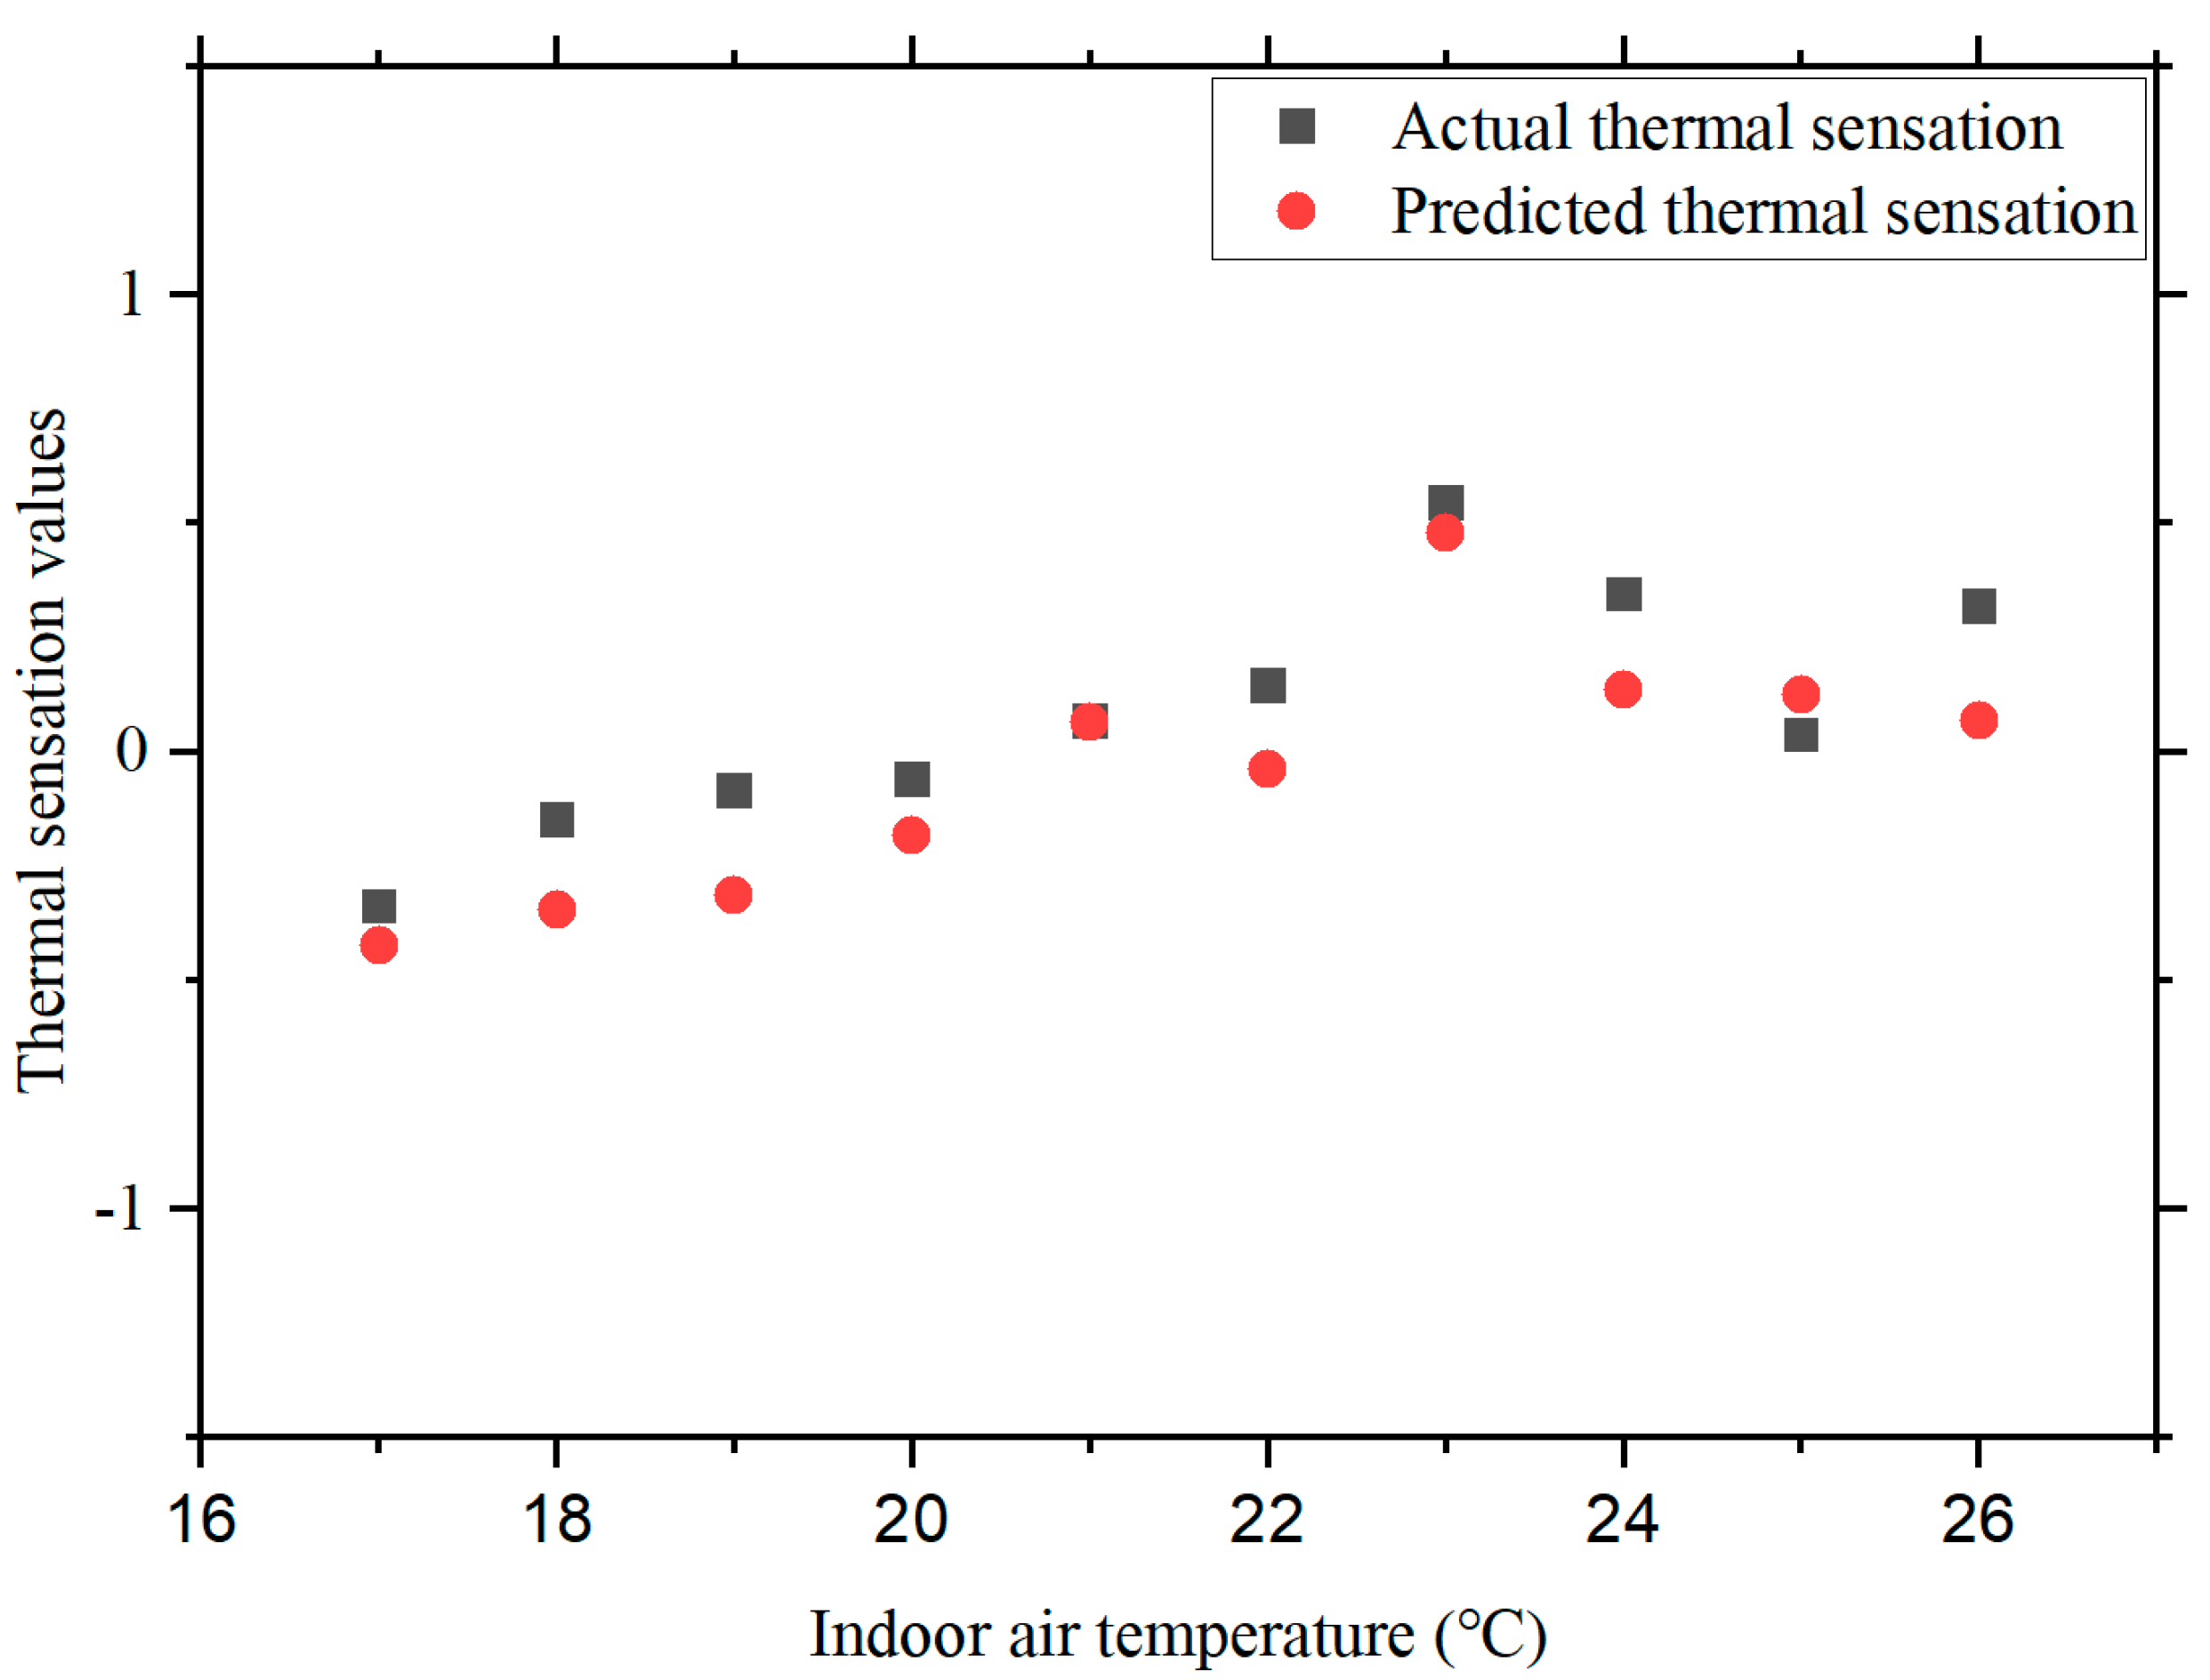
3.7.1. Local and Overall Thermal Sensations
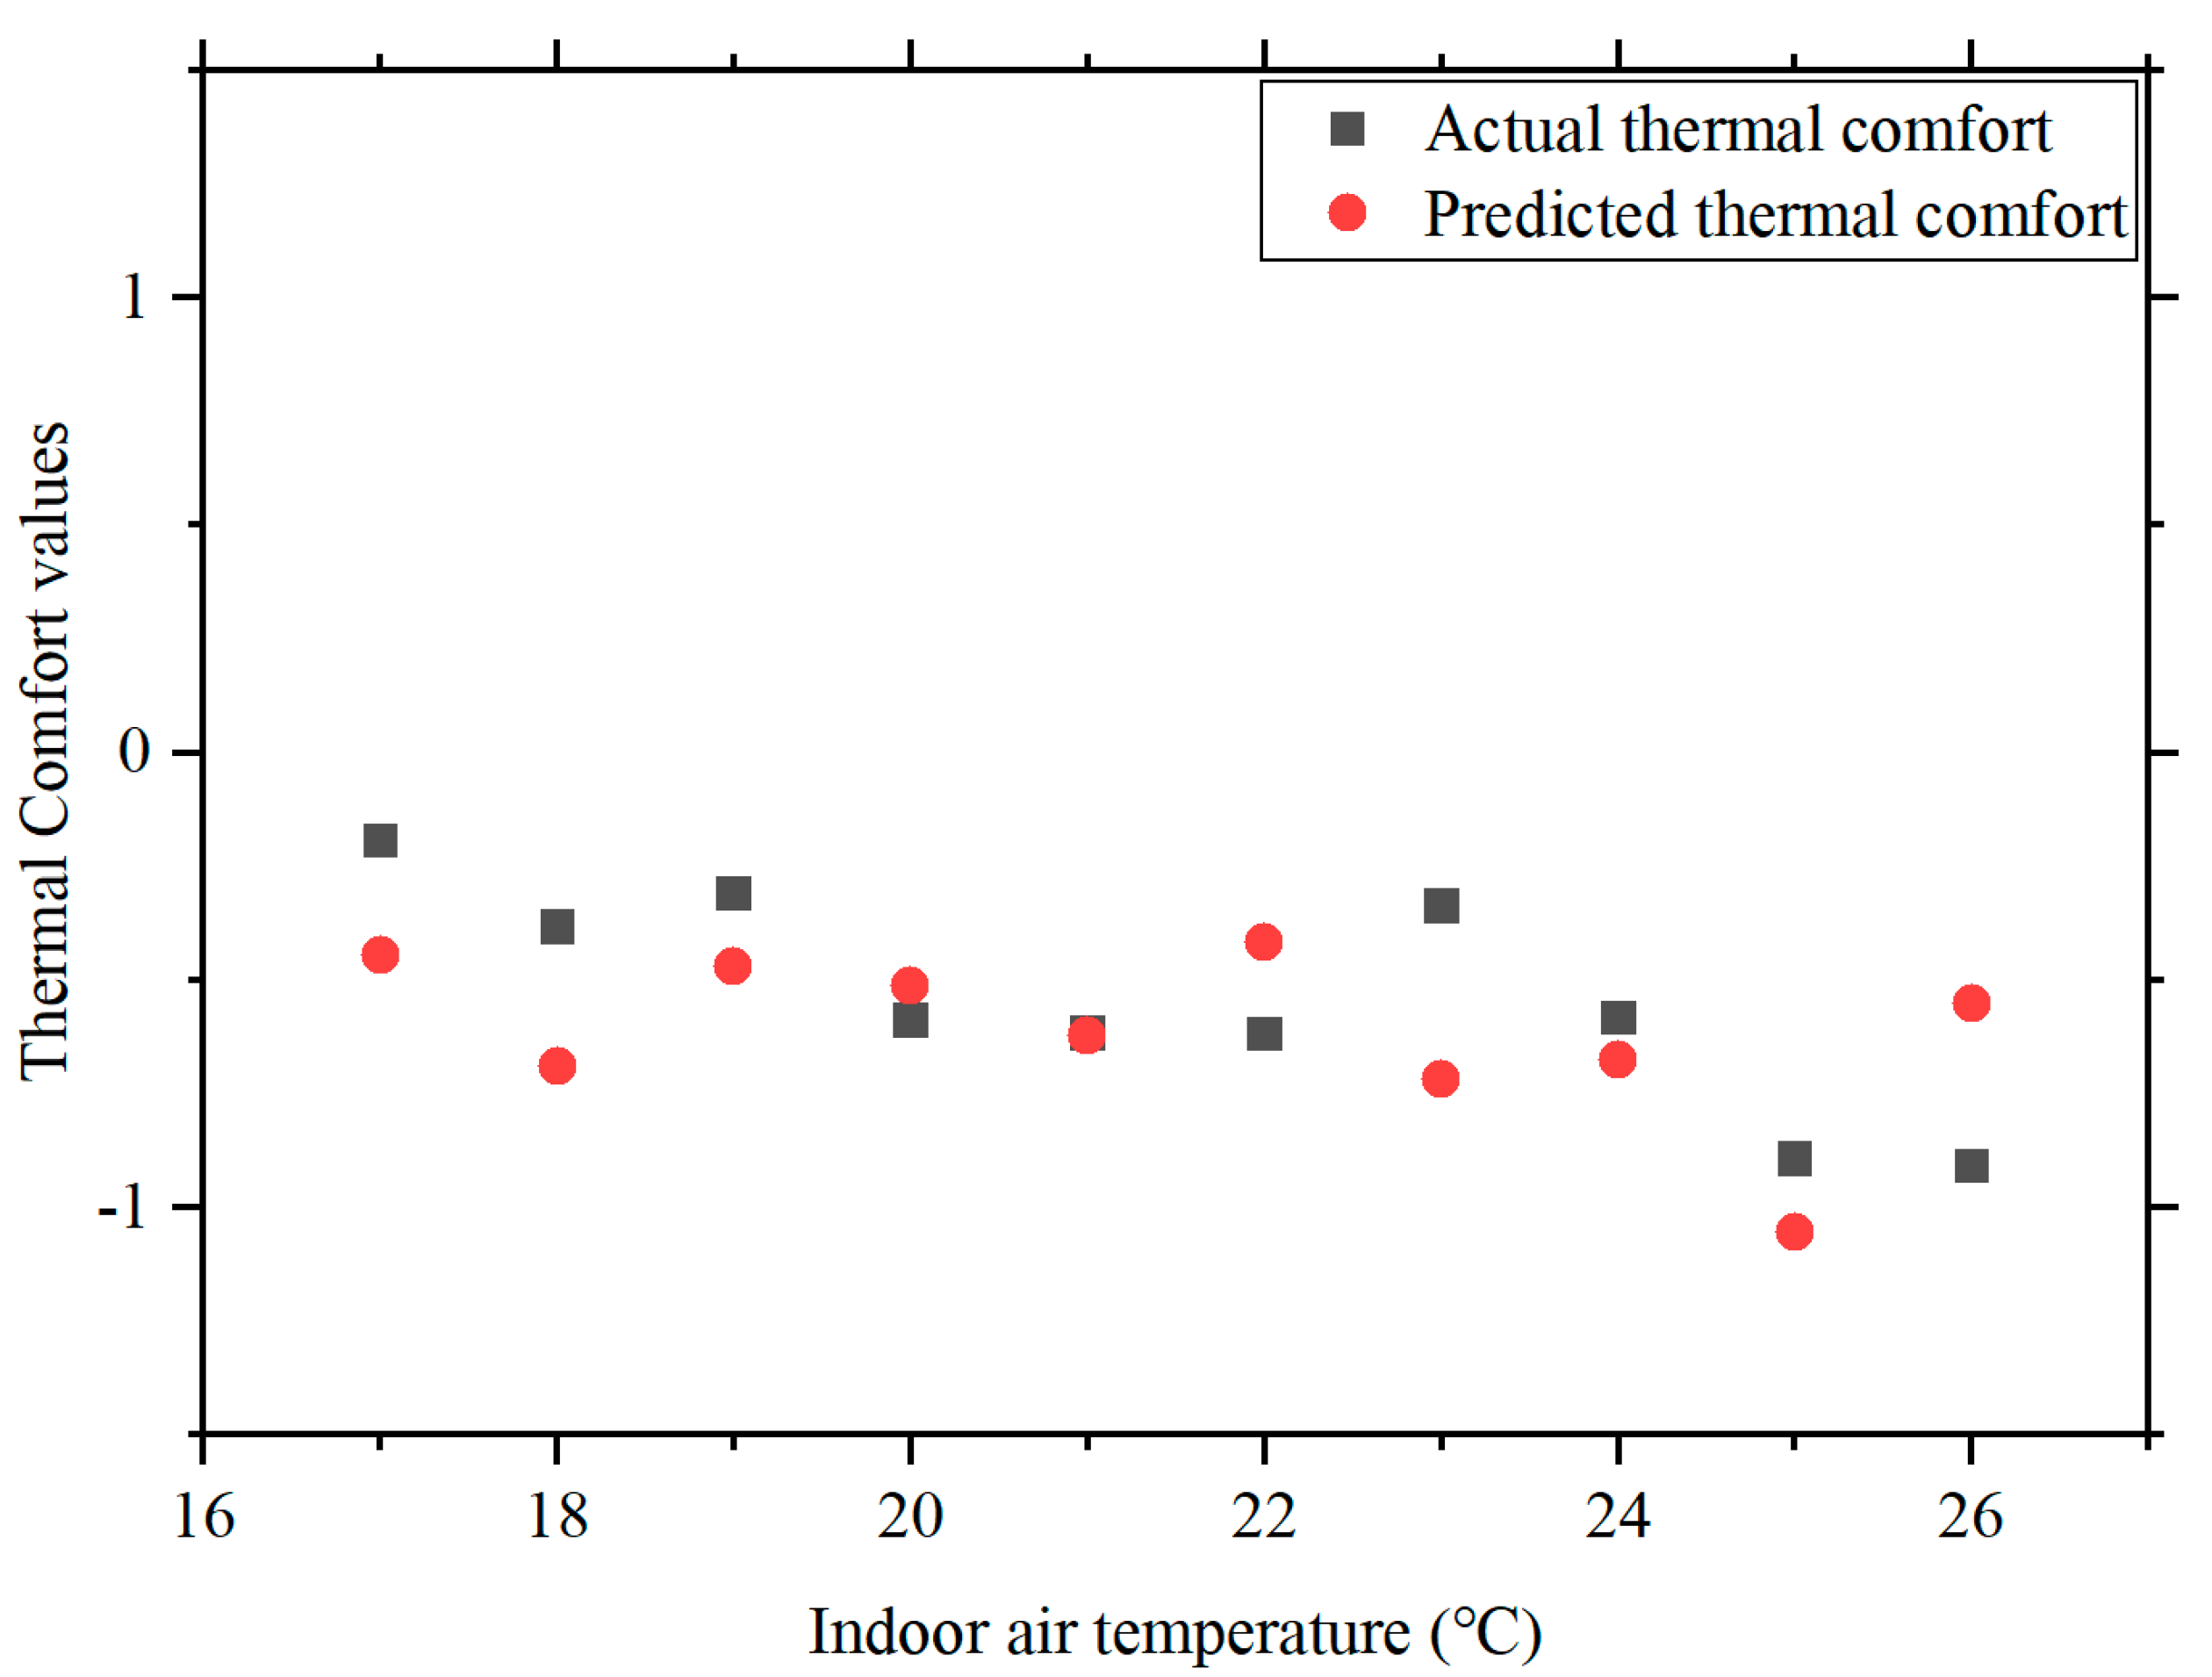
3.7.2. Local and Overall Thermal Comfort
4. Discussion
5. Conclusions
Author Contributions
Funding
Data Availability Statement
Acknowledgments
Conflicts of Interest
References
- ASHRAE Standard 55; Thermal Environment Conditions for Human Occupancy. American Society of Heating, Refriger ation and Air-conditioning Engineers: Atlanta, GA, USA, 2017.
- Yang, H.; Deng, Y.; Cao, B.; Zhu, Y. Study on the local and overall thermal perceptions under nonuniform thermal exposure using a cooling chair. Build. Environ. 2020, 176, 106864. [Google Scholar] [CrossRef]
- Xiong, W.; Wang, Y.; Mathiesen, B.V.; Lund, H.; Zhang, X. Heat roadmap China: New heat strategy to reduce energy consumption towards 2030. Energy 2015, 81, 274–285. [Google Scholar] [CrossRef]
- Nilsson, H.O. Thermal comfort evaluation with virtual manikin methods. Build. Environ. 2007, 42, 4000–4005. [Google Scholar] [CrossRef]
- Park, S.; Hellwig, R.T.; Grün, G.; Holm, A. Local and overall thermal comfort in an aircraft cabin and their interrelations. Build. Environ. 2011, 46, 1056–1064. [Google Scholar] [CrossRef]
- Hu, J.; He, Y.; Wang, Q.; Wang, B.; Hao, X.; Li, N.; Yin, W.; Liu, L. Resilient or resistant to non-neutral environments? A comparative study on occupant thermal needs in buildings under natural ventilation, fee-free heating, and fee-charged heating modes. J. Build. Eng. 2023, 72, 106651. [Google Scholar] [CrossRef]
- Hu, J.; He, Y.; Hao, X.; Li, N.; Su, Y.; Qu, H. Optimal temperature ranges considering gender differences in thermal comfort, work performance, and sick building syndrome: A winter field study in university classrooms. Energy Build. 2022, 254, 111554. [Google Scholar] [CrossRef]
- Zhang, H.; Arens, E.; Huizenga, C.; Han, T. Thermal sensation and comfort models for non-uniform and transient environments: Part I: Local sensation of individual body parts. Build. Environ. 2010, 45, 380–388. [Google Scholar] [CrossRef]
- Arens, E.; Zhang, H.; Huizenga, C. Partial- and whole-body thermal sensation and comfort—Part II: Non-uniform environmental conditions. J. Therm. Biol. 2006, 31, 60–66. [Google Scholar] [CrossRef]
- Jin, Q.; Li, X.; Duanmu, L.; Shu, H.; Sun, Y.; Ding, Q. Predictive model of local and overall thermal sensations for non-uniform environments. Build. Environ. 2012, 51, 330–344. [Google Scholar] [CrossRef]
- He, Y.; Wang, X.; Li, N.; He, M.; He, D. Heating chair assisted by leg-warmer: A potential way to achieve better thermal comfort and greater energy conservation in winter. Energy Build. 2018, 158, 1106–1116. [Google Scholar] [CrossRef]
- Yang, H.; Cao, B.; Zhu, Y. Study on the effects of chair heating in cold indoor environments from the perspective of local thermal sensation. Energy Build. 2018, 180, 16–28. [Google Scholar] [CrossRef]
- He, Y.; Wang, X.; Li, N.; He, M.; He, D.; Wang, K. Cooling ceiling assisted by desk fans for comfort in hot-humid environment. Build. Environ. 2017, 122, 23–34. [Google Scholar] [CrossRef]
- Ren, Z.; Gao, X.; Xiao, Y.; Liu, Y. Thermal comfort and energy conservation of a four-sided enclosed local heating device in a cold environment. Build. Environ. 2023, 228, 109837. [Google Scholar] [CrossRef]
- Aryal, A.; Becerik-Gerber, B. A comparative study of predicting individual thermal sensation and satisfaction using wrist-worn temperature sensor, thermal camera and ambient temperature sensor. Build. Environ. 2019, 160, 106223. [Google Scholar] [CrossRef]
- Echarri-Iribarren, V.; Wong, N.H.; Sánchez-Ostiz, A. Radiant Floors versus Radiant Walls Using Ceramic Thermal Panels in Mediterranean Dwellings: Annual Energy Demand and Cost-Effective Analysis. Sustainability 2021, 13, 588. [Google Scholar] [CrossRef]
- Tang, J.; Liu, Y.; Du, H.; Lan, L.; Sun, Y.; Wu, J. The effects of portable cooling systems on thermal comfort and work performance in a hot environment. Build. Simul. 2021, 14, 1667–1683. [Google Scholar] [CrossRef]
- Zhang, J.; Zhou, X.; Lei, S.; Luo, M. Energy and comfort performance of occupant-centric air conditioning strategy in office buildings with personal comfort devices. Build. Simul. 2021, 15, 899–911. [Google Scholar] [CrossRef]
- Zhang, H.; Huizenga, C.; Arens, E.; Wang, D. Thermal sensation and comfort in transient non-uniform thermal environments. Eur. J. Appl. Physiol. 2004, 92, 728–733. [Google Scholar] [CrossRef] [PubMed]
- Fang, Z.; Liu, H.; Li, B.; Tan, M.; Olaide, O.M. Experimental investigation on thermal comfort model between local thermal sensation and overall thermal sensation. Energy Build. 2018, 158, 1286–1295. [Google Scholar] [CrossRef]
- Khiavi, N.M.; Maerefat, M.; Zolfaghari, S.A. Assessment of overall body thermal sensation based on the thermal response of local cutaneous thermoreceptors. J. Therm. Biol. 2019, 83, 187–194. [Google Scholar] [CrossRef]
- Jian, Y.; Hou, Y.; Liu, W.; Chang, X. How the coldest local thermal sensation affects overall thermal sensation after turning on the air conditioning—Evidence from chamber experiments. Build. Environ. 2022, 191, 107589. [Google Scholar] [CrossRef]
- Liu, F.; Huang, Y.; Zhang, L.; Li, G. Marine environmental pollution, aquatic products trade and marine fishery Economy—An empirical analysis based on simultaneous equation model. Ocean Coast. Manag. 2022, 222, 106096. [Google Scholar] [CrossRef]
- Sun, Y.; Zhang, H.; Yan, Y.; Lan, L.; Cao, T.; Lian, Z.; Fan, X.; Wargocki, P.; Zhu, J.; Xu, X. Comparison of wrist skin temperature with mean skin temperature calculated with Hardy and Dubois’s seven-point method while sleeping. Energy Build. 2022, 259, 111894. [Google Scholar] [CrossRef]
- Li, W.; Chen, J.; Lan, F.; Xie, H. Human thermal sensation and its algorithmic modelization under dynamic environmental thermal characteristics of vehicle cabin. Indoor Air 2022, 32, e13168. [Google Scholar] [CrossRef] [PubMed]
- Du, C.; Liu, H.; Li, C.; Xiong, J.; Li, B.; Li, G.; Xi, Z. Demand and efficiency evaluations of local convective heating to human feet and low body parts in cold environments. Build. Environ. 2020, 171, 106662. [Google Scholar] [CrossRef]
- Cheng, X.; Yang, B.; Tan, K.; Isaksson, E.; Li, L.; Hedman, A.; Olofsson, T.; Li, H. A Contactless Measuring Method of Skin Temperature based on the Skin Sensitivity Index and Deep Learning. Appl. Sci. 2019, 9, 1375. [Google Scholar] [CrossRef]
- Jia, M.; Choi, J.-H.; Liu, H.; Susman, G. Development of facial-skin temperature driven thermal comfort and sensation modeling for a futuristic application. Build. Environ. 2022, 207, 108479. [Google Scholar] [CrossRef]
- Shahzad, S.; Calautit, J.K.; Aquino, A.I.; Nasir, D.S.; Hughes, B.R. A user-controlled thermal chair for an open plan workplace: CFD and field studies of thermal comfort performance. Appl. Energy 2017, 207, 283–293. [Google Scholar] [CrossRef]
- Kim, J.; Bauman, F.; Raftery, P.; Arens, E.; Zhang, H.; Fierro, G.; Andersen, M.; Culler, D. Occupant comfort and behavior: High-resolution data from a 6-month field study of personal comfort systems with 37 real office workers. Build. Environ. 2019, 148, 348–360. [Google Scholar] [CrossRef]
- Chen, X.; Xue, P.; Gao, L.; Du, J.; Liu, J. Physiological and thermal response to real-life transient conditions during winter in severe cold area. Build. Environ. 2019, 157, 284–296. [Google Scholar] [CrossRef]
- He, Y.; Li, N.; Huang, Q. A field study on thermal environment and occupant local thermal sensation in offices with cooling ceiling in Zhuhai, China. Energy Build. 2015, 102, 277–283. [Google Scholar] [CrossRef]
- He, Y.; Li, N.; Zhang, W.; Peng, J. Overall and local thermal sensation & comfort in air-conditioned dormitory with hot-humid climate. Build. Environ. 2016, 101, 102–109. [Google Scholar] [CrossRef]
- He, Y.; Zhang, H.; Arens, E.; Merritt, A.; Huizenga, C.; Levinson, R.; Wang, A.; Ghahramani, A.; Alvarez-Suarez, A. Smart detection of indoor occupant thermal state via infrared thermography, computer vision, and machine learning. Build. Environ. 2023, 228, 109811. [Google Scholar] [CrossRef]
- Zhang, Q.; Yang, H. Typical Meteorological Database Handbook for Buildings; China Building Industry Press: Beijing, China, 2012. [Google Scholar]
- 0OpenStreetMap (CCBY-SA2.0), Licences: Commons Attribution ShareAlike 2.0. Available online: https://www.openstreetmap.org (accessed on 20 March 2024).
- He, Y. Research on Characteristics of Thermal Comfort and Energy-Use Behaviors of Occupants with Personal Comfort Systems. Ph.D. Thesis, Hunan University, Changsha, Hunan, April 2019. [Google Scholar]
- Cao, Y.; Lei, T.-H.; Wang, F.; Yang, B.; Mündel, T. Head, Face and Neck Cooling as Per-cooling (Cooling During Exercise) Modalities to Improve Exercise Performance in the Heat: A Narrative Review and Practical Applications. Sports Med.-Open 2022, 8, 16. [Google Scholar] [CrossRef]
- Lv, S.; He, W.; Wang, L.; Li, G.; Ji, J.; Chen, H.; Zhang, G. Design, fabrication and feasibility analysis of a thermo-electric wearable helmet. Appl. Therm. Eng. 2016, 109, 138–146. [Google Scholar] [CrossRef]


| Type | Parameter | Instrument | Models | Range | Accuracy |
|---|---|---|---|---|---|
| Environmental | Air temperature | Temp. and humidity recorder | TR-72Ui | −10~60°C | ±0.3 °C |
| Relative humidity | Temp. and humidity recorder | TR-72Ui | 10–90% | ±5% | |
| Physiological | Skin temperature | Thermocouple | 905 12 | −50~350 °C | 0.1 °C |
| Heart rate/SpO2 | Oximeter | YX303 | 70–100% | ±2% |
| Voting Scale | Thermal Sensation | Thermal Comfort | Thermal Acceptability |
|---|---|---|---|
| 3 | Hot | Very comfortable | |
| 2 | Warm | Comfortable | |
| 1 | Slightly warm | Slightly comfortable | Acceptable |
| 0 | Neutral | Neutral | Unacceptable |
| −1 | Slightly cool | Slightly uncomfortable | |
| −2 | Cool | Uncomfortable | |
| −3 | Cold | Very uncomfortable |
| Information | Range | Percentage (Overall %) | Percentage (Male %) | Percentage (Female %) |
|---|---|---|---|---|
| Age | 16–18 | 42.4 | 23.1 | 19.4 |
| 19–21 | 41.3 | 19.9 | 21.4 | |
| 22–24 | 9.0 | 4.3 | 4.7 | |
| >24 | 7.3 | 2.8 | 4.5 | |
| Hight | <160 | 16.4 | 0.1 | 16.4 |
| 160–170 | 40.8 | 10.8 | 30.0 | |
| 170–180 | 33.1 | 29.6 | 3.5 | |
| 180–190 | 9.3 | 9.2 | 0.1 | |
| >190 | 0.3 | 0.3 | 0.0 | |
| Weight | <50 | 16.0 | 1.0 | 15.0 |
| 50–60 | 43.0 | 15.2 | 27.8 | |
| 60–70 | 26.5 | 20.5 | 6.1 | |
| 70–80 | 11.1 | 10.3 | 0.8 | |
| >80 | 1.5 | 1.3 | 0.2 | |
| BMI | <18.4 | 19.4 | 9.0 | 10.4 |
| 18.5–23.9 | 70.1 | 32.9 | 37.2 | |
| 24.0–27.9 | 9.7 | 7.7 | 2.1 | |
| >28 | 0.8 | 0.6 | 0.2 |
| Air Temperature (°C) | Actual Value | Predicted Value |
|---|---|---|
| 17 | −0.34 | −0.42 |
| 18 | −0.15 | −0.35 |
| 19 | −0.09 | −0.32 |
| 20 | −0.06 | −0.18 |
| 21 | 0.07 | 0.07 |
| 22 | 0.14 | −0.04 |
| 23 | 0.54 | 0.48 |
| 24 | 0.34 | 0.14 |
| 25 | 0.04 | 0.13 |
| 26 | 0.32 | 0.07 |
| Air Temperature (°C) | Actual Value | Predicted Value |
|---|---|---|
| 17 | −0.19 | −0.45 |
| 18 | −0.38 | −0.69 |
| 19 | −0.31 | −0.47 |
| 20 | −0.59 | −0.51 |
| 21 | −0.62 | −0.62 |
| 22 | −0.62 | −0.42 |
| 23 | −0.34 | −0.72 |
| 24 | −0.58 | −0.68 |
| 25 | −0.89 | −1.05 |
| 26 | −0.91 | −0.55 |
Disclaimer/Publisher’s Note: The statements, opinions and data contained in all publications are solely those of the individual author(s) and contributor(s) and not of MDPI and/or the editor(s). MDPI and/or the editor(s) disclaim responsibility for any injury to people or property resulting from any ideas, methods, instructions or products referred to in the content. |
© 2024 by the authors. Licensee MDPI, Basel, Switzerland. This article is an open access article distributed under the terms and conditions of the Creative Commons Attribution (CC BY) license (https://creativecommons.org/licenses/by/4.0/).
Share and Cite
Liang, X.; He, Y.; Li, N.; Yin, Y.; Hu, J. A Field Investigation to Quantify the Correlation between Local and Overall Thermal Comfort in Cool Environments. Buildings 2024, 14, 1171. https://doi.org/10.3390/buildings14041171
Liang X, He Y, Li N, Yin Y, Hu J. A Field Investigation to Quantify the Correlation between Local and Overall Thermal Comfort in Cool Environments. Buildings. 2024; 14(4):1171. https://doi.org/10.3390/buildings14041171
Chicago/Turabian StyleLiang, Xiaohong, Yingdong He, Nianping Li, Yicheng Yin, and Jinhua Hu. 2024. "A Field Investigation to Quantify the Correlation between Local and Overall Thermal Comfort in Cool Environments" Buildings 14, no. 4: 1171. https://doi.org/10.3390/buildings14041171