
Volume Stability and Mechanical Properties of Cement Paste Containing Natural Fibers from Phragmites-Australis Plant at Elevated Temperature


Abstract
:1. Introduction
2. Materials and Methods
2.1. Raw Materials
2.2. Paste Specimen Preparation
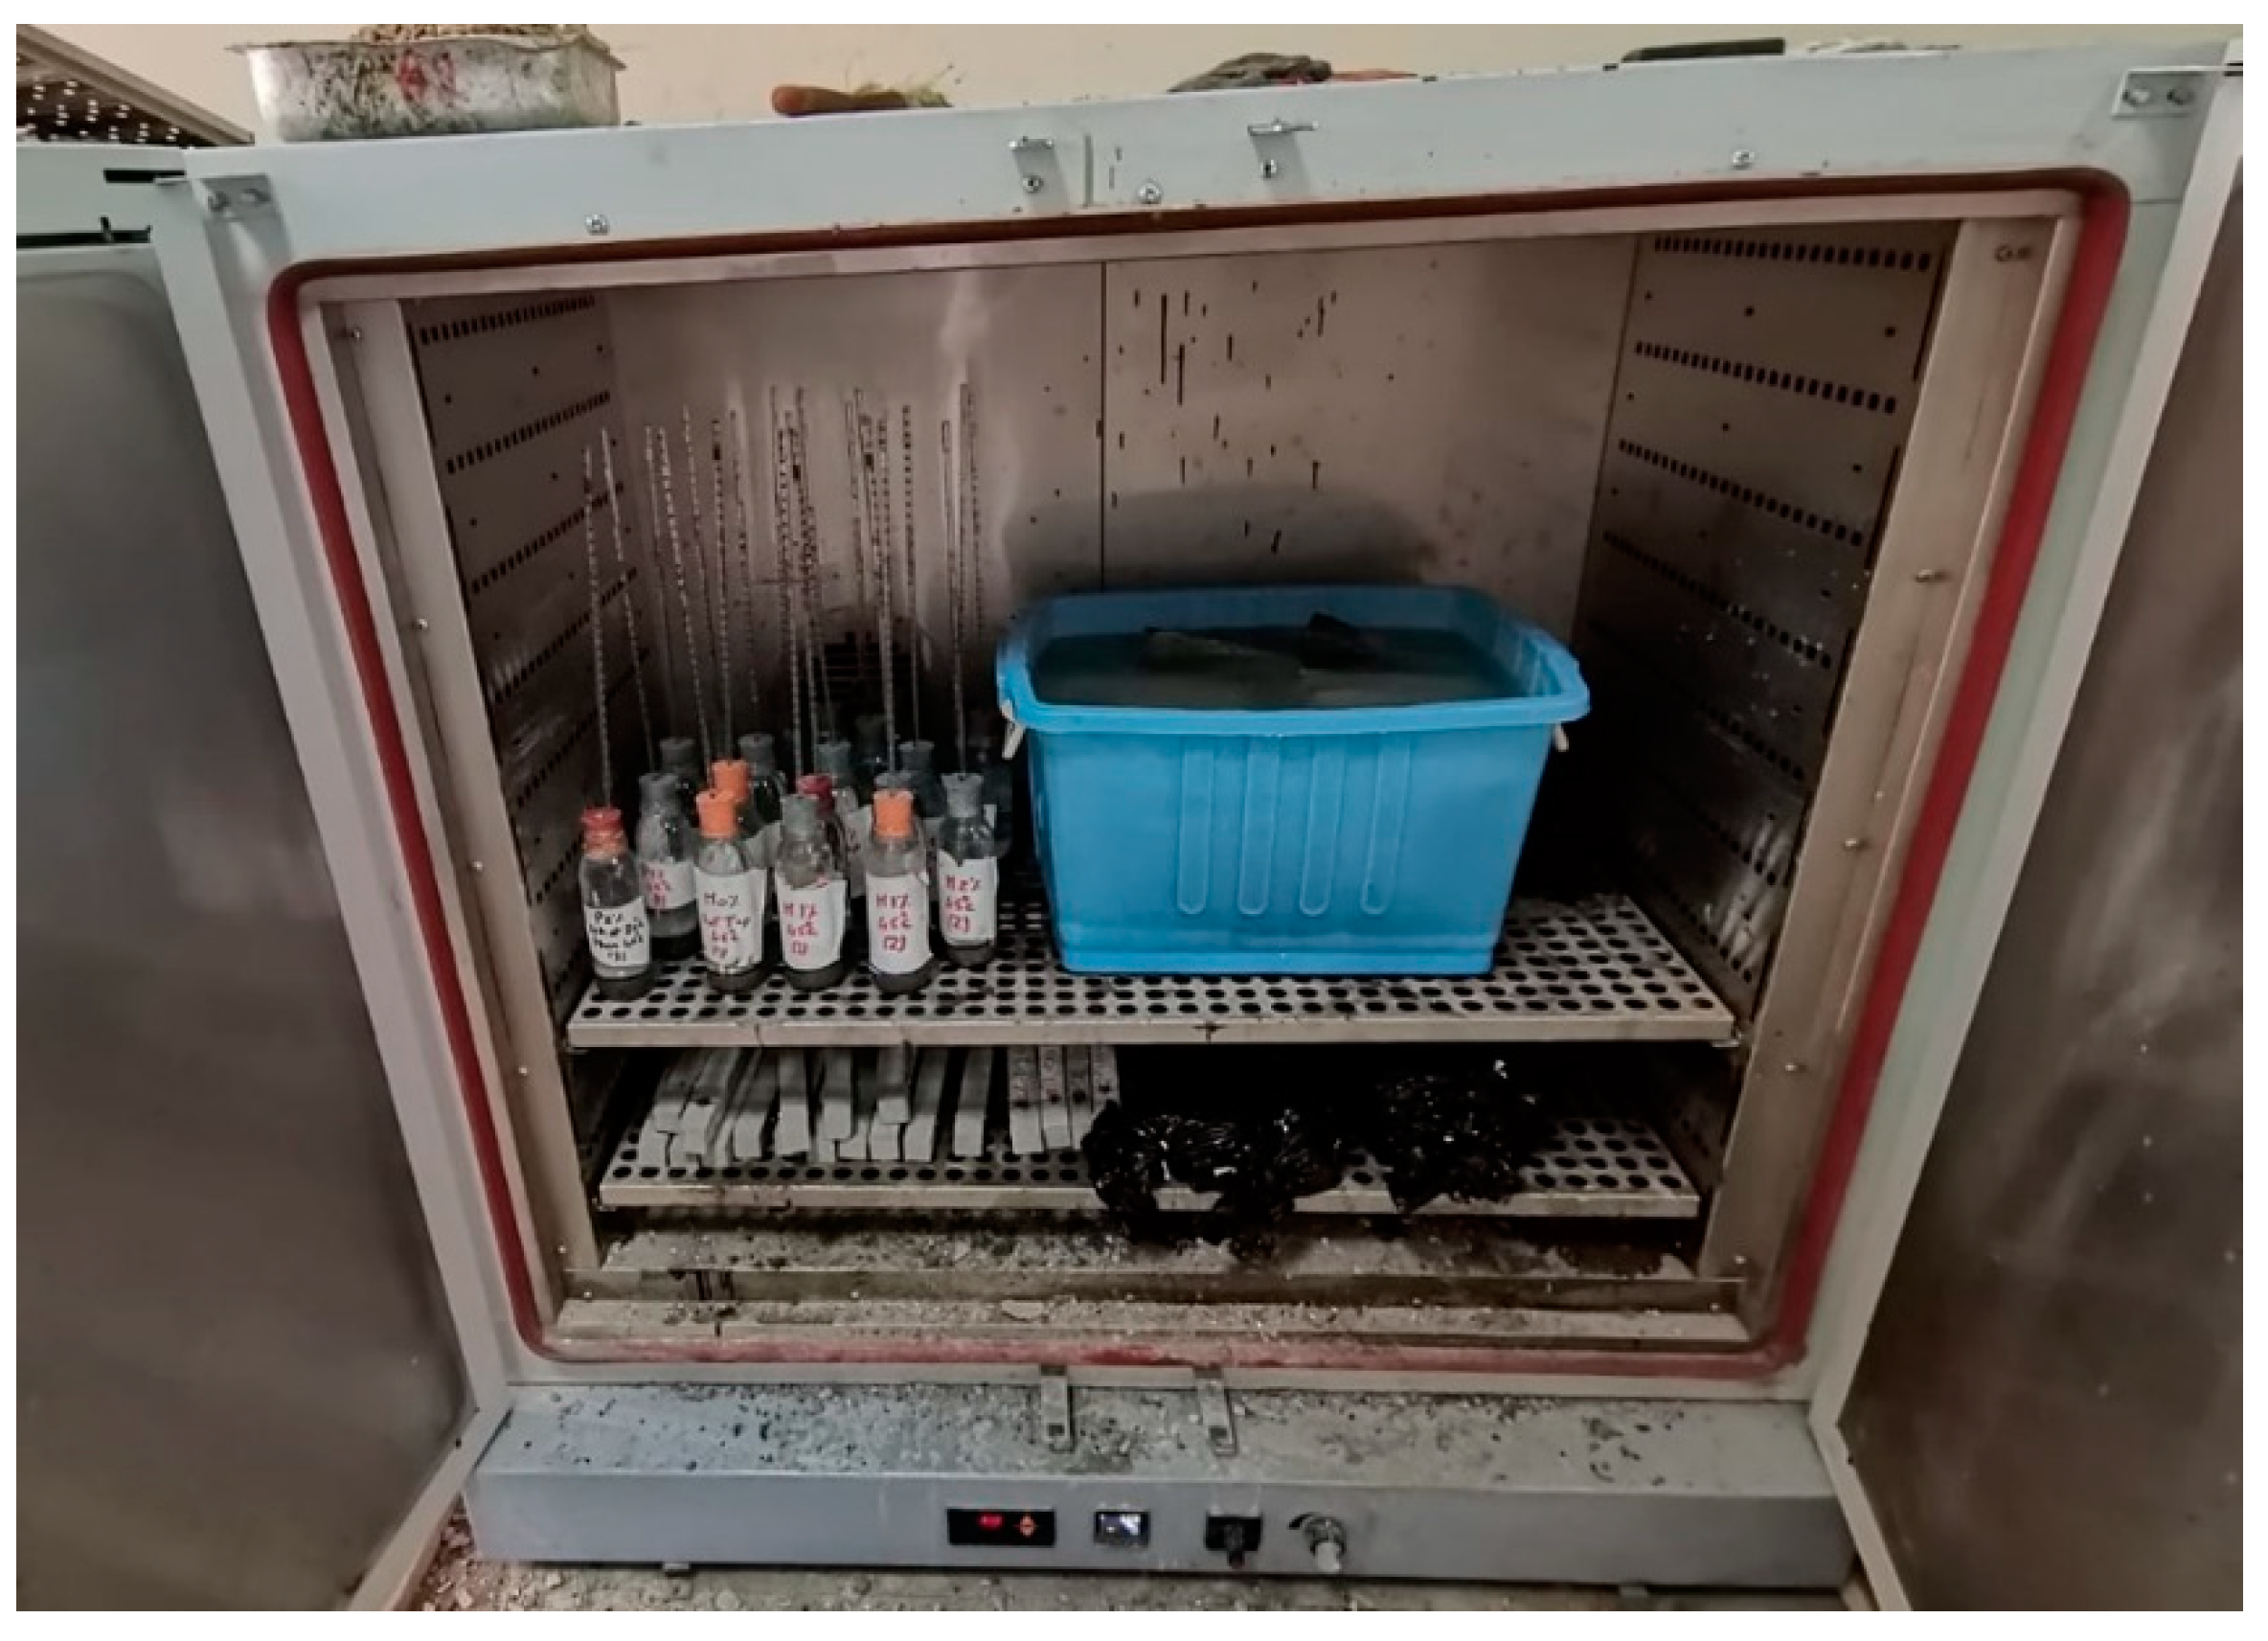
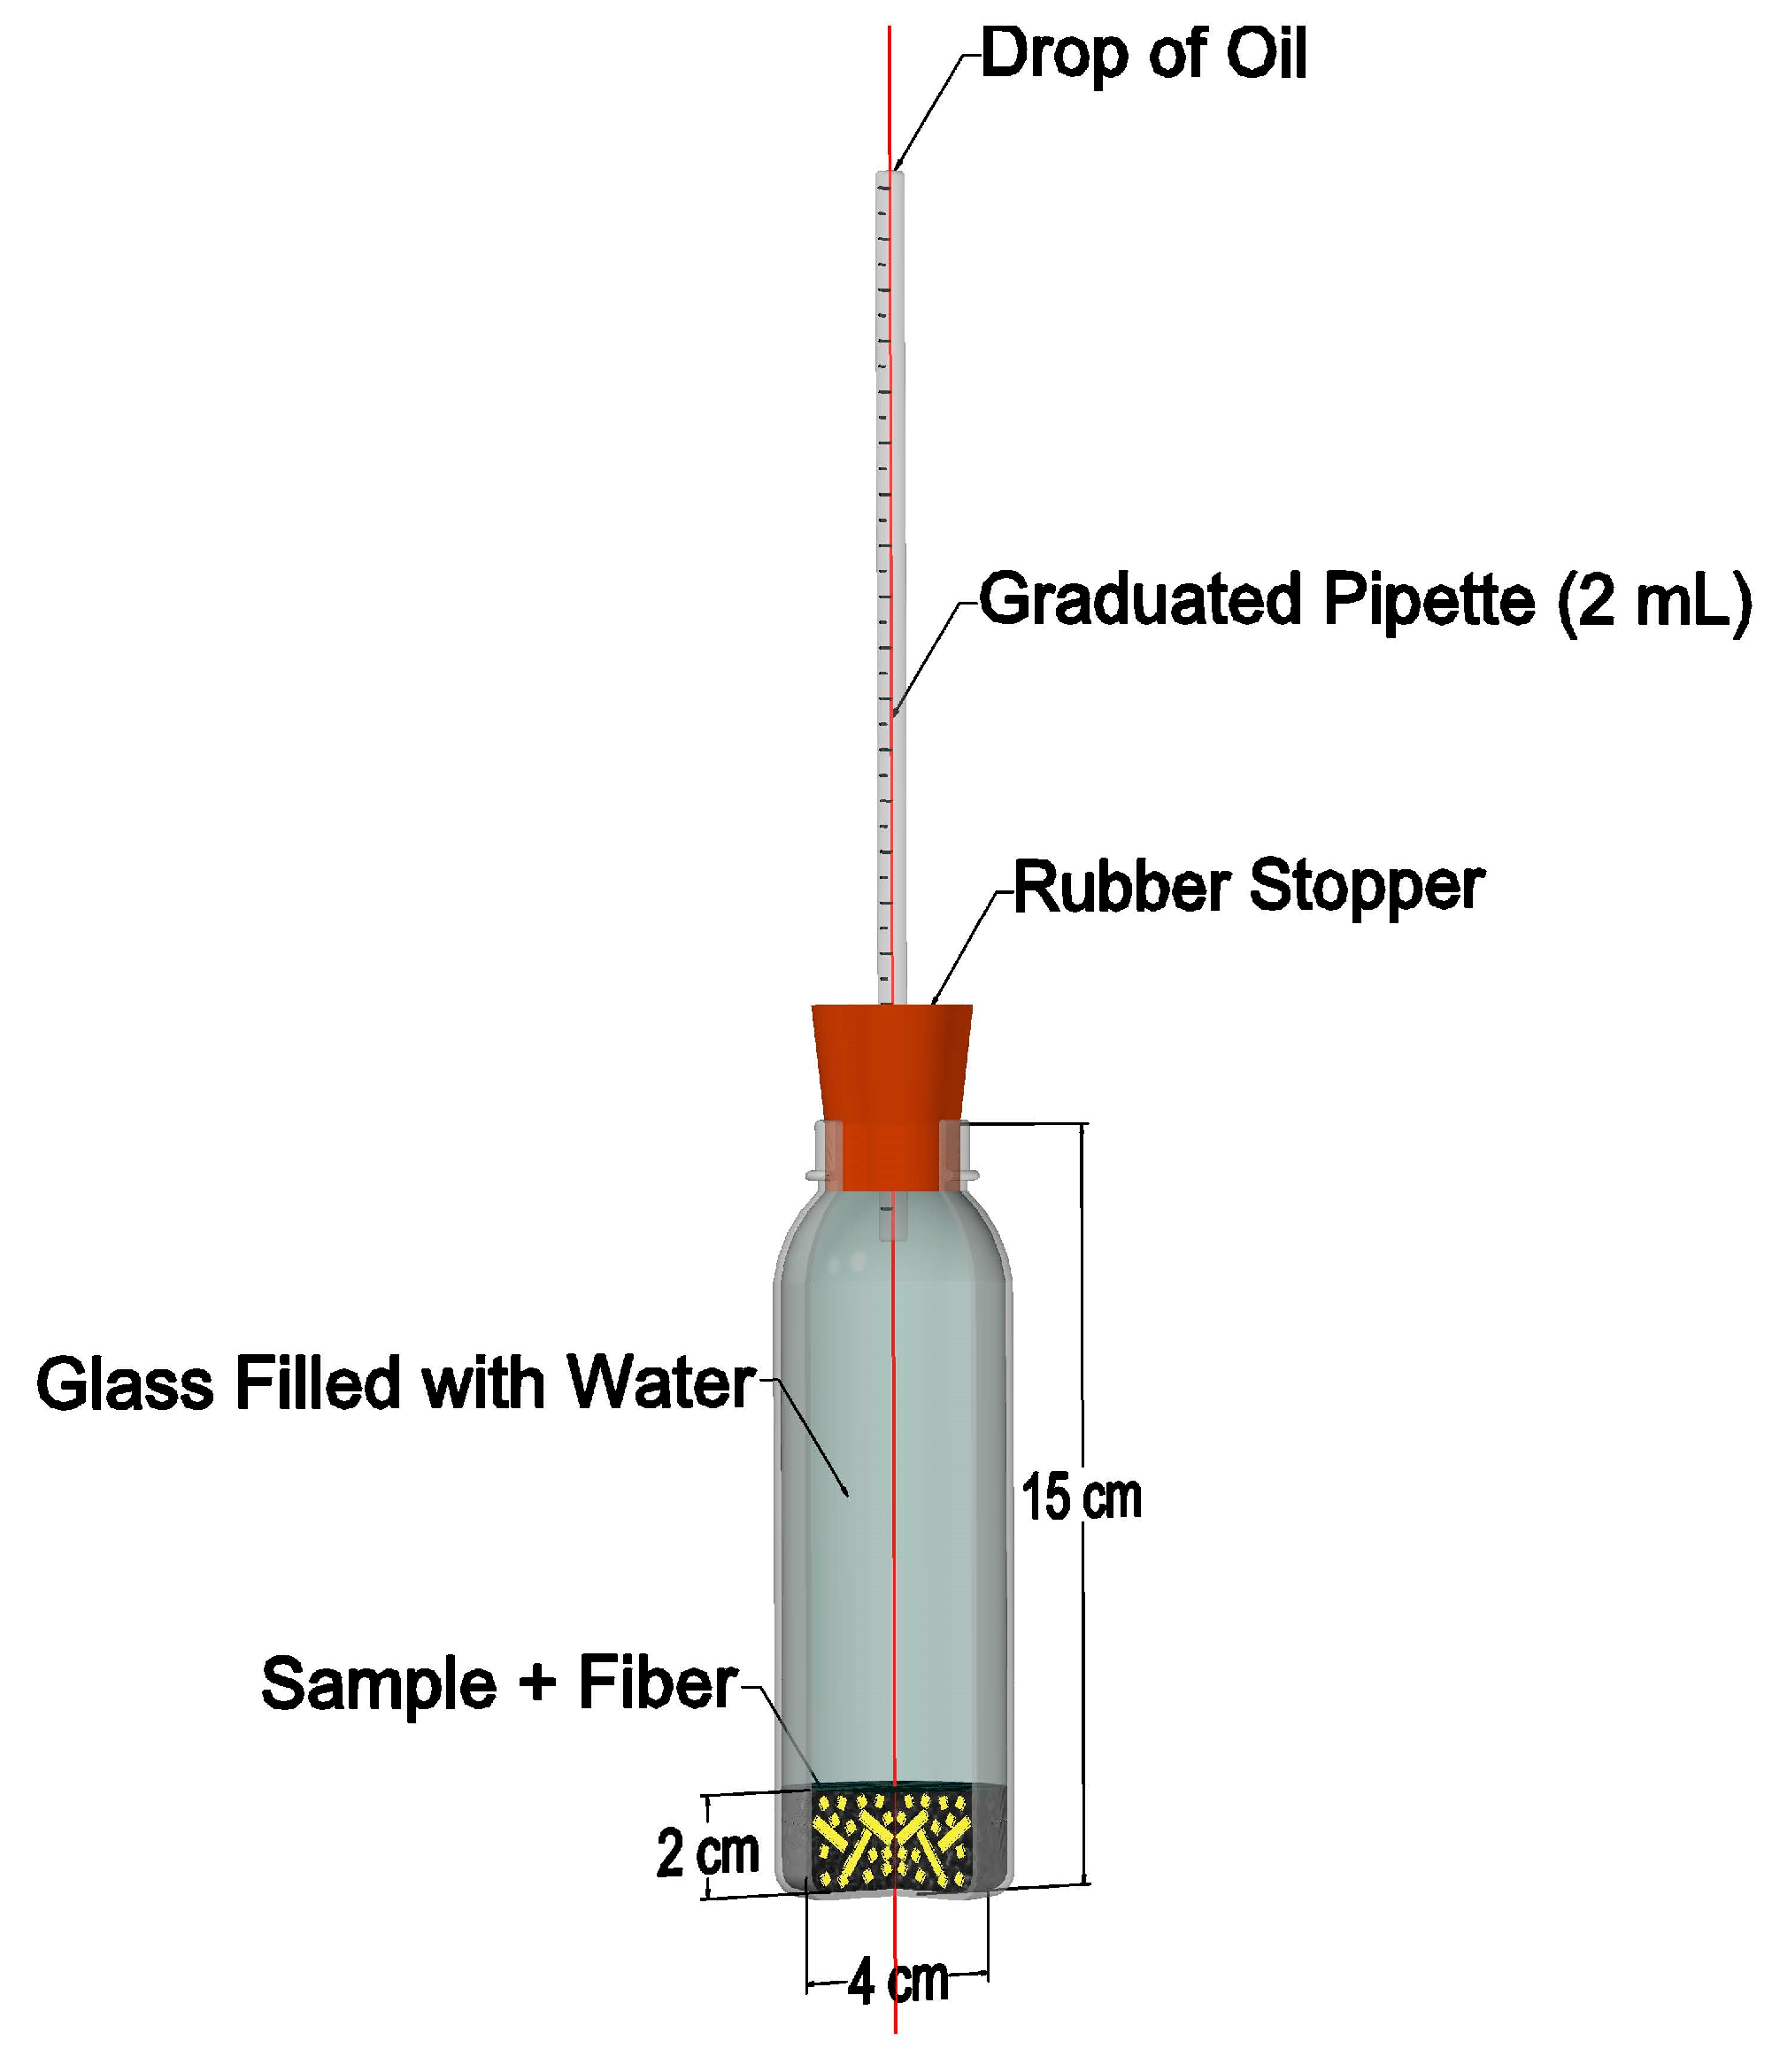
2.3. Testing Procedure
- ΔL = change in the length at time (t);
- L = initial length of the sample;
- ΔV = change in the volume in the pipette at time (t);
- V = initial volume of the sample.
- P = maximum load;
- L = prism length;
- b = prism width;
- d = prism thickness.
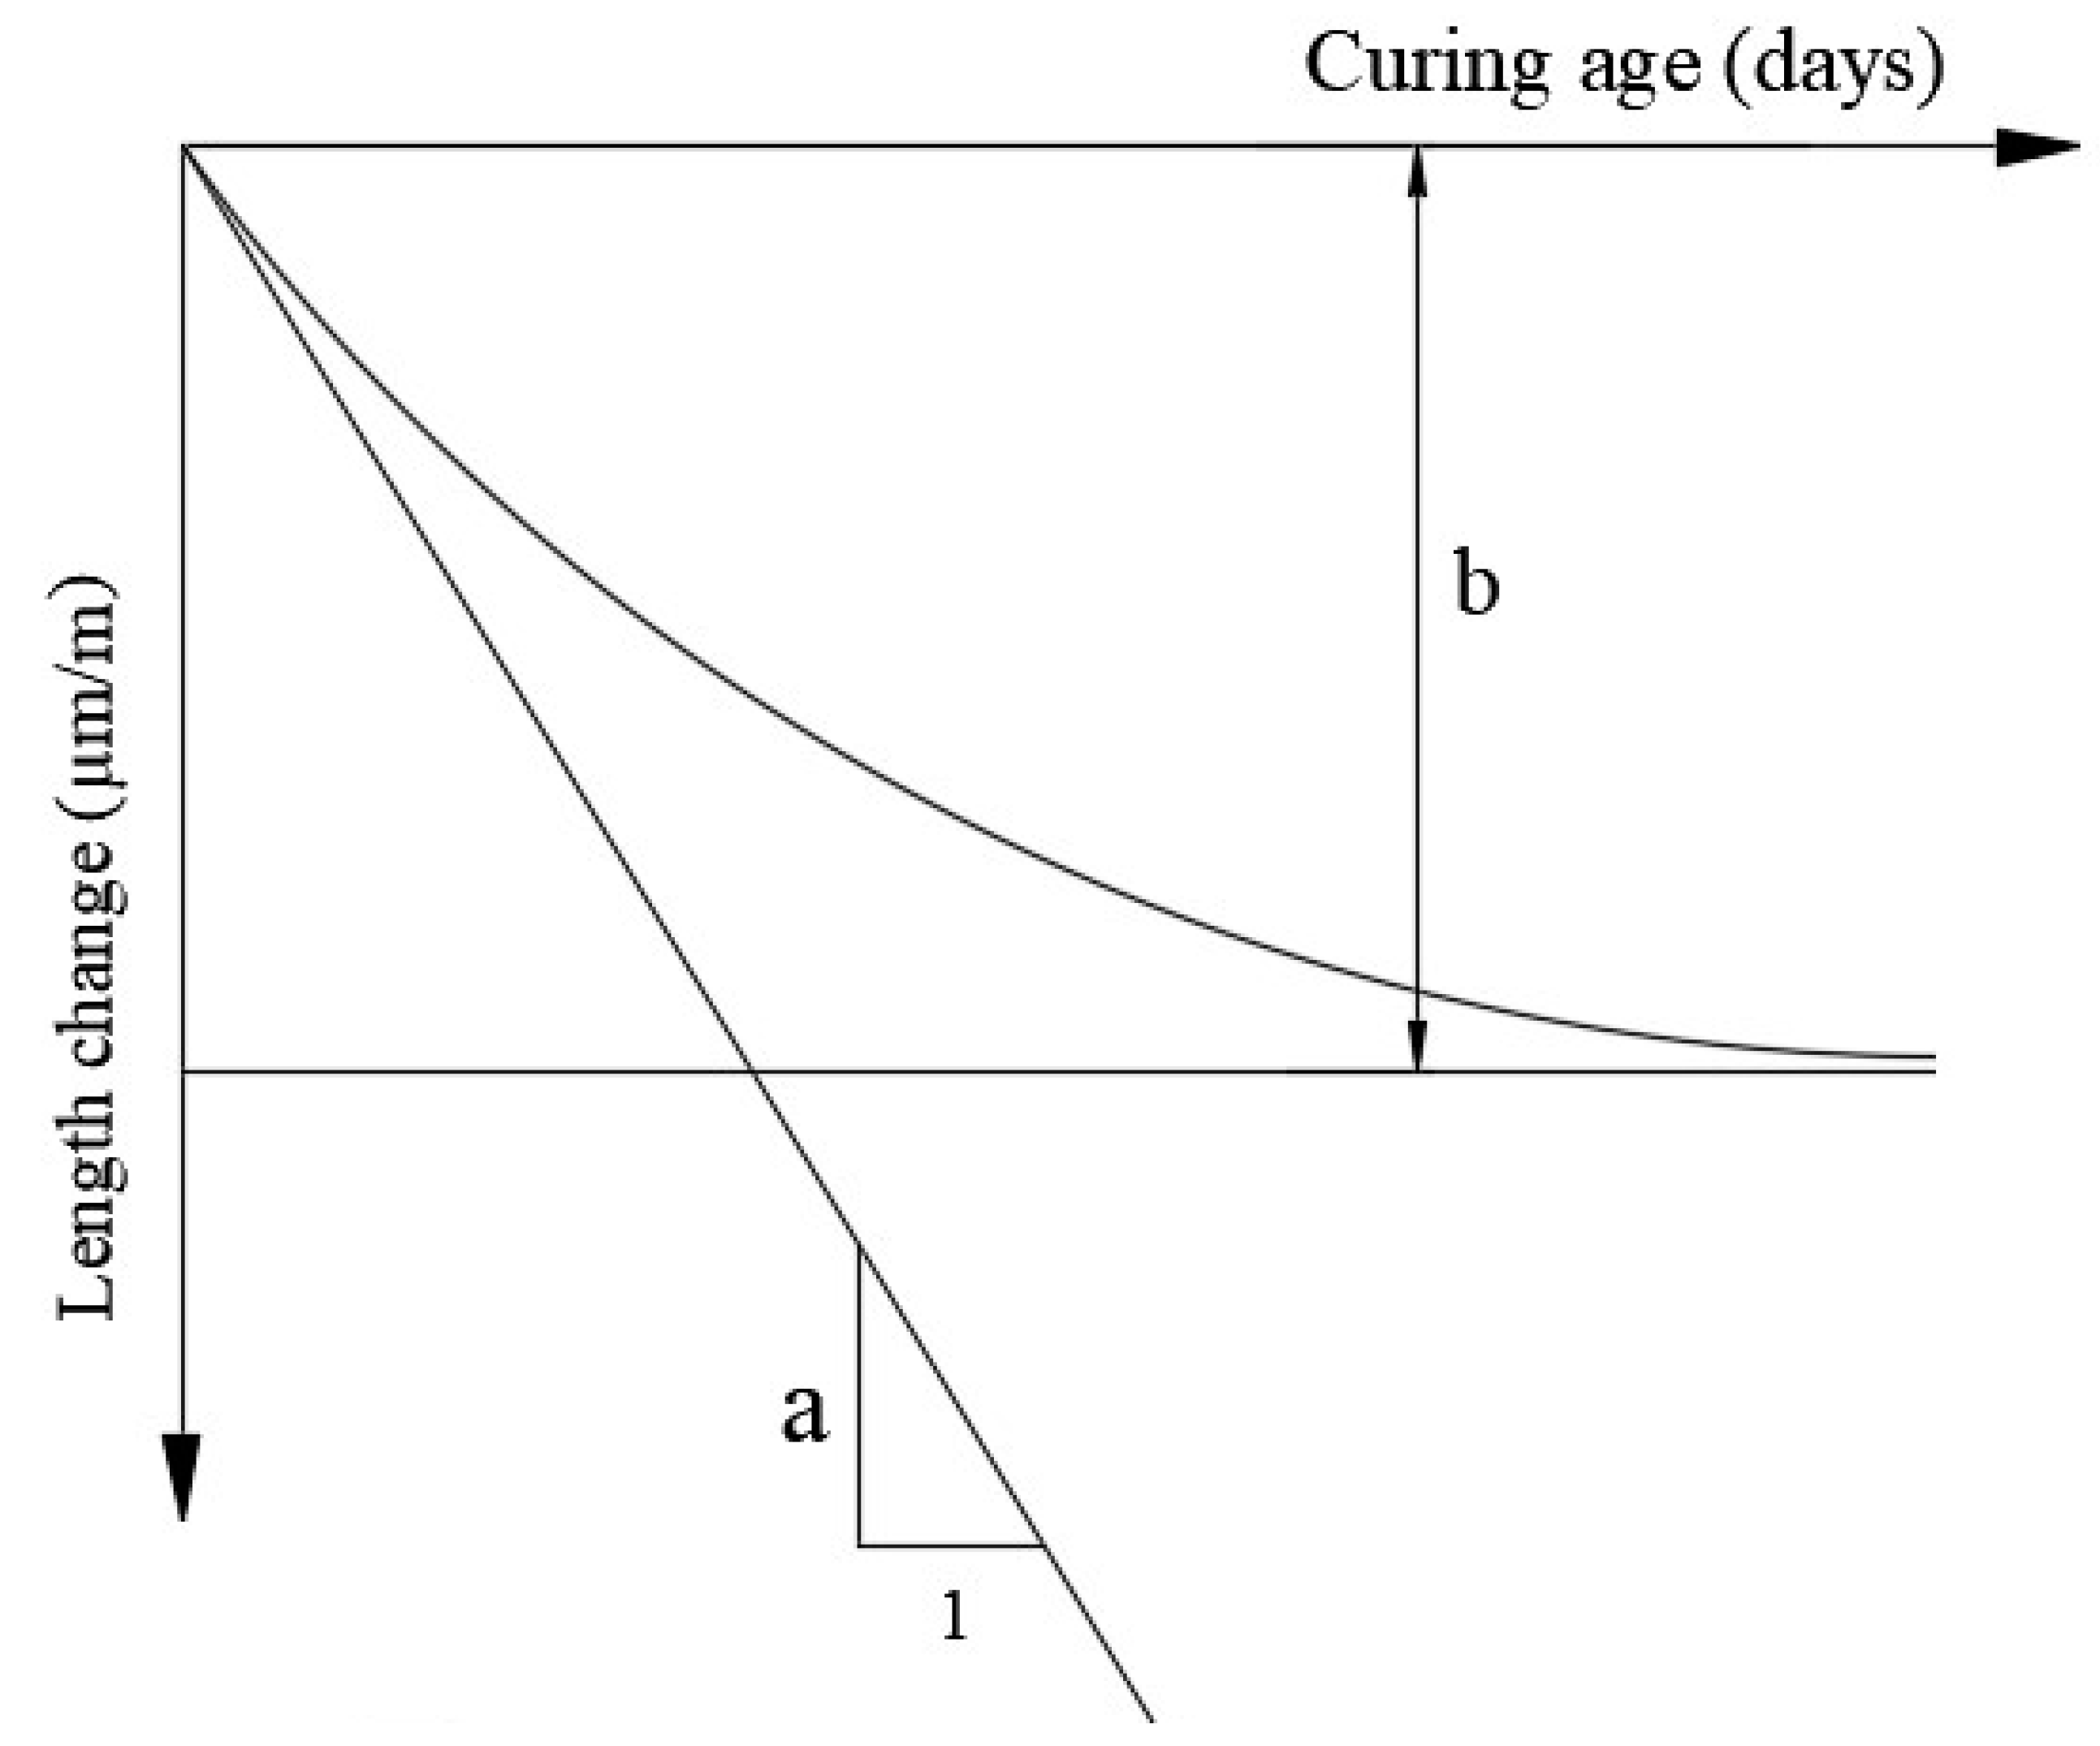
2.4. Estimation of Length Change Parameters
- ε = shrinkage/expansion value (µm/m);
- = curing age;
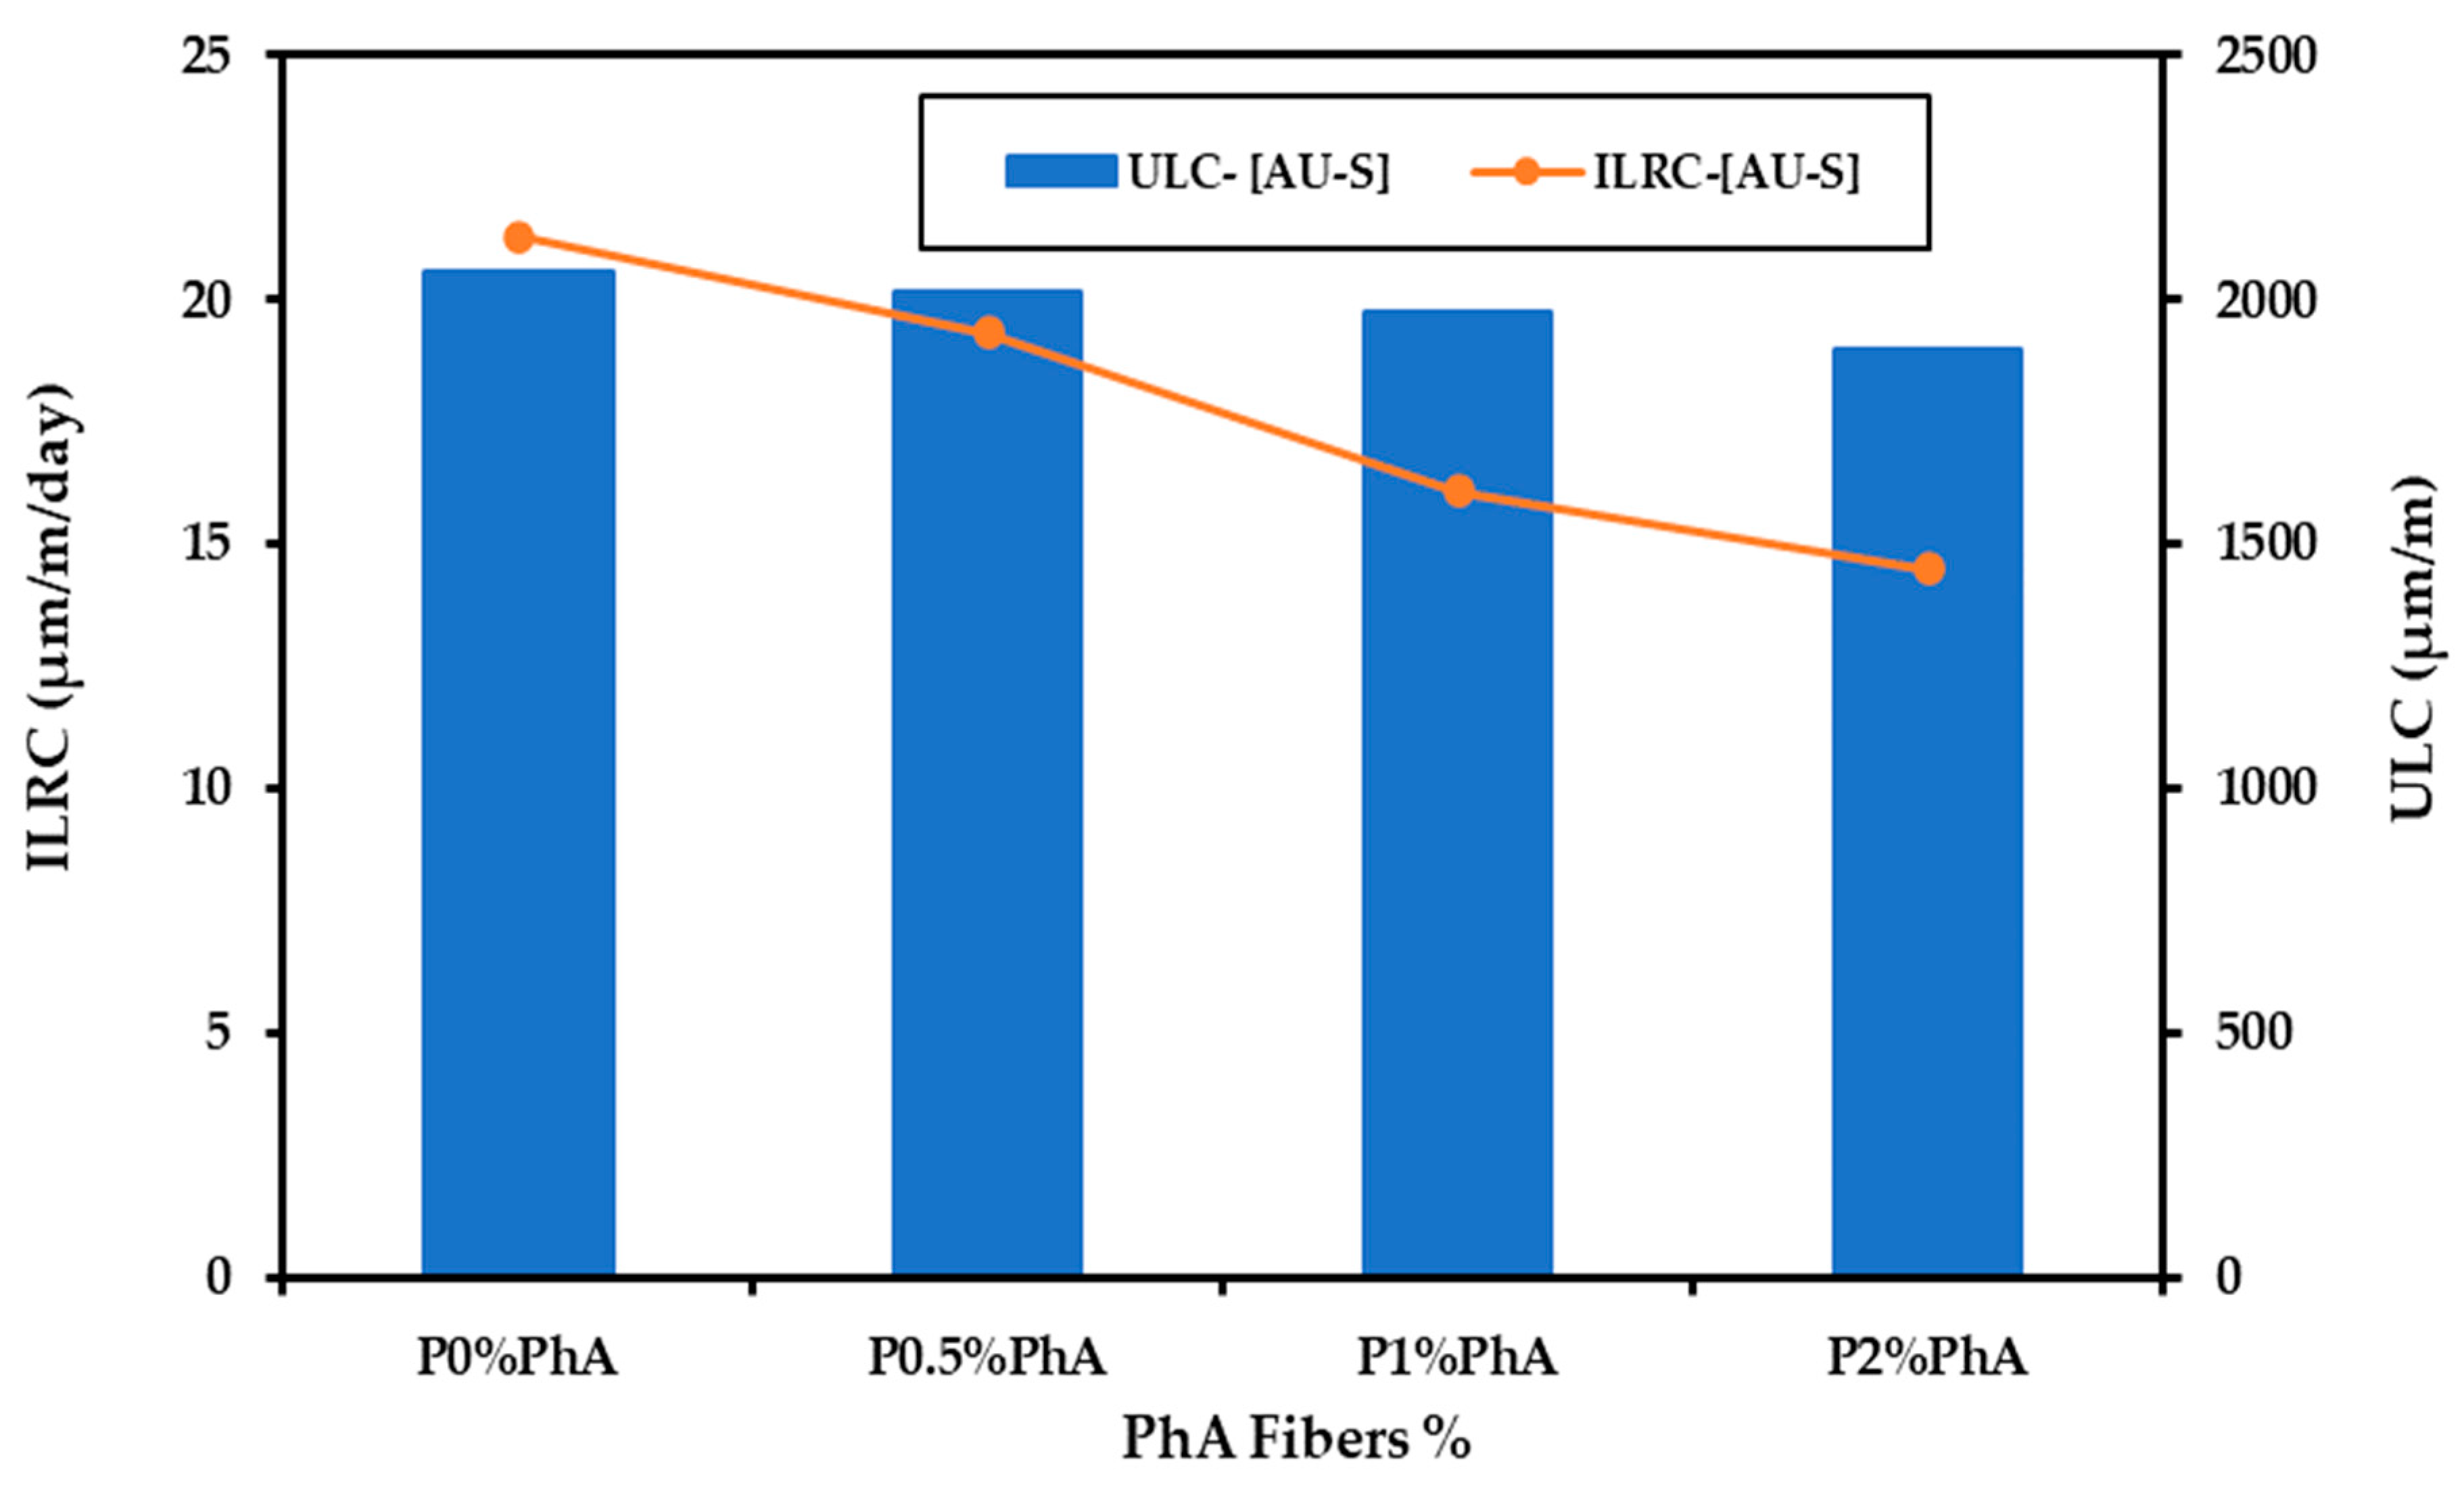
- a = IRLC values;
- b = ULC values.
3. Results and Discussion
3.1. Density
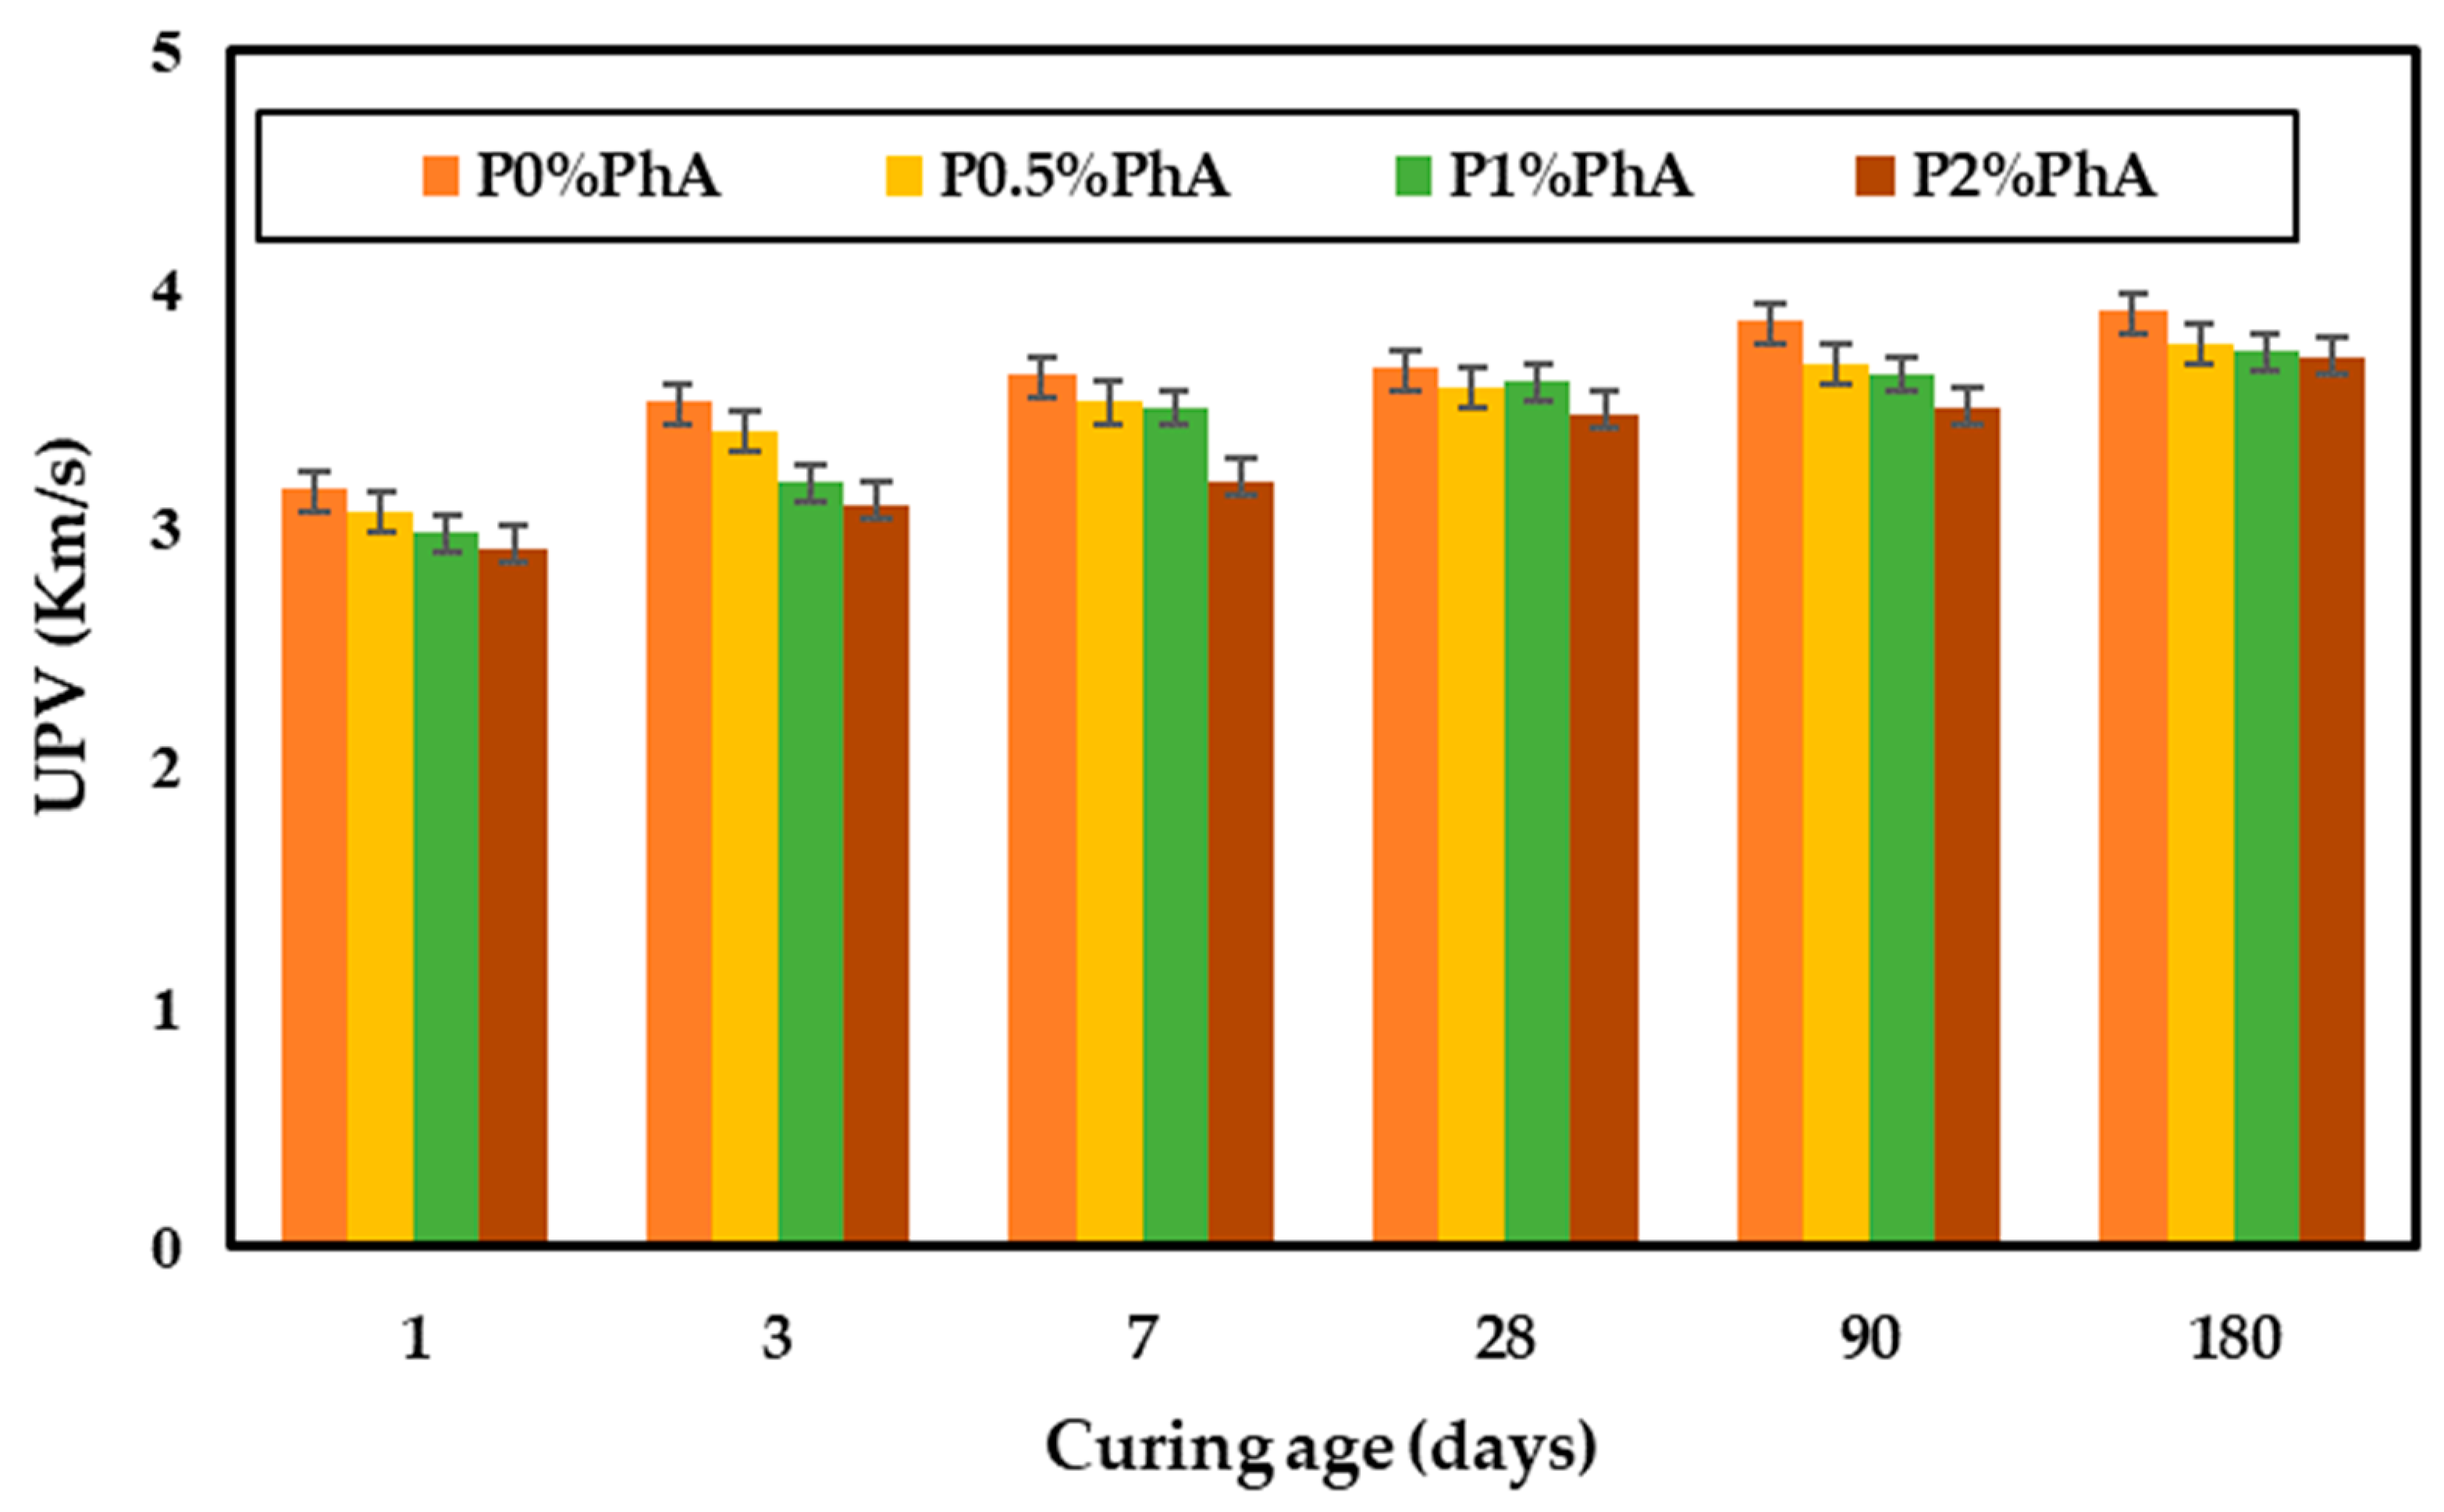
3.2. Ultrasonic Pulse Velocity (UPV)
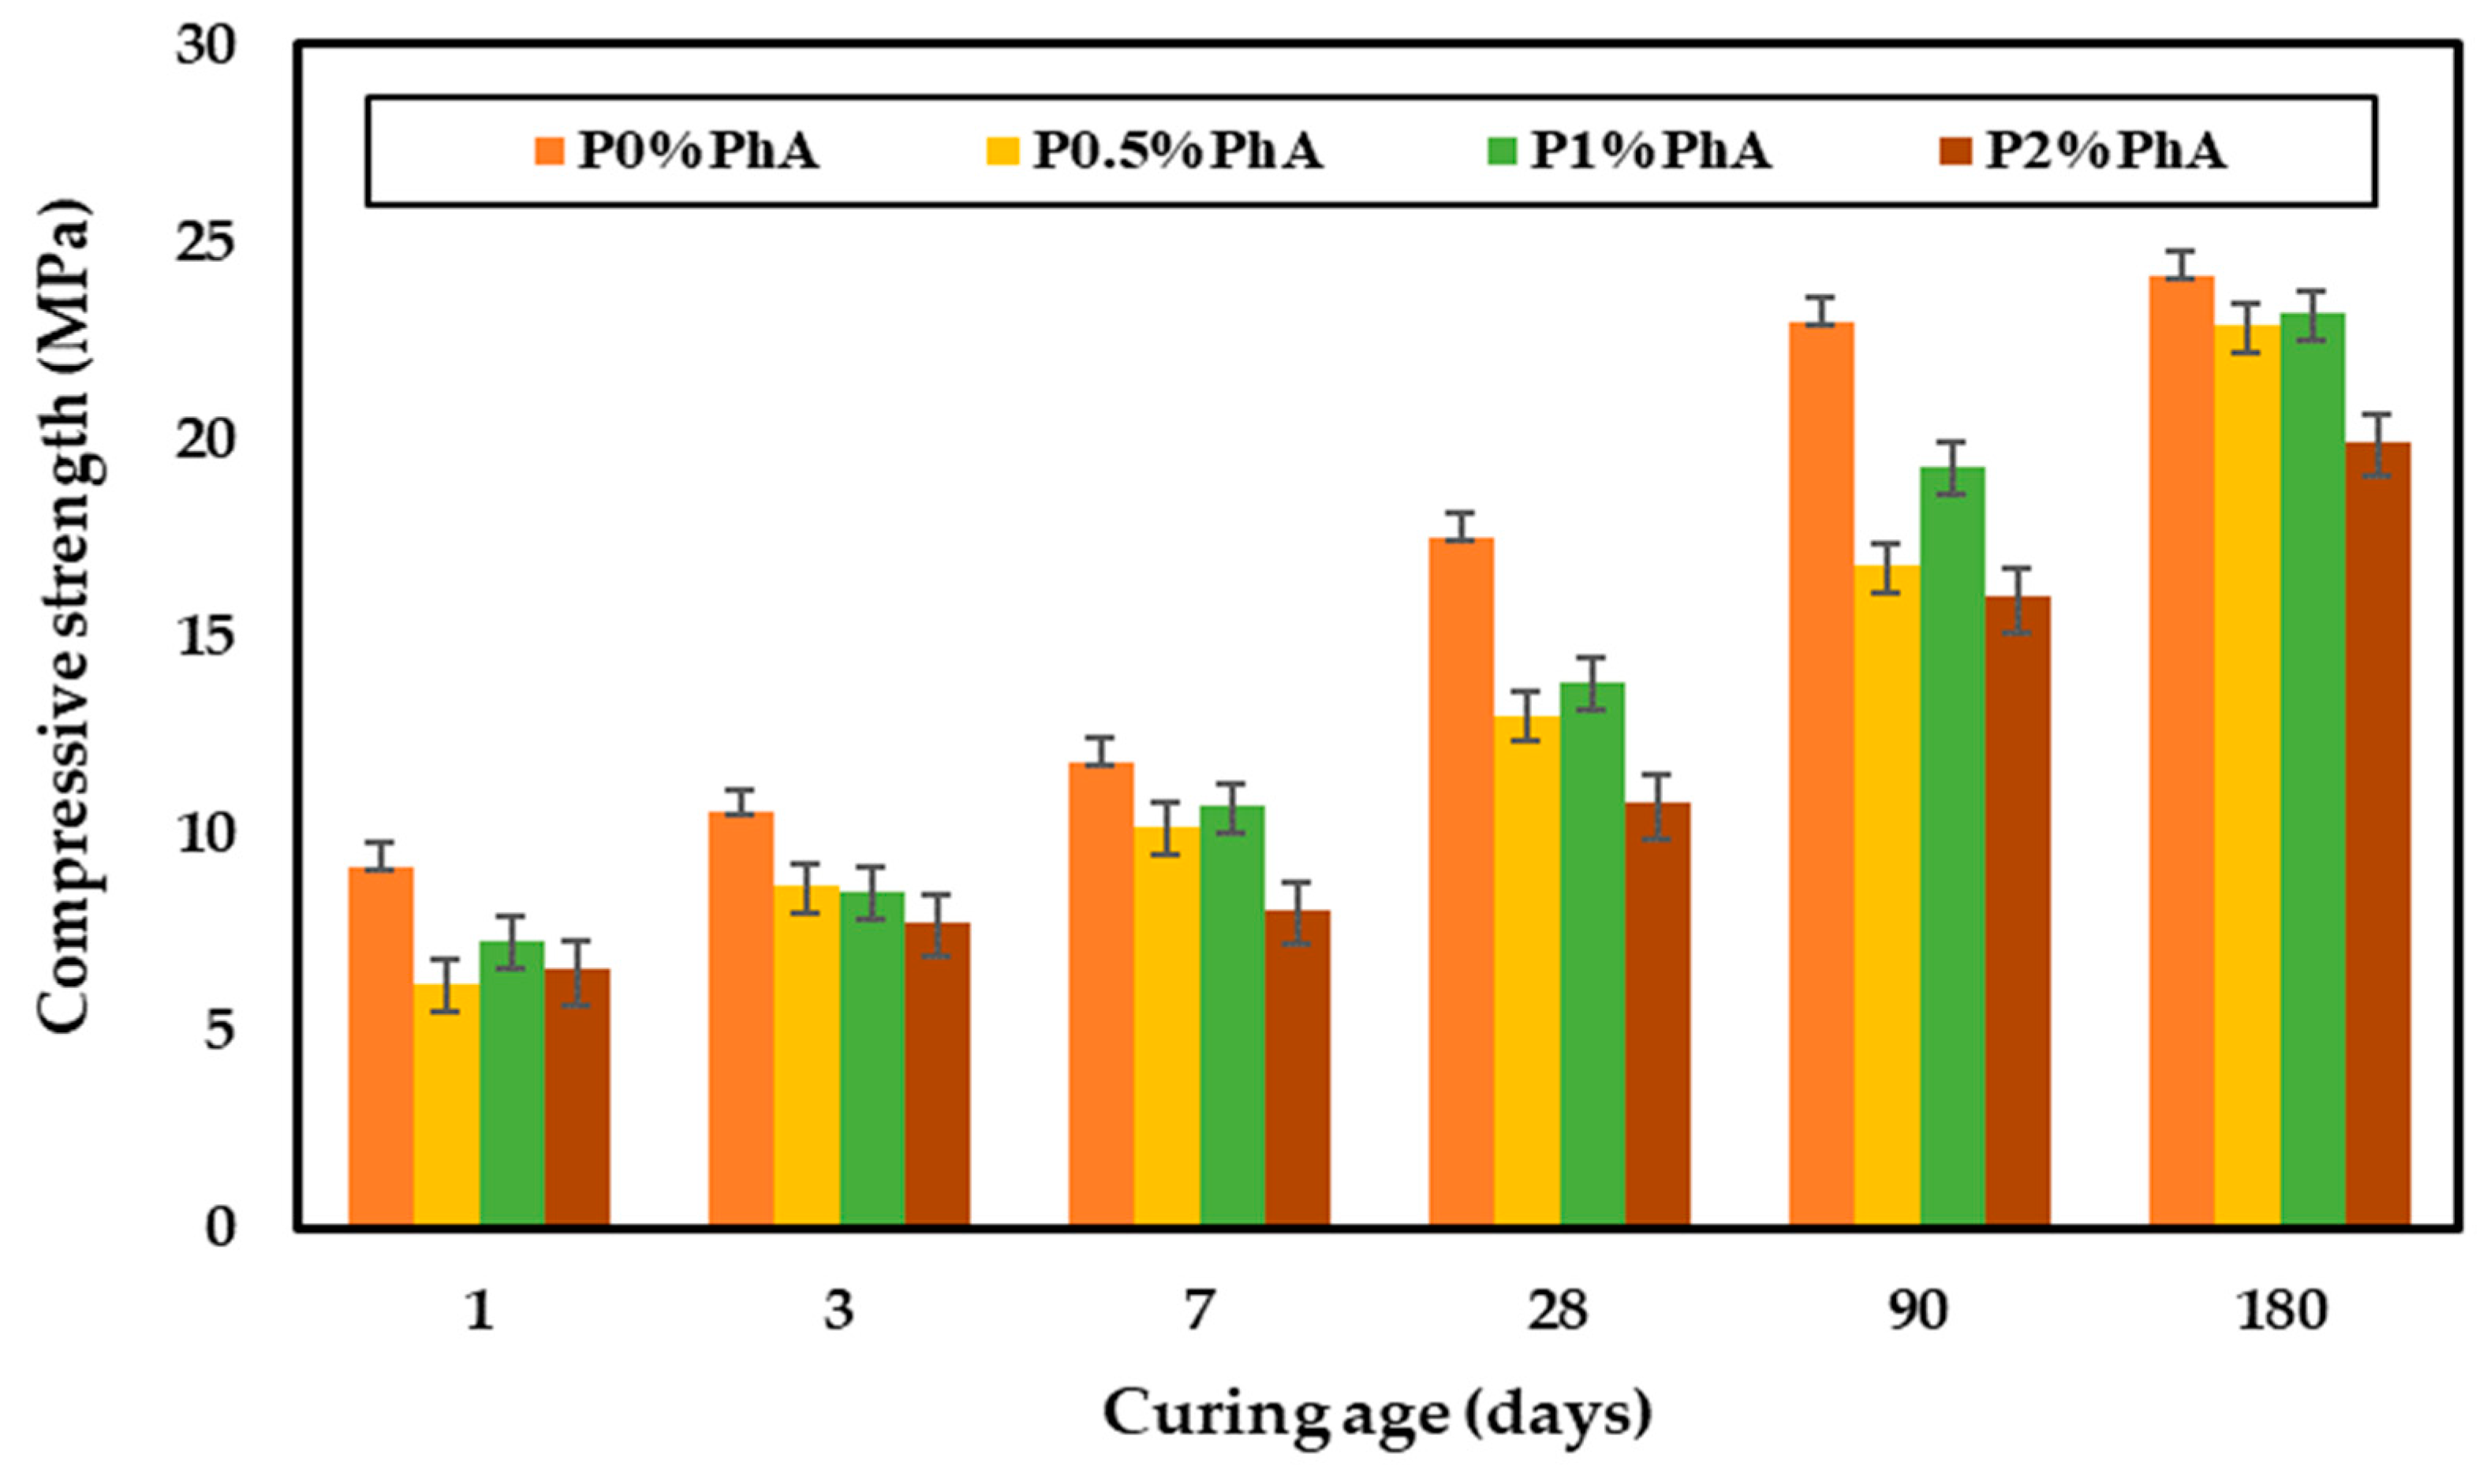
3.3. Compressive and Flexural Strength
3.4. Length Change
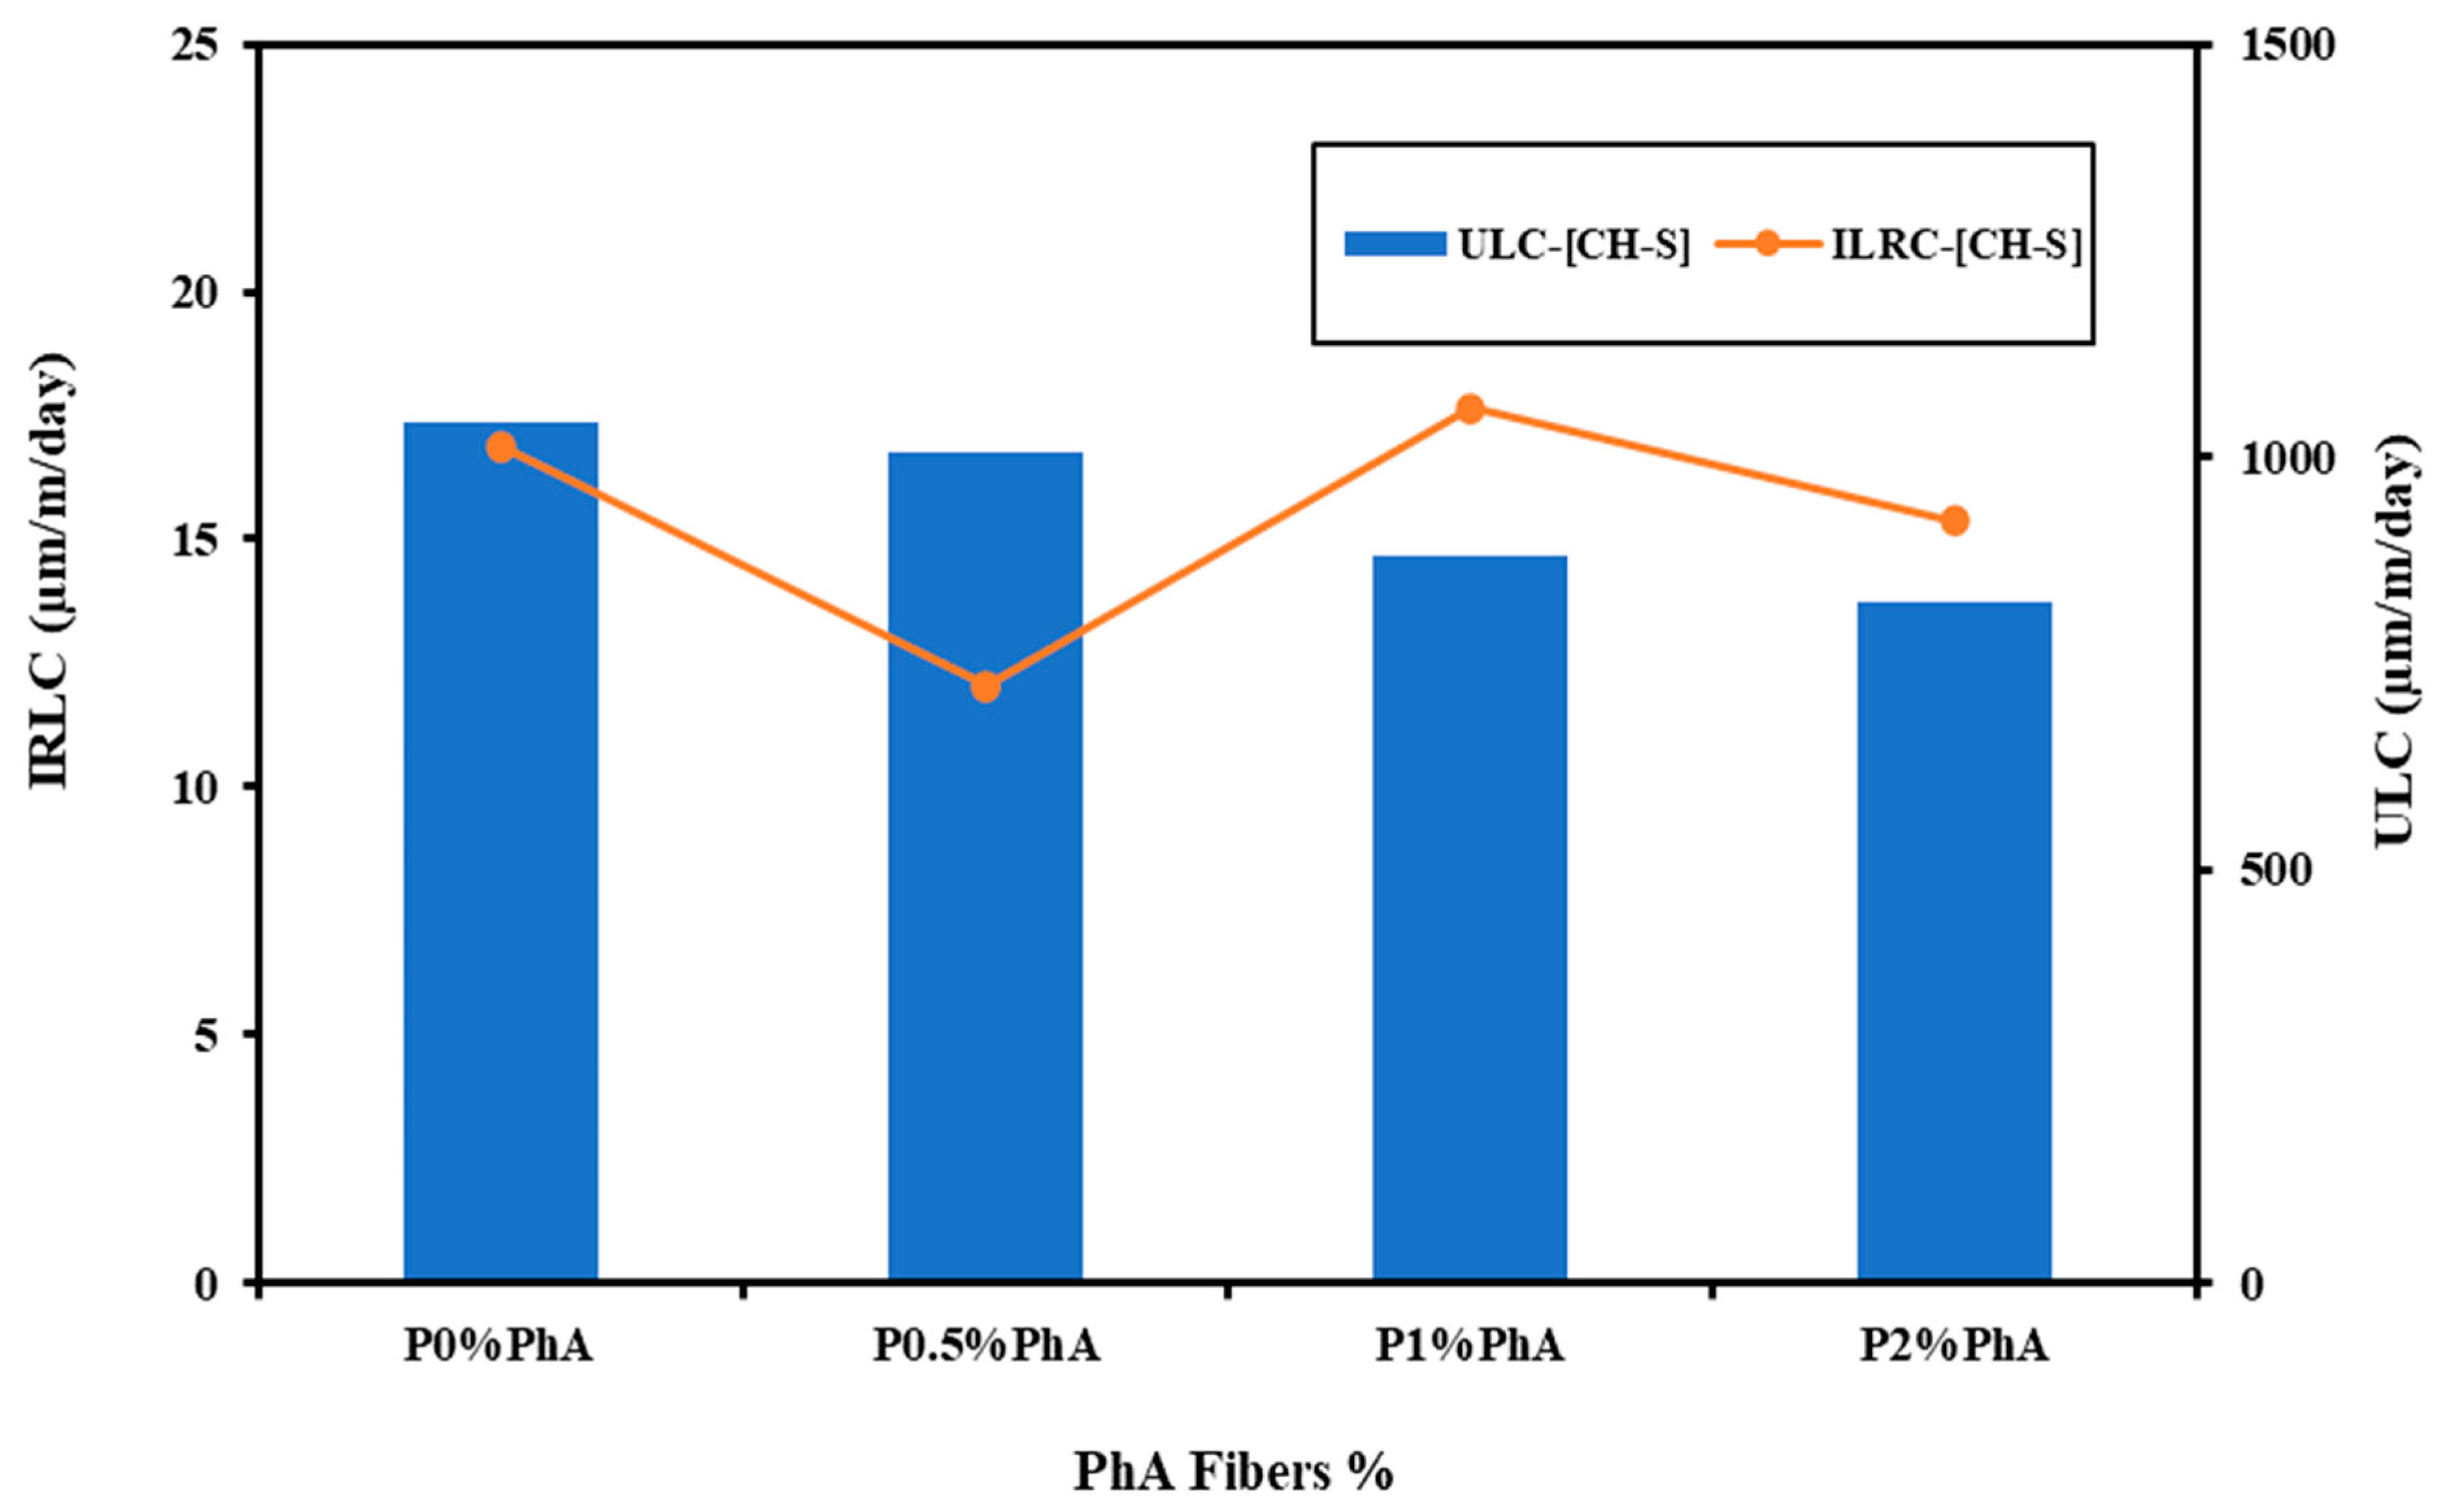
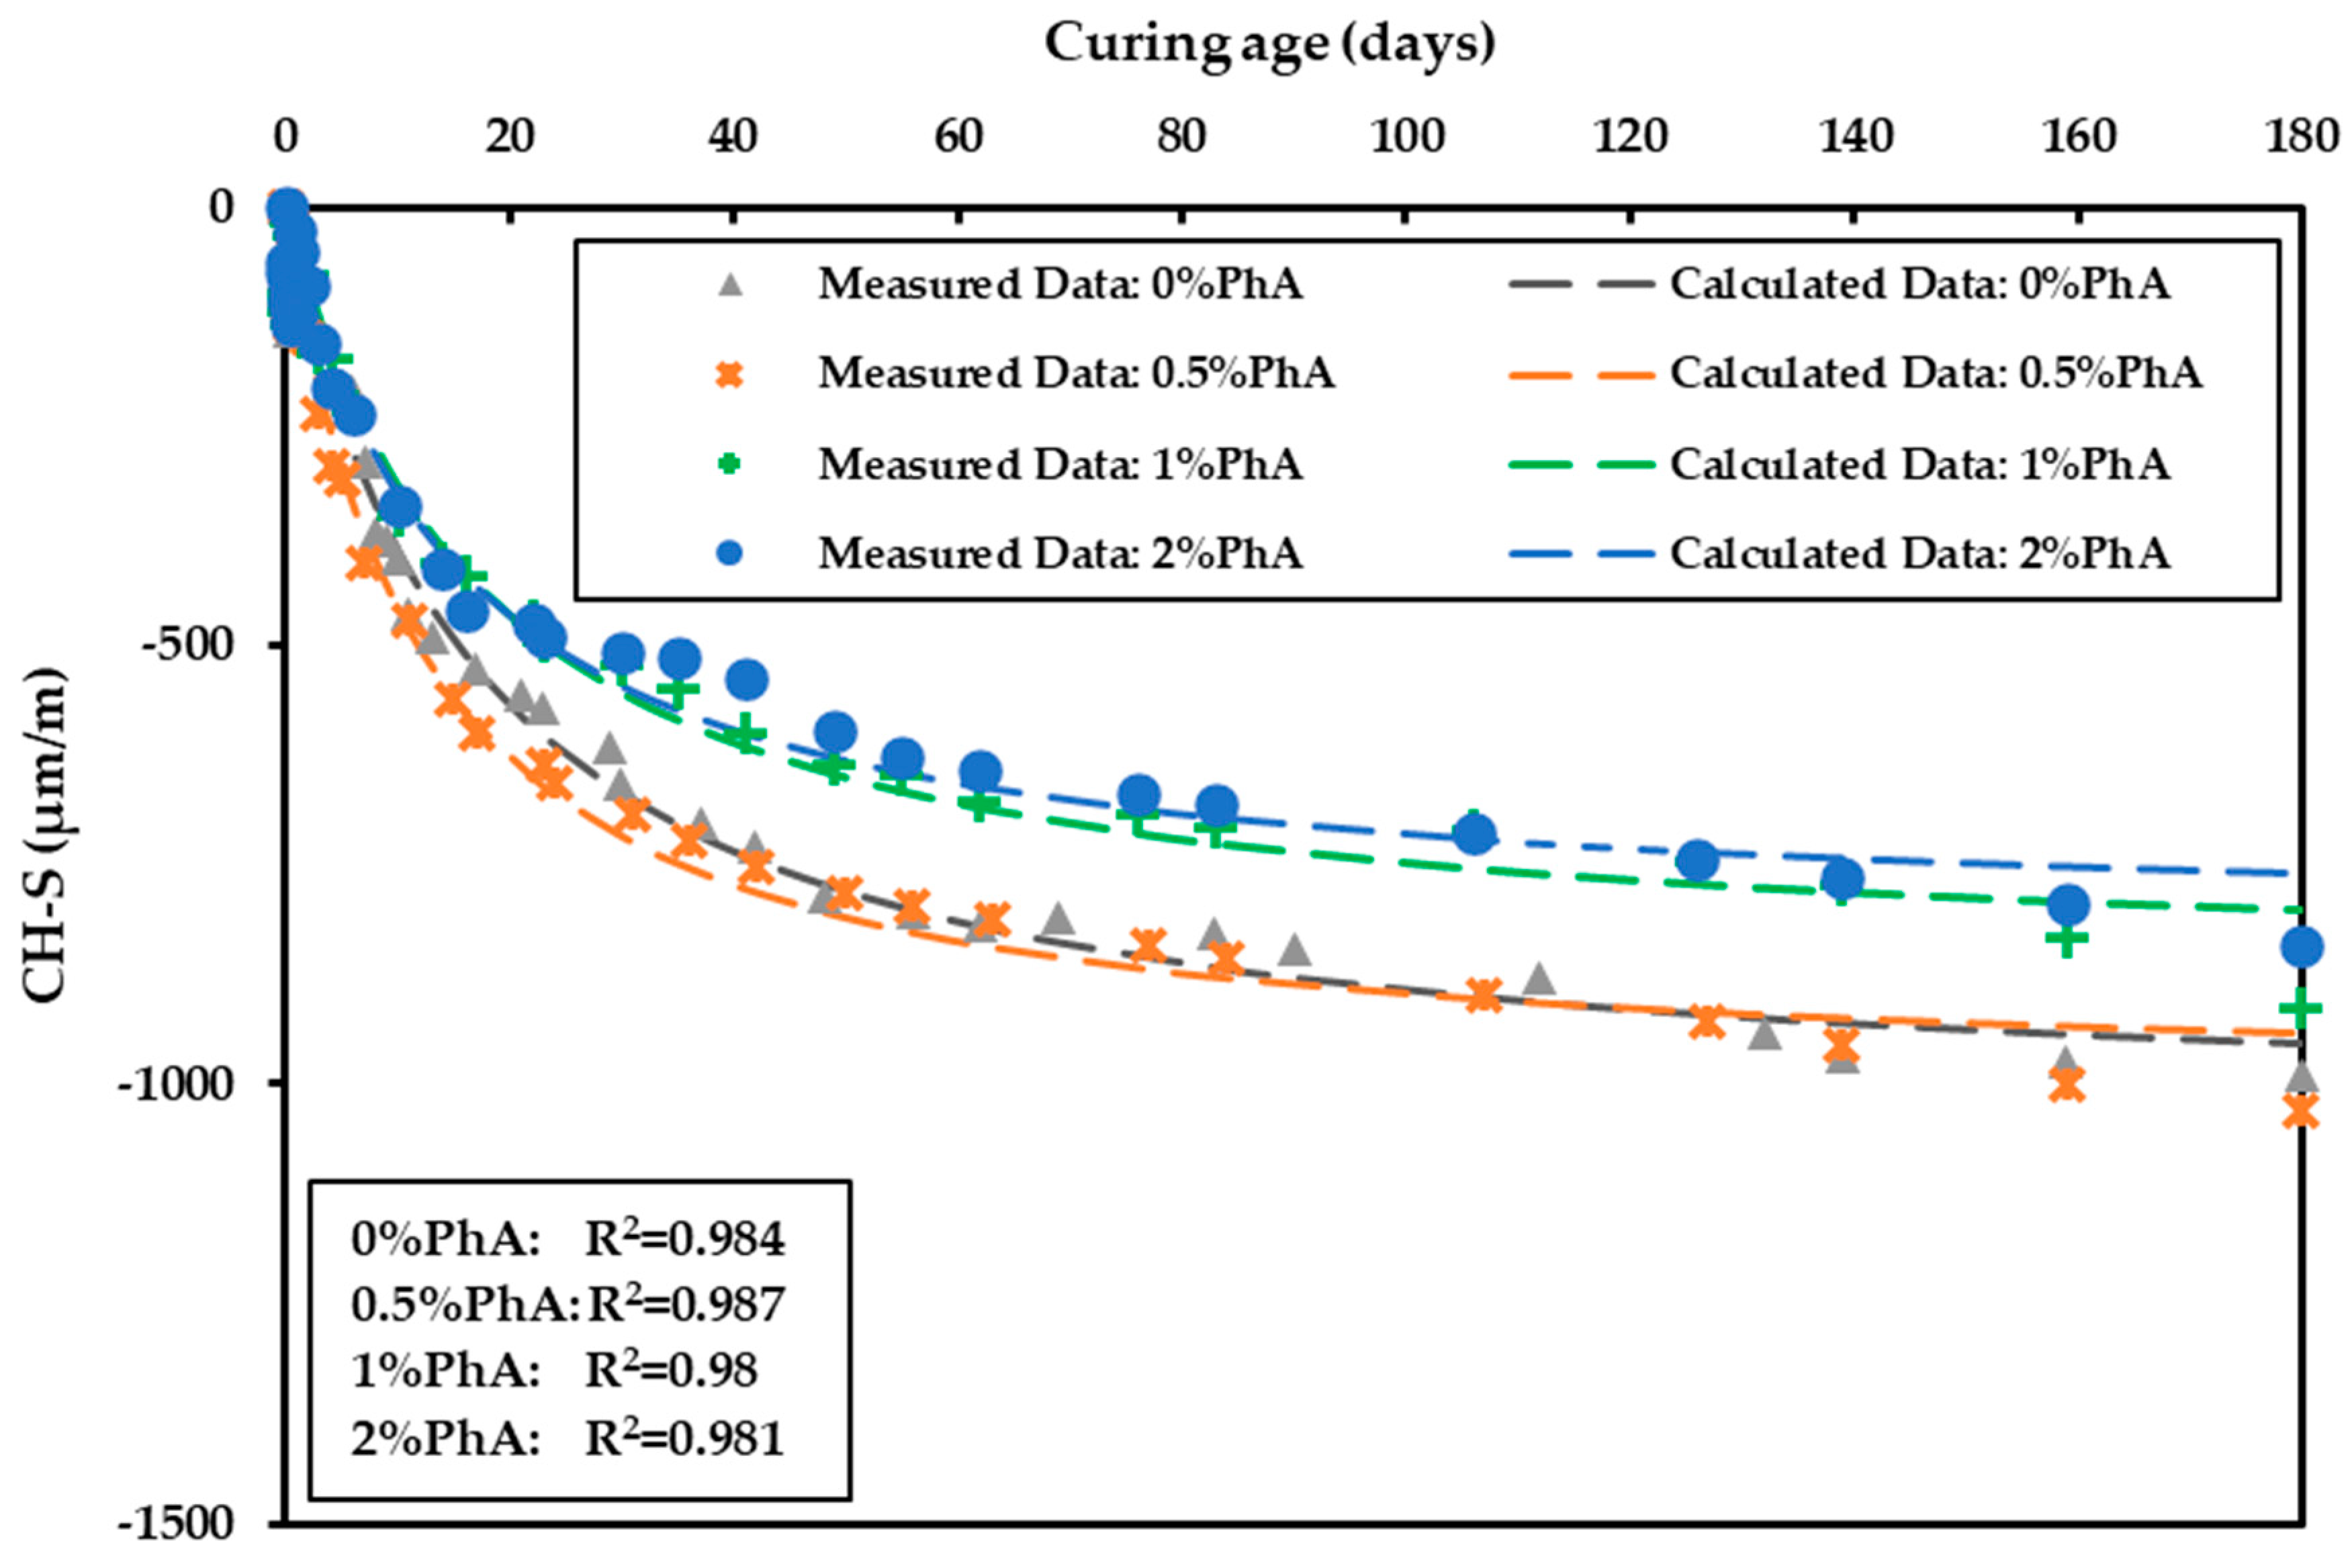
3.4.1. Chemical Shrinkage (CH-S)
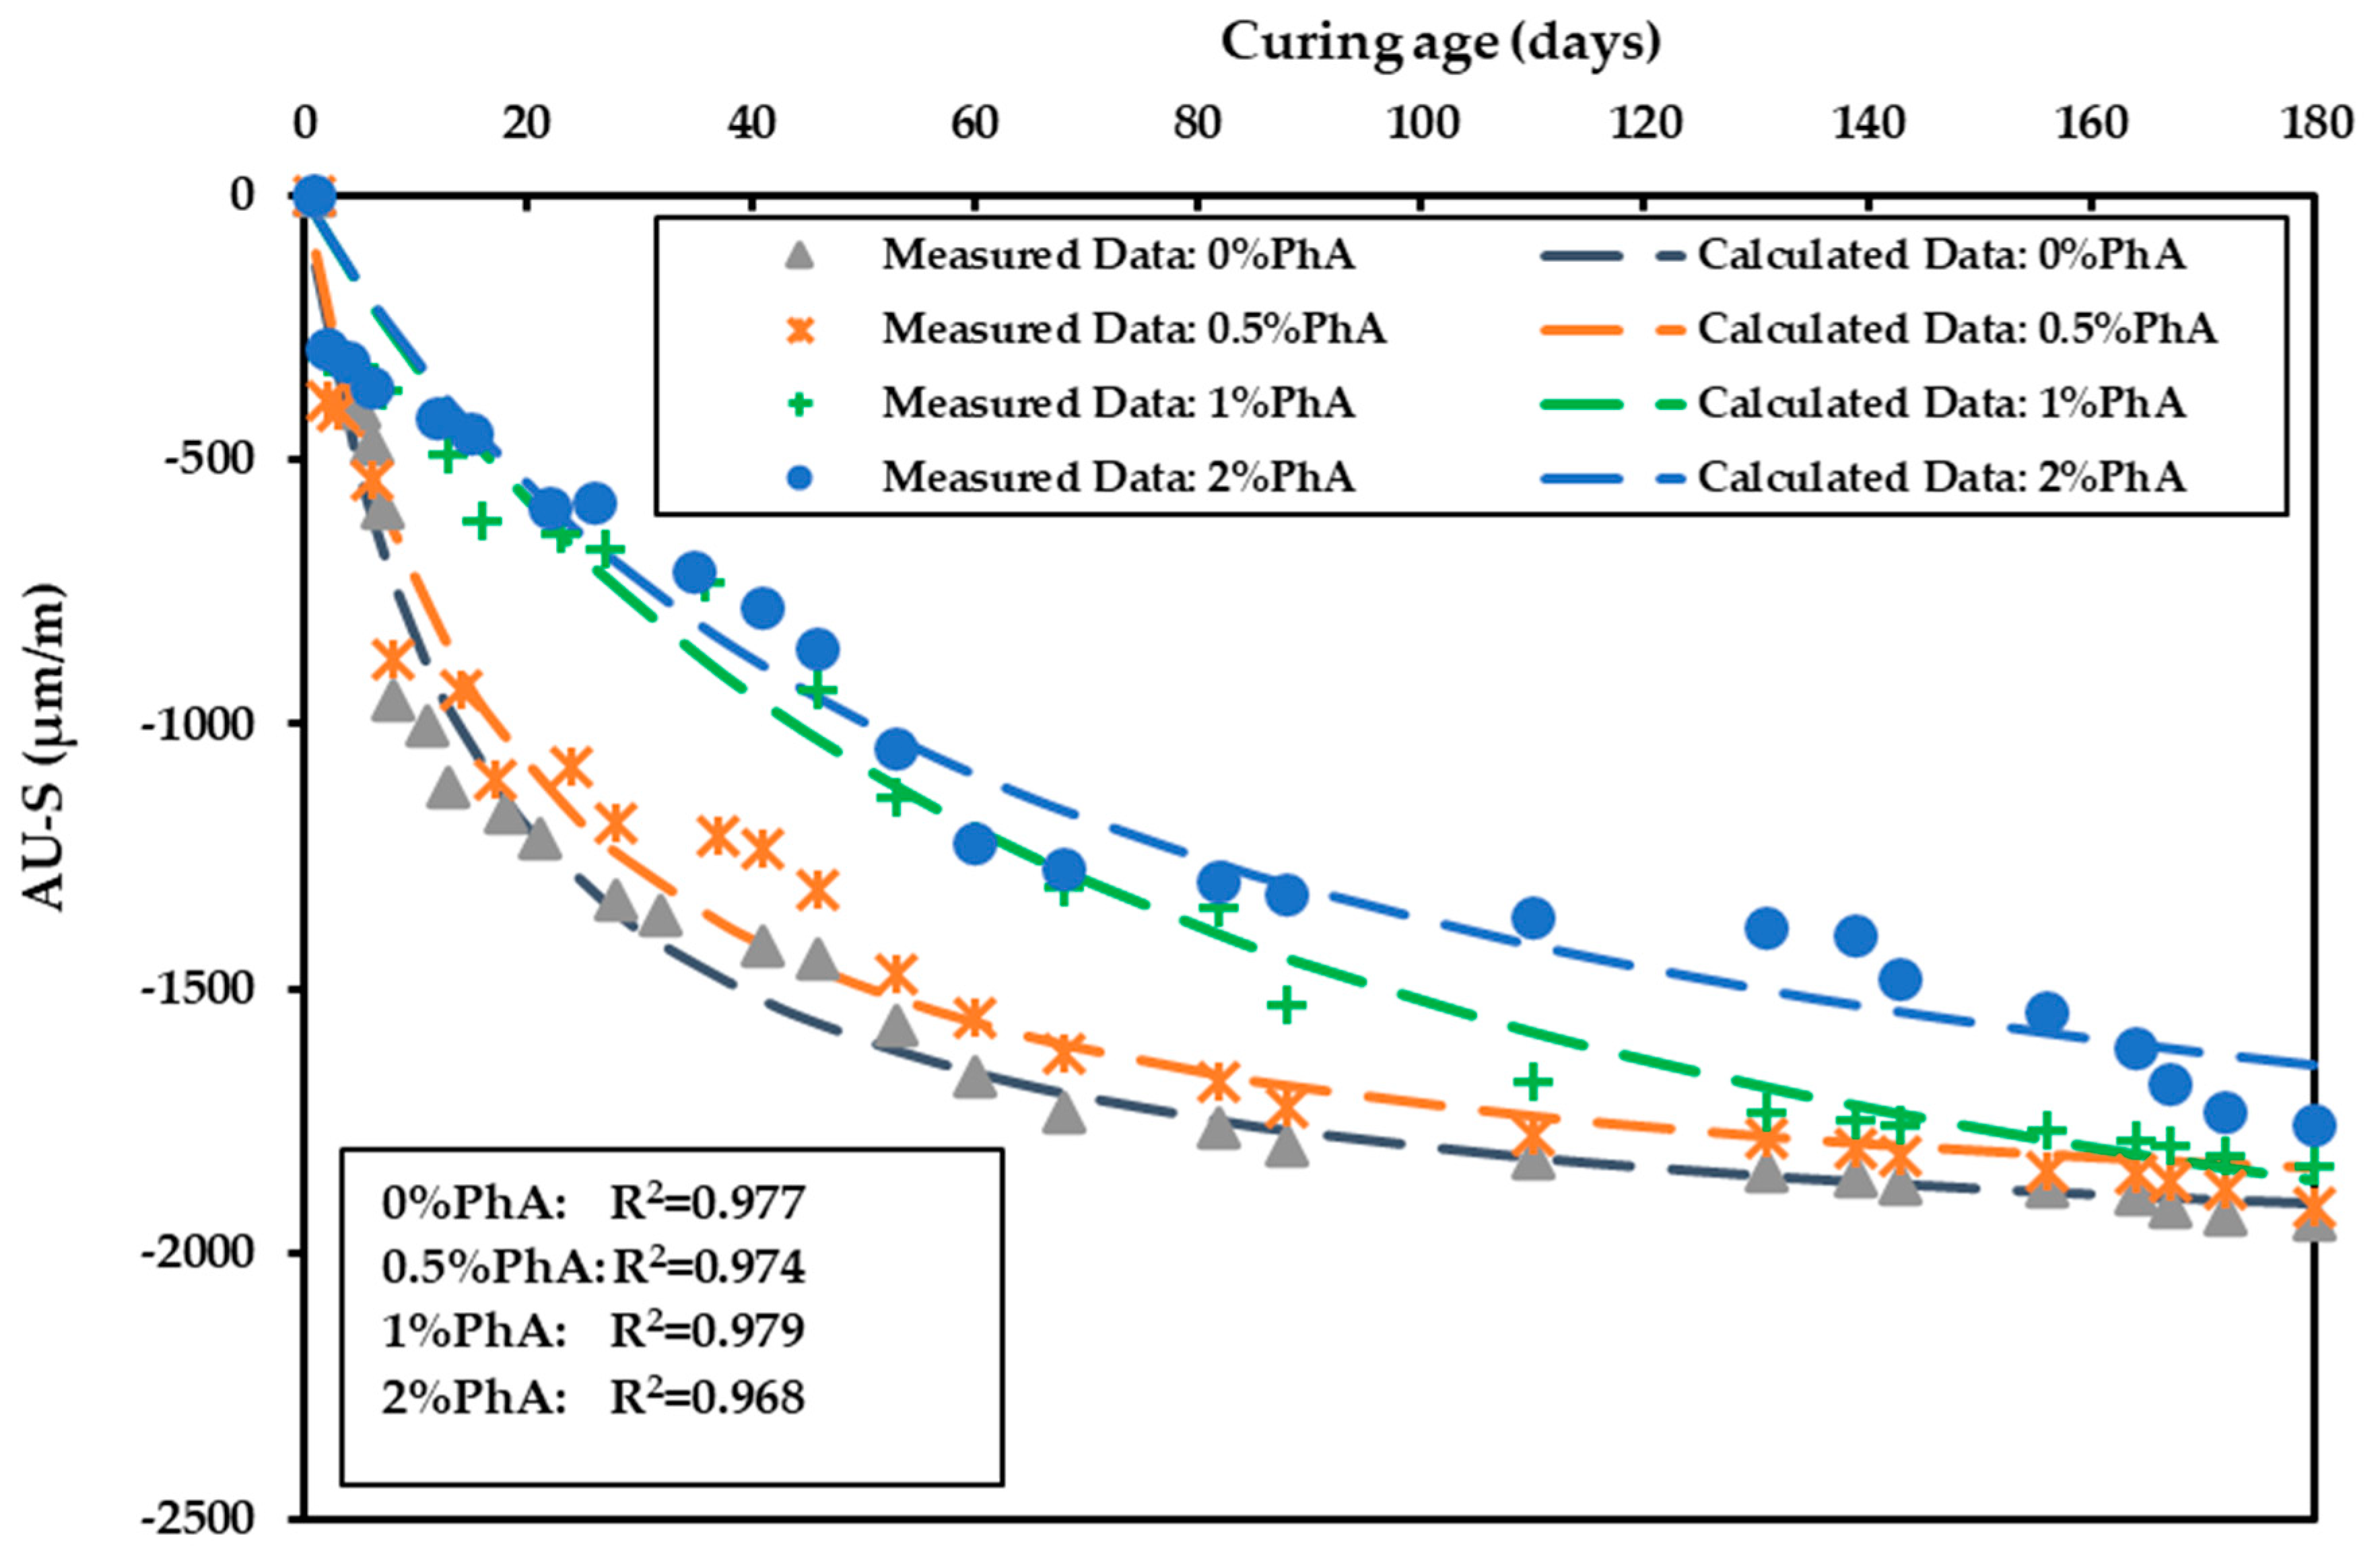
3.4.2. Autogenous Shrinkage (AU-S)
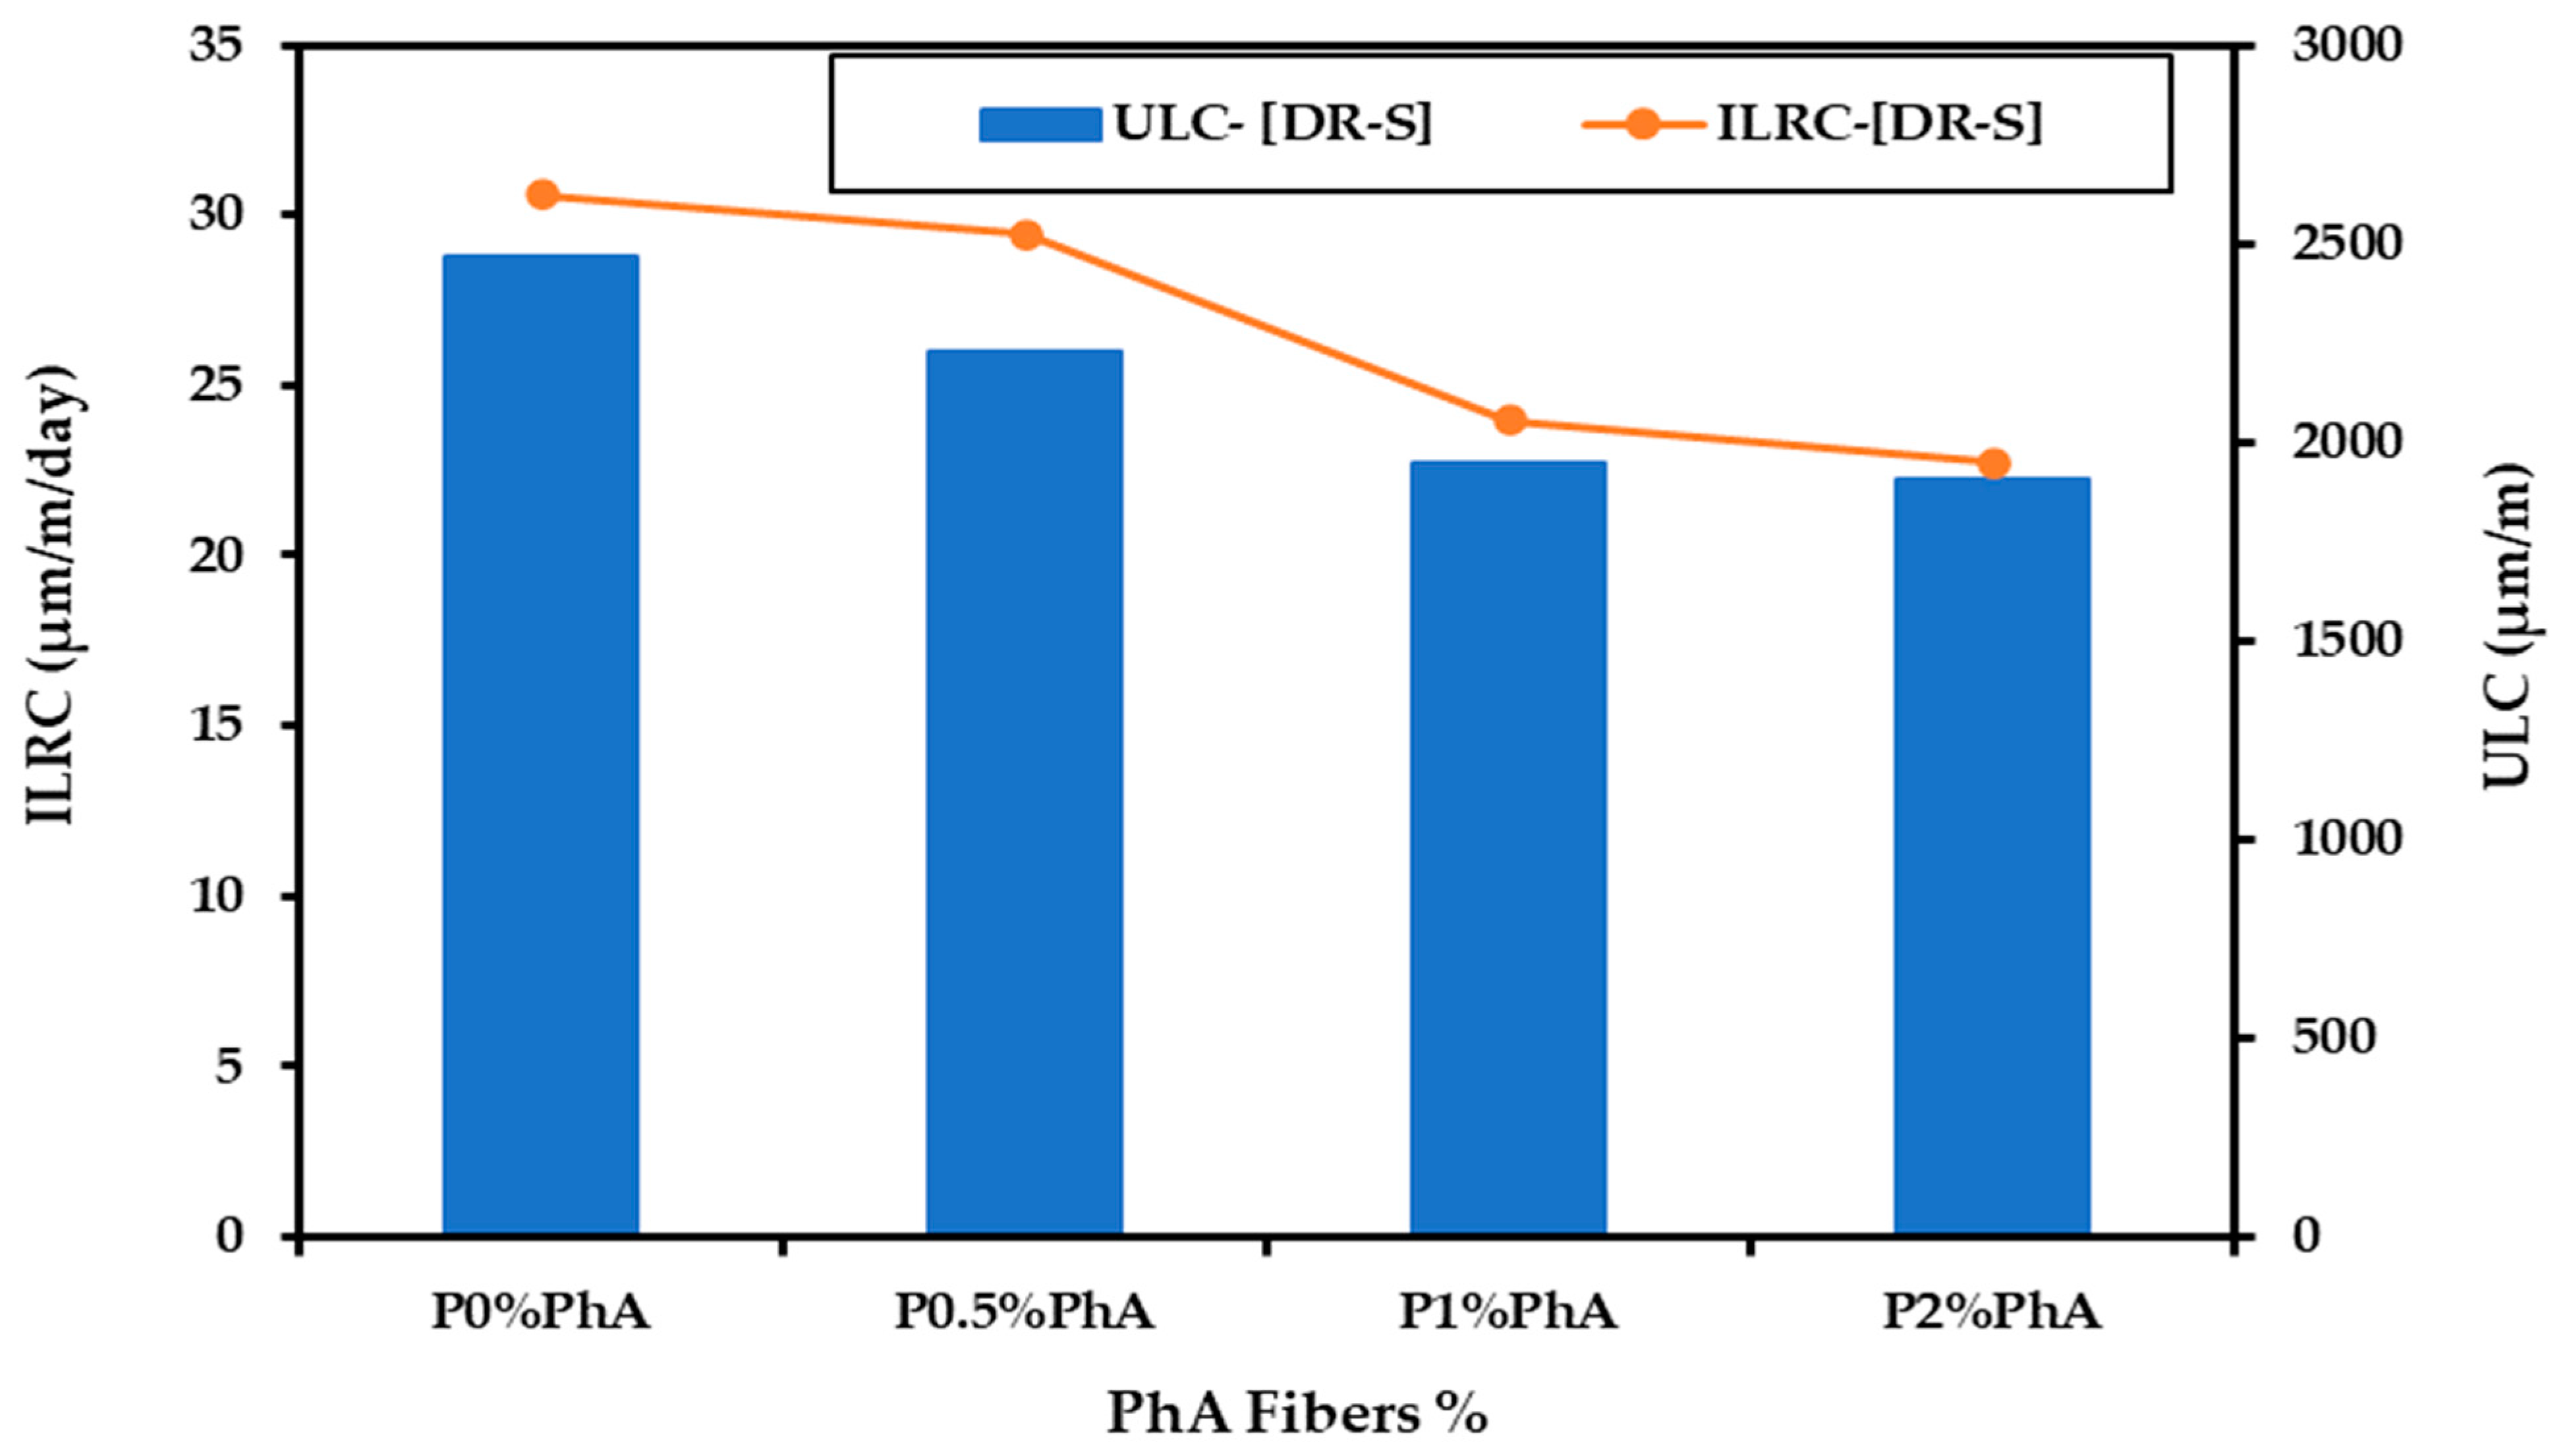
3.4.3. Drying Shrinkage (DR-S)
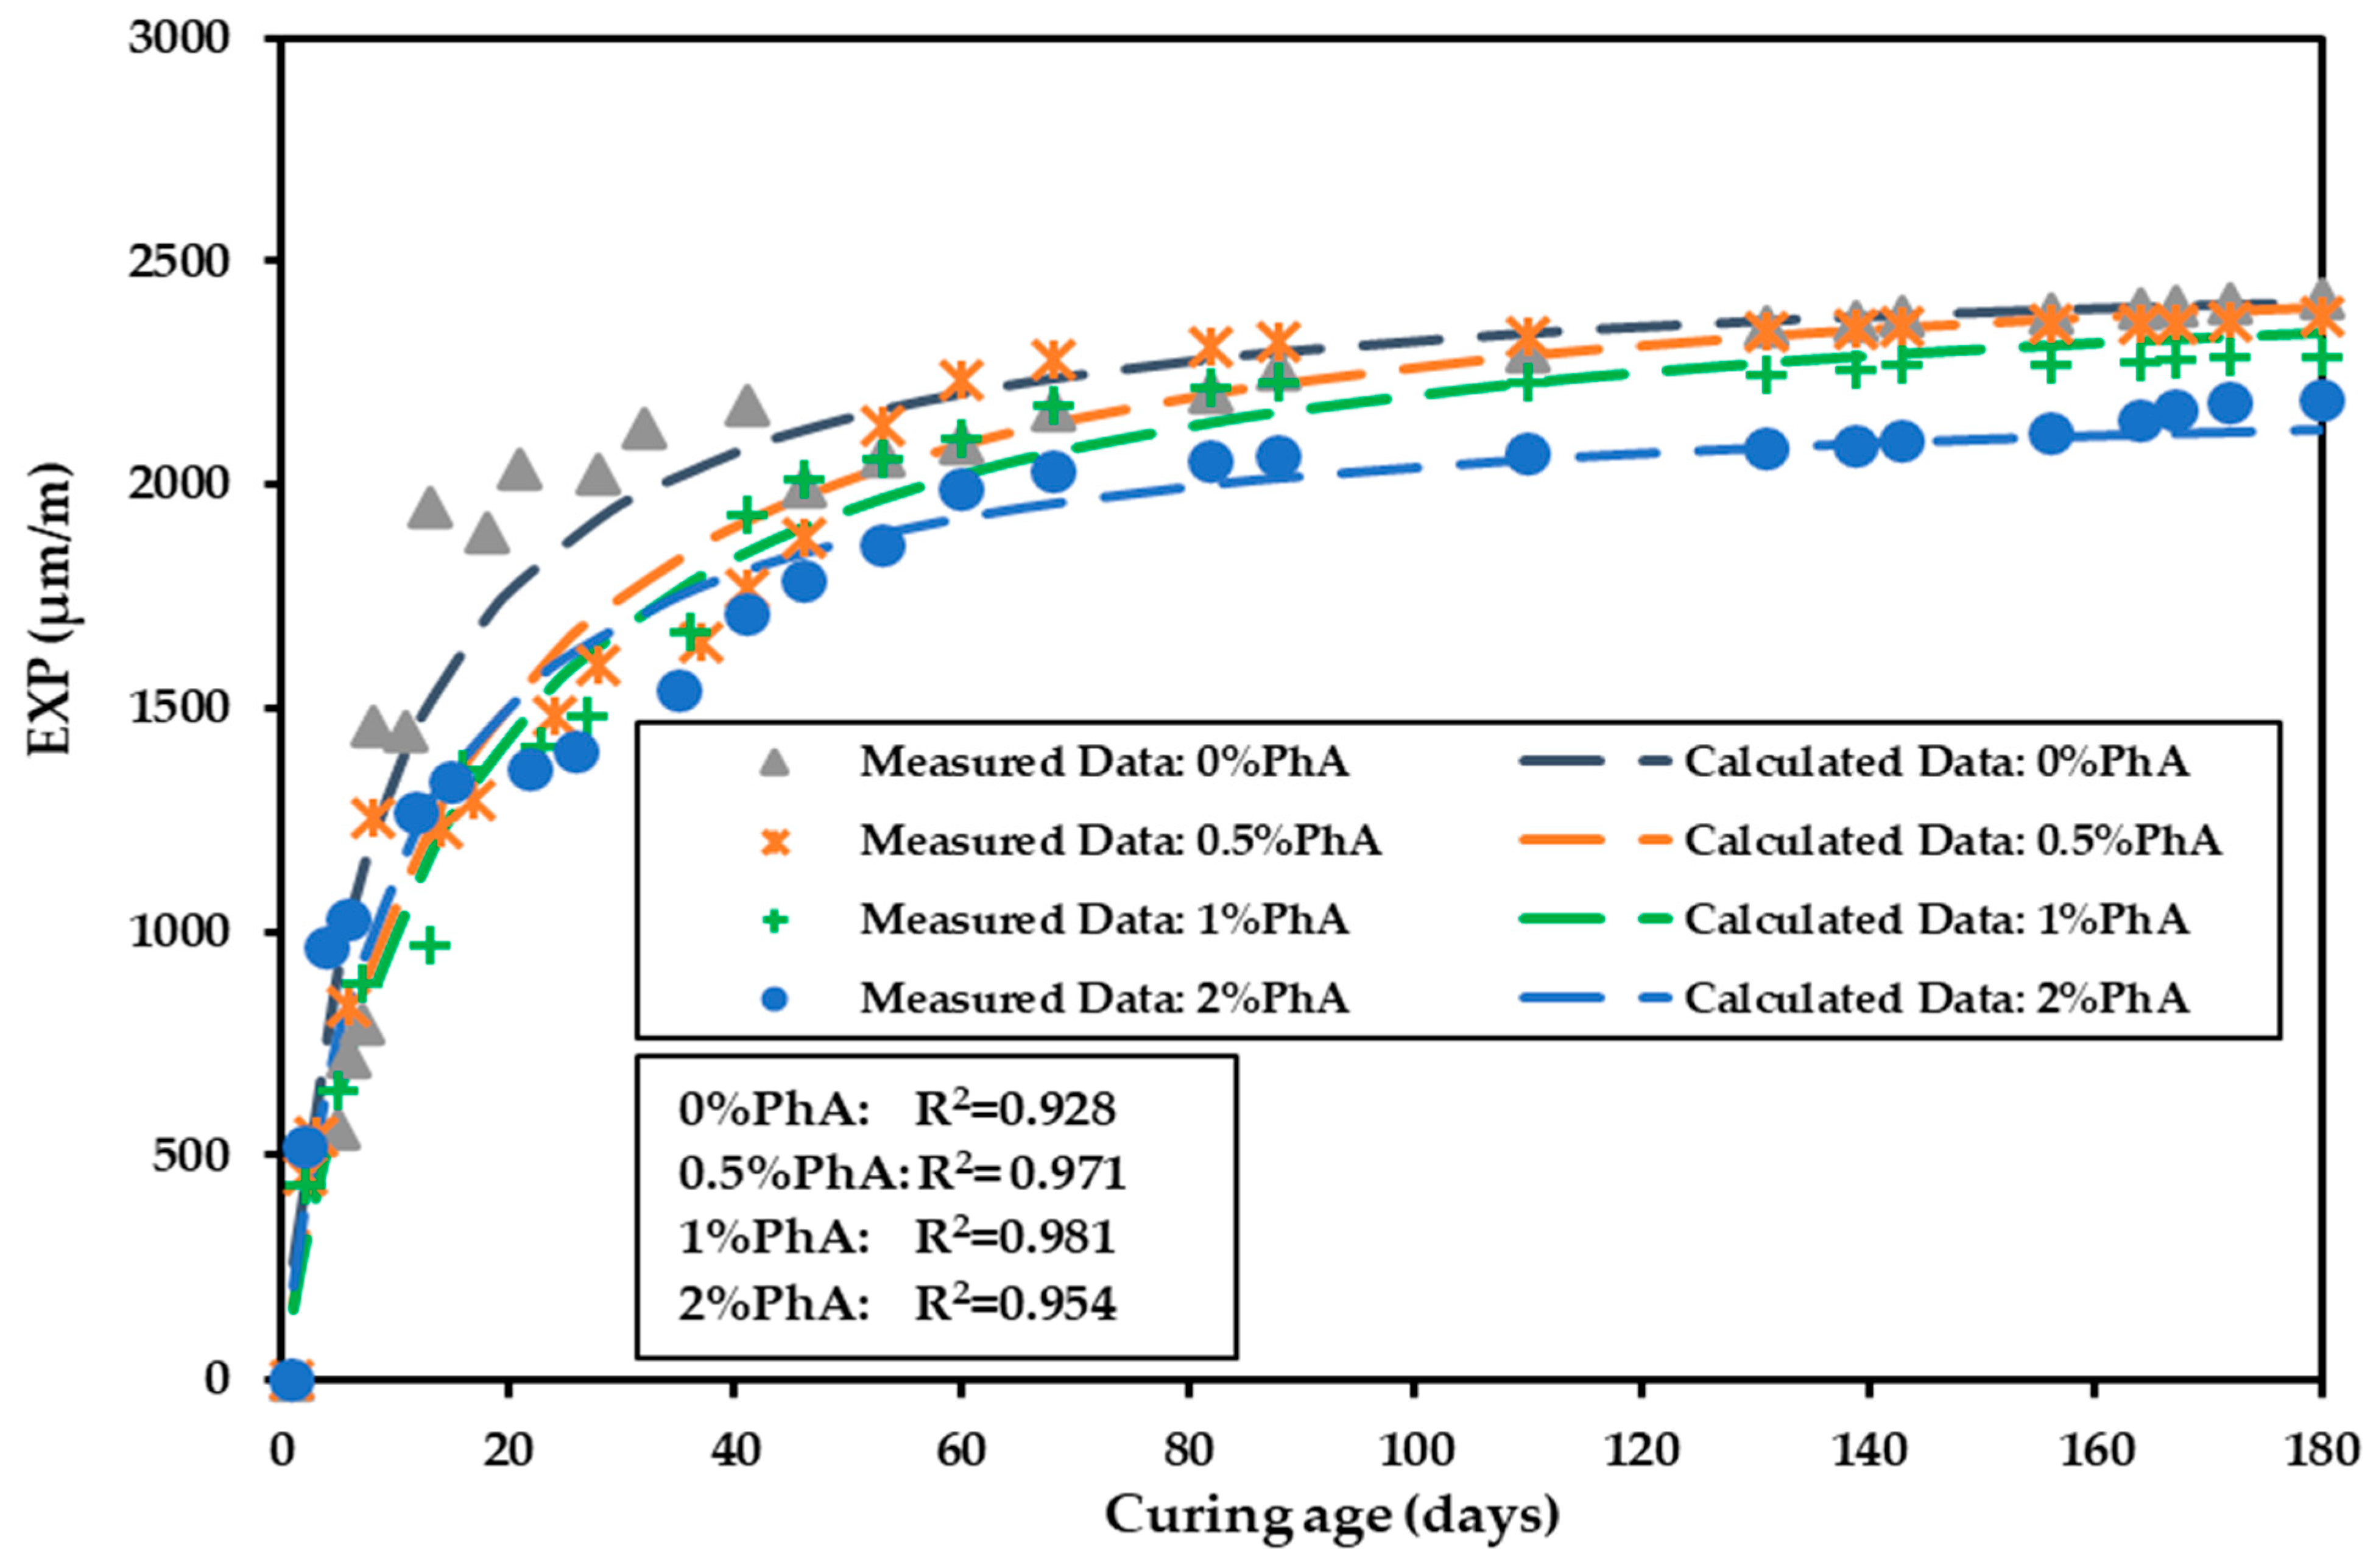
3.4.4. Expansion (EXP)
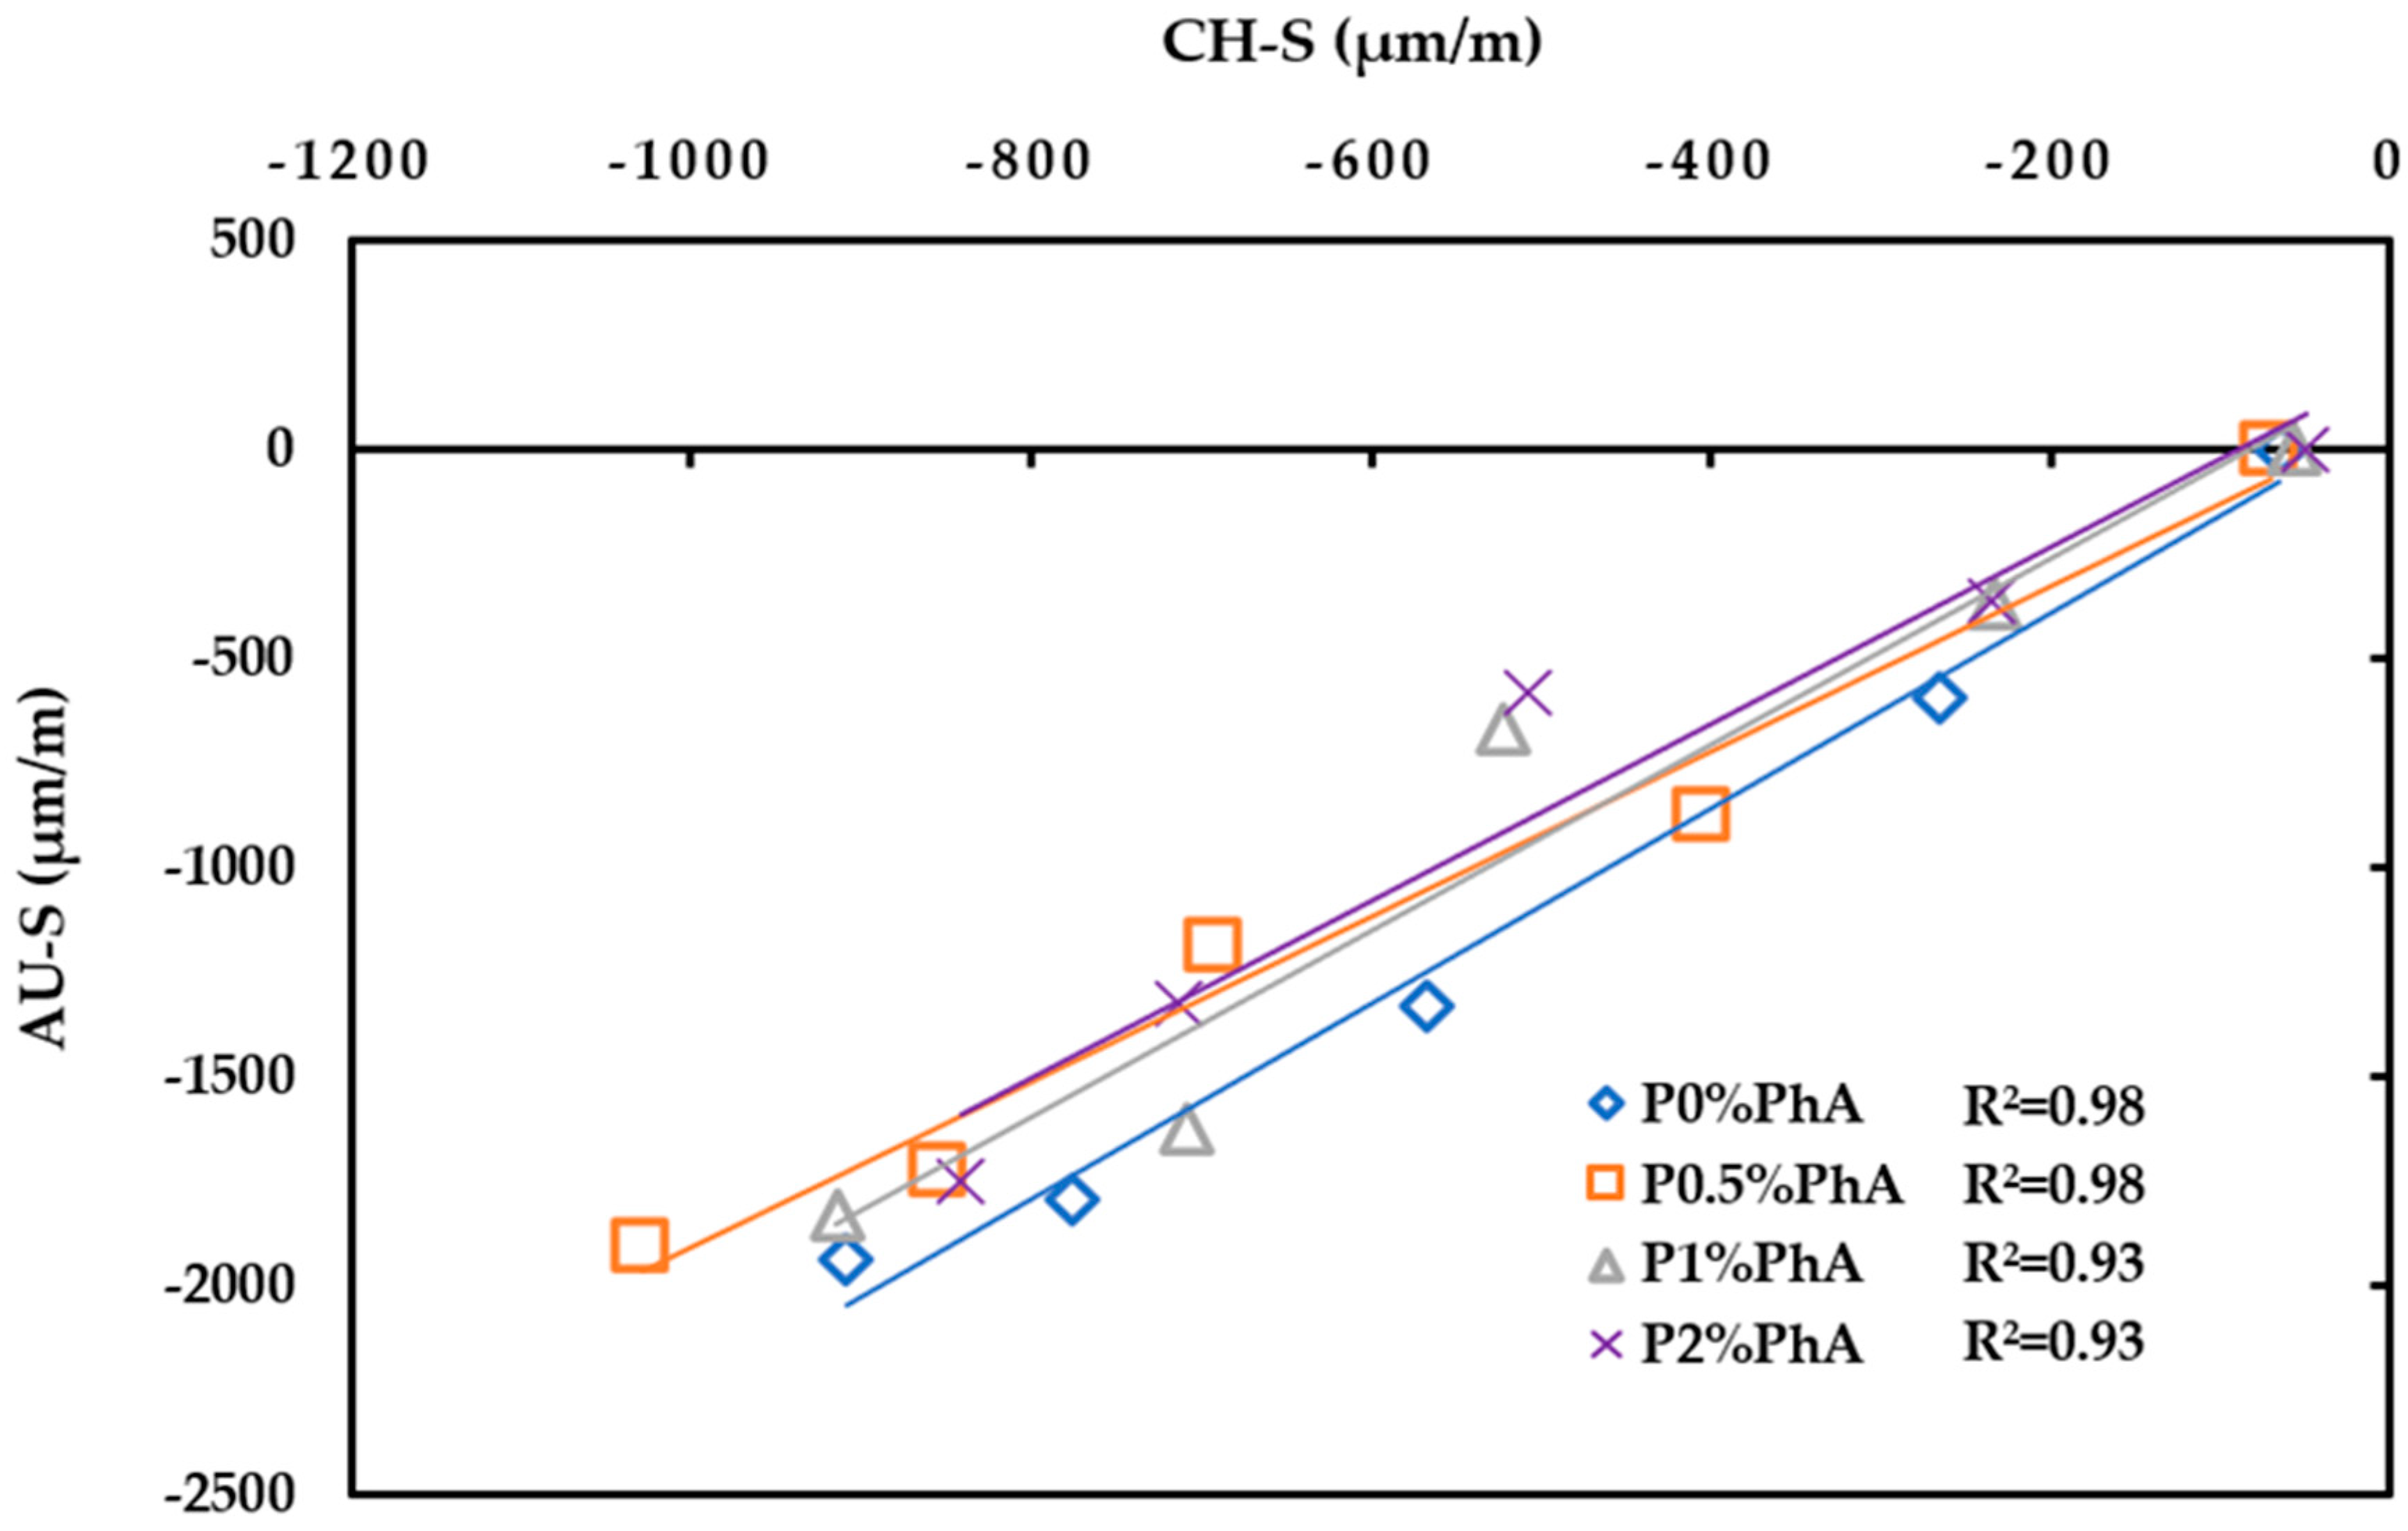
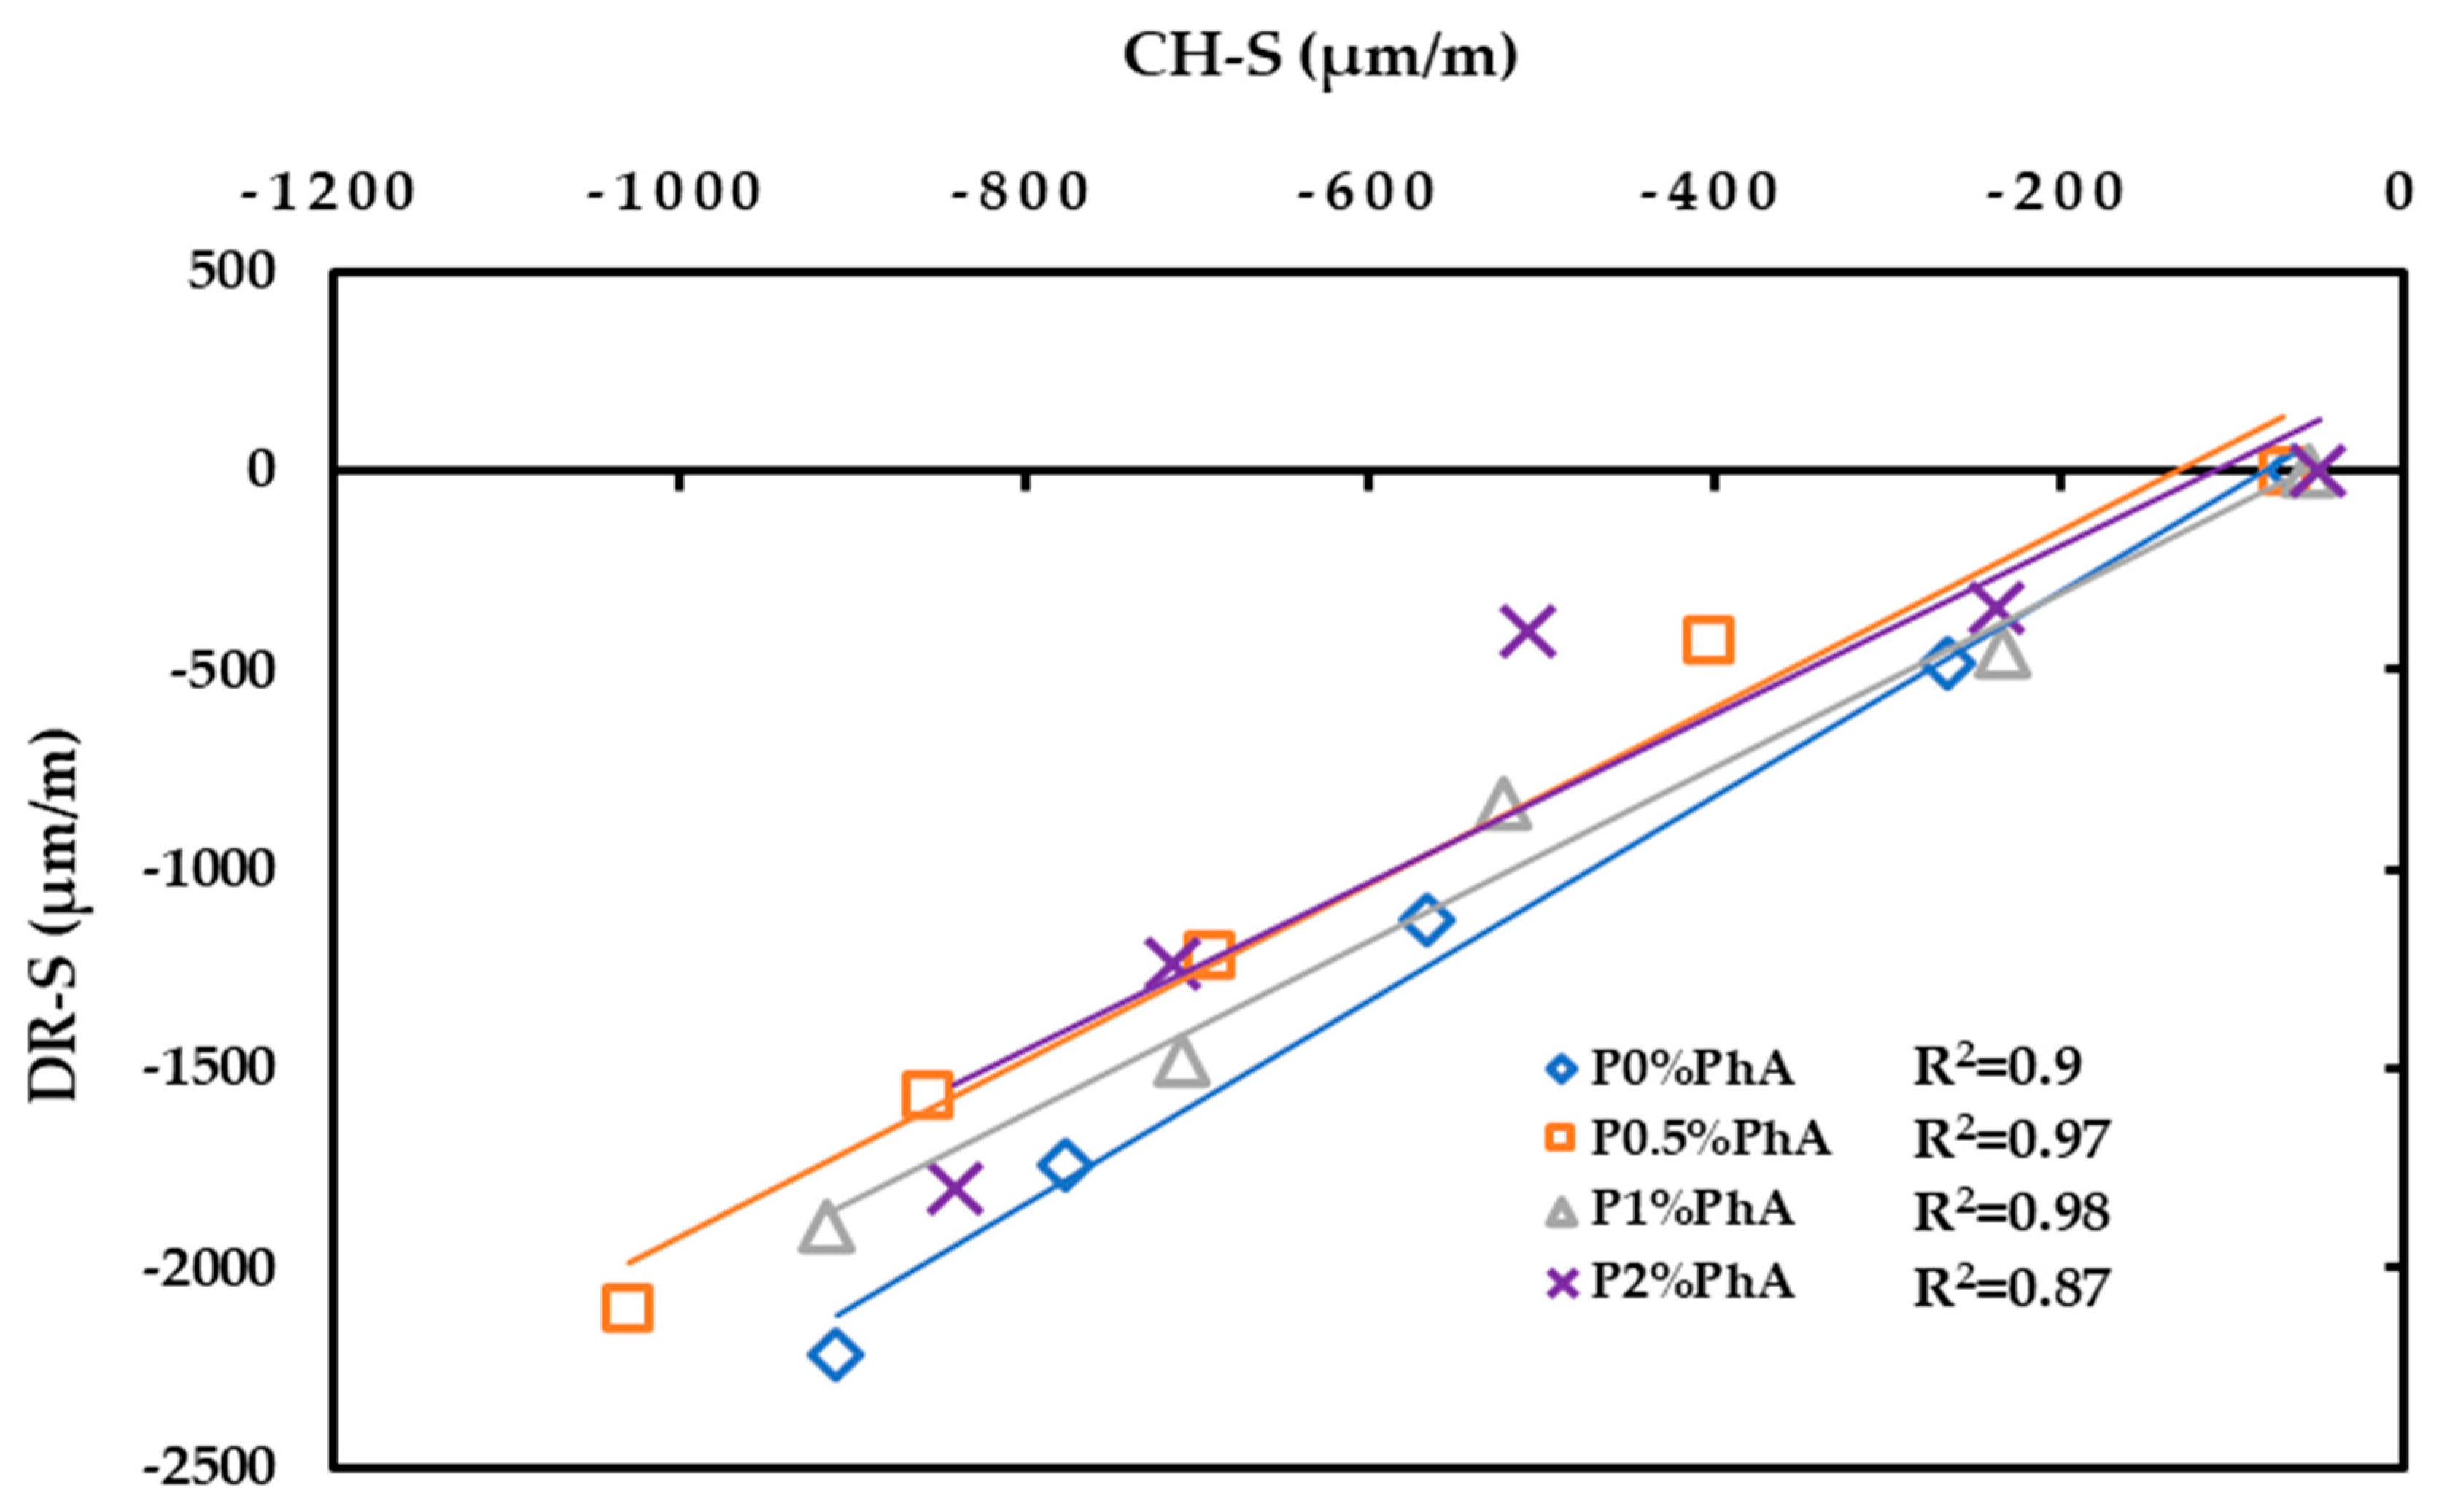
3.5. Correlations between Shrinkage Parameters
4. Conclusions and Recommendations
- The presence of fibers in the paste resulted in a decrease in the compressive strength. This drop was more noticeable for 2% PhA fibers, where drops of 26.3% and 17.4% were observed at 3 and 180 days, respectively.
- Adding 0.5 and 2% PhA fibers to the mix resulted in a decrease in the flexural strength. At 180 days of curing, this decrease was 3.4 and 22.2% for the paste containing 0.5 and 2% PhA, respectively. However, at 1% PhA fibers, there was a slight increase in the flexural strength, where a 7.5% increase was observed at 180 days.
- Incorporating PhA fibers up to 2% notably reduced the shrinkage and expansion of the paste. In comparison to the control mix, the CH-S, AU-S, DR-S, and EXP decreased by 15.3%, 10%, 18.7%, and 9.3%, respectively, at 180 days.
- The application of the hyperbolic model proved accurate in predicting the length changes over 180 d, with a coefficient of correlation of R2 > 0.9. With an increase in the PhA fiber percentage, there was a consistent reduction in the ultimate length change.
- The high coefficient of determination (R2 > 0.8) showed a positive correlation between the CH-S and the other shrinkage parameters (i.e., AU-S and DR-S). Conversely, there was a negative correlation between CH-S and EXP.
- Understanding the volume stability of a paste can lead to predicting a better behavior for mortar and concrete. Therefore, future research should focus on the volume stability of cementitious systems, such as mortar and concrete, containing PhA fibers. Such research efforts could lead to the development of guidelines for optimizing the use of PhA fibers in various paste applications within the construction industry.
Author Contributions
Funding
Data Availability Statement
Acknowledgments
Conflicts of Interest
References
- Lee, Y.S. Achieving Sustainability in Concrete and Construction: Challenges and Opportunities. J. Civ. Constr. Eng. 2022, 8, 17–26. [Google Scholar]
- Noël, M.; Sanchez, L.; Fathifazl, G. Recent advances in sustainable concrete for structural applications. Sustain. Constr. Mater. Technol. 2016, 4, 1–11. [Google Scholar]
- Kioumarsi, M.; Plevris, V. Advanced Concrete and Construction Materials for Sustainable Structures. Sustainability 2024, 16, 1427. [Google Scholar] [CrossRef]
- Hertwich, E.G. Increased carbon footprint of materials production driven by rise in investments. Nat. Geosci. 2021, 14, 151–155. [Google Scholar] [CrossRef]
- Day, J.W.; Rybczyk, J.M. Global change impacts on the future of coastal systems: Perverse interactions among climate change, ecosystem degradation, energy scarcity, and population. In Coasts Estuaries; Elsevier: Amsterdam, The Netherlands, 2019; pp. 621–639. [Google Scholar] [CrossRef]
- Khatib, J.; Ramadan, R.; Ghanem, H.; ElKordi, A. Effect of using limestone fines on the chemical shrinkage of pastes and mortars. Environ. Sci. Pollut. Res. 2023, 30, 25287–25298. [Google Scholar] [CrossRef] [PubMed]
- Khatib, J.M.; Ramadan, R.; Ghanem, H.; Elkordi, A.; Sonebi, M. Effect of limestone fines as a partial replacement of cement on the chemical, autogenous, drying shrinkage and expansion of mortars. Mater. Today Proc. 2022, 58, 1199–1204. [Google Scholar] [CrossRef]
- Khatib, J.M.; Ramadan, R.; Ghanem, H.; Elkordi, A.; Baalbaki, O.; Kırgız, M. Chemical shrinkage of paste and mortar containing limestone fines. Mater. Today Proc. 2022, 61, 530–536. [Google Scholar] [CrossRef]
- Ramadan, R.; Ghanem, H.; Khatib, J.; Elkordi, A. Effect of hot weather concreting on the mechanical and durability properties of concrete-a review. BAU J. Sci. Technol. 2022, 4, 4. [Google Scholar] [CrossRef]
- Khatib, J.; Ramadan, R.; Ghanem, H.; Elkordi, A. Volume Stability of Pastes Containing Limestone Fines. Buildings 2021, 11, 366. [Google Scholar] [CrossRef]
- Lai, G.; Liu, X.; Li, S.; Xu, Y.; Zheng, Y.; Guan, J.; Gao, R.; Wei, Z.; Wang, Z.; Cui, S. Development of chemical admixtures for green and environmentally friendly concrete: A review. J. Clean. Prod. 2023, 389, 136116. [Google Scholar] [CrossRef]
- Liu, J.; Yu, C.; Shu, X.; Ran, Q.; Yang, Y. Recent advance of chemical admixtures in concrete. Cem. Concr. Res. 2019, 124, 105834. [Google Scholar] [CrossRef]
- Ahmad, J.; Majdi, A.; Deifalla, A.F.; Ben Kahla, N.; El-Shorbagy, M.A. Concrete reinforced with sisal fibers (SSF): Overview of mechanical and physical properties. Crystals 2022, 12, 952. [Google Scholar] [CrossRef]
- Ranjitham, M.; Mohanraj, S.; Ajithpandi, K.; Akileswaran, S.; Sree, S.K. Strength properties of coconut fibre reinforced concrete. In Proceedings of the AIP Conference Proceedings, Tamilnadu, India, 8–9 March 2019; AIP Publishing: Long Island, NY, USA, 2019; Volume 2128. [Google Scholar]
- Asim, M.; Uddin, G.M.; Jamshaid, H.; Raza, A.; Hussain, U.; Satti, A.N.; Hayat, N.; Arafat, S.M. Comparative experimental investigation of natural fibers reinforced light weight concrete as thermally efficient building materials. J. Build. Eng. 2020, 31, 101411. [Google Scholar] [CrossRef]
- Shah, I.; Li, J.; Yang, S.; Zhang, Y.; Anwar, A. Experimental investigation on the mechanical properties of natural fiber reinforced concrete. J. Renew. Mater. 2022, 10, 1307. [Google Scholar] [CrossRef]
- Abd Khalid, N.H.B.; Yatim, J.M.; Rahman, W.A.W.A. Temperature Effects on Tensile Properties of Kenaf Bast Fiber. In Empowering Science, Technology and Innovation towards a Better Tomorrow; UMTAS: Kuala Terengganu, Malaysia, 2011. [Google Scholar]
- Hart, A.; Summerscales, J. Effect of time at temperature for natural fibres. Procedia Eng. 2017, 200, 269–275. [Google Scholar] [CrossRef]
- Placet, V. Characterization of the thermo-mechanical behaviour of Hemp fibres intended for the manufacturing of high performance composites. Compos. Part A Appl. Sci. Manuf. 2009, 40, 1111–1118. [Google Scholar] [CrossRef]
- Gupta, M.K.; Srivastava, R.K.; Bisaria, H. Potential of jute fibre reinforced polymer composites: A review. Int. J. Fiber Text. Res 2015, 5, 30–38. [Google Scholar]
- Zhang, D.; Tan, K.H.; Dasari, A.; Weng, Y. Effect of natural fibers on thermal spalling resistance of ultra-high performance concrete. Cem. Concr. Compos. 2020, 109, 103512. [Google Scholar] [CrossRef]
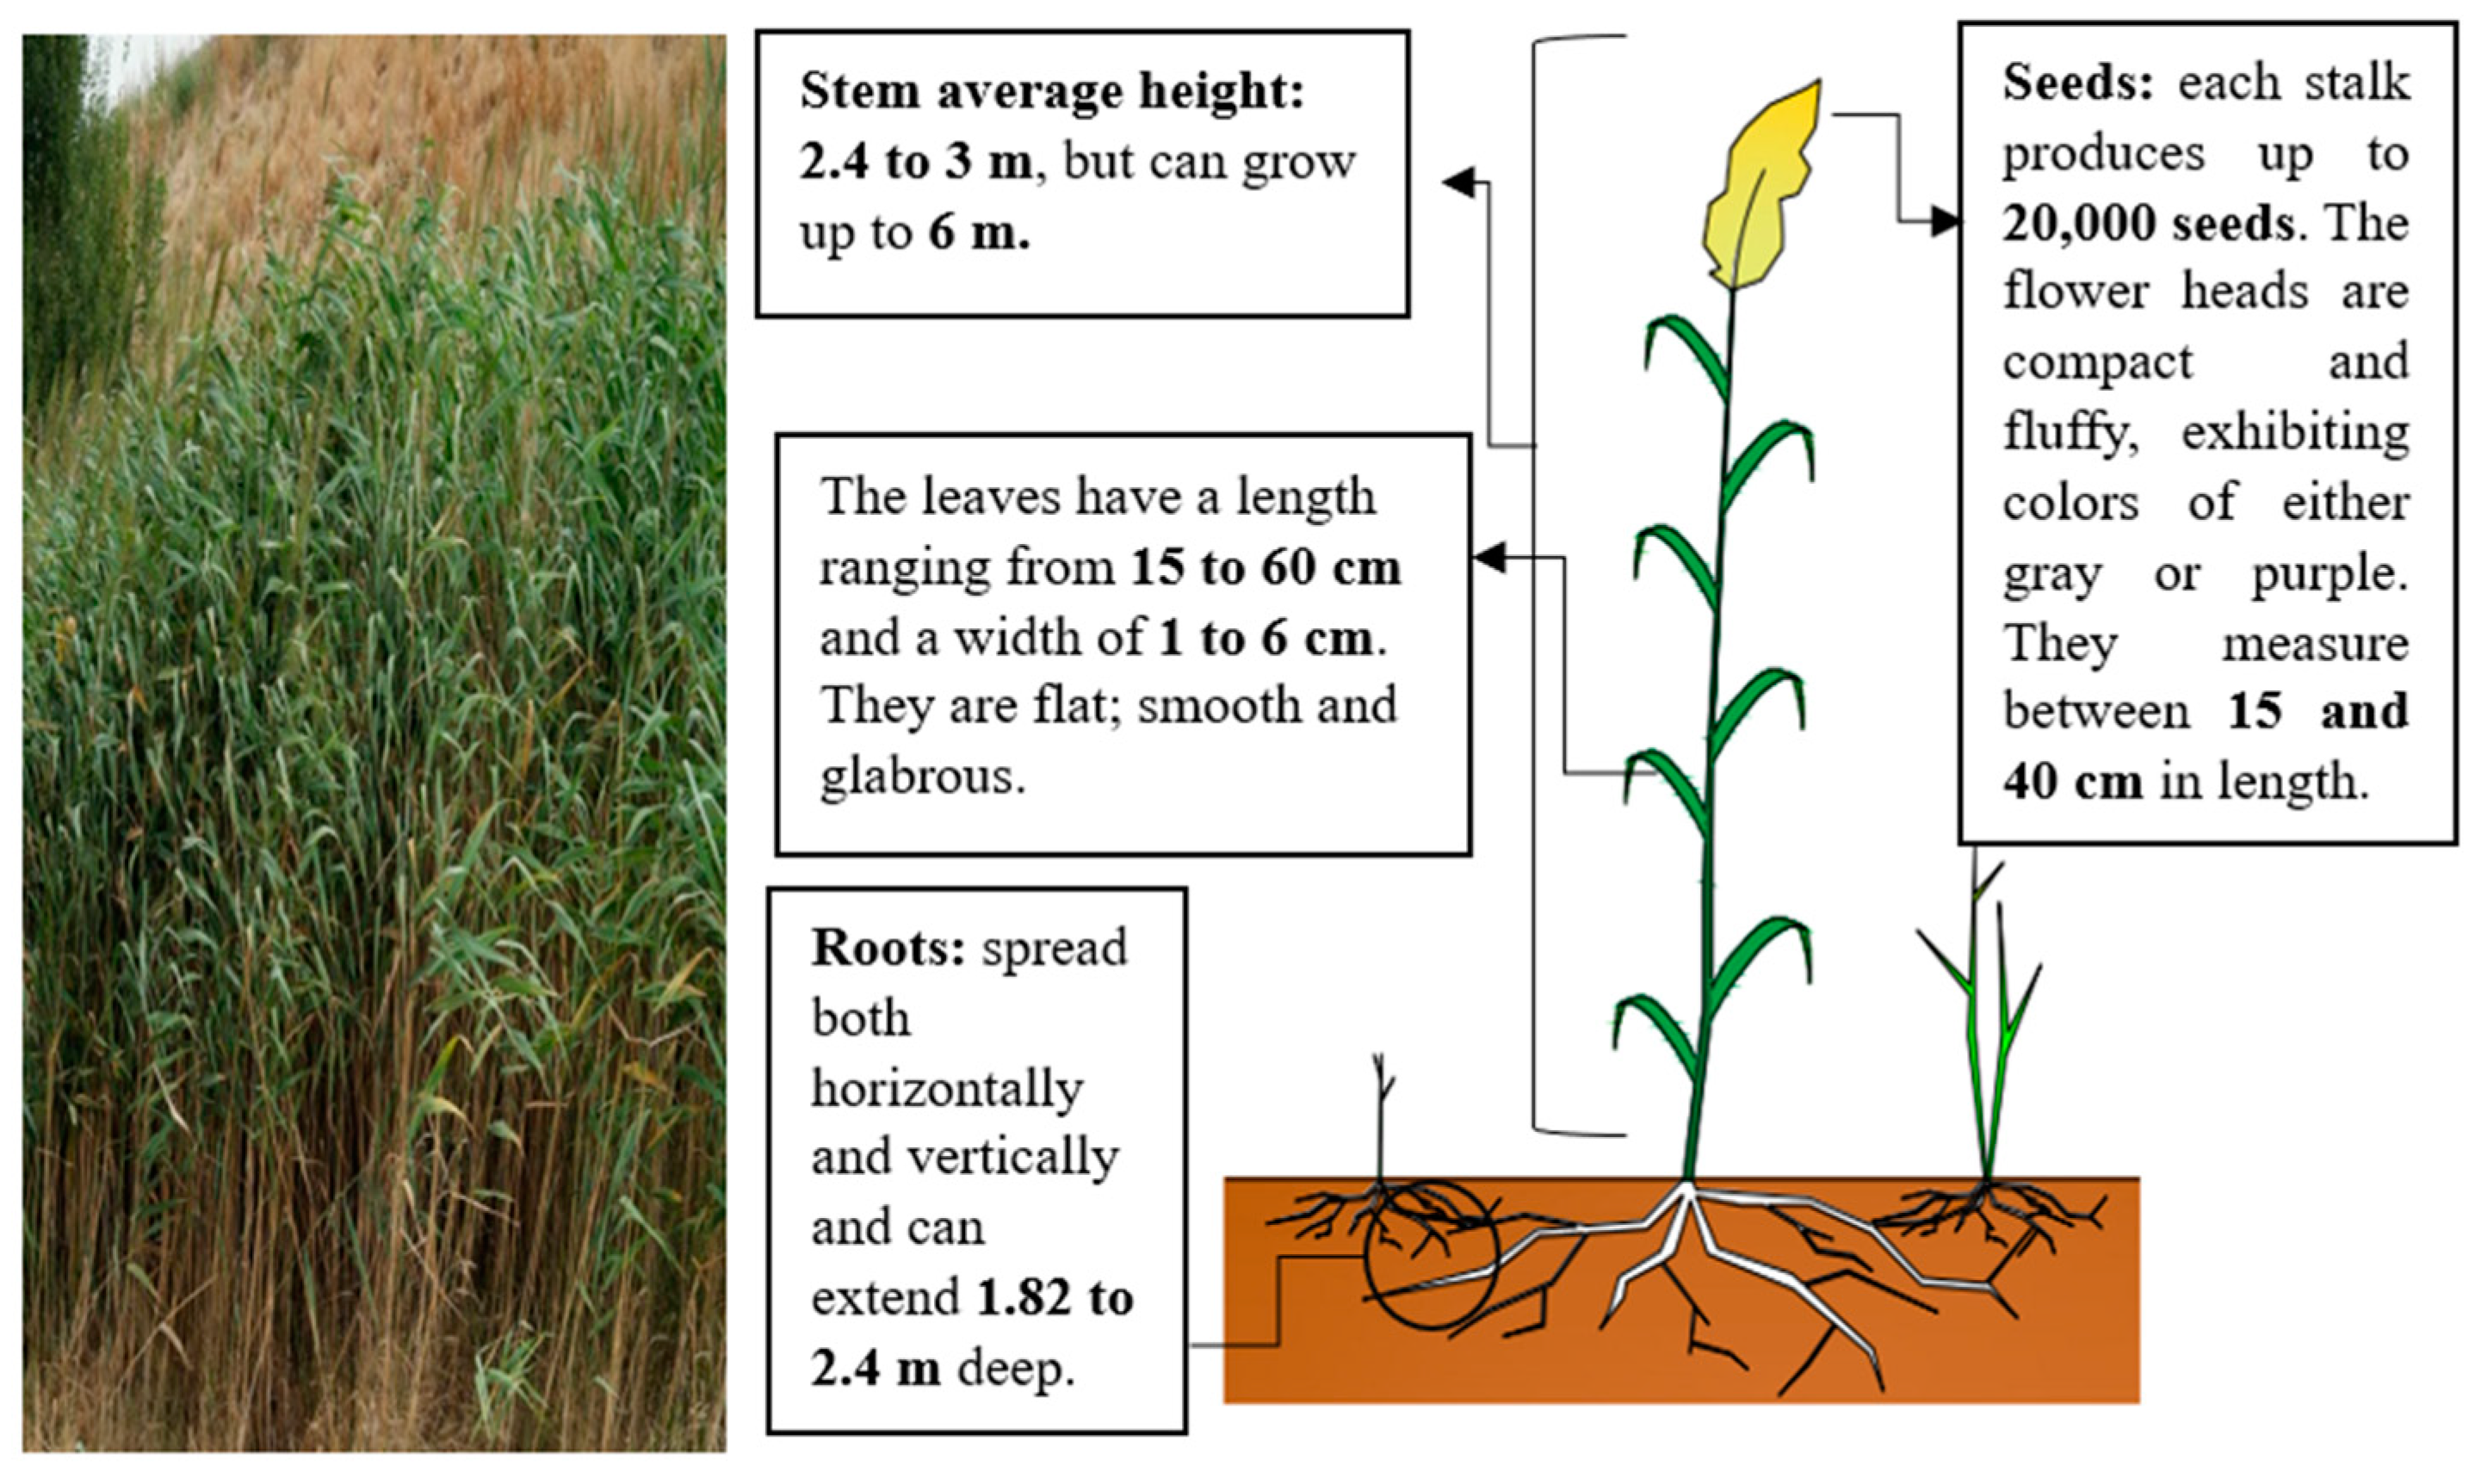
- Eller, F.; Skálová, H.; Caplan, J.S.; Bhattarai, G.P.; Burger, M.K.; Cronin, J.T.; Guo, W.Y.; Guo, X.; Hazelton, E.L.; Kettenring, K.M.; et al. Cosmopolitan species as models for ecophysiological responses to global change: The common reed Phragmites australis. Front. Plant Sci. 2017, 8, 1833. [Google Scholar] [CrossRef]
- Packer, J.G.; Meyerson, L.A.; Skálová, H.; Pyšek, P.; Kueffer, C. Biological flora of the British Isles: Phragmites australis. J. Ecol. 2017, 105, 1123–1162. [Google Scholar] [CrossRef]
- Ramadan, R.; Jahami, A.; Khatib, J.; El-Hassan, H.; Elkordi, A. Improving Structural Performance of Reinforced Concrete Beams with Phragmites Australis Fiber and Waste Glass Additives. Appl. Sci. 2023, 13, 4206. [Google Scholar] [CrossRef]
- Ramadan, R.; Khatib, J.; Ghorbel, E.; Elkordi, A. Effect of Adding Phragmites-Australis Plant on the Chemical Shrinkage and Mechanical Properties of Mortar. In Proceedings of the International Conference on Bio-Based Building Materials, Vienna, Austria, 21–23 June 2023; Springer Nature: Cham, Switzerland, 2023; pp. 573–584. [Google Scholar]
- Islam, M.S.; Ahmed, S.J. Influence of jute fiber on concrete properties. Constr. Build. Mater. 2018, 189, 768–776. [Google Scholar] [CrossRef]
- Bheel, N.; Tafsirojjaman, T.; Liu, Y.; Awoyera, P.; Kumar, A.; Keerio, M.A. Experimental study on engineering properties of cement concrete reinforced with nylon and jute fibers. Buildings 2021, 11, 454. [Google Scholar] [CrossRef]
- Jamshaid, H.; Mishra, R.K.; Raza, A.; Hussain, U.; Rahman, M.L.; Nazari, S.; Chandan, V.; Muller, M.; Choteborsky, R. Natural cellulosic fiber reinforced concrete: Influence of fiber type and loading percentage on mechanical and water absorption performance. Materials 2022, 15, 874. [Google Scholar] [CrossRef]
- Ahmad, J.; Arbili, M.M.; Majdi, A.; Althoey, F.; Farouk Deifalla, A.; Rahmawati, C. Performance of concrete reinforced with jute fibers (natural fibers): A review. J. Eng. Fibers Fabr. 2022, 17, 15589250221121871. [Google Scholar] [CrossRef]
- ASTM C 490-04; Standard Practice for Use of Apparatus for the Determination of Length Change of Hardened Cement Paste, Mortar, and Concrete. Annual Book of ASTM Standards 2004, Section 4. vol. 04.02 (Concrete and Aggregates); ASTM: Philadelphia, PA, USA, 2004.
- ASTM C 1608; Standard Test Method for Chemical Shrinkage of Hydraulic Cement Paste. American Society for Testing and Materials: West Conshohocken, PA, USA, 2007.
- ASTM C138/C138M-13; Standard Test Method for Density (Unit Weight), Yield, and Air Content (Gravimetric) of Concrete. American Society for Testing and Materials (ASTM) International: West Conshohocken, PA, USA, 2013.
- ASTM C597; Standard Method for Pulse Velocity Through Concrete. ASTM International: West Conshohocken, PA, USA, 2016.
- EN 1015-11; Methods of Test for Mortar for Masonry—Part 11: Determination of Flexural and Compressive Strength of Hardened Mortar. British Standards Institution (BSI): London, UK, 2007.
- Khatib, J.; Ramadan, R.; Ghanem, H.; Elkordi, A. Effect of Adding Phragmites-Australis Fiber on the Mechanical Properties and Volume Stability of Mortar. Fibers 2024, 12, 14. [Google Scholar] [CrossRef]
- Ghanem, H.; Ramadan, R.; Khatib, J.; Elkordi, A. A Review on Chemical and Autogenous Shrinkage of Cementitious Systems. Materials 2024, 17, 283. [Google Scholar] [CrossRef]
- Bheel, N.; Sohu, S.; Awoyera, P.; Kumar, A.; Abbasi, S.A.; Olalusi, O.B. Effect of wheat straw ash on fresh and hardened concrete reinforced with jute fiber. Adv. Civ. Eng. 2021, 2021, 6659125. [Google Scholar] [CrossRef]
- Bessadok, A.; Roudesli, S.; Marais, S.; Follain, N.; Lebrun, L. Alfa fibres for unsaturated polyester composites reinforcement: Effects of chemical treatments on mechanical and permeation properties. Compos. Part A Appl. Sci. Manuf. 2009, 40, 184–195. [Google Scholar] [CrossRef]
- Kaplan, G.; Bayraktar, O.Y. The effect of hemp fiber usage on the mechanical and physical properties of cement-based mortars. Res. Eng. Struct. Mater. 2021, 7, 245–258. [Google Scholar] [CrossRef]
- Othuman Mydin, M.A.; Mohd Zamzani, N.; Abdul Ghani, A.N. Influence of elevated temperatures on compressive and flexural strengths of Cocos nucifera Linn. fiber strengthened lightweight foamcrete. Rev. Construcción 2020, 19, 112–126. [Google Scholar] [CrossRef]
- Awoyera, P.O.; Odutuga, O.L.; Effiong, J.U.; De Jesus Silvera Sarmiento, A.; Mortazavi, S.J.; Hu, J.W. Development of Fibre-Reinforced Cementitious Mortar with Mineral Wool and Coconut Fibre. Materials 2022, 15, 4520. [Google Scholar] [CrossRef]
- Çavdar, A. A study on the effects of high temperature on mechanical properties of fiber reinforced cementitious composites. Compos. Part B Eng. 2012, 43, 2452–2463. [Google Scholar] [CrossRef]
- Ferreira, S.R.; Silva, L.E.; McCaffrey, Z.; Ballschmiede, C.; Koenders, E. Effect of elevated temperature on sisal fibers degradation and its interface to cement based systems. Constr. Build. Mater. 2021, 272, 121613. [Google Scholar] [CrossRef]
- Zhang, Z.; Scherer, G.W. Measuring chemical shrinkage of ordinary Portland cement pastes with high water-to-cement ratios by adding cellulose nanofibrils. Cem. Concr. Compos. 2020, 111, 103625. [Google Scholar] [CrossRef]
- Ren, G.; Yao, B.; Ren, M.; Gao, X. Utilization of natural sisal fibers to manufacture eco-friendly ultra-high-performance concrete with low autogenous shrinkage. J. Clean. Prod. 2022, 332, 130105. [Google Scholar] [CrossRef]
- Zhutovsky, S.; Kovler, K. Influence of water to cement ratio on the efficiency of internal curing of high-performance concrete. Constr. Build. Mater. 2017, 144, 311–316. [Google Scholar] [CrossRef]
- Khandaker, S.; Akter, D.; Hasan, M.; Saifullah, A.; Marwani, H.M.; Islam, A.; Asiri, A.M.; Rahman, M.M.; Hasan, M.M.; Kuba, T.; et al. From industrial jute fibre spinning wastes to biofibre-reinforced plastics. Mater. Chem. Phys. 2024, 313, 128586. [Google Scholar] [CrossRef]
- Kesikidou, F.; Stefanidou, M. Natural fiber-reinforced mortars. J. Build. Eng. 2019, 25, 100786. [Google Scholar] [CrossRef]
- Miah, M.J.; Li, Y.; Paul, S.C.; Babafemi, A.J.; Jang, J.G. Mechanical strength, shrinkage, and porosity of mortar reinforced with areca nut husk fibers. Constr. Build. Mater. 2023, 363, 129688. [Google Scholar] [CrossRef]
- Nayak, J.R.; Bochen, J.; Gołaszewska, M. Experimental studies on the effect of natural and synthetic fibers on properties of fresh and hardened mortar. Constr. Build. Mater. 2022, 347, 128550. [Google Scholar] [CrossRef]
- Guo, A.; Sun, Z.; Satyavolu, J. Impact of modified kenaf fibers on shrinkage and cracking of cement pastes. Constr. Build. Mater. 2020, 264, 120230. [Google Scholar] [CrossRef]
- Jaberizadeh, M.M.; Danoglidis, P.A.; Shah, S.P.; Konsta-Gdoutos, M.S. Eco-efficient cementitious composites using waste cellulose fibers: Effects on autogenous shrinkage, strength and energy absorption capacity. Constr. Build. Mater. 2023, 408, 133504. [Google Scholar] [CrossRef]
- Yıldırım, M.; Özhan, H.B. Durability properties of basalt fiber-reinforced mortars with different mineral admixtures exposed to high temperatures. Constr. Build. Mater. 2023, 400, 132574. [Google Scholar] [CrossRef]
- Shen, D.; Jiang, J.; Shen, J.; Yao, P.; Jiang, G. Influence of curing temperature on autogenous shrinkage and cracking resistance of high-performance concrete at an early age. Constr. Build. Mater. 2016, 103, 67–76. [Google Scholar] [CrossRef]
- Liu, H.; Lin, H.; Liu, X.; Wang, J.; Pang, X.; Kong, X. Effects of triethanolamine on autogenous shrinkage and drying shrinkage of cement mortar. Constr. Build. Mater. 2021, 304, 124620. [Google Scholar] [CrossRef]
- Mermerdaş, K.; Algın, Z.; Ekmen, Ş. Experimental assessment and optimization of mix parameters of fly ash-based lightweight geopolymer mortar with respect to shrinkage and strength. J. Build. Eng. 2020, 31, 101351. [Google Scholar] [CrossRef]
- Holt, E. Contribution of mixture design to chemical and autogenous shrinkage of concrete at early ages. Cem. Concr. Res. 2005, 35, 464–472. [Google Scholar] [CrossRef]
- Kucharczyková, B.; Daněk, P.; Kocáb, D.; Misák, P. Experimental analysis on shrinkage and swelling in ordinary concrete. Adv. Mater. Sci. Eng. 2017, 2017, 3027301. [Google Scholar] [CrossRef]
- Marušić, E.; Štirmer, N. Autogenous shrinkage and expansion related to compressive strength and concrete composition. J. Adv. Concr. Technol. 2016, 14, 489–501. [Google Scholar] [CrossRef]
- Li, Z.; Guo, T.; Chen, Y.; Yang, W.; Wang, J.; Jin, L. Preparation and properties of pretreated jute fiber cement-based composites. Ind. Crops Prod. 2024, 210, 118090. [Google Scholar] [CrossRef]
- Song, H.; Liu, J.; He, K.; Ahmad, W.A. comprehensive overview of jute fiber reinforced cementitious composites. Case Stud. Constr. Mater. 2021, 15, e00724. [Google Scholar] [CrossRef]
- Aluko, O.G.; Yatim, J.M.; Kadir, M.A.A.; Yahya, K. A review of properties of bio-fibrous concrete exposed to elevated temperatures. Constr. Build. Mater. 2020, 260, 119671. [Google Scholar] [CrossRef]
- Chindaprasirt, P.; Boonbamrung, T.; Poolsong, A.; Kroehong, W. Effect of elevated temperature on polypropylene fiber reinforced alkali-activated high calcium fly ash paste. Case Stud. Constr. Mater. 2021, 15, e00554. [Google Scholar] [CrossRef]
- Fu, Z.; Yao, Y.; Duan, Y.; Wang, B.; Li, X. Failure mechanism of bonding between natural fiber and cement matrix at high temperature. Constr. Build. Mater. 2024, 412, 134724. [Google Scholar] [CrossRef]
- Santos, S.F.; Teixeira, R.S.; Junior, H.S. Interfacial transition zone between lignocellulosic fiber and matrix in cement-based composites. In Sustainable and Nonconventional Construction Materials Using Inorganic Bonded Fiber Composites; Woodhead Publishing: Sawston, UK, 2017; pp. 27–68. [Google Scholar] [CrossRef]


| Quantity (kg/m3) | ||||
|---|---|---|---|---|
| Paste Code | Cement (C) | Water (W) | PhA Fibers | W/C * |
| P0%PhA | 1152.8 | 634.04 | 0 | 0.55 |
| P0.5%PhA | 1152.8 | 634.04 | 3.33 | 0.55 |
| P1%PhA | 1152.8 | 634.04 | 6.65 | 0.55 |
| P2%PhA | 1152.8 | 634.04 | 13.3 | 0.55 |
| Density (kg/m3) | ||||
|---|---|---|---|---|
| Curing Age (Days) | P0%PhA | P0.5%PhA | P1%PhA | P2%PhA |
| 1 | 2060 | 1950 | 1930 | 2100 |
| 3 | 2130 | 2080 | 2150 | 2070 |
| 7 | 2160 | 2130 | 2210 | 2110 |
| 28 | 2190 | 2140 | 2223 | 2120 |
| 90 | 2210 | 2190 | 2230 | 2160 |
| 180 | 2250 | 2220 | 2240 | 2200 |
Disclaimer/Publisher’s Note: The statements, opinions and data contained in all publications are solely those of the individual author(s) and contributor(s) and not of MDPI and/or the editor(s). MDPI and/or the editor(s) disclaim responsibility for any injury to people or property resulting from any ideas, methods, instructions or products referred to in the content. |
© 2024 by the authors. Licensee MDPI, Basel, Switzerland. This article is an open access article distributed under the terms and conditions of the Creative Commons Attribution (CC BY) license (https://creativecommons.org/licenses/by/4.0/).
Share and Cite
Ghanem, H.; Ramadan, R.; Khatib, J.; Elkordi, A. Volume Stability and Mechanical Properties of Cement Paste Containing Natural Fibers from Phragmites-Australis Plant at Elevated Temperature. Buildings 2024, 14, 1170. https://doi.org/10.3390/buildings14041170
Ghanem H, Ramadan R, Khatib J, Elkordi A. Volume Stability and Mechanical Properties of Cement Paste Containing Natural Fibers from Phragmites-Australis Plant at Elevated Temperature. Buildings. 2024; 14(4):1170. https://doi.org/10.3390/buildings14041170
Chicago/Turabian StyleGhanem, Hassan, Rawan Ramadan, Jamal Khatib, and Adel Elkordi. 2024. "Volume Stability and Mechanical Properties of Cement Paste Containing Natural Fibers from Phragmites-Australis Plant at Elevated Temperature" Buildings 14, no. 4: 1170. https://doi.org/10.3390/buildings14041170