
Feasibility of Recycled Aggregate Concrete in a Novel Anchoring Connection for Beam-to-Concrete-Filled Steel Tube Joints

Abstract
:1. Introduction
2. Experimental Program
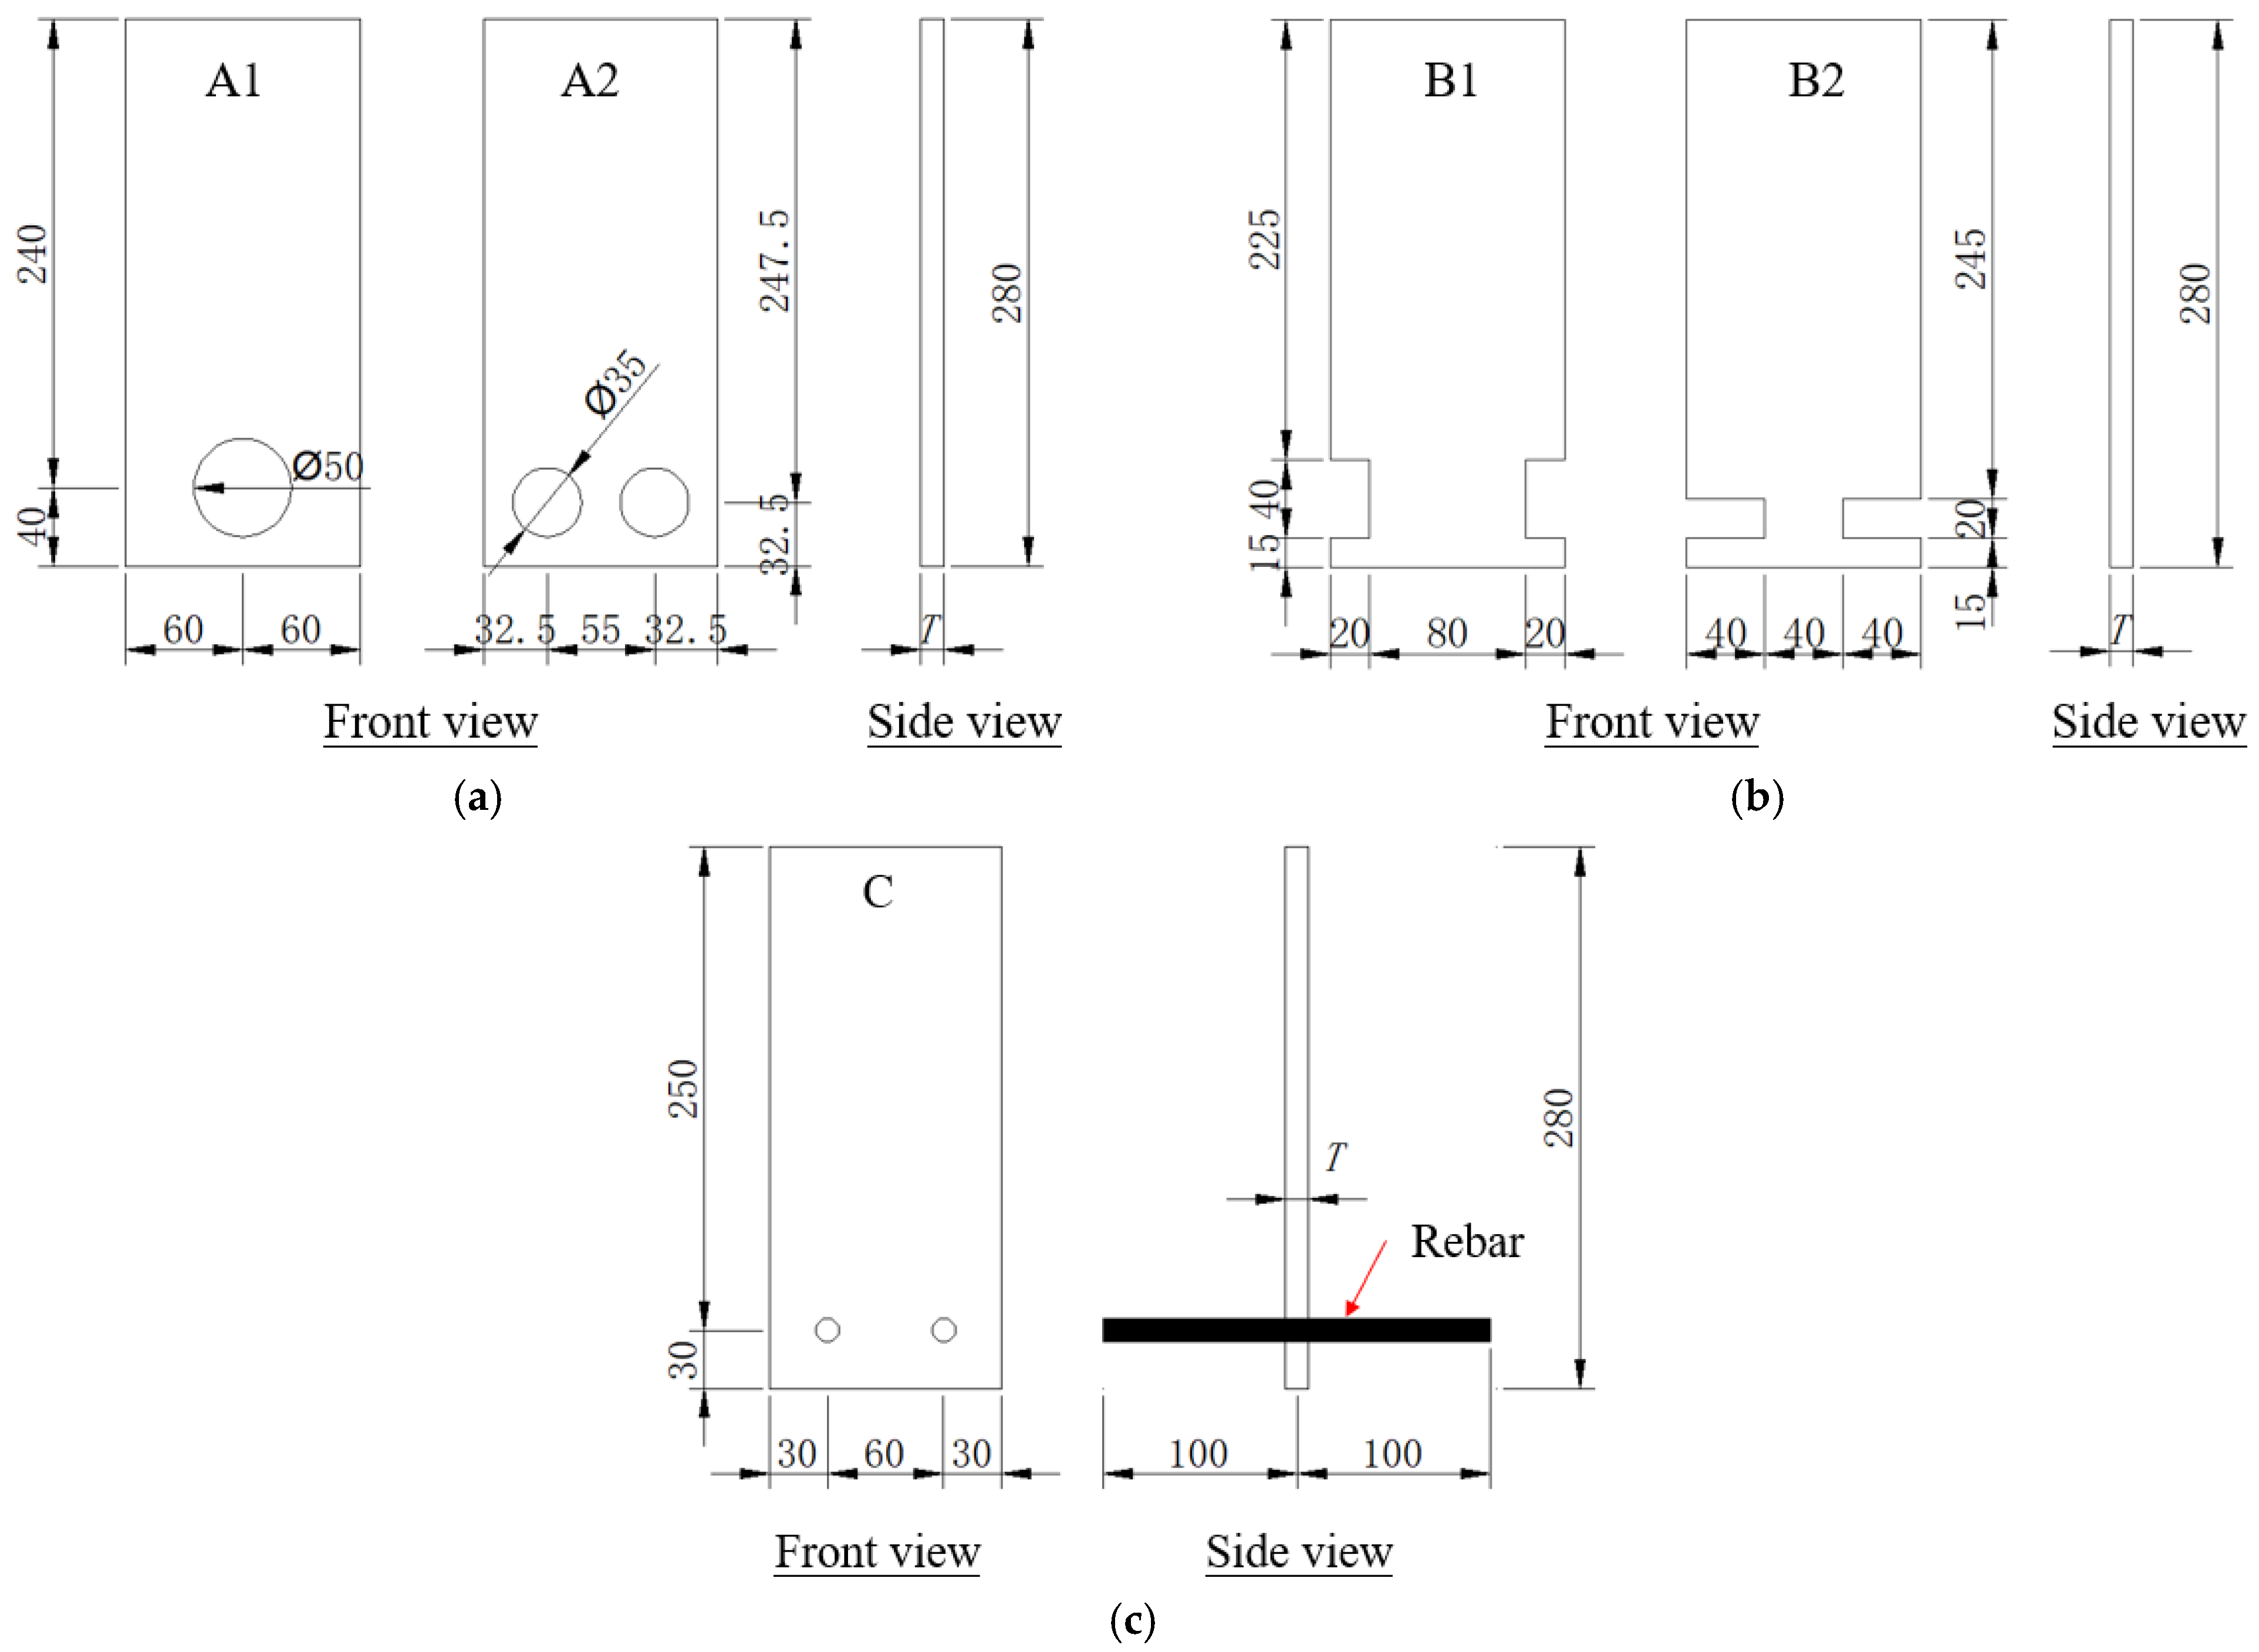
2.1. Specimens
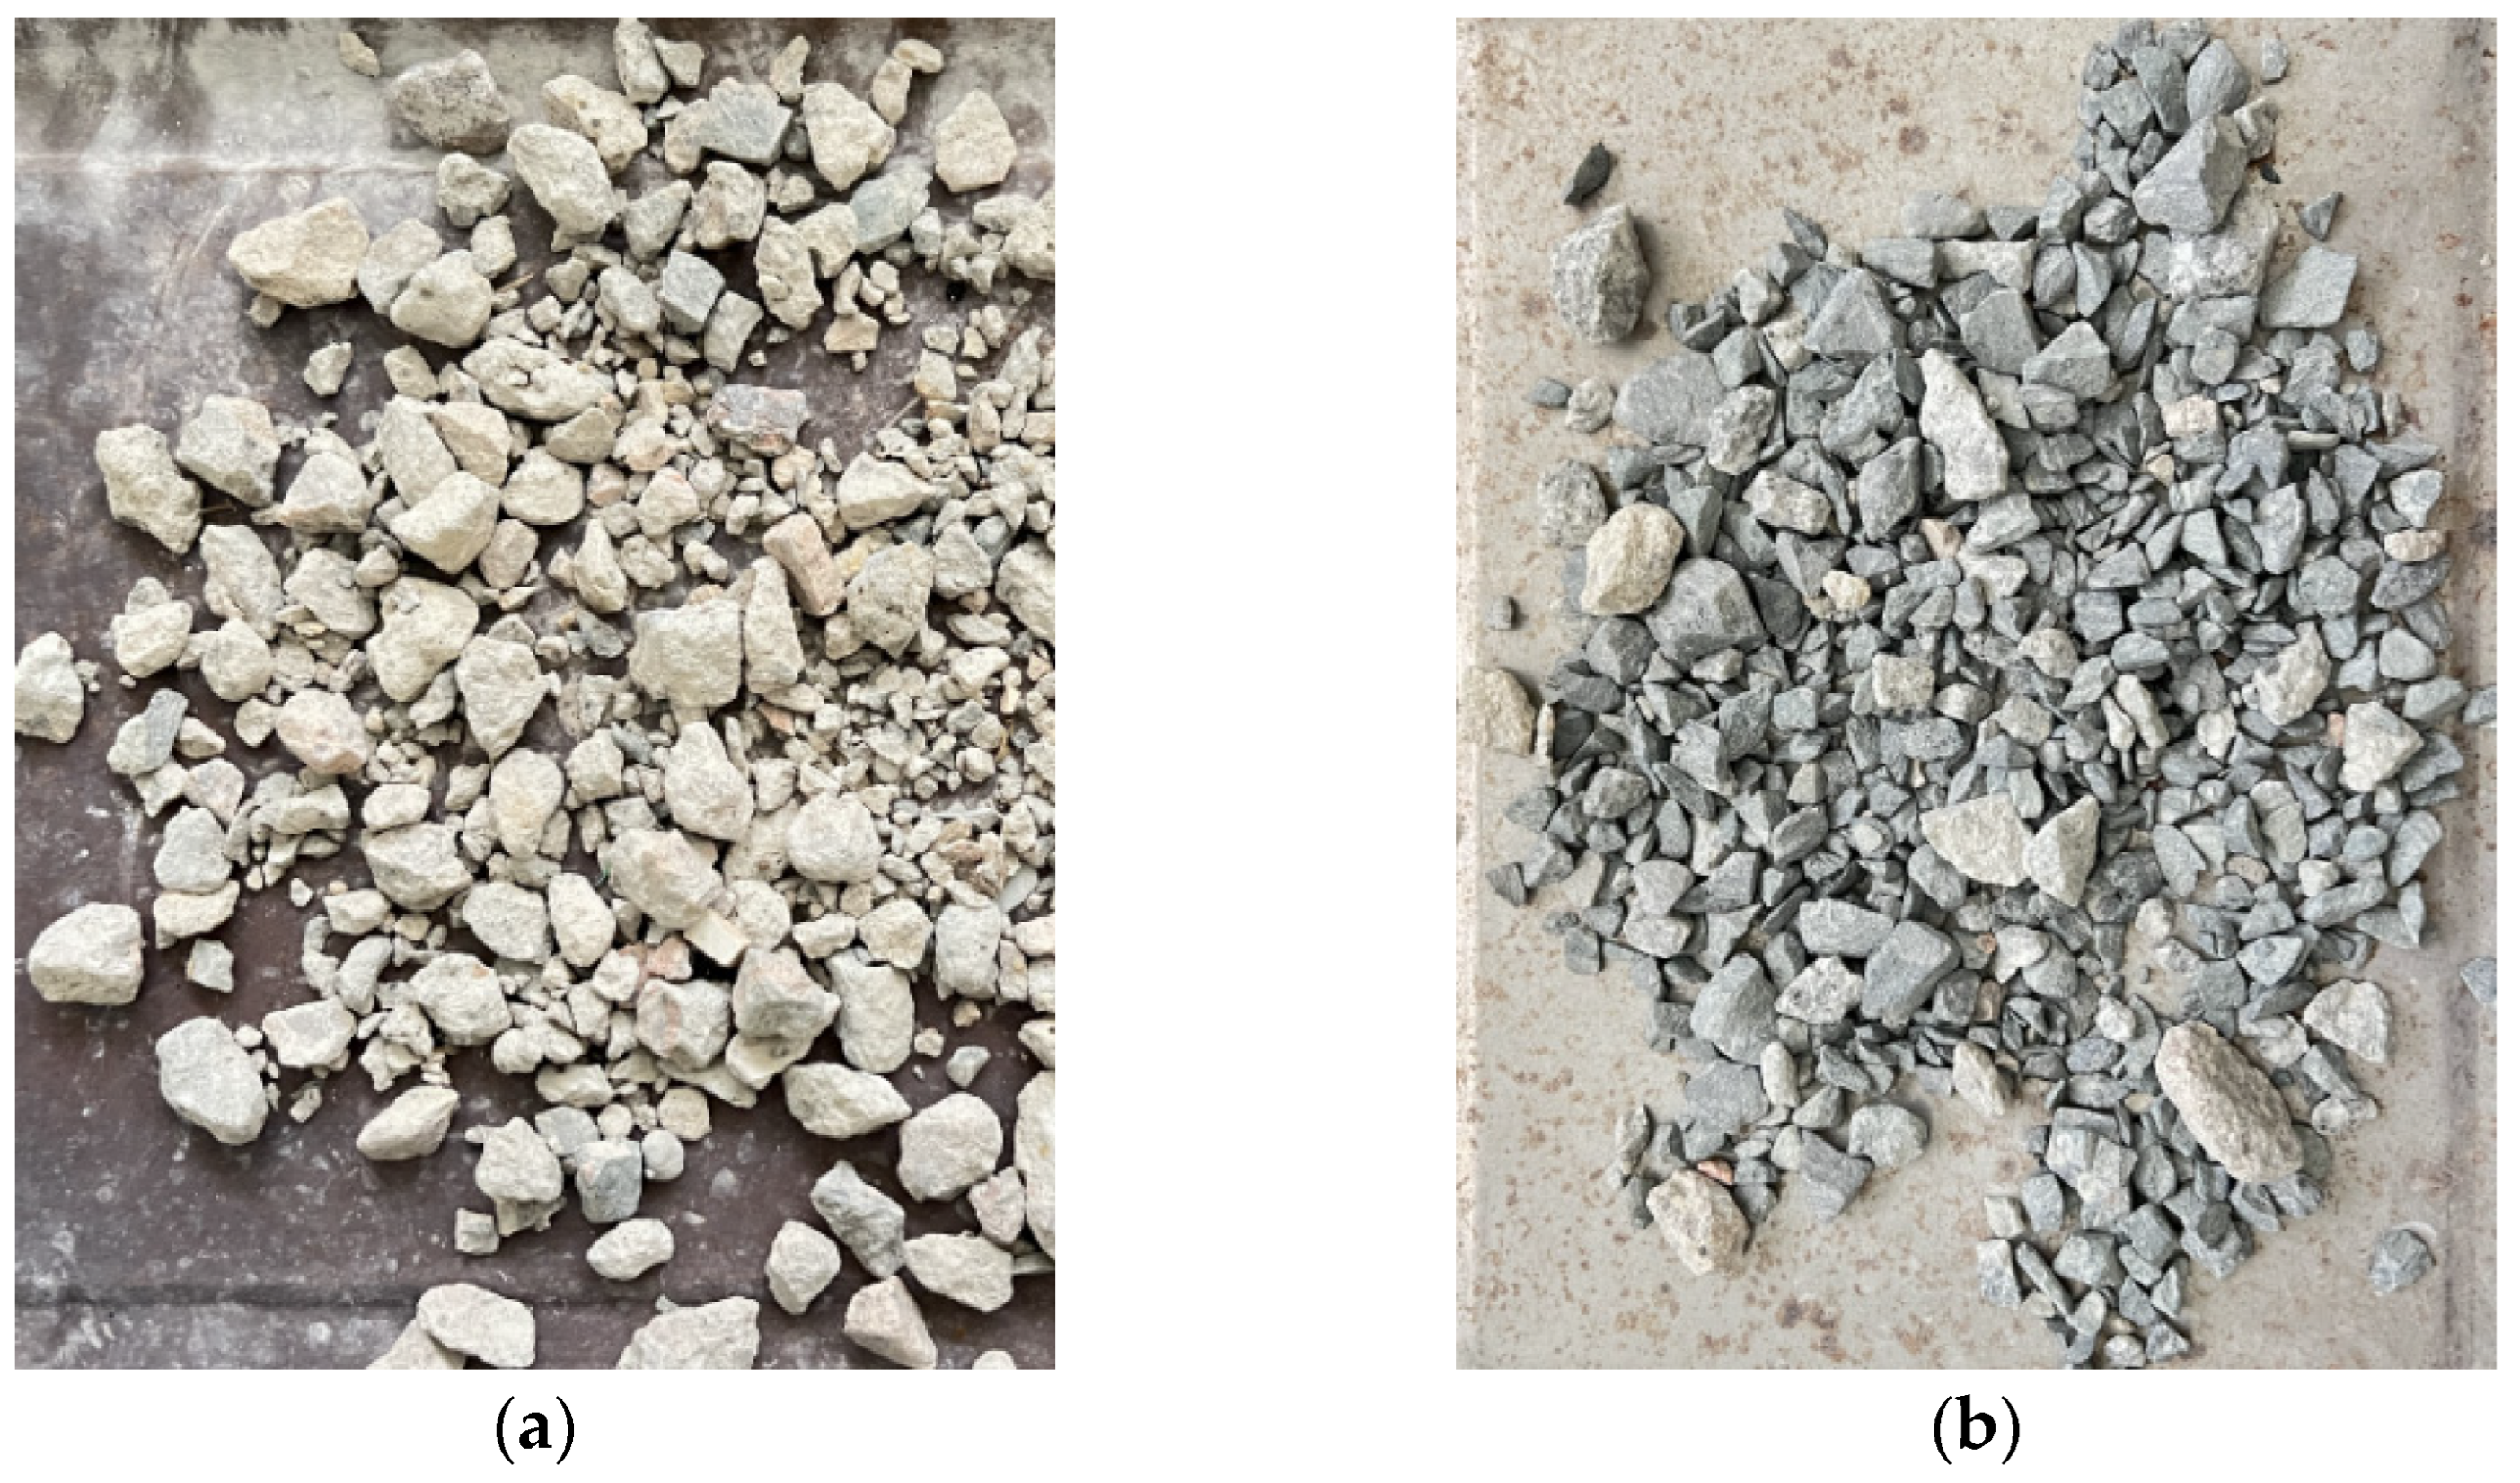
2.2. Materials
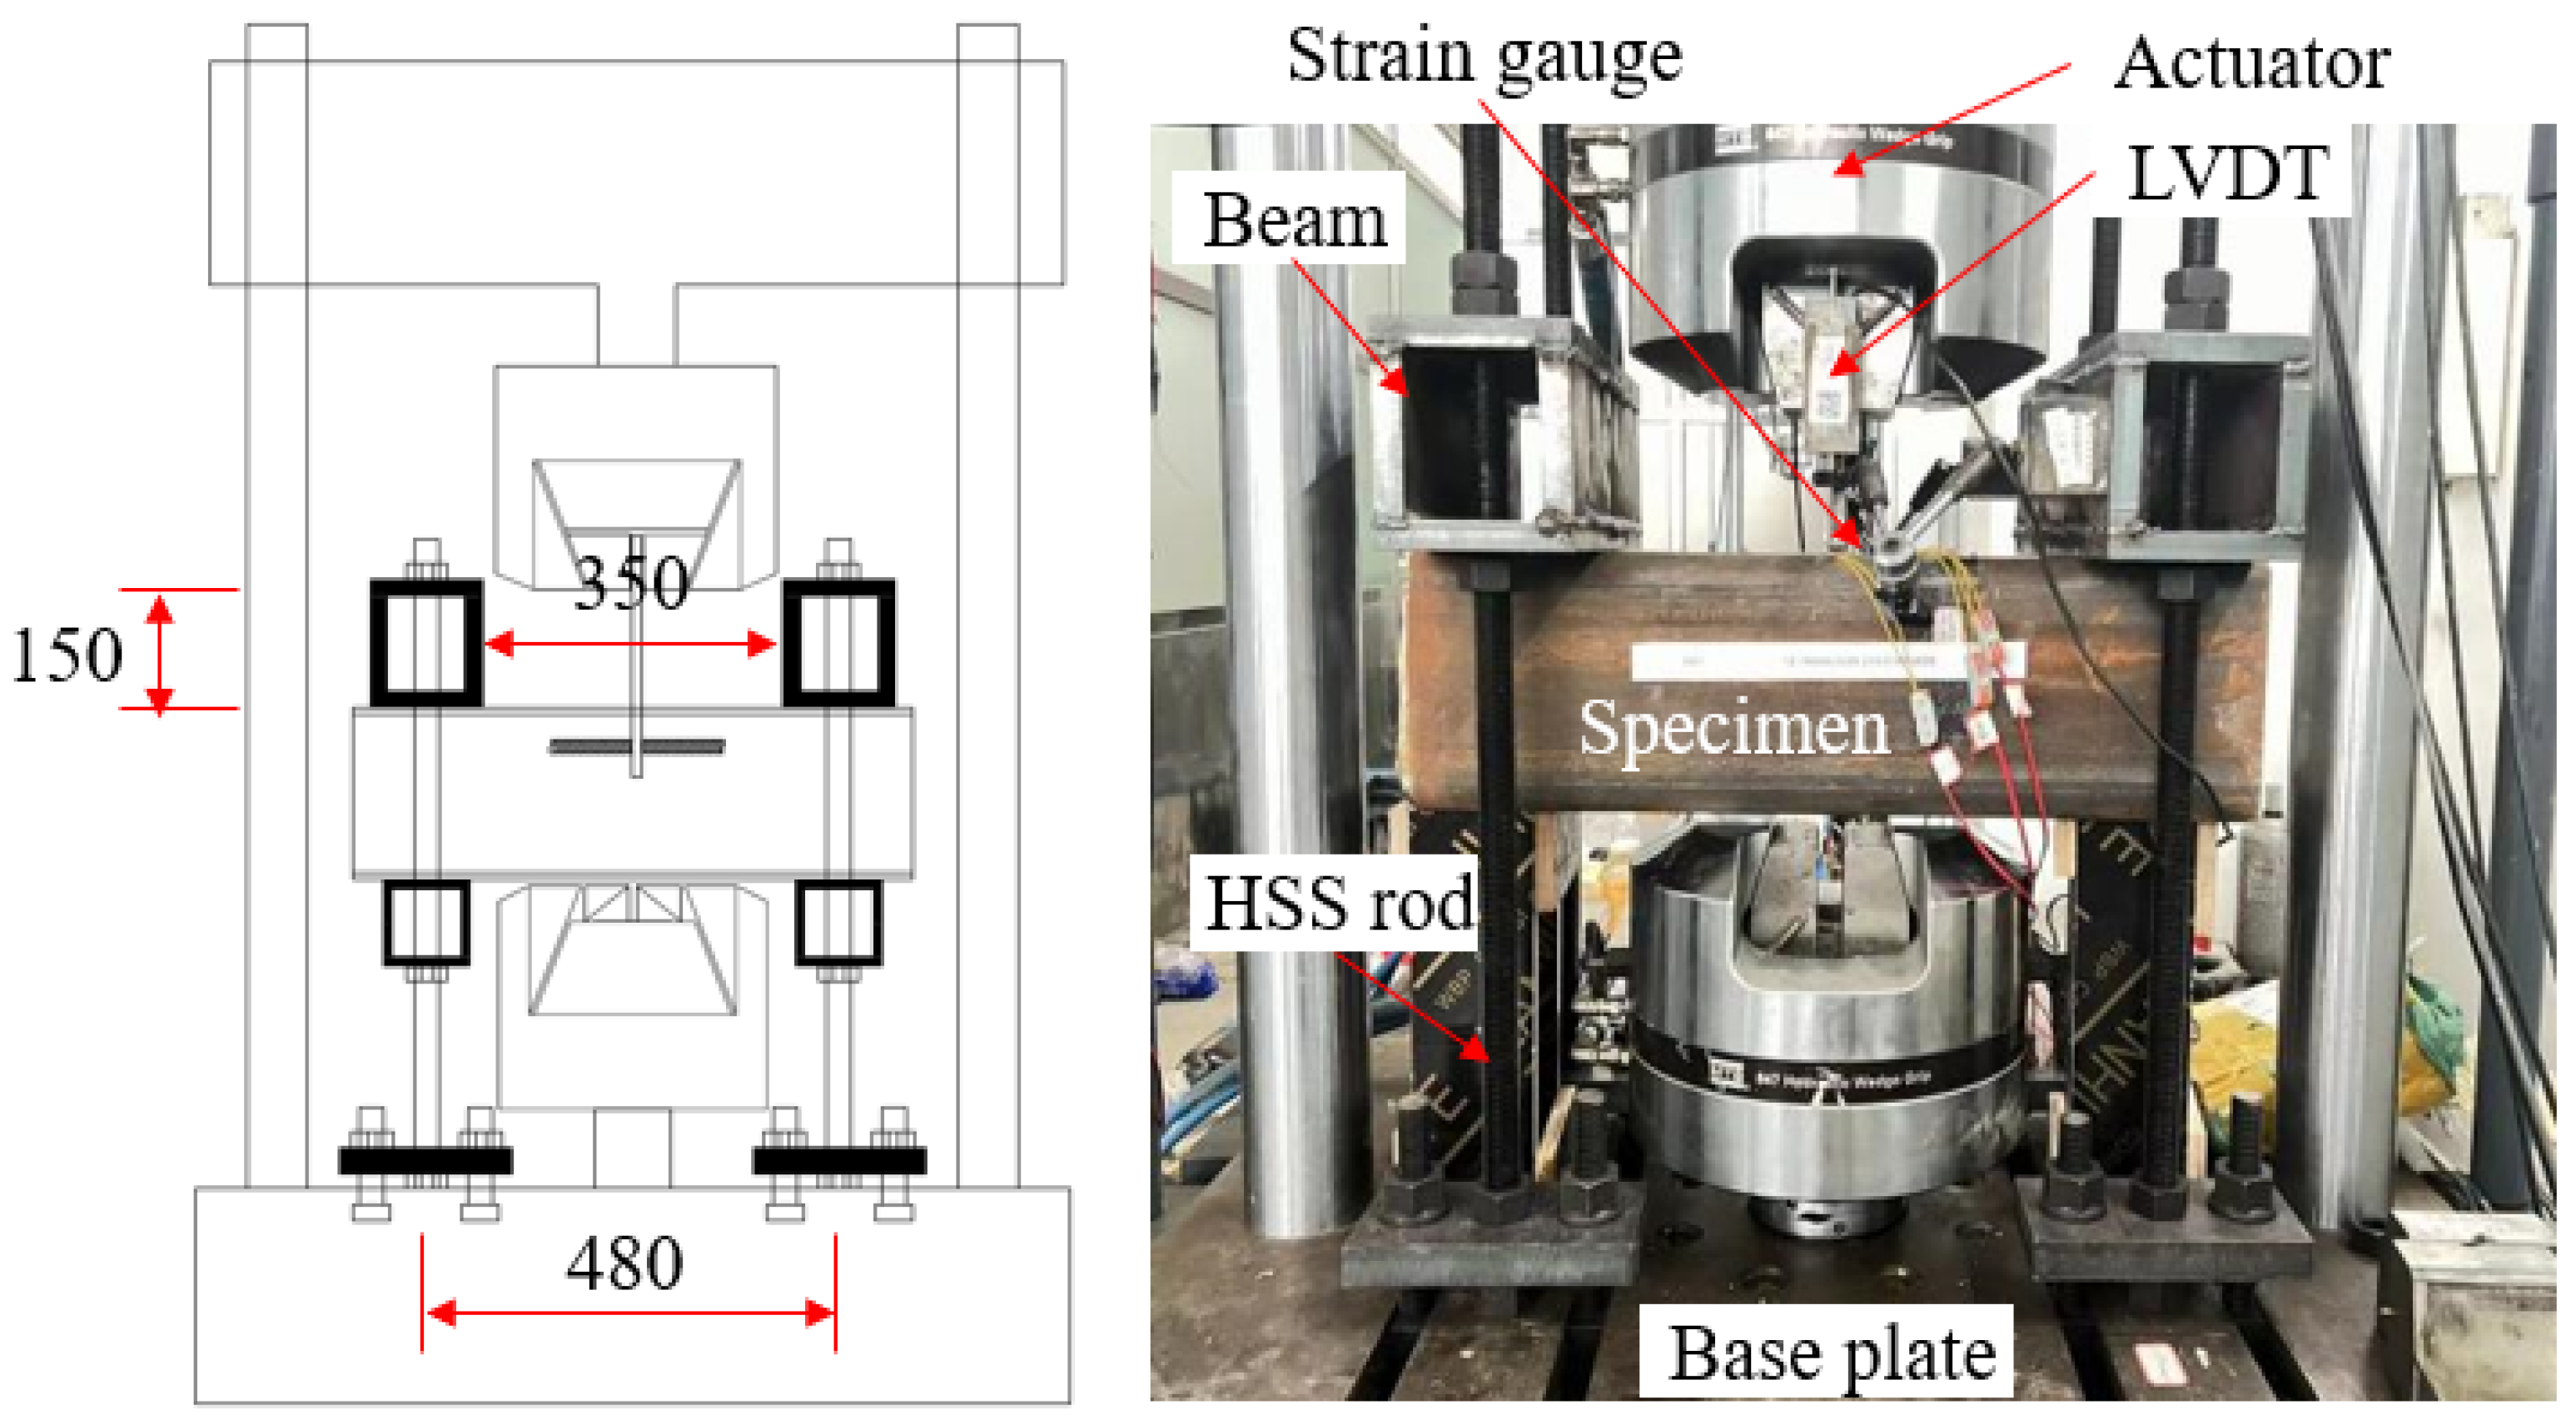
2.3. Experimental Setup
3. Experimental Results
3.1. Failure Modes
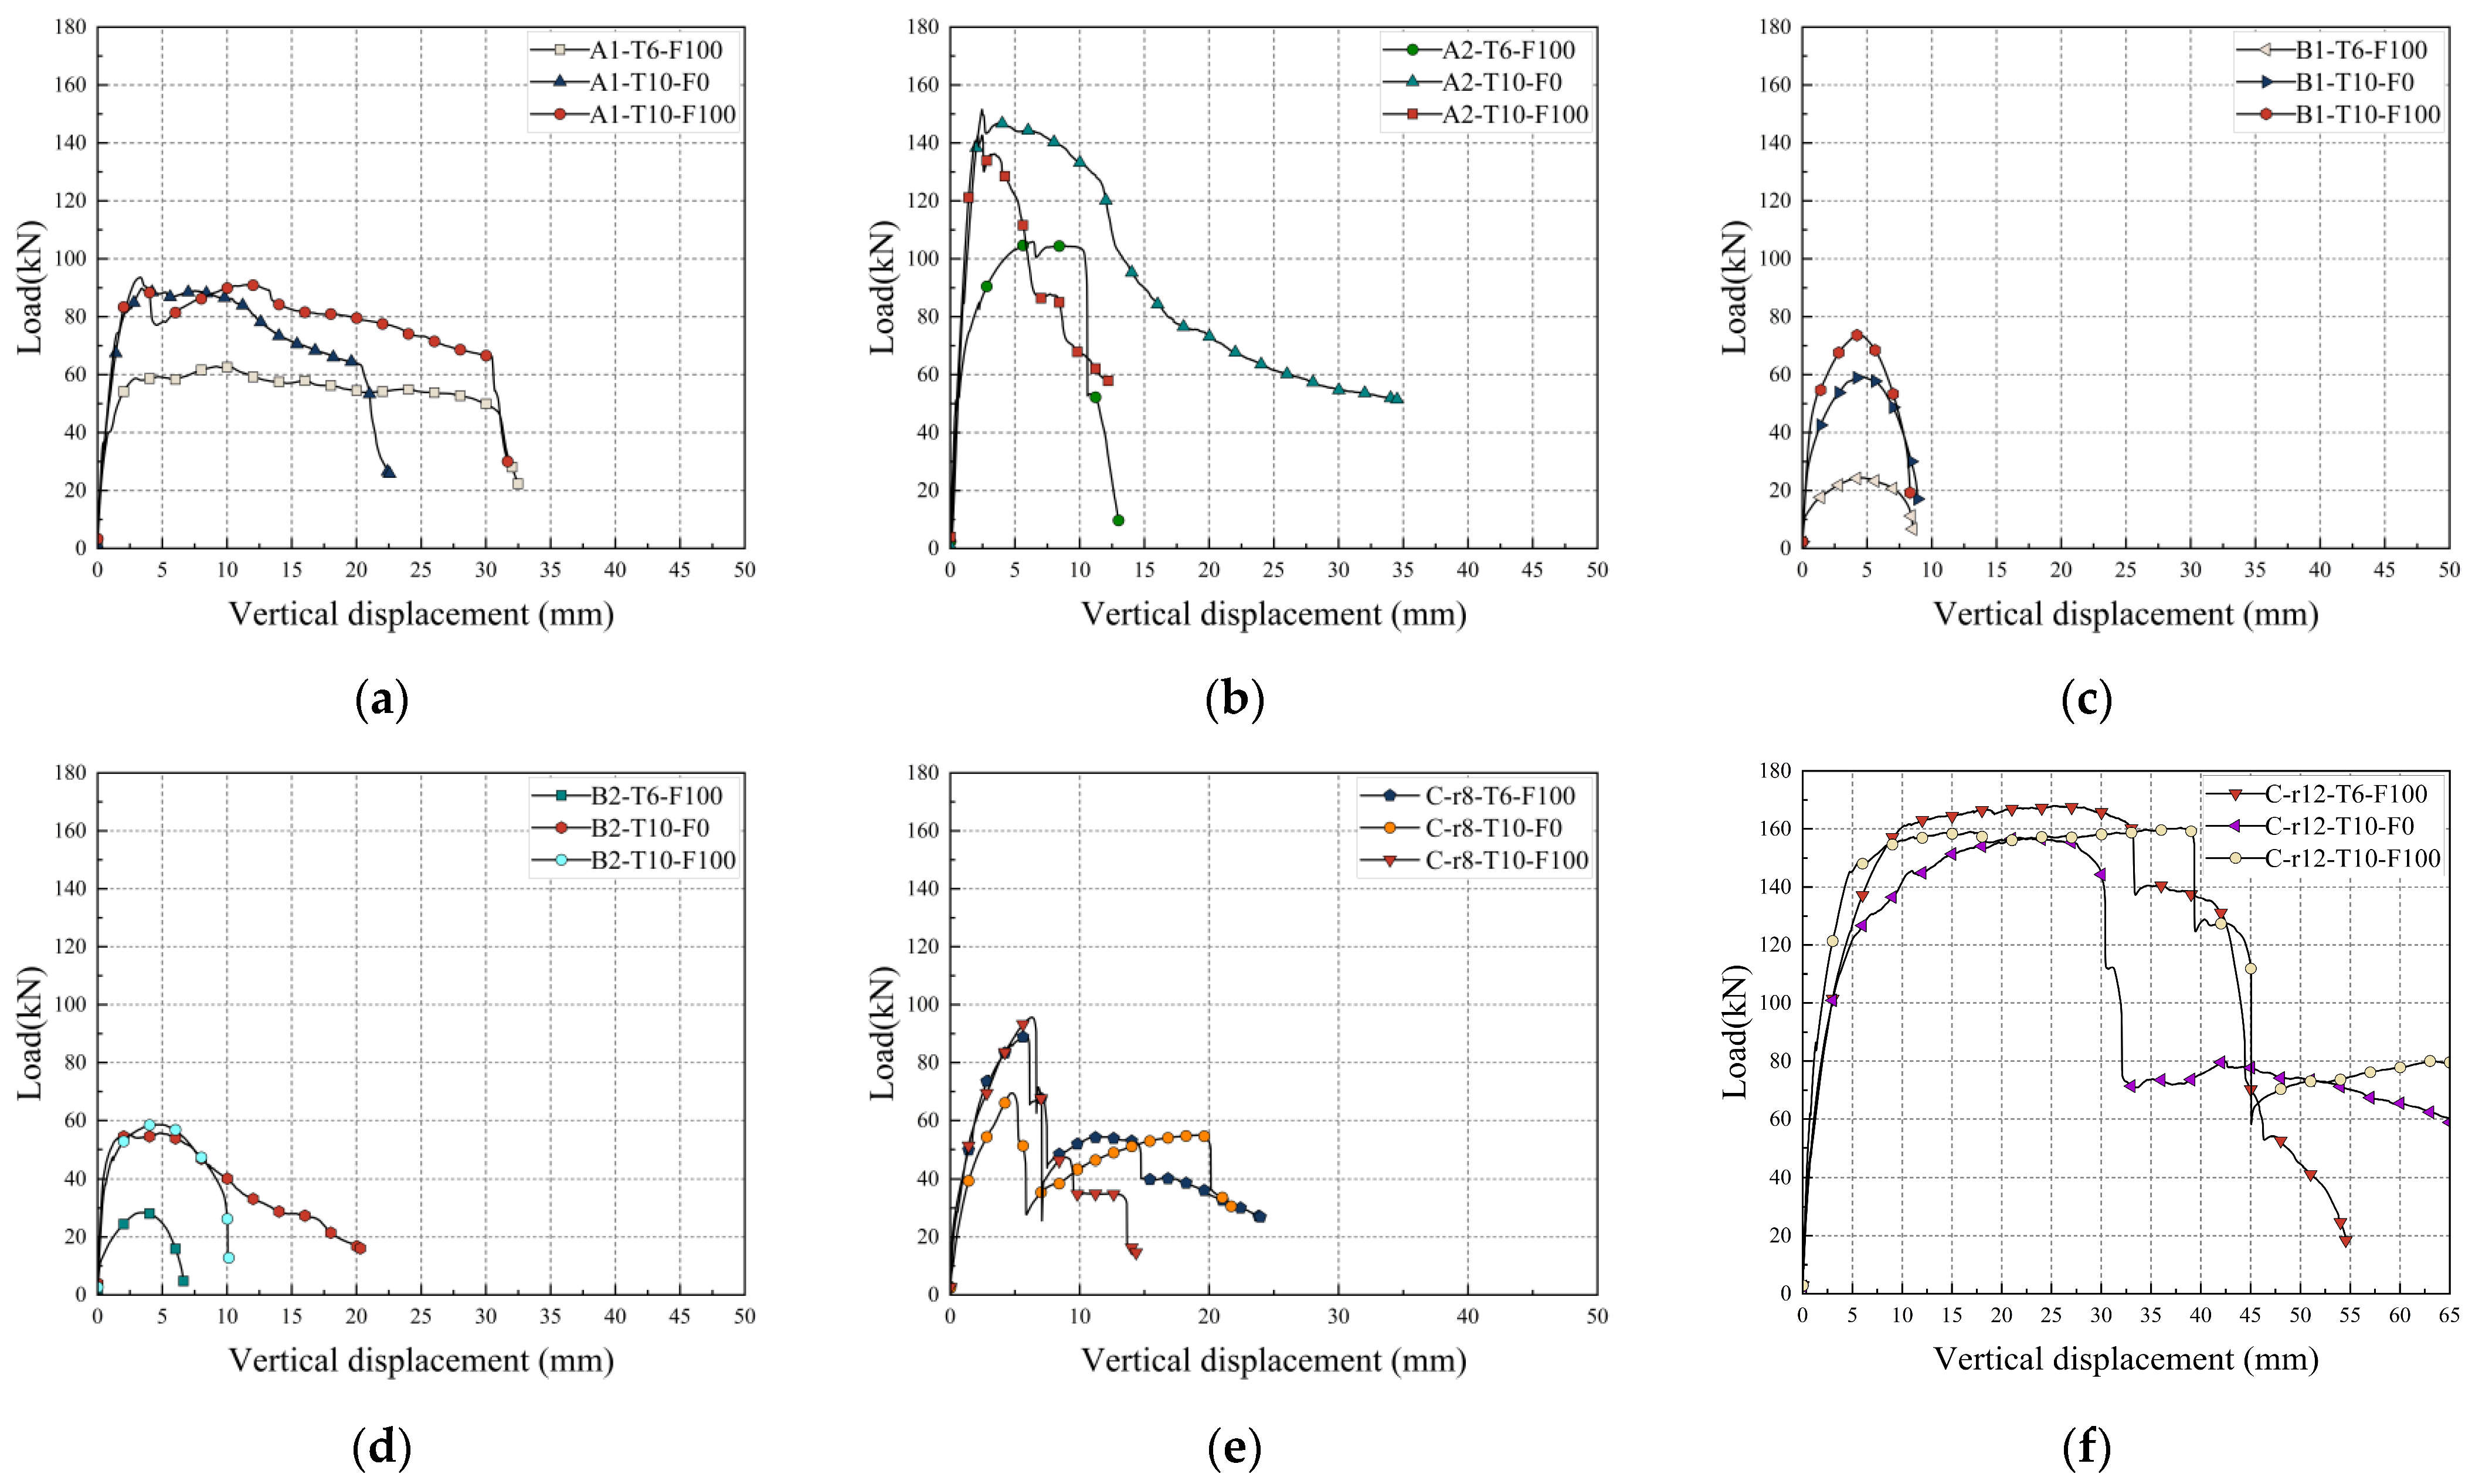
3.2. Load–Displacement Curves
3.3. Key Experimental Results
3.4. Strain Distributions of CFST
4. Discussions
4.1. Effect of Anchoring Type and Configurations
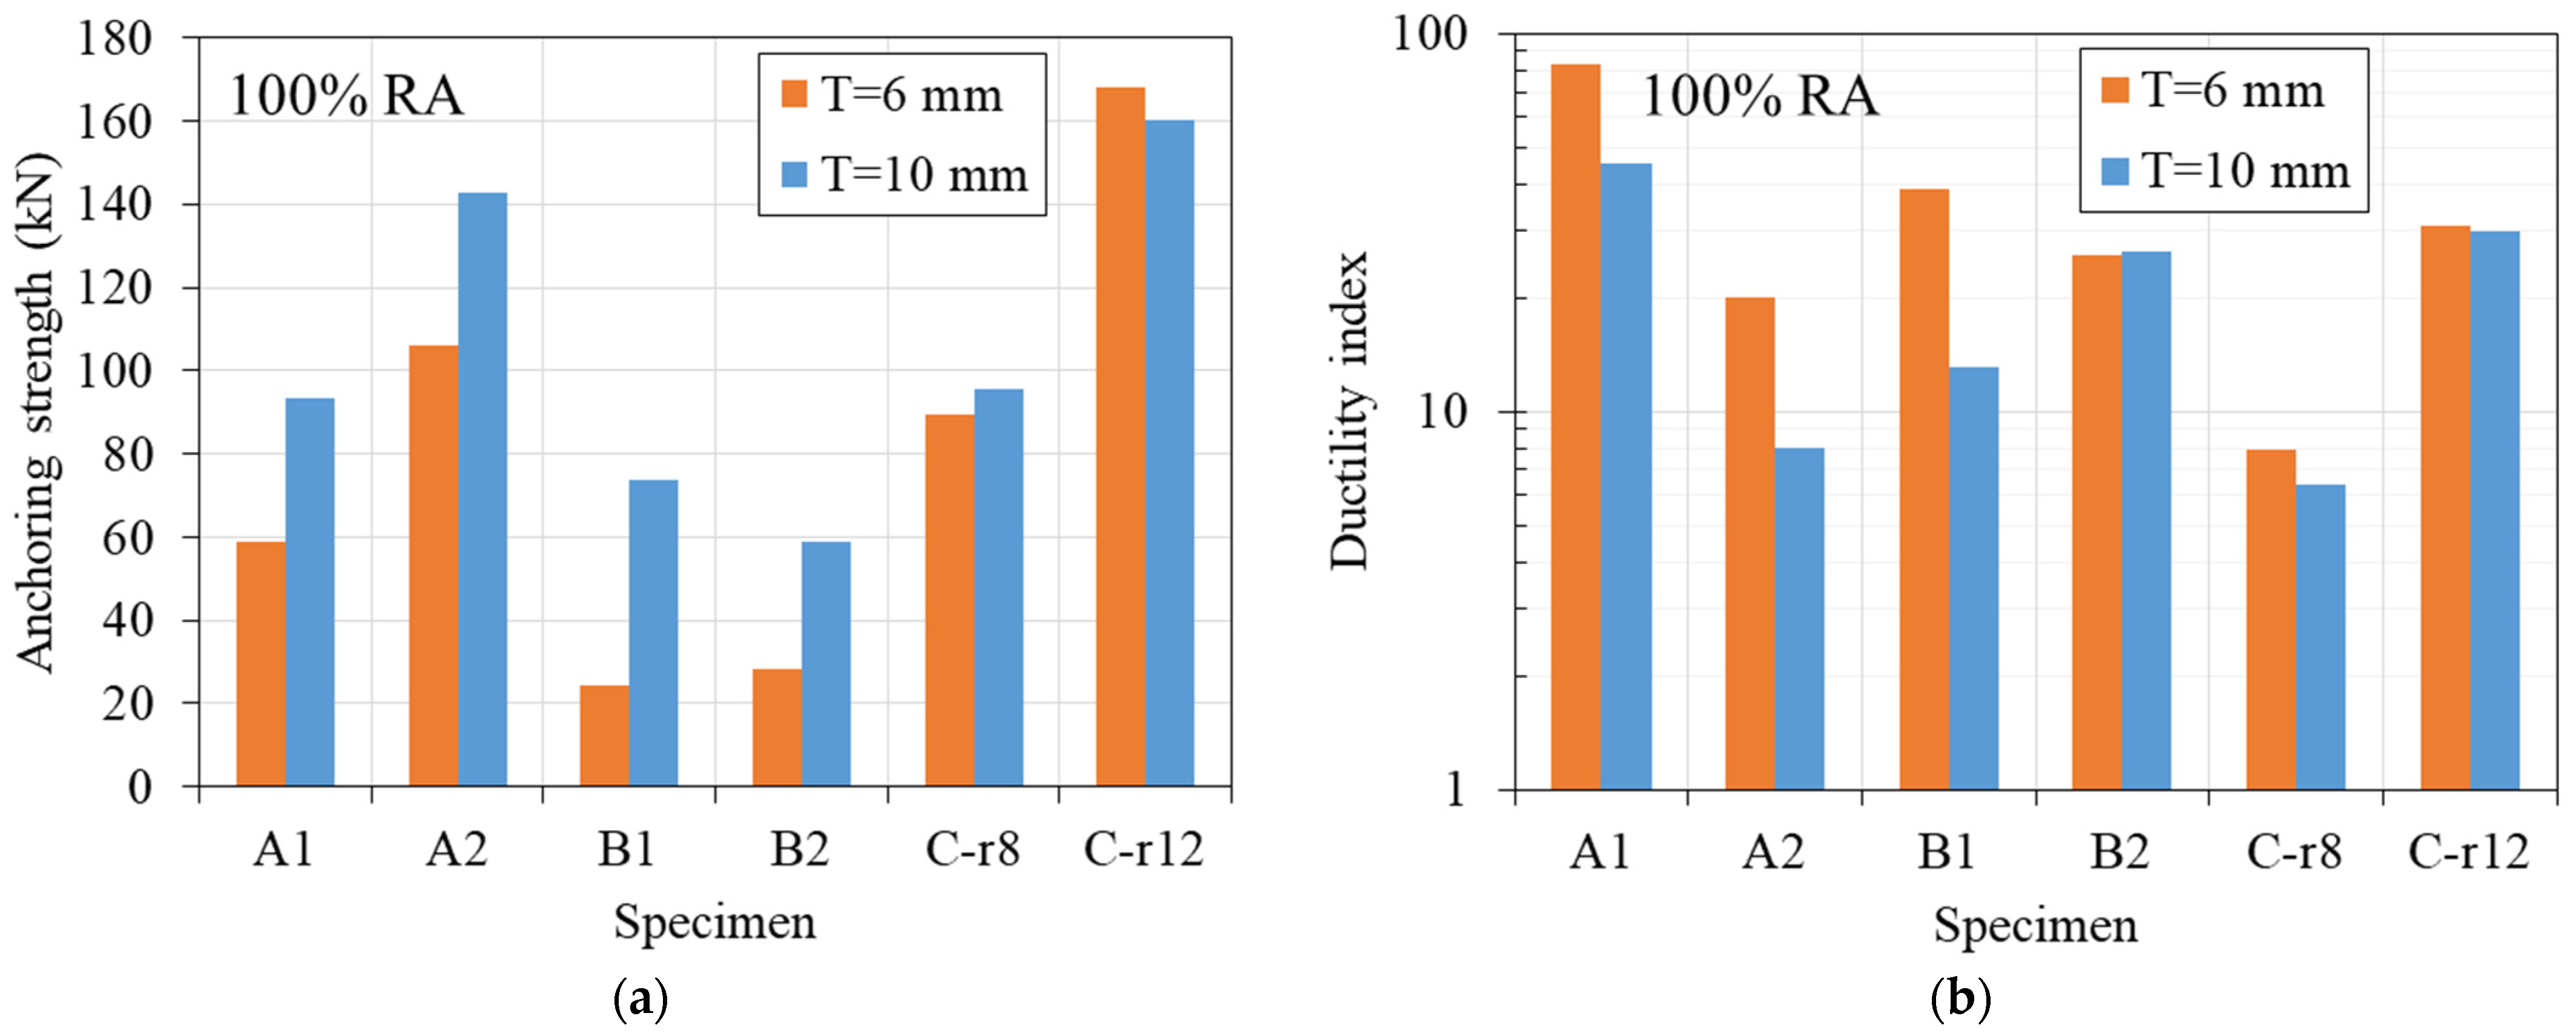
4.2. Effect of Plate Thickness
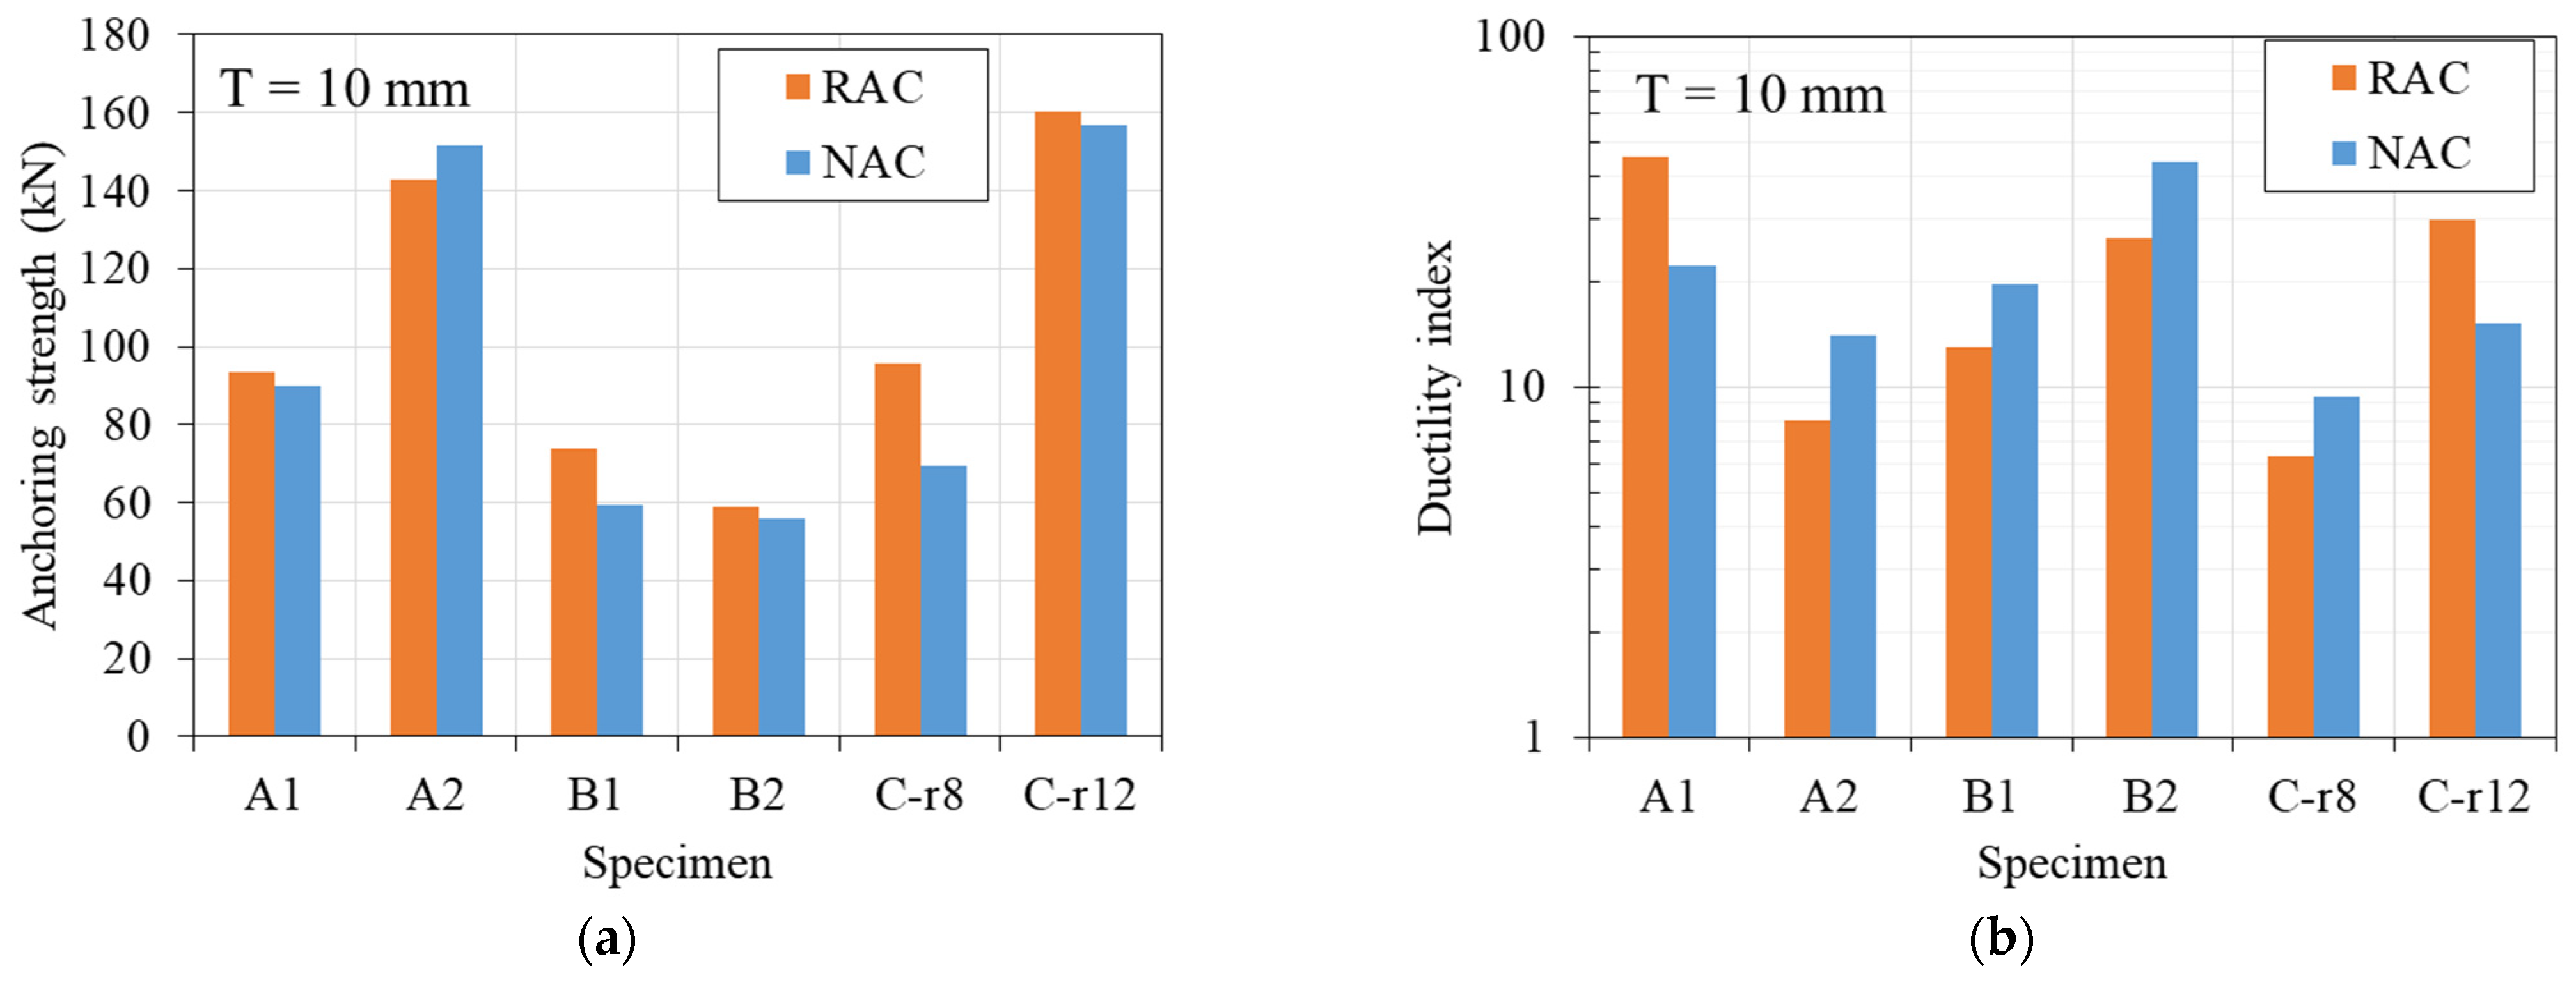
4.3. Effect of Concrete Type
5. Prediction for the Anchorage Strength of the Connecting Plate
5.1. Connecting Plate with Holes
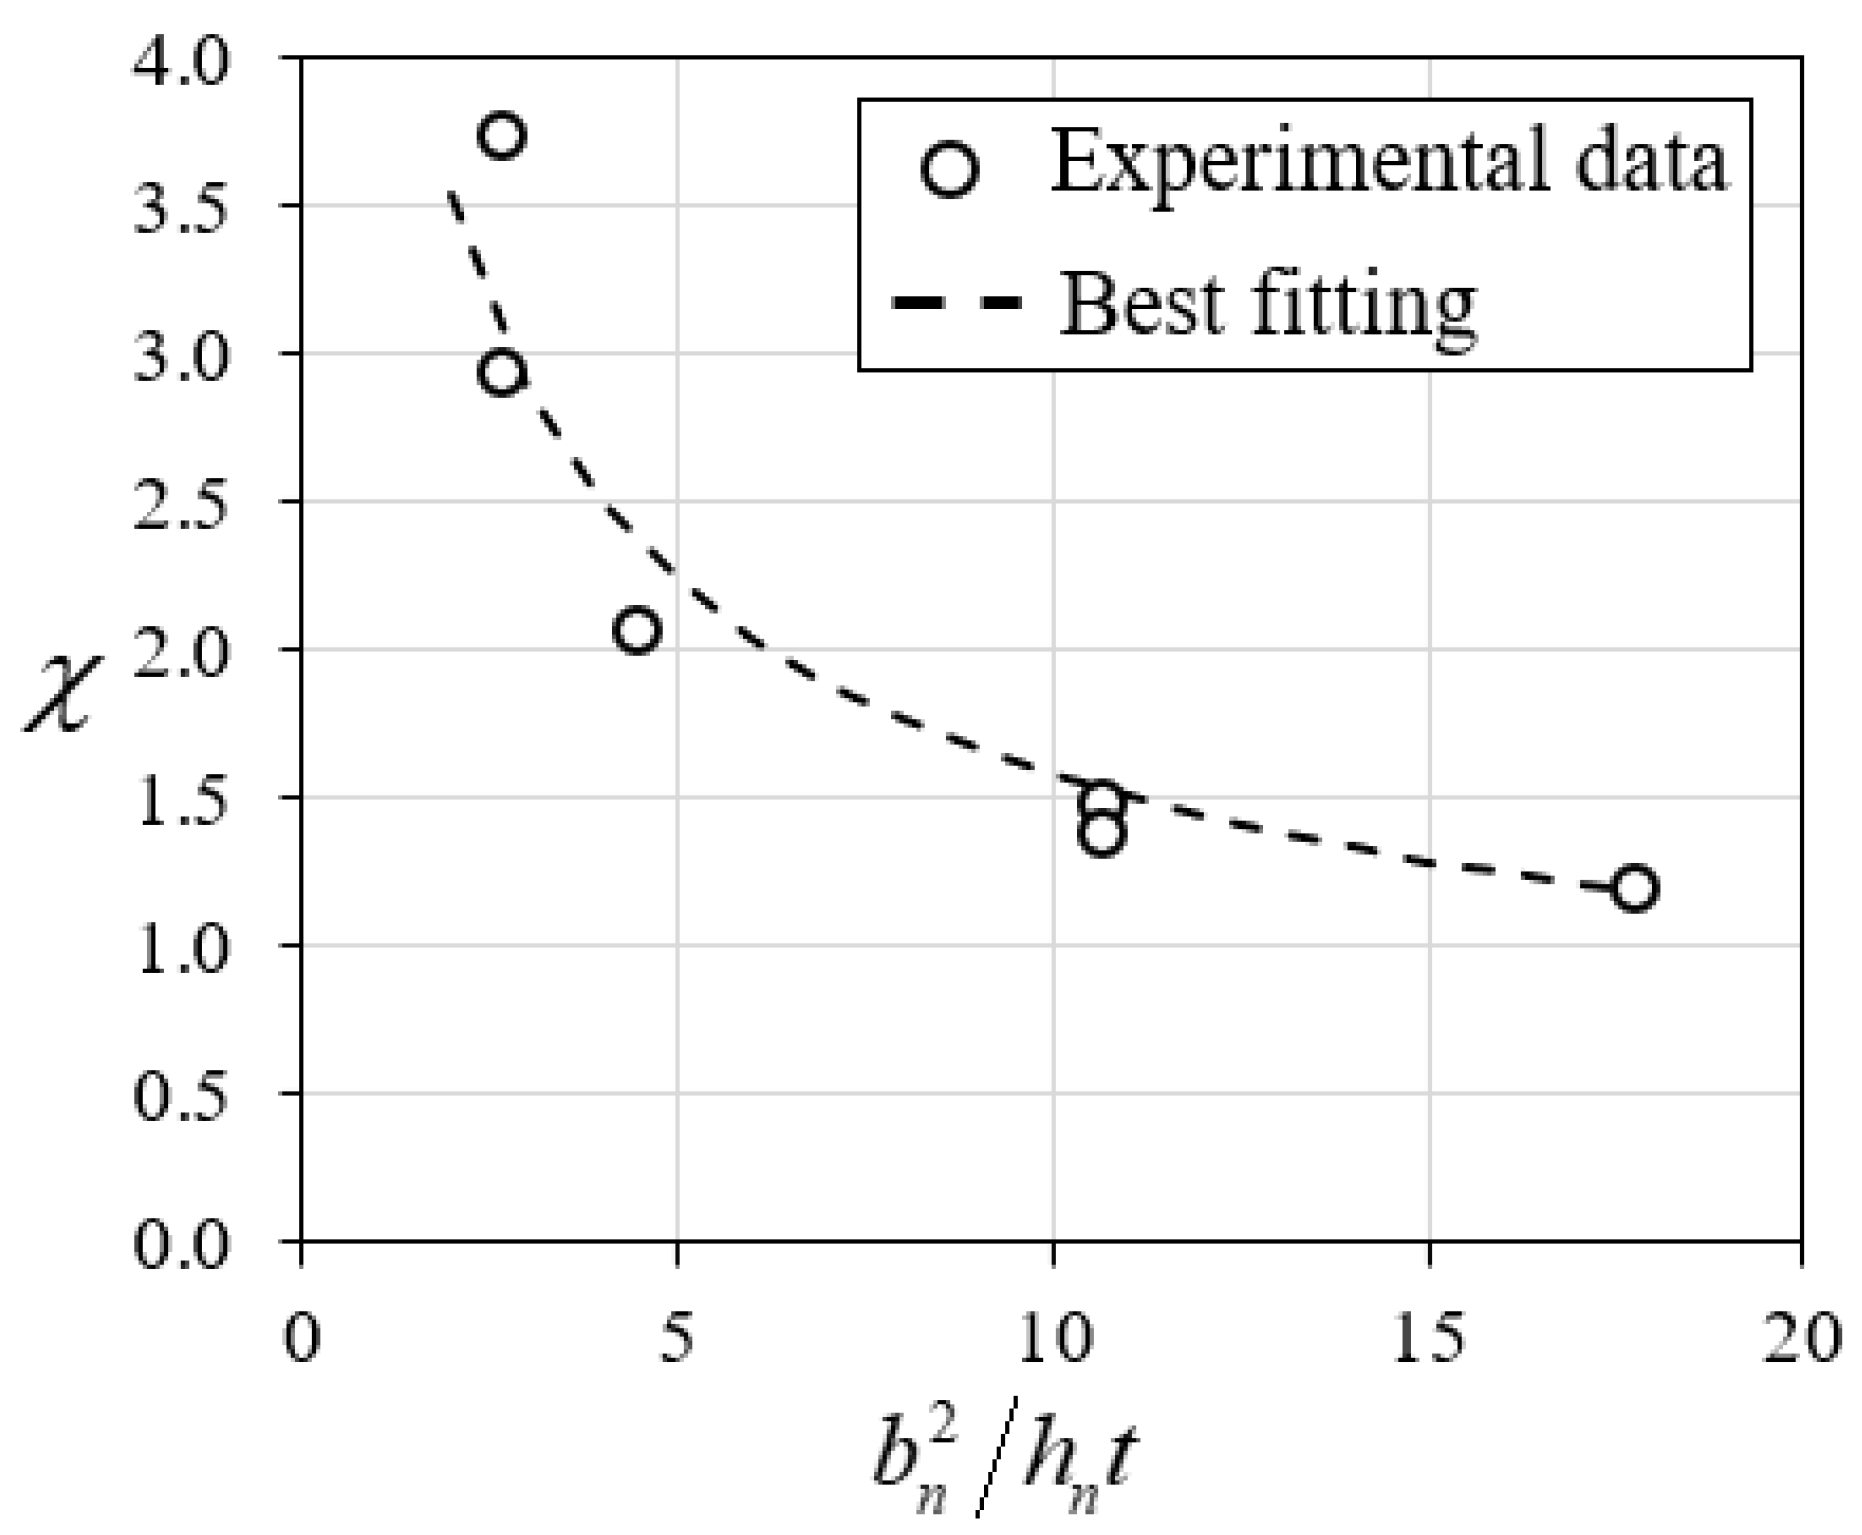
5.2. Connecting Plate with Notches
5.3. Connecting Plate with Rebars
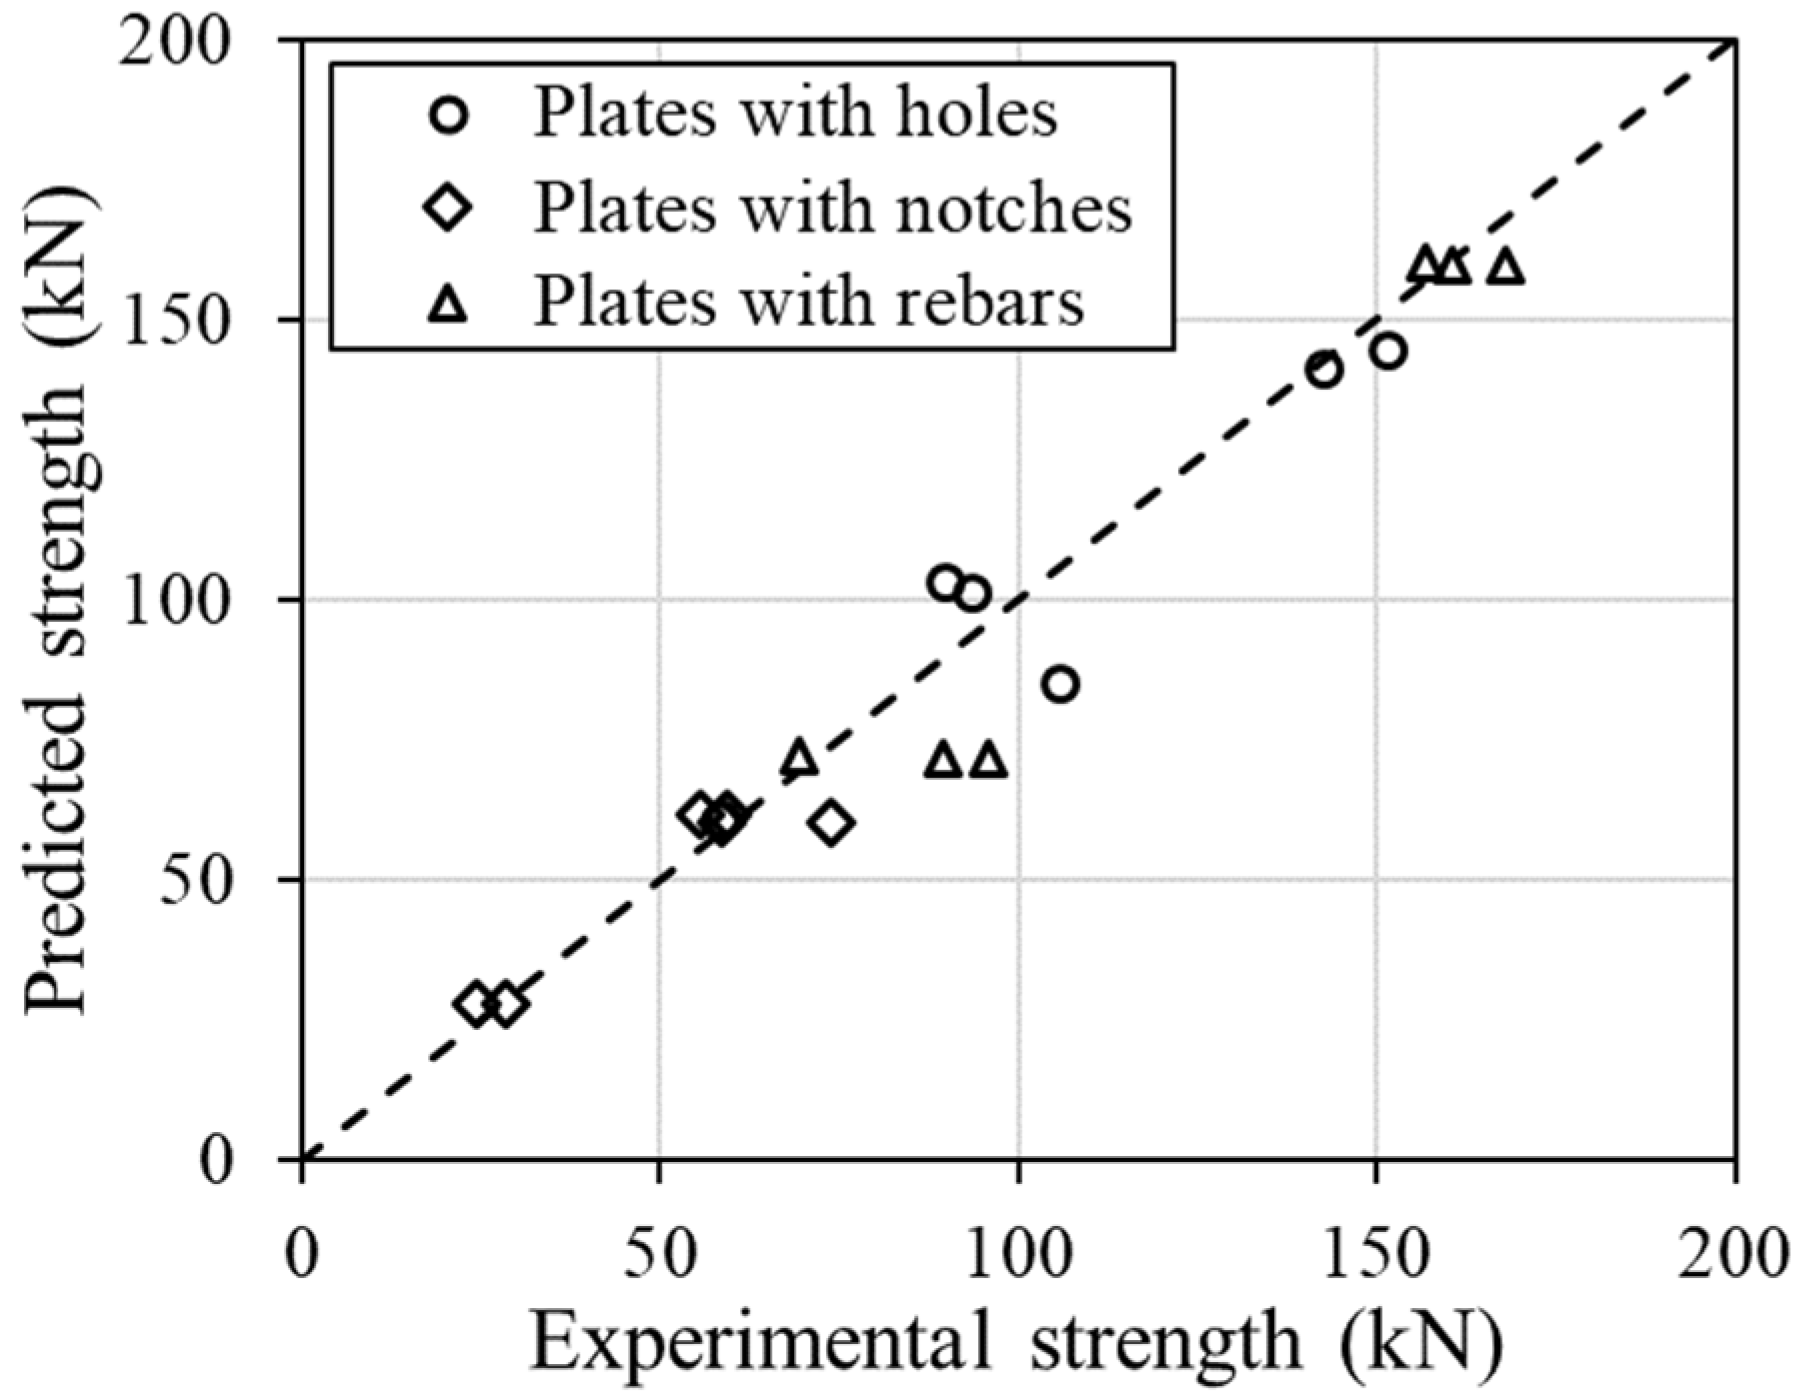
5.4. Verifications
6. Conclusions
- (1)
- Mechanical properties of recycled aggregate concrete are similar to those of natural aggregate concrete with the same mixtures. Using recycled aggregate for a CFST does not obviously affect the pullout behavior of plates, demonstrating the feasibility of using RAC for composite structures.
- (2)
- The failure modes of the specimens greatly depend on the anchoring types and configurations. Plates with rebars exhibit higher strength and ductility than the plates with holes or notches, so it is a recommended anchoring method for beam-to-CFST joints.
- (3)
- With the same void area, plates with two small holes have higher strength than plates with one large hole do, likely due to the increase in bearing area. The effect of the notch dimension (20 mm × 40 mm vs. 40 mm × 20 mm, same area but different direction) on the anchorage strength is not significant, whereas the ductility is slightly influenced. The diameter of the rebars greatly affects the anchorage strength and ductility of the connecting plates.
- (4)
- Because the bearing area is proportional to the plate thickness, thickness has a significant influence on the pullout behavior of the connecting plates with holes and notches. However, the behavior of the plates with rebars is not affected by the plate thickness.
- (5)
- Deformations of the connecting plate and CFST are negligible, and their stiffness could be assumed to be infinity in the determination of the initial stiffness of a beam-to-column joint using the component method.
- (6)
- The proposed formulas could reasonably predict the anchorage strength of the connecting plates with holes and notches. The current method for perfobond rib connectors somewhat underestimates the anchorage strength of the connecting plates with rebars, likely due to the lack of consideration of the confining effect in CFSTs, which is a major difference compared with that in perfobond rib connectors.
Author Contributions
Funding
Data Availability Statement
Conflicts of Interest
References
- Lai, Y.-Y.; Yeh, L.-H.; Chen, P.-F.; Sung, P.-H.; Lee, Y.-M. Management and Recycling of Construction Waste in Taiwan. Procedia Environ. Sci. 2016, 35, 723–730. [Google Scholar] [CrossRef]
- Zhen, H.; Xiong, Z.; Song, Y.; Li, L.; Qiu, Y.; Zou, X.; Chen, B.; Chen, D.; Liu, F.; Ji, Y. Early mechanical performance of glass fibre-reinforced manufactured sand concrete. J. Build. Eng. 2024, 83, 108440. [Google Scholar] [CrossRef]
- Zhu, H.; Xiong, Z.; Song, Y.; Zhou, K.; Su, Y. Effect of Expansion Agent and Glass Fiber on the Dynamic Splitting Tensile Properties of Seawater–Sea-Sand Concrete. Buildings 2024, 14, 217. [Google Scholar] [CrossRef]
- Lin, J.-X.; Luo, R.-H.; Su, J.-Y.; Guo, Y.-C.; Chen, W.-S. Coarse synthetic fibers (PP and POM) as a replacement to steel fibers in UHPC: Tensile behavior, environmental and economic assessment. Constr. Build. Mater. 2024, 412, 134654. [Google Scholar] [CrossRef]
- Chen, Z.; Yu, J.; Nong, Y.; Yang, Y.; Zhang, H.; Tang, Y. Beyond time: Enhancing corrosion resistance of geopolymer concrete and BFRP bars in seawater. Compos. Struct. 2023, 322, 117439. [Google Scholar] [CrossRef]
- Pan, Z.; Liu, F.; Li, H.; Li, X.; Wang, D.; Ling, Z.; Zhu, H.; Zhu, Y. Performance Evaluation of Thermal Insulation Rubberized Mortar Modified by Fly Ash and Glass Fiber. Buildings 2024, 14, 221. [Google Scholar] [CrossRef]
- Xiong, Z.; Mai, G.; Pan, Z.; Chen, Z.; Jian, J.; Wang, D.; Ling, Z.; Li, L. Synergistic effect of expansive agents and glass fibres on fatigue bending performance of seawater sea sand concrete. Constr. Build. Mater. 2024, 421, 135665. [Google Scholar] [CrossRef]
- Ding, T.; Xiao, J.; Tam, V.W.Y. A closed-loop life cycle assessment of recycled aggregate concrete utilization in China. Waste Manag. 2016, 56, 367–375. [Google Scholar] [CrossRef] [PubMed]
- Chen, X.; Xiao, X.; Wu, Q.; Cheng, Z.; Xu, X.; Cheng, S.; Zhao, R. Effect of magnesium phosphate cement on the mechanical properties and microstructure of recycled aggregate and recycled aggregate concrete. J. Build. Eng. 2021, 46, 103611. [Google Scholar] [CrossRef]
- Superti, V.; Houmani, C.; Hansmann, R.; Baur, I.; Binder, C.R. Strategies for a Circular Economy in the Construction and Demolition Sector: Identifying the Factors Affecting the Recommendation of Recycled Concrete. Sustainability 2021, 13, 4113. [Google Scholar] [CrossRef]
- Zhang, X.; Kuang, X.; Wang, F.; Wang, S. Strength indices and conversion relations for basalt fiber-reinforced recycled aggregate concrete. Dyna-Bilbao 2019, 94, 82–87. [Google Scholar] [CrossRef]
- Kurda, R.; de Brito, J.; Silvestre, J.D. Combined influence of recycled concrete aggregates and high contents of fly ash on concrete properties. Constr. Build. Mater. 2017, 157, 554–572. [Google Scholar] [CrossRef]
- Papavasileiou, G.S.; Charmpis, D.C. Earthquake-resistant buildings with steel or composite columns: Comparative assessment using structural optimization. J. Build. Eng. 2020, 27, 100988. [Google Scholar] [CrossRef]
- Ma, H.; Liu, F.; Wu, Y.; Xin, X.; Zhao, Y. Axial compression tests and numerical simulation of steel reinforced recycled concrete short columns confined by carbon fiber reinforced plastics strips. Front. Struct. Civ. Eng. 2022, 16, 817–842. [Google Scholar] [CrossRef]
- Duan, Z.; Li, B.; Xiao, J.; Guo, W. Optimizing mix proportion of recycled aggregate concrete by readjusting the aggregate gradation. Struct. Concr. 2020, 22, E22–E32. [Google Scholar] [CrossRef]
- Liang, C.; Liu, T.; Xiao, J.; Zou, D.; Yang, Q. Effect of Stress Amplitude on the Damping of Recycled Aggregate Concrete. Materials 2015, 8, 5298–5312. [Google Scholar] [CrossRef]
- Wang, Y.; Deng, Z.; Xiao, J.; Li, T.; Li, J. Mechanical properties of recycled aggregate concrete under compression-shear stress state. Constr. Build. Mater. 2021, 271, 121894. [Google Scholar] [CrossRef]
- Xiao, J.; Zhang, K.; Akbarnezhad, A. Variability of stress-strain relationship for recycled aggregate concrete under uniaxial compression loading. J. Clean. Prod. 2018, 181, 753–771. [Google Scholar] [CrossRef]
- Tam, V.W.Y.; Xiao, J.; Liu, S.; Chen, Z. Behaviors of recycled aggregate concrete-filled steel tubular columns under eccentric loadings. Front. Struct. Civ. Eng. 2018, 13, 628–639. [Google Scholar] [CrossRef]
- Yang, Y.-F.; Han, L.-H.; Zhu, L.-T. Experimental Performance of Recycled Aggregate Concrete-Filled Circular Steel Tubular Columns Subjected to Cyclic Flexural Loadings. Adv. Struct. Eng. 2009, 12, 183–194. [Google Scholar] [CrossRef]
- Ma, H.; Xue, J.; Zhang, X.; Luo, D. Seismic performance of steel-reinforced recycled concrete columns under low cyclic loads. Constr. Build. Mater. 2013, 48, 229–237. [Google Scholar] [CrossRef]
- Ma, H.; Xue, J.; Liu, Y.; Dong, J. Numerical analysis and horizontal bearing capacity of steel reinforced recycled concrete columns. Steel Compos. Struct. 2016, 22, 797–820. [Google Scholar] [CrossRef]
- Ma, H.; Qiang, J.; Xi, J.; Zhao, Y. Cyclic loading tests and horizontal bearing capacity of recycled concrete filled circular steel tube and profile steel composite columns. J. Constr. Steel Res. 2022, 199, 107572. [Google Scholar] [CrossRef]
- Zhang, W.-H.; Wang, R.; Zhao, H.; Lam, D.; Chen, P. Axial-load response of CFST stub columns with external stainless steel and recycled aggregate concrete: Testing, mechanism analysis and design. Eng. Struct. 2022, 256, 113968. [Google Scholar] [CrossRef]
- Lyu, W.-Q.; Han, L.-H. Investigation on bond strength between recycled aggregate concrete (RAC) and steel tube in RAC-filled steel tubes. J. Constr. Steel Res. 2019, 155, 438–459. [Google Scholar] [CrossRef]
- Zhao, H.; Zhang, W.-H.; Wang, R.; Hou, C.-C.; Lam, D. Axial compression behaviour of round-ended recycled aggregate concrete-filled steel tube stub columns (RE-RACFST): Experiment, numerical modeling and design. Eng. Struct. 2023, 276, 115376. [Google Scholar] [CrossRef]
- Choi, S.-M.; Park, S.-H.; Yun, Y.-S.; Kim, J.-H. A study on the seismic performance of concrete-filled square steel tube column-to-beam connections reinforced with asymmetric lower diaphragms. J. Constr. Steel Res. 2010, 66, 962–970. [Google Scholar] [CrossRef]
- Qin, Y.; Chen, Z.; Wang, X. Experimental investigation of new internal-diaphragm connections to CFT columns under cyclic loading. J. Constr. Steel Res. 2014, 98, 35–44. [Google Scholar] [CrossRef]
- Qin, Y.; Chen, Z.; Wang, X. Elastoplastic behavior of through-diaphragm connections to concrete-filled rectangular steel tubular columns. J. Constr. Steel Res. 2014, 93, 88–96. [Google Scholar] [CrossRef]
- Yang, J.; Sheehan, T.; Dai, X.; Lam, D. Experimental study of beam to concrete-filled elliptical steel tubular column connections. Thin-Walled Struct. 2015, 95, 16–23. [Google Scholar] [CrossRef]
- Vianna, J.d.C.; de Andrade, S.; Vellasco, P.d.S.; Costa-Neves, L. Experimental study of Perfobond shear connectors in composite construction. J. Constr. Steel Res. 2013, 81, 62–75. [Google Scholar] [CrossRef]
- Fang, Z.; Wu, J.; Xian, B.; Zhao, G.; Fang, S.; Jiang, H.; Ma, Y. Shear Performance and Design Recommendations of Single Embedded Nut Bolted Shear Connectors in Prefabricated Steel-UHPC Composite Beams. Steel Compos. Struct. 2024, 50, 319–336. [Google Scholar]
- Fang, Z.; Wu, J.; Xu, X.; Ma, Y.; Fang, S.; Zhao, G.; Jiang, H. Grouped rubber-sleeved studs–UHPC pocket connections in prefabricated steel–UHPC composite beams: Shear performance under monotonic and cyclic loadings. Eng. Struct. 2024, 305, 117781. [Google Scholar] [CrossRef]
- Tizani, W.; Cabrera, M.; Mahmood, M.; Ninic, J.; Wang, F. The behaviour of anchored extended blind bolts in concrete-filled tubes. Steel Constr. 2022, 15, 51–58. [Google Scholar] [CrossRef]
- Ng, W.H.; Kong, S.Y.; Chua, Y.S.; Bai, Y. Tensile behaviour of innovative one-sided bolts in concrete-filled steel tubular connections. J. Constr. Steel Res. 2022, 191, 107165. [Google Scholar] [CrossRef]
- Yao, H.; Goldsworthy, H.; Gad, E. Experimental and numerical investigation of the tensile behavior of blind-bolted T-stub connections to concrete-filled circular columns. J. Struct. Eng. 2008, 134, 198–208. [Google Scholar] [CrossRef]
- Li, Y.; Chan, T.; Zhao, X. Review on blind bolted connections to concrete-filled steel tubes. Thin-Walled Struct. 2023, 183, 110444. [Google Scholar] [CrossRef]
- GB 175; Common Portland Cement. China Standards Press: Beijing, China, 2020. (In Chinese)
- GB/T25177; Recycled Coarse Aggregate for Concrete. China Construction Industry Press: Beijing, China, 2010. (In Chinese)
- Oktavianus, Y.; Chang, H.; Goldsworthy, H.M.; Gad, E.F. Component model for pull-out behaviour of headed anchored blind bolt within concrete filled circular hollow section. Eng. Struct. 2017, 148, 210–224. [Google Scholar] [CrossRef]
- Su, Q.; Yang, G.; Bradford, M.A. Bearing Capacity of Perfobond Rib Shear Connectors in Composite Girder Bridges. J. Bridg. Eng. 2016, 21, 06015009. [Google Scholar] [CrossRef]
- He, S.; Fang, Z.; Fang, Y.; Liu, M.; Liu, L.; Mosallam, A.S. Experimental study on perfobond strip connector in steel–concrete joints of hybrid bridges. J. Constr. Steel Res. 2016, 118, 169–179. [Google Scholar] [CrossRef]
- Guo, Z.; Shi, X. Theory and Analysis Ofreinforced Concrete; Tsinghua University Press: Beijing, China, 2003; pp. 163–337. (In Chinese) [Google Scholar]
- GB 50017; Code for Design of Steel Structures. China Construction Industry Press: Beijing, China, 2017. (In Chinese)
- Code of Practice for the Structural Use of Steel 2011; Buildings Department: Hong Kong, China, 2023.
- JTG D64; Specifications for design of highway steel bridge. China Communications Press: Beijing, China, 2015. (In Chinese)


| Specimen | Configuration | T (mm) | RA Replacement (%) | Remark |
|---|---|---|---|---|
| A1-T6-F100 | 1 Φ 50 hole | 6 | 100 | With holes |
| A1-T10-F100 | 1 Φ 50 hole | 10 | 100 | |
| A1-T10-F0 | 1 Φ 50 hole | 10 | 0 | |
| A2-T6-F100 | 2 Φ 35 hole | 6 | 100 | |
| A2-T10-F100 | 2 Φ 35 hole | 10 | 100 | |
| A2-T10-F0 | 2 Φ 35 hole | 10 | 0 | |
| B1-T6-F100 | 2□20 × 40 notch | 6 | 100 | With notches |
| B1-T10-F100 | 2□20 × 40 notch | 10 | 100 | |
| B1-T10-F0 | 2□20 × 40 notch | 10 | 0 | |
| B2-T6-F100 | 2□40 × 20 notch | 6 | 100 | |
| B2-T10-F100 | 2□40 × 20 notch | 10 | 100 | |
| B2-T10-F0 | 2□40 × 20 notch | 10 | 0 | |
| C-r8-T6-F100 | 2 Φ 8 rebar | 6 | 100 | With rebars |
| C-r8-T10-F100 | 2 Φ 8 rebar | 10 | 100 | |
| C-r8-T10-F0 | 2 Φ 8 rebar | 10 | 0 | |
| C-r12-T6-F100 | 2 Φ 12 rebar | 6 | 100 | |
| C-r12-T10-F100 | 2 Φ 12 rebar | 10 | 100 | |
| C-r12-T10-F0 | 2 Φ 12 rebar | 10 | 0 |
| Replacement Ratio of RA (%) | Mass per Unit Volume (kg/m3) | fc′ (MPa) | Ec′ (GPa) | |||||
|---|---|---|---|---|---|---|---|---|
| Cement | Sand | Natural CA | Recycled CA | Water | Water Reducer | |||
| 0% | 425 | 762 | 1018 | 0 | 175.5 | 8.5 | 50.3 | 49.4 |
| 100% | 425 | 762 | 0 | 1018 | 175.5 | 8.5 | 49.3 | 41.5 |
| Type | Es (GPa) | fy (MPa) | fu (MPa) |
|---|---|---|---|
| Steel plate | 211 | 328 | 444 |
| Steel rebar | 209 | 453 | 672 |
| Specimen | Py (kN) | Δy (mm) | Pu (kN) | Δu (mm) | DI | Np (kN) | Np/Pu |
|---|---|---|---|---|---|---|---|
| A1-T6-F100 | 36.4 | 1.14 | 62.6 | 9.3 | 82.5 | 60.6 | 1.03 |
| A1-T10-F100 | 54.5 | 1.57 | 93.6 | 3.3 | 45.2 | 101.0 | 1.08 |
| A1-T10-F0 | 70.4 | 1.51 | 89.8 | 3.4 | 22.3 | 103.2 | 1.15 |
| A2-T6-F100 | 62.3 | 1.56 | 105.9 | 6.4 | 20.1 | 84.8 | 0.80 |
| A2-T10-F100 | 102.4 | 1.53 | 142.7 | 2.5 | 8.0 | 141.4 | 0.99 |
| A2-T10-F0 | 109.8 | 2.01 | 151.5 | 2.5 | 14.0 | 144.4 | 0.95 |
| B1-T6-F100 | 11.7 | 0.67 | 24.4 | 4.4 | 38.8 | 28.0 | 1.15 |
| B1-T10-F100 | 48.0 | 1.29 | 73.8 | 4.4 | 13.0 | 60.3 | 0.82 |
| B1-T10-F0 | 31.6 | 1.15 | 59.2 | 4.6 | 19.5 | 61.6 | 1.04 |
| B2-T6-F100 | 12.6 | 0.76 | 28.4 | 3.6 | 25.8 | 28.0 | 0.99 |
| B2-T10-F100 | 37.2 | 0.85 | 58.7 | 4.3 | 26.4 | 60.3 | 1.03 |
| B2-T10-F0 | 36.3 | 0.55 | 55.7 | 4.8 | 43.9 | 61.6 | 1.11 |
| C-r8-T6-F100 | 58.0 | 1.80 | 89.4 | 5.9 | 7.9 | 71.9 | 0.80 |
| C-r8-T10-F100 | 63.6 | 2.27 | 95.6 | 6.3 | 6.4 | 71.9 | 0.75 |
| C-r8-T10-F0 | 26.9 | 2.02 | 69.4 | 4.8 | 9.4 | 72.0 | 1.04 |
| C-r12-T6-F100 | 110.1 | 3.58 | 168.0 | 25.2 | 31.1 | 160.0 | 0.95 |
| C-r12-T10-F100 | 110.8 | 3.64 | 160.4 | 38.0 | 30.1 | 160.0 | 1.00 |
| C-r12-T10-F0 | 107.6 | 5.10 | 157.0 | 21.8 | 15.2 | 160.1 | 1.02 |
Disclaimer/Publisher’s Note: The statements, opinions and data contained in all publications are solely those of the individual author(s) and contributor(s) and not of MDPI and/or the editor(s). MDPI and/or the editor(s) disclaim responsibility for any injury to people or property resulting from any ideas, methods, instructions or products referred to in the content. |
© 2024 by the authors. Licensee MDPI, Basel, Switzerland. This article is an open access article distributed under the terms and conditions of the Creative Commons Attribution (CC BY) license (https://creativecommons.org/licenses/by/4.0/).
Share and Cite
Su, J.; Zhao, Q.; Cai, L.; Li, X.; Pu, H.; Dai, W.; Zhang, J.; Lu, D.; Liu, F. Feasibility of Recycled Aggregate Concrete in a Novel Anchoring Connection for Beam-to-Concrete-Filled Steel Tube Joints. Buildings 2024, 14, 1178. https://doi.org/10.3390/buildings14041178
Su J, Zhao Q, Cai L, Li X, Pu H, Dai W, Zhang J, Lu D, Liu F. Feasibility of Recycled Aggregate Concrete in a Novel Anchoring Connection for Beam-to-Concrete-Filled Steel Tube Joints. Buildings. 2024; 14(4):1178. https://doi.org/10.3390/buildings14041178
Chicago/Turabian StyleSu, Jianhua, Qian Zhao, Li’ao Cai, Xiaohui Li, Hongyin Pu, Wei Dai, Jian Zhang, Deng Lu, and Feng Liu. 2024. "Feasibility of Recycled Aggregate Concrete in a Novel Anchoring Connection for Beam-to-Concrete-Filled Steel Tube Joints" Buildings 14, no. 4: 1178. https://doi.org/10.3390/buildings14041178