Article

Numerical Study on Permeability of Reconstructed Porous Concrete Based on Lattice Boltzmann Method

1
School of Highway, Chang’an University, Xi’an 710064, China
2
Shaanxi Expressway Engineering Testing Inspection & Testing Co., Ltd., Xi’an 710086, China
3
School of Highway, Xi’an Technology University, Xi’an 710021, China
*
Author to whom correspondence should be addressed.
Buildings 2024, 14(4), 1182; https://doi.org/10.3390/buildings14041182
Submission received: 15 March 2024 / Revised: 17 April 2024 / Accepted: 18 April 2024 / Published: 22 April 2024
(This article belongs to the Special Issue Foundation Treatment and Building Structural Performance Enhancement)

Abstract

:
The reconstruction of the porous media model is crucial for researching the mesoscopic seepage characteristics of porous concrete. Based on a self-compiled MATLAB program, a porous concrete model was modeled by controlling four parameters (distribution probability, growth probability, probability density, and porosity) with clear physical meanings using a quartet structure generation set (QSGS) along with the lattice Boltzmann method (LBM) to investigate permeability. The rationality of the numerical model was verified through Poiseuille flow theory. The results showed that the QSGS model exhibited varied pore shapes and disordered distributions, resembling real porous concrete. Seepage velocity distribution showed higher values in larger pores, with flow rates reaching up to 0.012 lattice point velocity. The permeability–porosity relationship demonstrated high linearity (the Pearson correlation coefficient is 0.92), consistent with real porous concrete behavior. The integration of QSGS-LBM represents a novel approach, and the research results can provide new ideas and new means for subsequent research on the permeability of porous concrete or similar porous medium materials.

1. Introduction

Porous concrete, with its efficient permeability, facilitates rapid water infiltration through its pores into the ground, making it widely used in urban construction, ecological slope protection, sewage treatment, and other fields [1,2,3]. Additionally, this type of concrete plays a crucial role in preventing urban road waterlogging disasters, replenishing groundwater resources, and protecting urban roads and natural water systems from damage [4,5]. It is primarily composed of coarse aggregates with a single particle size distribution or a discontinuous particle size distribution as its structural framework, characterized by numerous large pores that are randomly distributed and unevenly dispersed [6]. Currently, research on its permeability is mainly focused on indoor experiments. Zhang et al. [7] evaluated the influence of the shape and size variations of concrete specimens on their permeability and mechanical properties. Elizondo-Martinez et al. [8] established a correlation between the indirect tensile strength and permeability of this concrete using five different compaction methods. Hou et al. [9] developed a mathematical model characterizing the relationship between compressive strength and the permeability coefficient based on the preparation and testing of three types of porous concrete with different porosities, permeability coefficients, and compressive strengths. Bian et al. [10] prepared porous concrete using alkali activators and compared the effects of three different factors on the mechanical and permeability properties.
Although indoor experimental studies provide insights into the macroscopic permeability performance of porous concrete, inevitable sample disturbances and potential testing errors, coupled with time-consuming and resource-intensive procedures, impose certain limitations on investigating the relationship between the internal pore structure and permeability performance of porous concrete on a large scale. Thus, exploring modeling methods for porous concrete and studying the variations in its permeability characteristics are crucial for a deeper understanding and the improvement of porous concrete design theory.
At present, scanning electron microscopy (SEM) and computed tomography (CT) are the two primary methods of modeling porous concrete models. Both methods involve scanning indoor porous concrete specimens and utilizing image processing and three-dimensional (3D) reconstruction techniques to model models. Zhang et al. [11] proposed an SEM-based method for the 3D reconstruction of porous media. Shan et al. [6], Liu [12], and Yi [13] conducted tests on porous concrete specimens using industrial CT scanning technology, studying and analyzing the structural characteristics of porous concrete pores with the aid of image processing and 3D reconstruction techniques. Hu et al. [14] quantitatively studied the relationship between pore characteristics and permeability by testing samples of porous asphalt concrete before and after blockage using X-CT equipment. Chung et al. [15] quantified and reconstructed porous concrete specimens with almost identical pore distributions to the original specimens using CT and low-order probability functions. It is evident that both scanning electron microscopy and computed tomography methods provide effective characterizations of the internal pore structure of porous concrete, but they impose strict requirements on specimen preparation and incur high scanning costs, making it inconvenient to study the influence of various pore structure parameters on the permeability of porous concrete quickly and easily.
In recent years, with the rapid development of computer technology, the quartet structure generation set (QSGS) method has received widespread attention and application in academia due to its efficiency and convenience [16,17]. This method, by controlling four parameters with clear physical meanings—distribution probability, growth probability, probability density, and porosity [18]—can construct porous media models with diverse morphologies similar to the actual pore structure of soil and rock masses. Meanwhile, traditional computational fluid dynamics (CFD) methods have shown limitations in simulating the permeability of porous concrete. CFD methods conduct fluid dynamics simulations at a macroscopic level, requiring high-quality and specific grid types, which not only increase the complexity of the model but also raise computational costs for simulating complex flow conditions [19,20]. In contrast, the lattice Boltzmann method (LBM) operates at a mesoscopic level, with relatively simple requirements for grid types, and demonstrates significant advantages in dealing with multiphase flow, multicomponent flow, and complex boundary conditions [21,22]. Consequently, the LBM exhibits greater potential in research on the permeability of porous concrete.
Moreover, QSGS can be smoothly combined with the LBM for joint simulation, effectively simulating the seepage field of porous media. For instance, Zhou et al. [23] simulated the seepage of saturated soil using QSGS and LBM, revealing the correlation between soil porosity and seepage velocity. The results indicated that the simulated soil structure resembled natural soil, and the seepage velocity was closely related to pore volume fraction and seepage channel size. Additionally, Cai et al. [24], through MATLAB programming, investigated the mesoscopic seepage mechanism of reconstructed soil with different porosities based on the QSGS-LBM method. The results showed that the model size was proportional to pore connectivity, and when the porosity was high, the main seepage channel was prominent, with the flow velocity center higher than the pore walls. Porosity significantly influenced the accuracy of flow velocity and permeability, with fine-grained soil exhibiting more stable flow velocity and uniform velocity field distribution. These studies demonstrate that the QSGS-LBM joint simulation method is an effective approach to modeling numerical models of porous, soil-like materials and simulating their internal pore seepage.
In conclusion, although the QSGS-LBM joint simulation method has achieved fruitful results in seepage simulation, it mainly focuses on soil and rock masses, and the model soil and rock mass models often exhibit relatively uniform pore shapes and distributions, which differ from the actual conditions. On the other hand, porous concrete, as a porous medium material, shares similarities with soil bodies when using the QSGS-LBM joint simulation method to simulate pore seepage characteristics. However, to the best of our knowledge, such research methods have not been reported. This indicates that there is still room for exploration and development in the field of simulation methods for the pore seepage characteristics of porous concrete.
Thus, this research proposes to jointly improve the QSGS and LBM to model realistic models of porous concrete based on a self-compiled MATLAB2023b program and explore the permeability of porous concrete. The relationship between the porosity and permeability of porous concrete models is quantitatively analyzed. Furthermore, the rationality of the simulation results regarding porous concrete permeability is validated through experimental testing rules.

2. Theoretical Method

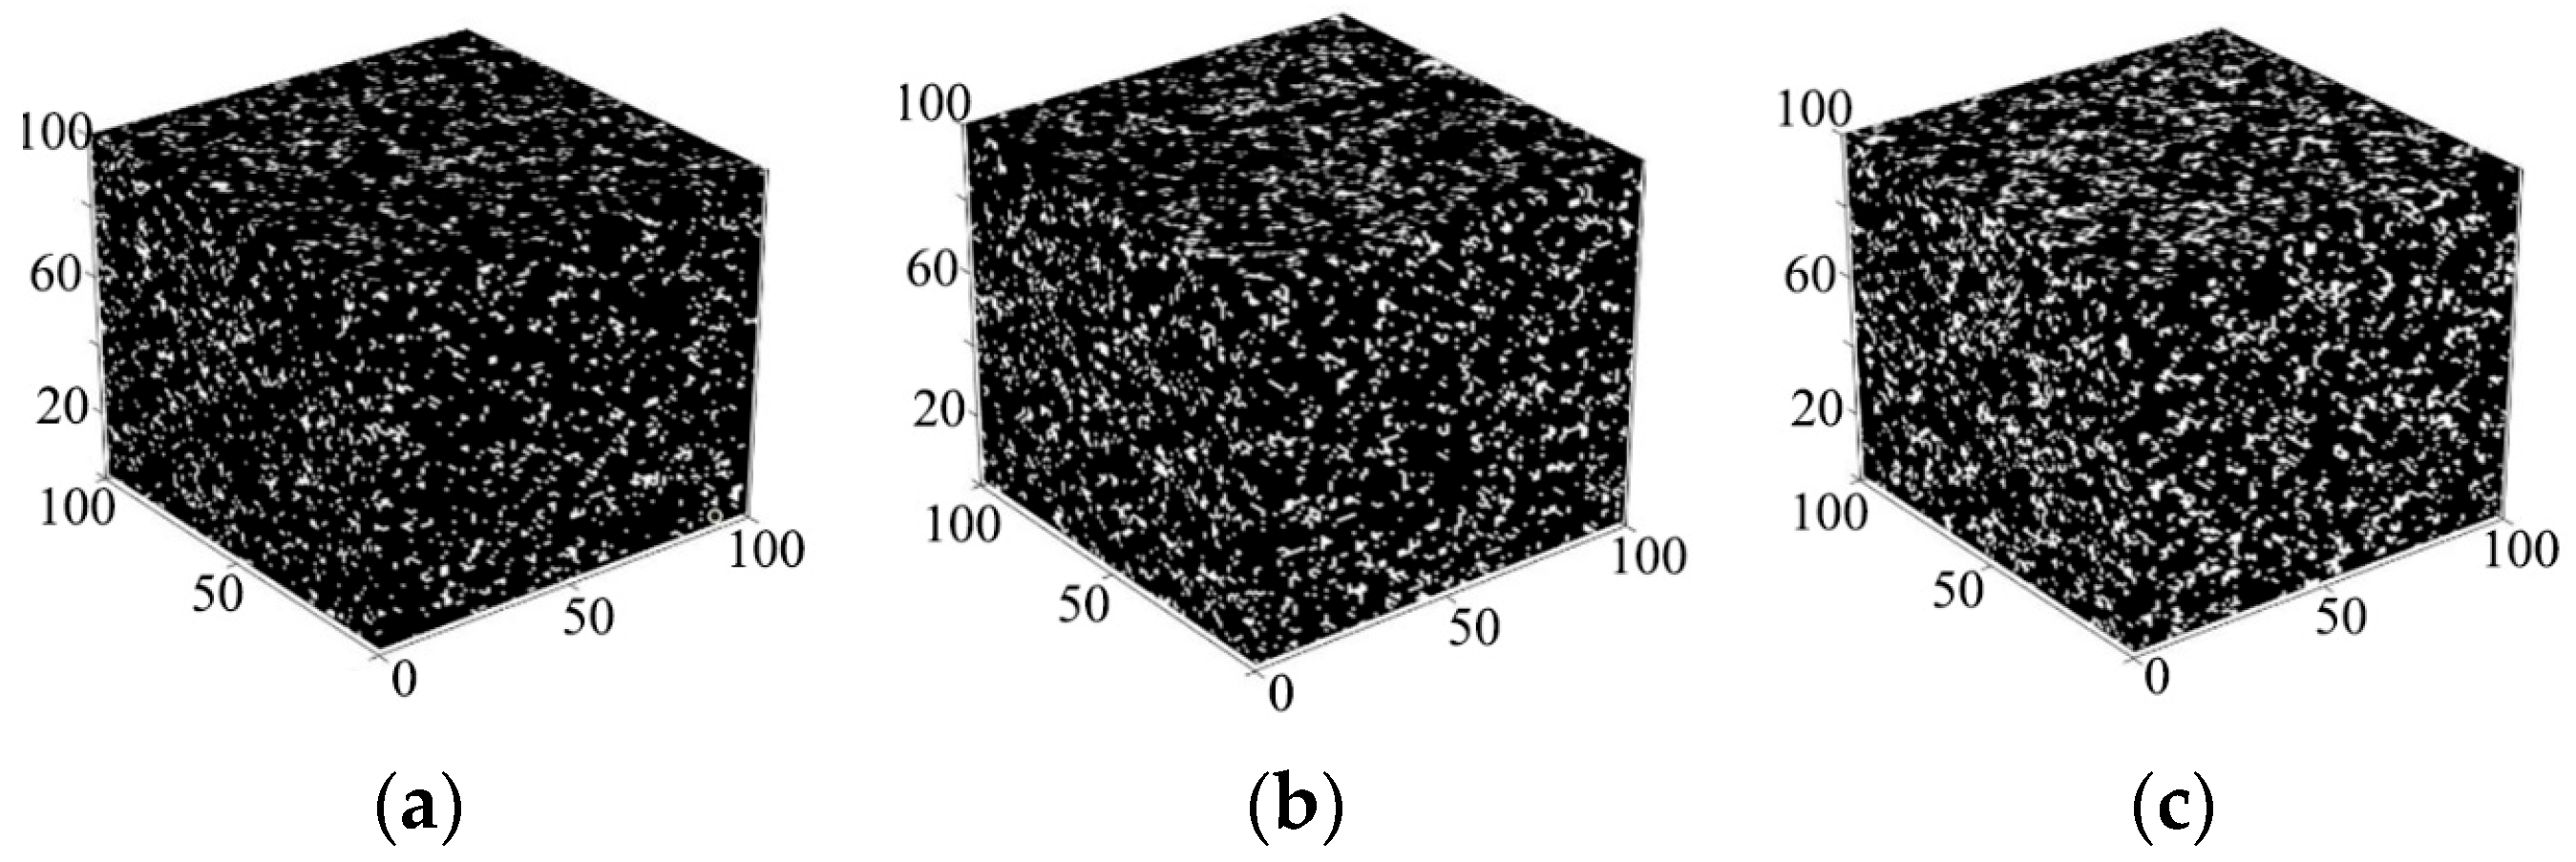
2.1. Quartet Structure Generation Set Method

The QSGS method controls the model of porous media through four parameters [17]: the distribution probability, pc; the growth probability, pd; the probability density, pimq; and porosity, n. In this research, the paste region of porous concrete is designated as the growth phase, while the pores are considered the non-growth phase, as follows:
Step 1. Solid phases are randomly distributed in space according to a certain probability, pc, ensuring that this distribution probability must be less than the set porosity, n.
Step 2. Within the spatial domain, solid phase units are grown along adjacent points in 19 directions with a certain growth probability, pd (as shown in Figure 1).
Step 3. Step 1 and Step 2 are repeated until the growth phase reaches the initially set porosity, n. Growth is halted at this point, marking the completion of the porous concrete model based on the QSGS method.

2.2. Lattice Boltzmann Theory and Boundary Conditions

The lattice Boltzmann equation (LBE) is a special discrete form of the Boltzmann–BGK equation [21], capable of deriving Navier–Stokes (N-S) equations by solving the discrete Boltzmann equation for the particle distribution function, F(ω,t), at time t and position ω. This approach enables the simulation of fluid flow from a mesoscopic perspective. The evolution of the particle distribution function, F(ω,t), without external force terms, can be represented by the discrete LBE as follows:
F α ( ω + e α δ t , t + δ t ) = F α ( ω , t ) F α ( ω , t ) F α eq ( ω , t ) τ
where Fα(ω,t) represents the particle distribution function at time t at lattice point ω in direction α; eα is the discrete velocity; δt is the discrete time; τ is the dimensionless relaxation time; and F α eq ( ω , t ) denotes the local equilibrium state distribution function in the discrete velocity space.
The lattice Boltzmann model typically consists of a lattice, an equilibrium distribution function, and a set of evolution equations for the distribution function [22]. A commonly used model is D3Q19, where D represents the dimension, and Q represents the number of discrete velocities.
The discrete velocities, eα, in the D3Q19 model satisfy Equation (2):
e α = c 0 0 0 1 0 0 1 0 0 0 1 0 0 1 0 0 0 1 0 0 1 1 1 0 1 1 0 1 1 0 1 1 0 1 0 1 1 0 1 1 0 1 1 0 1 0 1 1 0 1 1 0 1 1 0 1 1
In the D3Q19 model, the weight coefficients are configured as follows:
w α = 1 3 ,         α = 0 1 18 ,         α = 1 , 2 , , 6 1 36 ,         α = 7 , 8 , , 18
The equilibrium distribution function can be represented as follows:
F α eq = ρ w α [ 1 + e α u c s 2 + ( e α u ) 2 2 c s 4 u 2 2 c s 2 ]
where cs is the lattice speed of sound, typically set to c 2 / 3 in lattice units; ρ represents the density; wα is the weight coefficients; and u is the macroscopic velocity.
The derivation of the N-S equations from the fundamental LBE model reflects the interplay among macroscopic parameters such as density, velocity, pressure, and viscosity coefficient with the dimensionless relaxation time [25]. For detailed relationships and theoretical underpinnings, reference can be made to the literature [26]. Additionally, related studies [27] have shown that the variation pattern between lattice units and actual physical units is completely consistent. Therefore, all units in the lattice Boltzmann method (LBM) simulations can generally be made dimensionless (lattice units). The units used in this research are all based on lattice units.
In the mesoscopic simulation of permeation, the setting of boundary conditions plays a crucial role in the stability, efficiency, and convergence of numerical calculations. This research employs the standard bounce-back format [21] and the non-equilibrium extrapolation method [28] to simulate the no-slip flow behavior and pressure boundaries between the solid phase and fluid within porous concrete. Additionally, except for the inlet and outlet boundaries, the model’s surrounding wall boundaries are set as impermeable boundaries. As can be seen from the above, to effectively handle the boundary problem of porous concrete seepage simulation, this research adopts two different boundary treatment methods (standard bounce-back format and non-equilibrium extrapolation method), which is very crucial. Appropriate boundary treatment methods can ensure the correct convergence of numerical solutions and prevent nonphysical oscillations or error accumulation caused by boundary conditions. The walls around the model object are set as impermeable boundaries, which usually means that fluid cannot flow in or out of these boundaries. This setting is very reasonable in porous media simulation because it simulates the barrier effect of porous materials on fluids in actual situations. Taking into account the above boundary conditions, it is extremely important to ensure the physical authenticity and numerical stability of the simulation.

2.3. Permeability Calculation Method

The permeability or permeation coefficient of concrete can generally be calculated using Darcy’s law [26]. In this research, permeability is used to characterize the ability of water to pass through the pores within porous concrete, and it is specifically expressed as follows:
K = u L μ p in - p out
where K represents the permeability; u is the average flow velocity; L is the length of the flow path; μ is the dynamic viscosity of the fluid; and pin and pout are the water pressures at the inlet and outlet, respectively.

2.4. Lattice Boltzmann Model Verification

To verify the accuracy of the LBM numerical approach, a Poiseuille flow test was conducted on a self-compiled program [26,29]. A grid region of 100 lattice units in length (L) and 50 lattice units in diameter (D) was selected as the 3D validation calculation model. All parameters in this model were expressed in dimensionless lattice units [26,30,31], and the boundary condition treatments remained consistent with those previously mentioned. Specific calculation parameters are provided in Table 1. The comparison between the LBM numerical solution and the analytical solution for Poiseuille flow is depicted in Figure 2. As shown in Figure 2, there is excellent agreement between the LBM numerical solution and the analytical Poiseuille solution, with the maximum error in model flow velocity being a mere 0.312%.

3. Construction of a Mesoscopic Model of Porous Concrete

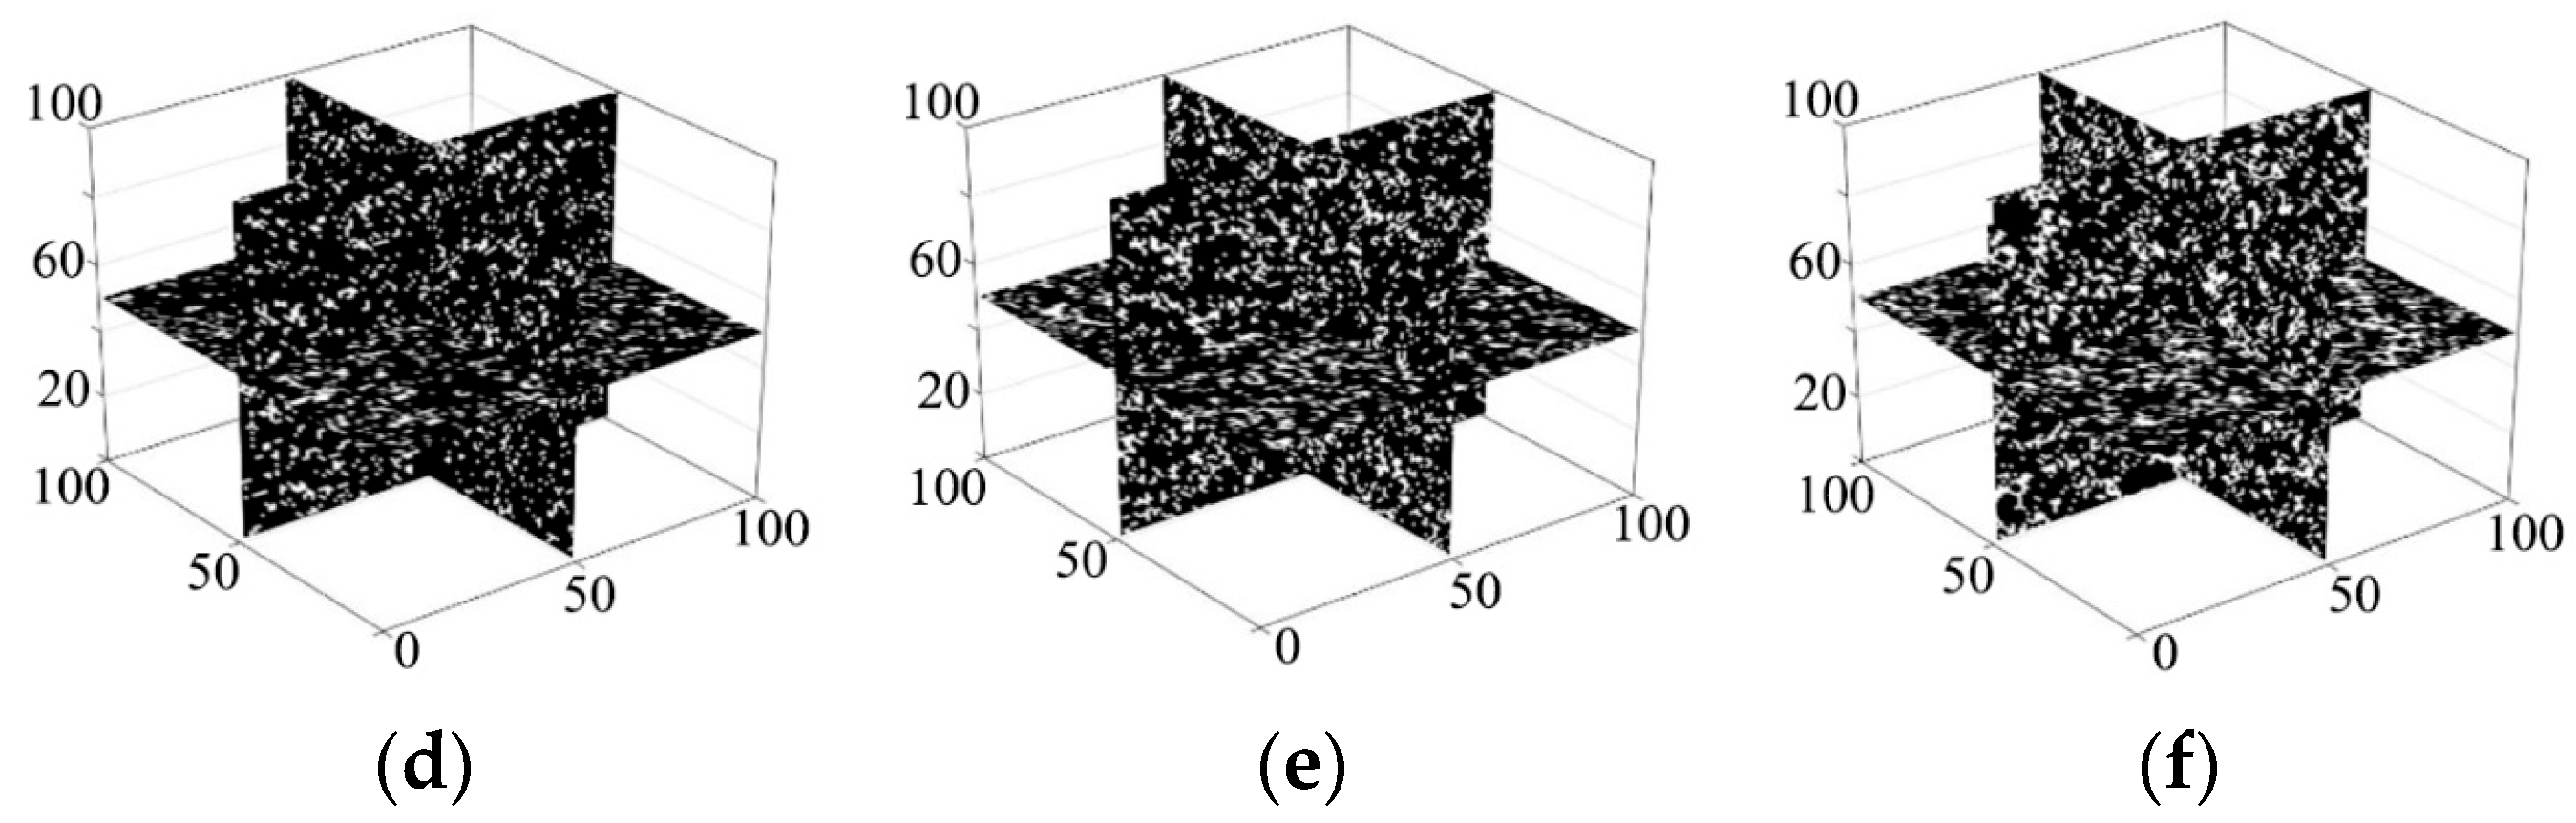
3.1. Mesoscopic Structural Characterization

Porous concrete, akin to geotechnical materials, can be regarded as a porous medium material, broadly divisible into two components: the cement paste matrix and the voids. The spatial distribution within the porous medium can be expressed as follows:
G ( x ) = 1 ,         x   is   located   in   the   solid   phase . 0 ,         x   is   located   in   the   pore   phase .
where G(x) represents a random variable reflecting the distribution of pores, and the expected value of G(x) is denoted as <G(x)> = n; here, the symbol <> denotes the average, and n is the porosity.

3.2. Mesoscopic Model of Porous Concrete

Utilizing the QSGS method, which manipulates control parameters such as the pc, pd, pimq, and n, the diverse porosity levels of 3D mesoscopic structural models of porous concrete can be modeled, with dimensions of 100 × 100 × 100 lattice points. The specific model construction schemes are outlined in Table 2, and the resulting mesoscopic structural models of porous concrete are illustrated in Figure 3, Figure 4 and Figure 5. In these models, the solid phase is represented in black, while the pore phase is depicted in white. Varying the pc value enables control over the size of the pores within the porous concrete, with smaller pc values resulting in larger pores.
Observations from Figure 3, Figure 4 and Figure 5 reveal that the distribution of pores within the porous concrete varies and is disordered, fundamentally aligning with the anisotropic nature of pore distribution in actual porous concrete. In summary, the QSGS method described in this research for modeling models of porous concrete demonstrates the effective distribution of pores and cement paste. Hence, this approach offers a convenient and rapid advantage for subsequent research into the influence of various factors on the permeability characteristics of porous concrete, thereby providing a reference for other scholars in the field.

4. Permeability of Porous Concrete Model

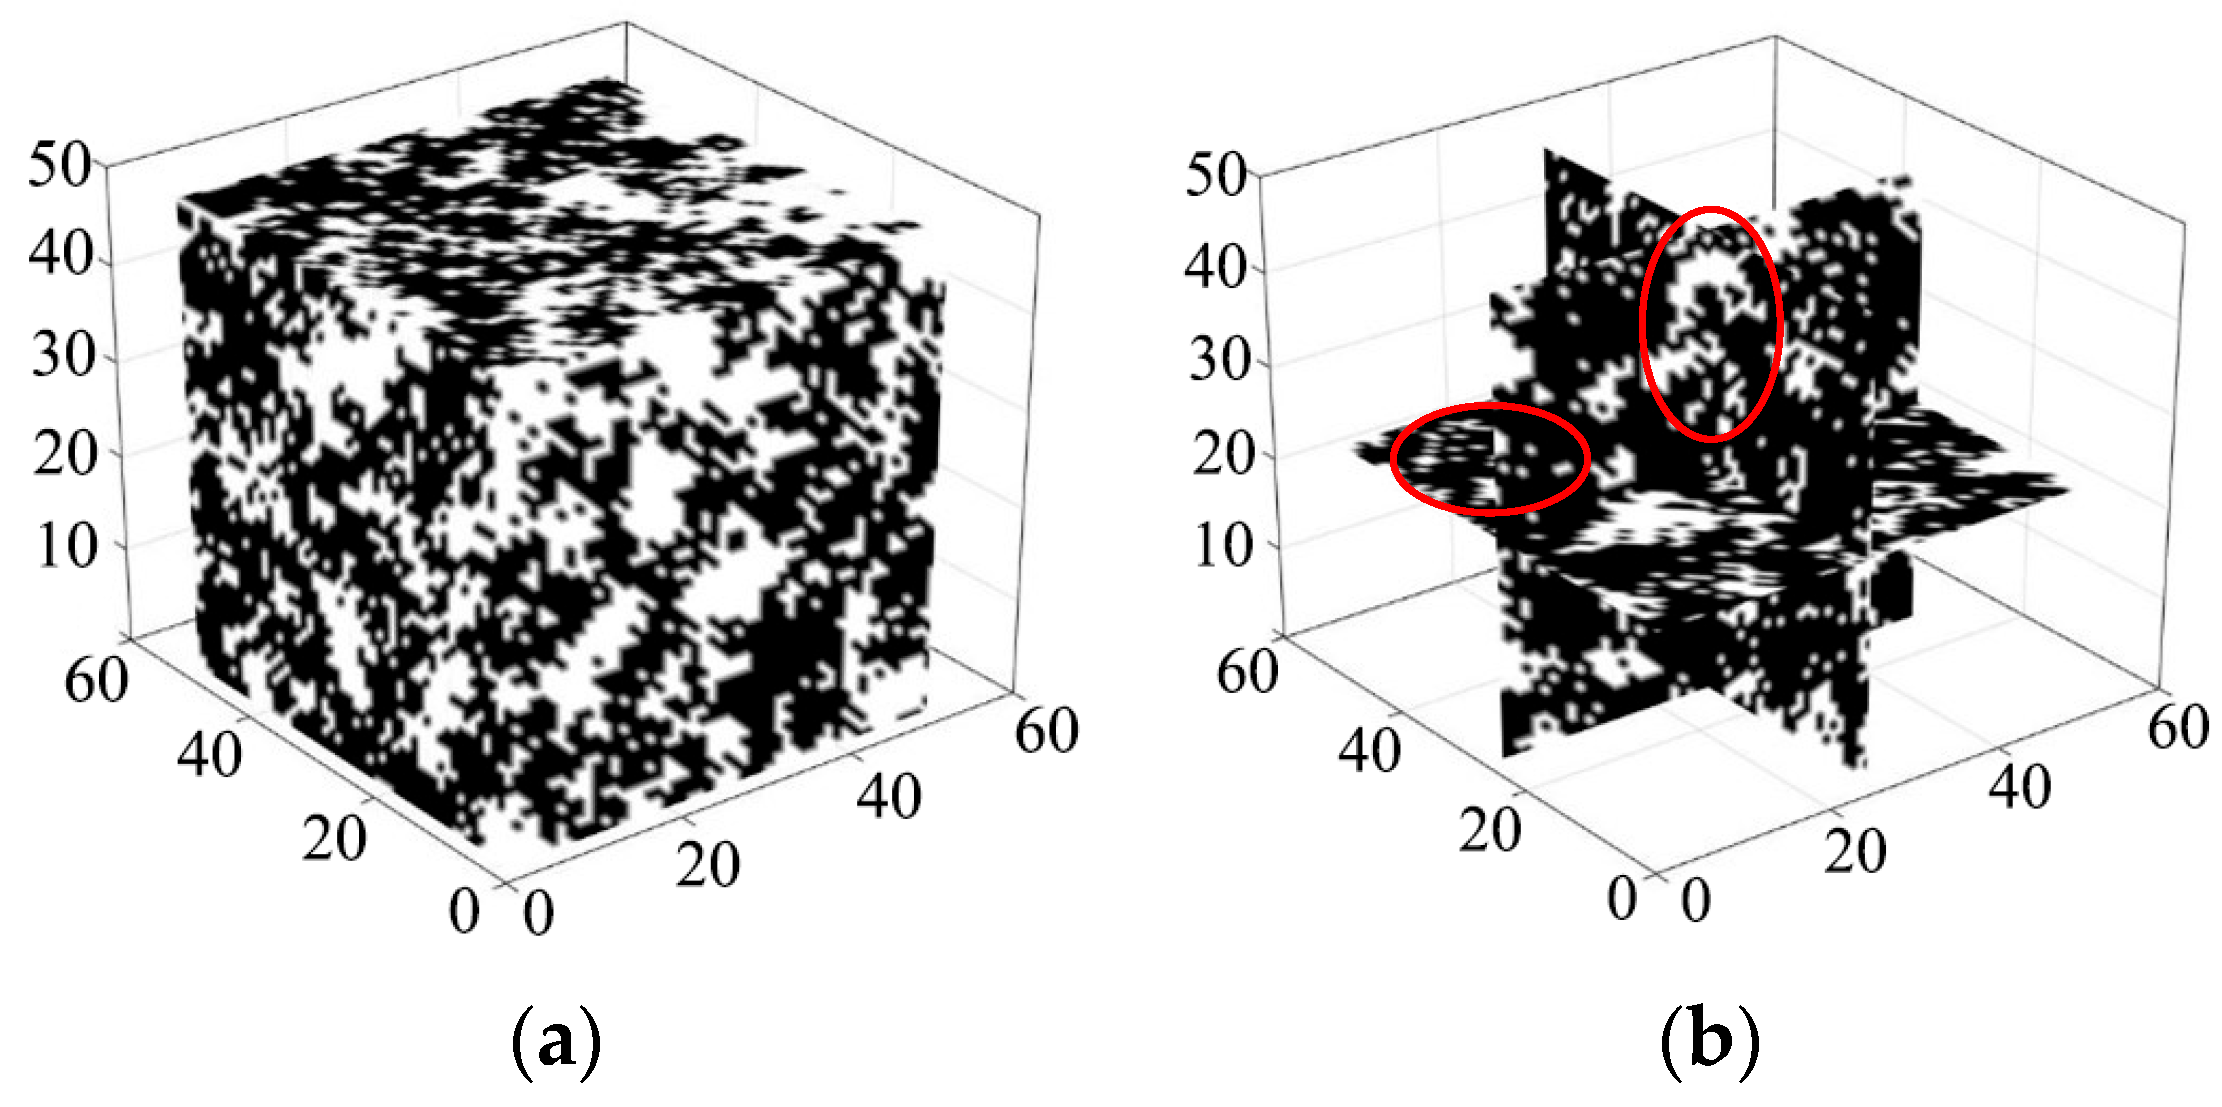
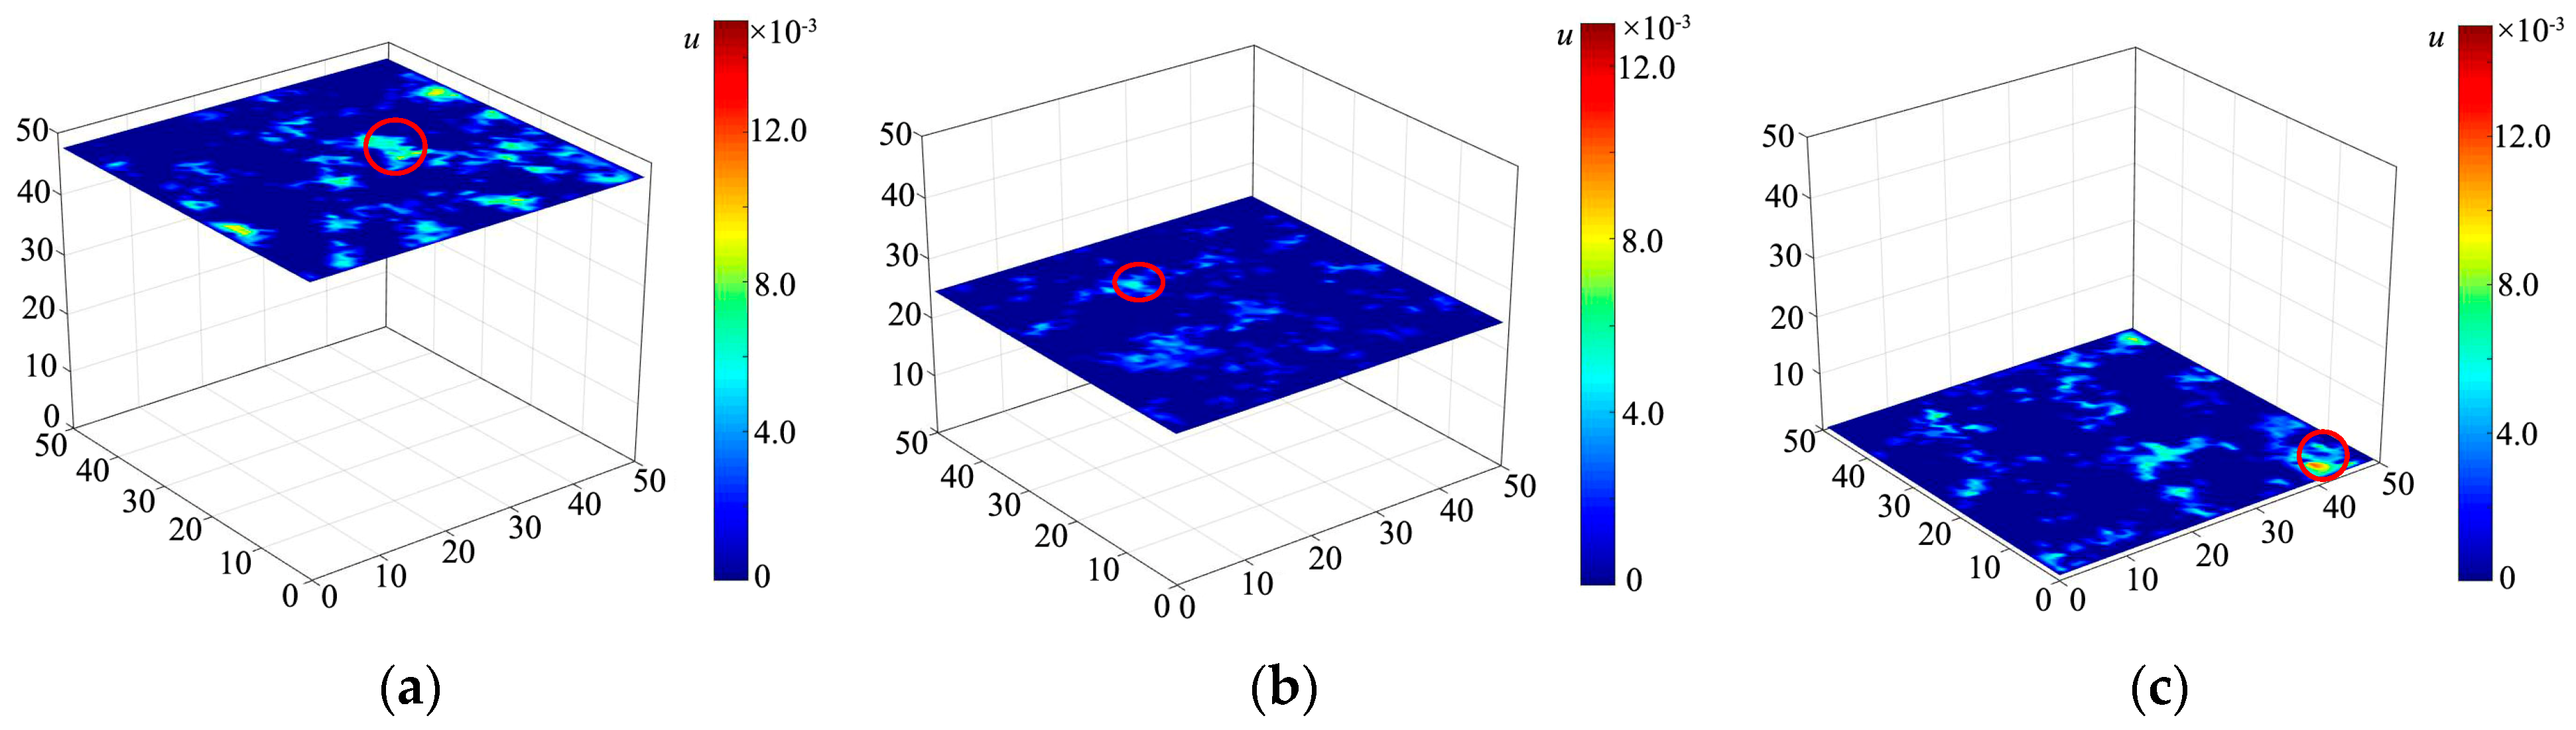
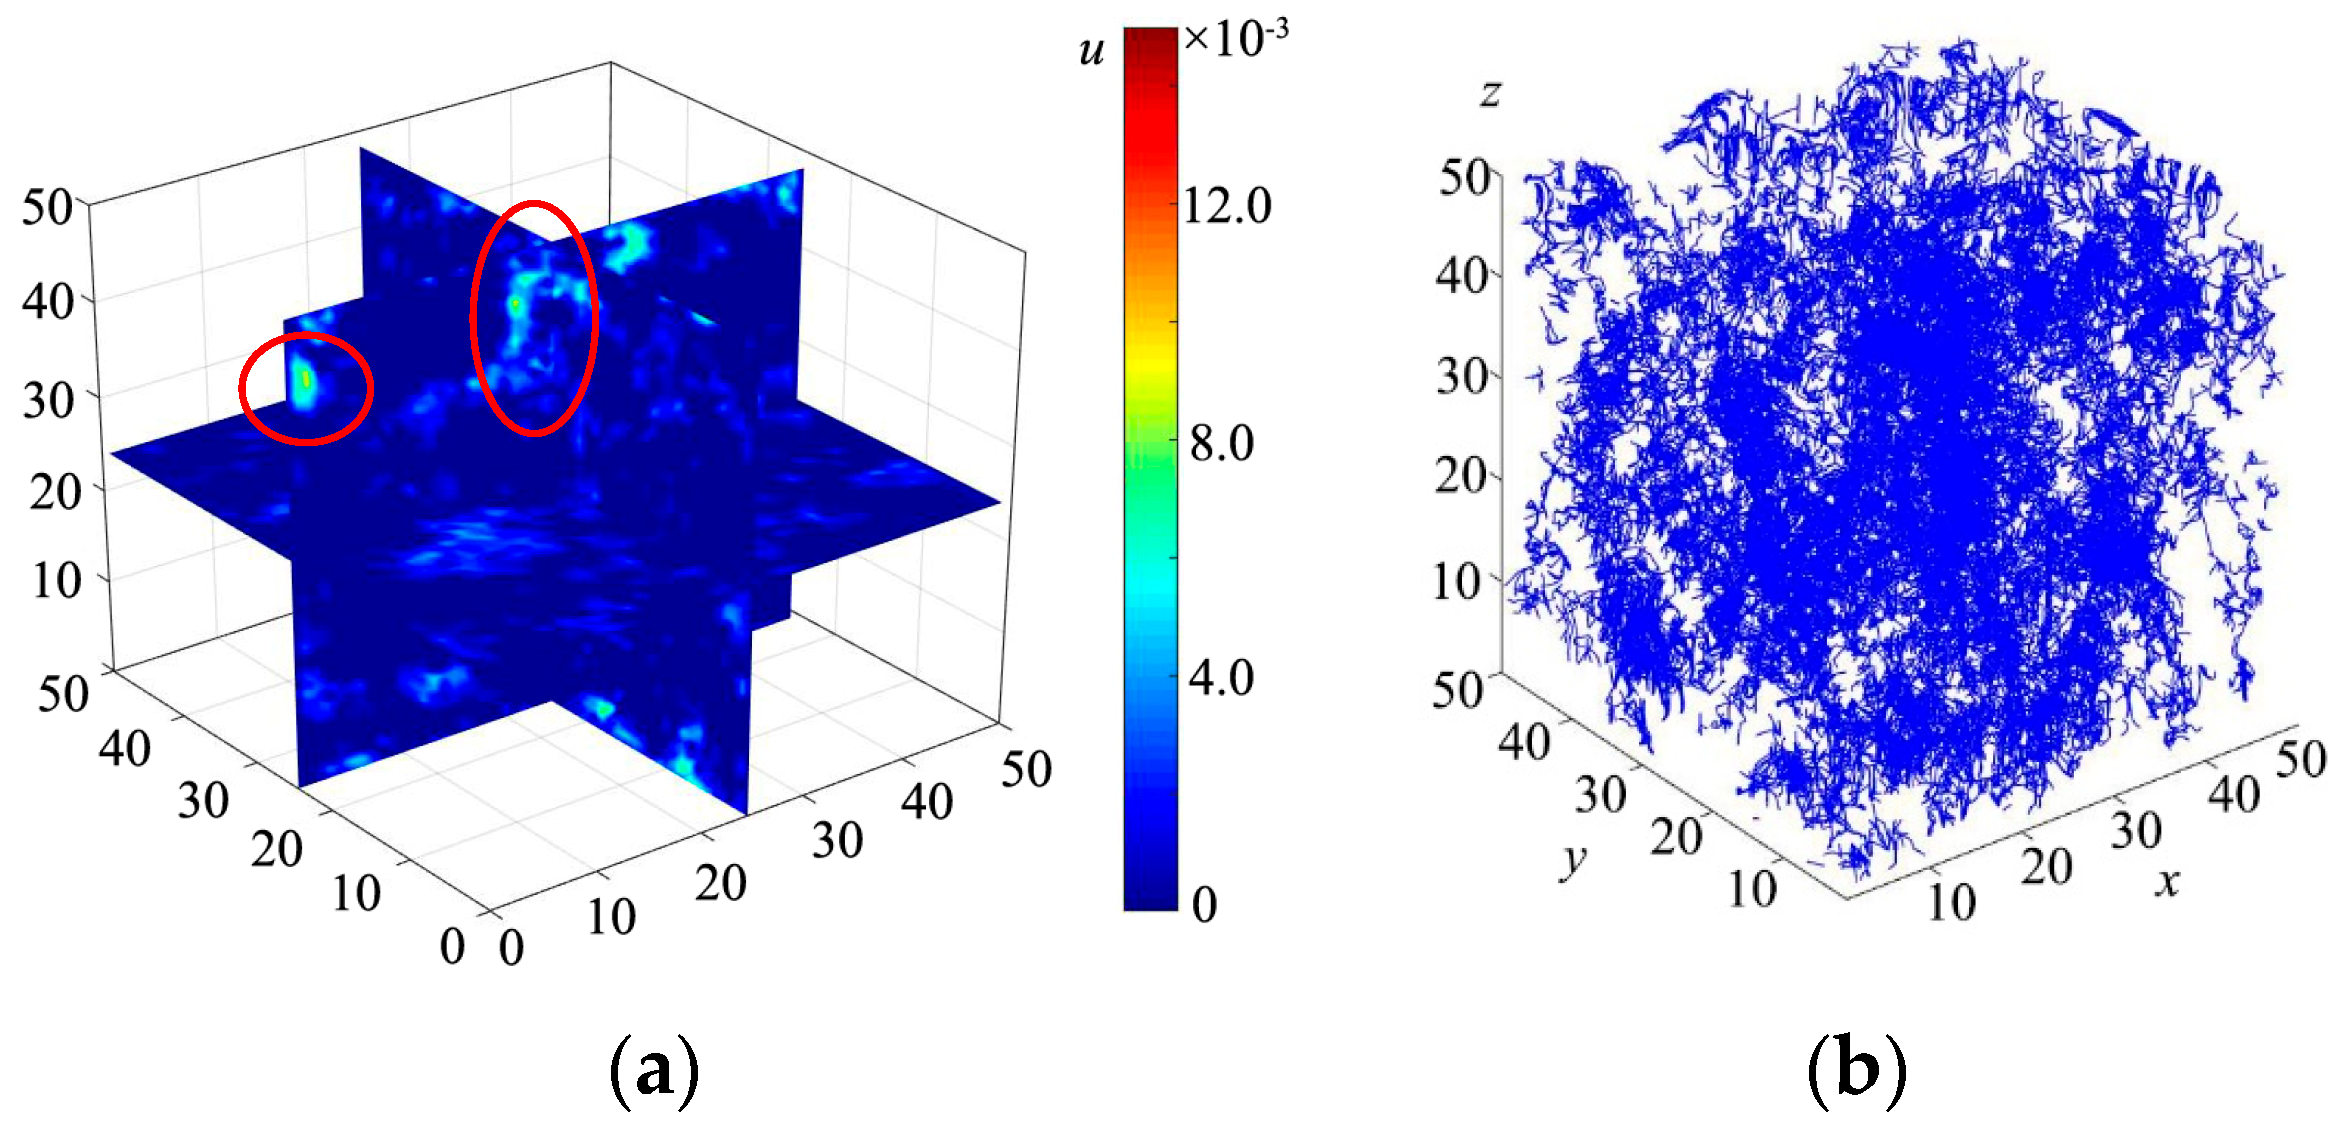
4.1. Seepage Simulation of Porous Concrete Model

To further investigate the permeability of the porous concrete model modeled based on the QSGS mentioned above and to ensure a more intuitive visualization of seepage simulation, the porous concrete model with the highest porosity (n = 0.25) in Scheme 1 is taken as an example. The LBM is employed to simulate the fluid (water) percolation process within the internal pores of the porous concrete, aiming to calculate its permeability and thus quantitatively evaluate its permeability capacity. Furthermore, considering the substantial computational memory required and the low efficiency of simulating fluid flow in large-scale models, this research adopts the strategy of reducing the model size, as suggested in the literature [6]. Specifically, a porous concrete model of 50 × 50 × 50 lattice points (as shown in Figure 6) is used for the permeability simulation. Reflecting the real application of porous concrete as a permeable base layer or pavement structure where rainwater primarily infiltrates from top to bottom, the direction of pore flow in the porous concrete model is similarly set to proceed along the depth of the model. An inlet and outlet pressure difference of 0.012 lattice units is applied to simulate infiltration. The computational domain is selected to be a grid area of 50 × 50 × 50 lattice points, with other related settings and calculation parameters remaining consistent with those in the previously verified examples.

4.2. Analysis of Seepage Simulation Results for Porous Concrete Model

Using the QSGS-LBM combined simulation method, the permeability characteristics of porous concrete were simulated, as illustrated in Figure 7, Figure 8 and Figure 9. Figure 7 shows the velocity field distribution at the inlet, middle, and outlet sections of the porous concrete. It is evident from Figure 7 that the velocity field distributions vary across different sections of the porous concrete, correlating with the diverse pore distributions of the modeled porous concrete. Moreover, Figure 7 reveals localized areas of higher brightness in the velocity field slices, indicating regions where the percolation velocity is significantly higher compared with other areas, with velocities reaching above 0.0140 lattice units, as circled in red in Figure 7a,b.
To visually illustrate the percolation characteristics within porous concrete, the porous concrete model, after achieving flow stability, was sliced along its central axis to display both the velocity field cross-section and the overall velocity streamline distribution, as shown in Figure 8. Figure 8a demonstrates that the velocity field distribution corresponds directly to the pore distribution (as shown in Figure 6b), confirming the feasibility of utilizing the LBM combined with the QSGS method to simulate fluid percolation through the pores of porous concrete. By comparing the velocity slice images with the pore slice images, it can be observed that higher percolation velocities often occur in larger pores, reaching velocities of up to 0.012 lattice units, whereas, in smaller and less connected pores, the percolation velocity is lower, generally below 0.004 lattice units, consistent with the findings in Figure 7. Figure 8b shows that after flow stabilization within the porous concrete model, the streamline distribution intersects and concentrates along the main percolation channels.
Figure 9 presents the distribution curve of permeability changes over time steps. It indicates that the permeability (K) gradually increases with the number of time steps, stabilizing at around 1000 time steps. At this stable point (t = 1000 time steps), the permeability (K) stabilizes at 9.64 × 10⁻³ lattice permeability units. Overall, this research provides a reference for future research on 3D modeling and percolation simulation methods for porous concrete.

4.3. Rationality Analysis and Discussion

To further validate and discuss the rationality of employing the QSGS method for generating porous concrete structures and utilizing the LBM to investigate their permeability characteristics, porous concrete models (50 × 50 × 50 lattice points) with porosities (n) of 0.10, 0.15, 0.20, 0.25, and 0.30 were modeled based on the previously described modeling approach. The permeability of these models was calculated using the LBM numerical simulation method, and the relationship between the calculated permeability and model porosity is depicted in Figure 10.
It can be observed from Figure 10 that there is a high positive correlation between permeability and porosity. Furthermore, to quantitatively evaluate the correlation between permeability and porosity, the Pearson correlation coefficient between the permeability of porous concrete models and their porosity was calculated, reaching a high value of 0.92. Under conditions of similar porosity in porous concrete, the numerical calculation results of this research are consistent with the experimental results found in the literature [6,32,33]. This consistency demonstrates the viability of using the QSGS to model mesoscopic structural models of porous concrete. Moreover, employing the LBM to explore the permeability characteristics based on these models proves to be feasible. This approach not only validates the methods used but also provides new perspectives and methodologies for subsequent research on porous concrete and similar porous materials.
In addition, the research results of other scholars on the regression relationship between the permeability and porosity of porous concrete tested in the laboratory are further compared and discussed, as shown in Table 3. According to Table 3, the relationship between the permeability and porosity of porous concrete in laboratory tests can be categorized into linear and exponential relationships. Specifically, when the porosity of porous concrete is below 0.30, there is a linear relationship between its permeability and porosity. However, when the porosity exceeds 0.30, the relationship between permeability and porosity becomes an exponential model. The reasons for this distinction are as follows.
(1) At lower porosity levels, the pores within porous concrete may be relatively isolated, with poor connectivity between them. In this scenario, an increase in porosity directly leads to more pathways for water flow, though these pathways remain relatively simple and direct. Consequently, the increase in fluid flow paths is approximately proportional to the increase in porosity, resulting in a direct linear relationship between permeability and porosity. This linear relationship indicates that as the porosity increases by a certain proportion, permeability increases correspondingly in a linear manner.
(2) At higher porosity levels, the pore structure within the porous concrete undergoes significant changes, primarily in the form of greatly enhanced connectivity between the pores. The pathways between pores become more complex, potentially forming more networks and branches, which causes an exponential increase in the number and complexity of water flow paths. When the porosity exceeds a certain threshold (such as 0.30), even a small increase in porosity can lead to a large number of new flow paths, with increasing permeability outpacing that of porosity. Thus, the relationship between permeability and porosity exhibits exponential behavior.
In summary, the relationship between permeability and porosity in porous concrete reflects the complexity of pore structures and changes in fluid flow mechanisms. At lower porosity levels, where pores are more isolated, permeability increases linearly with porosity. In contrast, at higher porosity levels, the enhanced connectivity and complexity of the pore network lead to an exponential relationship between permeability and porosity. These variations reveal how the internal structure of the material profoundly impacts its physical properties, which is crucial for the design and application of porous concrete structures.

5. Conclusions

This research utilized the QSGS and LBM to conduct numerical simulation experiments on the water infiltration of porous concrete models, verifying the rationality of the modeled porous concrete and its permeability results. The following conclusions were drawn.
(1) The porous concrete models modeled using the QSGS method feature various pore shapes and a disorderly pore distribution, consistent with the anisotropic characteristics of actual porous concrete pore distributions. Moreover, leveraging the efficient and convenient advantages of the QSGS method, coupled with the LBM simulation method, a self-compiled MATLAB program can further facilitate research on the impact of multiple factors on the permeability characteristics of porous concrete, providing a reference for other studies.
(2) Variations in velocity field distribution across different regions of porous concrete are notable, with higher flow velocities commonly observed in larger pores, reaching velocities of up to 0.012 lattice units. As the flow stabilizes, the streamline distribution becomes intertwined, forming concentrated areas, mainly along the main permeation channels. Additionally, the uneven distribution of streamlines in each permeation channel reflects the amount of fluid passing through the porous concrete’s channels to some extent.
(3) A highly linear relationship exists between the permeability and porosity of porous concrete models. The Pearson correlation coefficient is as high as 0.92, which is consistent with the relationship between the permeability and porosity of real porous concrete.
(4) The research demonstrates the feasibility of utilizing the QSGS method to model mesoscopic structural models of porous concrete and employing the LBM to investigate their permeability characteristics. This approach can provide new ideas and methods for subsequent research on porous concrete or similar porous media materials.

Author Contributions

Writing—original draft, Validation, Software: D.Z.; Supervision, Writing—original draft: J.X.; Funding acquisition, Software: X.W.; Formal analysis, Methodology: Q.G. and Y.L. (Yangcheng Li); Software, Formal analysis: Z.H. and Y.L. (Yifan Liu); Investigation: Z.Z., J.Z. and R.S. All authors have read and agreed to the published version of the manuscript.

Funding

This research was funded by the Key Research and Development Projects of Shaanxi Province (2024GX-YBXM-372&2024QCY-KXJ-176) and Department of Transport of Shaanxi Province (22-38K&23-39R).

Data Availability Statement

The raw data supporting the conclusions of this article will be made available by the authors on request.

Acknowledgments

The authors thank Peichen Cai from Chang’an University for his assistance with LBM theory.

Conflicts of Interest

Author Xingang Wang was employed by the company Shaanxi Expressway Engineering Testing Inspection & Testing Co., Ltd. The remaining authors declare that the research was conducted in the absence of any commercial or financial relationships that could be construed as a potential conflict of interest.

List of Relevant Symbols

SymbolDescriptionUnit
pcDistribution probabilityDimensionless
pdGrowth probabilityDimensionless
pimqProbability densityDimensionless
nPorosityDimensionless
tTimeLattice unit
ωPosition-
eαDiscrete velocityDimensionless
δtDiscrete timeDimensionless
τThe dimensionless relaxation timeDimensionless
F α eq ( ω , t ) The local equilibrium state distribution function in the discrete velocity space-
csLattice velocity of soundDimensionless
ρDensityLattice unit
wαThe weight coefficientsDimensionless
uThe macroscopic velocityLattice unit
KPermeabilityLattice unit
uThe average flow velocityLattice unit
LThe length of the flow pathLattice unit
μThe dynamic viscosity of the fluidLattice unit
pinWater pressures at the inletLattice unit
poutWater pressures at the outletLattice unit
DDiameterLattice unit
δxLattice spacingDimensionless
ReReynolds numberDimensionless
G(x)Random variable reflecting the distribution of pores-
< >The average of G(x)-

References

  1. Alshareedah, O.; Nassiri, S. Pervious concrete mixture optimization, physical, and mechanical properties and pavement design: A review. J. Clean. Prod. 2021, 288, 125095. [Google Scholar] [CrossRef]
  2. Yuan, D.H.; Cui, L.J.; An, Y.C.; Chen, B.; Guo, X.J.; Li, Y.; Zhao, R.; Cui, S.; Wang, S.S.; Kou, Y.Y. Investigating the pollutant-removal performance and DOM characteristics of rainfall surface runoff during different ecological concrete revetments treatment. Ecol. Indic. 2019, 105, 105655–105662. [Google Scholar] [CrossRef]
  3. Quan, J.D.; Li, X.L.; Liang, S.; Hu, G.; Li, X.W.; Yu, W.B.; Yuan, S.S.; Duan, H.B.; Hu, J.P.; Hou, H.J.; et al. Enhancing phosphorus removal by novel porous concrete fabricated with alkali-activated aggregate derived from industrial solid wastes. Resour. Conserv. Recycl. 2024, 204, 107520. [Google Scholar] [CrossRef]
  4. Zhang, Z.Z.; Xue, J.N.; Zhang, J.Y.; Ming, Q.; Meng, B.; Tan, Y.R.; Ren, S.P. A deep learning automatic classification method for clogging pervious pavement. Constr. Build. Mater. 2021, 309, 125195. [Google Scholar] [CrossRef]
  5. Chen, X.D.; Wang, H. Life-cycle assessment and multi-criteria performance evaluation of pervious concrete pavement with fly ash. Resour. Conserv. Recycl. 2022, 177, 105969. [Google Scholar] [CrossRef]
  6. Shan, J.S.; Zhang, Y.; Wu, S.Y.; Lin, Z.S.; Li, L.; Wu, Q.L. Pore characteristics of pervious concrete and their influence on permeability attributes. Constr. Build. Mater. 2022, 327, 126874. [Google Scholar] [CrossRef]
  7. Zhang, Y.; Li, H.; Abdelhady, A.; Yang, J.; Wang, H.B. Effects of specimen shape and size on the permeability and mechanical properties of porous concrete. Constr. Build. Mater. 2021, 266, 121074. [Google Scholar] [CrossRef]
  8. Elizondo-Martinez, E.J.; Ossa-Lopez, A.; Rodriguez-Hernandez, J. Evaluation of the Effect of Different Compaction Methods on Porous Concrete Pavements: Correlation with Strength and Permeability. J. Mater. Civ. Eng. 2021, 33, 04021184. [Google Scholar] [CrossRef]
  9. Hou, F.J.; Qu, G.L.; Yan, Z.W.; Zheng, M.L.; Ma, Y.; Li, J.; Fan, F.F.; Zhang, J.G. Properties and relationships of porous concrete based on Griffith’s theory: Compressive strength, permeability coefficient, and porosity. Mater. Struct. 2024, 57, 52. [Google Scholar] [CrossRef]
  10. Bian, L.B.; Dong, S.; Tao, Z. Basic Properties of Alkali Activated Slag /Fly Ash Pervious Concrete. Mater. Rep. 2020, 34, 1299–1303. [Google Scholar]
  11. Zhang, T.; Lu, D.T.; Li, D.L. A method of reconstruction of porous media using a two-dimensional image and multiple-point statistics. J. Univ. Sci. Technol. China 2010, 40, 271–277. [Google Scholar] [CrossRef]
  12. Liu, Y. CT Identification and Analysis of Pore State of Porous Cement Concrete; Changsha University of Science and Technology: Changsha, China, 2017. [Google Scholar]
  13. Yi, H. Application Researcher of Porous Concrete in Tunnel Drainage in Karst Area; Xi’an University of Science and Technology: Xi’an, China, 2020. [Google Scholar] [CrossRef]
  14. Hu, J.; Qian, Z.D.; Liu, P.F.; Wang, D.W.; Oeser, M. Investigation on the permeability of porous asphalt concrete based on microstructure analysis. Int. J. Pavement Eng. 2020, 21, 1683–1693. [Google Scholar] [CrossRef]
  15. Chung, S.Y.; Han, T.S.; Kim, S.Y.; Lee, T.H. Investigation of the permeability of porous concrete reconstructed using probabilistic description methods. Constr. Build. Mater. 2014, 66, 66760–66770. [Google Scholar] [CrossRef]
  16. Wang, M.; Ning, P. Numerical analyses of effective dielectric constant of multiphase microporous media. J. Appl. Phys. 2007, 101, 114102. [Google Scholar] [CrossRef]
  17. Li, R.M.; Liu, S.Y.; Fang, L.; Du, Y.J. Micro-structure of clay generated by quartet structure generation set. J. Zhejiang Univ. (Eng. Sci.) 2010, 44, 18971901. [Google Scholar] [CrossRef]
  18. Jin, Y.; Song, H.B.; Pan, J.N.; Zheng, J.L.; Zhu, Y.B. Three dimensional representation of coal’s microstructure and numerical analysis of its pore-permeability spatial-temporal evolution mode. Chin. J. Rock Mech. Eng. 2013, 32, 2632–2641. [Google Scholar]
  19. Raissi, M.; Wang, Z.C.; Triantafyllou, M.S.; Karniadakis, G.E. Deep learning of vortex-induced vibrations. J. Fluid Mech. 2018, 861, 119–137. [Google Scholar] [CrossRef]
  20. Chen, H.; Guo, M.M.; Tian, Y.; Chen, E.; Deng, X.; Le, J.L.; Li, L.J. Progress of convolution neural networks in flow field reconstruction. Chin. J. Theor. Appl. Mech. 2022, 54, 2343–2360. [Google Scholar]
  21. He, Y.L.; Wang, Y.; Li, Q. Lattice Boltzmann Method: Theory and Applications; Science Press: Beijing, China, 2009. [Google Scholar]
  22. Guo, Z.L.; Zheng, C.G. Theory and Applications of Lattice Boltzmann Method; Science Press: Beijing, China, 2009. [Google Scholar]
  23. Zhou, X.; Shen, L.F.; Ruan, Y.F.; Wang, Z.L. Reconstructed soil meso-numerical seepage simulation based on quartet structure generation set. J. Drain. Irrig. Mach. Eng. 2015, 33, 316–321. [Google Scholar] [CrossRef]
  24. Cai, P.C.; Que, Y.; Jiang, Z.L.; Yang, P.F. Lattice Boltzmann mesoseepage research of reconstructed soil based on the quartet structure generation set. Hydrogeol. Eng. Geol. 2022, 49, 33–42. [Google Scholar] [CrossRef]
  25. Succi, S. The Lattice Boltzmann Equation for Fluid Dynamics and Beyond; Clarendon Press: Oxford, UK, 2001. [Google Scholar] [CrossRef]
  26. Cai, P.C.; Mao, X.S.; Dai, Z.Y.; Fu, J.; Zhang, Y.M.; Gong, X.Q. Lattice Boltzmann simulation and mesoscopic mechanism analysis of permeability in soil-rock mixtures. In Computational Particle Mechanics; Springer: Berlin/Heidelberg, Germany, 2023. [Google Scholar] [CrossRef]
  27. Liu, Y.F.; Jeng, D.S. Pore scale study of the influence of particle geometry on soil permeability. Adv. Water Resour. 2019, 129, 232–249. [Google Scholar] [CrossRef]
  28. Guo, Z.L.; Zheng, C.G.; Shi, B.C. Non-equilibrium extrapolation method for velocity and boundary conditions in the lattice Boltzmann method. Chin. Phys. 2002, 11, 366–374. [Google Scholar] [CrossRef]
  29. Yin, P.; Song, H.H.; Ma, H.R.; Yang, W.C.; He, Z.; Zhu, X.N. The modification of the Kozeny-Carman equation through the lattice Boltzmann simulation and experimental verification. J. Hydrol. 2022, 609, 127738. [Google Scholar] [CrossRef]
  30. Shen, L.F.; Wang, Z.L.; Li, S.J. Numerical simulation for seepage field of soil based on mesoscopic structure reconfiguration technology. Rock Soil Mech. 2015, 36, 3307–3314. [Google Scholar] [CrossRef]
  31. Li, J.J.; Jin, L.; Cheng, T. Numerical simulation of mesoscopic seepage field of soil-rock mixture based on lattice Boltzmann method. Sci. Technol. Eng. 2019, 19, 235–241. [Google Scholar]
  32. Zhong, R.; Wille, K. Material design and characterization of high performance pervious concrete. Constr. Build. Mater. 2015, 98, 51–60. [Google Scholar] [CrossRef]
  33. Bhutta, M.A.R.; Tsuruta, K.; Mirza, J. Evaluation of high-performance porous concrete properties. Constr. Build. Mater. 2012, 31, 67–73. [Google Scholar] [CrossRef]
  34. Yuan, J.Q.; Chen, W.Z.; Tan, X.J.; Yang, D.S.; Yu, H.D.; Zhou, B.; Yang, B.H. Study on the Permeability Characteristics of Foamed Concrete Using a Pore-Scale Model from X-ray Microcomputed Tomography Image Reconstruction and Numerical Simulation. J. Mater. Civ. Eng. 2021, 33, 0003735. [Google Scholar] [CrossRef]
  35. Xu, G.L.; Shen, W.G.; Huo, X.J.; Yang, Z.F.; Wang, J.; Zhang, W.S.; Ji, X.L. Investigation on the properties of porous concrete as road base material. Constr. Build. Mater. 2018, 158, 141–148. [Google Scholar] [CrossRef]
Figure 1. Growth direction of 3D QSGS.
Buildings 14 01182 g001
Figure 2. Comparison of Poiseuille analytical solution and LBM numerical solution.
Buildings 14 01182 g002
Figure 3. Mesoscopic model of porous concrete model (pc = 0.01). (a) n = 0.15, 3D model. (b) n = 0.20, 3D model. (c) n = 0.25, 3D model. (d) n = 0.15, typical slice. (e) n = 0.20, typical slice. (f) n = 0.25, typical slice.
Buildings 14 01182 g003
Figure 4. Mesoscopic model of porous concrete model (pc = 0.05). (a) n = 0.15, 3D model. (b) n = 0.20, 3D model. (c) n = 0.25, 3D model. (d) n = 0.15, typical slice. (e) n = 0.20, typical slice. (f) n = 0.25, typical slice.
Buildings 14 01182 g004aBuildings 14 01182 g004b
Figure 5. Mesoscopic model of porous concrete model (pc = 0.1). (a) n = 0.15, 3D model. (b) n = 0.20, 3D model. (c) n = 0.25, 3D model. (d) n = 0.15, typical slice. (e) n = 0.20, typical slice. (f) n = 0.25, typical slice.
Buildings 14 01182 g005
Figure 6. Research model for permeability of porous concrete. (a) n = 0.25, 3D model. (b) n = 0.25, typical slice.
Buildings 14 01182 g006
Figure 7. Slice display of typical position velocity field in porous concrete. (a) Inlet velocity field slice. (b) Middle velocity field slice. (c) Outlet velocity field slice.
Buildings 14 01182 g007
Figure 8. Typical velocity field slices and streamline distribution of porous concrete. (a) Typical velocity field slice. (b) Velocity field streamline distribution.
Buildings 14 01182 g008
Figure 9. The relationship curve between the permeability of porous concrete and the change in time step.
Buildings 14 01182 g009
Figure 10. The relationship between the permeability and porosity of porous concrete.
Buildings 14 01182 g010
Table 1. LBM numerical method validation example parameters.
LDδxδtRepinpout
100501.01.01000.3080.296
Table 2. Model scheme for the mesoscopic model of porous concrete.
TypeDistribution Probability, pcAnisotropic Growth Probability, pdProbability Density, pimqPorosity, n
Scheme 10.010.01i = 0~18, m = 1, q = 20.15, 0.20, 0.25
Scheme 20.050.01i = 0~18, m = 1, q = 20.15, 0.20, 0.25
Scheme 30.100.01i = 0~18, m = 1, q = 20.15, 0.20, 0.25
Table 3. Comparison of the relationship between the porosity and permeability of porous concrete in this research with other studies.
ResearcherFitting RelationshipR2Porosity RangeResearch Method
Shan et al. [6]Linear relationship0.73Effective n = 0.20–0.26Experimental testing
Zhong et al. [32]Linear relationship0.87Effective n = 0.14–0.29Experimental testing
Bhutta et al. [33]Linear relationship0.75Total n = 0.15–0.30Experimental testing
Yuan et al. [34]Exponential relationship0.84Total n = 0.65–0.90Experimental testing
Xu et al. [35]Exponential relationship0.81Effective n = 0.15–0.35Experimental testing
This researchLinear relationship0.92Total n = 0.10–0.30Numerical calculation
Disclaimer/Publisher’s Note: The statements, opinions and data contained in all publications are solely those of the individual author(s) and contributor(s) and not of MDPI and/or the editor(s). MDPI and/or the editor(s) disclaim responsibility for any injury to people or property resulting from any ideas, methods, instructions or products referred to in the content.

