
Scientometric Analysis and Visualization of Carbon Emission Studies in the Construction Industry
by
 ,
,
Qiming Luo
1,2, 
Depo Yang
1,*,
Lepeng Huang
3,
Lin Chen
3,*,
Diyuan Luo
3,
Kang Cheng
2 and
Fan Yang
2 1
School of Civil and Hydraulic Engineering, Huazhong University of Science and Technology, Wuhan 430074, China
2
China Railway 11th Bureau Group Corporation Limited, Wuhan 430061, China
3
School of Civil Engineering, Chongqing University, Chongqing 400045, China
*
Authors to whom correspondence should be addressed.
Buildings 2024, 14(4), 1181; https://doi.org/10.3390/buildings14041181
Submission received: 18 March 2024
/
Revised: 15 April 2024
/
Accepted: 17 April 2024
/
Published: 22 April 2024
(This article belongs to the Special Issue Data Analysis and Energy Modeling in Smart and Zero-Energy Buildings and Communities)
Abstract
:The field of carbon emissions in the construction industry has drawn extensive attention from researchers and practitioners due to the issue of global warming. In this study, an in-depth analysis of the research status, trends, and frontiers in the field of carbon emissions in the construction industry was carried out. The CiteSpace tool was used to visualize and analyze relevant papers from 1985 to 2023, to describe the overall knowledge structure in the field of carbon emissions in the construction industry using dual-map overlay analysis, journal co-citation network analysis, and keyword co-occurrence network analysis, to apply cluster analysis and burst detection to identify research trends in the field and the frontiers, and to analyze the scientific collaborations in the field. Further, the core issues in the field of carbon emissions in the construction industry were explored and relevant recommendations were proposed. The results are of great significance in identifying and analyzing knowledge systems and research patterns in the field of carbon emissions in the construction industry and help us to discover and understand the current deficiencies, trends, and frontiers in this field, thus providing useful suggestions and reflections for policymakers, practitioners, researchers, and other stakeholders.
1. Introduction
The issue of climate change, which stems from global warming, remains a significant concern that has captured the global community’s attention [1,2]. Various studies have highlighted that global climate change has had a serious impact on ecosystems and human society, such as the melting of polar ice, reduction of biodiversity, increase in extreme weather events, and impact on agricultural production [3,4,5,6]. The State of the Global Climate 2022 released by the World Meteorological Organization (WMO) points out that the global average temperature in 2022 is 1.15 °C higher than the average from 1850 to 1900 [7]. The period from 2015 to 2022 was the warmest eight years on record in 173 years. One of the biggest causes of climate change is the massive emissions of anthropogenic greenhouse gases [8], mainly known as carbon emissions. Scholars have therefore conducted a great deal of research around carbon emissions.
Studies have shown that the construction industry is one of the most carbon-emitting industries [9,10]. Compared to 2020, building energy demand increased by 4% in 2021, with the highest level of carbon emissions from building operations (i.e., approximately 10 billion tons of carbon dioxide) [11]. Carbon emissions from the construction sector accounted for 37% of total emissions in 2021 [12]. Despite the increasing number of countries committed to improving energy efficiency and reducing carbon emissions, the carbon emissions in the construction industry continue to remain high, and the reduction of carbon emissions is negligible. Therefore, research on carbon emissions in the construction industry deserves more attention.
Carbon emissions produced by the construction industry have garnered worldwide attention for their crucial research significance [13,14]. As a result, numerous research works and publications have emerged in this area. While this focus has yielded positive outcomes, it also presents some potential risks. Specifically, it is difficult to accurately assess the scope and impact of the knowledge discovered, including which critical areas may still require further exploration [15]. To help scholars and practitioners have a deeper understanding of the current status and future trends of research into carbon emissions in the construction industry, it is necessary to conduct a systematic analysis of the existing research findings. Prior review studies have made valuable contributions to this field. However, most existing related studies are qualitative and based on manual evaluation. While such studies are informative, they lack repeatability and are susceptible to subjective biases, which may limit their reliability [16]. Furthermore, most review studies tend to concentrate on specific and narrow aspects of carbon emissions in the construction industry. For example, Ref. [17] offers a comprehensive analysis and comparison of diverse techniques employed in calculating the carbon footprint of buildings. Ref. [18] focuses on the embodied carbon emissions of buildings and provides a review of measurement methods and reduction strategies for embodied carbon emissions. Ref. [19] examines various authoritative data and articles related to the carbon emissions of commercial buildings. A recent scientometric review of carbon emissions in the construction industry provides an overview of research regarding carbon emissions in public buildings [20]. Nevertheless, there are limitations to the reference value of these studies for carbon emissions.
To the authors’ knowledge, there is no study that provides a comprehensive understanding of the literature on carbon emissions in the construction industry. To fill this gap, this review study stands out for its innovative use of quantitative techniques to comprehensively investigate the overall body of knowledge and trends in carbon emissions in the construction industry. The purpose of this study is to analyze and comprehend the current research status, trends, and frontiers of carbon emissions in the construction industry. To better achieve this research goal, this paper focuses on addressing the following questions: (1) What is the trend in the number of publications on carbon emissions in the construction industry? (2) What is the knowledge system in the field of carbon emissions in the construction industry, including knowledge flow, research carriers, and research interests, from different perspectives such as macro, meso, and micro? (3) What are the active fields and research frontiers of carbon emissions in the construction industry at different times? (4) What is the status of scientific cooperation in the field of carbon emissions in the construction industry?
2. Methodology
The scientific mapping method, which describes the conceptual, intellectual, and social structure of a particular field of study [21], was used in this study and categorized into bibliometric analysis and scientometric analysis [16]. The former focuses on the literature itself, while the latter covers bibliometric methods, tools, and data to assess the literature and identify potential profound patterns and trends in the field [15]. As this can provide a broader approach, the scientometric analysis method was adopted.
2.1. Science Mapping Tools
Researchers utilize a variety of science mapping tools, each possessing distinctive features. Among the commonly employed software tools are VOSviewer, Gephi, and CiteSpace [15,16]. VOSviewer focuses on network analysis, and Gephi is a specialized network drawing tool. However, CiteSpace can perform both network analysis and visualization simultaneously [22], and it outperforms other tools in terms of its capabilities [21]. Moreover, CiteSpace has the following advantages: (1) It allows users to visualize and perform various scientometric analyses on complex networks constructed from citation data from mainstream academic databases and open-access sources. (2) It is actively maintained and updated, with new visual analysis characteristics and theoretical development [23,24]. (3) Its graphical interface offers good interactivity, allowing for various analyses and adjustments to different layouts [21]. In this study, CiteSpace 5.7.R2 was ultimately selected.
2.2. Data Collection
A systematic literature search was conducted to obtain research works within the field of carbon emission research in the construction industry. The search for relevant publications minimized the exclusion of the most important and relevant publications in the field and tried to avoid subjective judgments. A search strategy applicable to this study was developed with reference to the structured approach proposed by Webster and Watson [25].
Firstly, conduct a pilot literature search on prominent databases, such as Web of Science Core Colelection (WoSCC), Scopus, and Google Scholar. The primary objective is to identify representative papers on carbon emissions in the construction industry. Subsequently, a comparative analysis of the databases used can provide insights into their respective strengths and limitations. Remarkably, the process of scientometrics research, particularly with regard to data collecting, should be conducted with transparency to enable reproducibility by other researchers [26], so the following explains the details of the data source. The literature search was conducted via the library of Huazhong University of Science and Technology. Since WoSCC contains ten sub-datasets, Huazhong University of Science and Technology only subscribes to a customized subset of the whole core collection, as described below:
- Science Citation Index Expanded (SCI-EXPANDED)—1997–present
- Social Sciences Citation Index (SSCI)—2000–present
- Arts & Humanities Citation Index (AHCI)—2005–present
- Conference Proceedings Citation Index–Science (CPCI-S)—1998–present
- Conference Proceedings Citation Index–Social Science & Humanities (CPCI-SSH)—2001–present
- Emerging Sources Citation Index (ESCI)—2019–present
- Current Chemical Reactions (CCR-EXPANDED)—1985–present
- Index Chemicus (IC)—1993–present
Secondly, based on preliminary search and analysis, WoSCC is identified as the citation database for this study. The reasons are summarized as follows: (1) It is difficult to obtain datasets from all databases as analysis objects. Choosing a database to obtain the target dataset is the most feasible and common practice. (2) Google Scholar has issues with insufficient citation information and the relatively low quality of available metadata [27,28,29]. Web of Science (WoS) and Scopus are two leading and competing citation databases, where the former is the oldest, most extensively used, and authoritative database of research publications and citations [30,31]. (3) WoSCC is a commonly used comprehensive database in citation analysis. It sets high standards for publishing, with publications that are expertly reviewed and have high-quality citation data [31,32]. (4) WoSCC is the most popular tool of scientometric analysis in the field of construction.
Thirdly, search in WoSCC to form the dataset for this study. To comprehensively cover publications in the field of carbon emissions in the construction industry as much as possible, relevant published review studies [33,34,35] and a wide range of concepts and variants have been considered. The search terms were divided into two aspects, i.e., carbon emissions and construction. Through Boolean operations, synonyms and corresponding subordinate subject terms of the construction industry or carbon emissions are taken into account. According to the preliminary analysis, the corresponding words for the construction industry include construction industry, construction sector, and civil engineering, the subordinate subject words related to carbon emissions include building, architecture, construction project, construction management, and construction engineering, and synonyms for carbon emissions include greenhouse gas emissions and GHG emissions. All relevant terms and hyponyms need to be taken into account in the search. In this study, all sub-datasets subscribed by our institution are selected and the following retrieval code is used: TS = ((carbon emission* OR carbon dioxide emission* OR greenhouse gas emission* OR GHG emission*) AND (building* OR architecture* OR construction project* OR construction sector* OR construction industry OR construction management OR construction engineering OR structural engineering OR civil engineering)). “TS” is a search term that is short for “Topic” in the WoS, which can be used to search the following fields within a record: Title, Abstract, Author Key, and KeyWords Plus®. KeyWords Plus® is an index term automatically generated from the titles of cited articles. The wildcard “*” is employed to denote the possible presence of zero, one, or multiple unspecified characters, enabling the search for various forms of words, including plurals and inflections. The language is “English”, and no “date range” limit is set. The search type is only for “articles”, as articles can provide a wide range and high quality of information, and a large number of reviews in the field of construction management are also for articles [35,36,37]. As of 10 July 2023, a total of 13,507 articles have been retrieved, and all records and references have been exported.
2.3. Scientific Techniques
This study conducted dual-map overlay analysis, journal co-citation network analysis, keyword co-occurrence network analysis, and scientific collaboration network analysis with the help of CiteSpace. In addition, cluster analysis and burst detection were conducted based on the results of keyword co-occurrence networks.
The parameter settings for CiteSpace are explained as follows. The time slice is set to one year, and the selection criteria is g-index. Usually, within a specific scientific discipline, the higher the g-index, the greater the influence of the analysis object. Details about the g-index can be found in Ref. [38]. The pathfinder networks algorithm recommended by Chen and Morris [39] was used to prune the network to obtain clearer visualization results.
3. Scientometric Analysis of Carbon Emissions in the Construction Industry
3.1. Annual Publishing Trends
In the dataset of this study, the earliest article was published in 1997 [40], which may be affected by any intrinsic limitations of the customized subset’s coverage of publications and the topic search in WoS in the old historical literature retrievals [41]. We attempted to refine our search criteria to focus only on keywords related to carbon emissions and excluded those related to the construction industry. Then, the earliest publication on carbon emission research dated back to 1992. From 1992 to 1996, the number of carbon-emission-related articles remained in the single digits. In 1996, there were only six articles, but it drastically increased to 1141 in 1997, indicating a significant increase in scholarly attention towards carbon emissions. In July 1996, the second conference of the parties to the United Nations Framework Convention on Climate Change (UNFCCC) called on countries to strive to conclude a “binding” legal document by December 1997. In 1997, the Kyoto Protocol was agreed upon, which made specific provisions on the types of greenhouse gas emissions to be reduced, as well as the emission reduction schedules and quotas of major developed countries [42]. This may explain the sudden increase in the number of publications in 1997 and the beginning of attention paid to carbon emissions in the construction industry.
Figure 1 shows the number of articles published annually on carbon emissions in the construction industry between 1997 and 2023. Although WoSCC has continued to expand its content coverage over time [43], its impact on annual publications on carbon emissions in the construction industry is limited, and it is necessary to analyze in detail the potential factors that affect the number of publications. As mentioned before, the data was collected on 10 July 2023, and the articles in the dataset do not include publications after the retrieval time point. Therefore, the line in Figure 1 shows a significant decrease in 2023. Given this, 2023 is excluded from the discussion on the trend of changes in the number of publications. From 1997 to 2007, the number of annual publications grew slowly. In 2007, the number of annual publications exceeded 100 for the first time and maintained stable growth in the following decade. The adoption of the “Bali Road Map” by the United Nations Framework Convention on Climate Change (UNFCCC) in 2007 clarified the responsibilities of each country for climate change [44]. This led to an increase in the importance placed on carbon reduction by countries and regions around the world, driving the rapid development of carbon emission research in the construction industry. This is consistent with Ref. [45]. On 4 November 2016, the Paris Agreement was officially implemented, outlining the plan for global climate governance actions after 2020. This is the third legally binding climate agreement after the United Nations Framework Convention on Climate Change and the Kyoto Protocol. According to Figure 1, since 2017, the annual increase in the number of publications has been greater than before. In 2020, the number of publications surpassed 1000 for the first time, reaching 1179, and is still in a period of rapid growth. In 2021, the United Nations Intergovernmental Panel on Climate Change (IPCC) released the sixth climate change assessment report, which highlights how carbon emissions have led to climate change and extreme events. In the same year, the 26th conference of the parties of the UNFCCC called on countries to accelerate technology development, application, and promotion, and formulate corresponding policies to address carbon emission issues. These events motivated decision-makers, researchers, and practitioners to pay more attention to carbon emissions, especially in the field of construction, which is consistent with the increasing annual publications on carbon emissions in the construction industry.
3.2. Structure of the Body of Knowledge
3.2.1. Macro Knowledge Flow
The overlay maps module can display the distribution of disciplines involved in a certain research field. This is achieved by conducting a combinatorial analysis of publications, depicting the sources and objectives of citations, as well as demonstrating the flow of knowledge [46]. Dual-map overlay analysis was performed on the dataset and link classes with significance were merged using the Z-Score algorithm. The results are shown in Figure 2.
The left part in Figure 2 is the citation graph, while the right part is the cited graph, and they are connected by the citation line which can show the citation trajectory. Each curve in the figure starts from the citing journal on the left and points to the cited journal on the right. The labels at both ends of the curve represent the corresponding disciplines of the journal. The left part shows the main disciplines of the research, indicating the application fields [35]. On the other hand, the right part indicates which disciplines are mainly cited in the research on carbon emissions in the construction industry, denoting the research foundation [35].
Seven major citation trajectories can be observed in Figure 2: (1) From “Physics, Materials, Chemistry” to “Chemistry, Materials, Physics”; (2) From “Physics, Materials, Chemistry” to “Environmental, Toxicology, Nutrition”; (3) From “Veterinary, Animal, Science” to “Chemistry, Materials, Physics”; (4) From “Veterinary, Animal, Science” to “Environmental, Toxicology, Nutrition”; (5) From “Mathematics, Systems, Mathematical” to “Environmental, Toxicology, Nutrition”; (6) From “Veterinary, Animal, Science” to “Economics, Economic, Political”; (7) From “Economics, Economic, Political” to “Economics, Economic, Political”. From the perspective of both application fields and research foundations, there is a significant cross-disciplinary phenomenon in the study of carbon emissions in the construction industry.
In the field of carbon emissions in the construction industry, three main subject groups are cited as the research basis: “Chemistry, Materials, Physics”, “Environmental, Toxicology, Nutrition”, and “Economics, Economic, Political”. The research findings on carbon emission in the construction industry are mainly applied to “Physics, Materials, Chemistry”, “Veterinary, Animal, Science”, “Mathematics, Systems, Mathematical” and “Economics, Economic, Political”. This shows that besides fields such as environmental science, chemistry, materials, physics, economics, and politics, the field of carbon emissions in the construction industry has close links with veterinary science, animal science, toxicology, and nutrition. It indicates that carbon emissions in the construction industry is not only related to the environment and economy but also has a significant impact on the lives of animals and humans, as well as social development, which has garnered attention from scholars.
3.2.2. Meso Research Carrier
Figure 3 shows the visualization results of conducting journal co-citation analysis. The journal co-citation network displays the status of the journals cited in research on carbon emissions in the construction industry. The findings from these cited journals are absorbed, and the knowledge flows into the field of carbon emissions in the construction industry [35]. Additionally, journal co-citation analysis can help depict the impact level of the journals.
The journal co-citation network consists of nodes and connections. The size of a node indicates the frequency with which the journal has been cited, indicating the number of papers published on carbon emissions in the construction industry. The centrality of a node shows its influence, and a higher centrality indicates that the journal associated with that node has greater influence [47]. In the co-citation network, centrality refers to betweenness centrality and is a measure of the importance of the node [48]. The centrality of a node is the proportion of the shortest path connecting two points in the network that passes through that node in the total number of shortest paths. It is assessed by Freeman’s method and details can be found in Ref. [49]. The outermost circle of nodes with a centrality exceeding 0.1 is marked in purple.
Table 1 shows the top ten journals in terms of cited frequency and centrality. The top three journals with the highest cited frequency are Journal of Cleaner Production, Renewable and Sustainable Energy Reviews, and Energy and Buildings, while the top three most influential journals are Environmental Science & Technology, Energy Policy, and Environmental Science & Policy. Among these six journals, three of them are particularly interested in topics directly related to energy, indicating that research on carbon emissions in the construction industry is highly related to energy. In addition, we found that there is no significant correlation between the citation frequency of journals and centrality, which is due to the fact that the process of calculating centrality is independent of the citation frequency. Thus, the cited frequency of a journal is not strictly positively correlated with its influence. The results are expected to guide industry professionals to quickly find suitable journals to study or publish research in, including research on carbon emissions in the construction industry.
3.2.3. Micro Main Research Interests
Keywords are the crucial words or phrases of a paper that express its main content. Analyzing keywords can provide opportunities for discovering research interests in any field [50]. Keyword co-occurrence networks can present a picture of research interests in a certain field, as well as their intellectual connections and structures [51].
Preprocessing of the first network obtained is necessary to obtain a valuable keyword co-occurrence network. Dealing with duplicates and misspellings is necessary. Some nodes in the visualization results may represent the same objects or concepts with different spellings, such as “carbon dioxide” and “CO2”. Occasionally, there could be spelling errors, such as missing spaces between words, e.g., “residentialbuilding”. However, keywords with similar concepts will not be merged, such as “carbon emission” and “carbon dioxide emission”. A detailed explanation of the theoretical basis can be found in Ref. [47]. Furthermore, nodes unrelated to the research topic were removed. To ensure that all articles related to carbon emissions in the construction industry in the database are included as much as possible, we adopted a topic search method and used fuzzy search. Therefore, it is inevitable that some individual literature that does not align well with the target topic will be mixed in, and it is necessary to exclude irrelevant nodes, such as “nanocomposite”, “aerenchyma”, etc. Note that our exclusion behavior is cautious. Only when it is determined that the keyword represented by this node is not related to carbon emissions in the construction industry, can an exclusion operation be made.
After preprocessing, the resulting keyword co-occurrence network is shown in Figure 4. It provides insight into the research interests of the researchers and how they are connected. The keyword co-occurrence network is also composed of nodes and connections. Nodes with a large size indicate that the corresponding keywords appear frequently in publications. As mentioned earlier, the centrality of a node represents its influence, and nodes with a centrality of over 0.1 are marked with purple on the outermost circle. The connections between nodes not only represent the relationship between keywords but also the strength of the relationship [51]. The more publications have keywords appearing simultaneously, the stronger the link strength between keywords, and the thicker the line displaying the link in network visualization [48]. These descriptions are also applicable to other networks in this paper. Keywords can be replaced with journals, institutions, or countries, and co-occurrence relationships can be replaced with co-citation relationships or co-authorship relationships. In addition, when nodes are displayed in a ring structure, the thickness of the ring is directly proportional to the frequency of citations in that year. In Figure 4, nodes with keyword frequencies exceeding 200 and higher centrality rankings are labeled. The top 20 keywords in frequency and centrality rankings are shown in Table 2.
“Carbon emission” is the keyword with the highest frequency of occurrence, as the topic discussed in this study is carbon emissions. Meanwhile, “carbon emission” has a high connection strength with “consumption”, “renewable energy”, “carbon dioxide emission”, “energy efficiency”, and “China”. This illustrates the following points: (1) Research on carbon emissions in the construction industry is highly related to energy research, including improving energy efficiency, reducing energy consumption, and promoting renewable energy. This is consistent with the views of the other literature [52]. The building life cycle includes various stages such as material production, construction, operation, and demolition. Each stage requires a significant amount of energy consumption and results in emissions. There is a significant positive correlation between energy consumption and carbon emissions [53]. The relationship between energy efficiency and carbon emissions will be further explained in this study. (2) In the field of carbon emissions in the construction industry, compared to other greenhouse gas emissions, carbon dioxide emissions are the most concerning. (3) Many publications have studied carbon emissions in China’s construction industry, which has the highest carbon emissions globally [54]. The research potential for reducing carbon emissions in the Chinese construction industry is huge.
“Life cycle assessment” (LCA) ranks second in frequency due to its importance in carbon emission evaluation [55]. LCA is a technology used to evaluate the environmental impact of a product throughout its entire life cycle, starting from the acquisition of raw materials to production, use, and disposal after use. LCA research includes four stages, i.e., goal and scope definition, life cycle inventory analysis (LCI), life cycle impact assessment (LCIA), and interpretation. This method can offer critical information to decision-makers, designers, engineers, and other construction industry practitioners by assessing the environmental impact of construction products. Most studies evaluating carbon emissions use the LCA method [56]. Keywords with high correlation with “Life cycle assessment” include “environment”, “embodied energy”, “product”, “concrete”, and “environmental impact assessment”.
The third most frequently ranked keyword is “performance”. In the field of carbon emissions in the construction industry, carbon performance [57], energy performance [58,59,60], environmental performance [61,62], and building thermal performance [63] are all widely discussed topics. Ref. [57] utilized BIM to analyze the carbon performance of residential buildings during their life cycle and researched the design optimization of residential buildings. Ref. [58] proposes a new modeling method for evaluating energy performance and carbon dioxide emission performance. According to the research, several major countries such as China and the United States have poor energy performance and carbon dioxide emission performance, which may be related to their lower power generation efficiency and consumption of large amounts of fossil fuels. Ref. [61] developed a monitoring framework that can provide indicator information on building performance, describe the environmental performance of operating buildings, and provide support for optimizing design and developing energy-saving buildings. Keywords with high connection strength to “performance” include “design”, “optimization”, “power system”, etc.
“Energy efficiency” is the keyword with the highest centrality, and its frequency is also ranked highly. It is especially important to improve building energy efficiency, as it can significantly contribute to carbon reduction efforts [64,65]. According to the International Energy Agency (IEA), the operational energy consumption of buildings accounts for 34% of global consumption. It is worth noting that building operations and construction account for over one-third of global energy-related emissions, and this does not even include other stages of the building life cycle. Therefore, energy plays a critical role in reducing carbon emissions in the construction industry. Besides “energy efficiency”, the top 20 energy-related keywords in terms of centrality include “energy”, “energy conservation”, and “energy saving”.
“Barrier” is the second keyword in centrality. Identifying barriers helps develop more reasonable and effective solutions, thereby promoting the development of this field. Therefore, studying the existing barriers in the field of carbon emissions in the construction industry has a significant impact. Existing research has indicated that the barriers in the field of carbon emissions in the construction industry include natural environmental effects, incomplete and uncoordinated policies, imperfect regulatory mechanisms, financial, time, and technological limitations, as well as negative social attitudes [66,67,68].
In addition, energy-saving and emission reduction retrofit and renovation of existing buildings [69,70,71], as well as low-carbon design and optimization of buildings [71,72], are highly influential topics in the field of carbon emissions in the construction industry. This corresponds to several keywords that rank high in centrality, such as “design”, “building stock”, “refurbishment”, “optimization”, and so on. “China” ranks ninth in terms of centrality. As mentioned earlier, China’s construction industry has the highest carbon emissions in the world. Moreover, China has increasingly attached importance to carbon emissions in the construction industry, actively formulating policies and increasing investment [73]. Thus, the frequency of “China” is also ranked highly. We have noticed that “concrete” also has a high impact. Concrete is widely used as a building material. The production of concrete-related materials, construction, and demolition of buildings produce a large number of emissions at various stages and contribute significantly to carbon emissions in the construction industry [55]. In the field of carbon emissions in the construction industry, the research on concrete mainly focuses on using waste or green materials to replace traditional fuels and raw materials, improving energy efficiency and carbon capture and storage [74,75,76]. These are also carbon reduction measures recommended by the IEA for the concrete industry. Among them, fuel and raw material replacement, energy efficiency improvement, and other related technologies have been matured, with lower implementation costs, and have been widely applied. Carbon capture and storage can significantly reduce carbon emissions, but there are still obstacles to the implementation of this technology, which has enormous research potential [76].
In summary, energy is the most studied and influential research field for carbon emissions in the construction industry, i.e., energy and carbon emissions are closely related. Improving energy efficiency and reducing energy consumption are important measures for reducing carbon emissions in the construction industry. Beyond energy efficiency, research on barriers is highly influential. There are several barriers to carbon emissions in the construction industry, and identifying and addressing them will drive global progress. In terms of assessment methods, LCA occupies an important position. In addition, performance, design, building stock, refurbishment, optimization, China, concrete, and other topics are widely studied or considered influential by scholars.
3.3. Research Trends and Frontiers over Time
3.3.1. Research Trends
Cluster analysis can provide active fields and trends of certain research areas in time series [22], and it can be used to extract important terms from the titles, keywords, or abstracts of publications as clustering labels. There are three algorithms for extracting terms: latent semantic index (LSI), logarithmic likelihood ratio (LLR), and mutual information (MI). The results obtained by LLR tend to be more satisfactory than the other two algorithms [22]. Therefore, this study uses the LLR algorithm to extract terms from keywords in articles as clustering labels.
Based on the network structure and clustering clarity, two metrics, Q value and S value, are commonly used in cluster analysis and are referred to as the modularity and silhouette, respectively. A Q value greater than 0.3 indicates a significant clustering structure, and the closer to 1, the better the clustering effect. An S value greater than 0.7 suggests that the clustering results are very reliable [22]. This study conducts clustering based on keyword co-occurrence networks. Filtering small clusters and displaying them as a time zone graph, the visualization is shown in Figure 5. The modularity Q value is 0.8621, and the weighted mean silhouette S value is 0.949, indicating a reliable clustering result. In Figure 5, the solid line in front of each cluster label represents the range of active years in the research field. For example, cluster #0 became an active field in 2001 and continued until 2023. Due to the incomplete literature statistics in 2023, the discussion on current research trends here is based on 2022.
Research on carbon emissions in the construction industry can be divided into 17 major clusters based on existing research interests. The serial number of a cluster is sorted based on the number of members it contains. Remarkably, the three largest clusters are “energy management”, “life cycle analysis”, and “energy”. These clusters have maintained their pre-eminence since the nascent stages of research on carbon emissions in the construction industry and continue to captivate the scholarly community’s attention. This is consistent with the previous analysis in this paper. There is a significant correlation between energy consumption and carbon emissions in the construction industry. The goal of energy management is to improve energy efficiency, mitigate climate change, etc. [77]. Life cycle analysis is an important method for assessing the impact of carbon emissions.
“Embodied carbon” is the third largest cluster and has remained active since 2005. Carbon emissions in the construction industry can be divided into operational carbon emissions and embodied carbon emissions [18]. Operating carbon emissions mainly include carbon emissions generated by the energy consumption of electrical appliances or other equipment operated during the use or operation phases of a building, such as space lighting, temperature regulation, etc. Carbon emissions related to material production, construction, maintenance, and demolition processes may be classified as embodied carbon emissions [18,78]. In the early stages of research on carbon emissions in the construction industry, scholars paid more attention to operational carbon emissions, as they believed that the relative share of carbon emissions from the operation of traditional buildings in the life cycle of buildings could reach or even exceed 80% [18]. With the progress in energy efficiency, building performance, and other related fields, the proportion of operating carbon emissions has decreased, while the proportion of embodied carbon emissions has increased [79]. The embodied energy of low-energy buildings may be equivalent to 40–60% of the entire life cycle energy [80]. Moreover, considering that the service life of buildings is short in many developing countries and regions, even the proportion of carbon emissions in the life cycle of ordinary buildings can reach 50% [81]. Therefore, research on embodied carbon is increasingly receiving attention from scholars. For example, Ref. [82] emphasizes the importance of research on embodied carbon emissions in the construction industry and reviews the research background, methods, and progress of embodied carbon. However, the results of this study suggest that although there has been some progress in assessing the embodied carbon of buildings, there are still barriers to reducing carbon emissions. The study of embodied carbon emissions is still an active research field.
In addition to the four largest research fields mentioned above, fields such as “building performance”, “passive house”, “uncertainty”, “carbon neutral”, “climate change”, “thermal energy storage”, “refurbishment”, and “economic growth” are also current research trends. Building performance is mainly reflected in energy efficiency, carbon dioxide emissions, and other indicators related to sustainability [83]. Passive house refers to a building that does not use traditional heating or cooling methods to achieve a comfortable indoor environment [84]. This type of building advocates minimizing the consumption of fossil fuels as much as possible by planning and designing the location, shape, enclosure structure, doors, and windows of buildings, utilizing natural methods such as solar energy and natural ventilation to maintain a comfortable indoor environment. Uncertainty refers to a lack of understanding of the facts. In the field of carbon emissions in the construction industry, uncertainty includes models, parameters, methods, future scenarios, etc. [78,82]. Carbon neutrality can be understood as carbon emissions equal to or less than carbon sink values, sometimes also known as net zero emissions. Executive Order EO 14057 of the US explicitly proposes to achieve carbon neutrality in the construction industry by 2045. The “European Green Agreement” sets out the goal of achieving carbon neutrality by 2050. China announced efforts to achieve carbon neutrality by 2060. Therefore, carbon neutrality research in the construction industry is not only a current research hotspot but will also be a key focus field in the future. The main paths to achieving carbon neutrality in the construction industry that existing research focuses on include reducing carbon emissions, waste recycling, and increasing carbon sinks [85,86]. Climate change is an important reason for global attention to carbon emissions. Thermal energy storage is a key path to reducing building energy consumption and achieving low-carbon development in the construction industry. Thermal energy storage technology mainly includes sensible energy storage, latent energy storage, and thermochemical storage. In recent years, latent energy storage using phase-change materials has become a research hotspot, especially for phase-change materials [87,88]. Refurbishment is an important measure for increasing the energy efficiency of existing buildings and reducing carbon emissions [68]. The research on carbon emissions in the construction industry inevitably has an impact on economic growth [89,90]. The relationship between economic growth and carbon emissions and the balance between economic growth and carbon emission reduction is the focus of scholars [90,91].
“Prefabrication”, “transportation”, “recycling”, and “machine learning” were once research hotspots, but now they have become neglected. This does not mean that they lack research value, and based on a review of existing research findings, these fields should receive renewed attention. Prefabricated buildings have the advantages of energy conservation, environmental protection, high construction efficiency, and easy-to-ensure construction quality. With the promotion of the concept of sustainable development and the advancement of building technology, prefabricated buildings have been favored by the industry and actively promoted globally [92,93,94]. A large number of scholars have researched the carbon emissions of prefabricated buildings and demonstrated that prefabricated buildings can reduce carbon emissions compared to traditional buildings [95,96]. However, there are obvious deficiencies in the existing research [93,94], which can be summarized as follows: (1) Limited research on the operation and demolition stages of buildings; (2) Insufficient diversification of building types and structural forms, limited to low-rise residential; (3) A lack of transparency of information in the existing research; (4) A lack of evaluation of the effect of carbon emission measures. It is regrettable that the field of prefabrication has been overlooked by scholars at present. The transition within and between stages of the building life cycle involves a significant amount of transportation-related carbon emissions, which should be considered in carbon emission assessments [18,82]. Recycling is one of the most effective measures of reducing carbon emissions in the construction industry [18]. Predicting carbon emissions and determining the influencing factors of carbon emissions are beneficial for formulating policies and taking targeted measures. Many studies have shown that machine learning is a reliable tool for achieving the above goals [97,98]. Fields such as prefabrication, transportation, recycling, and machine learning were overlooked in 2022, but they still have research potential.
3.3.2. Research Frontiers
Identifying keywords frequently cited in the field of carbon emissions in the construction industry research during a specific period can reflect research frontiers [99]. Figure 6 shows the top 30 burst terms. The blue line in the figure represents the year range, while the red line represents the duration of the burst keyword.
From 1997 to 2013, “greenhouse gas”, “energy”, “climate change”, “carbon dioxide”, and “emission” were the research hotspots of the construction industry. In the early days, scholars and practitioners mainly focused on top-level design. These studies focus on the possible social and environmental impacts of carbon emissions in the construction industry, policy and planning recommendations, and how to control carbon emissions in the construction industry. Ref. [100] shows that practitioners have a lower willingness to voluntarily improve traditional construction methods, although these processes may generate significant carbon emissions. In addition, financial incentives can have a significant positive impact on the development of green buildings. Ref. [101] points out that the construction industry is the most important energy-saving field. This study introduces China’s energy conservation policies from 2006 to 2010 and analyzes the trend of future energy consumption in the construction industry. Ref. [102] evaluates the life cycle greenhouse gas emissions of a residential area and suggests that carbon reduction targets should be set during the construction and operation stages of buildings to mitigate climate change. In addition, scholars are mainly focused on carbon dioxide emissions. In the early stages of research on carbon emissions in the construction industry, researchers and practitioners pay more attention to the most important greenhouse gas, rather than to all.
During the period from 2007 to 2018, researchers gradually refined their research on carbon emissions in the construction industry, and the research topics presented multiple developments. Researchers had a broader focus on greenhouse gases, and methane and nitrous oxide became research hotspots. Methane is the second largest greenhouse gas [103,104], and its global warming potential exceeds that of carbon dioxide by 28 times [105]. The global warming potential of nitrous oxide on a 100-year time scale is 298 times that of carbon dioxide [106]. Therefore, in addition to carbon dioxide, understanding, quantifying, and managing methane and nitrous oxide are indispensable. Life cycle inventory (LCI) research stands out in terms of tools and methods for assessing carbon emissions. LCI is a tool for compiling resource consumption (input) and emissions (output) of products during their life cycle and is also an important component of LCA research [107]. In addition to studying how to reduce carbon emissions, research on carbon sequestration has also gradually attracted attention. Reducing carbon emissions by itself is insufficient to mitigate the climate impact, and it is necessary to consider carbon sequestration [108], especially for the construction industry and its high energy consumption. Patware et al. [109] summarized the direct and indirect methods of carbon sequestration. At present, the construction industry mainly focuses on indirect technology, which utilizes ecosystems to absorb and store carbon. This is a win-win or multi-win strategy. For example, soil carbon sequestration can not only improve soil quality but also offset carbon emissions generated by energy consumption [110].
Since 2019, research on carbon emission in the construction industry has been further deepened, focusing on the impact of more potential factors. The driving force has gradually become a hot topic, which has important theoretical and practical significance for the research of carbon emissions in the construction industry. According to existing research, factors or driving forces such as social systems, changes in values, macro policy regulation, industrial structure adjustment, technological progress, economic change cycles, and energy price fluctuations can all affect carbon emissions [111,112]. The focus on driving forces proves that researchers have begun to pay more attention to various specific factors that affect carbon emissions in the construction industry in order to find reliable solutions. A study has pointed out that among the many factors affecting carbon emissions, the relationship between carbon emissions and economic development has been given more attention [113], which is consistent with the results of this paper. Circular economy, investment, and economic analysis have become research hotspots for industry scholars in the field of carbon emissions in the construction industry [114,115]. As a scientific economic development model, circular economy has achieved decoupling between economic development, resource utilization, and environmental impact [116], which is of great value for achieving the carbon neutrality goal of the construction industry. Circular economy advocates for the conservation and intensive use of resources and promotes the recycling of waste resources [117], which can effectively improve the resource output rate of the construction industry, produce more products or value with less resource investment, and significantly reduce carbon emissions. Research has shown that implementing a circular economy can reduce carbon emissions from key industrial materials such as cement, steel, and aluminum globally by 40% by 2050 [118]. Households, renovations, and waste management have received widespread attention, and the projects considered in the field of carbon emissions in the construction industry are further comprehensive and refined. Household emissions, building renovation, and waste management are important areas that are easily overlooked in the early stages of carbon emissions in the construction industry research. Household emissions are a huge source of carbon emissions [119]. For example, heating and electricity are often factored into the carbon footprint of a building during its operation. Building renovation is not only a source of embodied carbon emissions in buildings but also an important measure to reduce carbon emissions during the operation phase of existing buildings [120,121]. Construction waste is the main source of global social and environmental solid waste, accounting for 20–60% [122]. The traditional ways of dealing with waste are landfills and incineration, which will generate a large amount of carbon emissions. Studies have pointed out that properly managed construction waste can be recycled as an important resource for alternative materials and reduce carbon emissions [82]. Therefore, studying the field of waste management in the construction industry is very valuable. Ref. [123] assesses the waste generated by newly built buildings in Shanghai. Building waste management can significantly reduce carbon emissions. Ref. [124] utilized BIM and Network Map Service (WMS) technology to construct an information-based waste management system, providing novel ideas for optimizing waste management.
3.4. Scientific Collaboration Networks
Scientific collaboration networks contribute to the acquisition of professional knowledge and financial support, while also improving productivity [125]. The analysis of co-authorship networks using scientometric analysis methods can almost comprehensively examine scientific cooperation [126].
3.4.1. Institution Co-Authorship Analysis
Analyzing the scientific collaboration networks between institutions that invest resources in studying carbon emissions in the construction industry research makes it easier to investigate partnerships and formulate policies [125]. The visualization results obtained by conducting institute co-authorship analysis on the dataset are illustrated in Figure 7, and the top ten institutions for frequency and centrality are shown in Table 3.
In Figure 7, each node represents an institution. Institutions containing 45 or more publications are labeled, and 35 institutions are eligible. It can be found that the distribution of nodes is relatively scattered, indicating that the connections between institutions are limited. In particular, the connections between large nodes are weaker, indicating a lack of cooperation between the institutions with the highest number of published articles. This is a surprising discovery. Publications with collaborative research are more likely to have a higher impact. Moreover, in the scientific collaboration networks of specific research fields, a lack of cooperation is considered a manifestation of weak research productivity [127].
According to the distribution and connectivity of existing institutional collaboration network nodes, they can be roughly divided into three sub-networks, distinguished from each other by black dashed lines. The connections between nodes within each sub-network are tight, while the connections between sub-networks are weak. The bottom left corner is the largest sub-network, which contains the most nodes. Among them, institutions with significant influence include Chongqing University and the University of Colorado. Chongqing University has established close cooperation with institutions such as Harbin Institute of Technology, Hebei University of Technology, Curtin University, Lawrence Berkeley National Laboratory, and others. There is a close relationship between the University of Colorado and the Norwegian University of Science and Technology, as well as the University of California, Berkeley. This sub-network includes many research institutions in East Asia, North America, Europe, and Australia. In sub-network 2, several institutions are closely connected, such as the Chinese Academy of Sciences, Peking University, University of the Chinese Academy of Sciences, Tongji University, China University of Geosciences, Beijing University of Technology, Beijing Normal University, North China Electric Power University, and so on. These institutions all come from China and lack communication and cooperation worldwide. In sub-network 3, closely connected institutions include Shanghai Jiao Tong University, National University of Singapore, MIT, the University of British Columbia, and others. It is worth noting that institutions such as Tsinghua University, the University of Cambridge, and Zhejiang University have also published a large number of journals with high influence. However, they lack cooperation with other highly productive institutions.
Among the top ten institutions that publish journals, there are nine universities and one academic institution, i.e., the Chinese Academy of Sciences. The top ten institutions in terms of influence are all universities. Universities have contributed a key force in the research on carbon emissions in the construction industry. In addition, seven of the top ten institutions that publish articles come from China, while only three Chinese universities, including China University of Geosciences, University of the Chinese Academy of Sciences, and Fudan University, rank in the top ten in terms of influence. This indicates that many institutions in China have invested a large amount of resources in the field of carbon emissions in the construction industry and have achieved certain results. Although some institutions have an advantage in the number of publications, their influence needs to be improved. This also indicates that there is not a strict positive correlation between influence and the number of publications. Institutions with a high number of publications and influence are the University of the Chinese Academy of Sciences and the University of Cambridge.
3.4.2. Country Co-Authorship Analysis
The visualization results obtained from the country co-authorship network analysis of the dataset are shown in Figure 8. It showcases the exchange and cooperation of carbon emissions in the construction industry research among countries. The top ten countries in terms of published articles and influence are organized as shown in Table 4.
Countries with more than 150 published articles are labeled, and a total of 20 nodes meet the requirements. The labeled nodes are very scattered in the network, indicating that there is a lack of cooperation among major countries in the field of carbon emissions in the construction industry. The two largest nodes are China and the United States, indicating that they have the highest number of published articles. Moreover, the node representing China has an obvious purple band, denoting a high centrality and high influence. However, they have only a weak connection with other annotated nodes, i.e., they lack cooperation with other countries that publish more publications. This does not mean that they have no communication and cooperation with other countries at all, as a large number of line segments can be found radiating from these two nodes. This suggests that they have cooperative relationships with many countries, but the number of articles published by these countries is too small to appear as a node in the Figure. The other three countries in the top five in terms of the number of publications are England, Germany, and Canada, where a similar situation is also present. Countries with strong cooperative relationships that can be observed are Australia and Malaysia, Italy and Switzerland, and Brazil and Sweden.
Among the 20 countries marked in the network, developing countries account for only 20%. China and India are the only two developing countries among the top 10 publishing countries. In terms of centrality, only China is among the top ten. This indicates that developed countries and developing countries with better economic development have invested more attention and resources in the field of carbon emission in the construction industry. They have more resources to invest in the field of carbon emissions in the construction industry, including funding and technology.
The US and China have significantly higher numbers of articles in the field of carbon emissions in the construction industry than other countries. This is consistent with the fact that China and the US have been the top two contributors of WoS-SCI indexed papers for many years, and China has surpassed the US to become the top contributor [128]. More importantly, they are the two largest carbon emitters in the world, and both countries are vigorously promoting research on carbon emissions in the construction industry. Both governments have proposed emission reduction goals and plans for the construction industry, and have successively introduced a series of policy tools to ensure the achievement of these goals. According to the definition of policy tools proposed by McDonnell and Elmore [129], the policy tools adopted by the two countries for carbon emissions in the construction industry research include at least three categories, i.e., mandatory command type, short-term incentive type, and capacity building type.
Generally, mandatory command type refers to relevant policies and documents issued by the country or industry that require researchers to pay attention to the field of carbon emissions in the construction industry. At the national policy and planning level, the US government has proposed the “Nationally Determined Contribution” (NDC), which clearly outlines decarbonization strategies related to construction. In addition, the US government has established goals and strategies for achieving net zero emissions from buildings by 2045 through Executive Order 14057 and the Federal Sustainable Development Plan. The Chinese government has issued a notice on the “Action Plan for Carbon Peak before 2030”, an implementation plan for carbon peak in urban and rural construction, and a development plan for building energy conservation and green buildings during the 14th Five-Year Plan period. At the level of industry standards and regulations, the current relevant regulations and standards in the US include “2024 International Energy Conservation Code”, “2021 International Residential Code”, and “Standard 189.1” [130]. China has issued documents such as the “General Specification for Building Energy Conservation and Renewable Energy Utilization”, the “Evaluation Standard for Ultra Low Energy Buildings”, and the “Guidelines for Passive Design of Green Buildings”.
Short-term incentive type refers to material and spiritual rewards given to individuals, teams, or institutions. These include the Tien-yow Jeme Civil Engineering Prize, the China Construction Engineering Luban Prize, the Green Building Innovation Award, and various awards established and awarded by the American Society of Civil Engineers. Capacity building type expects to receive returns in the future and can play a long-term incentive role. This includes government funding for research projects or setting up laboratories and research institutes to carry out long-term research on specific topics. The US and China have established the National Natural Science Foundation (NSFC) and the National Science Foundation (NSF), as well as various other scientific funding institutions, to support key scientific research projects. Research organizations such as the New Building Institute (NBI) and the International Ecological Future Research Institute (ILFI) were founded in the United States. China has established the Green Building Research Center of the China Urban Science Research Association and the National Key Laboratory of Green Building. Moreover, most laboratories and research institutes do not operate independently. They can collaborate with other research institutions such as universities to further improve national research.
In conclusion, there is a general lack of cooperation among important countries engaged in research on carbon emissions in the construction industry, and the participation of developing countries is significantly lower than that of developed countries. Additionally, China and the US have enormous carbon reduction potential, and with the support of policy tools, they have the richest research results in the field of carbon emissions in the construction industry.
4. Discussion and Recommendations
4.1. Discussion
The articles published in the field of carbon emissions in the construction industry began in the late 1990s. In the early days of this research, the number of articles published each year slowly increased and remained in the double digits. In 2007, the annual number of articles published reached 116. Afterward, the number of articles published each year maintained rapid growth. This proves the sustained growth of global interest in carbon emissions in the construction industry. However, through scientometric analysis of a large number of articles, it was found that the knowledge system of carbon emission in the construction industry still has obvious limitations, especially when certain important topics are ignored.
The existing research focuses on housing construction, while infrastructure such as roads and bridges are neglected. There are significant differences in the construction, operation, maintenance, and demolition processes of infrastructure and housing buildings, so carbon emission assessment methods and carbon reduction measures cannot be simply analogized. Therefore, it is necessary to conduct a specific assessment of infrastructure carbon emissions and propose targeted carbon reduction measures. In addition, it is also necessary to study the mechanism of the impact of infrastructure on carbon emissions. For example, transportation infrastructure can improve transportation between regions and promote the flow of people and goods, thereby reducing energy consumption, promoting technology dissemination and innovation, and ultimately affecting carbon emissions [131]. Therefore, studying the impact of infrastructure construction on carbon emissions is of great significance for formulating scientific and effective carbon reduction policies.
Research on building materials has focused on concrete or cement, while other carbon-intensive building materials such as steel and aluminum have been overlooked. The manufacturing, transportation, and other processes of building materials generate a large amount of carbon emissions. For example, the carbon emissions generated by the manufacturing process of concrete and steel may exceed 40% of the carbon emissions of a building’s life cycle [132]. Concrete, steel, aluminum, glass, and other carbon-intensive materials are widely used in the construction industry [133]. To control carbon emissions in the construction industry, it is necessary to reduce their carbon emissions or their usage, such as improving energy efficiency in production processes or finding alternative materials. To control carbon emissions in the construction industry, it is not enough to focus on concrete.
Modern information technology, such as BIM technology, has not been fully applied in the field of carbon emissions in the construction industry. With the development of science and technology, scholars and practitioners are increasingly interested in the application of information technology in the sustainable development of the construction industry, especially BIM technology [57]. BIM can achieve digital representation and information sharing of physical and functional features of building objects, providing a reference basis for all decisions throughout the entire life cycle of buildings [134]. Moreover, BIM can integrate various modern technologies, such as the Internet of Things (IoT), Big Data, and Artificial Intelligence (AI), making it even more powerful. Therefore, BIM has important application value in the field of carbon emissions in the construction industry, and more and more scholars are calling for research on the impact and application of BIM technology in this field [135].
4.2. Recommendations
Analyzing important research topics that are absent can provide reference for scholars. Identifying the problems with carbon emissions in the construction industry and providing reliable recommendations for decision-makers and practitioners is also an important goal of this study. Through reflecting on and reviewing the existing literature, to address the problems faced by the construction industry in the field of carbon emissions, the following suggestions are proposed.
- (1)
- Strengthen top-level designs and improve policy systems, management systems, and guarantee mechanisms. Specifically, this includes formulating policies, regulations, and standards that are tailored to local conditions, and clarifying work objectives and measures. At the same time, strengthen the construction of management and execution capabilities, and improve the quality and efficiency of execution. Actively promote the labeling system for building energy efficiency. Building energy efficiency labeling can make building energy consumption information more transparent and provide incentives for improving energy efficiency in the construction industry. By providing appropriate policy guidance and actively conducting policy lectures and educational training, increase the participation and willingness of construction-related enterprises, institutions, and individuals in conducting practical and research activities.
- (2)
- Adhere to technological innovation. Technological innovation is the primary driving force for solving the problem of carbon emissions in the construction industry. The development and maturity of new technologies can reduce the cost of implementing carbon reduction plans, and even lead to the emergence of new and more efficient solutions. For example, breakthroughs in fields such as clean energy technology and carbon capture and storage technology will have a significant impact on the field of carbon emissions.
- (3)
- Pay attention to all aspects of the whole life cycle of the building. In the materials production stage, improve the energy efficiency of the materials production process, and use low-carbon environmental protection materials or raw materials instead of traditional materials. In the construction phase, promote the use of low-energy construction machinery and equipment, and utilize information technology for low-carbon production management. For example, by inputting data such as equipment configurations, construction progress, and personnel information into a database for overall management, it is possible to optimize the allocation of personnel, machines, raw materials, methods, and environmental factors, ultimately achieving high efficiency, low energy consumption, and low emissions. At the same time, it can also accelerate the progress of the project. During the operational phase, improve the electrification level in the fields of building heating, cooling, and living consumption, and minimize fossil fuel consumption as much as possible. Moreover, encourage people to use energy-efficient appliances. At the stage of maintenance and demolition, improve the recycling rate of construction waste. For example, promote the recycling and utilization of construction waste resources from aspects such as classification, recycling, regeneration, resource utilization, and product application.
- (4)
- Strengthen cooperation. Active cooperation between enterprises, research institutions, and countries is crucial. Climate change is a global challenge, and cooperation brings together stakeholders to address this challenge and contribute to the global carbon reduction goals of the construction industry. Carbon reduction in the construction industry is not only related to the construction industry itself but also to the entire supply chain. Enterprise cooperation can promote carbon reduction measures in all aspects of the supply chain, achieving overall low-carbon development. In addition, cooperation between enterprises and countries is conducive to fully leveraging their respective technological, management, and financial advantages. Collaboration between research institutions can facilitate the exchange of technology and knowledge, thereby accelerating technological innovation and transformation.
5. Conclusions
With global attention on climate change and other related environmental issues, more and more researchers and practitioners are focusing on carbon emissions in the construction industry. This study uses a scientific mapping method to review the articles in the field of carbon emissions in the construction industry, in order to identify and explore the current research status, trends, and frontiers in the field. A total of 13,507 articles from 1985 to 2023 were retrieved from the WoSCC database as the dataset for this study. The main conclusions are as follows:
- (1)
- Researchers and practitioners have paid much attention to carbon emissions in the construction industry in recent years. From 1997 to 2006, the number of articles published annually was below 100 and the growth was slow. Since 2007, the annual publication of articles has maintained a rapid growth. In 2022, the number of articles published reached 2265.
- (2)
- The research on carbon emissions in the construction industry has a clear interdisciplinary phenomenon. This field is not only closely related to the environment and economy but also has a significant impact on the lives of animals and humans, as well as social development. Research carrier analysis is expected to guide researchers and practitioners in finding suitable journals for learning and publishing. In terms of research interests, energy is the most relevant topic. In addition, “carbon emission”, “life cycle assessment”, and “performance” are the three keywords that have received the most attention in existing research. “Energy efficiency”, “barrier”, “China”, “concrete”, “design”, “building stock”, “refurbishment”, and “optimization” are highly influential topics.
- (3)
- The existing research topics can be identified as 17 clusters, with the largest five clusters corresponding to “energy management”, “life cycle analysis”, “energy”, “embodied carbon”, and “building performance”. Other hot research trends include “passive house”, “uncertainty”, “carbon neutral”, “climate change”, “thermal energy storage”, “refurbishment”, and “economic growth”. The fields of “prefabrication”, “transportation”, “recycling”, and “machine learning” have been briefly overlooked, but they still have high research potential. In addition, the research frontiers analysis results indicate that scholars and practitioners pay more attention to the impact of potential factors, and the research topic continues to deepen. “Driving force”, “circular economy”, “household”, “waste management”, and “circular economy” are currently research frontiers.
- (4)
- The analysis of the scientific collaboration networks has identified institutions and countries with a high number of publications or high influence, as well as the connections between institutions and countries, thus providing a reference for seeking communication and cooperation. In the field of carbon emissions in the construction industry, the connections between institutions with high publications or high influence and between countries are limited. It is recommended to further strengthen cooperation. In addition, China and the United States have published the most articles through a series of policy tools.
Valuable results were obtained in this study, which can help researchers and practitioners understand the knowledge system, research trends, frontiers, and scientific cooperation of the field of carbon emissions in the construction industry. In addition, based on the review of existing research, we propose several targeted suggestions that can motivate researchers and practitioners to participate in scientific research and practice in this field, and to promote the global progress of the field of carbon emissions in the construction industry. However, this study still has several limitations. The dataset was collected from the WoSCC and may be affected by the coverage of WoSCC. Additionally, the dataset only includes English articles. Therefore, the research results may not take into account all publications in the field of carbon emissions in the construction industry. Future research can extract broader data to address the limitations of this study.
Author Contributions
Q.L., D.Y., L.C. and D.L.: conceptualization, investigation, methodology, investigation, data curation, writing—original draft, writing—review and editing, formal analysis; Q.L. and L.H.: supervision, resources, project administration, funding acquisition writing—original draft, writing—review and editing, visualization; K.C. and F.Y.: writing—original draft, writing—review and editing. Q.L., D.Y., L.C. and D.L. led to writing the article with equal contributions. All authors have read and agreed to the published version of the manuscript.
Funding
This research received no external funding.
Data Availability Statement
Not applicable.
Acknowledgments
Qiming Luo would like to express to all the authors for their contribution to this article, to the reviewers for their positive comments, and to the publisher for their support and cooperation.
Conflicts of Interest
Authors Qiming Luo, Kang Cheng and Fan Yang were employed by the company China Railway 11th Bureau Group Corporation Limited. The remaining authors declare that the research was conducted in the absence of any commercial or financial relationships that could be construed as a potential conflict of interest.
References
- Jakucionyte-Skodiene, M.; Liobikiene, G. Climate change concern, personal responsibility and actions related to climate change mitigation in EU countries: Cross-cultural analysis. J. Clean. Prod. 2021, 281, 125189. [Google Scholar] [CrossRef]
- Chen, L.; Msigwa, G.; Yang, M.; Osman, A.I.; Fawzy, S.; Rooney, D.W.; Yap, P.-S. Strategies to achieve a carbon neutral society: A review. Environ. Chem. Lett. 2022, 20, 2277–2310. [Google Scholar] [CrossRef] [PubMed]
- Mihiretu, A.; Okoyo, E.N.; Lemma, T. Causes, indicators and impacts of climate change: Understanding the public discourse in Goat based agro-pastoral livelihood zone, Ethiopia. Heliyon 2021, 7, e06529. [Google Scholar] [CrossRef] [PubMed]
- Akerlof, K.; Maibach, E.W.; Fitzgerald, D.; Cedeno, A.Y.; Neuman, A. Do people “personally experience” global warming, and if so how, and does it matter? Glob. Environ. Chang.-Hum. Policy Dimens. 2013, 23, 81–91. [Google Scholar] [CrossRef]
- Sisodiya, S.M.; Fowler, H.J.; Lake, I.; Nanji, R.O.; Gawel, K.; Esguerra, C.; Newton, C.; Foley, A. Climate change and epilepsy: Time to take action. Epilepsia Open 2019, 4, 524–536. [Google Scholar] [CrossRef] [PubMed]
- Chen, L.; Huang, L.; Hua, J.; Chen, Z.; Wei, L.; Osman, A.I.; Fawzy, S.; Rooney, D.W.; Dong, L.; Yap, P.-S. Green construction for low-carbon cities: A review. Environ. Chem. Lett. 2023, 21, 1627–1657. [Google Scholar] [CrossRef]
- World Meteorological Organization. State of the Global Climate 2022 (WMO-No. 1316); WMO: Geneva, Switzerland, 2023. [Google Scholar]
- Pokhrel, S.R.; Hewage, K.; Chhipi-Shrestha, G.; Karunathilake, H.; Li, E.; Sadiq, R. Carbon capturing for emissions reduction at building level: A market assessment from a building management perspective. J. Clean. Prod. 2021, 294, 126323. [Google Scholar] [CrossRef]
- Robati, M.; Oldfield, P.; Nezhad, A.A.; Carmichael, D.G.; Kuru, A. Carbon value engineering: A framework for integrating embodied carbon and cost reduction strategies in building design. Build. Environ. 2021, 192, 107620. [Google Scholar] [CrossRef]
- Chen, L.; Hu, Y.; Wang, R.; Li, X.; Chen, Z.; Hua, J.; Osman, A.I.; Farghali, M.; Huang, L.; Li, J.; et al. Green building practices to integrate renewable energy in the construction sector: A review. Environ. Chem. Lett. 2023, 22, 751–784. [Google Scholar] [CrossRef]
- UN Environment Programme. 2022 Global Status Report for Buildings and Construction: Towards a Zero Emission; Efficient and Resilient Buildings and Construction Sector; UN Environment Programme: Nairobi, Kenya, 2022. [Google Scholar]
- Chen, L.; Zhang, Y.; Chen, Z.; Dong, Y.; Jiang, Y.; Hua, J.; Liu, Y.; Osman, A.I.; Farghali, M.; Huang, L.; et al. Biomaterials technology and policies in the building sector: A review. Environ. Chem. Lett. 2024, 22, 715–750. [Google Scholar] [CrossRef]
- Chen, L.; Chen, Z.; Liu, Y.; Lichtfouse, E.; Jiang, Y.; Hua, J.; Osman, A.I.; Farghali, M.; Huang, L.; Zhang, Y.; et al. Benefits and limitations of recycled water systems in the building sector: A review. Environ. Chem. Lett. 2024, 22, 785–814. [Google Scholar] [CrossRef]
- Chen, L.; Chen, Z.; Xie, Z.; Wei, L.; Hua, J.; Huang, L.; Yap, P.-S. Recent developments on natural fiber concrete: A review of properties, sustainability, applications, barriers, and opportunities. Dev. Built Environ. 2023, 16, 100255. [Google Scholar] [CrossRef]
- Hosseini, M.R.; Martek, I.; Zavadskas, E.K.; Aibinu, A.A.; Arashpour, M.; Chileshe, N. Critical evaluation of off-site construction research: A Scientometric analysis. Autom. Constr. 2018, 87, 235–247. [Google Scholar] [CrossRef]
- Darko, A.; Chan, A.P.C.; Huo, X.; Owusu-Manu, D.-G. A scientometric analysis and visualization of global green building research. Build. Environ. 2019, 149, 501–511. [Google Scholar] [CrossRef]
- Fenner, A.E.; Kibert, C.J.; Woo, J.; Morque, S.; Razkenari, M.; Hakim, H.; Lu, X. The carbon footprint of buildings: A review of methodologies and applications. Renew. Sustain. Energy Rev. 2018, 94, 1142–1152. [Google Scholar] [CrossRef]
- Akbarnezhad, A.; Xiao, J. Estimation and Minimization of Embodied Carbon of Buildings: A Review. Buildings 2017, 7, 5. [Google Scholar] [CrossRef]
- Lu, M.; Lai, J. Review on carbon emissions of commercial buildings. Renew. Sustain. Energy Rev. 2020, 119, 109545. [Google Scholar] [CrossRef]
- Gao, Z.; Liu, H.; Xu, X.; Xiahou, X.; Cui, P.; Mao, P. Research Progress on Carbon Emissions of Public Buildings: A Visual Analysis and Review. Buildings 2023, 13, 677. [Google Scholar] [CrossRef]
- Cobo, M.J.; Lopez-Herrera, A.G.; Herrera-Viedma, E.; Herrera, F. Science Mapping Software Tools: Review, Analysis, and Cooperative Study Among Tools. J. Am. Soc. Inf. Sci. Technol. 2011, 62, 1382–1402. [Google Scholar] [CrossRef]
- Chen, C. CiteSpace: A Practical Guide for Mapping Scientific Literature; Nova Science Publishers: Hauppauge, NY, USA, 2016. [Google Scholar]
- Zheng, C.; Yuan, J.; Zhu, L.; Zhang, Y.; Shao, Q. From digital to sustainable: A scientometric review of smart city literature between 1990 and 2019. J. Clean. Prod. 2020, 258, 120689. [Google Scholar] [CrossRef]
- Chen, C. Science Mapping: A Systematic Review of the Literature. J. Data Inf. Sci. 2017, 2, 1–40. [Google Scholar] [CrossRef]
- Webster, J.; Watson, R.T. Analyzing the Past to Prepare for the Future: Writing a Literature Review. MIS Q. 2002, 26, xiii–xxiii. [Google Scholar]
- Öztürk, O.; Kocaman, R.; Kanbach, D.K. How to design bibliometric research: An overview and a framework proposal. Rev. Manag. Sci. 2024. [Google Scholar] [CrossRef]
- Martín-Martín, A.; Thelwall, M.; Orduna-Malea, E.; Delgado López-Cózar, E. Google Scholar, Microsoft Academic, Scopus, Dimensions, Web of Science, and OpenCitations’ COCI: A multidisciplinary comparison of coverage via citations. Scientometrics 2021, 126, 871–906. [Google Scholar] [CrossRef] [PubMed]
- Levine-Clark, M.; Gil, E.L. A new comparative citation analysis: Google Scholar, Microsoft Academic, Scopus, and Web of Science. J. Bus. Financ. Librariansh. 2021, 26, 145–163. [Google Scholar] [CrossRef]
- Delgado López-Cózar, E.; Orduña-Malea, E.; Martín-Martín, A. Google Scholar as a Data Source for Research Assessment. In Springer Handbook of Science and Technology Indicators; Glänzel, W., Moed, H.F., Schmoch, U., Thelwall, M., Eds.; Springer International Publishing: Cham, Switzerland, 2019; pp. 95–127. [Google Scholar]
- Birkle, C.; Pendlebury, D.A.; Schnell, J.; Adams, J. Web of Science as a data source for research on scientific and scholarly activity. Quant. Sci. Stud. 2020, 1, 363–376. [Google Scholar] [CrossRef]
- Zhu, J.; Liu, W. A tale of two databases: The use of Web of Science and Scopus in academic papers. Scientometrics 2020, 123, 321–335. [Google Scholar] [CrossRef]
- Li, K.; Rollins, J.; Yan, E. Web of Science use in published research and review papers 1997–2017: A selective, dynamic, cross-domain, content-based analysis. Scientometrics 2018, 115, 1–20. [Google Scholar] [CrossRef]
- Darko, A.; Chan, A.P.C. Critical analysis of green building research trend in construction journals. Habitat Int. 2016, 57, 53–63. [Google Scholar] [CrossRef]
- Darko, A.; Chan, A.P.C.; Adabre, M.A.; Edwards, D.J.; Hosseini, M.R.; Ameyaw, E.E. Artificial intelligence in the AEC industry: Scientometric analysis and visualization of research activities. Autom. Constr. 2020, 112, 103081. [Google Scholar] [CrossRef]
- Li, Q.; Long, R.; Chen, H.; Chen, F.; Wang, J. Visualized analysis of global green buildings: Development, barriers and future directions. J. Clean. Prod. 2020, 245, 118775. [Google Scholar] [CrossRef]
- Zheng, X.; Le, Y.; Chan, A.P.C.; Hu, Y.; Li, Y. Review of the application of social network analysis (SNA) in construction project management research. Int. J. Proj. Manag. 2016, 34, 1214–1225. [Google Scholar] [CrossRef]
- Yi, W.; Chan, A.P.C. Critical review of labor productivity research in construction journals. J. Manag. Eng. 2014, 30, 214–225. [Google Scholar] [CrossRef]
- Egghe, L. Theory and practise of the g-index. Scientometrics 2006, 69, 131–152. [Google Scholar] [CrossRef]
- Chen, C.; Morris, S. Visualizing evolving networks: Minimum spanning trees versus Pathfinder networks. In Proceedings of the IEEE Symposium on Information Visualization, INFO VIS, Seattle, WA, USA, 19–21 October 2003; pp. 67–74. [Google Scholar]
- Gunter, W.D.; Gentzis, T.; Rottenfusser, B.A.; Richardson, R.J.H. Deep coalbed methane in Alberta, Canada: A fuel resource with the potential of zero greenhouse gas emissions. Energy Convers. Manag. 1997, 38, S217–S222. [Google Scholar] [CrossRef]
- Liu, W. Caveats for the use of Web of Science Core Collection in old literature retrieval and historical bibliometric analysis. Technol. Forecast. Soc. Chang. 2021, 172, 121023. [Google Scholar] [CrossRef]
- Breidenich, C.; Magraw, D.; Rowley, A.; Rubin, J.W. The Kyoto Protocol to the United Nations Framework Convention on Climate Change. Am. J. Int. Law 1998, 92, 315–331. [Google Scholar] [CrossRef]
- Liu, W.; Ni, R.; Hu, G. Web of Science Core Collection’s coverage expansion: The forgotten Arts & Humanities Citation Index? Scientometrics 2024, 129, 933–955. [Google Scholar] [CrossRef]
- Ott, H.E.; Sterk, W.; Watanabe, R. The Bali roadmap: New horizons for global climate policy. Clim. Policy 2008, 8, 91–95. [Google Scholar] [CrossRef]
- Mathews, J. Seven steps to curb global warming. Energy Policy 2007, 35, 4247–4259. [Google Scholar] [CrossRef]
- Chen, C.; Leydesdorff, L. Patterns of connections and movements in dual-map overlays: A new method of publication portfolio analysis. J. Assoc. Inf. Sci. Technol. 2014, 65, 334–351. [Google Scholar] [CrossRef]
- Su, H.-N.; Lee, P.-C. Mapping knowledge structure by keyword co-occurrence: A first look at journal papers in Technology Foresight. Scientometrics 2010, 85, 65–79. [Google Scholar] [CrossRef]
- Chen, C. How to Use CiteSpace; Leanpub. 2020. Available online: http://leanpub.com/howtousecitespace (accessed on 16 April 2024).
- Freeman, L.C. Centrality in social networks conceptual clarification. Soc. Netw. 1978, 1, 215–239. [Google Scholar] [CrossRef]
- Shrivastava, R.; Mahajan, P. Artificial Intelligence Research in India: A Scientometric Analysis. Sci. Technol. Libr. 2016, 35, 136–151. [Google Scholar] [CrossRef]
- van Eck, N.J.; Waltman, L. Visualizing Bibliometric Networks. In Measuring Scholarly Impact: Methods and Practice; Ding, Y., Rousseau, R., Wolfram, D., Eds.; Springer International Publishing: Cham, Switzerland, 2014; pp. 285–320. [Google Scholar]
- Röck, M.; Saade, M.R.M.; Balouktsi, M.; Rasmussen, F.N.; Birgisdottir, H.; Frischknecht, R.; Habert, G.; Lützkendorf, T.; Passer, A. Embodied GHG emissions of buildings–The hidden challenge for effective climate change mitigation. Appl. Energy 2020, 258, 114107. [Google Scholar] [CrossRef]
- Yang, L.; Yan, H.; Lam, J.C. Thermal comfort and building energy consumption implications—A review. Appl. Energy 2014, 115, 164–173. [Google Scholar] [CrossRef]
- Huang, L.; Krigsvoll, G.; Johansen, F.; Liu, Y.; Zhang, X. Carbon emission of global construction sector. Renew. Sustain. Energy Rev. 2018, 81, 1906–1916. [Google Scholar] [CrossRef]
- Abd Rashid, A.F.; Yusoff, S. A review of life cycle assessment method for building industry. Renew. Sustain. Energy Rev. 2015, 45, 244–248. [Google Scholar] [CrossRef]
- Joseph, V.R.; Mustaffa, N.K. Carbon emissions management in construction operations: A systematic review. Eng. Constr. Archit. Manag. 2023, 30, 1271–1299. [Google Scholar] [CrossRef]
- Gan, J.; Li, K.; Li, X.; Mok, E.; Ho, P.; Law, J.; Lau, J.; Kwok, R.; Yau, R. Parametric BIM-Based Lifecycle Performance Prediction and Optimisation for Residential Buildings Using Alternative Materials and Designs. Buildings 2023, 13, 904. [Google Scholar] [CrossRef]
- Zhang, N.; Zhou, P.; Choi, Y. Energy efficiency, CO2 emission performance and technology gaps in fossil fuel electricity generation in Korea: A meta-frontier non-radial directional distance functionanalysis. Energy Policy 2013, 56, 653–662. [Google Scholar] [CrossRef]
- Xu, P.P.; Chan, E.H.W. Toward Low Carbon Buildings: Sustainable Building Energy Efficiency Retrofit (beer) Under Energy Performance Contracting (epc) Mechanism. In Proceedings of the 1st International Conference on Sustainable Urbanization (ICSU), Hong Kong, China, 15–17 December 2010; pp. 455–464. [Google Scholar]
- Pajek, L.; Košir, M. Implications of present and upcoming changes in bioclimatic potential for energy performance of residential buildings. Build. Environ. 2018, 127, 157–172. [Google Scholar] [CrossRef]
- Hajdukiewicz, M.; Byrne, D.; Keane, M.M.; Goggins, J. Real-time monitoring framework to investigate the environmental and structural performance of buildings. Build. Environ. 2015, 86, 1–16. [Google Scholar] [CrossRef]
- Azari, R.; Garshasbi, S.; Amini, P.; Rashed-Ali, H.; Mohammadi, Y. Multi-objective optimization of building envelope design for life cycle environmental performance. Energy Build. 2016, 126, 524–534. [Google Scholar] [CrossRef]
- Ling-Chin, J.; Taylor, W.; Davidson, P.; Reay, D.; Nazi, W.I.; Tassou, S.; Roskilly, A.P. UK building thermal performance from industrial and governmental perspectives. Appl. Energy 2019, 237, 270–282. [Google Scholar] [CrossRef]
- Ruparathna, R.; Hewage, K.; Sadiq, R. Improving the energy efficiency of the existing building stock: A critical review of commercial and institutional buildings. Renew. Sustain. Energy Rev. 2016, 53, 1032–1045. [Google Scholar] [CrossRef]
- Liu, Z.; Liu, Y.; He, B.-J.; Xu, W.; Jin, G.; Zhang, X. Application and suitability analysis of the key technologies in nearly zero energy buildings in China. Renew. Sustain. Energy Rev. 2019, 101, 329–345. [Google Scholar] [CrossRef]
- Morton, T.A.; Bretschneider, P.; Coley, D.; Kershaw, T. Building a better future: An exploration of beliefs about climate change and perceived need for adaptation within the building industry. Build. Environ. 2011, 46, 1151–1158. [Google Scholar] [CrossRef]
- Blumberga, A.; Cilinskis, E.; Gravelsins, A.; Svarckopfa, A.; Blumberga, D. Analysis of regulatory instruments promoting building energy efficiency. Energy Procedia 2018, 147, 258–267. [Google Scholar] [CrossRef]
- Yearwood Travezan, J.; Harmsen, R.; van Toledo, G. Policy analysis for energy efficiency in the built environment in Spain. Energy Policy 2013, 61, 317–326. [Google Scholar] [CrossRef]
- Huang, H.; Wang, H.; Hu, Y.-J.; Li, C.; Wang, X. The development trends of existing building energy conservation and emission reduction—A comprehensive review. Energy Rep. 2022, 8, 13170–13188. [Google Scholar] [CrossRef]
- An, J.; Jung, D.; Jeong, K.; Ji, C.; Hong, T.; Lee, J.; Kapp, S.; Choi, J. Energy-environmental-economic assessment of green retrofit policy to achieve 2050 carbon-neutrality in South Korea: Focused on residential buildings. Energy Build. 2023, 289, 113059. [Google Scholar] [CrossRef]
- Economidou, M.; Todeschi, V.; Bertoldi, P.; D’Agostino, D.; Zangheri, P.; Castellazzi, L. Review of 50 years of EU energy efficiency policies for buildings. Energy Build. 2020, 225, 110322. [Google Scholar] [CrossRef]
- Kershaw, T.; Simm, S. Thoughts of a design team: Barriers to low carbon school design. Sustain. Cities Soc. 2014, 11, 40–47. [Google Scholar] [CrossRef]
- Zhang, Y.; Wang, J.; Hu, F.; Wang, Y. Comparison of evaluation standards for green building in China, Britain, United States. Renew. Sustain. Energy Rev. 2017, 68, 262–271. [Google Scholar] [CrossRef]
- Benhelal, E.; Shamsaei, E.; Rashid, M.I. Challenges against CO2 abatement strategies in cement industry: A review. J. Environ. Sci. 2021, 104, 84–101. [Google Scholar] [CrossRef] [PubMed]
- Thomas, B.S. Green concrete partially comprised of rice husk ash as a supplementary cementitious material—A comprehensive review. Renew. Sustain. Energy Rev. 2018, 82, 3913–3923. [Google Scholar] [CrossRef]
- Salas, D.A.; Ramirez, A.D.; Rodríguez, C.R.; Petroche, D.M.; Boero, A.J.; Duque-Rivera, J. Environmental impacts, life cycle assessment and potential improvement measures for cement production: A literature review. J. Clean. Prod. 2016, 113, 114–122. [Google Scholar] [CrossRef]
- Islam, M.M.; Hasanuzzaman, M. Chapter 1—Introduction to energy and sustainable development. In Energy for Sustainable Development; Hasanuzzaman, M., Rahim, N.A., Eds.; Academic Press: Cambridge, MA, USA, 2020; pp. 1–18. [Google Scholar]
- Zhu, W.; Feng, W.; Li, X.; Zhang, Z. Analysis of the embodied carbon dioxide in the building sector: A case of China. J. Clean. Prod. 2020, 269, 122438. [Google Scholar] [CrossRef]
- Dixit, M.K.; Fernández-Solís, J.L.; Lavy, S.; Culp, C.H. Need for an embodied energy measurement protocol for buildings: A review paper. Renew. Sustain. Energy Rev. 2012, 16, 3730–3743. [Google Scholar] [CrossRef]
- Thormark, C. Energy and resources, material choice and recycling potential in low energy buildings. In Proceedings of the International Conference on Sustainable Construction, Materials and Practices, Lisbon, Portugal, 12–14 September 2007; p. 759. [Google Scholar]
- Gan, V.J.L.; Chan, C.M.; Tse, K.T.; Lo, I.M.C.; Cheng, J.C.P. A comparative analysis of embodied carbon in high-rise buildings regarding different design parameters. J. Clean. Prod. 2017, 161, 663–675. [Google Scholar] [CrossRef]
- Khan, S.A.; Alam, T.; Khan, M.S.; Blecich, P.; Kamal, M.A.; Gupta, N.K.; Yadav, A.S. Life Cycle Assessment of Embodied Carbon in Buildings: Background, Approaches and Advancements. Buildings 2022, 12, 1944. [Google Scholar] [CrossRef]
- Brás, A. Embodied carbon minimisation of retrofit solutions for walls. Proc. Inst. Civ. Eng.-Eng. 2017, 170, 141–156. [Google Scholar] [CrossRef]
- Persson, M.-L.; Roos, A.; Wall, M. Influence of window size on the energy balance of low energy houses. Energy Build. 2006, 38, 181–188. [Google Scholar] [CrossRef]
- Zhang, G.; Setunge, S. Achieving Carbon Neutral Construction: A Review of Viable Techniques. In Proceedings of the International Symposium on Advancement of Construction Management and Real Estate, Nanjing, China, 29–31 October 2009; pp. 539–547. [Google Scholar]
- Yao, H.; Xu, P.; Wang, Y.; Chen, R. Exploring the low-carbon transition pathway of China’s construction industry under carbon-neutral target: A socio-technical system transition theory perspective. J. Environ. Manag. 2023, 327, 116879. [Google Scholar] [CrossRef] [PubMed]
- Kommandur, S.; Mahvi, A.; Bulk, A.; Odukomaiya, A.; Aday, A.; Woods, J. The impact of non-ideal phase change properties on phase change thermal energy storage device performance. J. Energy Storage 2023, 72, 108470. [Google Scholar] [CrossRef]
- Ismail, A.; Wang, J.; Abiodun Salami, B.; Oyedele, L.O.; Otukogbe, G.K. Microencapsulated phase change materials for enhanced thermal energy storage performance in construction materials: A critical review. Constr. Build. Mater. 2023, 401, 132877. [Google Scholar] [CrossRef]
- Liu, W. EKC test study on the relationship between carbon dioxide emission and regional economic growth. Carbon Manag. 2020, 11, 415–425. [Google Scholar] [CrossRef]
- Khan, H.; Weili, L.; Khan, I.; Zhang, J. The nexus between natural resources, renewable energy consumption, economic growth, and carbon dioxide emission in BRI countries. Environ. Sci. Pollut. Res. 2023, 30, 36692–36709. [Google Scholar] [CrossRef]
- Minlah, M.K.; Zhang, X. Testing for the existence of the Environmental Kuznets Curve (EKC) for CO2 emissions in Ghana: Evidence from the bootstrap rolling window Granger causality test. Environ. Sci. Pollut. Res. 2021, 28, 2119–2131. [Google Scholar] [CrossRef]
- Li, H.; Li, X.; Jiang, Y.; Wei, C. On the Application of BIM Technology and Neural Network Algorithm in the Study of Energy-Saving Optimization of the Envelope Structure of Assembled Buildings in the Western Sichuan Plain. J. Sens. 2022, 2022, e1653838. [Google Scholar] [CrossRef]
- Chen, Y.; Zhou, Y.; Feng, W.; Fang, Y.; Feng, A. Factors That Influence the Quantification of the Embodied Carbon Emission of Prefabricated Buildings: A Systematic Review, Meta-Analysis and the Way Forward. Buildings 2022, 12, 1265. [Google Scholar] [CrossRef]
- Jin, R.; Hong, J.; Zuo, J. Environmental performance of off-site constructed facilities: A critical review. Energy Build. 2020, 207, 109567. [Google Scholar] [CrossRef]
- Tavares, V.; Soares, N.; Raposo, N.; Marques, P.; Freire, F. Prefabricated versus conventional construction: Comparing life-cycle impacts of alternative structural materials. J. Build. Eng. 2021, 41, 102705. [Google Scholar] [CrossRef]
- Pervez, H.; Ali, Y.; Petrillo, A. A quantitative assessment of greenhouse gas (GHG) emissions from conventional and modular construction: A case of developing country. J. Clean. Prod. 2021, 294, 126210. [Google Scholar] [CrossRef]
- Li, Y.; Dong, H.; Lu, S. Research on application of a hybrid heuristic algorithm in transportation carbon emission. Environ. Sci. Pollut. Res. 2021, 28, 48610–48627. [Google Scholar] [CrossRef]
- Qin, J.; Gong, N. The estimation of the carbon dioxide emission and driving factors in China based on machine learning methods. Sustain. Prod. Consum. 2022, 33, 218–229. [Google Scholar] [CrossRef]
- Chen, X.; Liu, Y. Visualization analysis of high-speed railway research based on CiteSpace. Transp. Policy 2020, 85, 1–17. [Google Scholar] [CrossRef]
- Mark, L. Moderating Influence of Uncertainty on the Adoption of Green Building Practices in Response to Climate Change-Determining Green Building Practice Institutionalization in the Residential Construction Industry. Ph.D. Dissertation, George Mason University, Fairfax, VA, USA, 2012. [Google Scholar]
- Zeng, D.; Liu, Y.; Yin, S. Research on China Building Energy Efficiency Policies under Global Climate Change. In Proceedings of the 2010 International Conference on Construction and Real Estate Management, VOLS 1-3, Brisbane, Australia, 1–3 December 2010; pp. 541–546. [Google Scholar]
- Säynäjoki, A.; Heinonen, J.; Junnila, S. A scenario analysis of the life cycle greenhouse gas emissions of a new residential area. Environ. Res. Lett. 2012, 7, 034037. [Google Scholar] [CrossRef]
- Kormi, T.; Mhadhebi, S.; Bel Hadj Ali, N.; Abichou, T.; Green, R. Estimation of fugitive landfill methane emissions using surface emission monitoring and Genetic Algorithms optimization. Waste Manag. 2018, 72, 313–328. [Google Scholar] [CrossRef]
- Fernández-Amador, O.; Oberdabernig, D.A.; Tomberger, P. Do methane emissions converge? Evidence from global panel data on production- and consumption-based emissions. Empir. Econ. 2022, 63, 877–900. [Google Scholar] [CrossRef]
- Stocker, T.F.; Qin, D.; Plattner, G.-K.; Tignor, M.M.B.; Allen, S.K.; Boschung, J.; Nauels, A.; Xia, Y.; Bex, V.; Midgley, P.M. Climate Change 2013: The Physical Science Basis. Contribution of Working Group I to the Fifth Assessment Report of IPCC the Intergovernmental Panel on Climate Change; Stocker, T., Qin, D., Plattner, G.-K., Tignor, M., Allen, S., Boschung, J., Nauels, A., Xia, Y., Bex, V., Midgley, P., Eds.; Cambridge University Press: Cambridge, UK, 2014; p. 1535. [Google Scholar]
- Jahangir, M.M.R.; Johnston, P.; Addy, K.; Khalil, M.I.; Groffman, P.M.; Richards, K.G. Quantification of In Situ Denitrification Rates in Groundwater Below an Arable and a Grassland System. Water Air Soil Pollut. 2013, 224, 1693. [Google Scholar] [CrossRef]
- Rebitzer, G.; Ekvall, T.; Frischknecht, R.; Hunkeler, D.; Norris, G.; Rydberg, T.; Schmidt, W.-P.; Suh, S.; Weidema, B.P.; Pennington, D.W. Life cycle assessment: Part 1: Framework, goal and scope definition, inventory analysis, and applications. Environ. Int. 2004, 30, 701–720. [Google Scholar] [CrossRef]
- Mishra, S.; Singh, S.P. Carbon management framework for sustainable manufacturing using life cycle assessment, IoT and carbon sequestration. Benchmarking Int. J. 2019, 28, 1396–1409. [Google Scholar] [CrossRef]
- Patware, P.; Thakur, G.; Rawat, P.; Sudhakar, K. A Roadmap for “carbon capture and sequestration” in the Indian context: A critical review. Int. J. ChemTech Res. 2013, 5, 858–870. [Google Scholar]
- Powlson, D.S.; Whitmore, A.P.; Goulding, K.W.T. Soil carbon sequestration to mitigate climate change: A critical re-examination to identify the true and the false. Eur. J. Soil Sci. 2011, 62, 42–55. [Google Scholar] [CrossRef]
- Bekhet, H.A.; Matar, A.; Yasmin, T. CO2 emissions, energy consumption, economic growth, and financial development in GCC countries: Dynamic simultaneous equation models. Renew. Sustain. Energy Rev. 2017, 70, 117–132. [Google Scholar] [CrossRef]
- Dinda, S. Environmental Kuznets Curve Hypothesis: A Survey. Ecol. Econ. 2004, 49, 431–455. [Google Scholar] [CrossRef]
- Yin, Z.; Jin, X. Recent advances in the relationship between economic development and carbon emissions. Manag. Environ. Qual. Int. J. 2021, 33, 141–165. [Google Scholar] [CrossRef]
- Osman, A.I.; Chen, L.; Yang, M.; Msigwa, G.; Farghali, M.; Fawzy, S.; Rooney, D.W.; Yap, P.-S. Cost, environmental impact, and resilience of renewable energy under a changing climate: A review. Environ. Chem. Lett. 2022, 21, 741–764. [Google Scholar] [CrossRef]
- Yang, M.; Chen, L.; Wang, J.; Msigwa, G.; Osman, A.I.; Fawzy, S.; Rooney, D.W.; Yap, P.-S. Circular economy strategies for combating climate change and other environmental issues. Environ. Chem. Lett. 2023, 21, 55–80. [Google Scholar] [CrossRef]
- Stahel, W.R. The circular economy. Nature 2016, 531, 435–438. [Google Scholar] [CrossRef]
- Wendong, W.; Zhujun, C.; Yong, G.; Wenqiu, C.; Hanbin, L. Toward Carbon Neutrality: Circular Economy Approach and Policy Implications. Bull. Chin. Acad. Sci. 2021, 36, 1030–1038. [Google Scholar]
- Foundation, E.M. Completing the Picture: How the Circular Economy Tackles Climate Change. Available online: https://ellenmacarthurfoundation.org/completing-the-picture (accessed on 14 October 2023).
- Vandenbergh, M.P.; Steinemann, A.C. The Carbon-Neutral Individual. N. Y. Univ. Law Rev. 2007, 82, 1673–1745. [Google Scholar]
- Ibn-Mohammed, T.; Greenough, R.; Taylor, S.; Ozawa-Meida, L.; Acquaye, A. Operational vs. embodied emissions in buildings—A review of current trends. Energy Build. 2013, 66, 232–245. [Google Scholar] [CrossRef]
- Luo, X.; Ren, M.; Zhao, J.; Wang, Z.; Ge, J.; Gao, W. Life cycle assessment for carbon emission impact analysis for the renovation of old residential areas. J. Clean. Prod. 2022, 367, 132930. [Google Scholar] [CrossRef]
- Crowther, P. Re-Valuing Construction Materials and Components Through Design for Disassembly. In Unmaking Waste in Production and Consumption: Towards the Circular Economy; Crocker, R., Saint, C., Chen, G., Tong, Y., Eds.; Emerald Publishing Limited: Bingley, UK, 2018; pp. 309–321. [Google Scholar]
- Wang, T.; Li, K.; Liu, D.; Yang, Y.; Wu, D. Estimating the Carbon Emission of Construction Waste Recycling Using Grey Model and Life Cycle Assessment: A Case Study of Shanghai. Int. J. Environ. Res. Public Health 2022, 19, 8507. [Google Scholar] [CrossRef]
- Huang, Y.; Pan, L.; He, Y.; Xie, Z.; Zheng, X. A BIM–WMS Management Tool for the Reverse Logistics Supply Chain of Demolition Waste. Sustainability 2022, 14, 16053. [Google Scholar] [CrossRef]
- Ding, Y. Scientific collaboration and endorsement: Network analysis of coauthorship and citation networks. J. Informetr. 2011, 5, 187–203. [Google Scholar] [CrossRef]
- Xiang, D. Analyzing International Scientific Collaboration in Materials Science Through Co-authorship. In Proceedings of the 19th International Conference on Industrial Engineering and Engineering Management: Management System Innovation, Changsha, China, 27–29 October 2013; pp. 73–83. [Google Scholar]
- Glänzel, W.; Schubert, A. Analysing Scientific Networks Through Co-Authorship. In Handbook of Quantitative Science and Technology Research: The Use of Publication and Patent Statistics in Studies of S&T Systems; Moed, H.F., Glänzel, W., Schmoch, U., Eds.; Springer: Dordrecht, The Netherlands, 2005; pp. 257–276. [Google Scholar]
- Adams, J.; Fry, R.; Pendlebury, D.; Potter, R.; Rogers, G. ISI Global Research Report: China’s Research Landscape; Clarivate: Philadelphia, PA, USA, 2023. [Google Scholar]
- McDonnell, L.M.; Elmore, R.F. Getting the Job Done: Alternative Policy Instruments. Educ. Eval. Policy Anal. 1987, 9, 133–152. [Google Scholar] [CrossRef]
- ASHRAE/ICC/USGBC/IES 189.1-2023; Standard for the Design of High-Performance Green Buildings Except Low-Rise Residential Buildings. ASHRAE: Marietta, GA, USA, 2023.
- Xie, R.; Fang, J.; Liu, C. The effects of transportation infrastructure on urban carbon emissions. Appl. Energy 2017, 196, 199–207. [Google Scholar] [CrossRef]
- Kofoworola, O.F.; Gheewala, S.H. Environmental life cycle assessment of a commercial office building in Thailand. Int. J. Life Cycle Assess. 2008, 13, 498–511. [Google Scholar] [CrossRef]
- Cousins, F.; Broyles Yost, T.; Bender, G. Think circular–Reducing embodied carbon through materials selection. MRS Energy Sustain. 2018, 5, 2. [Google Scholar] [CrossRef]
- ISO 29481-1: 2016; Building Information Models-Information Delivery Manual-Part 1: Methodology and Format. ISO: Geneva, Switzerland, 2016.
- Jun, H.; Lim, N.; Kim, M. BIM-based Carbon Dioxide Emission Quantity Assessment Method in Korea. J. Asian Archit. Build. Eng. 2015, 14, 569–576. [Google Scholar] [CrossRef]
Figure 1.
Trends in publication quantity (1997–10 July 2023).

Figure 2.
Dual-map overlay of the literature on carbon emissions in the construction sector.

Figure 3.
Journal co-citation network.

Figure 4.
Keyword co-occurrence network.

Figure 5.
Timeline view of keyword co-occurrence network clustering.

Figure 6.
Top 30 keywords with the strongest citation bursts.

Figure 7.
Institution co-authorship network.

Figure 8.
Country co-authorship network of construction-sector carbon-emission literature.


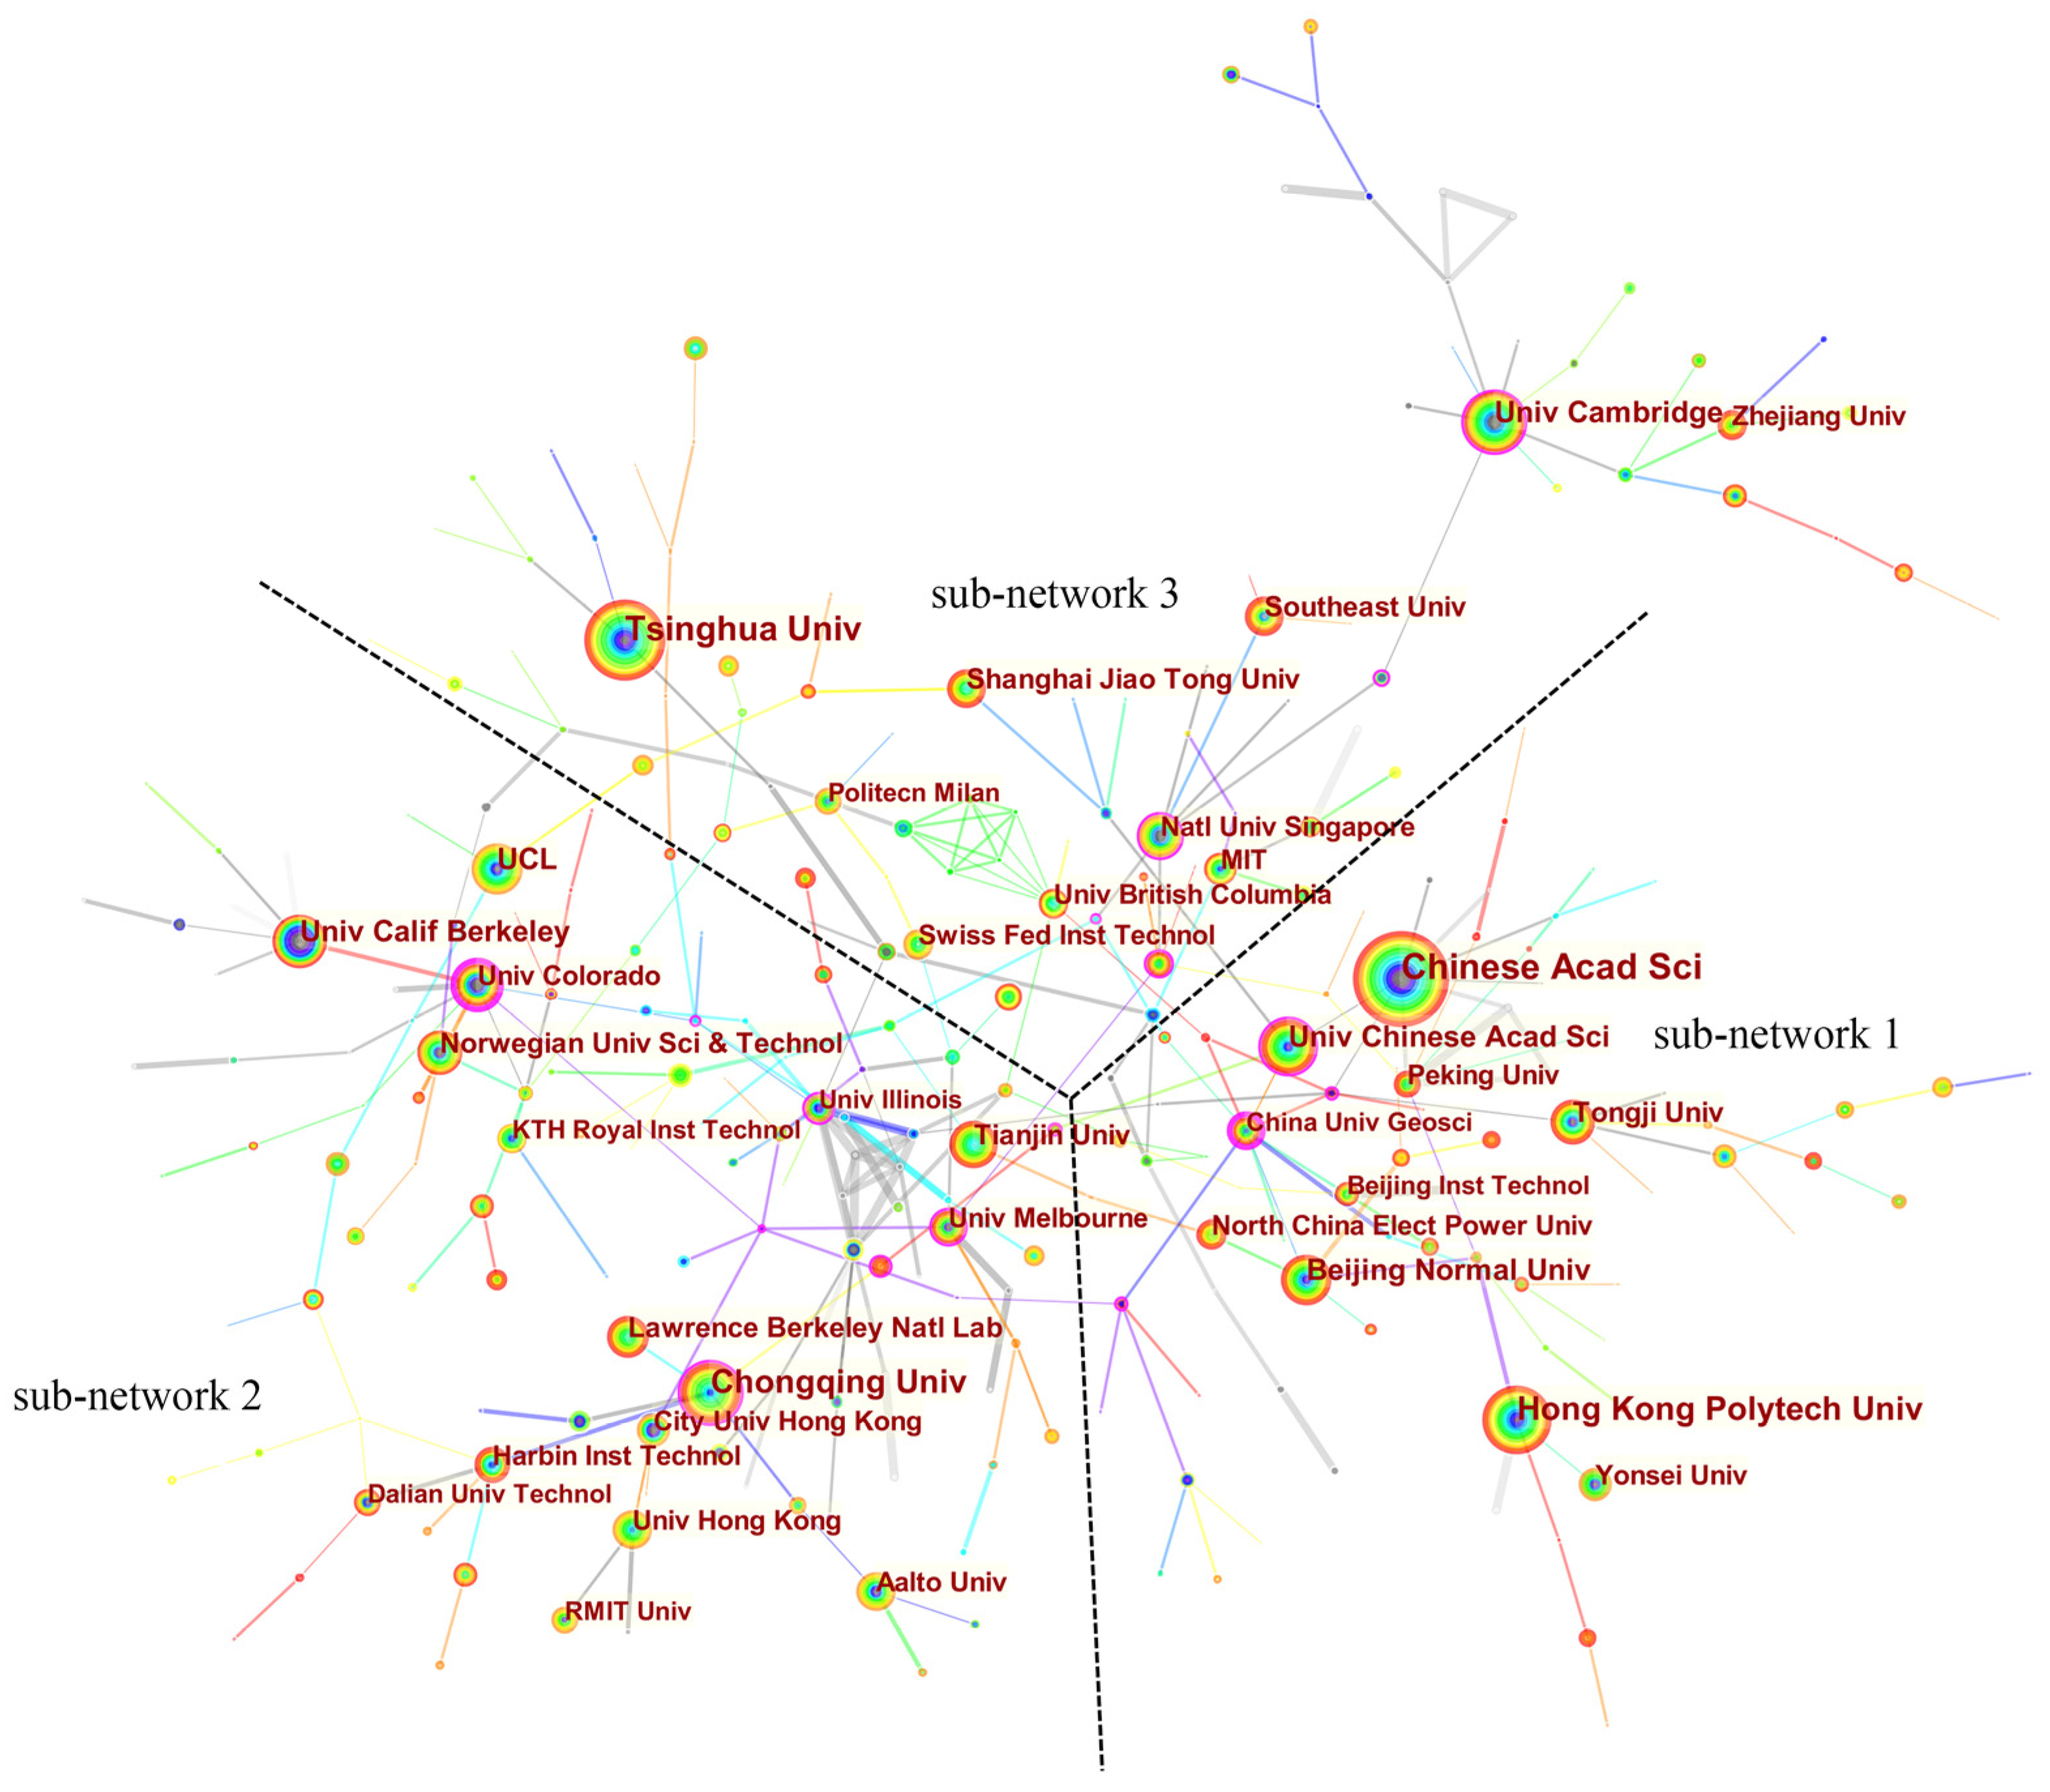
Table 1.
Top 10 journals in co-citation frequency and centrality.
| Number | Cited Journals (Frequency) | Cited Journals (Centrality) |
|---|---|---|
| 1 | Journal of Cleaner Production (5034) | Environmental Science & Technology (0.65) |
| 2 | Renewable and Sustainable Energy Reviews (4826) | Energy Policy (0.44) |
| 3 | Energy and Buildings (4624) | Environmental Science & Policy (0.44) |
| 4 | Applied Energy (4406) | Energy Conversion and Management (0.22) |
| 5 | Energy (4267) | Biomass and Bioenergy (0.21) |
| 6 | Energy Policy (4180) | Nature (0.18) |
| 7 | Building and Environment (3505) | Science (0.17) |
| 8 | Sustainability (2385) | Atmospheric Environment (0.15) |
| 9 | Environmental Science & Technology (2318) | Journal of Geophysical Research-Atmospheres (0.15) |
| 10 | Renewable Energy (2013) | Energy (0.12) |
Table 2.
Top 20 keywords in co-occurrence frequency and betweenness centrality.
| Number | Keywords (Frequency) | Keywords (Centrality) |
|---|---|---|
| 1 | carbon emission (1815) | energy efficiency (0.43) |
| 2 | life cycle assessment (1633) | barrier (0.35) |
| 3 | performance (1431) | carbon emission (0.29) |
| 4 | energy (1361) | energy (0.28) |
| 5 | emission (1308) | emission (0.26) |
| 6 | impact (1203) | design (0.24) |
| 7 | energy efficiency (1182) | energy conservation (0.24) |
| 8 | carbon dioxide emission (1179) | performance (0.22) |
| 9 | building (1096) | China (0.22) |
| 10 | system (1096) | balance (0.18) |
| 11 | climate change (856) | model (0.18) |
| 12 | model (826) | construction (0.17) |
| 13 | consumption (815) | concrete (0.15) |
| 14 | construction (755) | building stock (0.15) |
| 15 | design (748) | refurbishment (0.14) |
| 16 | sustainability (739) | climate change (0.13) |
| 17 | energy consumption (704) | energy saving (0.13) |
| 18 | optimization (698) | impact (0.13) |
| 19 | China (676) | optimization (0.13) |
| 20 | carbon dioxide (554) | carbon reduction (0.13) |
Table 3.
Top 10 institutions in frequency and betweenness centrality.
| Number | Institutions (Frequency) | Institutions (Centrality) |
|---|---|---|
| 1 | Chinese Acad Sci (271) | China Univ Geosci (0.28) |
| 2 | Tsinghua Univ (211) | Univ Colorado (0.22) |
| 3 | Chongqing Univ (165) | CALTECH (0.17) |
| 4 | Hong Kong Polytech Univ (157) | Natl Univ Singapore (0.17) |
| 5 | Univ Cambridge (115) | Univ Chinese Acad Sci (0.16) |
| 6 | Beijing Normal Univ (109) | Univ Illinois (0.15) |
| 7 | Univ Chinese Acad Sci (102) | Deakin Univ (0.15) |
| 8 | Univ Calif Berkeley (100) | Univ Melbourne (0.12) |
| 9 | UCL (97) | Fudan Univ (0.12) |
| 10 | Tianjin Univ (90) | Univ Cambridge (0.11) |
Table 4.
Top 10 countries in frequency and betweenness centrality.
| Number | Countries (Frequency) | Countries (Centrality) |
|---|---|---|
| 1 | PEOPLES R CHINA (2737) | GERMANY (0.46) |
| 2 | USA (2146) | NETHERLANDS (0.45) |
| 3 | ENGLAND 1 (850) | SPAIN (0.4) |
| 4 | GERMANY (484) | PEOPLES R CHINA (0.37) |
| 5 | AUSTRALIA (481) | SWEDEN (0.36) |
| 6 | CANADA (429) | ENGLAND (0.34) |
| 7 | ITALY (415) | ITALY (0.3) |
| 8 | SPAIN (358) | AUSTRALIA (0.29) |
| 9 | SOUTH KOREA (341) | FINLAND (0.22) |
| 10 | INDIA (294) | NEW ZEALAND (0.21) |
1 England is a constituent country of the United Kingdom.
Disclaimer/Publisher’s Note: The statements, opinions and data contained in all publications are solely those of the individual author(s) and contributor(s) and not of MDPI and/or the editor(s). MDPI and/or the editor(s) disclaim responsibility for any injury to people or property resulting from any ideas, methods, instructions or products referred to in the content. |
© 2024 by the authors. Licensee MDPI, Basel, Switzerland. This article is an open access article distributed under the terms and conditions of the Creative Commons Attribution (CC BY) license (https://creativecommons.org/licenses/by/4.0/).
Share and Cite
MDPI and ACS Style
Luo, Q.; Yang, D.; Huang, L.; Chen, L.; Luo, D.; Cheng, K.; Yang, F. Scientometric Analysis and Visualization of Carbon Emission Studies in the Construction Industry. Buildings 2024, 14, 1181. https://doi.org/10.3390/buildings14041181
AMA Style
Luo Q, Yang D, Huang L, Chen L, Luo D, Cheng K, Yang F. Scientometric Analysis and Visualization of Carbon Emission Studies in the Construction Industry. Buildings. 2024; 14(4):1181. https://doi.org/10.3390/buildings14041181
Chicago/Turabian StyleLuo, Qiming, Depo Yang, Lepeng Huang, Lin Chen, Diyuan Luo, Kang Cheng, and Fan Yang. 2024. "Scientometric Analysis and Visualization of Carbon Emission Studies in the Construction Industry" Buildings 14, no. 4: 1181. https://doi.org/10.3390/buildings14041181
Note that from the first issue of 2016, this journal uses article numbers instead of page numbers. See further details here.