
Suitability of Site Selection for Mountain Railway Engineering Spoil Disposal Areas from a Multi-Scenario Perspective

School of Civil Engineering, Central South University, Changsha 410075, China
*
Author to whom correspondence should be addressed.
Buildings 2024, 14(4), 1184; https://doi.org/10.3390/buildings14041184
Submission received: 5 March 2024
/
Revised: 14 April 2024
/
Accepted: 17 April 2024
/
Published: 22 April 2024
Abstract
:The current approach to selecting sites for abandoned spoil areas primarily relies on qualitative methods, often overlooking the impact of policy factors on decision-making. Traditional single-site selection strategies may not be flexible enough to accommodate evolving external policy demands. Addressing this challenge is crucial for ensuring the site selection for abandoned spoil areas is both scientifically sound and policy-compliant. This research integrates various analytical methods, including principal component analysis, complex network theory, the CRITIC method, and the ordered weighted averaging method, to thoroughly evaluate the factors influencing site selection. Utilizing geographic information system (GIS) technology, the study simulates different policy scenarios, such as construction cost, social and ecological concerns, natural security, spatial accessibility, and a comprehensive balance approach. It specifically analyzes the suitability of the spoil site of a segment of the Chongqing ZW Railway under these policy conditions. Based on the actual policy situation in the local area, six potential suitable sites were screened with the help of field investigation. This study can offer a methodological framework and theoretical guidance for optimally locating mountain railway engineering waste disposal sites. In addition, the methodology presented in this study can be adapted to the development and change in policy scenarios.
1. Introduction
Currently, as railroad engineering projects advance swiftly, the railway network in China’s eastern region has become increasingly comprehensive. Consequently, the emphasis of railway construction is progressively shifting towards the central and western regions, characterized by their challenging plateau and mountainous terrains. Constructing railroads in these areas frequently necessitates the erection of bridges and tunnels to navigate the varied topography, resulting in the significant production of construction waste materials, particularly spoil from excavations. Scientific planning of the disposal site is crucial for the proper disposal of these wastes. If the site selection of abandoned dreg sites is not properly designed, it may cause serious safety and environmental problems [1,2,3].
Most researchers have analyzed dumpsites from safety design and risk management perspectives. Tian et al. [4] used engineering data to statistically analyze the subgroup features of mountainous highway waste slag composition and the angle of repose. Jiang et al. [5] carried out an experimental study on the mechanical properties of loose spoil considering the vertical distribution factor. The results of their research can present basic parameters for the dynamic design of waste slag engineering. Li et al. [6] presented modelling work on the integration of fault tree and a Bayesian network to support the risk management of mega-project waste dumps under complex and dangerous environmental conditions.
In addition, there is currently a lot of research in the area of dump site selection, mainly focusing on the determination of dump site selection principles. Researchers have conducted extensive research on the principles and ideas of site selection and design for waste disposal sites by drawing inspiration from other fields such as highways, emphasizing the importance of reasonable site selection and design of waste disposal sites [1,7,8]. These studies have formed the basic principles of site selection of the abandoned dreg site, providing theoretical references for the determination of site selection standards.
However, there is a lack of research on the methodological framework for the site selection of the abandoned dreg site at this stage, but there are a large number of studies on the siting of similar projects such as landfills. Huo et al. [9], Kapilan et al. [10], and Huang et al. [11] conducted a site selection study for waste disposal using multi-criteria decision analysis (MCDA) methods such as the analytic hierarchy process (AHP) and fuzzy evaluation method based on a GIS platform. These research results can provide methodological references for the study of dump site selection.
Moreover, diversified policy scenarios have emerged with escalating national emphasis on building an ecological civilization and the westward shift in construction focus. A rigid, unchanging approach to site selection is often inadequate in responding to the evolving policy requirements. Such a scenario underscores the need for a more adaptable and forward-thinking strategy in site selection to accommodate the dynamic nature of policy frameworks and standards [1]. Policies are closely related to preferences. Preferences represent the extent to which an individual is inclined towards a particular service [12]. Some policies can influence the behavior of target groups by shaping their preferences [13]. Therefore, policy factors are very important in the decision-making of dump site selection and can influence decision-makers’ preferences for siting factors.
This study focuses on a section of the ZW railroad in Chongqing City, and a comprehensive evaluation index system for the site selection of the abandoned dreg site was constructed. A combination of principal component analysis (PCA), complex network theory, the CRITIC method, and the ordered weighted averaging (OWA) method was proposed to evaluate the suitability of the site selection of the abandoned dreg site. It aims to reduce the influence of subjective judgment, scientifically determine the weight of each indicator, and adapt to the siting needs under different policy environments. In addition, this study utilizes ArcGIS 10.2 to generate the suitability zoning map of the site selection of the abandoned dreg site. These results can provide methodological support and practical guidance for the site selection of mountain railway engineering waste disposal.
The paper proposes a set of combination weighing methods and simulates multiple policy scenarios to meet the needs of diversified siting scenarios. It avoids the inflexibility of the traditional residue disposal area siting methods and allows for the flexible siting of disposal sites in response to changes in policy scenarios, improving the adaptability and generalizability of the siting methods. Therefore, engineering designers and government regulators can use this method to adjust the site selection strategy for abandoned sites based on the persistent impacts of the external environment.
2. Overview of the Research Area
The study area is located in Chongqing City, with an elevation of 124–1379 m. The ZW railroad traversing this region predominantly consists of tunnels (Figure 1). The two sides of the tunnel are affected by the longitudinal cutting of streams and gullies. The soil cover on the slopes of the hills is thin, mostly exposed bedrock, and the ground surface is mostly forested and has shrubs. In contrast, the lower-lying areas, such as valleys, boast thicker soil layers, with much of this land converted into paddy fields and dry farmlands. The region is characterized by scattered villages and houses, alongside a network of densely situated highways. The geological stratification in the area is notably intricate, predominantly comprising mudstone and sandstone, with the rock material tending to be on the softer side. Moreover, the locale is prone to various geohazards, including the presence of rockfalls, avalanches, landslides, and mudslides, pointing to a highly developed adverse geological landscape.
Additionally, the area falls within the Three Gorges Reservoir zone, a region that prioritizes the ethos of ecological civilization construction, hence adhering to stringent environmental protection standards. This context not only heightens the significance of sustainable development practices but also necessitates a meticulous approach to any construction-related activities, especially those potentially impacting the delicate ecological and geological balance of the area.
3. Materials and Methodology
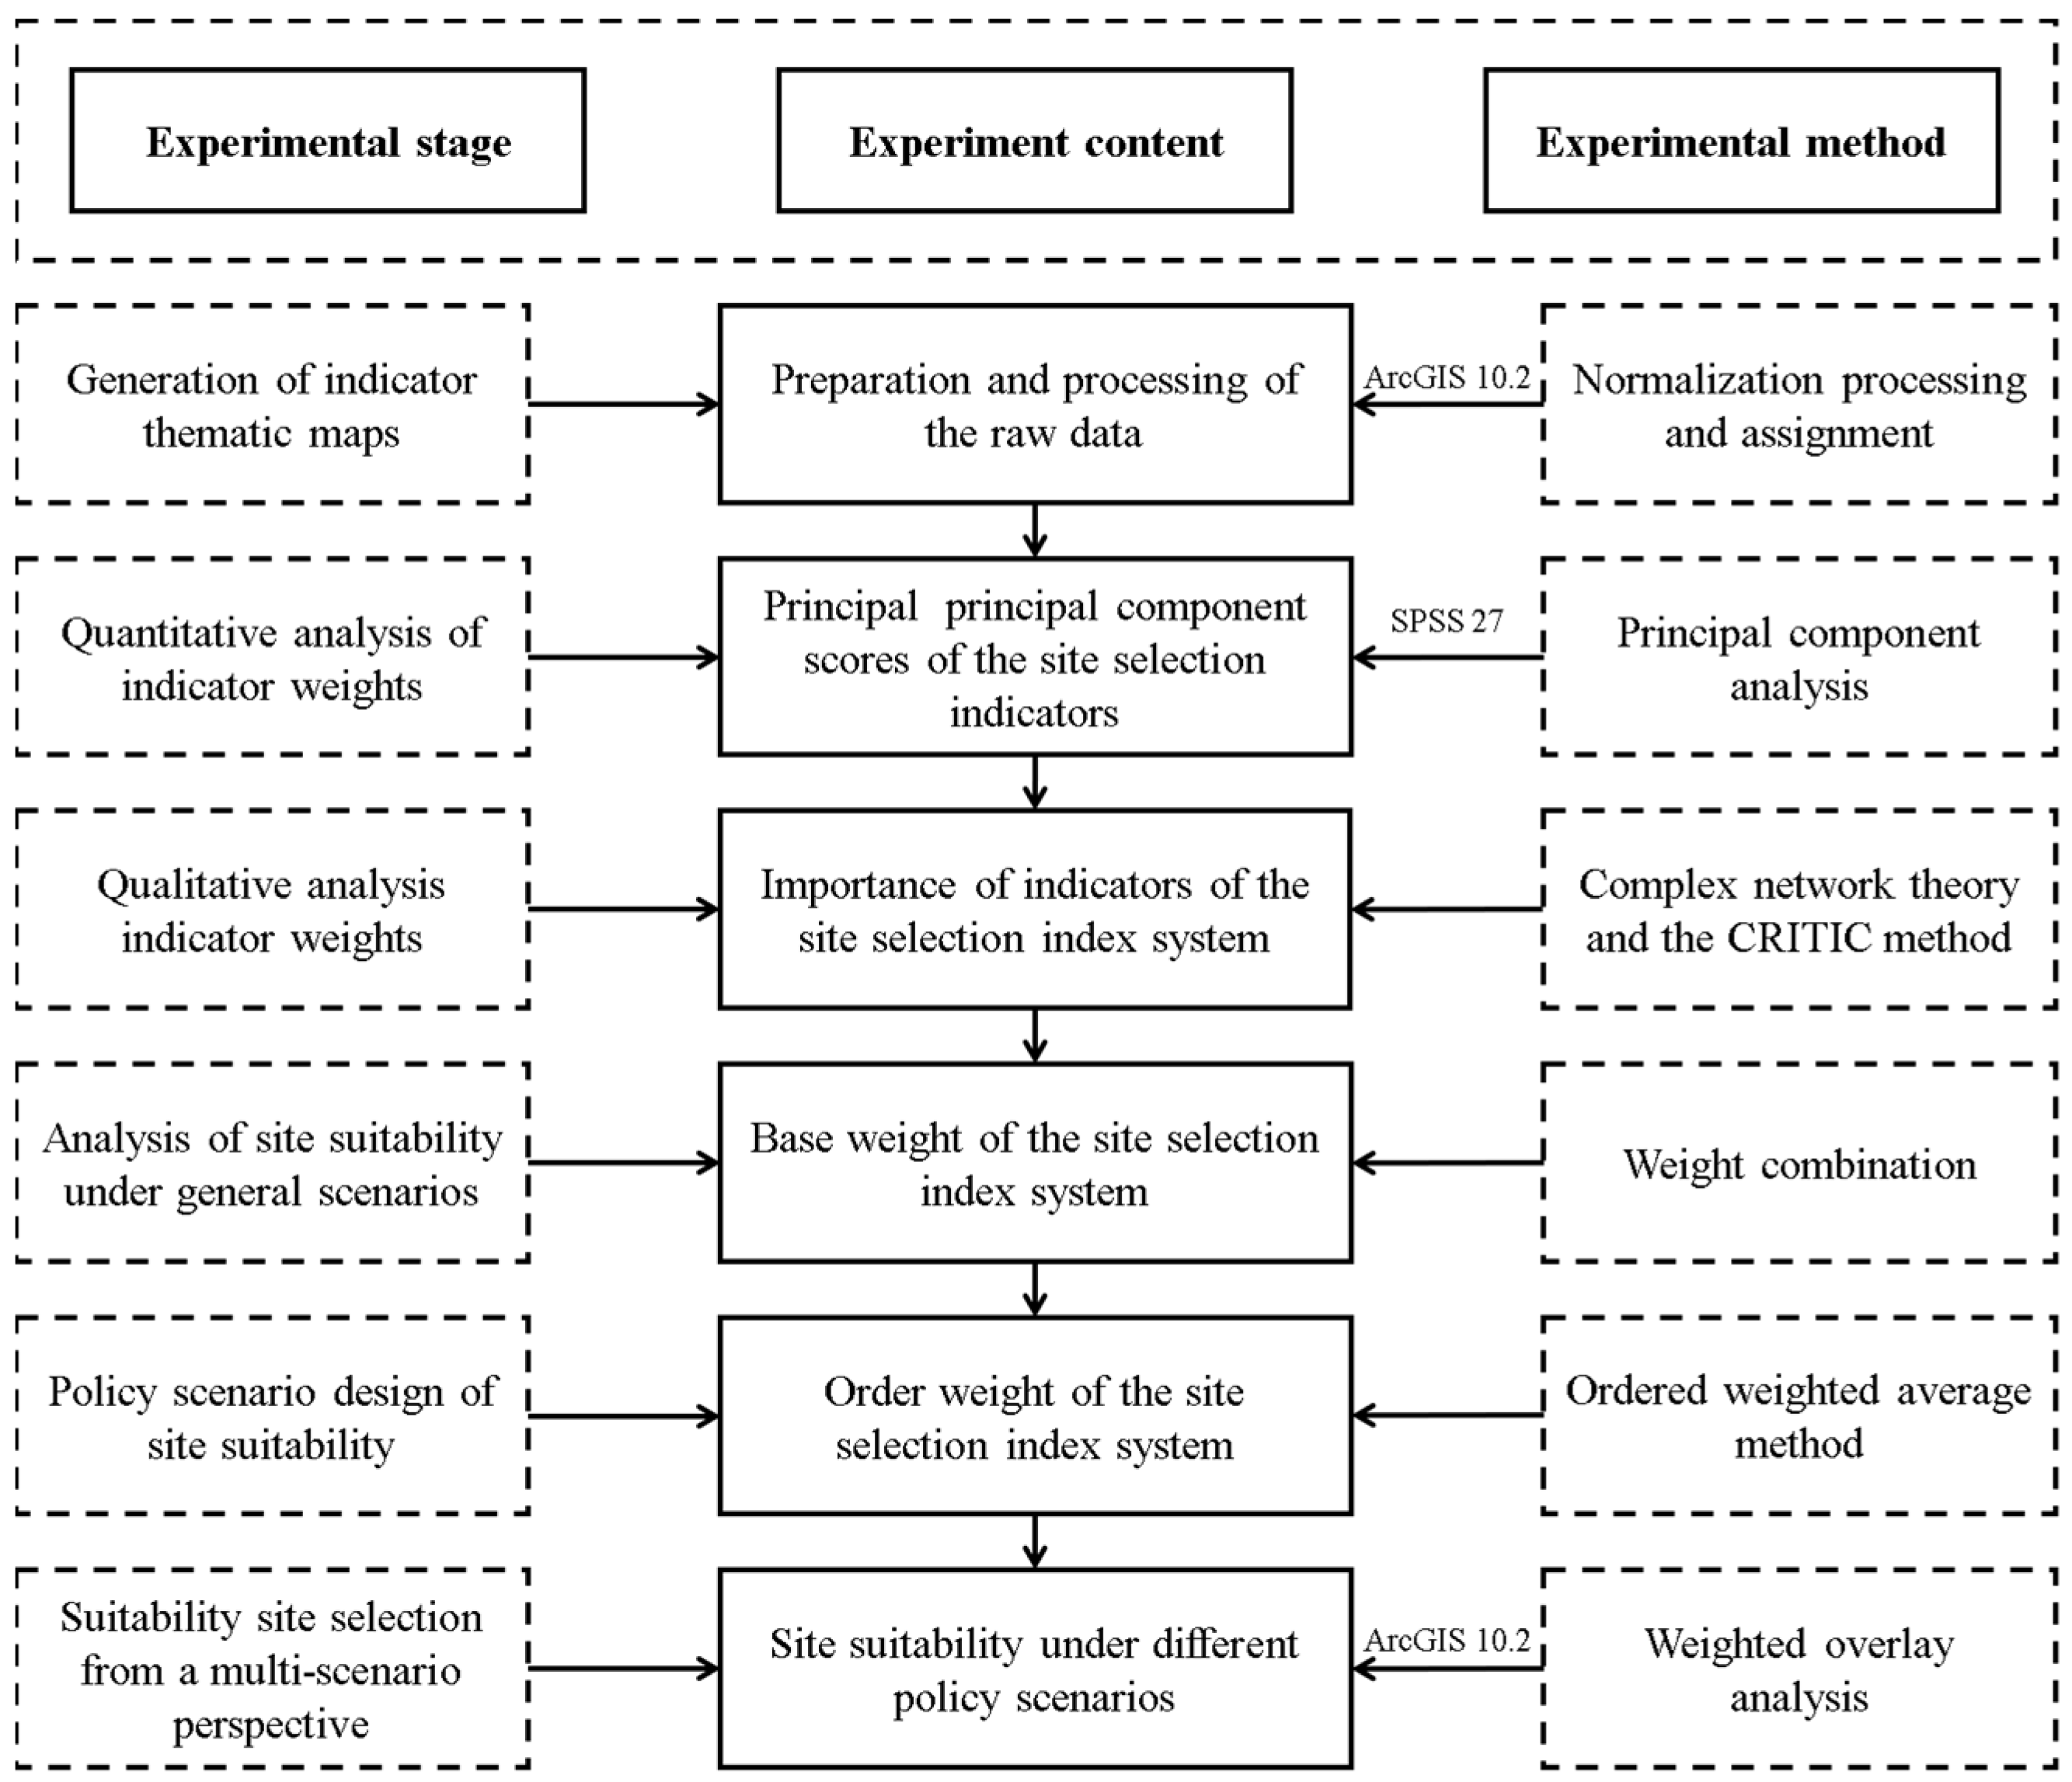
The methodology system adopted in the paper mainly includes PCA, complex network theory, CRITIC, OWA, etc. Based on GIS platform, we carried out the generation of indicator layers, weight allocation, and overlay analysis, and finally realized the site suitability evaluation of the residues disposal areas. The processes of the abovementioned methods can be seen in Figure 2. The detailed description of data collection and processing methods is described in the subsequent sections.
3.1. The Fundamental Data and Its Processing
The raw data of this study mainly include the Digital Elevation Model (DEM), land-use-type data, Normalized Difference Vegetation Index (NDVI), water system data, residential land data, public facilities data, road network data, stratum lithology data, adverse geology data, rainfall data, and soil physical and chemical properties data. The data sources are shown in Table 1.
3.2. The Suitability Index System for Site Selection of Abandoned Dreg Site
According to the research status [1,7,8] and the requirements of Code for design of soil and water conservation engineering (GB51018-2014) [14], 14 suitability evaluation indexes were selected. These include the land use type, terrain curvature, TPI, distance from the water system, distance from residential land, distance from public facilities, distance from cropland, soil erosion intensity, lithology, slope, distance from undesirable geologic conditions, SPI, distance from roads, distance from waste outlet, etc. These are further divided into four dimensions: construction cost, society and ecology, spatial accessibility, and natural security. Eventually, a comprehensive evaluation index system was constructed (Table 2).
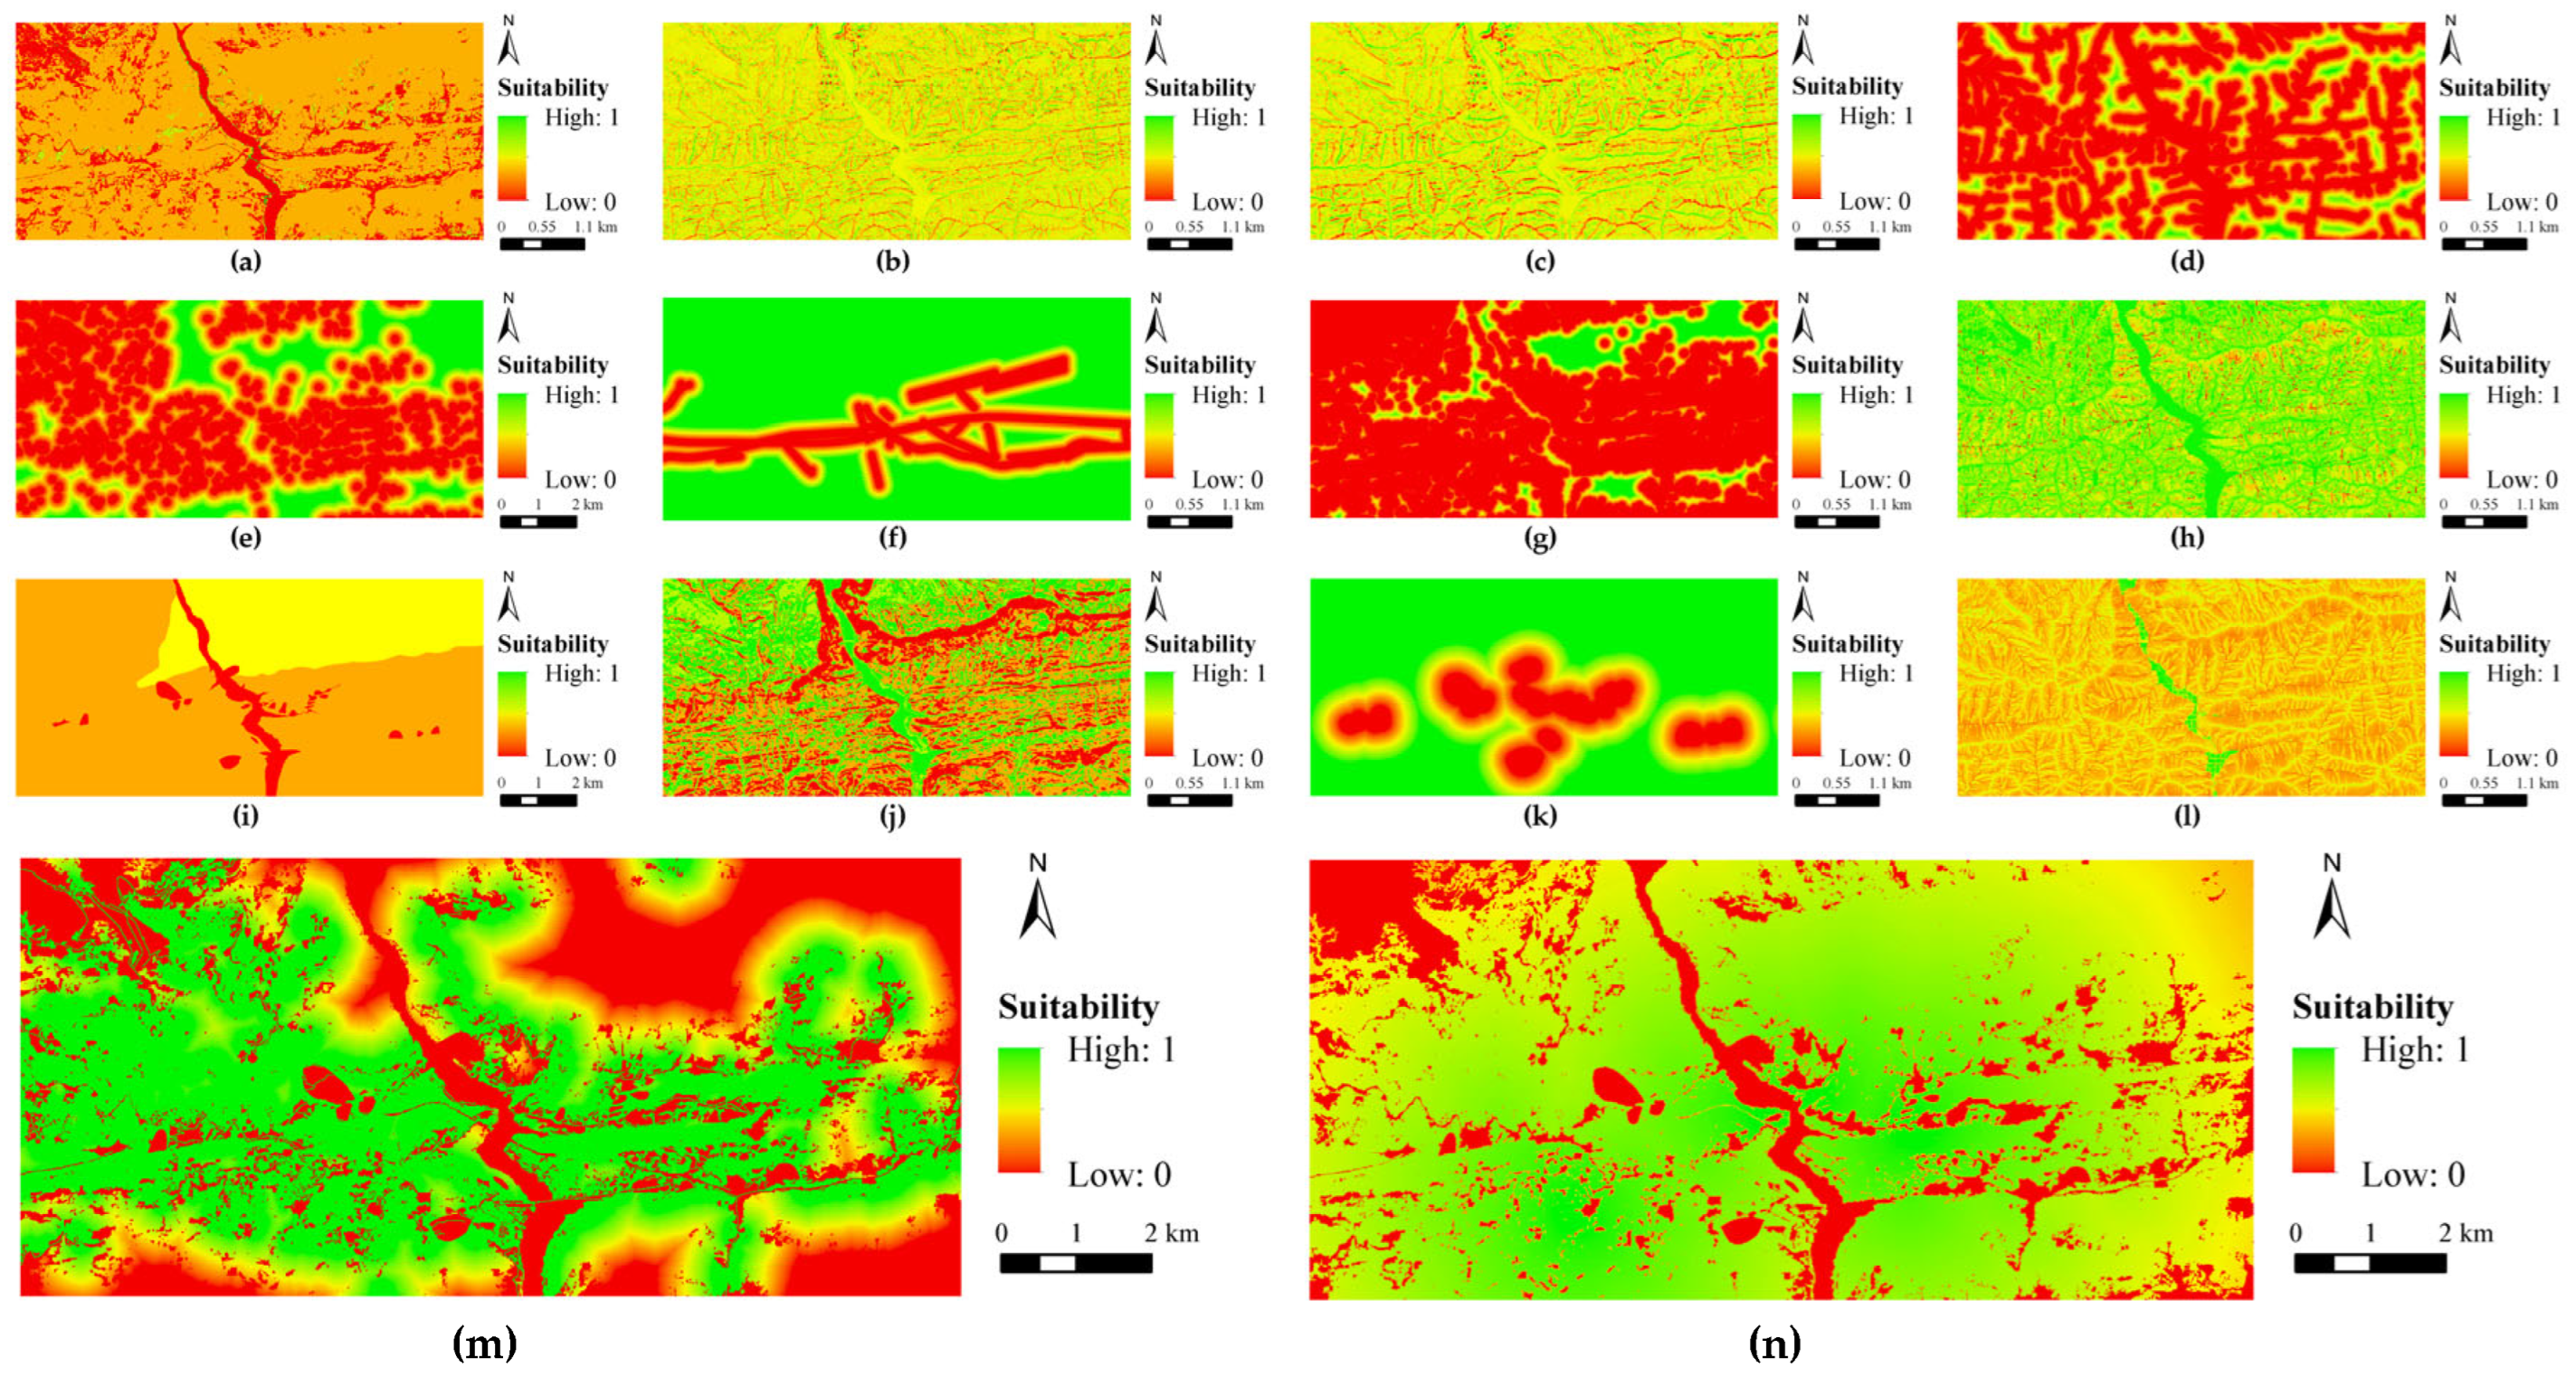
Based on the ArcGIS 10.2 platform to analyze and process the raw data, we extracted the thematic layers of these evaluation indicators. We determined the methods of processing raw data, attributes, and assignment of evaluation indicators through literature research (Table 2). Furthermore, based on the index attributes and assignment methods, the above indicators were assigned and normalized by using raster calculator in ArcGIS 10.2 to eliminate the influence of different scales. The results of the processing are shown in Figure 3. The normalization calculation formulas are as follows.
Positive indicators:
Negative indicators:
In the formula, represents the raw data value of the indicator at any geospatial location , and represents the normalized indicator value, .
3.3. Research Methods
3.3.1. Principal Component Analysis Method
Principal component analysis (PCA) is a commonly used multivariate data reduction and feature extraction method. It projects the original data onto a new coordinate system through a linear transformation so that the projected data have the maximum variance, thereby identifying the most important features in the data [30].
This study employed SPSS 27 software to perform a principal component analysis of the data of evaluation indicators and threshold values. The primary steps include the following: (1) standardizing the evaluation indicators, which are exported from processed thematic layers (Figure 3) in the ArcGIS 10.2 platform; (2) calculating the correlation coefficient matrix; (3) calculating the eigenvalues and eigenvectors; (4) selecting the principal components; and (5) calculating the composite scores () of the principal components (Table 3).
It is worth noting that the KMO test and Bartlett’s test need to be performed on the data before performing principal component analysis. In the KMO test, the value was 0.735; in Bartlett’s test, the p-value was less than 0.01, which indicated that it was appropriate to take PCA. The obtained would be involved in the calculation of the final weights of the indicators (Table 3). And, we conducted final weight allocation through GIS overlay analysis.
3.3.2. Complex Network Theory and the CRITIC Method
- Complex network theory
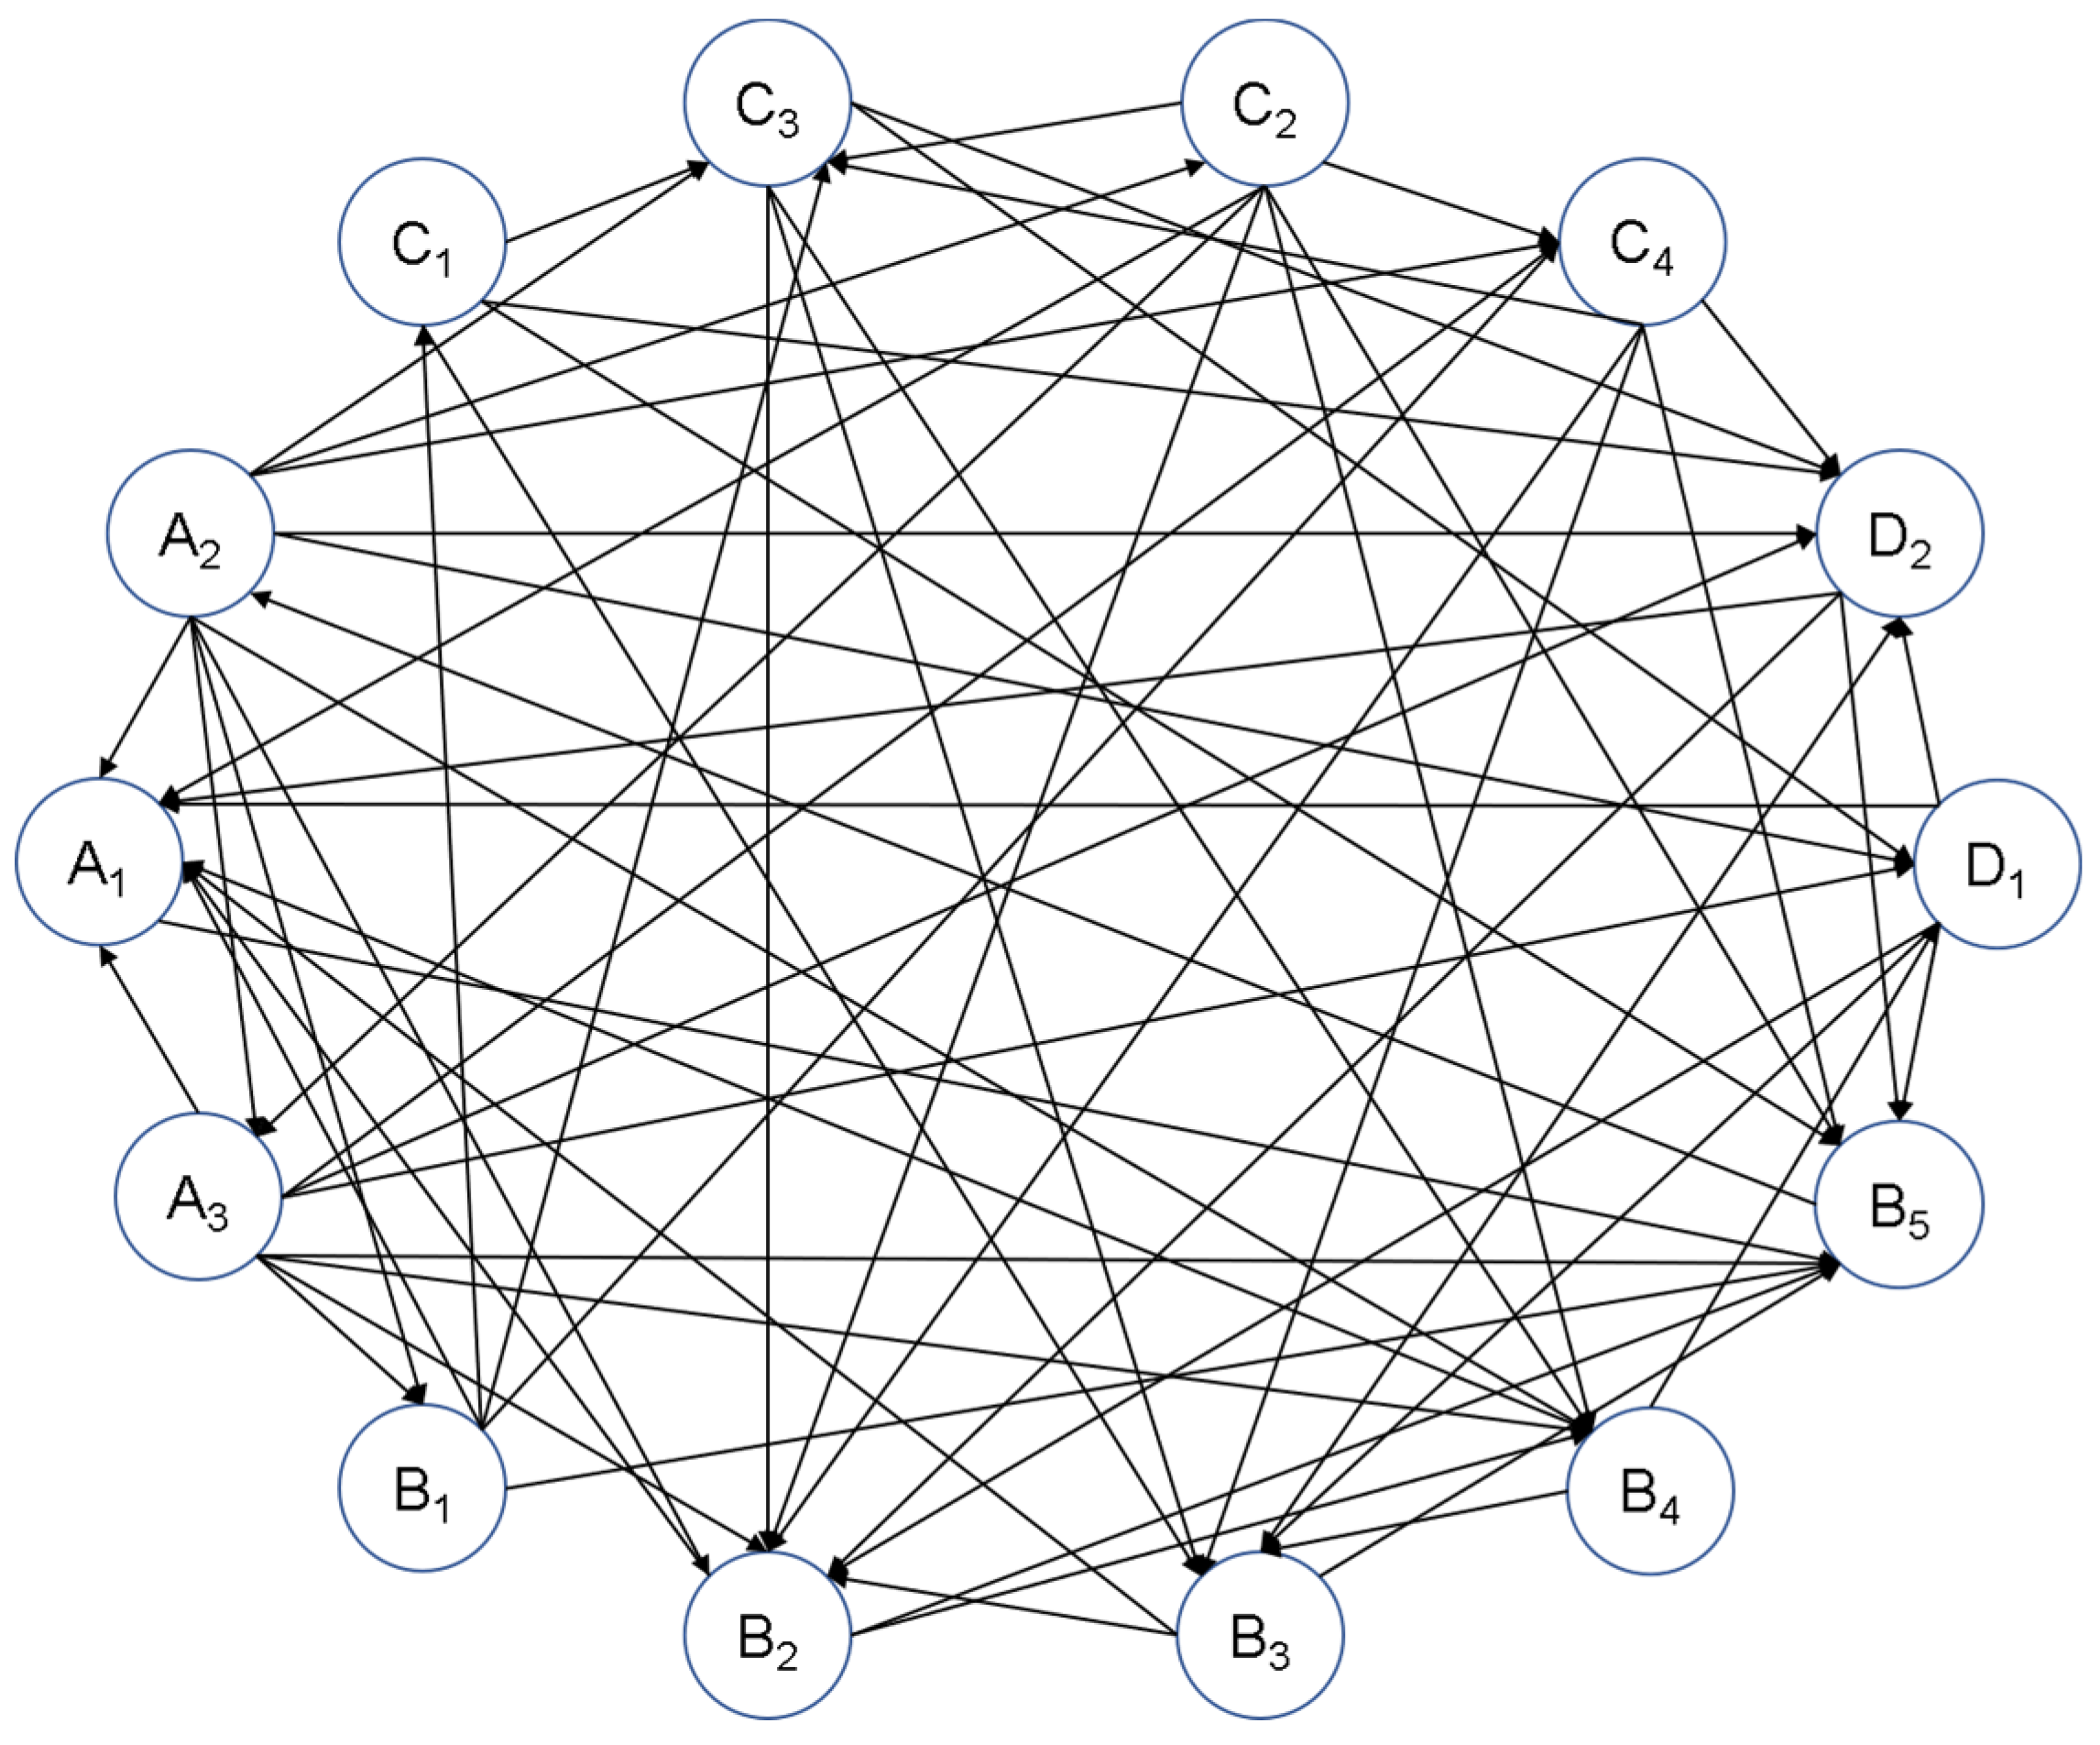
Complex networks employ network nodes to symbolize the individuals within the system, while the links within the network represent the relationships or associations among these individuals. Based on topological knowledge, the structural characteristics and dynamic mechanisms of network systems can be studied [31]. In this context, the suitability indicators are considered as the network nodes. By scrutinizing the inherent relationships among these indicator factors, a complex network is established, as illustrated in Figure 4.
The network features such as node degree, mediator centrality, proximity centrality, clustering coefficient, kernel degree, etc. [31,32,33], are selected as network node indicators to describe the importance of nodes. These node indicators can well reflect the structural characteristics and network status of nodes. However, node importance is also related to the importance of the subsystem in which it is located. When a node is located in a more important subsystem network, the node importance degree is relatively larger. To measure the comprehensive importance of subsystems, network subsystem indicators such as subsystem degree, subsystem nodes proportion, subsystem network density, and subsystem network aggregation (Table 4) are introduced.
- 2.
- CRITIC Method
The CRITIC (Criteria Importance Through Intercriteria Correlation) method is an objective weighting technique that thoroughly evaluates the correlations and distinctions among indicators, thereby minimizing informational overlap. This method assigns weights to each network node indicator. Through the CRITIC method, based on the values of network node indicators and network subsystem indicators, the weight of each node indicator (), and the weight of each subsystem indicator (). The calculation steps and formulas of the CRITIC method refer to the existing research [34], and are not repeated in the study.
On this basis, the comprehensive importance of network nodes () and the comprehensive importance of subsystems () are calculated, as shown in Formulas (3) and (4).
In Formulas (3) and (4), represents the number of network node indicators, represents the total number of network nodes, represents the value of network node indicators, represents the node indicator weight obtained based on the CRITIC method, represents the number of network subsystem indicators, represents the number of subsystems, represents the value of network subsystem indicators, and represents the weight of network subsystem indicators obtained based on the CRITIC method.
Furthermore, and are corrected to obtain the importance of criteria layer indicators and the importance of index layer indicators () in the site selection index system, as shown in Formulas (5) and (6).
In Formulas (5) and (6), represents the number of network nodes of subsystem .
Moreover, the calculation involves determining the base weights of the criteria layer indicators () and the base weights of index layer indicators () in the site selection index system (Table 3). These calculations are executed according to Formula (7) for the criteria layer indicators and Formula (8) for the index layer indicators.
In Formula (7), represents the principal component scores of the site selection index layer indicator , represents the importance of index layer indicators in the site selection index system, and represents the number of site selection index layer indicators.
3.3.3. Ordered Weighted Average Method
Ordered weighted average (OWA) method is a multi-criteria decision-making method that operates by adjusting the decision risk factor to obtain different evaluation results [35]; the decision risk factor is used to express the decision-maker’s decision preferences, and is denoted by the symbol .
When , it means that the decision-maker has no obvious preference, and the analysis of site suitability is transformed into the ordinary weighted superposition analysis of the indicators; when , the greater the base weight of the indicator itself, the greater the order weight, which means that the decision-maker holds a positive attitude and pays more attention to the indicators with a large degree of importance; when , the lower the base weight of the indicator itself, the greater the order weight, which means that the decision-maker holds a conservative attitude and pays more attention to the indicators with a weak degree of importance. Therefore, it is possible to simulate differentiated consideration of the importance of site selection indicators under different scenarios by adjusting different decision risk factors.
After the base weights are ranked, the order weights (Table 5) are determined using the given decision risk factors. Finally, the two are linearly combined to obtain the evaluation results (). The steps are as follows:
In the above formulas, represents the order, represents the sorted base weight, represents the order weight, represents the value of indicator at any geospatial location , represents the number of indicators, represents the decision risk factor, represents the importance level of the indicator, and represents the importance level based on the numerical value of the indicator weight, with the maximum being taken as 1, the next largest being taken as 2, and the smallest being taken as .
4. Results and Analysis
4.1. Scenario Simulation of the Site Selection of the Abandoned Dreg Site
The variation in order weights signifies the shifting priorities and focus of decision-makers regarding site selection for abandoned spoil sites across diverse policy contexts. By modifying the decision risk factor, the order weights of indicators such as construction cost, society, and ecology, natural security and spatial accessibility can be adjusted, thus affecting the combined weights of these indicators. Consequently, this flexibility enriches the decision-making process, rendering it more dynamic and adaptable to changing circumstances. Consequently, the design of different policy scenarios can be realized (Table 6).
When the decision risk factor , it indicates that the decision-maker holds no particular preference, implying that the siting of the abandoned spoil sites is entirely determined by the inherent importance of each indicator factor. This decision-making scenario epitomizes a balanced approach, aiming to harmonize the diverse policy objectives encompassing construction cost, societal and ecological considerations, natural security, and spatial accessibility. Essentially, this balanced decision-making strategy seeks to equitably address and integrate the various critical aspects, ensuring a comprehensive and well-rounded site selection process.
When the decision risk factor transitions from to , it indicates that the decision-maker’s focus shifts from an extreme emphasis on construction cost to an extreme emphasis on spatial accessibility. This sequence of adjustments showcases how decision-makers tailor site selection strategies to align with varying policy orientations. Such dynamic adaptability grants decision-makers the flexibility to modify their approach based on the prevailing policy context, ensuring that site selection decisions are both responsive and versatile. This adaptability is crucial for navigating the complexities of site selection, allowing for a more informed and nuanced decision-making process that can effectively accommodate different policy requirements and environmental considerations.
It is worth noting that when the decision risk factor is extremely skewed towards 0 or infinity, the impact of some indicators can be significantly suppressed. The policy scenarios simulated at this point are too extreme to correspond to actual needs. To avoid this situation and provide practical and feasible siting options, five values of α = 0.8, , α , , and are selected in this study to represent different decision risk preferences, corresponding to policy scenarios focusing on construction cost, comprehensive balance, society and ecology, natural security, and spatial accessibility (Table 6).
Furthermore, the suitability situation of the above scenarios was categorized into five categories using the natural break classification method in ArcGIS 10.2, namely the most suitable region, high suitable region, suitable region, low suitable region, and unsuitable region (Figure 5).
4.2. Analysis of the Suitability for the Site Selection of the Abandoned Dreg Site
The percentage of each suitability region under different policy scenarios can be calculated using the statistical functions of ArcGIS 10.2, as shown in Table 7.
In the scenario where the policy is focused on construction cost, indicators that influence construction expenses, such as terrain curvature, the Topographic Position Index (TPI), and land use type, are prioritized. Following these, the indicators related to society and ecology are also considered significant. Within this policy framework, the areas deemed most suitable for development predominantly span the northwest region of the study area, asserting a principal stance in site selection. The spatial distribution of regions categorized as highly suitable, unsuitable, and marginally suitable is relatively balanced, with each category covering a distinct portion of the study area, thereby reflecting a diverse range of potential sites for consideration under the construction-cost-oriented policy. The regions identified as most suitable for the establishment of abandoned spoil sites occupy the smallest proportion of the study area, predominantly located in the northeastern part and along the southern and northern banks of the central river. These areas feature relatively low-lying topography, and the predominant land cover of grass and shrubs contributes to lower construction costs for the spoil sites. Additionally, their distance from intensely used human areas such as farmlands, residential zones, and public facilities minimizes their social and ecological impact. This remoteness makes them particularly favorable for constructing abandoned spoil sites, as they align with the objectives of reducing disturbances to populated and agriculturally significant areas while also benefiting from the cost-effective and less disruptive land cover for construction.
Under a policy prioritizing social and ecological considerations, site selection is primarily guided by indicators that have significant impacts on society and the environment, with subsequent emphasis on natural security and construction costs. In this scenario, the majority of the study area is categorized as suitable, with the next largest portions being low suitable and unsuitable areas, respectively, and the high suitable regions being relatively scarce. The most suitable areas, despite their optimal conditions, represent the smallest fraction of the landscape. While the overall spatial distribution does not drastically deviate from that observed under the construction-cost-focused policy, subtle shifts are noticeable. There is a slight reduction in the combined extent of the high suitable and most suitable areas, whereas the extent of the low suitable and merely suitable regions see a marginal increase. This adjustment suggests a redistribution favoring areas that, while not optimal, still meet the necessary criteria for social and ecological compatibility. Moreover, this policy enhances the internal connectivity of the suitable regions (excluding the unsuitable areas), which signifies a heightened consideration for the continuity and wholeness of the social and ecological fabric. This increased connectivity indicates a strategic shift towards ensuring that the selected sites contribute positively to the overarching environmental and social landscape, reflecting a comprehensive approach to minimizing ecological disruption and fostering societal well-being.
Under a policy prioritizing natural security, the site selection process predominantly focuses on natural security factors, with subsequent importance placed on social and ecological indicators, followed by spatial accessibility. Under this emphasis, significant changes occur in the spatial distribution of suitability categories within the study area. Notably, a considerable portion of what was previously categorized as a suitable region, particularly in the northwestern part, is reclassified as a high suitable region. This reclassification results in the high suitable category encompassing the largest percentage of the area. Consequently, the extent of both the suitable and low suitable regions diminishes significantly. Although the area classified as the most suitable experiences an increase, it continues to represent the smallest portion of the study area. This most suitable area is primarily located in the northeastern part of the study area and along the northern and southern flanks of the central river. The enhancement of internal connectivity within the suitability regions under this policy signifies a deliberate effort to ensure greater overall coherence and alignment with the natural security focus. This indicates that, while prioritizing natural security, the site selection also robustly considers the continuity and suitability of regions to maintain ecological integrity and reduce vulnerability to natural hazards, thereby supporting a holistic approach to safe and sustainable site development.
Under a policy prioritizing spatial accessibility, the primary emphasis is placed on indicators related to spatial accessibility, specifically the proximity to outlets and roads, which are crucial for the efficient and cost-effective transportation of waste. While natural security factors are still considered important, indicators related to construction costs and social and ecological impacts are accorded lesser priority under this policy orientation. In this scenario, a significant portion of the study area is categorized as most suitable or highly suitable, underscoring a strategic focus on optimizing location advantages and transportation logistics. This reflects a clear preference for sites that offer superior accessibility and logistical convenience. Conversely, the areas designated as merely suitable or unsuitable are comparatively limited, with their presence being more scattered across the study area; the least proportion of the area is allocated to the low suitable category, constituting a mere 5.26%. This distribution pattern highlights a strategic prioritization of sites that maximize spatial accessibility benefits, ensuring that the selected locations support efficient waste management and transportation while aligning with broader policy goals.
Under the comprehensive balance policy, the site selection of the abandoned spoil site is a relatively comprehensive consideration of the influencing factors, with no particular preference for any single policy direction. Under this scenario, the suitability region with the largest share of area in the study area is the high suitable region, followed by the suitable region. When compared to other policy emphases, the spatial distribution and area proportions under the comprehensive balance policy exhibit similarities to those observed in the natural-security-focused policy. However, a notable distinction is the expanded coverage of the suitable region under the comprehensive balance approach, as opposed to the natural security policy, while the extent of the most suitable, low suitable, and unsuitable regions is decreased. This shift in distribution underscores a balanced integration of all influencing factors for site selection, avoiding a skewed emphasis on any particular element. Consequently, this leads to a broader categorization of areas as suitable or highly suitable, with a reduction in the areas classified as either most suitable or unsuitable. Such a balanced suitability zoning reflects a comprehensive and even-handed consideration of various factors, aiming to achieve an optimal and equitable distribution of site suitability across the study area, aligning with a multifaceted and pragmatic site selection strategy.
Based on the comprehensive analysis of the above five policy scenarios, the following can be observed: (1) In addition to the comprehensive balancing policy, with the increase in decision risk factor , the policy orientation has transitioned from a focus on construction cost to a focus on society and ecology, then to a focus on natural security, and finally to a focus on spatial accessibility. (2) The proportion of the most suitable and unsuitable region areas continues to increase, and the zoning characteristics become more prominent. (3) Decision-makers gradually pay less attention to construction cost indicators with higher weights, and pay more attention to spatial accessibility indicators with lower weights. (4) The connectivity and agglomeration within the suitability region continue to increase. (5) Overall, the suitability of the eastern region of the study area is better than that of the western region under different scenarios, and the most-suitable areas are mainly distributed on the north and south sides and northeast of the study area, making it suitable to set up the abandoned dreg sites.
4.3. Post-Processing Analysis
The site selection scenario for the study area is a social and ecological scenario, because the local government of the study area attaches great importance to the ecological environment. On this basis, the combination of multiple methods and GIS-based overlay analysis in this study provided six potential suitable sites in the study area (Figure 6). The results are based on a site suitability zoning map and determined on the basis of a field investigation.
As shown in Figure 6, all potential suitable sites are located in the most suitable areas, close to the slag outlet, with good accessibility, and away from construction land, farmland, rivers, and unfavorable geologic conditions. The results of this study can offer valuable decision-making references for selecting suitable sites for the abandoned spoil areas of the ZW Railway.
5. Discussion
At this stage, the focus of China’s railroad construction gradually shifted to the west. Affected by the complex terrain and geological conditions in the western region of China, a large amount of soil and slag disposal is generated in the process of railroad construction. As one of the important ancillary projects of the railroad, the residues disposal areas can be used to solve this problem. However, due to the vast territory of China, there is a certain degree of difference between different regions in terms of the requirements for dump site selection, i.e., policy scenarios. Therefore, it is of great significance to choose the site of residues disposal areas scientifically according to the local conditions [1,2,3].
Domestic and foreign research on the site selection method of the abandoned landfill is relatively limited, mainly focusing on the determination of the principles and ideas of site selection [1,7,8]. However, there are many studies on the siting methods for similar projects such as landfills. Many studies use a combination of GIS and MCDA methods for landfill siting analysis [9,10,11,16,17,29]. These studies can provide methodological references for the siting of this paper.
This study utilized the principal component analysis method, complex network theory, CRITIC method, and ordered weighted average method in determining the weights, which can combine subjective and objective factors, and fully consider the role of expert experience and objective data, to arrive at more accurate decision-making results. At the same time, based on the GIS platform, we solved the complex spatial location problem and realized the visualization analysis of the decision-making process.
With changes in the decision risk factor of OWA, the importance of site selection indicators undergoes significant shifts. They substantially affect the characteristics of suitability zoning. As the decision risk factor escalates, decision-makers gradually shift their focus from heavily weighted construction cost indicators to those associated with spatial accessibility, which typically have lower weights. Concurrently, there is an increase in connectivity and agglomeration within the suitability regions, reflecting a strategic adjustment to the changing scenario in the decision-making process. It provides room for adjustment in the design of the footprint and volume of the disposal site.
In addition, this study utilized a combination of methods, which incorporates a variety of policy factors into site selection decisions. Some previous studies have also mentioned the impact of the policy environment on site selection, but they have only extracted the site selection impact factors based on local policies [9,10,18,29]. Without considering changes in policies and the generalization of methods, these site selection methods are generally static and have a narrow applicability.
Compared to traditional static site selection evaluations, this study enabled a dynamic decision analysis with multi-scenario simulation. This approach allows for the development of a variety of site selection plans that are responsive to different policy requirements, thereby addressing the limitations of the traditional static evaluation’s one-dimensional nature. Therefore, it has good flexibility and adaptability.
The current study has both practical and research implications. Practically, engineering designers, engineering managers, and governance regulators can use the method proposed in this study to evaluate the suitability of disposal site locations. Moreover, this study contributes to the enrichment of theoretical frameworks and methodological approaches in the site selection domain, specifically tailored for railway waste disposal in mountainous regions. The methodological framework can be adapted to most siting policy scenarios. It can continuously coordinate and design the siting strategy according to the changes in and development of nature, science and technology, and economy and society. And, finally, it is conducive to the realization of the scientific siting of the disposal site and the sustainable development of the external environment.
6. Conclusions
To address the issue where traditional research on waste disposal site selection primarily concentrates on establishing site selection criteria while neglecting the influences of the policy environment, it is essential to develop a scientific suitability evaluation system for the site selection of abandoned spoil sites. This study, recognizing the gap, focuses on identifying the key factors that influence site selection for railway engineering waste disposal sites in mountainous regions. Building on this identification, this study has formulated a comprehensive suitability index system tailored for the site selection process. This index system integrates various pertinent factors. Focusing on a segment of the ZW Railway in Chongqing City as the research subject, this study has incorporated various analytical methods to refine the site selection process for waste disposal sites. It utilizes the principal component analysis method, complex network theory, CRITIC method, and the ordered weighted average method to accurately determine the weights of site selection indicators under different scenarios. Moreover, the suitability of locations for waste disposal sites was evaluated using ArcGIS 10.2, resulting in detailed suitability zoning outcomes.
Under all policy scenarios, the suitability of the eastern part of the study area is better than that of the western part. The most suitable region and high suitable region are characterized by the concentration in the northeastern part of the study area and the southern and northern parts on both sides of the river. While the unsuitable region mainly includes construction land, farmland, rivers, and unfavorable geological conditions in the study area. At the same time, six potential suitable site locations were provided for the study area based on local policy.
In terms of limitations, the study is not all-inclusive and has room for improvement. First, the accuracy of the evaluation results is contingent upon the appropriateness of the chosen indicators and the practicality of the weight determination method. Thus, enhancing and refining the evaluation index system remains a crucial direction for future research. Similarly, the understanding of residues disposal siting scenarios in this study still needs to be deepened. Different policy scenarios may work together to influence the decision of disposal site selection, and a multi-dimensional coupled systematic study of the siting scenarios and related factors will be the focus of further research.
Author Contributions
Conceptualization, Y.L., C.Z. and Z.H.; Methodology, C.Z.; Software, C.Z.; Supervision, Z.H., W.W. and J.H.; Validation, Y.L. and C.Z.; Writing—original draft, C.Z.; Writing—review and editing, Y.L. All authors have read and agreed to the published version of the manuscript.
Funding
This research received no external funding.
Data Availability Statement
The original contributions presented in the study are included in the article, further inquiries can be directed to the corresponding author.
Conflicts of Interest
The authors declare no conflicts of interest.
References
- Zhang, S.; Han, L. Research on Cause Analysis and Prevention Countermeasures of Abandoned Dreg Field Change of Railway Construction Projects. Railw. Stand. Des. 2023, 67, 175–179. [Google Scholar]
- Xiao, W.; Tian, W. Risk Evaluation of Landfills along Highway Based on Material Point Method and Limit Equilibrium Method. J. Catastrophol. 2021, 36, 37–41+59. [Google Scholar]
- Yin, Y.; Li, B.; Wang, W.; Zhan, L.; Xue, Q.; Gao, Y.; Zhang, N.; Chen, H.; Liu, T.; Li, A. Mechanism of the December 2015 Catastrophic Landslide at the Shenzhen Landfill and Controlling Geotechnical Risks of Urbanization. Engineering 2016, 2, 230–249. [Google Scholar] [CrossRef]
- Tian, M.; Zou, Y.; Xiao, A.; Gu, M.; Yin, X. Statistical classification features of particle composition and angle of repose of mountainous highway earth-rock mixed waste slag and its application. Rock Soil Mech. 2022, 43, 469–476. [Google Scholar]
- Jiang, J.; Pan, J.; Cheng, Z.; Xu, H.; Tan, F. Experimental study on mechanical properties of loose spoil considering vertical distribution factor. Chin. J. Rock Mech. Eng. 2022, 41, 631–639. [Google Scholar]
- Li, Y.; Hou, X. Risk Diagnosis and Prediction of Mega-Project Waste Dump Based on Fault Tree and Bayesian Network Integration. J. Syst. Manag. 2022, 31, 861–874. [Google Scholar]
- Wu, Y.; Ruan, B.; Zhang, C.; Zhang, P. Site Selection and Design Method of Waste Dump of Expressway in Southwest Mountainous Area. Highway 2022, 67, 67–74. [Google Scholar]
- Lin, T.; Sun, Z. Rationality of Soil and Water Conservation of Spoil Ground. Soil Water Conserv. China 2022, 2, 47–52. [Google Scholar]
- Huo, P.; Cao, L.; Tian, Y. Application and comparison of AHP and fuzzy evaluation method in landfill siting. Environ. Eng. 2015, 33, 131–135. [Google Scholar]
- Kapilan, S.; Elangovan, K. Potential landfill site selection for solid waste disposal using GIS and multi-criteria decision analysis (MCDA). J. Cent. South Univ. 2018, 25, 570–585. [Google Scholar] [CrossRef]
- Huang, J.; Fu, Z.; Luo, Z.; Liu, X.; Yang, D. Study on suitability zoning for the site selection of landfill in Wuhan City. Environ. Eng. 2015, 33, 105–108+54. [Google Scholar]
- Liu, Y.; Kong, Q.; Esther, W.B. Public preferences for health care facilities in rural China: A discrete choice experiment. Soc. Sci. Med. 2019, 237, 112396. [Google Scholar] [CrossRef] [PubMed]
- Stubager, R. Preference-shaping: An Empirical Test. Political Stud. 2003, 51, 241–261. [Google Scholar] [CrossRef]
- GB 51018-2014; Ministry of Housing and Urban-Rural Development of the PRC, General Administration of Quality Supervision, Inspection and Quarantine of the People’s Republic of China. Code for Design of Soil and Water Conservation Engineering. China Planning Press: Beijing, China, 2014. (In Chinese)
- Karimzadeh, S.; Miyajima, M.; Kamel, B.; Pessina, V. A fast topographic characterization of seismic station locations in Iran through integrated use of digital elevation models and GIS. J. Seismol. 2015, 19, 949–967. [Google Scholar] [CrossRef]
- Khan, M.M.; Vaezi, M.; Kumar, A. Optimal siting of solid waste-to-value-added facilities through a GIS-based assessment. Sci. Total Environ. 2018, 610–611, 1065–1075. [Google Scholar] [CrossRef] [PubMed]
- Sumathi, V.R.; Natesan, U.; Sarkar, C. GIS-based approach for optimized siting of municipal solid waste landfill. Waste Manag. 2008, 28, 2146–2160. [Google Scholar] [CrossRef] [PubMed]
- Wu, Z.; Li, G.; Chen, D.; He, Q.; Zhu, S. Optimal distribution of small-town domestic garbage landfills. Chin. J. Environ. Eng. 2012, 6, 3263–3269. [Google Scholar]
- Perovic, V.; Cakmak, D.; Srbinovic, O.S.; Pavlovich, P.; Simic, S.B.; Matic, M.; Pavlovic, D.; Jaramaz, D.; Mitrovic, M.; Pavlovic, P. A conceptual modelling framework for assessment multiple soil degradation: A case study in the region of Sumadija and Western Serbia. Ecol. Indic. 2023, 148, 110096. [Google Scholar] [CrossRef]
- Zhang, W.; Xie, T.; Liu, B. Rainfall Erosivity Estimation Using Daily Rainfall Amounts. Sci. Geogr. Sin. 2002, 6, 705–711. [Google Scholar]
- Wang, Z.; Ye, L.; Jiang, J.; Fan, Y.; Zhang, X. Review of application of EPIC crop growth model. Ecol. Model. 2022, 467, 109952. [Google Scholar] [CrossRef]
- Liu, B.; Nearing, M.; Shi, P.; Jia, Z. Slope length effects on soil loss for steep slopes. Soil Sci. Soc. Am. J. 2000, 64, 1759–1763. [Google Scholar] [CrossRef]
- Bagarello, V.; Ferro, V.; Pampalone, V. A comprehensive analysis of Universal Soil Loss Equation-based models at the Sparacia experimental area. Hydrol. Process. 2020, 34, 1545–1557. [Google Scholar] [CrossRef]
- Guo, F.; Liu, X.; Mamat, Z.; Zhang, W.; Xing, L.; Wang, R.; Luo, X.; Wang, C.; Zhao, H. Spatiotemporal variations and influencing factors of soil conservationservice based on ln VEST model: A case study of Miyun Reservoir upstream basin of Zhangcheng area in Hebei. Prog. Geophys. 2022, 9, 17. [Google Scholar]
- SL190-2007; Ministry of Water Resources of the PRC. Standards for Classification and Gradation of Soil Erosion. China Water & Power Press: Beijing, China, 2015. (In Chinese)
- Zhang, L.; Li, H.; Gu, C.; Pan, H.; Fu, P. Geological hazard susceptibility assessment based on weighted informationvalue in Yunyang County (The Three Gorges Reservoir Area), Chongqing. Miner. Explor. 2020, 11, 2809–2815. [Google Scholar]
- Li, G.; Tie, Y. Comparative Study on Modeling Methods of Comprehensive Geological Hazard Susceptibility Based on Information Mode. J. Catastrophol. 2023, 38, 212–221. [Google Scholar]
- Mhiret, D.A.; Dagnew, D.C.; Assefa, T.T.; Tilahun, S.A.; Zaitchik, B.F.; Steenhuis, T.S. Erosion hotspot identification in the sub-humid Ethiopian highlands. Ecohydrol. Hydrobiol. 2019, 19, 146–154. [Google Scholar] [CrossRef]
- Kamdar, I.; Ali, S.; Bennui, A.; Techato, K.; Jutidamrongphan, W. Municipal solid waste landfill siting using an integrated GIS-AHP approach: A case study from Songkhla, Thailand. Resour. Conserv. Recycl. 2019, 149, 220–235. [Google Scholar] [CrossRef]
- Chen, S.; Yu, L.; Zhang, C.; Wu, Y.; Li, T. Environmental impact assessment of multi-source solid waste based on a life cycle assessment, principal component analysis, and random forest algorithm. J. Environ. Manag. 2023, 339, 117942. [Google Scholar] [CrossRef] [PubMed]
- Han, Z.; Wang, Y.; Cao, J. Impact of contact heterogeneity on initial growth behavior of an epidemic: Complex network-based approach. Appl. Math. Comput. 2023, 451, 128021. [Google Scholar] [CrossRef]
- Yang, X.; Hu, D.; Zhan, X.; Zhang, Z. A method for identifying and ranking influential spreading nodes in complex networks based on neighborhood core diversity centrality. Chin. High Technol. Lett. 2016, 26, 129–138. [Google Scholar] [CrossRef]
- Kitsak, M.; Gallos, L.K.; Havlin, S.; Liljeros, F.; Muchnik, L.; Stanley, H.E.; Makse, H.A. Identification of influential spreaders in complex networks. Nat. Phys. 2010, 6, 888–893. [Google Scholar] [CrossRef]
- Weng, X.; Yang, S. Private-Sector Partner Selection for Public-Private Partnership Projects Based on Improved CRITIC-EMW Weight and GRA -VIKOR Method. Discret. Dyn. Nat. Soc. 2022, 2022, 9374449. [Google Scholar] [CrossRef]
- Zheng, T.; Chen, H.; Yang, X. Entropy and probability based Fuzzy Induced Ordered Weighted Averaging operator. J. Intell. Fuzzy Syst. 2023, 44, 4949–4962. [Google Scholar] [CrossRef]
Figure 1.
The study area.
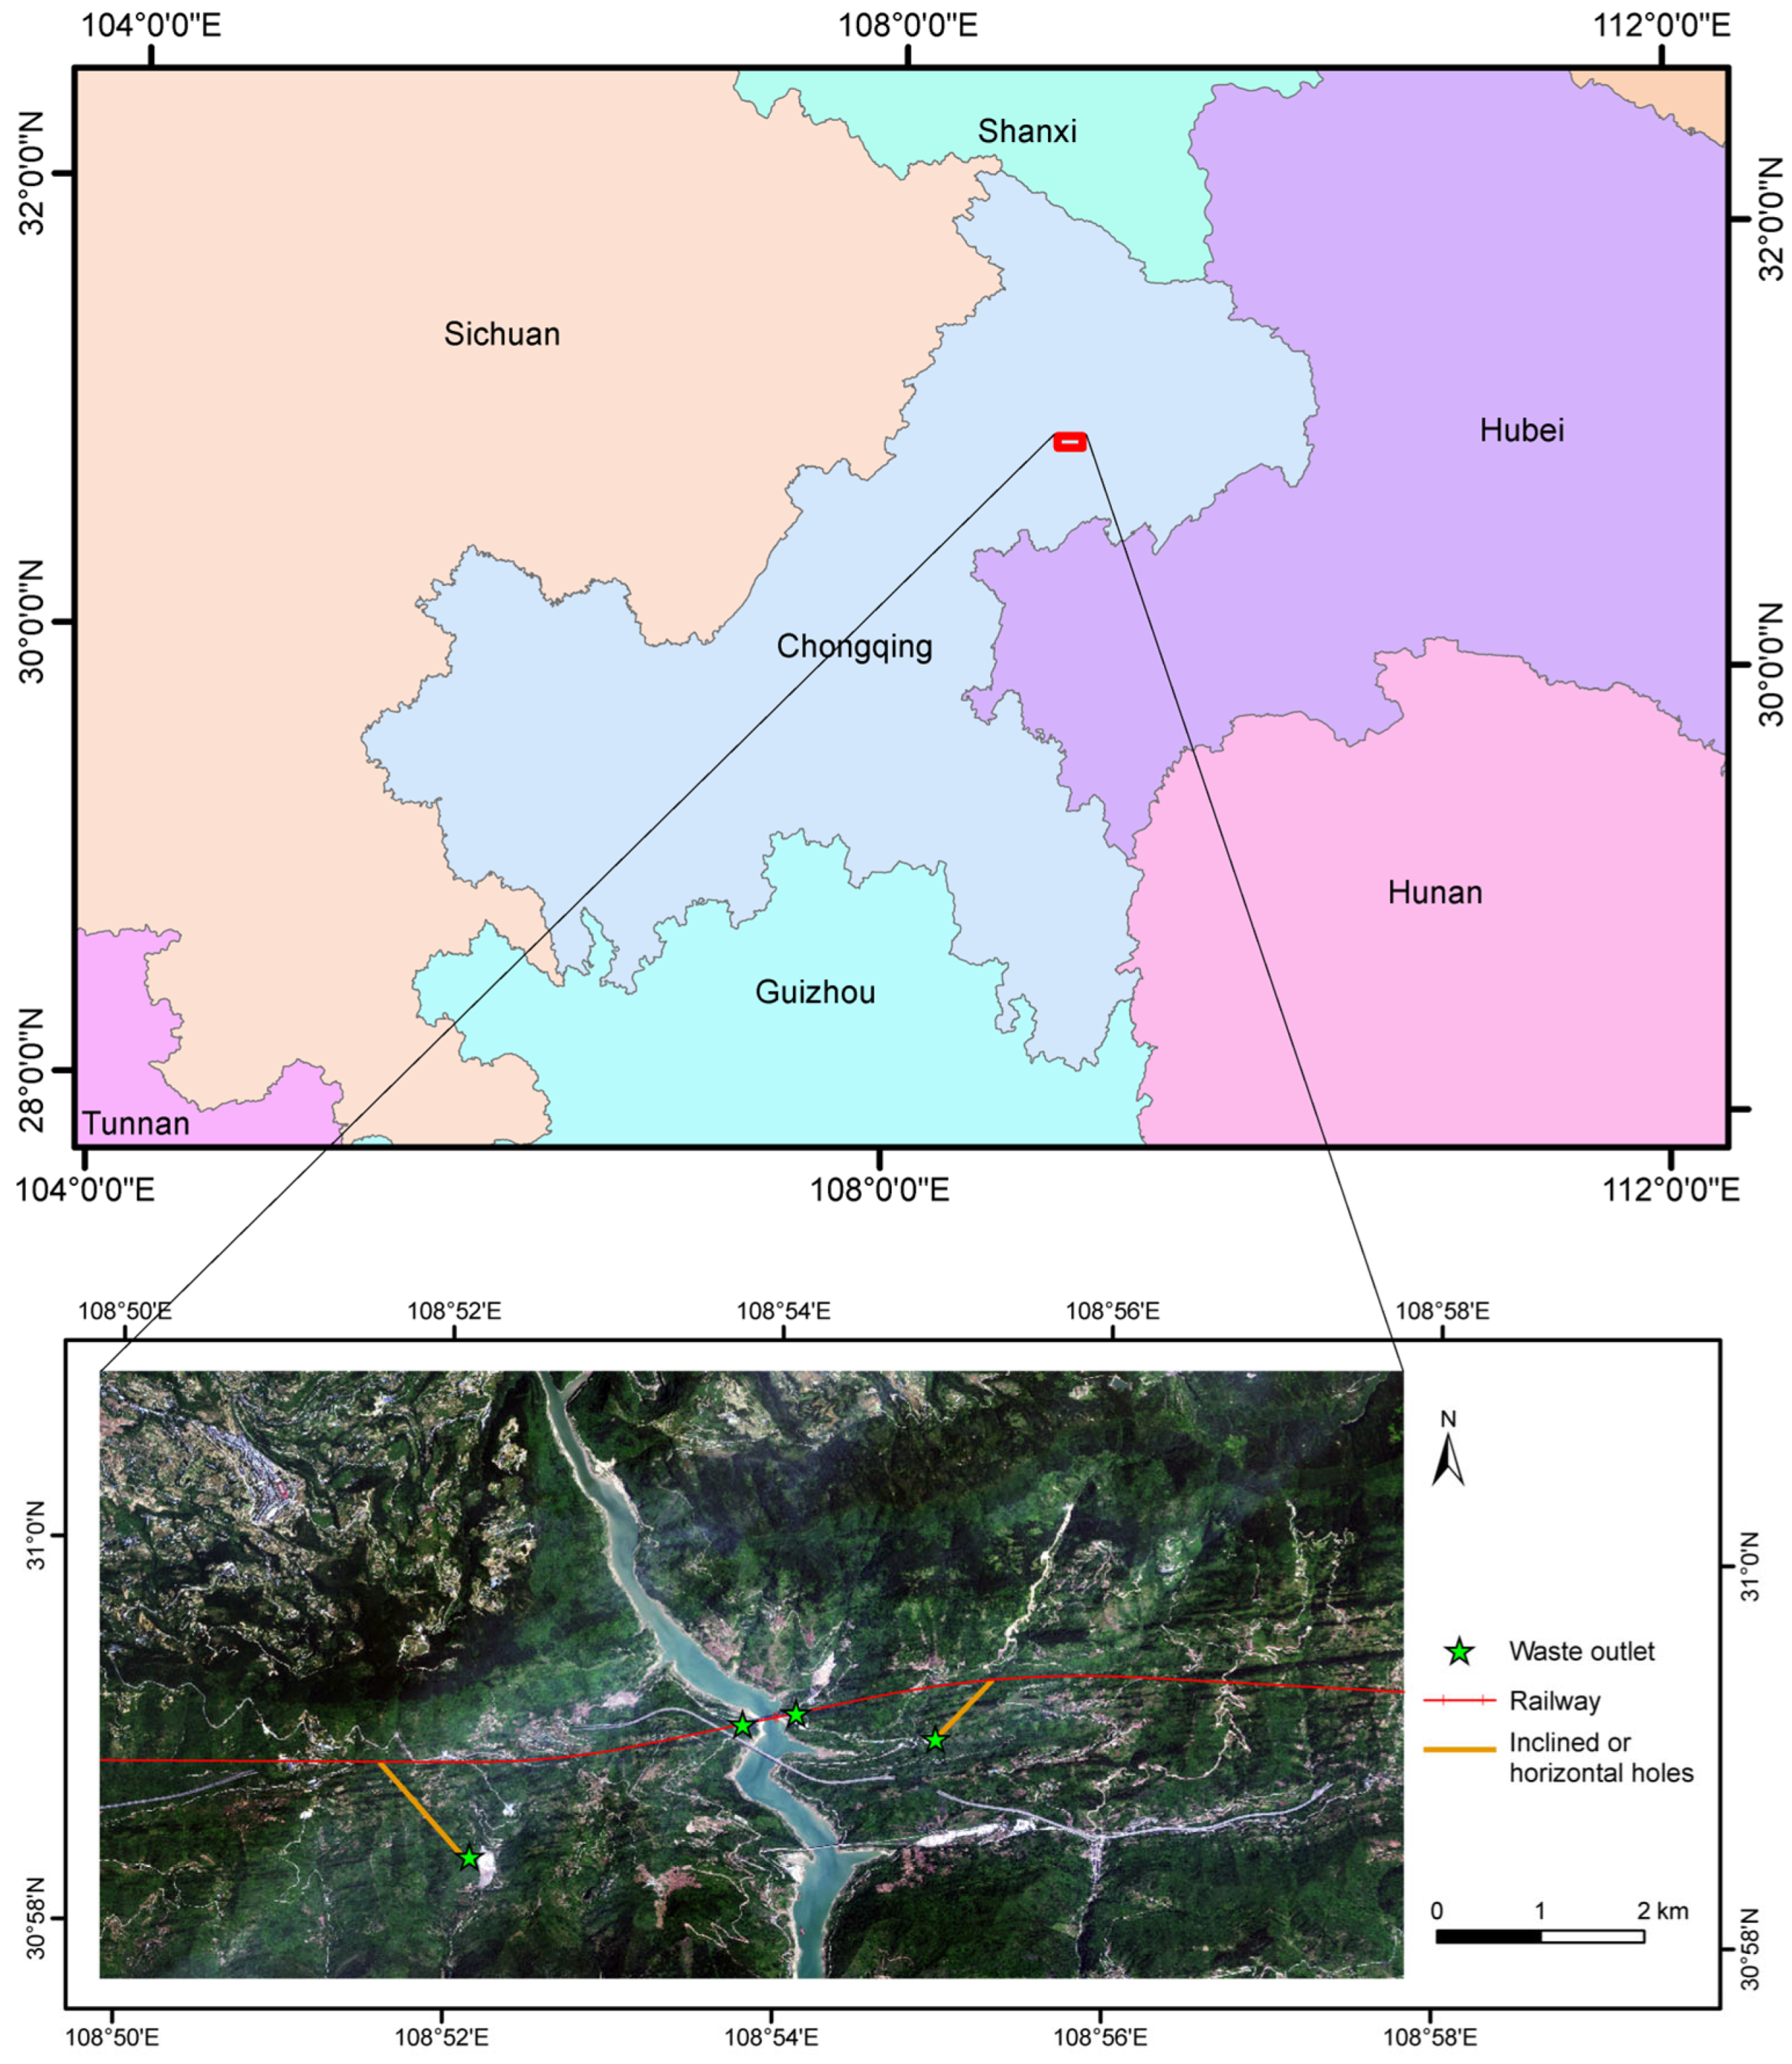
Figure 2.
Technical flow chart.

Figure 3.
Suitability indices for site selection of abandoned dreg field. (a) Land use type. (b) Terrain curvature. (c) TPI. (d) Distance from water system. (e) Distance from residential land. (f) Distance from public facilities. (g) Distance from cropland. (h) Soil erosion intensity. (i) Lithological type. (j) Slope. (k) Distance to adverse geology. (l) SPI. (m) Distance from roads. (n) Distance from waste outlet.

Figure 4.
Complex network of the site selection indicators.

Figure 5.
The suitability division under different policy scenarios. (a) Construction cost type. (b) Social and ecological type. (c) Natural security type. (d) Spatial accessibility type. (e) Comprehensive balance type.
Figure 5.
The suitability division under different policy scenarios. (a) Construction cost type. (b) Social and ecological type. (c) Natural security type. (d) Spatial accessibility type. (e) Comprehensive balance type.

Figure 6.
The potential suitable sites.


Table 1.
Data source.
| Data | Source |
|---|---|
| DEM data | https://www.tianditu.gov.cn/ (accessed on 23 March 2023) |
| Land-use-type data | https://doi.org/10.1016/j.scib.2019.03.002 (accessed on 25 March 2023) |
| NDVI data | https://www.resdc.cn (accessed on 28 March 2023) |
| Rainfall data | https://www.ncdc.noaa.gov (accessed on 28 March 2023) |
| Water system data, residential land data, public facilities data, road network data, stratum lithology data, adverse geology data, rainfall data, soil physical and chemical properties data, adverse geology data, and soil physical and chemical properties data | CAD engineering drawings provided by the project engineering party |
Table 2.
The index system and the normalization method.
| Criteria Layer | Index Layer | Criteria Guideline | Normalized Assignment Method | Attribute * |
|---|---|---|---|---|
| Construction cost | Land use type | Refs. [1,7,8,14] | Water, cropland, impervious surface, 0; forest, 0.3; grassland, shrubland, 0.7; bareland, 1 | + |
| Terrain curvature | Refs. [1,7,8,14] | Normalize | − | |
| TPI | Refs. [14,15] | Normalize | + | |
| Society and ecology | Distance to water system | Refs. [9,11,14,16,17] | <100, 0; 100–500, normalize; >500, 1 | + |
| Distance to residential land | Refs. [9,11,14,17] | <100, 0; 100–500, normalize; >500, 1 | + | |
| Distance to public facilities | Refs. [9,11,14,16] | <100, 0; 100–500, normalize; >500, 1 | + | |
| Distance to cropland | Refs. [14,18] | <100, 0; 100–500, normalize; >500, 1 | + | |
| Soil erosion intensity | Refs. [14,19,20,21,22,23,24,25] | Slight erosion, 1; light erosion, 0.8; moderate erosion, 0.6; strong erosion, 0.4; very strong erosion 0.2; severe erosion, 0 | − | |
| Natural security | Lithological type | Refs. [9,11,14,26,27] | Loose soil, 0; soft rock, 0.3; softer rock, 0.5; harder rock, 0.7; hard rock, 1 | + |
| Slope | Refs. [9,11,14] | <5°,1; 5°–15°, 0.7; 15°–25°, 0.5; 25°–35°, 0.3; >35°, 0 | + | |
| Distance to adverse geology | Refs. [11,14,17] | <200, 0; 200–1000, normalize; >1000, 1 | + | |
| SPI | Refs. [14,28,29] | normalize | − | |
| Spatial accessibility | Distance to road | Refs. [9,11,14,16] | <200, 1; 200–1000, normalize; >1000, 0 | − |
| Distance to waste outlet | Refs. [11,14,16] | <200, 1; 200–10,000, normalize; >10,000, 0 | − |
* The attribute of the indicator is the positive or negative direction of the indicator’s contribution to the system: attribute “+” indicates that the indicator is positive; attribute “−” indicates that the indicator is negative.
Table 3.
Weight of suitability indicators for site selection of abandoned dreg site.
| Criteria Layer | Index Layer | ||||
|---|---|---|---|---|---|
| Construction cost | 0.390 | Land use type | 0.018 | 0.103 | 0.028 |
| Terrain curvature | 0.121 | 0.114 | 0.211 | ||
| TPI | 0.133 | 0.074 | 0.151 | ||
| Society and ecology | 0.329 | Distance to water system | 0.100 | 0.021 | 0.033 |
| Distance to residential land | 0.100 | 0.081 | 0.124 | ||
| Distance to public facilities | 0.088 | 0.062 | 0.083 | ||
| Distance to cropland | 0.072 | 0.075 | 0.082 | ||
| Soil erosion intensity | 0.006 | 0.093 | 0.008 | ||
| Natural security | 0.148 | Lithological type | 0.149 | 0.029 | 0.065 |
| Slope | 0.009 | 0.053 | 0.007 | ||
| Distance to adverse geology | 0.086 | 0.036 | 0.047 | ||
| SPI | 0.036 | 0.052 | 0.029 | ||
| Spatial accessibility | 0.133 | Distance to road | 0.052 | 0.112 | 0.089 |
| Distance to waste outlet | 0.031 | 0.094 | 0.044 |
Table 4.
Indicators of network subsystem.
| Subsystem Indicators | Formulas * |
|---|---|
| Subsystem degree | |
| Subsystem nodes proportion | |
| Subsystem network density | |
| Subsystem network aggregation |
* is the number of directed edges starting at the nodes within the subsystem ; is the number of directed edges ending at the nodes within the subsystem ; is the total number of network nodes; is the number of nodes of the subsystem network ; is the number of connected edges between the nodes within the subsystem network .
Table 5.
Result of the ordered weight.
| 1.000 | 0.912 | 0.632 | 0.250 | 0.160 | 0.000 | |
| 0.000 | 0.053 | 0.204 | 0.250 | 0.330 | 0.028 | |
| 0.000 | 0.025 | 0.112 | 0.250 | 0.320 | 0.320 | |
| 0.000 | 0.010 | 0.051 | 0.250 | 0.190 | 0.651 |
Table 6.
Typical site selection scenarios.
| Type | Scenario Description |
|---|---|
| Construction cost type | Establish the concepts of cost reduction and efficiency, priority should be given to selecting concave terrain such as gourd shaped and bowl shaped for the layout of waste disposal areas. and reduce the unnecessary cost consumption arising from the construction process. |
| Social and ecological type | Focusing on the social and ecological benefits brought about by the construction of the project, and adhering to the concept of green and environmental protection, the project design and construction should avoid adverse impacts on the economy and society and the ecological environment. |
| Natural security type | Scientific assessment of the topographic environment and geological conditions of the project area is carried out at the stage of investigation and design of the project, to reduce the potential risks of geologic hazards during the construction and operation phases of the project. |
| Spatial accessibility type | Ensure the spatial accessibility and traffic convenience of the geographic location of the disposal sites to reduce the transportation cost of the slag and soil disposal. |
| Comprehensive balance type | Consider the impact of all factors in an integrated and comprehensive manner. |
Table 7.
Result of suitability region under different policy scenarios.
| Suitability Region | Construction Cost Type | Social and Ecological Type | Natural Security Type | Spatial Accessibility Type | Comprehensive Balance Type |
|---|---|---|---|---|---|
| Unsuitable region | 19.27% | 19.27% | 19.47% | 19.61% | 19.27% |
| Low suitable region | 18.66% | 19.46% | 15.09% | 5.26% | 14.87% |
| Suitable region | 30.00% | 30.87% | 21.05% | 21.26% | 22.45% |
| High suitable region | 19.94% | 18.08% | 29.98% | 26.73% | 29.98% |
| Most suitable region | 12.13% | 12.33% | 14.41% | 27.14% | 13.43% |
Disclaimer/Publisher’s Note: The statements, opinions and data contained in all publications are solely those of the individual author(s) and contributor(s) and not of MDPI and/or the editor(s). MDPI and/or the editor(s) disclaim responsibility for any injury to people or property resulting from any ideas, methods, instructions or products referred to in the content. |
© 2024 by the authors. Licensee MDPI, Basel, Switzerland. This article is an open access article distributed under the terms and conditions of the Creative Commons Attribution (CC BY) license (https://creativecommons.org/licenses/by/4.0/).
Share and Cite
MDPI and ACS Style
Li, Y.; Zeng, C.; Han, Z.; Wang, W.; Huang, J. Suitability of Site Selection for Mountain Railway Engineering Spoil Disposal Areas from a Multi-Scenario Perspective. Buildings 2024, 14, 1184. https://doi.org/10.3390/buildings14041184
AMA Style
Li Y, Zeng C, Han Z, Wang W, Huang J. Suitability of Site Selection for Mountain Railway Engineering Spoil Disposal Areas from a Multi-Scenario Perspective. Buildings. 2024; 14(4):1184. https://doi.org/10.3390/buildings14041184
Chicago/Turabian StyleLi, Yange, Cheng Zeng, Zheng Han, Weidong Wang, and Jianling Huang. 2024. "Suitability of Site Selection for Mountain Railway Engineering Spoil Disposal Areas from a Multi-Scenario Perspective" Buildings 14, no. 4: 1184. https://doi.org/10.3390/buildings14041184
Note that from the first issue of 2016, this journal uses article numbers instead of page numbers. See further details here.