

The Quantification of Carbon Emission Factors for Residential Buildings in Yunnan Province
by
 ,
,
Wuyan Li
1,
Qinyao Li
1,
Chubei Zhang
1,
Sike Jin
2,
Zhihao Wang
1,
Sheng Huang
1 and
Shihan Deng
1,* 1
Yunnan Key Laboratory of Disaster Reduction in Civil Engineering, Faculty of Civil Engineering and Mechanics, Kunming University of Science and Technology, Kunming 650500, China
2
School of Civil Engineering and Architecture, Taizhou Vocational and Technical College, Taizhou 318000, China
*
Author to whom correspondence should be addressed.
Buildings 2024, 14(4), 880; https://doi.org/10.3390/buildings14040880
Submission received: 15 January 2024
/
Revised: 14 March 2024
/
Accepted: 21 March 2024
/
Published: 25 March 2024
(This article belongs to the Special Issue Sustainable Building Technology and High-Performance Building Engineering)
Abstract
:The carbon emissions released from buildings are correlated with various factors in social and economic systems. Thus, quantifying and then controlling those factors can decrease the release of carbon emissions further. To quantify the influencing factors of the carbon emissions of residential buildings in Yunnan Province in China, separately for urban and rural areas, this study adopted the methods of utilizing the carbon emission factor and the LMDI model and combined them with the carbon emissions data obtained from 2010 to 2019. Subsequently, with this model, the contribution of each factor to the overall carbon emissions was quantified. The results demonstrate the following: (1) the main factors influencing carbon emissions from residential buildings include the per capita floor area, energy consumption per unit area, energy intensity effect, energy structure effect, urbanization rate, and population size. (2) For urban buildings, carbon emissions are negatively correlated with the energy consumption per unit area, energy intensity effect, and energy structure effect, with contribution values of 0.34, 0.27, and 0.05, respectively. Conversely, there is a positive correlation with the per capita floor area, urbanization rate, and population size, with contribution values of 0.23, 0.11, and 0.01, respectively. (3) For rural buildings, carbon emissions are negatively correlated with urbanization rate, energy intensity effect, and energy structure effect, with contribution values of 0.16, 0.15, and 0.14, respectively. Conversely, there is a positive correlation with the per capita floor area, energy consumption per unit area, and population size, with contribution values of 0.29, 0.24, and 0.02, respectively.
1. Introduction
With the rapid development of the economy and society, the pace and magnitude of climate change have far surpassed human expectations. Over the past century, Earth has witnessed the most significant manifestations of global warming in history. Currently, extensive discussions concerning the various social and environmental issues triggered by global warming are being conducted. To address this pressing concern, the World Meteorological Organization (WMO) and the United Nations Environment Programme (UNEP) have established the Intergovernmental Panel on Climate Change (IPCC). Since its inception, the IPCC has released six assessment reports on environmental matters, primarily focusing on the challenges posed by climate warming. In 1992, the United Nations Framework Convention on Climate Change was adopted, providing a foundation for the implementation of relevant agreements by various countries worldwide.
In recent years, China has emerged as a leading contributor to global carbon emissions. Since 2009, China has been releasing more than six billion tons of carbon dioxide into the atmosphere annually, surpassing the United States as the world’s largest carbon emitter by 2016 [1]. Consequently, China is, at present, confronted with formidable challenges concerning energy scarcity, population growth, and environmental preservation. To align their habits with international expectations and the demands of the era, energy conservation and carbon reduction have become paramount concerns. In 2020, during the United Nations General Assembly, China pledged to achieve a carbon peak by 2030 and carbon neutrality by 2060. China’s rapid urbanization process in recent years has propelled the construction industry’s growth. Unfortunately, this development has created various challenges, such as high energy consumption, significant carbon emissions, and low energy efficiency. The construction sector presently accounts for roughly 40% of global energy usage, with building-related carbon emissions constituting 36% of China’s total emissions [2,3]. Alarming reports indicate that, in 2018 alone, China’s operational buildings were responsible for 21.9% of the nation’s total energy consumption, with residential structures alone contributing to over 60% of carbon emissions. Given the current state of the construction industry, achieving energy efficiency and emissions reduction play crucial roles in meeting the 2030 and 2060 targets. The research suggests that the construction sector possesses a carbon reduction potential of 74%, surpassing other industries [4]. Given the severity of the situation in the construction industry, the adoption of energy conservation and emission reduction measures will make a significant contribution to the early success of China’s proposed carbon peak by 2030 and carbon neutrality by 2060.
The accurate prediction and calculation of future carbon emissions play pivotal roles in shaping effective policies and planning for future developments, thereby making a substantial contribution to the achievement of the “30/60” goal. Recognizing the significance of this endeavor, it is imperative to prioritize the prediction and calculation of carbon emissions.
Carbon emissions accounting serves as the foundational prerequisite for efficiently undertaking diverse carbon emission reduction initiatives and fostering a transition towards creating a green economy. It constitutes a crucial aspect of an active engagement in international climate change negotiations. Directly quantifying carbon emissions data, carbon emissions accounting analyzes each link in the process, identifying potential areas for emission reductions and strategies. This process is integral to achieving the “30/60” goal. Presently, three internationally acknowledged models for carbon emissions accounting exist: the emission factor, mass balance, and measured methods.
In 1996, the IPCC introduced the initial method for estimating carbon emissions, known as the IPCC factorial inventory method (IPCC-FIM), which remains the most widely employed approach to date. Subsequently, in 2006, the IPCC devised a corresponding set of activity data and carbon emission factors for each emission source based on the carbon emissions inventory list. Multiplying these two factors produces the estimated value of carbon emissions. The fundamental principle underlying the material balance algorithm is the conservation of mass, asserting that the level of input equals the level of output. This method effectively reflects the actual emissions of the measured location. The measurement technique relies on primary data acquired from field measurements of the emission source, with relevant carbon emissions calculated using the aggregation method. While this method yields precise results with minimal intermediary steps, it is challenged by the difficulty and expense associated with the data acquisition process [5]. Table 1 presents a comparative overview of the carbon emissions accounting methods.
As indicated by the comparative analysis presented in Table 1, the material balance method is commonly employed in research for calculating the level of emissions released in industrial production processes and can serve as a means to verify the accuracy of the results obtained through the use of other methods. On the other hand, the measured method is more applicable to natural emission sources characterized by small areas, simple emission sources, and the availability of firsthand detection data. Consequently, both the material balance and measured methods may not be well-suited for carbon emissions accounting in the construction sector. In contrast, the IPCC Factorial Inventory Method (IPCC-FIM) finds widespread application in the computation of carbon emissions associated with energy consumption.
In response to this issue, researchers have undertaken comprehensive studies to investigate the characteristics of changes in carbon emissions, the influencing factors, the underlying mechanisms, and the contribution rates of diverse energy sources. Presently, various methods are extensively utilized for the identification and analysis of factors influencing carbon emissions from buildings. Notably, the index decomposition method, IPAT model, and structural decomposition method stand out as effective and practical approaches [6,7]. In this study, the identification and analysis methods used for influencing factors of building carbon emissions, as delineated in Table 2, are compared with the aforementioned three methodologies, drawing upon relevant information and literature.
At present, the analysis of the influencing factors of carbon emissions in the construction industry can be divided into the following two categories: the first is to calculate carbon emissions by using the carbon footprint calculation method (I-O method) and then decompose and analyze the influencing factors by using the structure decomposition analysis (SDA) after obtaining the accounting results. The second method is to perform calculations according to the macro-statistical data of relevant departments and then use the logarithmic mean Divisia index (LMDI) decomposition method or relevant models, such as IPAT series and STIRPAT models, to analyze the relevant influencing factors [8].

Table 2.
Identification and analysis methods for influencing factors of building carbon emissions.
| Model | Tool | Description | Field | Reference |
|---|---|---|---|---|
| Exponential decomposition method | Dillard and Laplace index methods [6]—LMDI (I and II) | Less requirements, simple, solves 0 and negative problems [7], analyzes direct effects | The influence of economy, energy issues, and factors on changes in energy consumption levels | Reema et al. [9,10,11,12] |
| IPAT series model | STIRPAT model; Kaya | Improved effectiveness and reliability; cannot analyze indirect effects | Quantitative description of human driving force and environmental pressure | Cong et al. [13,14,15,16,17] |
| Structure decomposition method | Tree structure, matrix decomposition, flowchart | Indirect and direct effects can be analyzed | Economic growth factors, labor, prices, energy | Leontief et al. [18,19,20,21] |
According to the comparison of the centralized methods presented in Table 2, it can be observed that the decomposition methods of each factor present both advantages and disadvantages. According to this practical problem, in order to produce more reliable and rigorous results, most researchers generally combine the decomposition methods of these factors. For example, in a study, Qi [2] combined the Kaya identity factor in the IPAT model with the input–output method. Li et al. [22] used the extended Kaya identity factor in the IPAT and STIRPAT models. Sun et al. [23] combined the Kaya identity factor in the LMDI and IPAT models with the Tapio decoupling index method in the exponential decomposition method. In another study, Tseng [24] used the LMDI to decompose the carbon emission factors of Inner Mongolia, China, developed the decoupling index, and analyzed the factors to assess the decoupling status. On the whole, it is more common for scholars to combine the IPAT model with the LMDI in the exponential decomposition method. The main reason for this step is that the LMDI solves any remaining problems in decomposition scenarios and the problem of obtaining 0 negative values in the data. Moreover, the IPAT model can improve the validity and reliability of the estimation results. In view of this fact, according to the analysis of China’s construction industry, it can be determined that this method is more suitable for the current status of China’s construction industry.
In light of the summarized decomposition method used for determining the influencing factors of carbon emissions, we obtained qualitative results. However, with the amalgamation of influencing factors with the logarithmic mean Divisia index (LMDI), a quantitative comparison of the impacts of various factors on carbon emissions becomes feasible. Thus, in this study, employing this integrated approach, according to the existing research, it can be observed that China lacks the use of quantitative methods for measuring carbon emissions released from residential buildings. The distinctive climate of Yunnan Province in China, characterized by its low-latitude plateau and mild conditions, engenders unique living habits and practices among its residents. Consequently, it can be observed that carbon emissions released from residential buildings in Yunnan Province exhibit variations when compared to other regions. Aligned with the relevant policies [25,26,27] and amid rapid economic development and an escalating urbanization rate, the construction sector has substantially contributed to the surge in carbon emissions. Finally, from the perspective of energy structure, although Yunnan Province has long been dominated by the coal industry, it is a region with a high total carbon sink, and the overall energy intensity is not high. Yunnan Province is one of the pioneering low-carbon pilot cities in China, emphasizing the paramount importance of energy conservation and emission reduction initiatives.
2. Methodology
In order to predict the carbon emissions of Yunnan Province, this study first analyzed the energy consumption and carbon emission levels of residential buildings in Yunnan Province because no statistical data on building energy consumption levels in China’s Energy Statistical yearbook were available. This study adopted the method based on the energy balance table proposed by Hou et al. [28], in which the energy balance table for Yunnan Province (physical quantity) was selected to calculate the energy consumption level of each department. When quantifying the carbon emissions levels of residential buildings in Yunnan Province, the carbon IPCC-FIM was adopted. The development trends of energy consumption and carbon emissions levels of these residential buildings were subsequently analyzed. Then, the LMDI model was established based on the Kaya identity, and the factors leading to the change in carbon emissions released from residential buildings in Yunnan Province were thoroughly explored. Finally, the influencing factors and trends were determined. The flowchart representing the process adopted for this study is presented in Figure 1.
2.1. IPCC Factorial Inventory Method (IPCC-FIM)
At present, the carbon IPCC-FIM is the most widely used method for the purpose of carbon emissions accounting. It is calculated according to the basic equation of carbon accounting provided by the IPCC: greenhouse gas (GHG) emissions = activity data (AD) × emission factor (EF). This method is applicable to the macro-accounting levels of countries, provinces, and cities. According to the comparative analysis presented in Table 1, it can be concluded that neither the material balance algorithm nor the measured method is suitable for carbon emissions accounting in the construction field. Therefore, this study adopted the IPCC-FIM to successfully quantify the carbon emissions of residential buildings.
2.2. Determination of Carbon Emission Factors
The decomposition method used for analyzing the influencing factors of carbon emissions commonly relies on the Kaya identity framework, originally proposed by Kaya in 1988. This identity dissects the elements contributing to variations in carbon emissions into components, such as energy consumption, carbon emissions, economic factors, and population. Subsequently, the Kaya identity framework was expanded to incorporate additional dimensions, including carbon emission factors, energy structure, energy intensity, GDP, and population. In this study, the LMDI model in the index decomposition method was adopted to decompose the factors affecting the residential buildings under study.
To enhance the scientific and rational selection of carbon emission factors for residential buildings, this study employed the IPCC factorial inventory method (IPCC-FIM) to calculate the carbon emissions produced from 2010 to 2019. Subsequently, the study compiled and summarized the relevant influencing factors from the existing literature [7,14,29,30,31,32,33,34,35,36,37,38,39,40,41]. Through a detailed analysis of the sources, compatibility of research content and methodologies, as well as the frequency of each factor, this study identified the characteristics of carbon emissions from residential buildings. Building upon this stage, a logarithmic mean Divisia index (LMDI) model based on the Kaya identity framework was established, considering three pivotal aspects: social development, construction, and energy. The research method included a thorough investigation of factors influencing the changes in carbon emissions released from residential buildings post-2010. This study thus aimed to provide an in-depth analysis of the key factors influencing CO2 emissions as a result of energy consumption in the studied region.
The construction sector is one of the three major sectors that produce carbon emissions. After summarizing and analyzing the existing research, we determined that relevant scholars studied the influencing factors of building carbon emissions from different perspectives according to different models and analysis methods [24,42,43]. Table 3 presents the influencing factors of CO2 analyzed using the LMDI method and the LMDI decomposition model selects population, GDP, energy intensity, and energy structure as the four carbon emission decomposition factors [44,45]. Finally, this study combined the specific factors concerning Yunnan Province to determine the level of carbon emissions. The key factors affecting building carbon emissions were divided into six areas and presented in Table 3.
2.3. LMDI Decomposition Method
The exponential decomposition analysis was proposed by Ang and Zhang (2000) [46], and it has since been widely used to perform “decomposition analysis” or “factorization analysis”. Since some defects are present in the exponential decomposition analysis approach, an alternative method that produces decomposition results without leaving out the remaining terms has been established and is suitable for use in situations that involve many factors or influences. Prior to 1990, the decomposition analysis was mainly based on the concept of the Raspel index. In the 1990s, there was a gradual shift to the use of the Divisia index or, more specifically, to the arithmetic mean division index (AMDI) method proposed by Boyd et al. (1988) [47]. Since 2000, the most popular IDA method in the field is the log-average division index (LMDI).
The LMDI decomposition method is a branch of the IDA (index decomposition analysis). Its characteristics include a full decomposition ability, no residual errors, easy use, and unique results. The IDA was first used by researchers to perform an industrial electricity analysis in the early 1980s and has since been widely used for energy and emissions research. A review of studies conducted on the use of the IDA shows that the share of articles using the LMDI decomposition method has been increasing, a trend that suggests that the LMDI may further increase its dominance in the field over time. Therefore, this study selected the LMDI factor decomposition method to analyze the driving degree of the influencing factors on civil building carbon emissions.
- Computing method:
LMDI decomposition methods include two different types: LMDI-I and LMDI-II. The difference between the two methods is the weight formula used. Therefore, in general applications, there is no strong preference for one method, but, in some specific applications, subtle differences between the LMDI-I and LMDI-II can be observed, and these differences can determine the user’s choice. According to the existing literature, LMDI-I is more widely used than LMDI-II, partly because it has a simpler formula.
- 2.
- Decomposition program:
Once either the aggregate metric (quantity or strength) or the decomposition analysis procedure (addition or multiplication) has been selected, the results produced using LMDI-I and LMDI-II are quite similar. For LMDI-I and LMDI-II, the decomposition analysis problem can be expressed by either an addition or multiplication approach. The addition decomposition analysis is generally used to decompose the arithmetic (or difference) change in an aggregate indicator (such as total energy consumption), and the aggregate change and decomposition results are presented in physical units, which are applicable to the decomposition of the total indicator, such as total energy consumption. In the multiplicative decomposition analysis, the ratio change in the aggregate index is decomposed and the result is represented by an exponent [48]. However, for the determination of base year data, the addition model is more convenient [49].
- 3.
- Aggregate index:
The LMDI includes both quantity and intensity indexes. The quantitative indicator measures the absolute level of energy consumption and, when decomposing the change in the quantitative indicator, separately specifies the activity effect and estimates its impact on energy consumption levels. The strength indicator has the connotation of “energy efficiency” but does not include this definition. The choice to use quantitative and intensity indicators may be independent of the choice to employ the decomposition method, and, in some cases, the context of the study determines the preferred type of indicator. For example, when observing the changes in carbon dioxide emissions, quantitative measures are more likely to be adopted, while studies focusing on “energy productivity” may prefer to use intensity measures.
Since our research was mainly concerned with carbon emissions, it was more suitable to use the LMDI-I addition decomposition model to separate the influencing factors of total carbon emissions after performing a comparative analysis. The overall idea of the LMDI decomposition method is as follows [6,43,50]:
Suppose V is the target variable, xn is a variable that affects V, and each variable has i branches [7]:
Suppose that V varies between and during the time period 0-T; the total change can be decomposed into:
The multiplication decomposition form is:
Formulas (2) and (3) can be further decomposed as follows:
The addition decomposition form is as follows:
The multiplicative decomposition form is as follows:
2.4. Evaluated Model of the Carbon Emission Factor
This study combined the LMDI index decomposition method and combined with the research object: residential buildings in Yunnan province. The decomposition model of residential buildings carbon emissions in Yunnan Province and their carbon emissions characteristics was comprehensively constructed. The source of relevant data for carbon emissions was obtained from the previous section in this study, and the measurement period ranged from 2010 to 2019 according to the actual situation. The relevant expression is as follows:
where subscript i represents different forms of energy, such as coal, oil, and natural gas; z represents urban residential buildings; and r represents rural residential buildings. This refers to the quantification of different factors, such as energy intensity, and the factors affecting energy intensity include coal, oil, and natural gas, where i refers to the factors affecting the energy intensity, and Y is the specific quantification of these influencing factors. In order to clarify the relationship between the relevant variables, refer to Table 4.
As the addition decomposition in the LMDI is used for the decomposition of influencing factors, total carbon emissions are regarded as the comprehensive change effect and expressed by . The carbon emissions for the base period are set as . The carbon emissions value for period t is ; the formula is as follows:
The comprehensive change effect of civil buildings is:
Taking urban residential buildings as an example, we further decomposed the formula, and the contribution value expression of each factor is as follows:
where N = Y, U, A, M, D, P; i = z, c, i.
If a value of 0 is obtained, replace it with a minimum value, which does not affect the decomposition result. This study used a value of 10−10. The decomposition of rural residential buildings was similar to that of urban residential buildings.
The abovementioned factors were classified into the following six categories according to their meanings:
- (1)
- Energy intensity effect, , indicates the impact of the carbon dioxide emission coefficient on carbon emissions. Since the emissions factor of fossil energy in the study remained unchanged, the change generated by this effect was mainly attributed to the change in the annual power carbon emission factor, that is, the change in carbon emissions caused by the factors of power generation efficiency and power generation structure;
- (2)
- Energy structure effect, , indicates the impact of various energy consumption levels on building carbon emissions;
- (3)
- Building area energy intensity, , indicates the change in carbon emissions caused by the energy consumption per unit area;
- (4)
- Per capita building area effect, , indicates the change in building carbon emissions caused by a population increase or decrease per unit of residential building area;
- (5)
- Urbanization effect, , indicates the change in building carbon emissions caused by a city in the process of urbanization;
- (6)
- Population size effect, , indicates the impact of building carbon emissions caused by the factors of population growth or reduction;
2.5. Calculation Method for Carbon Emission Contributions
In order to obtain the influence degree of each factor on the total effect, the cumulative contribution rates of each factor were calculated separately. First, the absolute values of the carbon emissions of the influencing factors obtained using the LMDI-I additive decomposition model used in this study were calculated, and then the total effect was determined by summing all the factors. Finally, the contribution rates of the six influencing factors were calculated, and the calculation formula employed is as follows:
where X = Z, R, where Z represents urban buildings and R represents rural buildings. N = Y, U, A, M, D, P. I represents the cumulative contribution of each influencing factor to the total effect.
3. Results and Discussion
According to the direct data obtained from the relevant statistical systems, such as the China Statistical Yearbook and China Urban and Rural Construction Statistical Yearbook, the gross area of residential buildings in Yunnan Province was calculated by consulting the relevant documents and yearbooks, and then, according to the energy balance sheet, the IPCC-FIM was used to calculate the total carbon emissions from residential buildings’ energy consumption levels in Yunnan Province from 2010 to 2019, and the carbon dioxide gas generated by various energy consumption practices during the production and operation stages. Finally, the influencing factors were quantified.
3.1. Energy Consumption and Carbon Emissions of RESIDENTIAL BUILDINGS in Yunnan Province
Based on the IPCC-FIM, this study first calculated the energy consumption and carbon emissions levels of residential buildings in Yunnan Province. On the basis of the carbon emission calculation results, the main factors affecting the carbon emissions from these residential buildings were screened from qualitative and quantitative perspectives. Then, by using the LMDI index decomposition method, the factors affecting the residential buildings in Yunnan Province were thoroughly decomposed, and then these factors were disassembled and analyzed to determine the main factors affecting the residential buildings in Yunnan Province.
Using the IPC-FIM and Equations (6)–(8) to analyze the related energy consumption and carbon emissions levels, the following results were obtained in Table 5:
It can be observed in Figure 2 that, with the expansion of urbanization and the improvement of economic strength in Yunnan Province, as well as the improvement of residents’ requirements for housing standards, the civilian residential floor area in Yunnan Province presents a rapid growth trend, among which the urban residential area has the fastest growth rate (from 645 million square meters in 2010 to 1.912 billion square meters in 2019, with a total increase of 299.1%). At the same time, the urbanization rate of the province significantly improved. The rate of urbanization in Yunnan Province not only promotes the growth of civil residential building areas, but also results in the increase in the corresponding number of energy-using equipment, which ultimately directly affects the energy consumption and carbon emissions of civil buildings in Yunnan Province.
Among the per capita living area, the urban per capita living area depicted the highest increase, with an average growth rate of 11.21%. According to the phenomenon of the rapid growth of urban and residential living areas, Yunnan Province presented remarkable results for the considerable promotion of new urbanization development measures, and residents’ living standards also further improved.
Upon analyzing the energy consumption patterns depicted in Figure 3, Figure 4 and Figure 5, it can be observed that the overall energy consumption level of residential buildings in Yunnan Province is relatively stable. Figure 3 reveals that, concerning the trend in building usage, rural residential constructions have witnessed a gradual increase, albeit at a relatively slow pace. The functional intensity of urban residential buildings has consistently fluctuated in the range of 2–3 kgce/m2, as illustrated in Figure 3. When examining Figure 4, it becomes evident that, from 2010 to 2019, electricity consistently holds the largest proportion in the energy mix, with evidence of a year-over-year increase. Conversely, Figure 5 demonstrates a noteworthy resurgence of coal use, which, despite holding the second-largest share in the energy consumption sector, decreased from 29% to 18% over the decade. The contributions of natural gas and oil to residential building energy consumption practices are relatively low, exerting a minimal impact on the overall energy consumption level. In 2019, the total energy consumption for civil buildings in Yunnan Province amounted to 10.19 million tons. Specifically, urban and rural residential buildings consumed 4.05 and 6.14 million tons of standard coal, respectively. The growth rate of energy consumption for urban residential buildings was 0.92%, indicating the use of effective carbon reduction measures and the successful implementation of government energy-saving initiatives. Conversely, rural residential buildings experienced a growth rate of 6.3%, underscoring the need for strengthened energy conservation and emission reduction policies in rural areas when compared to their urban counterparts.
The carbon emissions values can be observed in Figure 6, Figure 7 and Figure 8; the general characteristic of the residential buildings in Yunnan Province is a “small increment and not obvious upward trend”. As shown in Figure 6, the carbon emissions released from 2010 to 2012 present in a gentle upward trend, and from 2013 to 2018, a fluctuating downward trend is evident. Compared with 2018, the carbon emissions increase again in 2019. From the perspective of building types presented in Figure 7, it can be observed that the carbon emissions from rural residential buildings present an increasing trend, but the growth rate is relatively flat, with an average value of 1.5%. The carbon emissions from urban residential buildings present a downward trend. From the perspective of different energy types, coal and electricity produced the highest carbon emissions, and the two contributed more than 90% of the energy consumption. However, from the perspective of their development trends presented in Figure 8, it can be observed that, prior to 2015, the carbon emissions produced as a result of coal consumption were less than by electricity consumption, and the proportion constantly increased. With the continuous adjustment of energy policies in Yunnan Province, the trend change in carbon emissions produced from electricity and coal use was relatively stable. From 2010 to 2019, the proportion of coal energy consumption decreased significantly, the proportion of electricity energy consumption increased steadily, and the proportions of oil and natural gas energy consumption fluctuated between 4% and 6% and 0.4% to 1%, respectively. From the current development trend, one can observe that the coal energy level in Yunnan Province still occupies the leading position concerning carbon emissions, but the overall trend is the energy electrification and low carbonization of the primary energy structure.
3.2. Quantification of Carbon Emission Factors
In the preceding section, we delineated the changing trend in building carbon emissions in Yunnan Province, revealing a discernible increase. Nevertheless, the underlying factors influencing the carbon emissions from these buildings remain unclear. Building upon the methodology outlined in the previous chapter, this study endeavored to quantify the carbon emission factors of residential buildings located in Yunnan Province.
Figure 9 and Figure 10 were derived using calculations performed using Equations (9) and (10), as detailed in Section 2. Figure 9 illustrates the contribution value and cumulative factor degree of civil buildings in Yunnan Province. The analyses of the annual contribution degree and contribution value of the relevant factors provided the following insights:
- (1)
- Overall, the collective influence of the six factors on the carbon emissions of civil buildings in Yunnan Province predominantly exhibited a promotion rather than inhibition of these emissions. The most significant factor contributing to the reduction in carbon emissions from these residential buildings was the energy intensity effect, registering a cumulative contribution value of −4.71 MTCO2 (million tons of carbon dioxide) in 2019, equating to a cumulative contribution of 214%.
- (2)
- The primary factors that positively contributed to the increase in carbon emissions from residential buildings were the per capita floor area, followed by the energy intensity of the floor area, with the population size exerting the least influence.
- (3)
- The main factors that inhibited the carbon emissions growth of residential buildings were energy intensity, followed by energy structure, and finally, urbanization.
The different types of civil residential building carbon emission factors were different. According to the abovementioned scenario, based on Equations (12) and (13) in Section 2, the cumulative contribution value and contribution degree of building factors affecting the change in carbon emissions from urban and rural residential buildings in Yunnan Province were respectively discussed. The annual factor contribution degree and contribution value were analyzed in Figure 10, according to which the following conclusions were drawn:
- (1)
- In summary, the factors influencing the variation in carbon emissions from residential buildings in Yunnan Province include the energy intensity effect of the building area and the energy intensity effect. Both the energy intensity effect and energy structure’s impact are inhibitory in both urban and rural residential buildings. Notably, the energy effect of the floor area plays a contrasting role in urban residential buildings compared to rural residential buildings.
- (2)
- Figure 10 illustrates that the comprehensive impact of influencing factors on urban residential buildings, obtained with the additive decomposition method, exhibits a U-shaped pattern in its effect on carbon emissions.
- (3)
- The cumulative contribution rates of the six influencing factors can be determined as follows: urban building carbon emissions exhibit a negative correlation with the energy consumption per unit area, energy intensity effect, and energy structure effect, as depicted in Figure 11, with contribution rates of 0.34, 0.27, and 0.05, respectively. In contrast, it demonstrates a positive correlation with the per capita construction area, urbanization rate, and population size, with contribution rates of 0.23, 0.11, and 0.01, respectively.
- (4)
- For rural residential buildings, the comprehensive effect of the factors obtained using the addition decomposition method presents an inverted “M”-type change in carbon emissions levels. The reasons for this phenomenon are as follows: the most significant factor inhibiting the growth of carbon emissions is the urbanization effect, which contributes −2MTCO2 at a contribution rate of −168.77%. The per capita floor area and energy intensity effect of the floor area play a major role in promoting the carbon emissions from buildings, contributing 2.46MTCO2 in the period from 2010 to 2019, and the cumulative contribution rate was 72.89%. According to Equations (11) and (12), the cumulative contribution rates of the six influencing factors can be successfully obtained. The urbanization rate, energy intensity effect, and energy structure effect are negatively correlated, and, as shown in Figure 11, the contribution rates are 0.16, 0.15, and 0.14, respectively. On the contrary, they are positively correlated with the per capita building area, energy consumption per unit area, and population size, with contribution rates of 0.29, 0.24, and 0.02, respectively.
3.3. Disscussion
The empirical results show that the carbon emissions in Yunnan Province present an increasing trend. This conclusion is consistent with the results achieved by many studies conducted in the past [51,52,53]. This result means that the series of rigid carbon reduction policies introduced by the Chinese government during the 13th Five-Year Plan period have had a significant effect on curbing carbon dioxide levels. These policies include “the 13th Five-Year Comprehensive Work Plan for Energy Conservation and Emission Reduction (2017)” [25] and several measures to promote the high-quality development of the construction industry in Yunnan Province (Yun Jian Jian (2022) No.44) [26], the “Guiding Opinions on Energy Work in 2016” [54], the “Notice on Accelerating the promotion of Green Buildings” [55], the “Measures for the Management of Renewable Energy Building Application Demonstration Projects” [56], the “Notice on the Implementation of National Action on Energy Conservation and Emission Reduction” [57], the “Notice on the implementation of energy-saving building demonstration projects” [58], and the “Yunnan Province Industrial Energy Efficiency Improvement Action Plan (2019–2020)” [59].
In this study, from the perspectives of energy, society, and architecture, the changes that occurred mainly referred to the methods of energy use in Yunnan Province, the changes in population growth, and the changes in building energy use. We determined that the reasons for such changes were as follows: from the change in energy in 2010, Yunnan Province mainly used coal for power generation purposes. Later, because the national and local governments vigorously promoted the utilization of local wind energy and hydropower resources in Yunnan, its power generation mode gradually changed to wind power and hydroelectric power. From the perspective of social development, although the total population is still increasing, it only increased by 1.1 million over ten years, with a low average annual growth rate, so the change in carbon emissions was not significant.
In terms of the energy intensity per unit area, for urban residential buildings, carbon emissions were reduced due to the increase in the proportion of renewable energy generation. Adopting the appropriate measures to slow down the increase in the per capita floor area can help to control the carbon emissions of urban residential buildings in Yunnan Province. In rural residential buildings, due to the improvement of the residents’ quality of life, the use of electricity has increased, resulting in the increasing energy consumption per unit area by rural residents.
4. Conclusions
In this study, the IPCC factor inventory method (IPC-FIM) was used to quantify the carbon emissions from residential buildings in Yunnan Province and to analyze the energy consumption and carbon emissions development trend of residential buildings. Firstly, the factors affecting carbon emissions change were determined using the Kaya identity framework; then, the obtained data concerning social development, construction, and energy in Yunnan Province from 2010 to 2019 were analyzed. Based on the analysis results, we established an LMDI model of Yunnan Province, and the key factors and influence degree of carbon emissions from the residential buildings in Yunnan Province were finally obtained. The conclusions we reached are as follows:
- The main factors influencing carbon emissions in residential buildings include the per capita floor area, energy consumption per unit area, energy intensity effect, energy structure effect, urbanization rate, and population size.
- For different types of residential buildings, due to different energy use structures, different factors have different influence trends and ranges on different types of buildings, and the same influencing factors also play different roles. Among them, the overall factors that play a role in promoting carbon emissions, ranging from highest to lowest, are the per capita floor area, energy consumption per unit area, and population size, and the influencing factors that play a role in inhibiting carbon emissions, ranging from highest to lowest are the energy intensity effect, energy structure effect, and effect of urbanization.
- Among the abovementioned influencing factors, carbon emissions from urban buildings can be negatively correlated with the energy consumption per unit area, energy intensity benefit, and energy structure effect, and their contribution degrees are 0.34, 0.27, and 0.05, respectively. The effects of per capita floor area, urbanization, and population size are positively correlated, and their contribution degrees are 0.23, 0.11, and 0.01, respectively.
- Carbon emissions in rural buildings are negatively correlated with the effects of urbanization, energy intensity benefits, and energy structure, and their contribution degrees are 0.16, 0.15, and 0.14, respectively. Per capita floor area, energy consumption per unit area, and population size effects were positively correlated, and their contribution degrees were 0.29, 0.24, and 0.02, respectively.
- When quantifying carbon emissions, the energy balance table can be used to perform the calculations, which may overlook the real building energy consumption values. In the future, with the improvement of technology, more appropriate research data can be used. More than one method was available for selecting the appropriate influencing factors in this study, and other methods can be used to determine the relevant influencing factors in the future.
Author Contributions
Methodology, W.L. and C.Z.; Software, W.L. and C.Z.; Formal analysis, Q.L. and S.H.; Data curation, C.Z. and S.H.; Writing—original draft, W.L. and Q.L.; Writing—review & editing, S.J., Z.W., S.H. and S.D.; Supervision, S.D.; Project administration, Z.W. and S.D.; Funding acquisition, S.J., Z.W. and S.D. All authors have read and agreed to the published version of the manuscript.
Funding
This work was supported by the Yunnan Fundamental Research Projects (Grant No. 202301BE070001-023) and the Special Support Plan for High Level Talents of Taizhou (Sike Jin).
Data Availability Statement
The original contributions presented in the study are included in the article, further inquiries can be directed to the corresponding author.
Conflicts of Interest
The authors declare no conflict of interest.
Abbreviations
| IPCC-FIM | IPCC factorial inventory method |
| IPAT | Regarding environmental impact (I), population (P), affluence (A), and technology (T) |
| LMDI | Logarithmic mean Divisia index decomposition method |
| SDA | Structure decomposition analysis |
| GHG | Greenhouse gas |
| C | Total carbon emissions of all types of buildings |
| E | The total energy consumption of all types of buildings |
| Energy structure effect (z represents urban; r represents rural) | |
| Building area energy intensity (z represents urban; r represents rural) | |
| Per capita building area effect (z represents urban; r represents rural) | |
| Urbanization effect (z represents urban; r represents rural) | |
| Population size effect (z represents urban) | |
| S | Floor area |
| P | Population size effect |
| STIRPAT | An extension of the IPAT model |
| Carbon dioxide emissions coefficient of i energy, that is, the energy intensity effect | |
| Proportion of I energy in building energy consumption, that is, the effect of the energy structure | |
| Energy consumption per unit building area, that is, energy intensity effect of the building area | |
| Represents the per capita living area, that is, the per capita building area effect | |
| Proportion of urban and rural populations in the total population, that is, the urbanization effect | |
| Total carbon emissions | |
| Carbon emissions from the base period | |
| Carbon emissions in period t | |
| Energy intensity effect (z represents urban; r represents rural) |
References
- Li, R. Low-carbon economy and sustainable economic development in China. Soc. Sci. 2009, 47–50. [Google Scholar]
- Hu, Y.; Zhu, D. Decoupling analysis of CO2 emissions from output value and energy consumption in China’s construction industry. China Popul. Resour. Environ. 2015, 25, 50–57. [Google Scholar]
- Ma, X.; Ouyang, Q. Construction of the industrial structure adjustment based on carbon emissions research. Ecol. Econ. 2016, 32, 5. [Google Scholar] [CrossRef]
- National Development and Reform Commission Energy Research Institute. Reinventing Energy: A roadmap for China’s Energy Consumption and Production Revolution to 2050. Econ. Res. 2016, 3–14. [Google Scholar] [CrossRef]
- Liu, T.; Wu, Z.; Chen, C.; Chen, H.; Zhou, H. Carbon Emission Accounting during the Construction of Typical 500 kV Power Transmissions and Substations Using the Carbon Emission Factor Approach. Buildings 2024, 14, 145. [Google Scholar] [CrossRef]
- Ang, B.W. LMDI decomposition approach: A guide for implementation. Energy Policy 2015, 86, 233–238. [Google Scholar] [CrossRef]
- de Freitas, L.C.; Kaneko, S. Decomposing the decoupling of CO2 emissions and economic growth in Brazil. Ecol. Econ. 2011, 70, 1459–1469. [Google Scholar] [CrossRef]
- Gao, H.; Wang, X.; Wu, K.; Zheng, Y.; Wang, Q.; Shi, W.; He, M. A Review of Building Carbon Emission Accounting and Prediction Models. Buildings 2023, 13, 1617. [Google Scholar] [CrossRef]
- Alajmi, R.G. Factors that impact greenhouse gas emissions in Saudi Arabia: Decomposition analysis using LMDI. Energy Policy 2021, 156, 112454. [Google Scholar] [CrossRef]
- Shi, L.; Sun, J.; Lin, J.; Zhao, Y. Factor decomposition of carbon emissions in Chinese megacities. J. Environ. Sci. 2019, 75, 209–215. [Google Scholar] [CrossRef]
- Chong, C.; Ma, L.; Li, Z.; Ni, W.; Song, S. Logarithmic mean Divisia index (LMDI) decomposition of coal consumption in China based on the energy allocation diagram of coal flows. Energy 2015, 85, 366–378. [Google Scholar] [CrossRef]
- Ang, B.W. The LMDI approach to decomposition analysis: A practical guide. Energy Policy 2005, 33, 867–871. [Google Scholar] [CrossRef]
- Cong, X.; Zhao, M.; Li, L. Analysis of Carbon Dioxide Emissions of Buildings in Different Regions of China Based on STIRPAT Model. Procedia Eng. 2015, 121, 645–652. [Google Scholar] [CrossRef]
- Ma, M.; Yan, R.; Cai, W. An extended STIRPAT model-based methodology for evaluating the driving forces affecting carbon emissions in existing public building sector: Evidence from China in 2000–2015. Nat. Hazards 2017, 89, 741–756. [Google Scholar] [CrossRef]
- Wang, P.; Wu, W.; Zhu, B.; Wei, Y. Examining the impact factors of energy-related CO2 emissions using the STIRPAT model in Guangdong Province, China. Appl. Energy 2013, 106, 65–71. [Google Scholar] [CrossRef]
- Ehrlich, P.R.; Holdren, J.P. Impact of Population Growth. Obstet. Gynecol. Surv. 1971, 26, 769–771. [Google Scholar] [CrossRef]
- Dietz, T.; Rosa, E.A. Rethinking the Environmental Impacts of Population. Affluence and Technology. Hum. Ecol. Rev. 1994, 1, 277–300. [Google Scholar]
- Su, B.; Ang, B.W.; Li, Y. Input-output and structural decomposition analysis of Singapore’s carbon emissions. Energy Policy 2017, 105, 484–492. [Google Scholar] [CrossRef]
- Su, B.; Ang, B.W. Multi-region comparisons of emission performance: The structural decomposition analysis approach. Ecol. Indic. 2016, 67, 78–87. [Google Scholar] [CrossRef]
- Su, B.; Ang, B.W.; Low, M. Input–output analysis of CO2 emissions embodied in trade and the driving forces: Processing and normal exports. Ecol. Econ. 2013, 88, 119–125. [Google Scholar] [CrossRef]
- Wood, R. Structural decomposition analysis of Australia’s greenhouse gas emissions. Energy Policy 2009, 37, 4943–4948. [Google Scholar] [CrossRef]
- Xia, Q.; Li, S.; Tao, D. Research on Influencing Factors of carbon Emission from Construction industry in China based on Extended STIRPAT Model. Manag. Mod. 2017, 37, 3. [Google Scholar]
- Sun, Y.; Zhou, M. Decoupling of carbon emissions from Energy Consumption and economic growth in China and its driving factors. Econ. Manag. Rev. 2017, 21–30. [Google Scholar] [CrossRef]
- Tseng, S. Analysis of Energy-Related Carbon Emissions in Inner Mongolia, China. Sustainability 2019, 11, 7008. [Google Scholar] [CrossRef]
- Guofa. Notice of The State Council on Printing and Distributing the Comprehensive Work Plan for Energy Conservation and Emission Reduction for the 13th Five-Year Plan Period; No.74.2017-01-05; Guofa: Jinjiang, China, 2016. [Google Scholar]
- Department of Housing and Urban-Rural Development of Yunnan Province. Some Measures to Promote the High-Quality Development of Construction Industry in Yunnan Province; Department of Housing and Urban-Rural Development of Yunnan Province: Beijing, China, 2022. [Google Scholar]
- General Office of the CPC Central Committee, Notice on Accelerating the promotion of Green Buildings. 2021. Available online: https://www.gov.cn/ (accessed on 21 October 2021).
- Huo, T.; Ren, H.; Zhang, X.; Cai, W.; Feng, W.; Zhou, N.; Wang, X. China’s energy consumption in the building sector: A Statistical Yearbook-Energy Balance Sheet based splitting method. J. Clean. Prod. 2018, 185, 665–679. [Google Scholar] [CrossRef]
- Aunedi, M.; Olympios, A.V.; Pantaleo, A.M.; Markides, C.N.; Strbac, G. System-driven design and integration of low-carbon domestic heating technologies. Renew. Sustain. Energy Rev. 2023, 187, 113695. [Google Scholar] [CrossRef]
- Donglan, Z.; Dequn, Z.; Peng, Z. Driving forces of residential CO2 emissions in urban and rural China: An index decomposition analysis. Energy Policy 2010, 38, 3377–3383. [Google Scholar] [CrossRef]
- Ozdemir, A.C. Decomposition and decoupling analysis of carbon dioxide emissions in electricity generation by primary fossil fuels in Turkey. Energy 2023, 273, 127264. [Google Scholar] [CrossRef]
- Dong, J.; Li, C.; Wang, Q. Decomposition of carbon emission and its decoupling analysis and prediction with economic development: A case study of industrial sectors in Henan Province. J. Clean. Prod. 2021, 321, 129019. [Google Scholar] [CrossRef]
- Gu, S.; Fu, B.; Thriveni, T.; Fujita, T.; Ahn, J.W. Coupled LMDI and system dynamics model for estimating urban CO2 emission mitigation potential in Shanghai, China. J. Clean. Prod. 2019, 240, 118034. [Google Scholar] [CrossRef]
- Song, M.; Guo, X.; Wu, K.; Wang, G. Driving effect analysis of energy-consumption carbon emissions in the Yangtze River Delta region. J. Clean. Prod. 2015, 103, 620–628. [Google Scholar] [CrossRef]
- Wu, L.; Zeng, W. Research on the Contribution of Structure Adjustment on Carbon Dioxide Emissions Reduction based on LMDI Method. Procedia Comput. Sci. 2013, 17, 744–751. [Google Scholar] [CrossRef]
- Neumayer, E.; Cole, M.A. Examining the Impact of Demographic Factors on Air Pollution. Popul. Environ. 2004, 26, 5–21. [Google Scholar]
- Rosa, E.A.; York, R.; Dietz, T. Tracking the anthropogenic drivers of ecological impacts. Ambio 2004, 33, 509–512. [Google Scholar] [CrossRef] [PubMed]
- Zhu, Q.; Peng, X. The impacts of population change on carbon emissions in China during 1978–2008. Environ. Impact Assess. Rev. 2012, 36, 1–8. [Google Scholar] [CrossRef]
- Ren, S.; Yin, H.; Chen, X. Using LMDI to analyze the decoupling of carbon dioxide emissions by China’s manufacturing industry. Environ. Dev. 2014, 9, 61–75. [Google Scholar] [CrossRef]
- Zhu, Q.P.X.Z.; Zhu, Q.; Peng, X.Z.; Lu, Z.M.; Wu, K.Y. Factors decomposition and empirical analysis of variations in energy carbon emission in China. Resour. Sci. 2009, 31, 2072–2079. [Google Scholar]
- Wang, Y.; Jiang, Z.; Li, L.; Qi, Y.; Sun, J.; Jiang, Z. A Bibliometric and Content Review of Carbon Emission Analysis for Building Construction. Buildings 2023, 13, 205. [Google Scholar] [CrossRef]
- Lin, B.; Ouyang, X. Analysis of energy-related CO2 (carbon dioxide) emissions and reduction potential in the Chinese non-metallic mineral products industry. Energy 2014, 68, 688–697. [Google Scholar] [CrossRef]
- Zhang, Y.; Da, Y. The decomposition of energy-related carbon emission and its decoupling with economic growth in China. Renew. Sustain. Energy Rev. 2015, 41, 1255–1266. [Google Scholar] [CrossRef]
- Wang, W.; Kuang, Y.; Huang, N. Study on the Decomposition of Factors Affecting Energy-Related Carbon Emissions in Guangdong Province, China. Energies 2011, 4, 2249–2272. [Google Scholar] [CrossRef]
- Yang, J.; Chen, B. Using LMDI method to analyze the change of industrial CO2 emission from energy use in Chongqing. Front. Earth Sci. 2011, 5, 103–109. [Google Scholar] [CrossRef]
- Ang, B.W.; Zhang, F.Q. A survey of index decomposition analysis in energy and environmental studies. Energy 2000, 25, 1149–1176. [Google Scholar] [CrossRef]
- Boyd, G.; McDonald, J.F.; Ross, M.; Hanson, D.A. Separating the Changing Composition of U.S. Manufacturing Production from Energy Efficiency Improvements: A Divisia Index Approach. Energy J. 1987, 8, 77–96. [Google Scholar] [CrossRef]
- Ang, B.W.; Liu, F.L. A new energy decomposition method: Perfect in decomposition and consistent in aggregation. Energy 2001, 26, 537–548. [Google Scholar] [CrossRef]
- Ang, B.W.; Zhang, F.Q.; Choi, K. Factorizing changes in energy and environmental indicators through decomposition. Energy 1998, 23, 489–495. [Google Scholar] [CrossRef]
- Wang, W.; Liu, X.; Zhang, M.; Song, X. Using a new generalized LMDI (logarithmic mean Divisia index) method to analyze China’s energy consumption. Energy 2014, 67, 617–622. [Google Scholar] [CrossRef]
- Wang, G.; Chen, X.; Zhang, Z.; Niu, C. Influencing Factors of Energy-Related CO2 Emissions in China: A Decomposition Analysis. Sustainability 2015, 7, 14408–14426. [Google Scholar] [CrossRef]
- Wang, Q.; Li, R.; Jiang, R. Decoupling and Decomposition Analysis of Carbon Emissions from Industry: A Case Study from China. Sustainability 2016, 8, 1059. [Google Scholar] [CrossRef]
- Xiao, B.; Niu, D.; Guo, X. The Driving Forces of Changes in CO2 Emissions in China: A Structural Decomposition Analysis. Energies 2016, 9, 259. [Google Scholar] [CrossRef]
- Energy Bureau Website. National Energy Bureau on the Issuance of 2016 Energy Work Guidance Notice National Energy Planning. Available online: http://zfxxgk.nea.gov.cn/ (accessed on 12 April 2016).
- General Office of the CPC. Central Committee and General Office of the State Council. Opinions on Promoting Green Development of Urban and Rural Construction; General Office of the CPC: Beijing, China, 2021. [Google Scholar]
- Ministry of Finance; Ministry of Housing and Urban-Rural Development. Notice of Urban Demonstration Implementation Plan for Renewable Energy Building Applications; Caijian: Beijing, China, 2009. [Google Scholar]
- Guofa. Notice of The State Council on Printing and Distributing the Comprehensive Work Plan for Energy Conservation and Emission Reduction for the 14th Five-Year Plan; Guofa: Jinjiang, China, 2021. [Google Scholar]
- National Development and Reform Commission; Ministry of Science and Technology; Ministry of Industry and Information Technology; Ministry of Finance; Natural Resources; Housing and Urban-Rural Development; Ministry of Transport; SASAC of The State Council, National Energy Administration. Green low-Carbon Advanced Technology Demonstration Project Implementation Plan. [2023] 1093 [Z]. Available online: https://www.gov.cn/ (accessed on 23 August 2023).
- Department of Industry and Information Technology of Yunnan Province. Yunnan Province Industrial Energy Efficiency Improvement Action Plan (2019–2020). Cloud Industry and Information Technology Energy Conservation; Department of Industry and Information Technology of Yunnan Province: Beijing, China, 2019. [Google Scholar]
Figure 1.
Measurement process of carbon emission factors for residential buildings in Yunnan Province.
Figure 1.
Measurement process of carbon emission factors for residential buildings in Yunnan Province.

Figure 2.
Total area and proportion.

Figure 3.
Energy consumption and proportion of civil buildings.
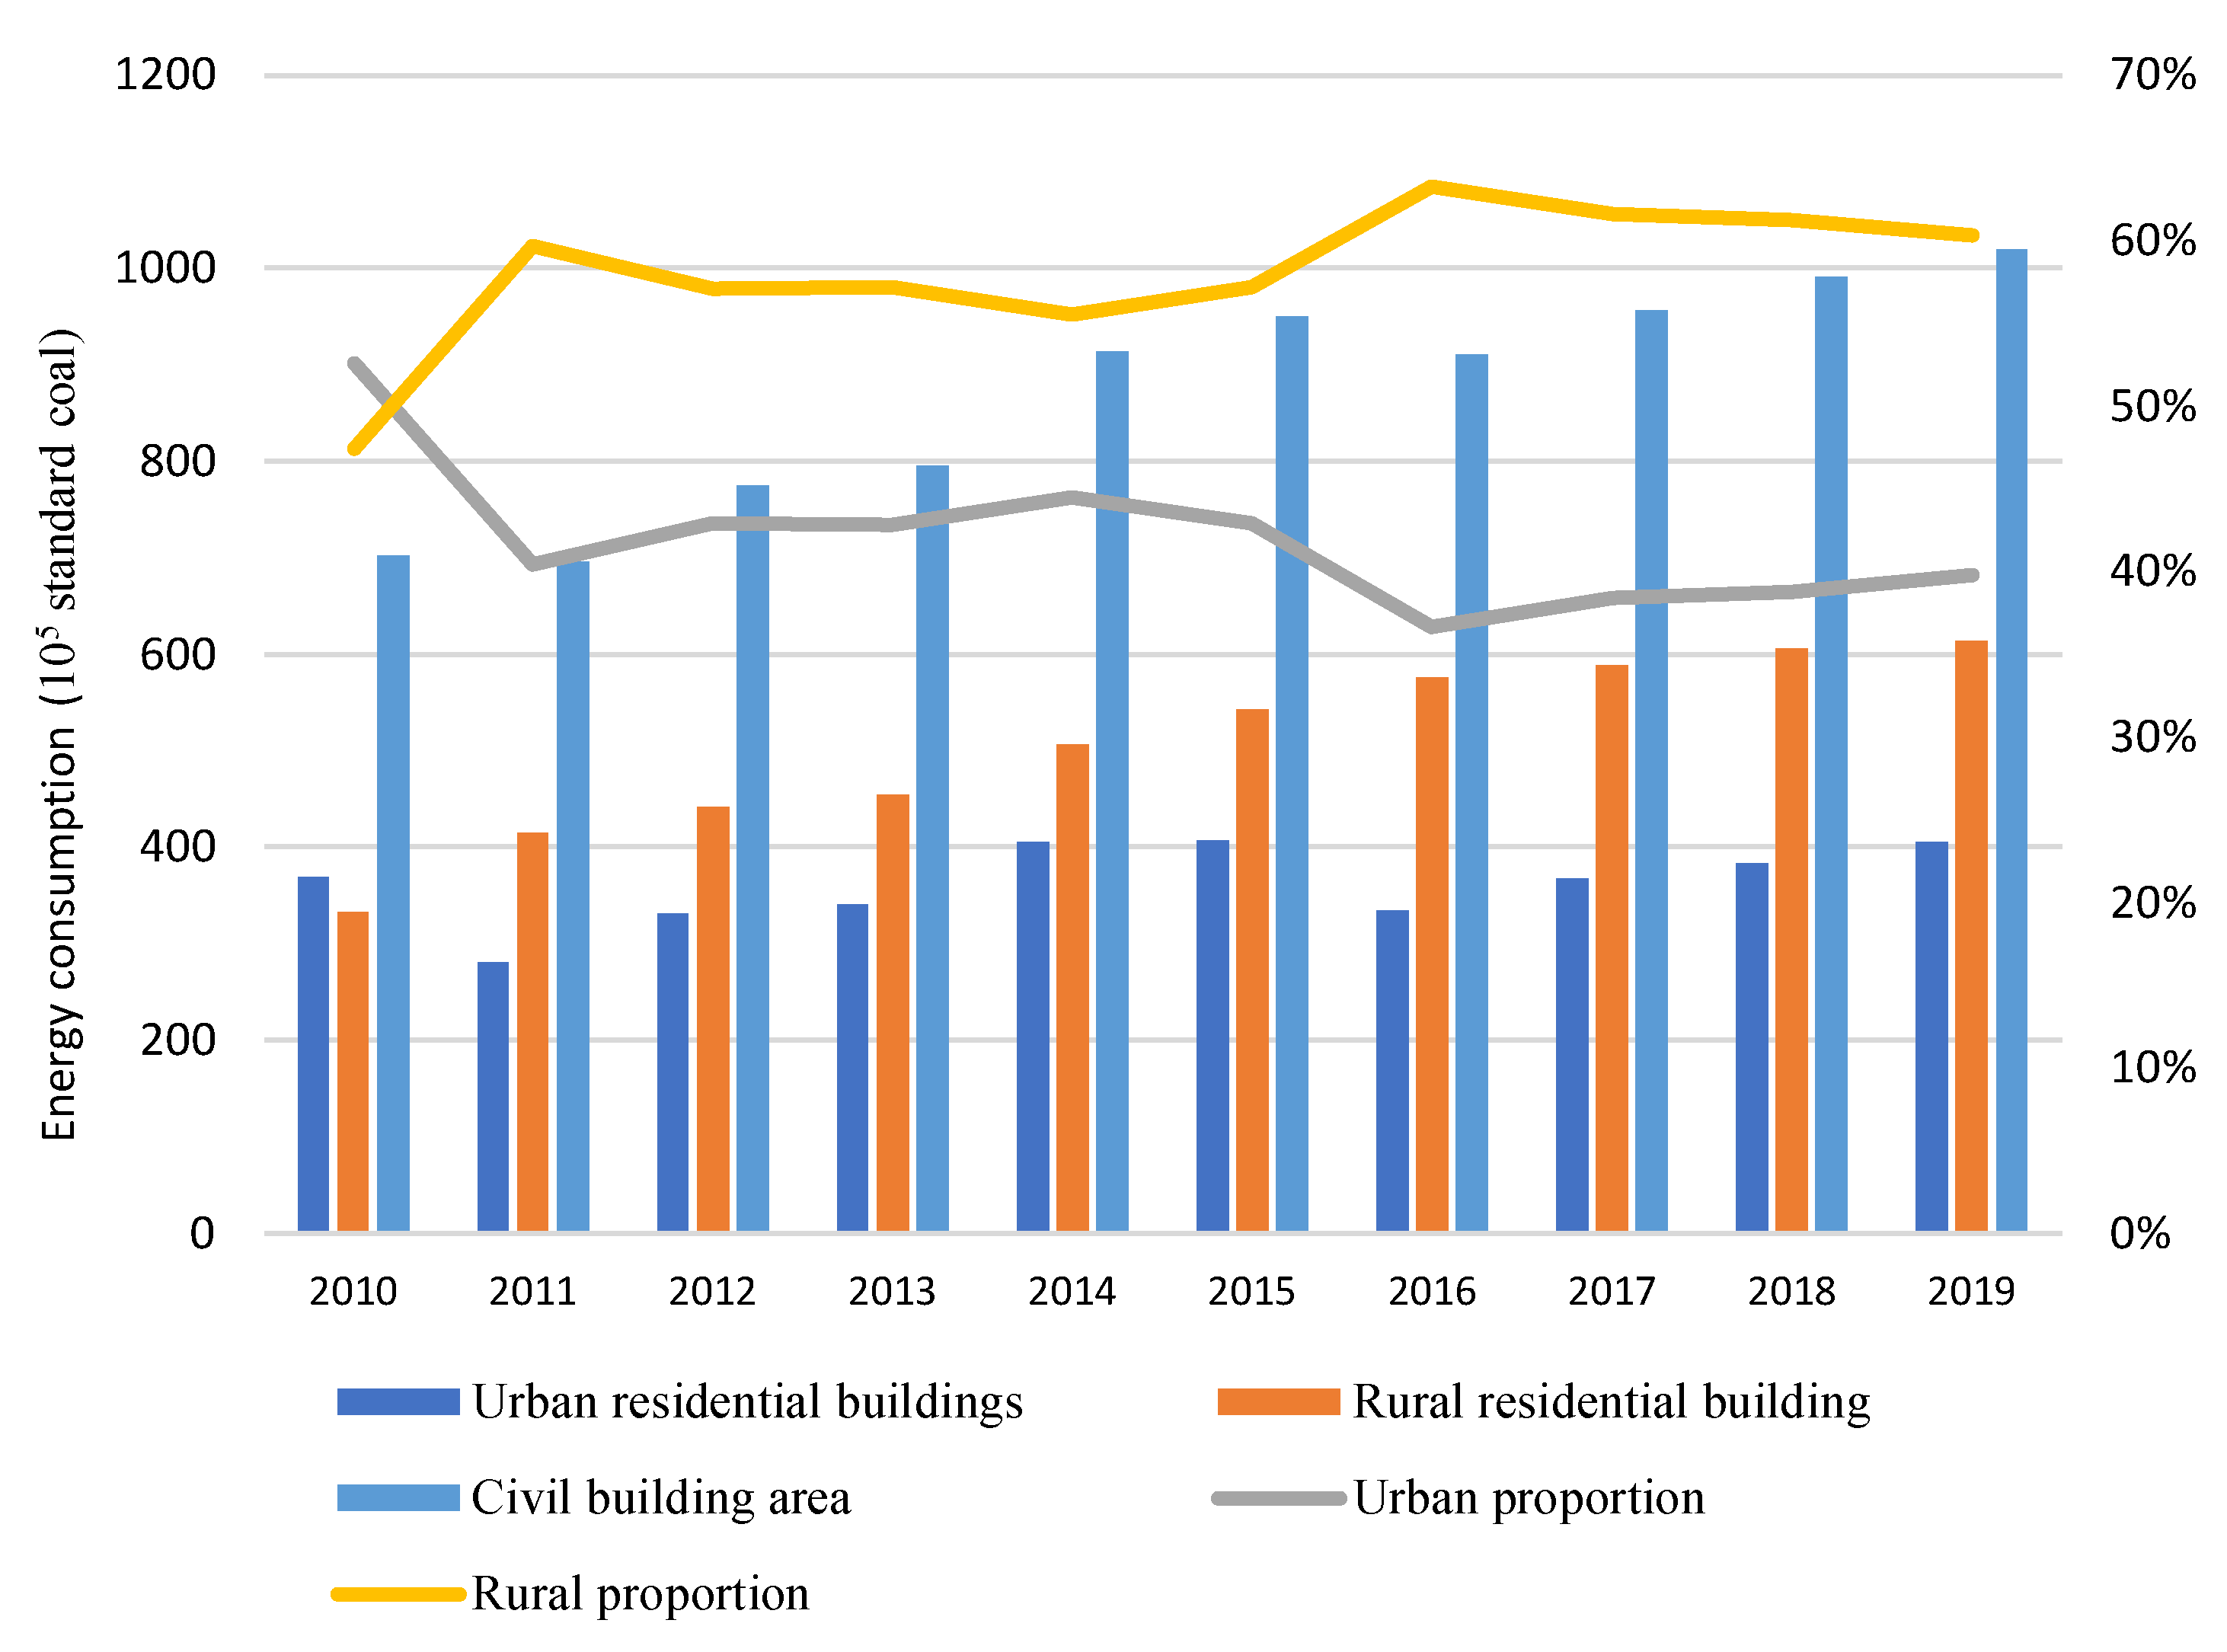
Figure 4.
Change in energy intensity of residential buildings.
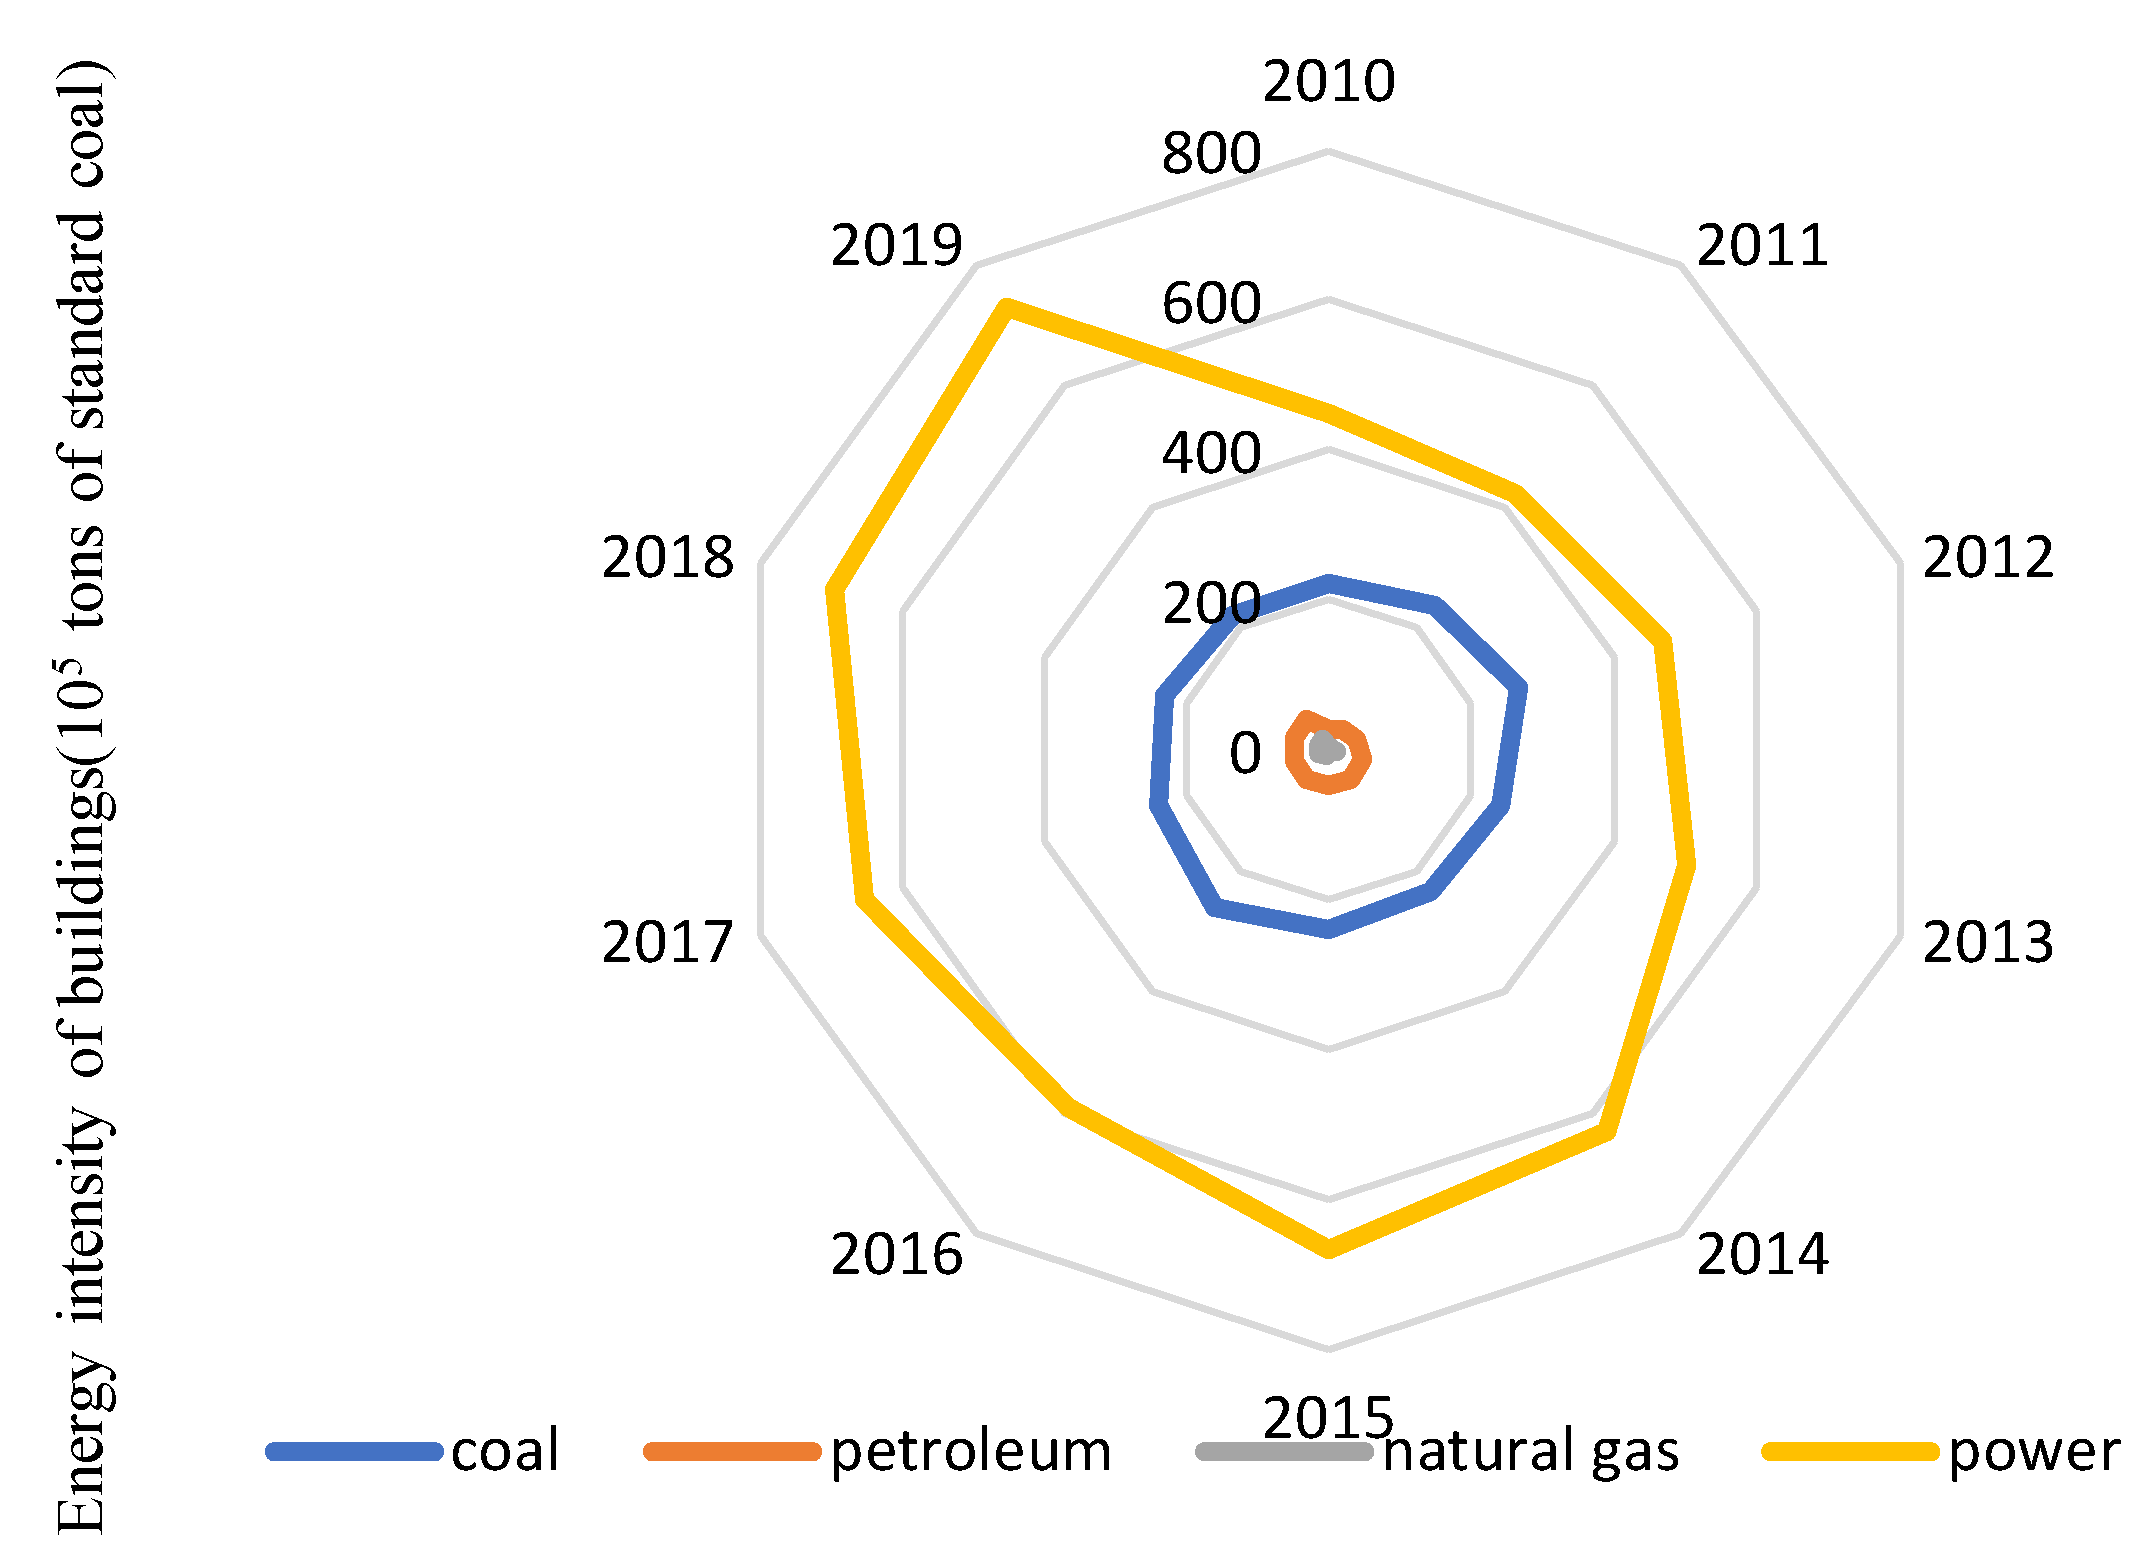
Figure 5.
The proportion of all types of energy consumption in residential buildings.
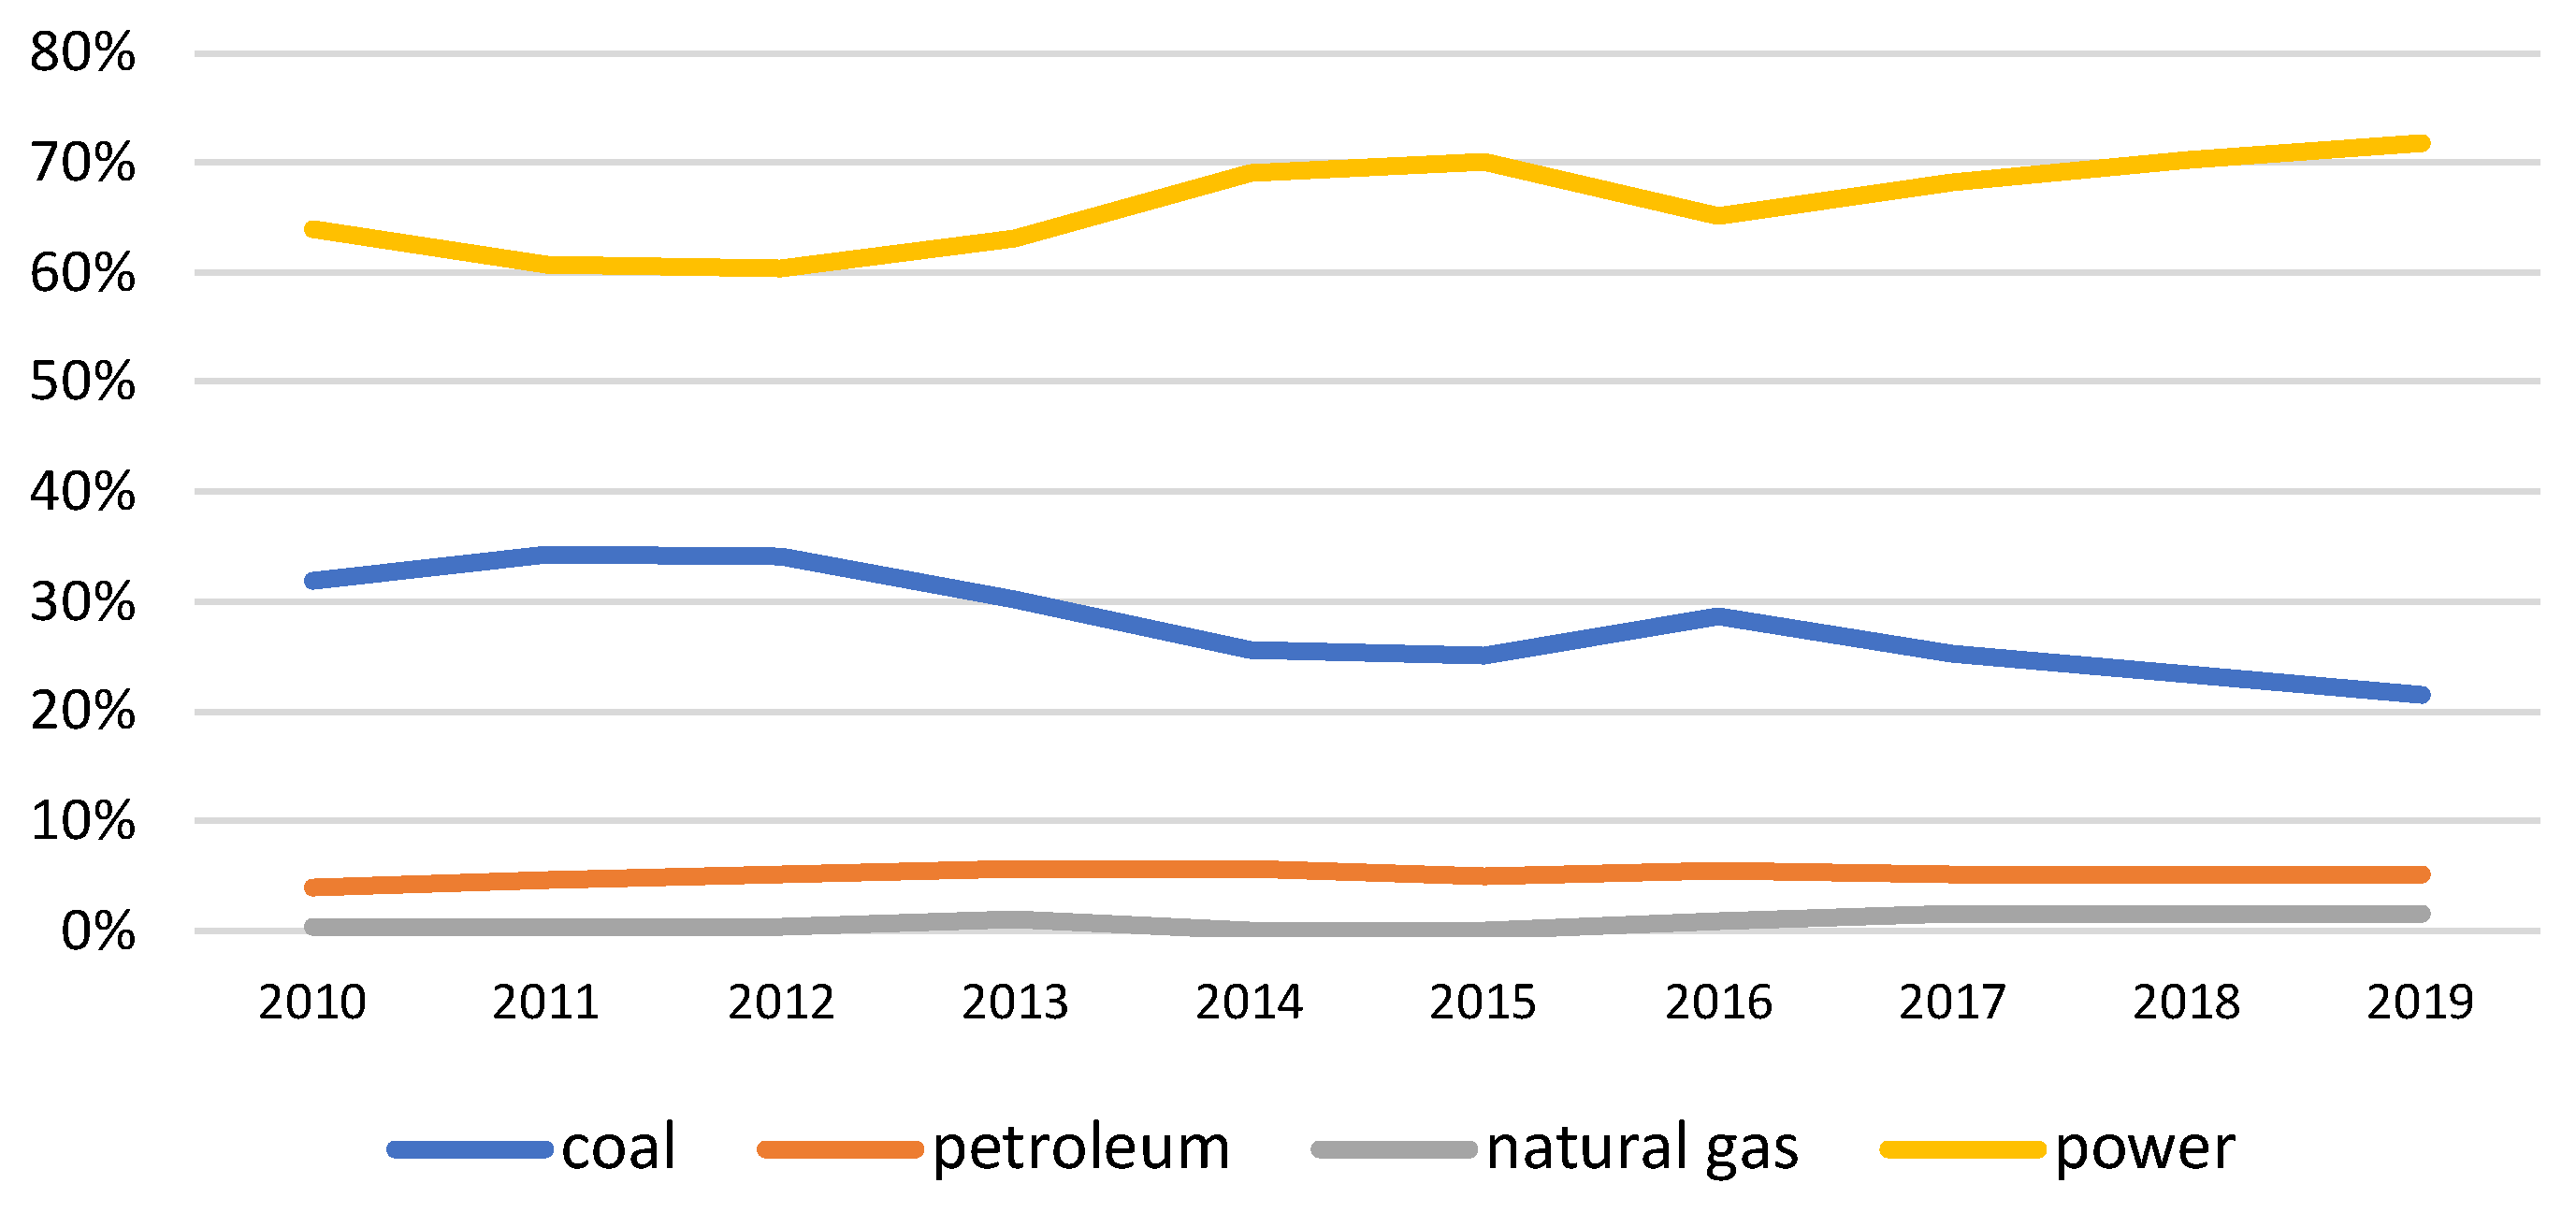
Figure 6.
Calculation of carbon emissions from all types of civil buildings.

Figure 7.
Change in energy intensity levels of residential buildings.

Figure 8.
Proportion of carbon emissions from various energy sources in residential buildings.
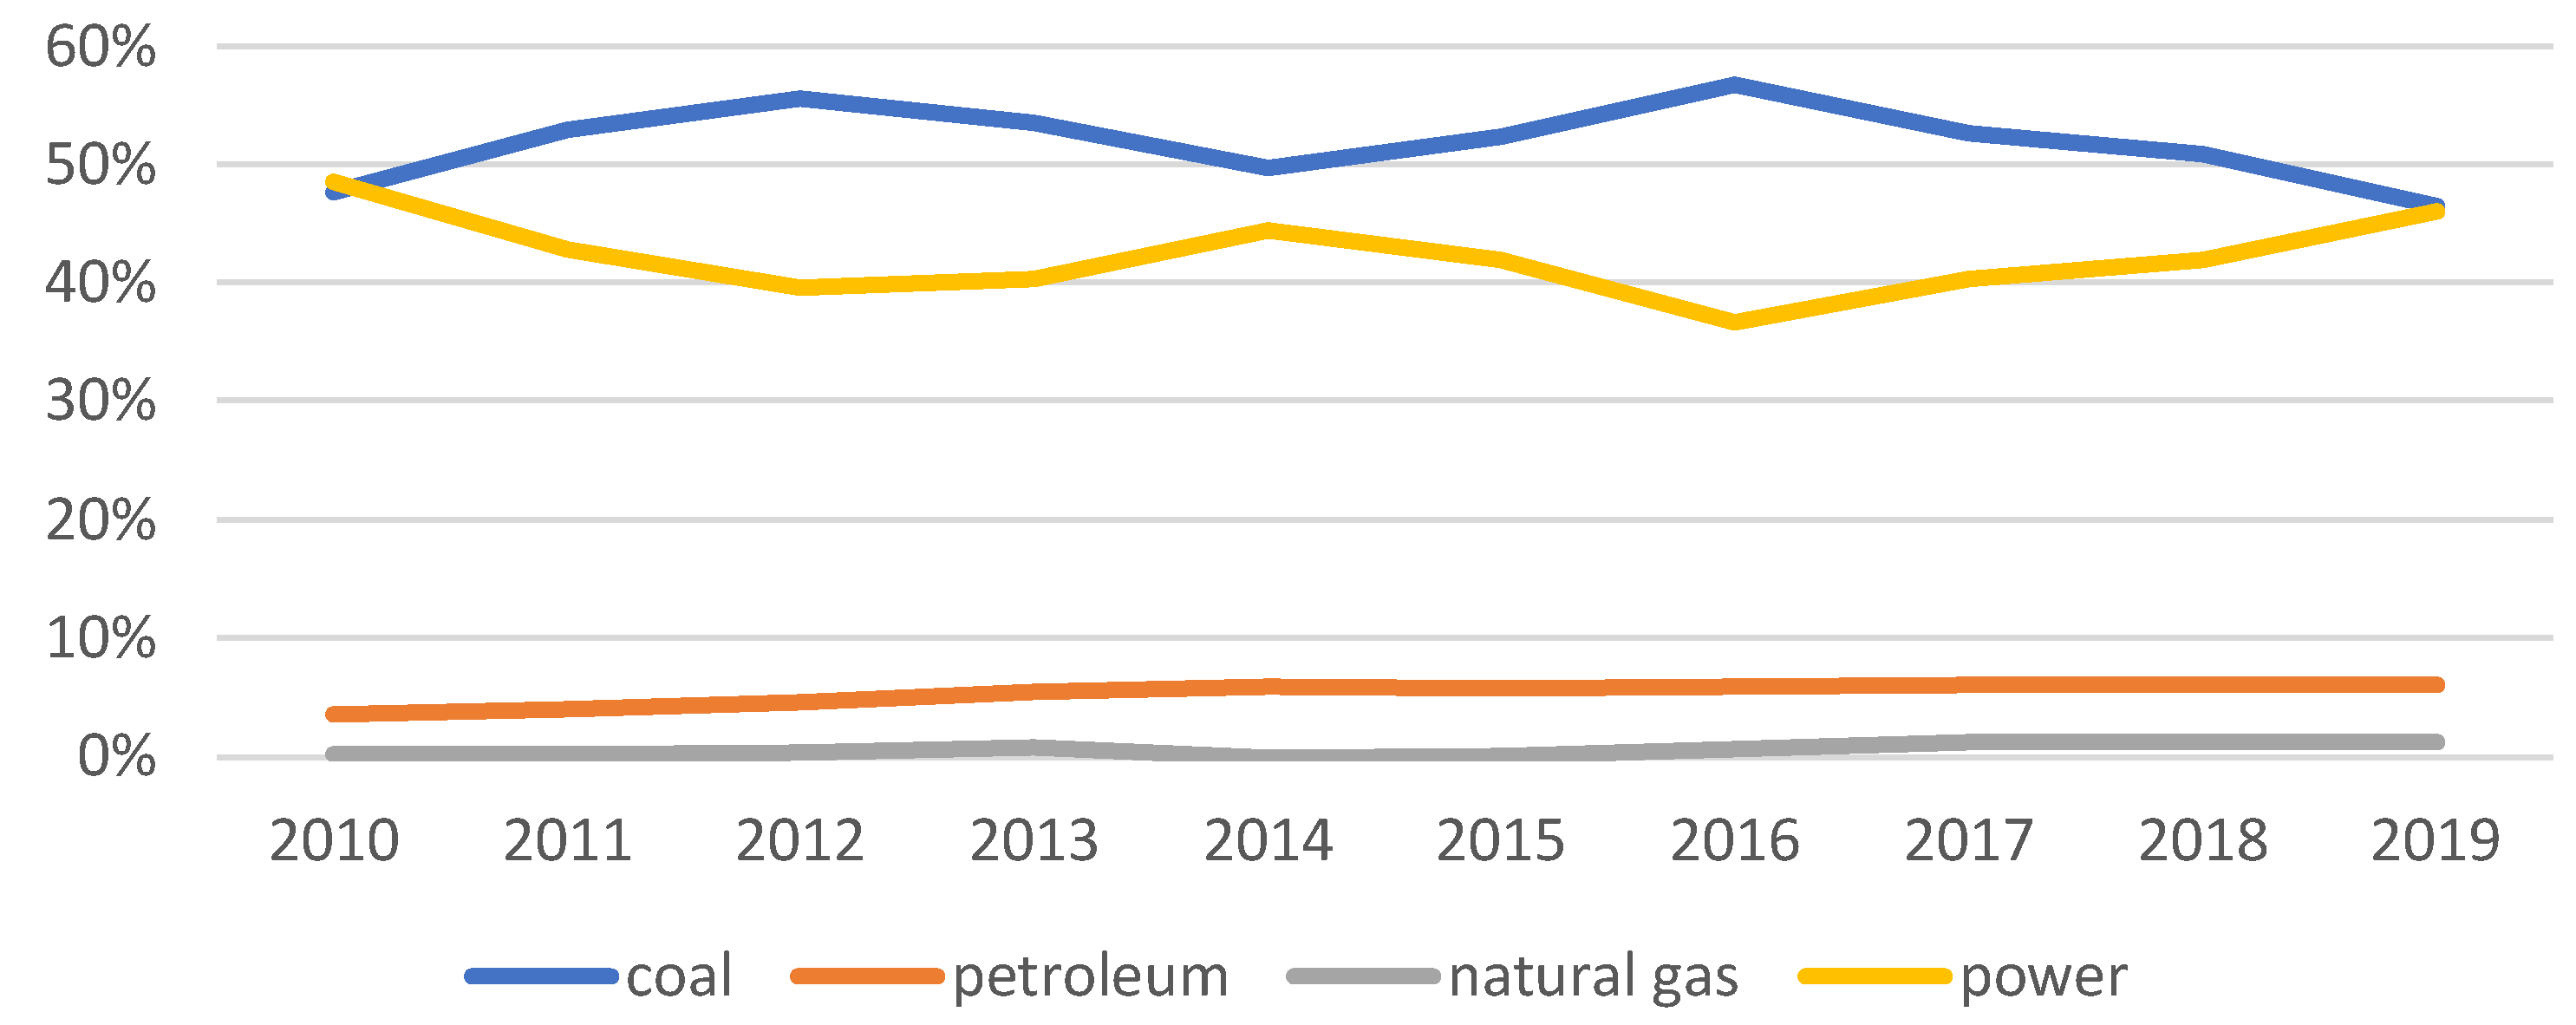
Figure 9.
Contribution values of civil construction factors: (a) cumulative and (b) annual contributions (unit: million tons of CO2).
Figure 9.
Contribution values of civil construction factors: (a) cumulative and (b) annual contributions (unit: million tons of CO2).

Figure 10.
Cumulative carbon emission factor contribution values in Yunnan Province: (a) urban and (b) rural buildings.
Figure 10.
Cumulative carbon emission factor contribution values in Yunnan Province: (a) urban and (b) rural buildings.
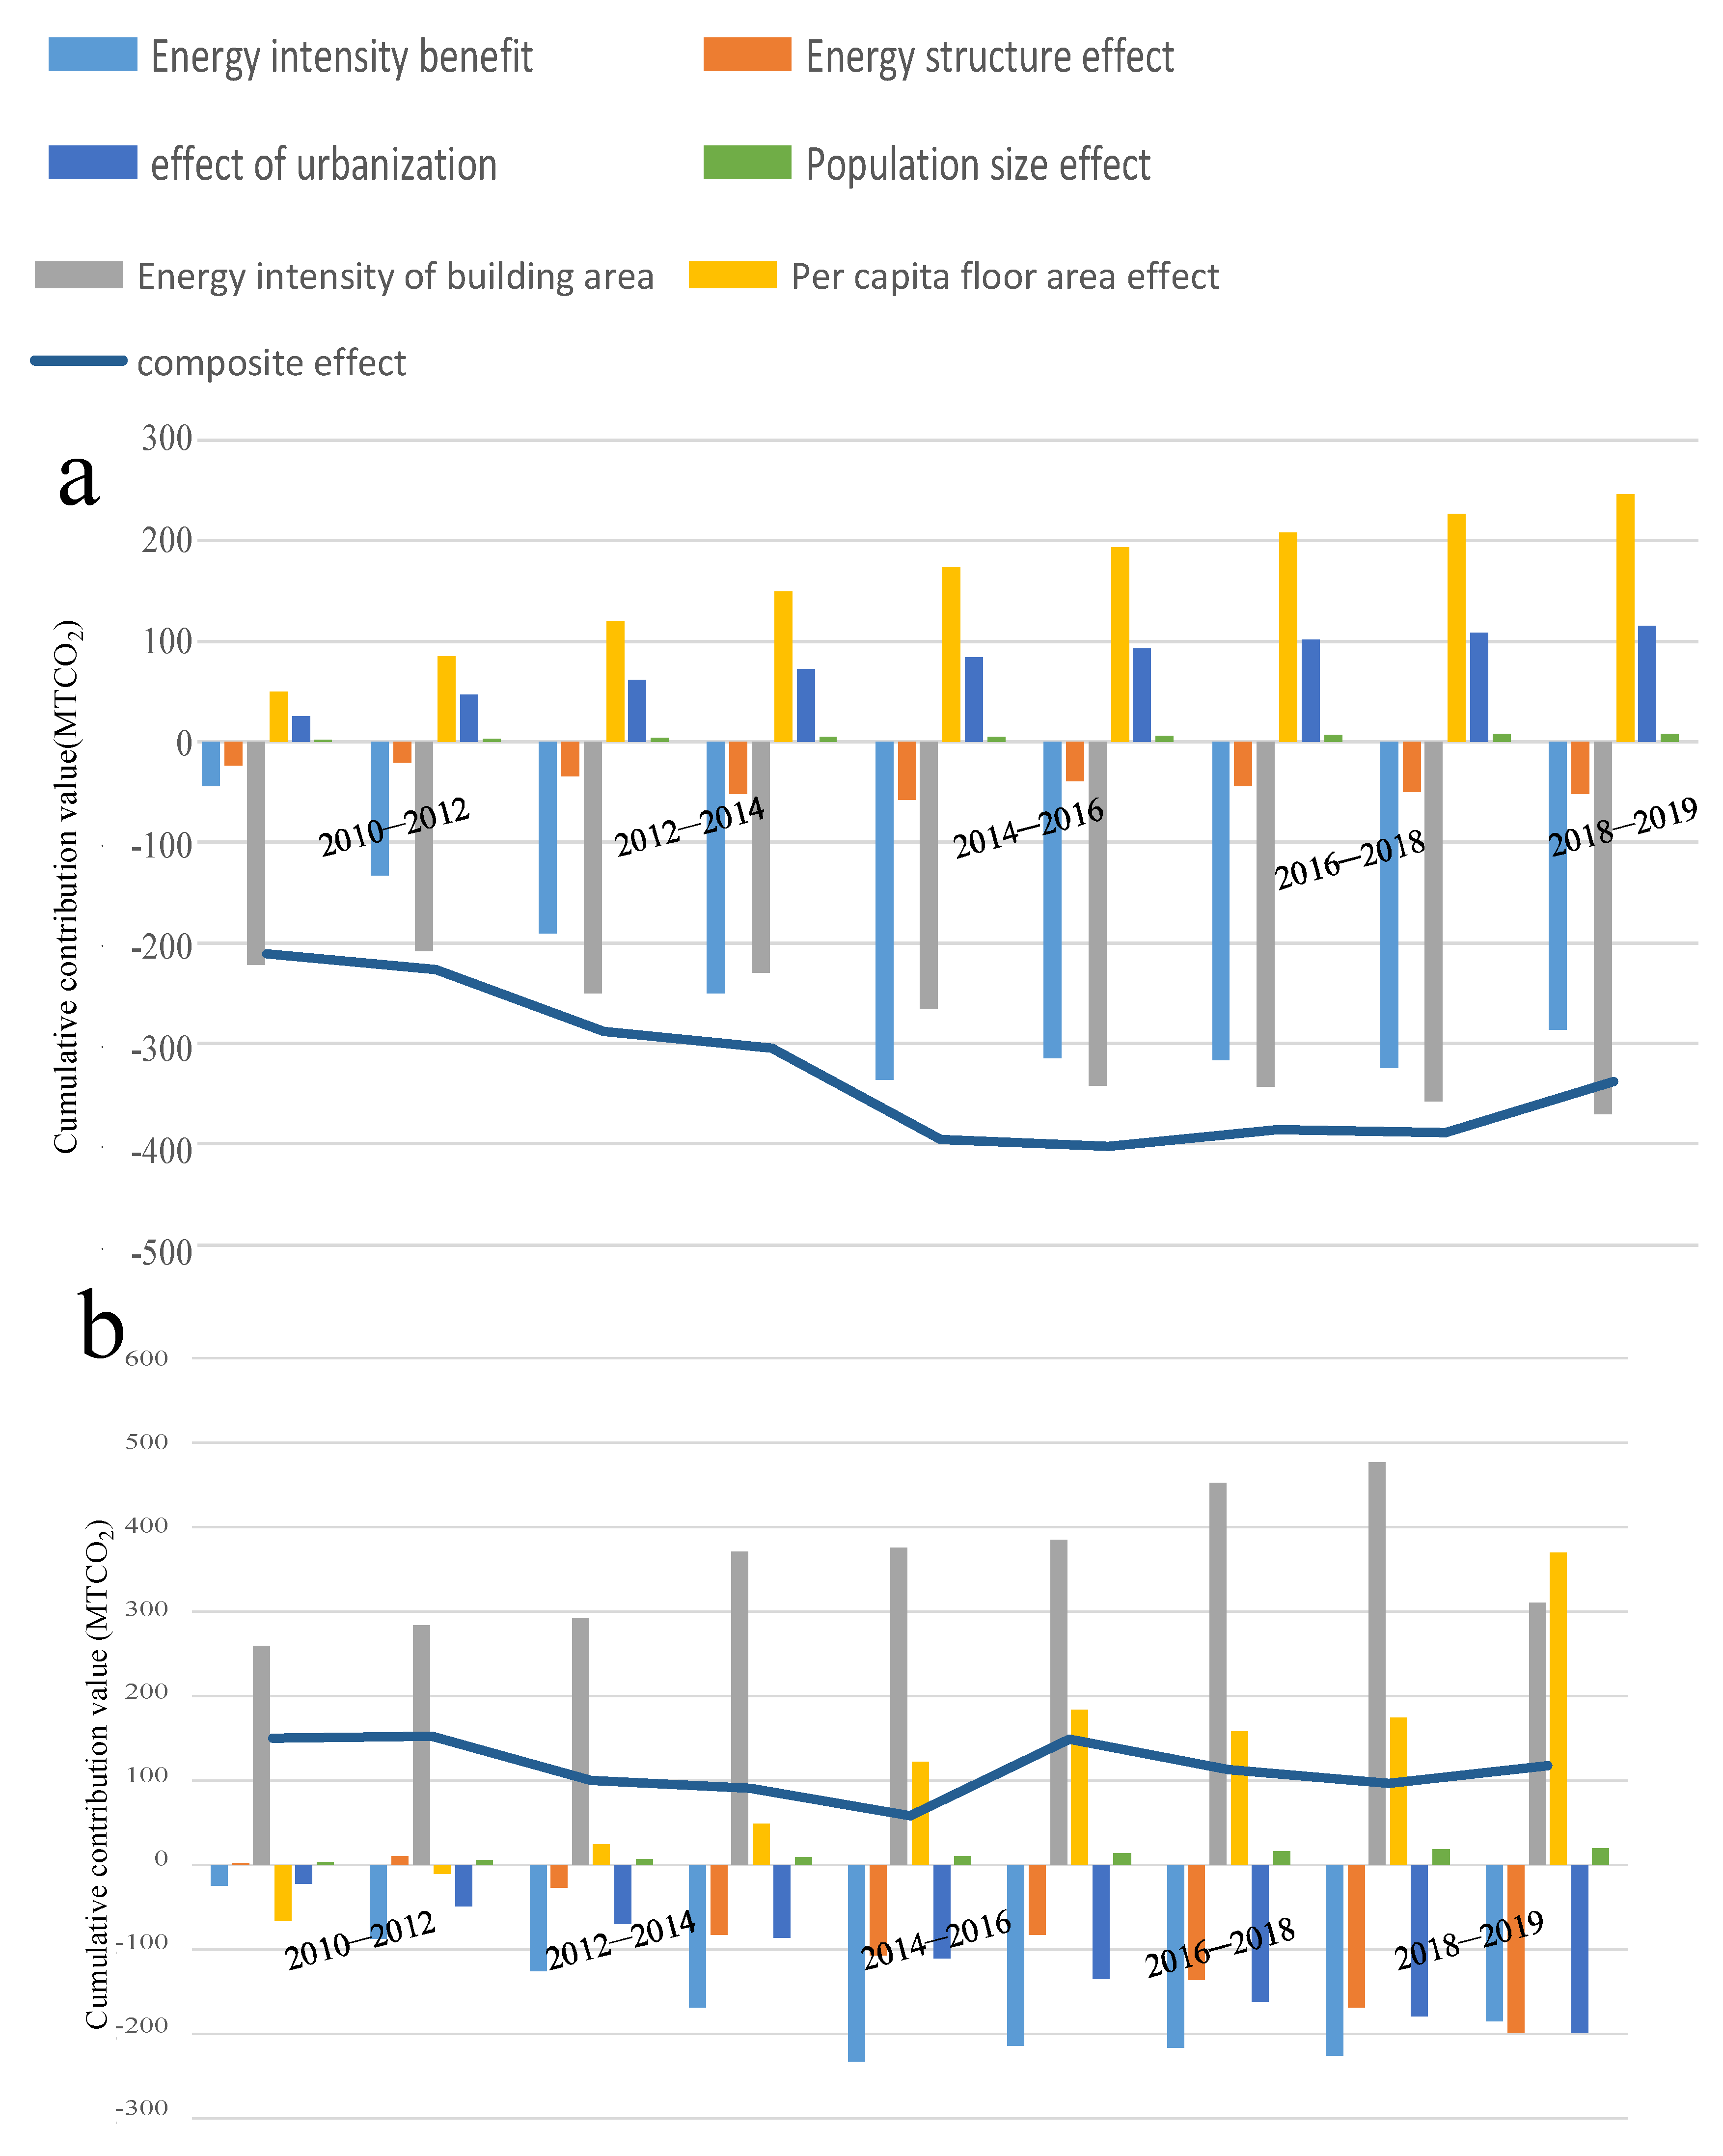
Figure 11.
Contribution of 6 influencing factors to carbon emissions. (a) Urban and (b) rural buildings.
Figure 11.
Contribution of 6 influencing factors to carbon emissions. (a) Urban and (b) rural buildings.

Table 1.
Comparison of carbon emissions accounting methods.
| Method | Formula | Features | Input |
|---|---|---|---|
| IPCC-FIM | Em = AD × EF Em—greenhouse gas emissions, AD—activity data, EF—emission factor | Simple, practical, and applicable; carbon emission factors are regional | Emission factors; activity levels |
| Material balance method | ΣGinput = ΣGproduct + ΣGlose Ginput—total, input material, Gproduct—obtain the sum of the product quantities, Glose—total amount of material and product lost | Reflects the actual emissions, there are errors, the workload is large | Introduces new chemical qualities; facility or equipment storage |
| Field measurement method | G = KQC G—emission of a gas, Q—flow medium, C—concentration of a gas in a medium, K—unit conversion coefficient | Accurate results and high cost | Air flow; conversion coefficient; emission concentration |
Table 3.
Key factors affecting building carbon emissions.
| Key Factors Affecting Building Carbon Emissions | Key Factors Affecting the Carbon Emissions of Residential Buildings |
|---|---|
| Energy | Energy structure |
| Energy intensity | |
| Social development | Population size |
| Urbanization | |
| Architecture | Energy consumption per unit area |
| Per capita floor area |
Table 4.
Meanings of indicators.
| Variable | Definition |
|---|---|
| Total carbon emissions for all types of buildings | |
| Total energy consumption for all types of buildings | |
| Floor area | |
| Population size effect | |
| Carbon dioxide emission coefficient of i energy, that is, the energy intensity effect | |
| Represents the proportion of i energy in building energy consumption, that is, the effect of the energy structure | |
| Represents energy consumption per unit building area, that is, the energy intensity effect of a building area | |
| Represents the per capita living area, that is, the per capita building area effect | |
| Proportion of urban and rural populations in the total population, that is, the urbanization effect |
Table 5.
Energy consumption and carbon emissions.
| Year | Urban Residential Buildings | Urban Proportion | Rural Residential Buildings | Rural Proportion | Civil Building Area |
|---|---|---|---|---|---|
| 2010 | 6.45 | 34% | 12.49 | 66% | 18.94 |
| 2011 | 7.49 | 40% | 11.23 | 60% | 18.71 |
| 2012 | 8.57 | 42% | 11.63 | 58% | 20.21 |
| 2013 | 9.81 | 45% | 11.86 | 55% | 21.67 |
| 2014 | 11.04 | 48% | 12 | 52% | 23.04 |
| 2015 | 12.54 | 50% | 12.78 | 50% | 25.32 |
| 2016 | 14.19 | 51% | 13.41 | 49% | 27.6 |
| 2017 | 15.67 | 55% | 12.67 | 45% | 28.35 |
| 2018 | 17.32 | 58% | 12.66 | 42% | 29.98 |
| 2019 | 19.12 | 55% | 15.68 | 45% | 34.79 |
Disclaimer/Publisher’s Note: The statements, opinions and data contained in all publications are solely those of the individual author(s) and contributor(s) and not of MDPI and/or the editor(s). MDPI and/or the editor(s) disclaim responsibility for any injury to people or property resulting from any ideas, methods, instructions or products referred to in the content. |
© 2024 by the authors. Licensee MDPI, Basel, Switzerland. This article is an open access article distributed under the terms and conditions of the Creative Commons Attribution (CC BY) license (https://creativecommons.org/licenses/by/4.0/).
Share and Cite
MDPI and ACS Style
Li, W.; Li, Q.; Zhang, C.; Jin, S.; Wang, Z.; Huang, S.; Deng, S. The Quantification of Carbon Emission Factors for Residential Buildings in Yunnan Province. Buildings 2024, 14, 880. https://doi.org/10.3390/buildings14040880
AMA Style
Li W, Li Q, Zhang C, Jin S, Wang Z, Huang S, Deng S. The Quantification of Carbon Emission Factors for Residential Buildings in Yunnan Province. Buildings. 2024; 14(4):880. https://doi.org/10.3390/buildings14040880
Chicago/Turabian StyleLi, Wuyan, Qinyao Li, Chubei Zhang, Sike Jin, Zhihao Wang, Sheng Huang, and Shihan Deng. 2024. "The Quantification of Carbon Emission Factors for Residential Buildings in Yunnan Province" Buildings 14, no. 4: 880. https://doi.org/10.3390/buildings14040880
Note that from the first issue of 2016, this journal uses article numbers instead of page numbers. See further details here.