
Dynamic Response Study of Space Large-Span Structure under Stochastic Crowd-Loading Excitation
1
College of Architecture and Engineering, Liaocheng University, Liaocheng 252000, China
2
China Railway 17th Bureau Group 1st Engineering Co., Ltd., Qingdao 266000, China
*
Author to whom correspondence should be addressed.
Buildings 2024, 14(5), 1203; https://doi.org/10.3390/buildings14051203
Submission received: 25 March 2024
/
Revised: 14 April 2024
/
Accepted: 20 April 2024
/
Published: 24 April 2024
(This article belongs to the Special Issue Structural Vibration Serviceability and Human Comfort II)
Abstract
:With the development of civil engineering, lightweight and high-strength materials, as well as large-span, low-frequency structural systems, are increasingly used. However, its self-oscillation frequency is often close to the stride frequency of pedestrians, which is easily affected by human activities. To study the effect of human activities on the dynamic response of structures, it is crucial to choose an appropriate anthropogenic load model. Considering the inter-subject and intra-subject variability of pedestrian walking parameters and induced forces in a crowd, we introduce the interaction rules between pedestrians based on the floor field cellular automata (FFCA). A stochastic crowd-loading model coupling walking parameters, induced forces between pedestrians, and induced forces between pedestrians and structures is proposed for simulating crowd-walking loads. The feasibility of the model is verified by comparing the measured response of a space large-span structure with the predicted response of the proposed stochastic crowd-loading model. The comfort level of the structure under different crowd densities was also evaluated based on the model. It was found that both random combinations of walking parameters and dynamic behaviors of pedestrians can cause significant differences in the structural response. Therefore, the crowd-loading model should consider the influence of pedestrian behavioral factors on the structural response.
1. Introduction
In recent years, lightweight and high-strength building materials, as well as large-span structural forms, have become increasingly popular in construction due to their flexible use of space and aesthetic appeal. However, these structures are also prone to dynamic response issues under low-frequency human-induced excitation, which can lead to resonance and compromise their safety. Previously, structural vibration suitability problems caused by human-induced excitation have occurred from time to time, with the London Millennium Bridge [1] and the Lardal Bridge in Norway [2] both experiencing vibration problems of varying degrees. The most influential was the vibration incident on the Millennium Bridge in London. Since then, the study of human-induced structural vibration has become a popular research area. For the human-induced vibration problem, the first step is to choose an appropriate human-induced excitation load model [3]. Among the various human excitations frequently encountered by structures, crowd walking loads are particularly common, given the intended use of the building.
Several researchers [4,5,6] have conducted human-induced vibration tests on structures. They found that the randomness of pedestrian and structural parameters has a great influence on the dynamic response of the structure. The pedestrian load model is typically treated as a deterministic periodic process in the time domain, often expressed using the Fourier series [7,8,9,10,11,12]. Several researchers [13,14] generated different individual walking incentives based on anthropometric characteristics. They were randomly combined using the Monte Carlo method to simulate the crowd walking incentives. Nevertheless, this approach requires a large number of calculations to achieve the desired level of accuracy. Several researchers [15,16] have developed a crowd load spectrum model. This model takes into account stochastic factors such as pedestrian arrival destination, stride frequency, stride speed, force amplitude, and pedestrian weight. Several researchers [17,18] have developed a crowd-loading model by combining crowd density with a single-person loading model. The model takes into account the relationship between crowd density and pedestrian stride speed. Da Silva et al. [19] developed a crowd-loading model for sparse and dense crowds (with densities up to around 1.0 pedestrian/m2) based on biodynamic modeling. Gazzola et al. [20] developed a mathematical model for multi-person synchronized cyclic movements based on a synchronization model as well as a single-person walking load model. Wang et al. [21] developed the cross-power spectral density among pedestrians in a crowd based on the individual auto-power spectral density (PSD) function. They built a crowd-walking load spectrum model based on it.
Crowd walking is a highly complex stochastic process. Factors such as the constructional characteristics of the structure, pedestrian walking parameters, differences in walking characteristics, and interactions between individuals all impact pedestrian behavior (e.g., changing walking routes, reduction of stride speed, etc.), which in turn causes changes in the structural response. However, most of the existing crowd-loading models consider pedestrian loading as a static stochastic process and investigate walking parameters (e.g., pedestrian weight, stride frequency, stride length, and crowd density). There are fewer studies on crowd-loading models that consider the dynamic behavioral characteristics of pedestrians. This factor may lead to a large discrepancy between the crowd-loading model and the actual loads generated by the crowd-walking process.
With the continuous optimization of artificial intelligence (AI) algorithms [22,23,24,25], it has become a new approach to simulate and analyze the behavior of complex systems by computer. The cellular automaton model has unique advantages in the field of complex pedestrian behavior simulation [26]. Yu et al. [27] proposed a cellular automata model considering the effect of rescue behaviors to study pedestrian evacuation in emergencies. Zhao et al. [28] proposed a continuous floor field cellular automata model to improve the efficiency of crowd evacuation. Xue et al. [29] proposed a floor field cellular automata model that introduces a waiting time rule. Pedestrian behavior in two-way pedestrian flow was studied. Lu et al. [30] proposed an extended floor field cellular automaton model considering the effect of group behavior, which reproduces common group behaviors such as congestion in crowd evacuation.
The related studies above establish the foundation for the establishment of a coupled multifactor stochastic crowd-loading model. Based on them, we propose an improved FFCA model (BO-FFCA) that takes into account the pedestrian behavioral orientation mechanism. The model takes into account the interactions between individuals and between individuals and structures in the process of a crowd walking through the behavioral orientation mechanism and achieves the dynamic behavioral simulation of the crowd walking process. The walking load function and random pedestrian parameters (e.g., stride frequency, stride length, weight, crowd density, and walking time) are introduced into the BO-FFCA model to establish a multifactor coupled stochastic crowd-loading model. The remaining sections are organized as follows. Section 2 provides a detailed description of the methodology used to establish the stochastic crowd-loading model. In Section 3, the validity of the proposed stochastic crowd-loading model is verified through anthropogenic vibration tests conducted on a large-span space structure. Section 4 involves the application of the proposed stochastic crowd-loading model to an engineering example to evaluate its comfort level. Additionally, Section 5 analyzes the effects of different factors on the dynamic response of the structure. Finally, Section 6 summarizes some key conclusions.
2. Stochastic Crowd-Loading Model
The stochastic crowd-loading model and dynamic response analysis of a space’s large-span steel truss structure are carried out as an example. The chords of the corridor are connected by steel beams and horizontal supports. The plan dimension is 58.8 m × 25.2 m, and the elevation range is 67.200 m~76.200 m. The corridor is connected to the main structure of the east and west sides by box-type steel columns, steel beams, and braces, as shown in Figure 1.
The stochastic crowd-loading model based on BO-FFCA consists of two parts: stochastic pedestrian walking loads and stochastic pedestrian walking routes.
2.1. Stochastic Pedestrian Walking Loads
According to the literature [7], walking parameters should take into account both inter-individual and intra-individual variability. This is because there are differences in stride frequency, stride length, and weight among different individuals, and even the same individual may have different stride lengths at different times. These two factors can be considered as two independent random variables. The walking parameters selected for this study are listed in Table 1.
A walking load is a three-dimensional force consisting of a vertical component, a horizontal transverse component, and a horizontal longitudinal component. However, horizontal longitudinal forces are usually negligible, and existing structural vibration suitability problems have been largely attributed to the vertical component, which coincides with the stride frequency [32]. Therefore, this study only considers the vertical component of the walking load. Taking into account the bipedal support phase during pedestrian walking, we adopt the single-person walking time-domain load model proposed in the literature [12], as represented by the following equation:
where is the pedestrian load vertical excitation, is the time, is stride frequency, is the weight of the pedestrian. is the phase of each order of pedestrian walking, . is the i-th harmonic Fourier coefficient, referred to as the dynamic loading factor, when the stride frequency belongs to , the dynamic loading factor takes the value as follows: .
The numerically fitted normalized curve for the single-person walking load with a stride frequency of 1.87 Hz is shown in Figure 2.
2.2. Stochastic Pedestrian Walking Routes
This paper simplifies pedestrian walking into a particle motion process described by using Lagrange in continuum physics, given that it is a process of constantly changing spatial position over time. Through specific walking parameter selection rules, we assign each pedestrian’s unique information to particles. The motion of these particle swarms with pedestrian information is used to simulate the walking of an actual crowd. The Cellular Automata (CA) is a discrete network dynamics model that includes local spatial interactions and temporal causality in time, space, and state [26]. It can simulate the spatio-temporal evolution of complex systems and consists of Cellular, Cellular Neighborhood, Cellular Space, and Cellular Evolution Rules [33], as shown in Figure 3. To simulate the stochastic walking routes of pedestrians, this study is based on CA and made appropriate modifications to achieve the above functions.
In CA, a cellular is the fundamental unit. Within a discrete time step, each cellular can accommodate only one pedestrian. In the pedestrian simulation, a commonly used approach is to represent the space as a square 2D grid of cellular space, where each grid corresponds to a cellular [27]. The structural space is divided into uniform grids of equal size, treating each grid as a basic cellular unit. Therefore, each cellular can have two states: occupied by a pedestrian or vacant. According to the literature [34], the area occupied by each cellular is divided into , where represents the number of cellular occupied by a pedestrian in the length and width directions. In this study, each cellular is further divided into .
2.2.1. Stochastic Pedestrian Walking Route Influences Factor
To simulate the dynamic process of the whole crowd walking, CA needs to set a series of local state update rules. When determining these rules, it is necessary to consider the influencing factors of pedestrians choosing the walking route. According to the literature [35,36,37,38,39], these influencing factors can be categorized into the following four groups:
- (1)
- Environmental factors: mainly include the spatial structure of the building, exit, walls, and other scene factors, as well as crowd distribution, density, and other crowd factors.
- (2)
- Accidental factors: describe the impact of accidental hazards on behavioral decisions such as fire and smoke.
- (3)
- Pedestrian characteristics: describe the effects of pedestrian movement characteristics (e.g., acceleration, steering, forward and right-side walking preferences), behavioral characteristics (e.g., agitation, fear, and aggression), and experiential factors (e.g., familiarity) on behavioral decisions.
- (4)
- Pedestrian interaction: describes the influence of interaction and information exchange between pedestrians on behavioral decisions.
In addition to the above selection of influencing factors, it is also necessary to consider the coupling mechanism between influencing factors. One of the most classical is the floor field model [28,29,40]. Inspired by the literature [28,40], we adopt the theory of FFCA and introduce the interaction rules among pedestrians to simulate the random walking behavior of crowds. This approach can more easily simulate the interaction and information transfer between crowds and effectively describe the dynamic process of the whole crowd walking.
2.2.2. The Floor Field Cellular Automata
FFCA is a further extension of CA, which is discrete in time and space. The selection probability of the target cellular is calculated by static and dynamic floor fields to determine the direction of movement of pedestrians. Its expression is as follows in the equation:
where represents the target cellular in the pedestrian space; is a normalization coefficient ensuring . denotes the state of the target grid, where 0 indicates that the target cellular is unoccupied and can be moved into, while 1 indicates that the target cellular is occupied by pedestrians and prohibits movement into the cellular. stands for the obstacle number, where 0 signifies cellular that are prohibited from movement, such as boundary walls, obstacles, and pedestrians ahead of the cellular, and 1 indicates no obstacle, allowing movement into the cellular. and represent the dynamic and static floor fields, respectively. and denote the coupling parameters with the dynamic floor field and the static floor field.
Stochastic walking behaviors of two-way crowds can be broadly classified into three categories: walking straight, overtaking, and following. Among these behaviors, pedestrians have a higher tendency to walk straight than to overtake and follow. When pedestrians make a lane change, the attractiveness of the target lane to the target pedestrians is proportional to the distance between the two. The pedestrian movement direction and movement probability are shown in Figure 4.
The Static Floor Field
The static floor field is a powerful concept that illuminates how attractive destinations, such as exits, affect pedestrian trajectories independent of changes in pedestrian location and time. The static floor field distribution of a space’s large-span structure is shown in Figure 5.
Specifically, the static floor field quantifies the minimum distance a pedestrian must travel to reach an exit from within a building [29], and can be expressed mathematically by the following equation:
where represents the distance from the cellular to the exit, which can be calculated using the following equation:
where is the set of exit occupation units.
The Dynamic Floor Field
The dynamic floor fields are used to characterize pedestrian interactions in which the walking path of one person affects the direction of movement of others, spreading and decaying over time. The dynamic floor field is calculated as follows:
Step 1. Before the pedestrian walks, the dynamic floor field strength of all cellular is 0. When a pedestrian passes through cellular , .
Step 2. According to the principle of decay and diffusion with time, the dynamic floor field can be expressed as the following equation:
where and are the diffusion and attenuation parameters, respectively, both distributed in . represents the dynamic field of the three neighbors near cellular at the previous time step.
2.2.3. The Behaviorally Oriented Floor Field Cellular Automata
Since FFCA can only move units at a fixed speed within each time step, it cannot simulate the behavior of pedestrians with different stride speeds. Literature [29] proposes a CFFCA that combines the advantages of FFCA and SFM. The model treats pedestrians as prime points and uses real coordinates to represent the position of pedestrians to more accurately describe pedestrian movement. We introduce stride frequency and stride length as pedestrian stride speed parameters to characterize the stride speed of each pedestrian. Meanwhile, by introducing the judgment parameters , , and for the three behaviors of walking straight, overtaking, and following. is transformed from the transition probability to the selection probability of the pedestrian’s walking direction. Such improvement makes the model more flexible and accurate. Figure 6 provides an example of how these parameters are defined.
The behavioral judgment parameters are defined in the following equation:
When , ; when , ; when , and the pedestrian stride length is updated to .
The selection factor for the pedestrian walking direction can be expressed by the following equation:
BO-FFCA can be expressed as the following equation:
The value of the pedestrian’s stride speed can be expressed by the following equation:
where represents different pedestrians. is the th time step, . are the stride frequency and stride length of pedestrians, respectively.
In BO-FFCA, the walking behavior of pedestrians can be composed of two parts: stride speed as well as walking direction vector, which can be expressed by the following equation:
where denotes the pedestrian’s walking velocity vector at , is the pedestrian’s unit walking direction vector in BO-FFCA.
2.2.4. State Update Rules
We control the maximum number of pedestrians within the structure by utilizing crowd density. To enhance computational efficiency, we simulate the pedestrian walking process only when the number of pedestrians inside the structure reaches the predetermined crowd density, disregarding the process of pedestrians entering the structure. Through numerical methods, we obtained the set of possible initial pedestrian spatial distribution states. The following presents the specific update rules for the crowd walking routes:
- (a)
- The initial pedestrian spatial distribution states are randomly selected from the set of possible initial pedestrian spatial distribution states.
- (b)
- Calculate the selection probability of the walking direction for each walker at each time based on Equations (6)–(8).
- (c)
- Equation (9) is used to calculate the stride speed of the pedestrians in the corresponding time step.
- (d)
- The pedestrian’s walking behavior is described according to Equation (10), and the real coordinates of the traveler at the next time step are calculated.
- (e)
- Transforms pedestrian real coordinate positions to integer cellular positions.
- (f)
- Update the time step and loop rules (b)–(e).
2.3. Development and Application of a Walking Load Database for Stochastic Crowds
First, the pedestrian walking space is generated according to the spatial discretization rules and structural information, and the discretized cell number information is output. Each pedestrian particle has an initial random walking parameter, and the stride frequency and weights remain constant during the walking process, but the stride length will change according to the state update rule. Then, the crowd walking process is simulated according to the state update rule. The position of pedestrians and the corresponding vertical excitation data in each discrete time step are output to create a load information base. As mentioned earlier, the structural surface of the FE model is divided according to the metric grid size that represents the space occupied by the pedestrians. The FE software (ANSYS, Canonsburg, PA, USA) reads the pedestrian position information from the load information library according to the time step sequence. Based on the pedestrian location information, the corresponding loads for pedestrians are applied at the corresponding locations on the surface of the FE model structure. Finally, the transient dynamics analysis module in the FE software was utilized to solve for the structural response at time steps. Figure 7 shows the location distribution of pedestrians on the structure and the load data applied to the FE model at the corresponding time step for a crowd density of 0.1 person/m2.
3. Validation of Stochastic Crowd-Loading Model
3.1. Dynamic Characterization of Space Large-Span Structure
3.1.1. Dynamic Characterization Tests of Space Large-Span Structure
We adopted the environmental random excitation method to test the dynamic characteristics of large-span space structures. During the test, we used the INV3065N (China Orient Institute of Noise &Vibration, Beijing, China.) series dynamic collector compatible with the Coinv DASP V11 (China Orient Institute of Noise &Vibration, Beijing, China.) acquisition system and 891-2 pickup oscillator (Institute of Engineering Mechanics, China Earthquake Administration, Harbin, China.) to collect the dynamic response of the structure under environmental excitation. The sampling frequency was set at 50 Hz, and the sampling time was 1800 s. The 891-2 pickup used in this test has the following specifications: sensitivity of 0.1 V/m·s−2, acceleration range of 0–100 m/s2, passband 0.5–80 Hz, and output load resistance of 300 KΩ. The dynamic response acquisition system is shown in Figure 8.
Considering the large geometrical dimensions of the structure and the limited number of pickups, the batch acquisition method was used for data collection in this dynamic characterization test. The structure was meshed with a grid size of 8.4 m × 8.4 m. The pickups were placed at the center of each grid, and the reference point was located at the center of the span. In the process of batch data acquisition, keep the picker at the reference point location unmoving and move the other pickers until the data acquisition of the whole structure is completed. The arrangement of the measurement points is shown in Figure 9. The time course profile of the acceleration response of the reference point under environmental excitation is shown in Figure 10. Due to the large amount of data for the complete time-course curves, we chose half of the time-course curves to show.
The batch-acquired acceleration response signals are processed by the stochastic subspace algorithm (SSI). Table 2 lists the out-of-plane modal information of the structure with a high number of stabilization maps. The first three orders of out-of-plane vibration integrated frequencies of the structure were finally determined to be 4.675 Hz, 5.760 Hz, and 7.731 Hz, with the corresponding damping ratios of 1.237%, 1.070%, and 0.711%, respectively. The same method was used to determine the transverse modal parameters of the structure, and the 1st-order transverse vibration integrated frequency was 1.761 Hz with a corresponding damping ratio of 0.65%.
3.1.2. Finite Element Modal Analysis of Space Large-Span Structure
The vibration response of the space large-span structure under pedestrian loads falls within the normal service condition analysis. Due to the relatively low stress levels in the beams and slabs, their displacement and acceleration responses occur predominantly within the elastic phase. Therefore, we adopt a linear elasticity principal relationship for the elastic analysis of each member, disregarding the reinforcement and slip relationship in the concrete slab and focusing solely on the concrete and steel beams. The concrete slab on the surface of the structure is made of C30 grade concrete, and the steel structures, such as the top and bottom chords and the shear connectors, adopted Q355C steel. According to the relevant standards and studies [6,41], the material parameters are shown in Table 3. According to the actual state of the structure, the boundary conditions of the FE model are defined according to the simple support method. The left end is defined as a fixed support, which constrains all the degrees of freedom in the X, Y, and Z directions. The right end is defined as the sliding support, which constrains the degrees of freedom in the Y and Z directions. The X direction is the length direction of the structure, the Z direction is the width direction of the structure, and the Y direction is the height direction of the structure. The loading conditions applied to the FE model at a particular time step when the transient dynamic analysis is solved by the FE software are shown in Figure 7. We use BEAM188 cells in ANSYS to simulate steel beams and employ adaptive meshing techniques to divide the hexahedral cells. For the reinforced concrete floor slabs, we use SHELL181 cells in ANSYS, dividing the hexahedral cells along the length and width directions of the concrete slabs with a length of 0.6 m. In addition, we use MASS21 cells in ANSYS to simulate the mass of the glass curtain wall on the space large-span structure. To account for damping effects, we incorporate Rayleigh damping in the FE model. According to the structural dynamics, the Rayleigh damping coefficient can be calculated by the following equation:
where is the i-th order intrinsic frequency of the structure, is the j-th order intrinsic frequency of the structure, and is the modal damping ratio of the structure.
Human-induced vibrations appear in a low-frequency range (less than 5 Hz [42]). By analyzing the out-of-plane vibration intrinsic frequency and modal damping ratio of the space large-span structure, we chose the 1st and 4th-order intrinsic frequency of the structure to calculate the Rayleigh damping coefficients. The Rayleigh damping coefficients are and . The FE model is presented in Figure 11.
The first three orders of modal shapes of the structure were calculated by the FE software, as shown in Figure 12.
Its 1st-order frequency is , and the maximum displacement amplitude occurs at the center of the structure. The measured and calculated frequency information of the space large-span structure is shown in Table 4.
According to Table 4, both the calculated and measured 1st vibration frequencies of the space large-span structure exceed 3 Hz. This is due to the presence of horizontal and lateral bracing between the upper and lower stringers, which ensures that the structure has good lateral stiffness. Research findings indicate that the maximum error between the FE model calculations and the structural measurements for the first three vertical frequencies is 1.439%. The relative error between the measured and calculated values remains within 5%. These results demonstrate the effective capability of the FE model in reflecting the dynamic characteristics of the actual structure. Therefore, the FE model can be confidently utilized in subsequent analyses.
3.2. Finite Element Computational Validation of Stochastic Crowd-Loading Model
As pedestrians walk on the structure, their walking parameters, walking routes, and the number of pedestrians often vary, causing the pedestrian loads generated on the structure to have high randomness. Therefore, conducting actual tests to study the dynamic response of the structure under stochastic crowd load excitation not only requires significant material and financial resources but may also fail to achieve the desired experimental objectives. In this study, we chose to input different stride frequencies and walking path conditions measured from actual scenarios into the established stochastic crowd load model in the previous section, generating corresponding load data and solving them on the FE model. We compared the calculation results at the center point of the space large-span structure with the measured results to verify the accuracy of the FE calculation of the aforementioned stochastic crowd load model. The measured scenario of human-induced vibration of the space large-span structure is shown in Figure 13.
3.2.1. Human-Induced Vibration Testing of Space Large-Span Structure
The stride frequency of the pedestrians was regulated using a metronome. Before the official test, each tester underwent an acclimatization process to synchronize their walking rhythm with the metronome. The relevant information of the testers is presented in Table 5.
The stride frequency of the tester is determined according to the 1/2 octave and 1/3 octave of the 1st-order out-of-plane vibration frequency of the space large-span structure and the applicable range of the stride frequency of the time-domain loading model. The stride frequency of the pedestrian in this human-induced vibration test is selected to be 1.5 Hz, 2.0 Hz, and 2.3 Hz. The specific test conditions are shown in Table 6, and the arrangement of the measurement points is shown in Figure 14.
3.2.2. Finite Element Accuracy Verification of Stochastic Crowd-Loading Model
In the transient dynamic analysis of the FE model, we chose the complete method as the calculation method through the above stochastic crowd load model; we carried out the FE solution for the structural response under the corresponding working conditions and chose the average value of the data of 10 calculations as the final result. Figure 15 and Figure 16 show the measured and FE-calculated acceleration response curves at the center point of the span of the space large-span structure under different working conditions.
The results of the corresponding peak acceleration test data are shown in Table 7.
According to Table 7, the structural response is closely related to the pedestrian parameters and walking routes. At different stride frequencies, the size of the error in the comparison of the structural response caused by the deterministic route and the random route is different, and there is no obvious pattern to follow. By analyzing the peak acceleration data, the structural response, both measured and FE-calculated, was smaller for the random route compared to the deterministic route. The calculated values from the FE analysis were consistently higher than the measured values for all working conditions. The reason for this difference is that the pedestrian weight parameters used in the stochastic crowd load model are based on the average values obtained from the experimental subjects. The maximum comparison error between the two conditions was 20.585% when the stride frequency was 2.3 Hz. This is because as the stride frequency of the experimental subjects increased, it became difficult for them to synchronize with the metronome frequency even though the metronome was controlling the stride frequency, which led to an increase in the comparison error. However, under other working conditions, the FE calculations using the stochastic crowd load model agree well with the measurements, and the structural response comparison error does not exceed 12%. This indicates that the stochastic crowd load model proposed in this study effectively predicts the structural response and shows high reliability.
4. Vibration Suitability Assessment of Space Large-Span Structure
Structural vibration suitability is usually measured by the peak acceleration of the out-of-plane vibration of the structure [43,44,45]. By the Chinese industry standard [43,44], the 1st-order vertical self-vibration frequency of the building structure with walking excitation should not be lower than 3 Hz. Similarly, the 1st-order transverse self-vibration frequency of connecting corridors and pedestrian bridges should not be lower than 1.2 Hz. Furthermore, the German EN03 specification [45] specifies the range of vibration-sensitive frequencies. For out-of-plane vibrations, the 1st-order frequency range is 1.25 to 2.30 Hz, while the 2nd-order frequency range is 2.50 to 4.60 Hz. Transverse vibrations, on the other hand, fall within a frequency range of 0.5 to 1.2 Hz. Additionally, the EN03 specification provides four levels of comfort, as outlined in Table 8.
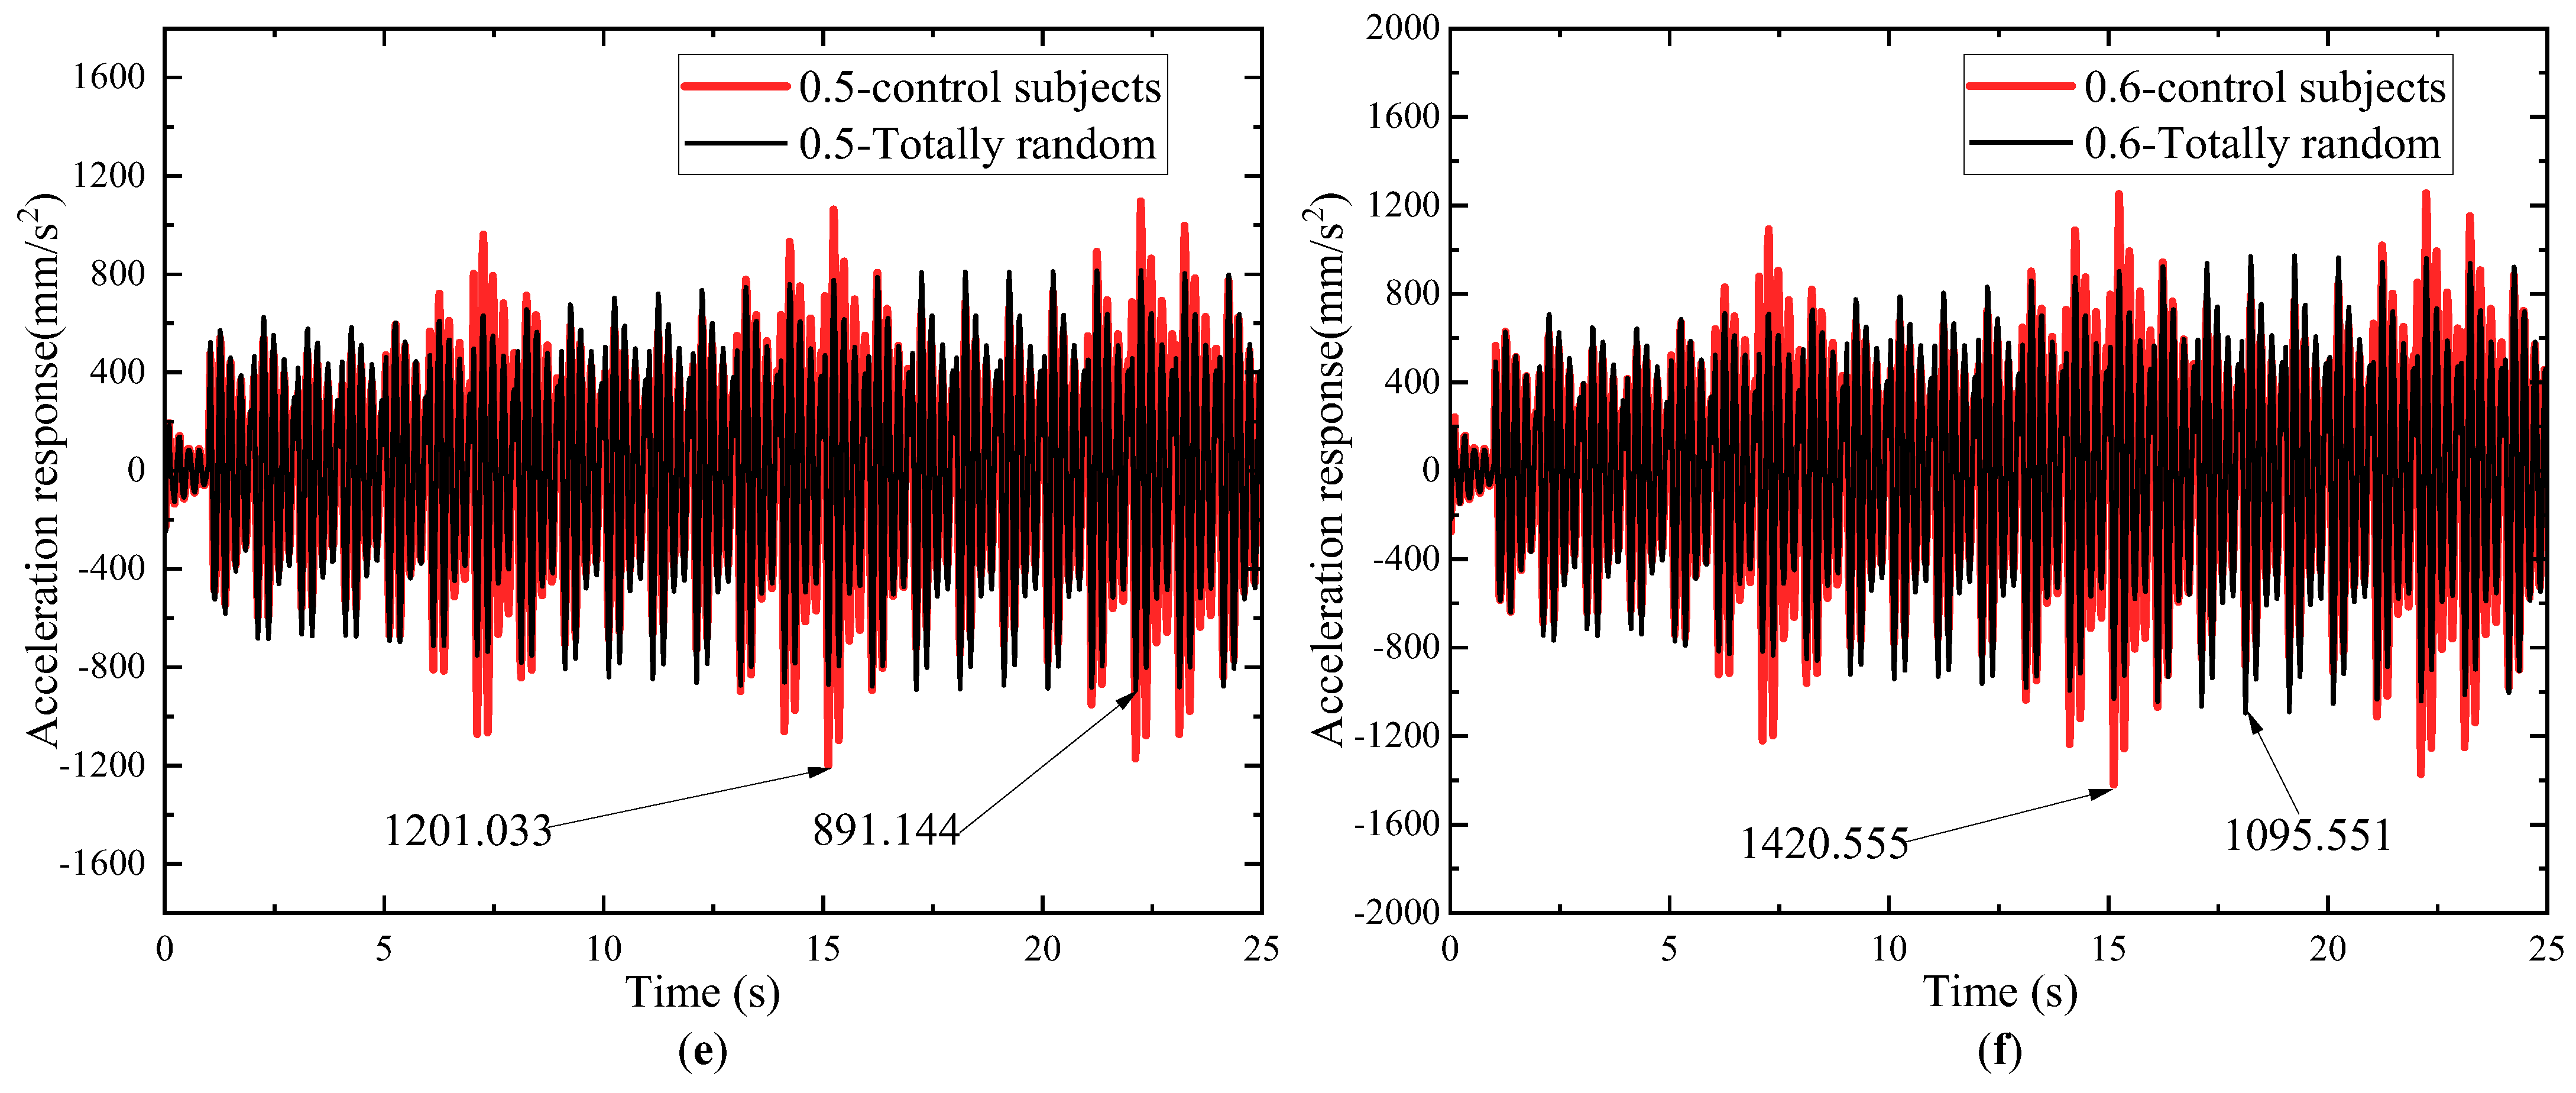
Based on Table 4, it is evident that the calculated value of the 1st-order out-of-plane vibration frequency for the structure is 4.590 Hz, falling within the range of the second-order vibration-sensitive frequency. However, the 2nd-order out-of-plane vibration frequency is 5.730 Hz, which is outside the range of the out-of-plane vibration-sensitive frequency. Moreover, the 1st-order horizontal vibration frequency is 1.761 Hz, meeting the requirements of both standards. Therefore, only the comfort of out-of-plane vibration needs to be evaluated. The acceleration-time response curves of the space large-span structure under different working conditions of crowd walking parameters, walking routes, and crowd density are shown in Figure 17. The specific working condition settings are shown in Table 9.
From Figure 17, we can derive the comfort evaluation ratings of the corresponding working conditions for different crowd densities, as shown in Table 9.
According to Table 9, the maximum mass ratio for all crowd density conditions is 3.71%, so the effect of pedestrian weight on the vibration response of the structural system is not considered here. Under totally random conditions, the highest comfort ratings were achieved when the crowd density remained at or below 0.2 Person/m2. On the contrary, under the same randomized conditions, the lowest comfort scores of the structure were obtained when the crowd density exceeded 0.5 Person/m2. To ensure that the structure consistently maintains a high level of comfort when randomized crowds are walking, it is recommended that the crowd density be kept at an upper limit of 0.5 Person/m2.
5. Influence of Stochastic Crowd-Loading Model Parameters on Structural Dynamic Response
5.1. Influence of Walking Parameters on Structural Dynamic Response
To investigate the effect of different random pedestrian parameters on the dynamic response of space large-span structure, we set up eight pedestrian parameter operating conditions at a crowd density of 0.2 Person/m2. These conditions include single parameter randomization, dual parameter randomization, all parameter randomization, and all parameter averaging. To reduce the impact of the random initial position distribution and the dynamic behavior of the pedestrians, we set a deterministic walking route for the pedestrians and selected ten calculation results for processing. The specific working conditions are shown in Table 10. The time-range cumulative displacements at the center point of the structure at 25 s for each working condition are illustrated in Figure 18.
To better assess the impact of randomized pedestrian parameters on the dynamic response of space large-span structure, we used the coefficient of variation (C.O.V) of the time-range cumulative displacement at the center point of the structure at 25 s as a measure of the importance of different levels of randomization in pedestrian parameters. Based on the data presented in Figure 18, C.O.V values were calculated for different levels of randomization, which are summarized in Table 10.
As can be seen from Table 10, the cumulative displacement difference between the time-range centroid of the span center point of the space large-span structure under control subject condition and totally random condition is 2.71%, which proves that it is feasible to use the results of 10 calculations with data. Additionally, to determine the relative importance of each level of randomization under different working conditions, we present corresponding importance indicators in Figure 19.
By studying the randomness of a single walking parameter, it is found that the C.O.V was randomized by stride frequency, randomized by weight, and randomized by stride length in descending order. The corresponding importance indices of walking parameters are 30.4%, 26.7%, and 24.4%, which are all greater than the 18.5% of the control subjects. This phenomenon indicates that the randomness of all three walking parameters has a significant effect on the dynamic response of the structure. Among them, the most influential on the dynamic response of the structure is the stride frequency randomness. When considering the stochastic combination of dual walking parameters, the coefficients of variation were found to be stride frequency, stride length stochastic combination, stride frequency, weight stochastic combination and stride length, and weight stochastic combination in descending order. The corresponding walking parameter importance indices were 39.5%, 21.3%, and 17.8%, respectively. This phenomenon indicates that when considering the dual walking parameter combination randomness, the stride frequency and stride length combination randomness have the most significant effect on the dynamic response of the structure.
5.2. Influence of Pedestrian Dynamic Behavior on Structural Dynamic Response
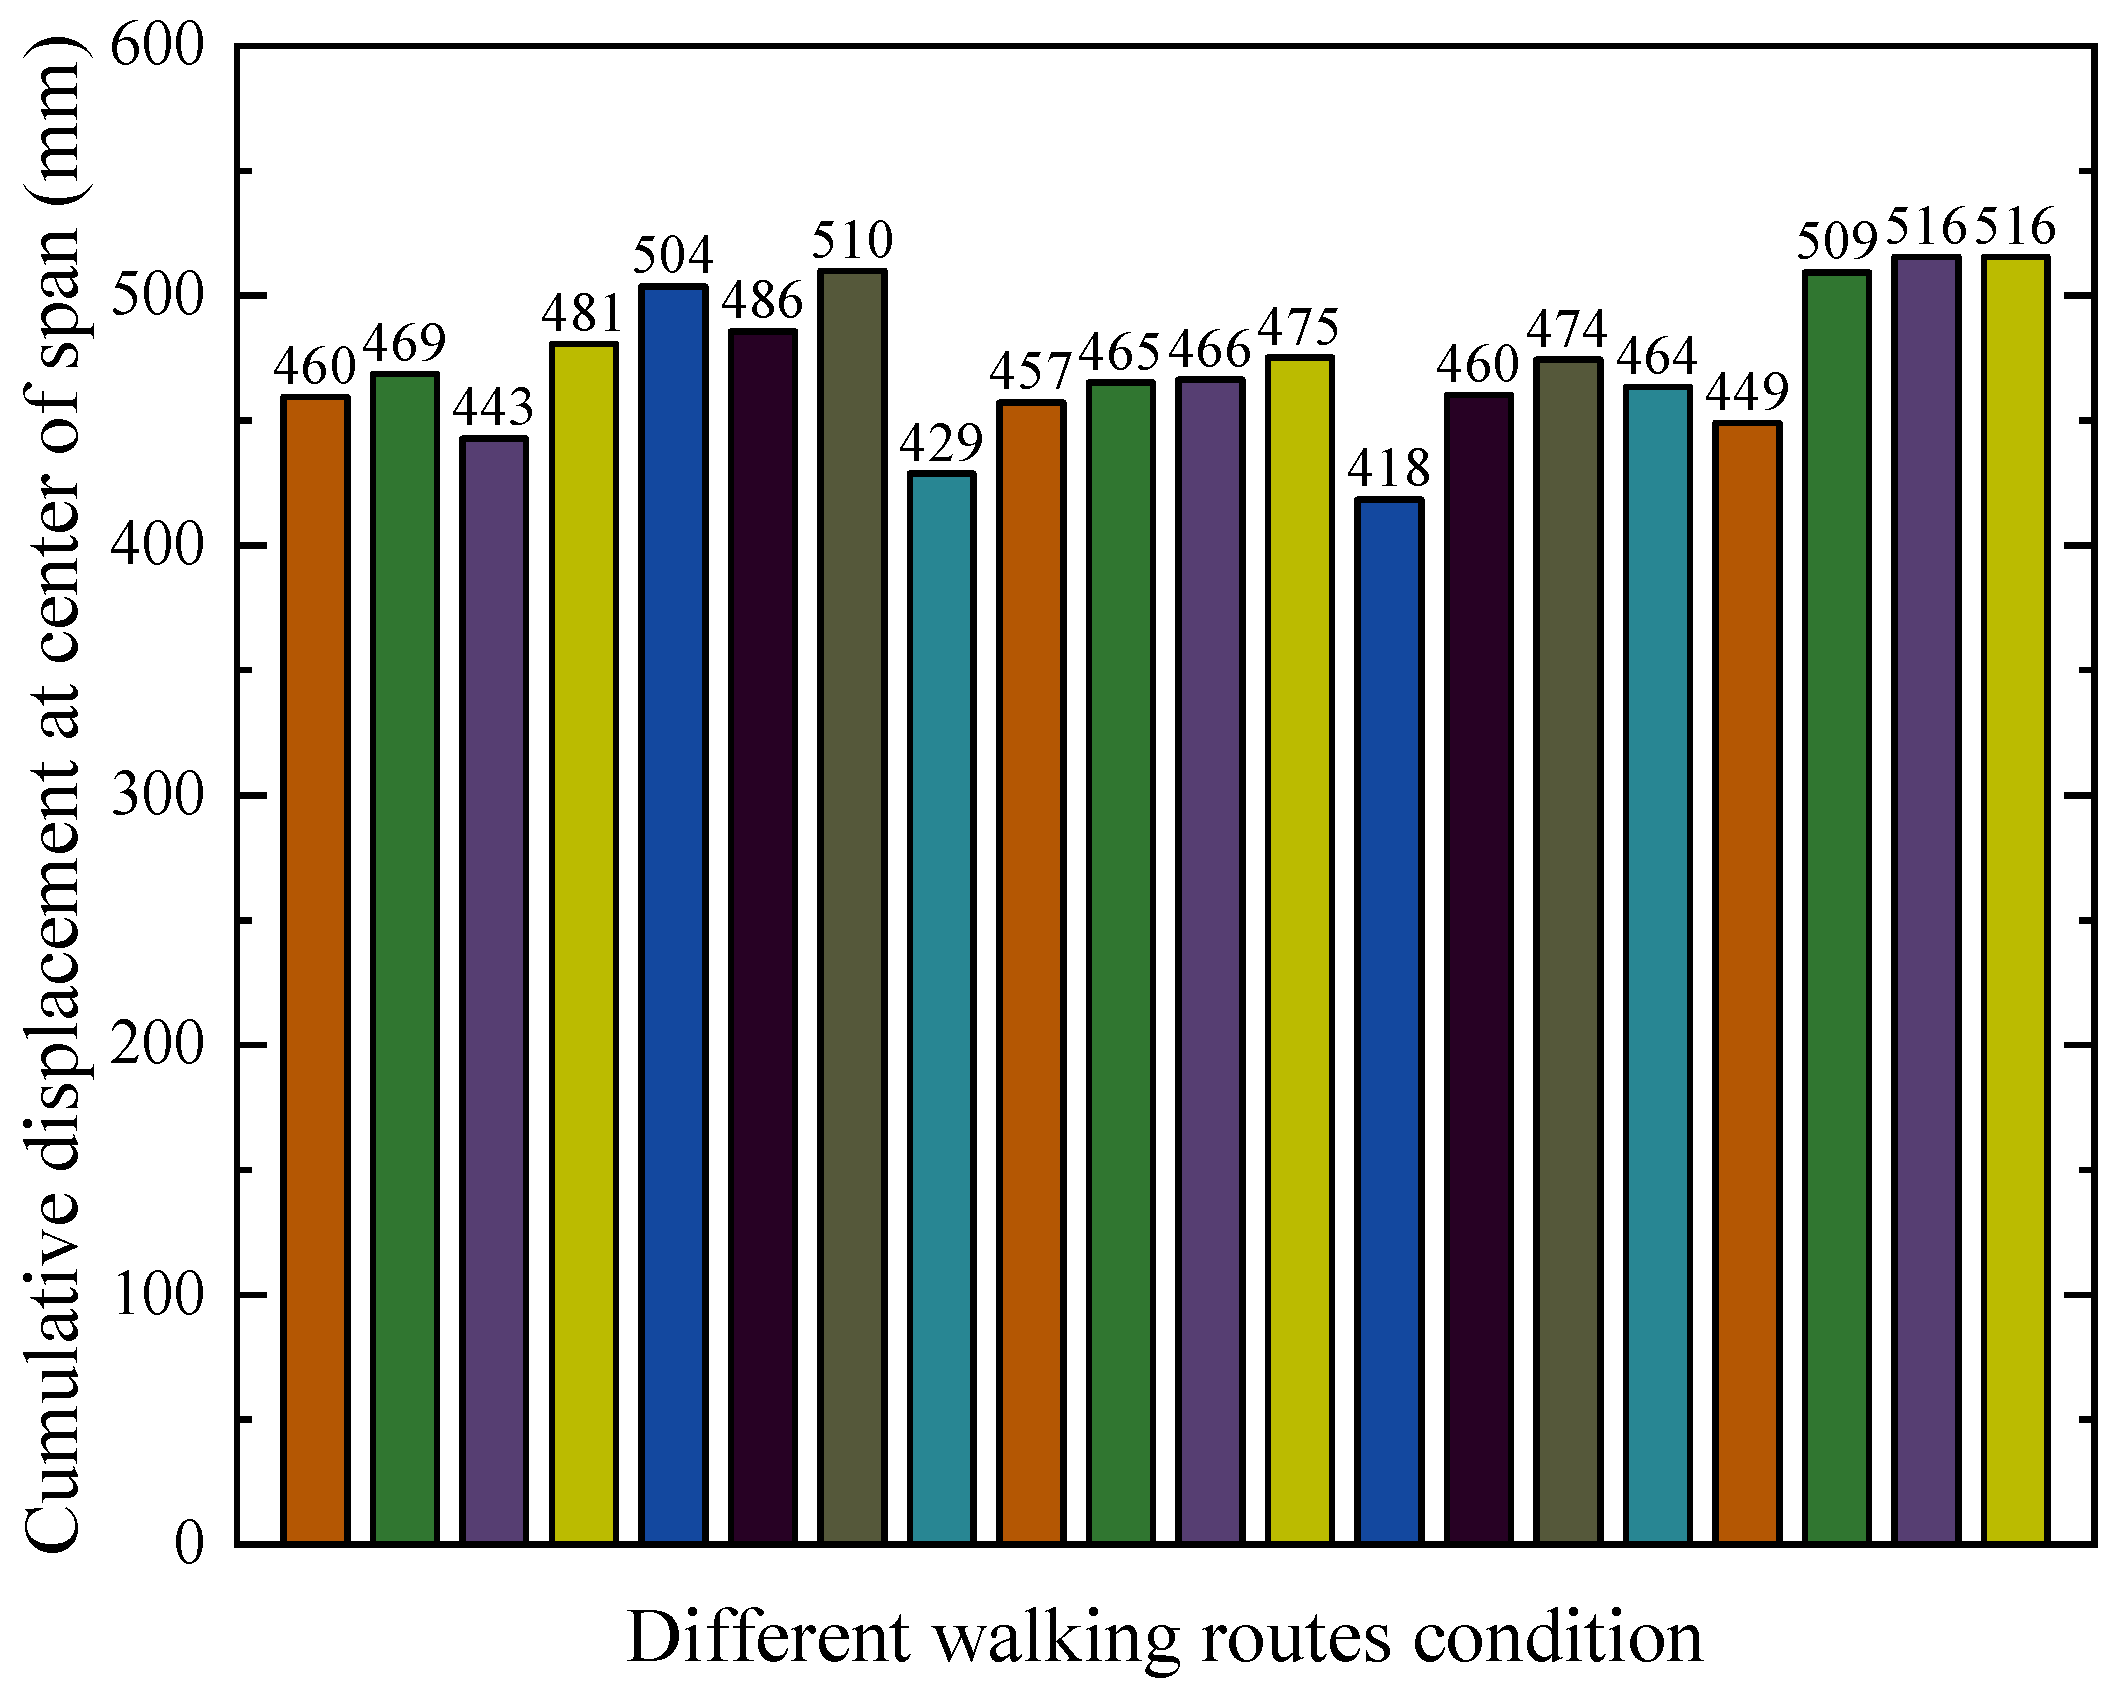
To investigate the effect of pedestrian dynamic behavior on the dynamic response of the space large-span structure, we have taken different walking routes as an example to study the dynamic behavior of pedestrians. We randomly generated 20 different walking routes at a crowd density of 0.2 Person/m2 using the pedestrian parameters under Gaussian averaging conditions. Then, the time-range cumulative displacement of each route at the center of the structure in 25 s is calculated. The results are shown in Figure 20.
The difference between the maximum and minimum values of the time-range cumulative displacements at the center point of the structure under the above random conditions reaches 98 mm. This phenomenon suggests that the dynamic behavioral characteristics of pedestrians during crowd walking can have a significant impact on structural response.
5.3. Influence of Crowd Density on Structural Dynamic Response
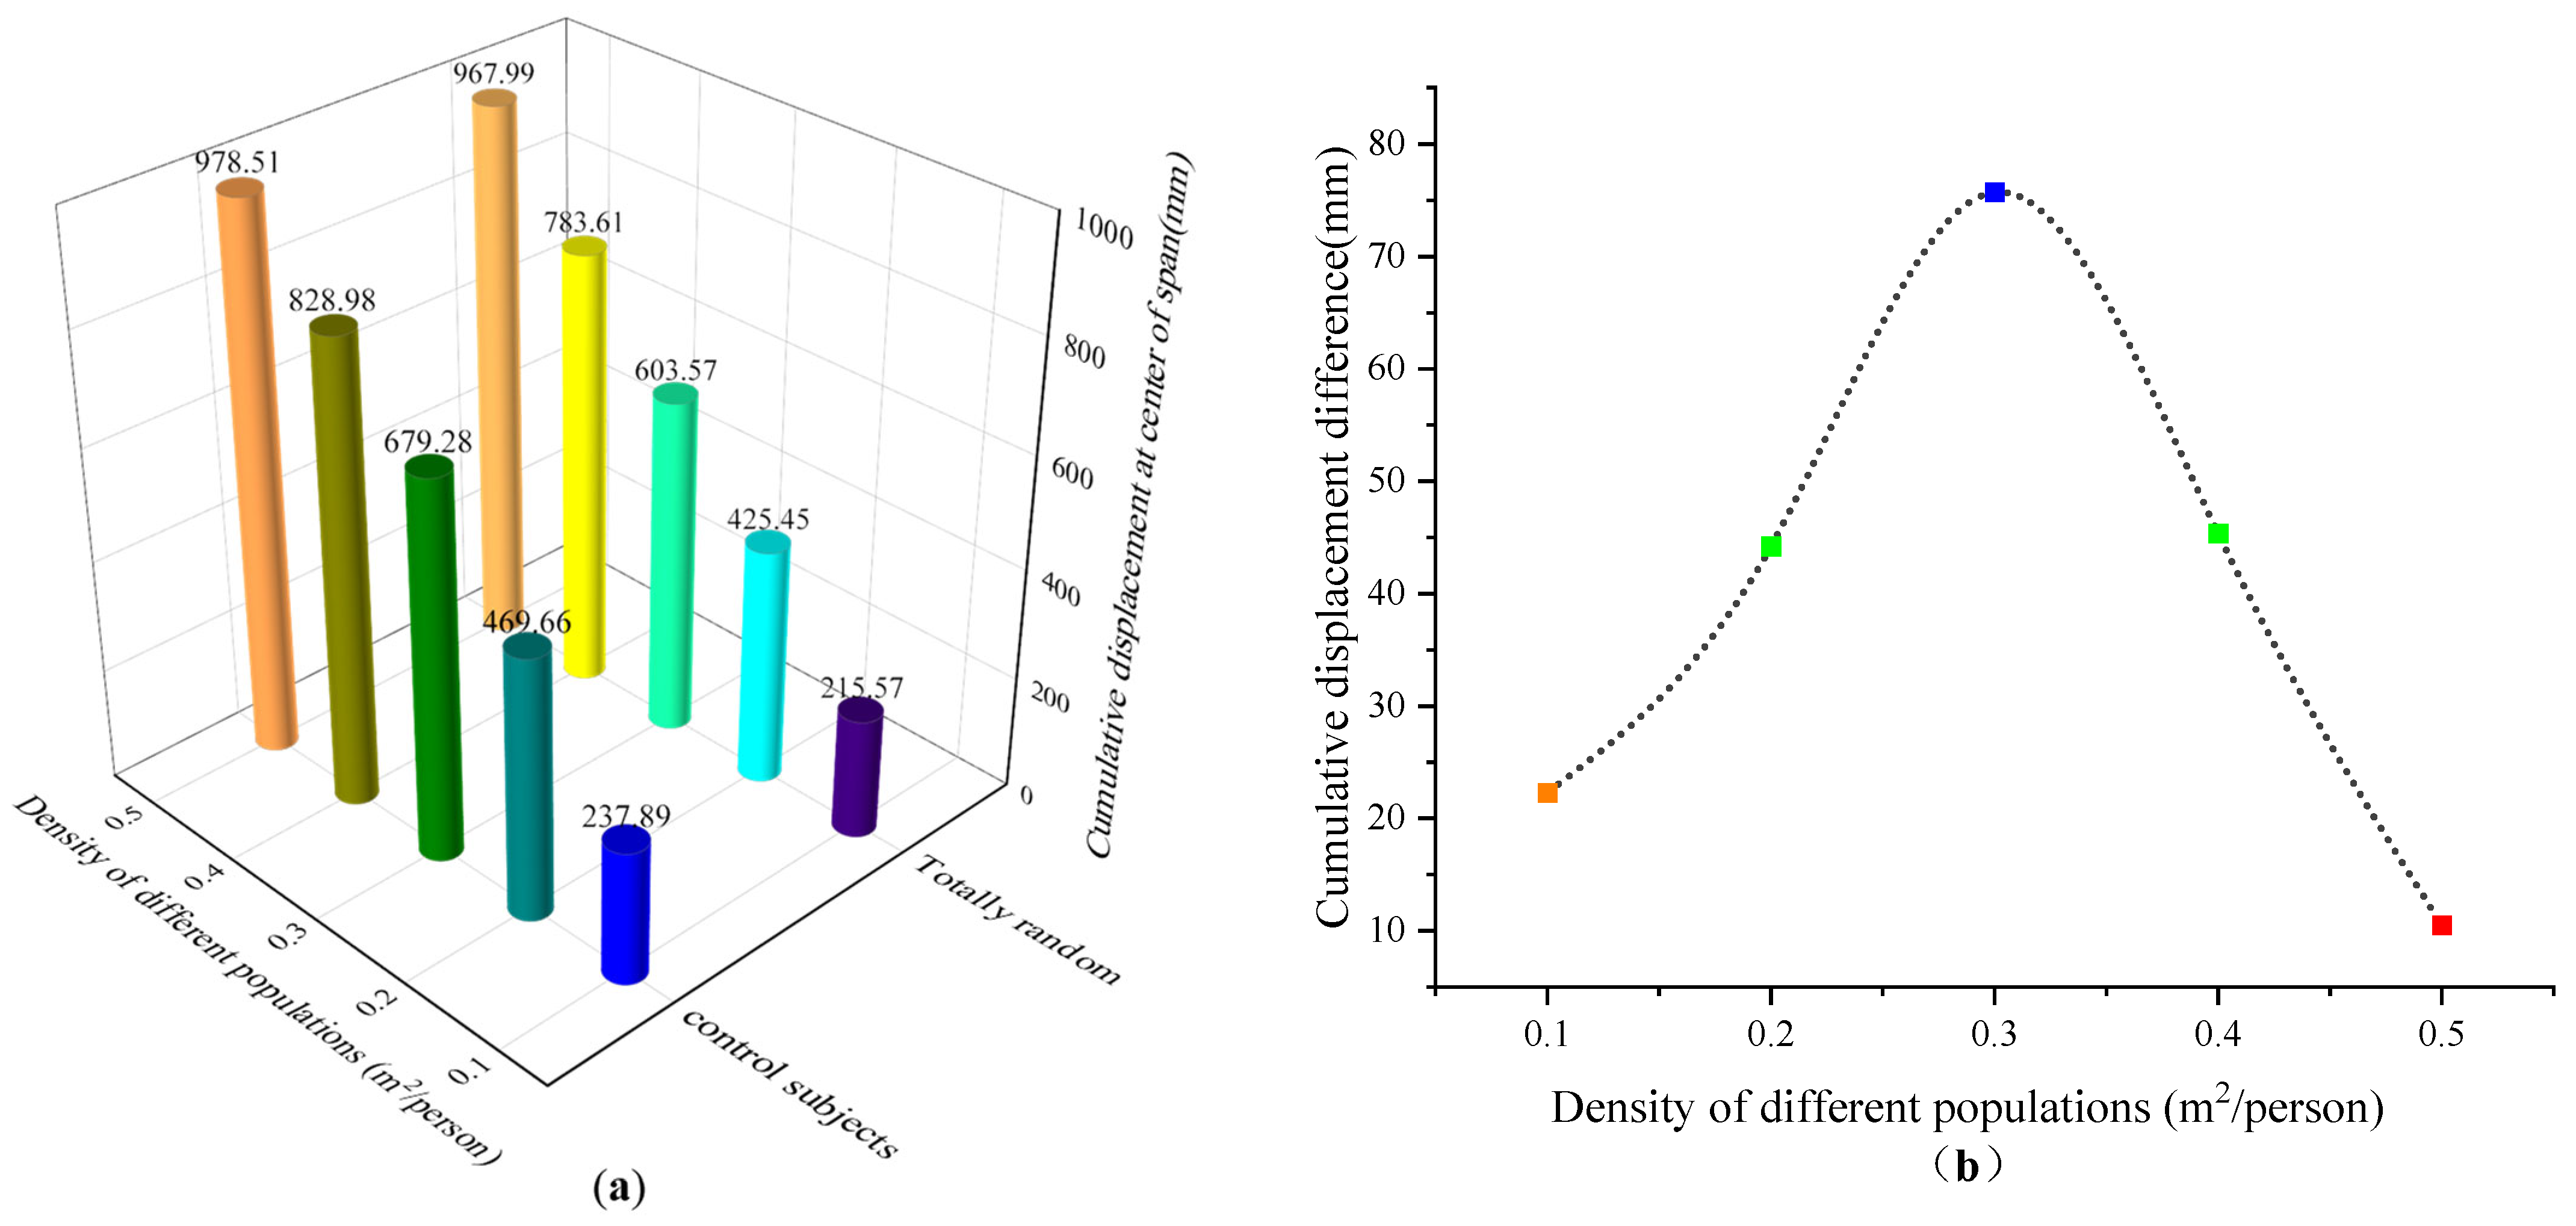
We investigated the effect of crowd density on the dynamic response of a space large-span structure by considering two distinct working conditions: control subject and totally random. These conditions are explored across various crowd densities. Subsequently, the time-range cumulative displacement of the structure’s center point was calculated over a 25-s duration under each working condition. The resulting data are depicted in Figure 21.
From Figure 21a, it can be seen that the cumulative displacements of the center point of the space large-span structure increase continuously with the increase of crowd density, which indicates that the structural response is increasing with the increase of crowd density. From Figure 21b, it can be seen that the cumulative displacement difference between the two working conditions shows a tendency to increase and then decrease with the increase in crowd density. This phenomenon indicates that the number of randomness combinations of crowd load model parameters increases with the increase of crowd density, which is close to the actual situation of the crowd walking. When the crowd density reaches 0.3 Person/m2, the cumulative displacement difference between the two conditions is 75.71 mm, which reaches the peak value for all the conditions. This indicates that the crowd density at this time is the limit of the crowd density that satisfies the requirement of a random combination of all parameters. When the crowd density increases further, the cumulative displacement difference between the two conditions begins to decrease. This indicates that the crowd is already in the early stage of the crowding phenomenon. This leads to the limitation of the random combination of stride frequency and stride length, which in turn affects the dynamic behavior of the pedestrians.
6. Conclusions
A stochastic crowd-loading model is developed based on BO-FFCA that integrates pedestrian walking parameters, pedestrian dynamic behavior, crowd density, and induced forces in the crowd. The model’s effectiveness was verified using a space large-span structure as an example. Using this model as a basis, the study investigated the influence of walking parameters, walking routes, and crowd density on the dynamic response of the structure and evaluated its comfort level. This study is an important reference for the dynamic response and comfort evaluation of pedestrian bridges, large span structures in space, and large venues with public use functions under random crowd excitation. The following conclusions can be drawn from this study:
1. When the crowd density does not exceed 0.5, the comfort level of this space’s large-span structure can meet the relevant standard requirements.
2. The randomness of different walking parameters has different degrees of influence on the structural dynamic response. When considering the effect of a single walking parameter, the randomness of stride frequency has the most significant effect on the structural dynamic response, while considering the effect of a combination of dual walking parameters, the combined randomness of stride frequency and stride length has the most significant effect on the structural dynamic response.
3. The influence of the dynamic behavior of pedestrians on the dynamic response of a structure is very significant. Therefore, the effect of pedestrian dynamic behavior (e.g., walking routes) on the dynamic response of a structure must be considered when studying problems related to human-induced vibration.
4. As the density of the crowd increases, the effects of random combinations of walking parameters and the dynamic behavior of pedestrians on the dynamic response of the structure tend to first increase and then decrease.
Author Contributions
Conceptualization, Q.X. and S.Y.; methodology, S.Y.; software, Q.X.; validation, M.Y. and C.S.; formal analysis, Q.X.; investigation, S.Y.; resources, G.W. and J.H.; data curation, C.S.; writing—original draft preparation, S.Y.; writing—review and editing, Q.X.; visualization, S.Y.; supervision, Q.X.; project administration, G.W. and J.H. All authors have read and agreed to the published version of the manuscript.
Funding
This research received no external funding.
Data Availability Statement
Data will be provided upon request by the corresponding author via email.
Conflicts of Interest
Authors Gang Wang and Junfu He were employed by the company China Railway 17th Bureau Group 1st Engineering Co., Ltd. The remaining authors declare that the research was conducted in the absence of any commercial or financial relationships that could be construed as a potential conflict of interest.
References
- Dallard, P.; Fitzpatrick, A.; Flint, A.; Le Bourva, S.; Low, A.; Ridsdill Smith, R.M.; Willford, M. The London Millennium Footbridge. Struct. Eng. 2001, 79, 17–33. [Google Scholar]
- Rönnquist, A.; Strømmen, E.; Wollebæk, L. Dynamic Properties from Full Scale Recordings and FE-Modelling of a Slender Footbridge with Flexible Connections. Struct. Eng. Int. 2008, 18, 421–426. [Google Scholar] [CrossRef]
- Basaglia, B.M.; Li, J.; Shrestha, R.; Crews, K. Response Prediction to Walking-Induced Vibrations of a Long-Span Timber Floor. J. Struct. Eng. 2021, 147, 04020326. [Google Scholar] [CrossRef]
- Chen, Z.; Chen, Z.; Li, G.; Zhang, W.; Zhang, X.; Huang, S.; Chen, Z. Dynamic Response Analysis and Vibration Reduction of Steel Truss Corridor Pedestrian Bridge under Pedestrian Load. Front. Mater. 2022, 9, 839265. [Google Scholar] [CrossRef]
- Cao, L.; Liu, J.; Zhou, X.; Chen, Y.F. Vibration Performance Characteristics of a Long-Span and Light-Weight Concrete Floor under Human-Induced Loads. Struct. Eng. Mech. 2018, 65, 349–357. [Google Scholar] [CrossRef]
- Jiang, L.; Cheng, R.; Zhang, H.; Ma, K. Human-Induced-Vibration Response Analysis and Comfort Evaluation Method of Large-Span Steel Vierendeel Sandwich Plate. Buildings 2022, 12, 1228. [Google Scholar] [CrossRef]
- Živanović, S.; Pavić, A.; Reynolds, P. Probability-Based Prediction of Multi-Mode Vibration Response to Walking Excitation. Eng. Struct. 2007, 29, 942–954. [Google Scholar] [CrossRef]
- Kerr, S.C.; Bishop, N.W.M. Human Induced Loading on Flexible Staircases. Eng. Struct. 2001, 23, 37–45. [Google Scholar] [CrossRef]
- Racic, V.; Brownjohn, J.M.W. Stochastic Model of Near-Periodic Vertical Loads Due to Humans Walking. Adv. Eng. Inform. 2011, 25, 259–275. [Google Scholar] [CrossRef]
- Chen, J.; Peng, Y.X.; Wang, L. Experimental investigation and mathematical modeling of single footfall load using motion capture technology. China Civ. Eng. J. 2014, 47, 79–87. [Google Scholar] [CrossRef]
- Chen, J.; Ding, G.; Živanović, S. Stochastic Single Footfall Trace Model for Pedestrian Walking Load. Int. J. Struct. Stab. Dyn. 2019, 19, 1950029. [Google Scholar] [CrossRef]
- Chen, J.; Wang, H.Q.; Peng, Y.X. Experimental investigation on Fourier-series model of walking load and its coefficients. J. Vib. Shock 2014, 33, 11–15+28. [Google Scholar] [CrossRef]
- Cao, L.L.; Li, A.Q.; Zhang, Z.Q.; Zhou, D.L.; Zhou, C.Y. Human-Induced Vibration Analysis and Measurement of Long-Span Composite Floors. J. Southwest Jiaotong Univ. 2012, 47, 922–928. [Google Scholar] [CrossRef]
- Tang, L.P.; Xie, W.P.; He, W.; Zhang, T. Vibration response characteristics analysis of long-span composite floor under crowd loads. Build. Sci. 2017, 33, 85–90. [Google Scholar] [CrossRef]
- Piccardo, G.; Tubino, F. Equivalent Spectral Model and Maximum Dynamic Response for the Serviceability Analysis of Footbridges. Eng. Struct. 2012, 40, 445–456. [Google Scholar] [CrossRef]
- Ferrarotti, A.; Tubino, F. Generalized Equivalent Spectral Model for Serviceability Analysis of Footbridges. J. Bridge Eng. 2016, 21, 04016091. [Google Scholar] [CrossRef]
- Li, H.; Jian, F.L. Human-induced structural vibrations under crowd walking loads. J. South China Univ. Technol. (Nat. Sci. Ed.) 2010, 38, 125–130. [Google Scholar] [CrossRef]
- Yang, N.; Qiu, X. Crowd density load model and analysis of crowd-induced vibration. J. Beijing Jiaotong Univ. 2016, 40, 88–96. [Google Scholar] [CrossRef]
- Da Silva, F.T.; Brito, H.M.B.F.; Pimentel, R.L. Modeling of Crowd Load in Vertical Direction Using Biodynamic Model for Pedestrians Crossing Footbridges. Can. J. Civ. Eng. 2013, 40, 1196–1204. [Google Scholar] [CrossRef]
- Gazzola, F.; Racic, V. A Model of Synchronisation in Crowd Dynamics. Appl. Math. Model. 2018, 59, 305–318. [Google Scholar] [CrossRef]
- Wang, J.; Chen, J.; Yokoyama, Y.; Xiong, J. Spectral Model for Crowd Walking Load. J. Struct. Eng. 2020, 146, 04019220. [Google Scholar] [CrossRef]
- Li, Y.; He, X.; Zhou, C. Automatic Modulation Recognition Based on a New Deep K-SVD Denoising Algorithm. J. Data Sci. Intell. Syst. 2023. online first. [Google Scholar] [CrossRef]
- Fan, Q.; Jiang, M.; Huang, W.; Jiang, Q. Considering Spatiotemporal Evolutionary Information in Dynamic Multi-objective Optimisation. CAAI Trans. Intell. Technol. 2023. online version of record. [Google Scholar] [CrossRef]
- Mustapha, S.; Kassir, A.; Hassoun, K.; Dawy, Z.; Abi-Rached, H. Estimation of Crowd Flow and Load on Pedestrian Bridges Using Machine Learning with Sensor Fusion. Autom. Constr. 2020, 112, 103092. [Google Scholar] [CrossRef]
- Su, D.; Stanimirović, P.S.; Han, L.B.; Jin, L. Neural Dynamics for Improving Optimiser in Deep Learning with Noise Considered. CAAI Trans. Intell. Technol. 2023. online version of record. [Google Scholar] [CrossRef]
- Li, Y.; Chen, M.; Dou, Z.; Zheng, X.; Cheng, Y.; Mebarki, A. A Review of Cellular Automata Models for Crowd Evacuation. Phys. A Stat. Mech. Its Appl. 2019, 526, 120752. [Google Scholar] [CrossRef]
- Yu, R.; Mao, Q.; Lv, J. An Extended Model for Crowd Evacuation Considering Rescue Behavior. Phys. A Stat. Mech. Its Appl. 2022, 605, 127989. [Google Scholar] [CrossRef]
- Zhao, R.; Zhai, Y.; Qu, L.; Wang, R.; Huang, Y.; Dong, Q. A Continuous Floor Field Cellular Automata Model with Interaction Area for Crowd Evacuation. Phys. A Stat. Mech. Its Appl. 2021, 575, 126049. [Google Scholar] [CrossRef]
- Xue, S.; Claudio, F.; Shi, X.; Li, T. Revealing the Hidden Rules of Bidirectional Pedestrian Flow Based on an Improved Floor Field Cellular Automata Model. Simul. Model. Pract. Theory 2020, 100, 102044. [Google Scholar] [CrossRef]
- Lu, L.; Chan, C.-Y.; Wang, J.; Wang, W. A Study of Pedestrian Group Behaviors in Crowd Evacuation Based on an Extended Floor Field Cellular Automaton Model. Transp. Res. Part C Emerg. Technol. 2017, 81, 317–329. [Google Scholar] [CrossRef]
- Guo, R.; Ren, Y.; Wang, S.X.; Pan, Y. A study on stochastic crowd load model based on crowd density. J. Vib. Shock 2021, 40, 255–263+270. [Google Scholar] [CrossRef]
- Štěpánek, J.; Máca, J. Relation between Stationary and Moving Pedestrian Load Models. Acta Polytech. CTU Proc. 2018, 15, 114–119. [Google Scholar] [CrossRef]
- Li, X.; Wu, J.; Li, X. Theory of Practical Cellular Automaton; Springer: Singapore, 2018; ISBN 978-981-10-7496-7. [Google Scholar]
- Guo, R.-Y. New Insights into Discretization Effects in Cellular Automata Models for Pedestrian Evacuation. Phys. A Stat. Mech. Its Appl. 2014, 400, 1–11. [Google Scholar] [CrossRef]
- Zheng, Y.; Jia, B.; Li, X.-G.; Jiang, R. Evacuation Dynamics Considering Pedestrians’ Movement Behavior Change with Fire and Smoke Spreading. Saf. Sci. 2017, 92, 180–189. [Google Scholar] [CrossRef]
- Guan, J.; Wang, K.; Chen, F. A Cellular Automaton Model for Evacuation Flow Using Game Theory. Phys. A Stat. Mech. Its Appl. 2016, 461, 655–661. [Google Scholar] [CrossRef]
- Hrabák, P.; Bukáček, M. Influence of Agents Heterogeneity in Cellular Model of Evacuation. J. Comput. Sci. 2017, 21, 486–493. [Google Scholar] [CrossRef]
- Li, D.; Han, B. Behavioral Effect on Pedestrian Evacuation Simulation Using Cellular Automata. Saf. Sci. 2015, 80, 41–55. [Google Scholar] [CrossRef]
- Wang, X.; Guo, W.; Zheng, X. Information Guiding Effect of Evacuation Assistants in a Two-Channel Segregation Process Using Multi-Information Communication Field Model. Saf. Sci. 2016, 88, 16–25. [Google Scholar] [CrossRef]
- Huang, R.; Zhao, X.; Zhou, C.; Kong, L.; Liu, C.; Yu, Q. Static Floor Field Construction and Fine Discrete Cellular Automaton Model: Algorithms, Simulations and Insights. Phys. A Stat. Mech. Its Appl. 2022, 606, 128150. [Google Scholar] [CrossRef]
- GB50010-2010; Code for Design of Concrete Structures. China Construction Industry Press: Beijing, China, 2010.
- Schlaich, M.; Brownlie, K.; Cozett, J.; Sobrino, J.; Strasky, J.; Takenouchi, K. Fib Bulletin 32. Guidelines for the Design of Footbridges; fib. The International Federation for Structural Concrete, Ed.; fib Bulletins; fib. The International Federation for Structural Concrete: Lausanne, Switzerland, 2005; ISBN 978-2-88394-072-7. [Google Scholar]
- JGJ99-2015; Technical Specification for Steel Structure of Tall Building. Ministry of Housing and Urban-Rural Development of the People’s Republic of China. China Architecture & Building Press: Beijing, China, 2016.
- JGJ/T441-2019; Technical Standard for Human Comfort of the Floor Vibration. China Architecture & Building Press: Beijing, China, 2019.
- HiVoSS. Human Induced Vibrations of Steel Structures: Design of Footbridges; RFS2-CT-2007-00033, Footbridge_Guidelines_EN03; European Communities: Luxembourg, 2008. [Google Scholar]
Figure 1.
Example of a space large-span structure.

Figure 2.
Normalized single-person walking load time-range curves.
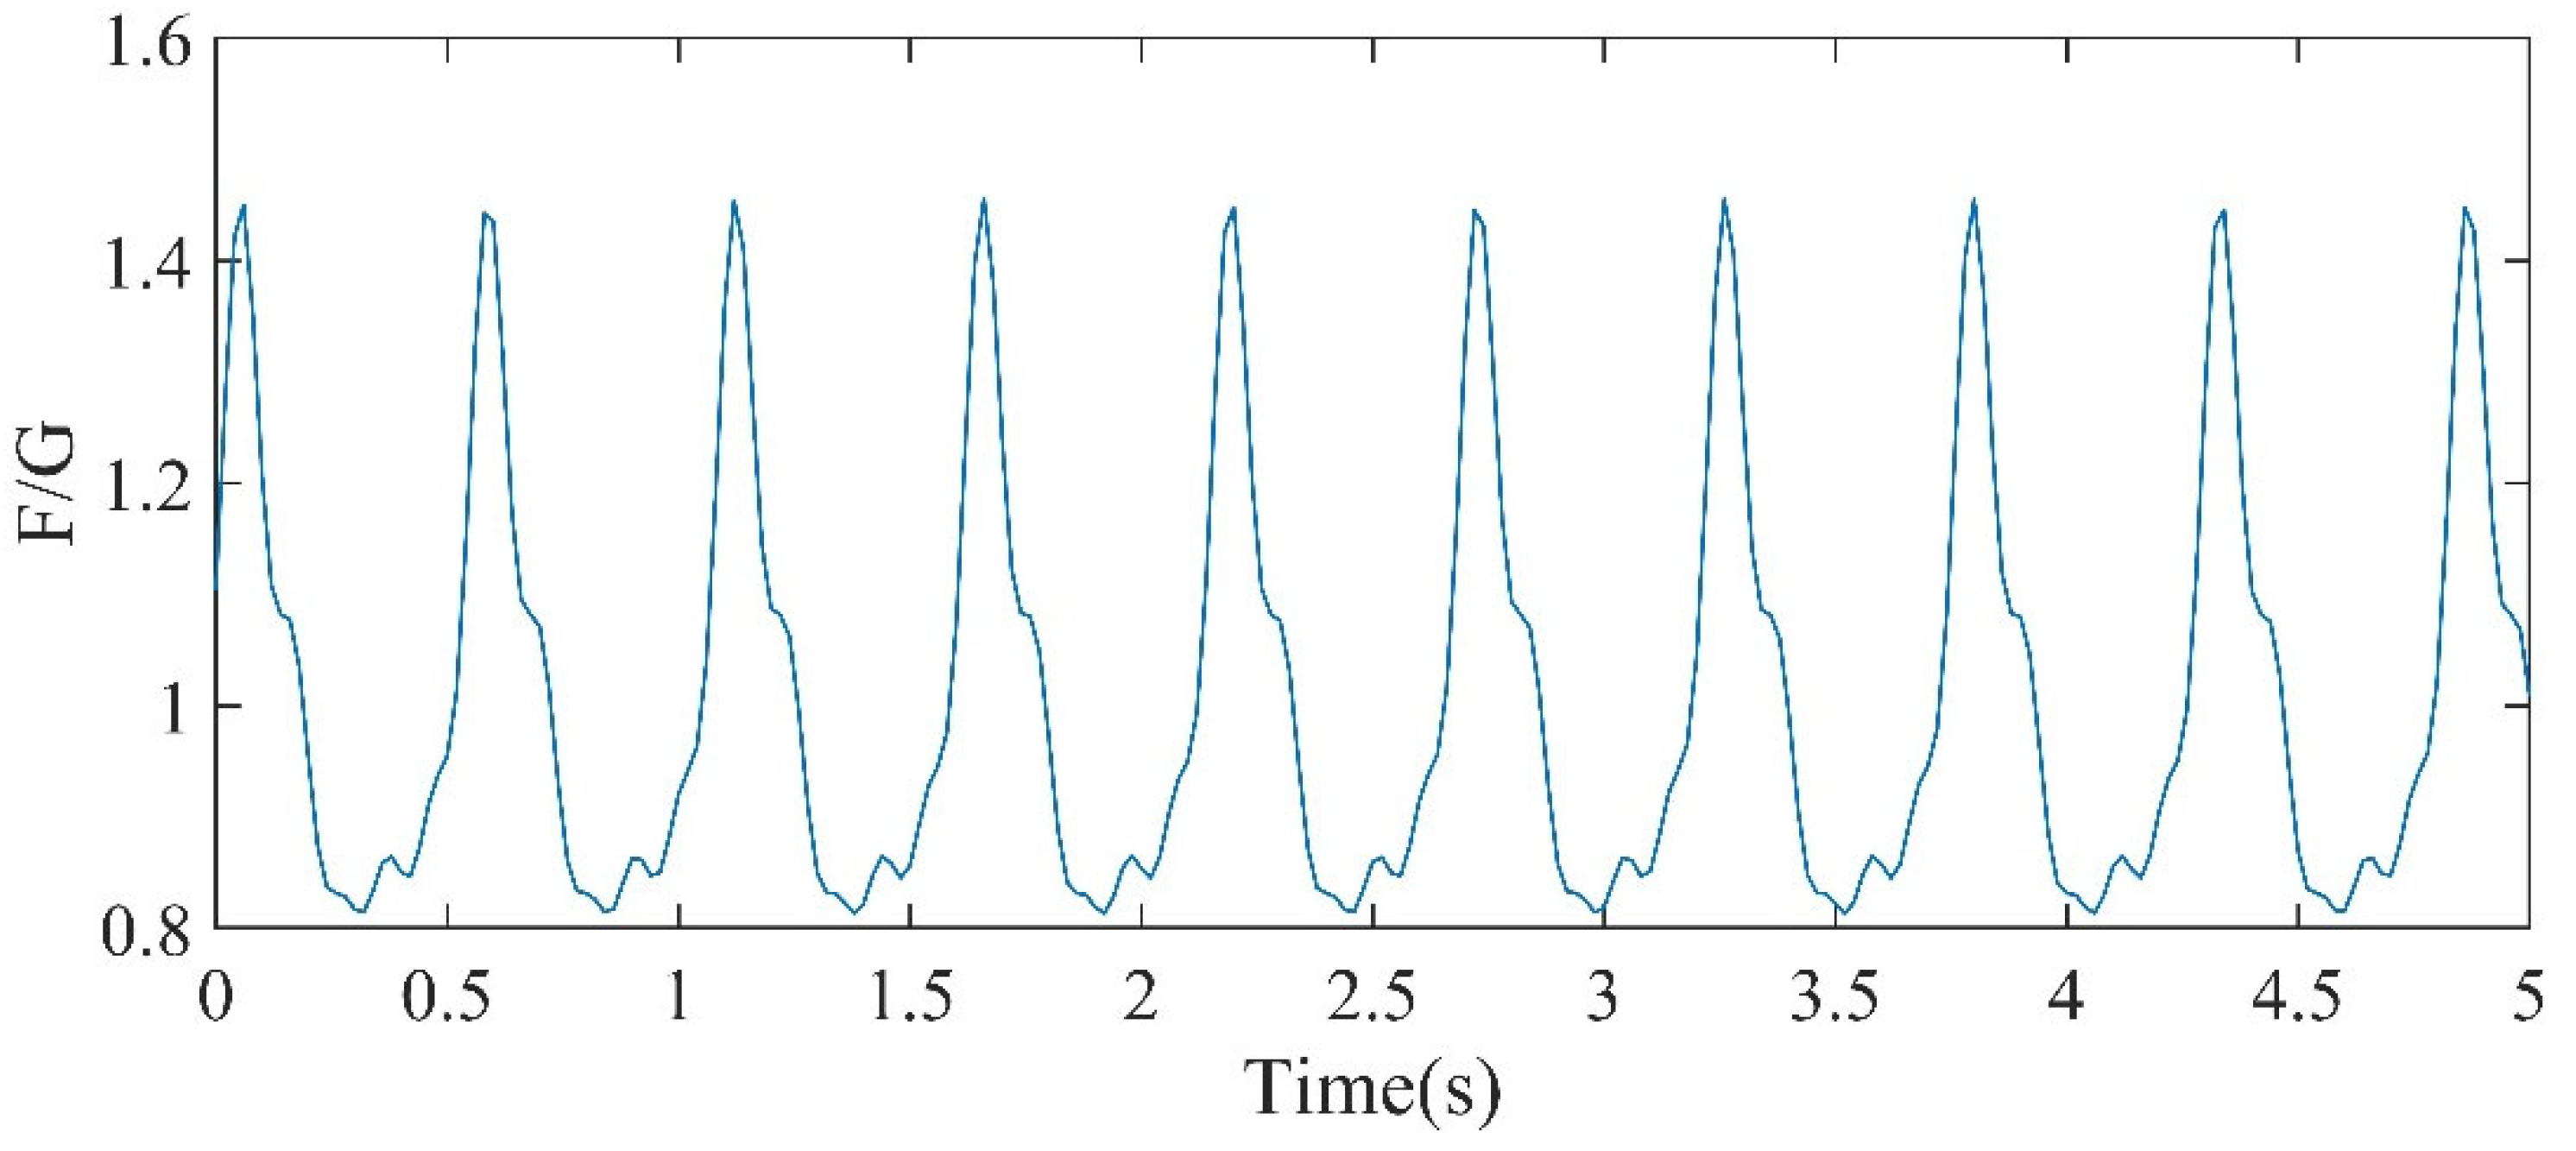
Figure 3.
The Cellular Automata composition schematic.

Figure 4.
Pedestrian movement direction and movement probability.

Figure 5.
The static floor field of a space’s large-span structure.

Figure 6.
Example of behavioral judgment parameter definition.

Figure 7.
Plot of crowd distribution and loading data at different moments in time: (a) Initial structural pedestrian distribution; (b) Process structural pedestrian distribution; (c) Final structural pedestrian distribution.
Figure 7.
Plot of crowd distribution and loading data at different moments in time: (a) Initial structural pedestrian distribution; (b) Process structural pedestrian distribution; (c) Final structural pedestrian distribution.
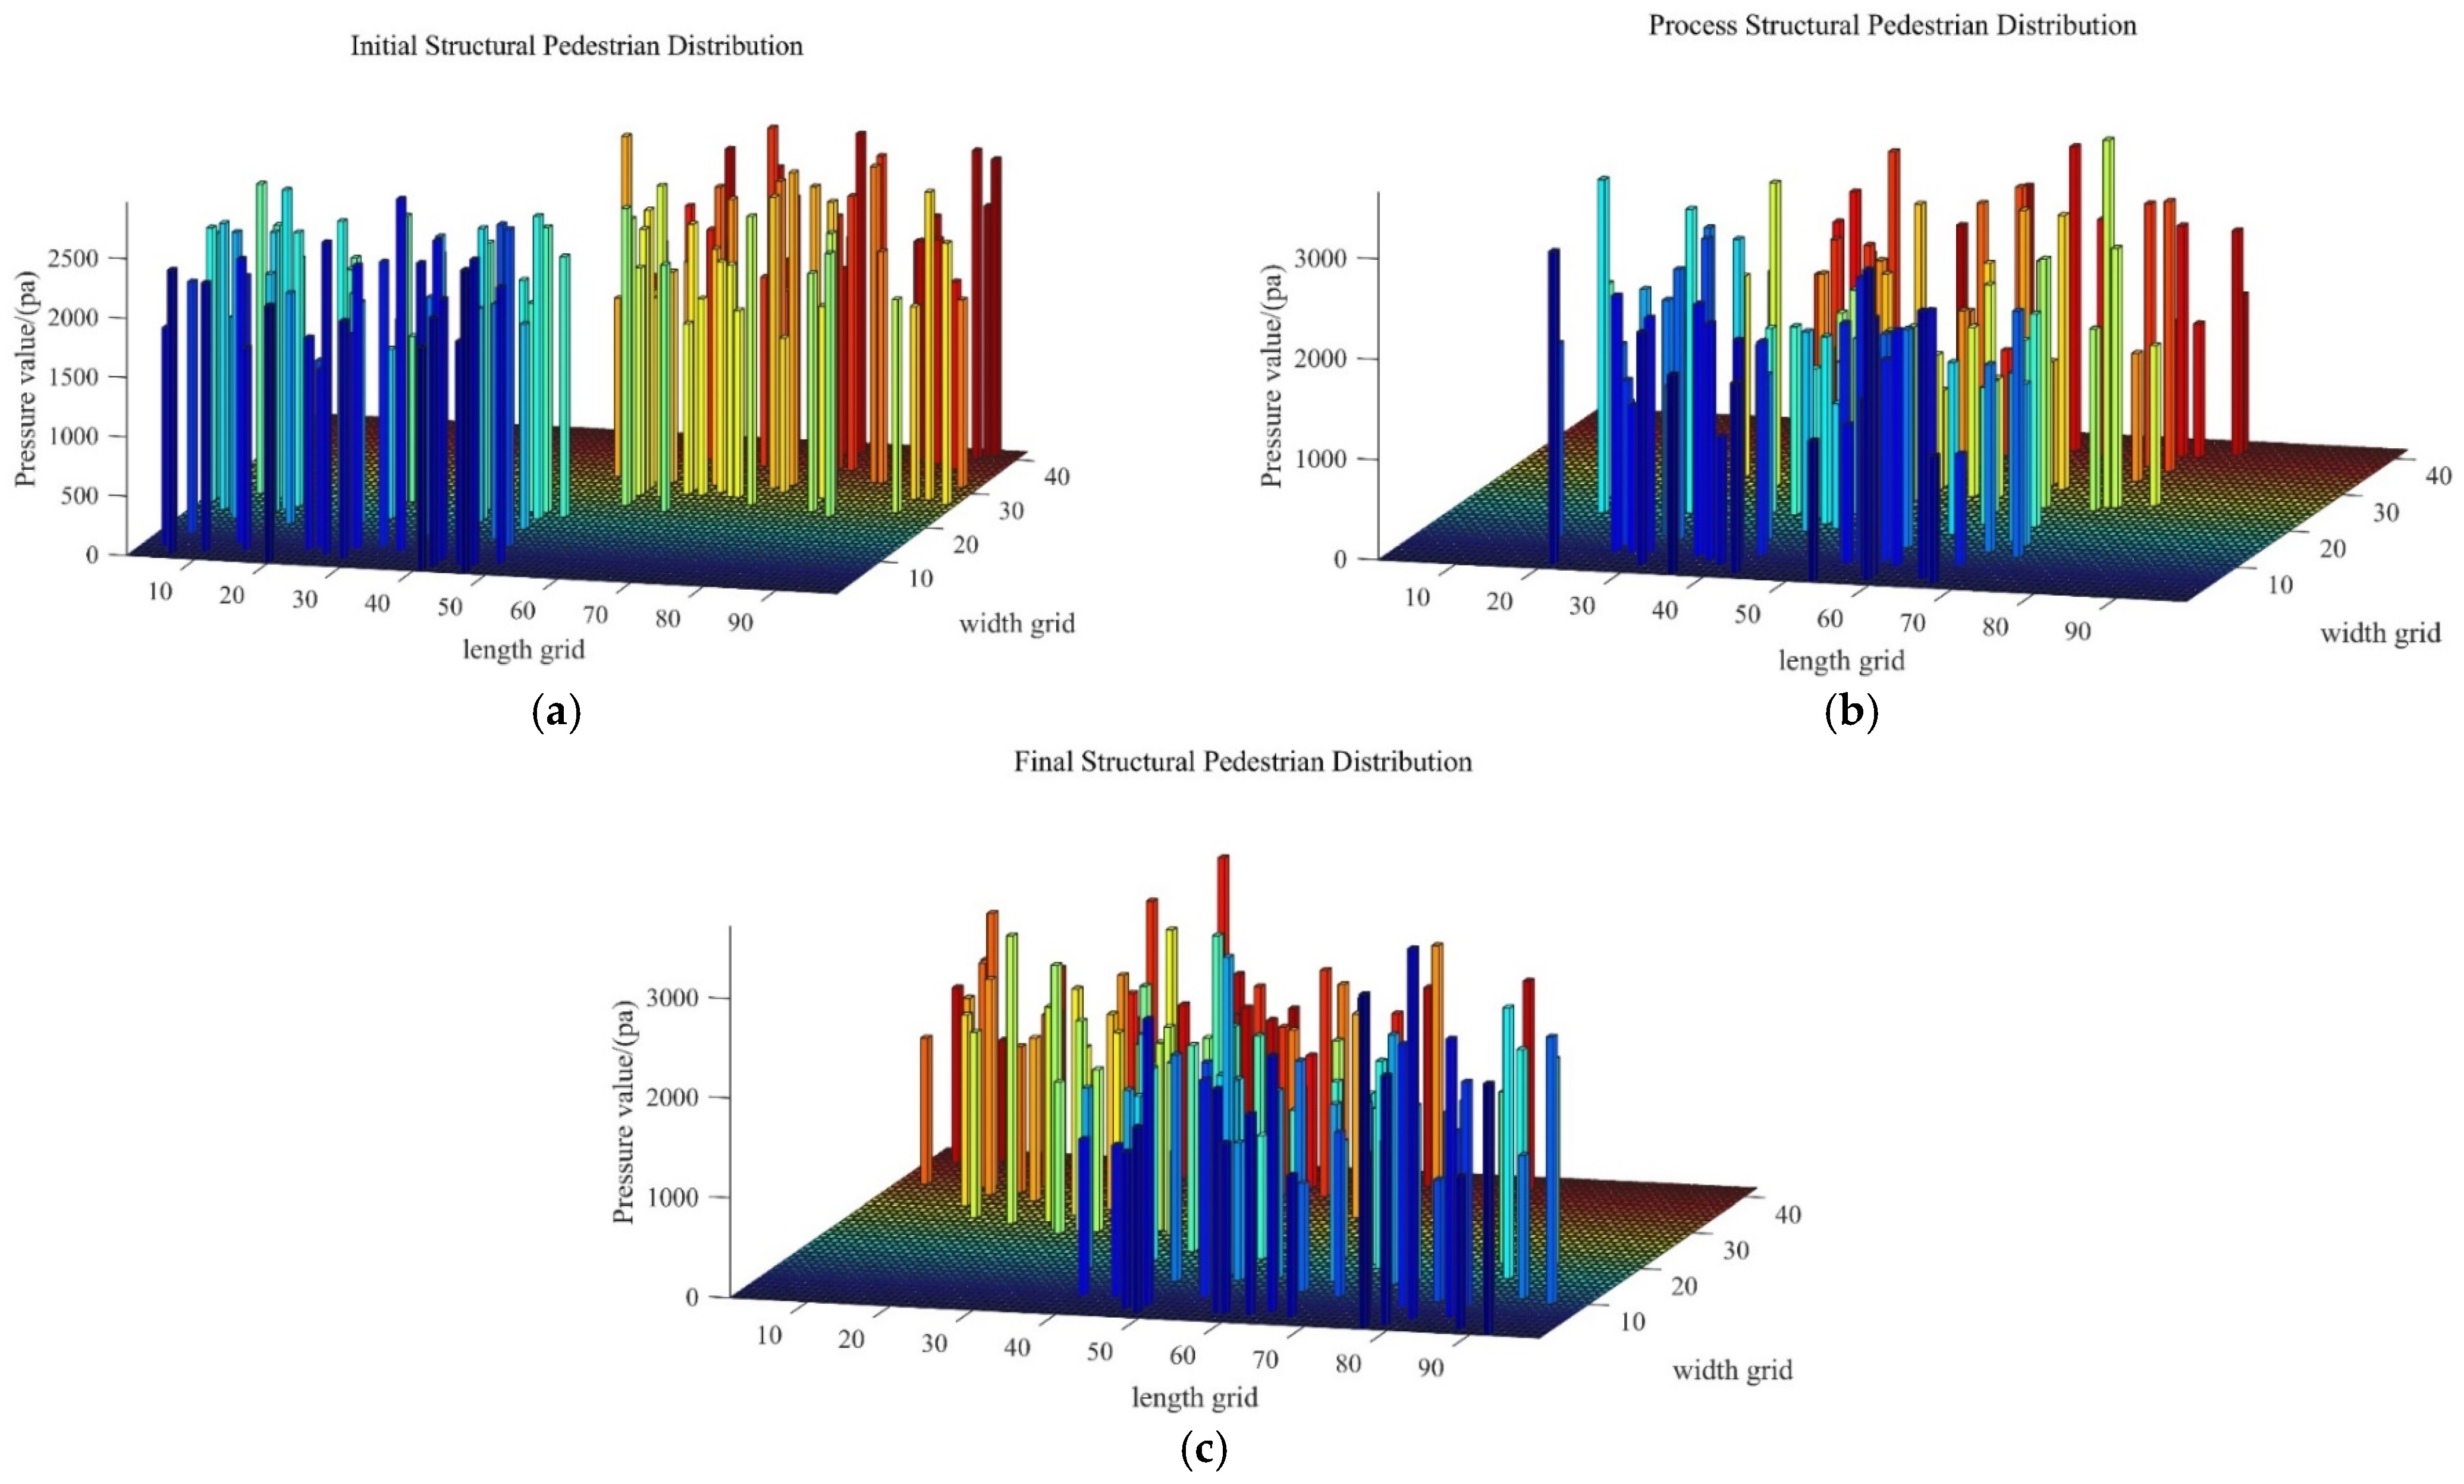
Figure 8.
Dynamic response acquisition system.
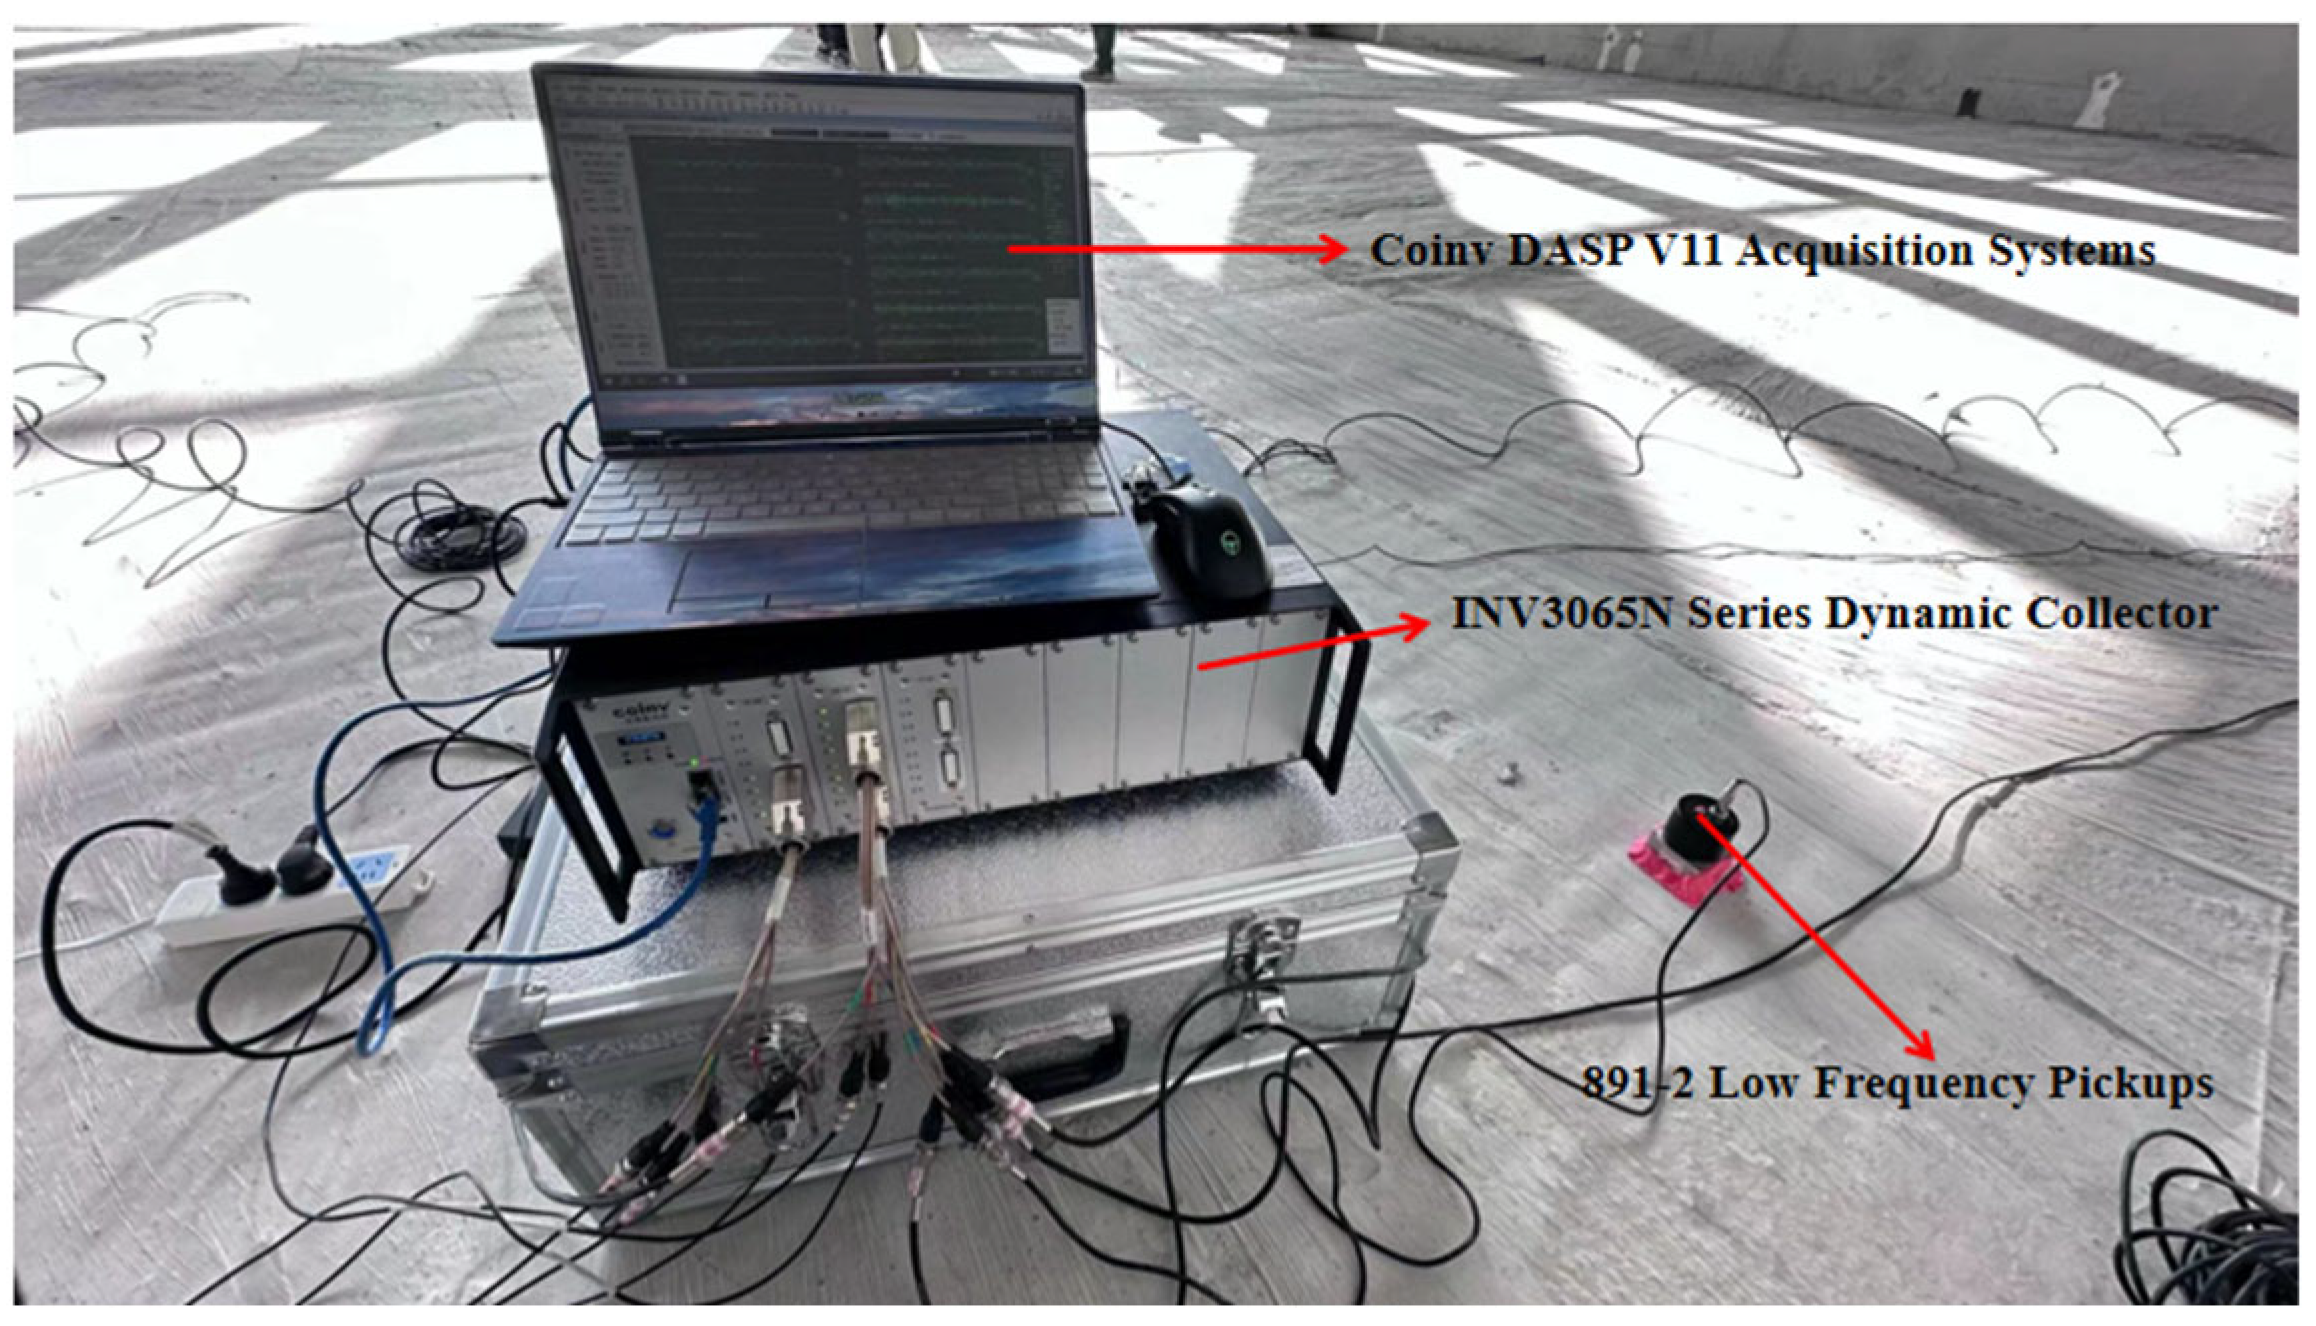
Figure 9.
Arrangement of measurement points for the dynamic characteristic test.

Figure 10.
The time-course curve of structural acceleration response under the environmental excitation.
Figure 10.
The time-course curve of structural acceleration response under the environmental excitation.

Figure 11.
FE model of space large-span structure.

Figure 12.
Out-of-plane mode shapes of the first 3 orders.
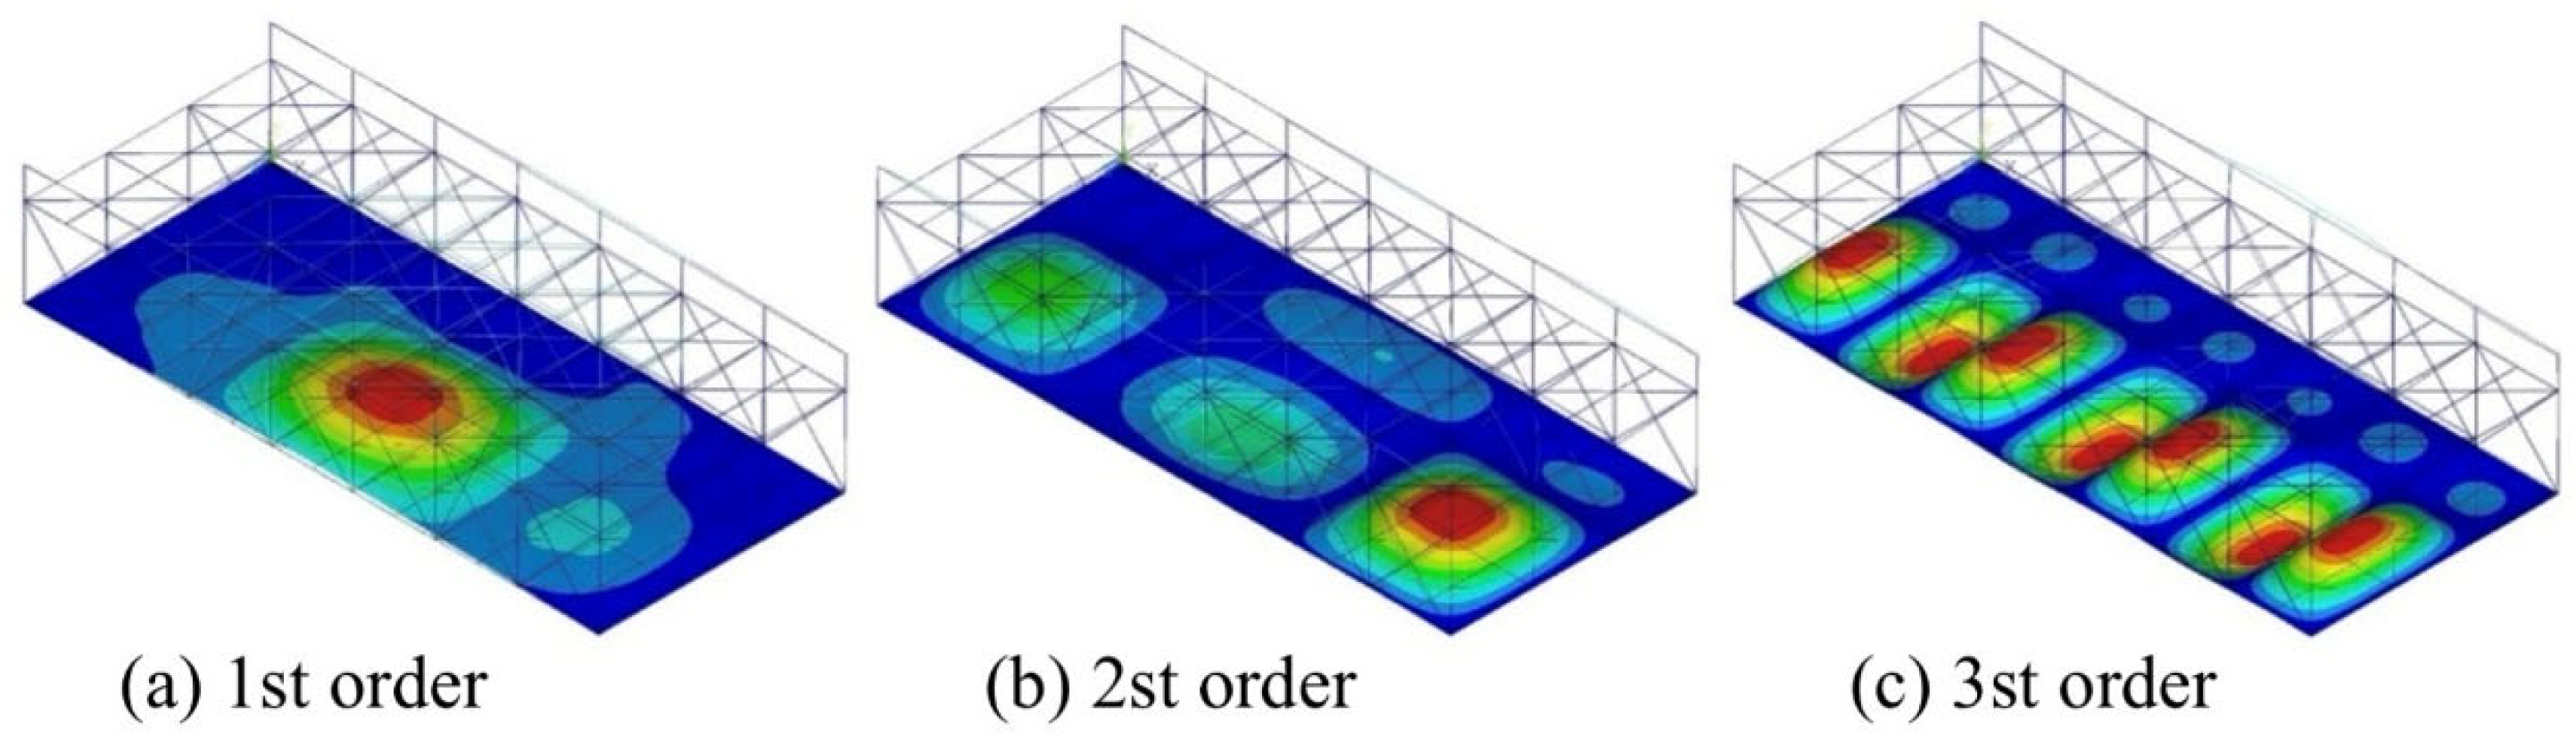
Figure 13.
Field test of human-induced vibration of the space large-span structure: (a) Fixed stride frequency walking test; (b) Random walk test.
Figure 13.
Field test of human-induced vibration of the space large-span structure: (a) Fixed stride frequency walking test; (b) Random walk test.
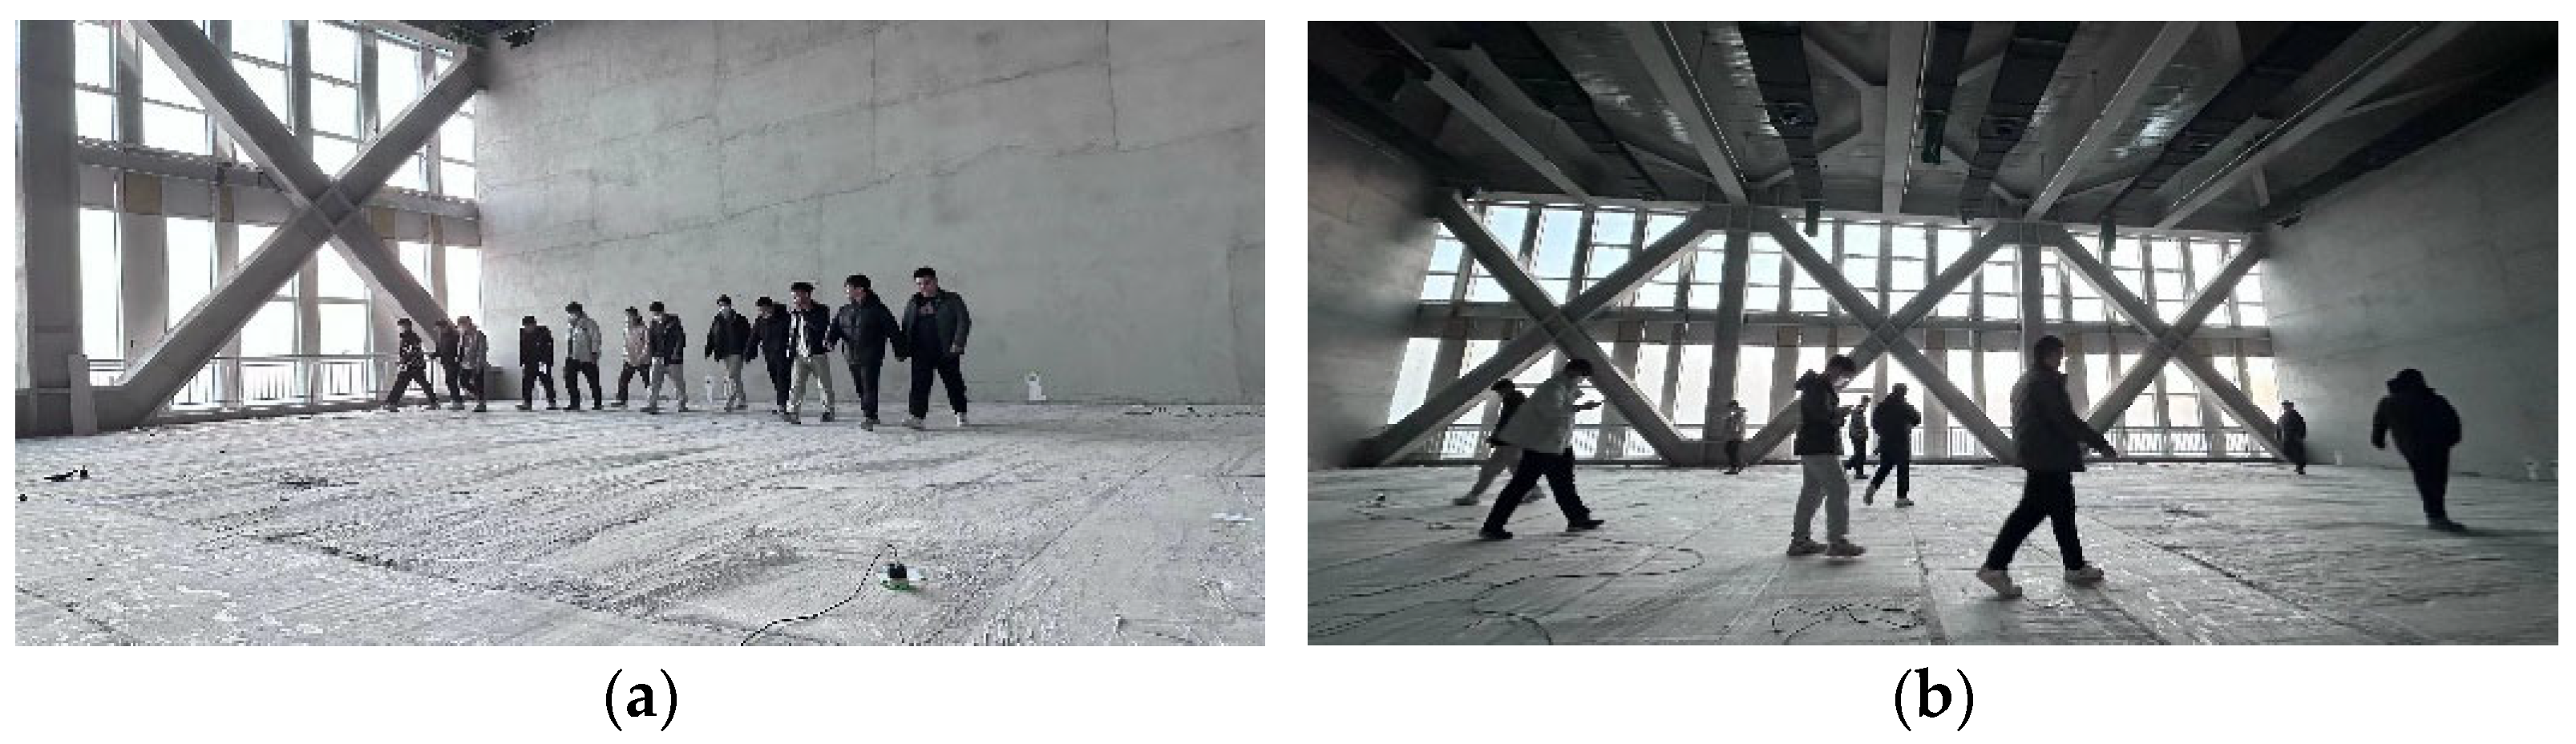
Figure 14.
Arrangement of measurement points for human-induced vibration test.
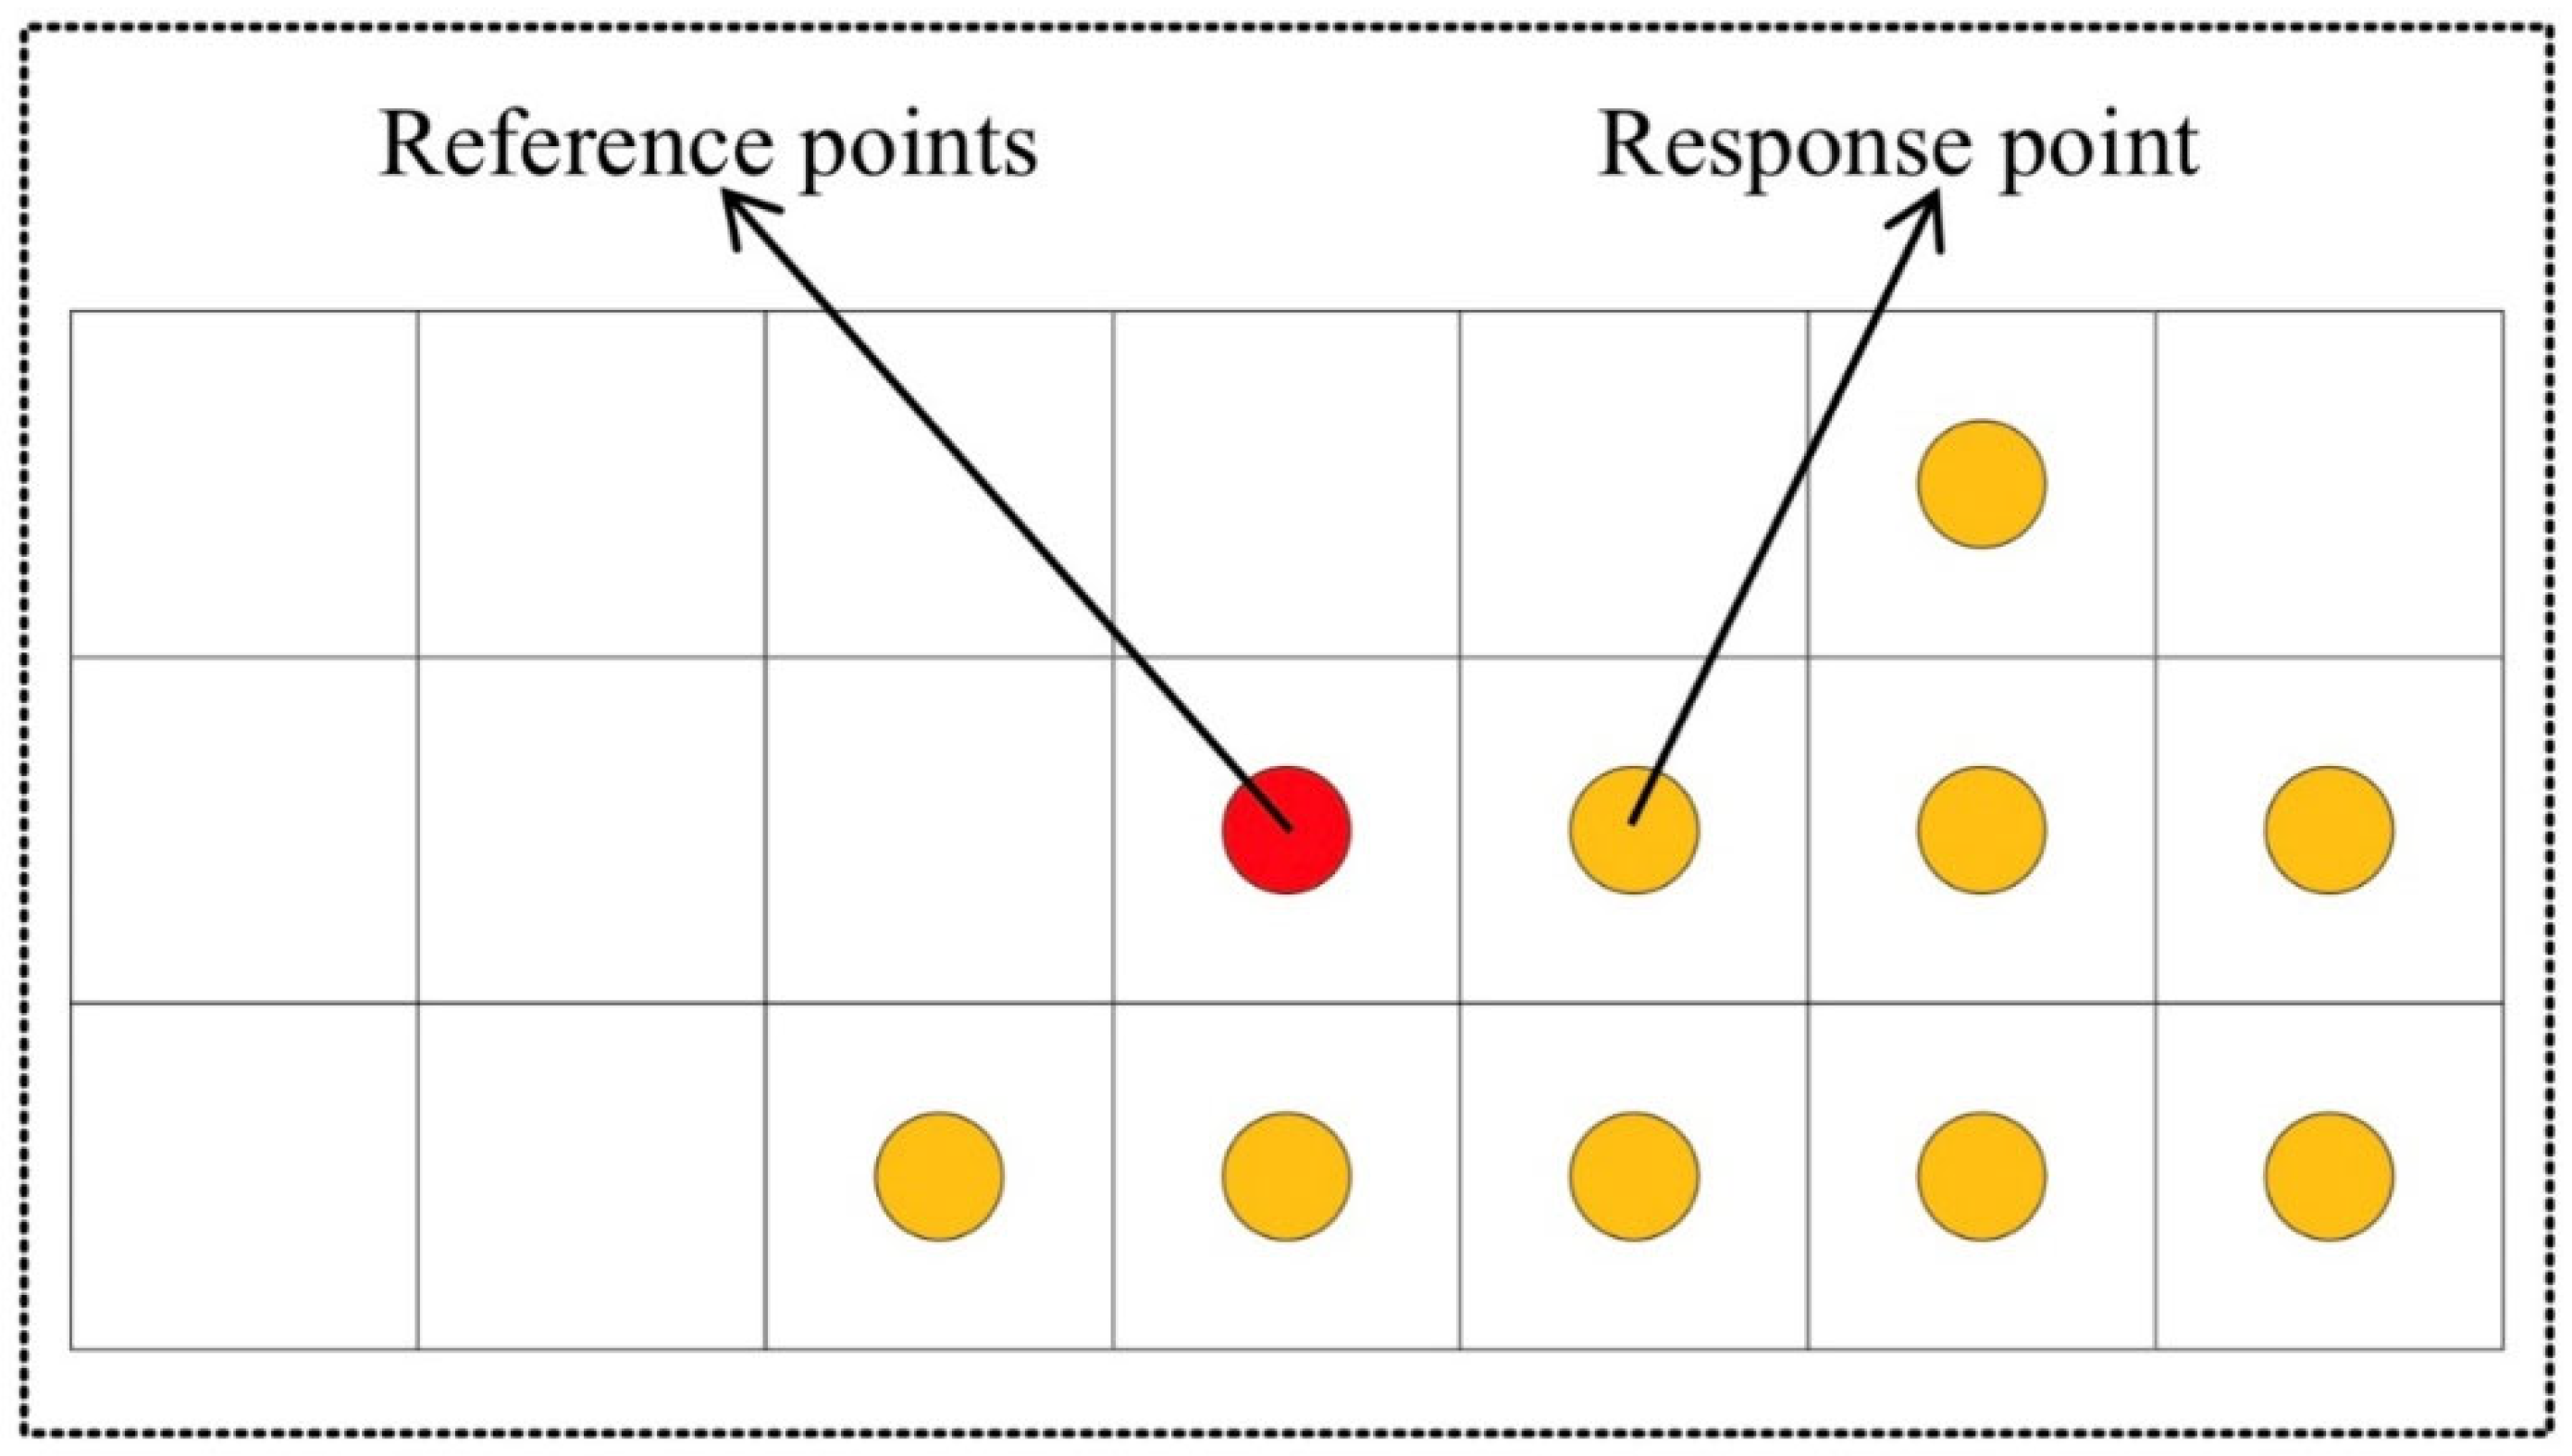
Figure 15.
Measured and FE-calculated acceleration time course curves for test condition 1.

Figure 16.
Measured and FE-calculated acceleration time course curves for test conditions 2.
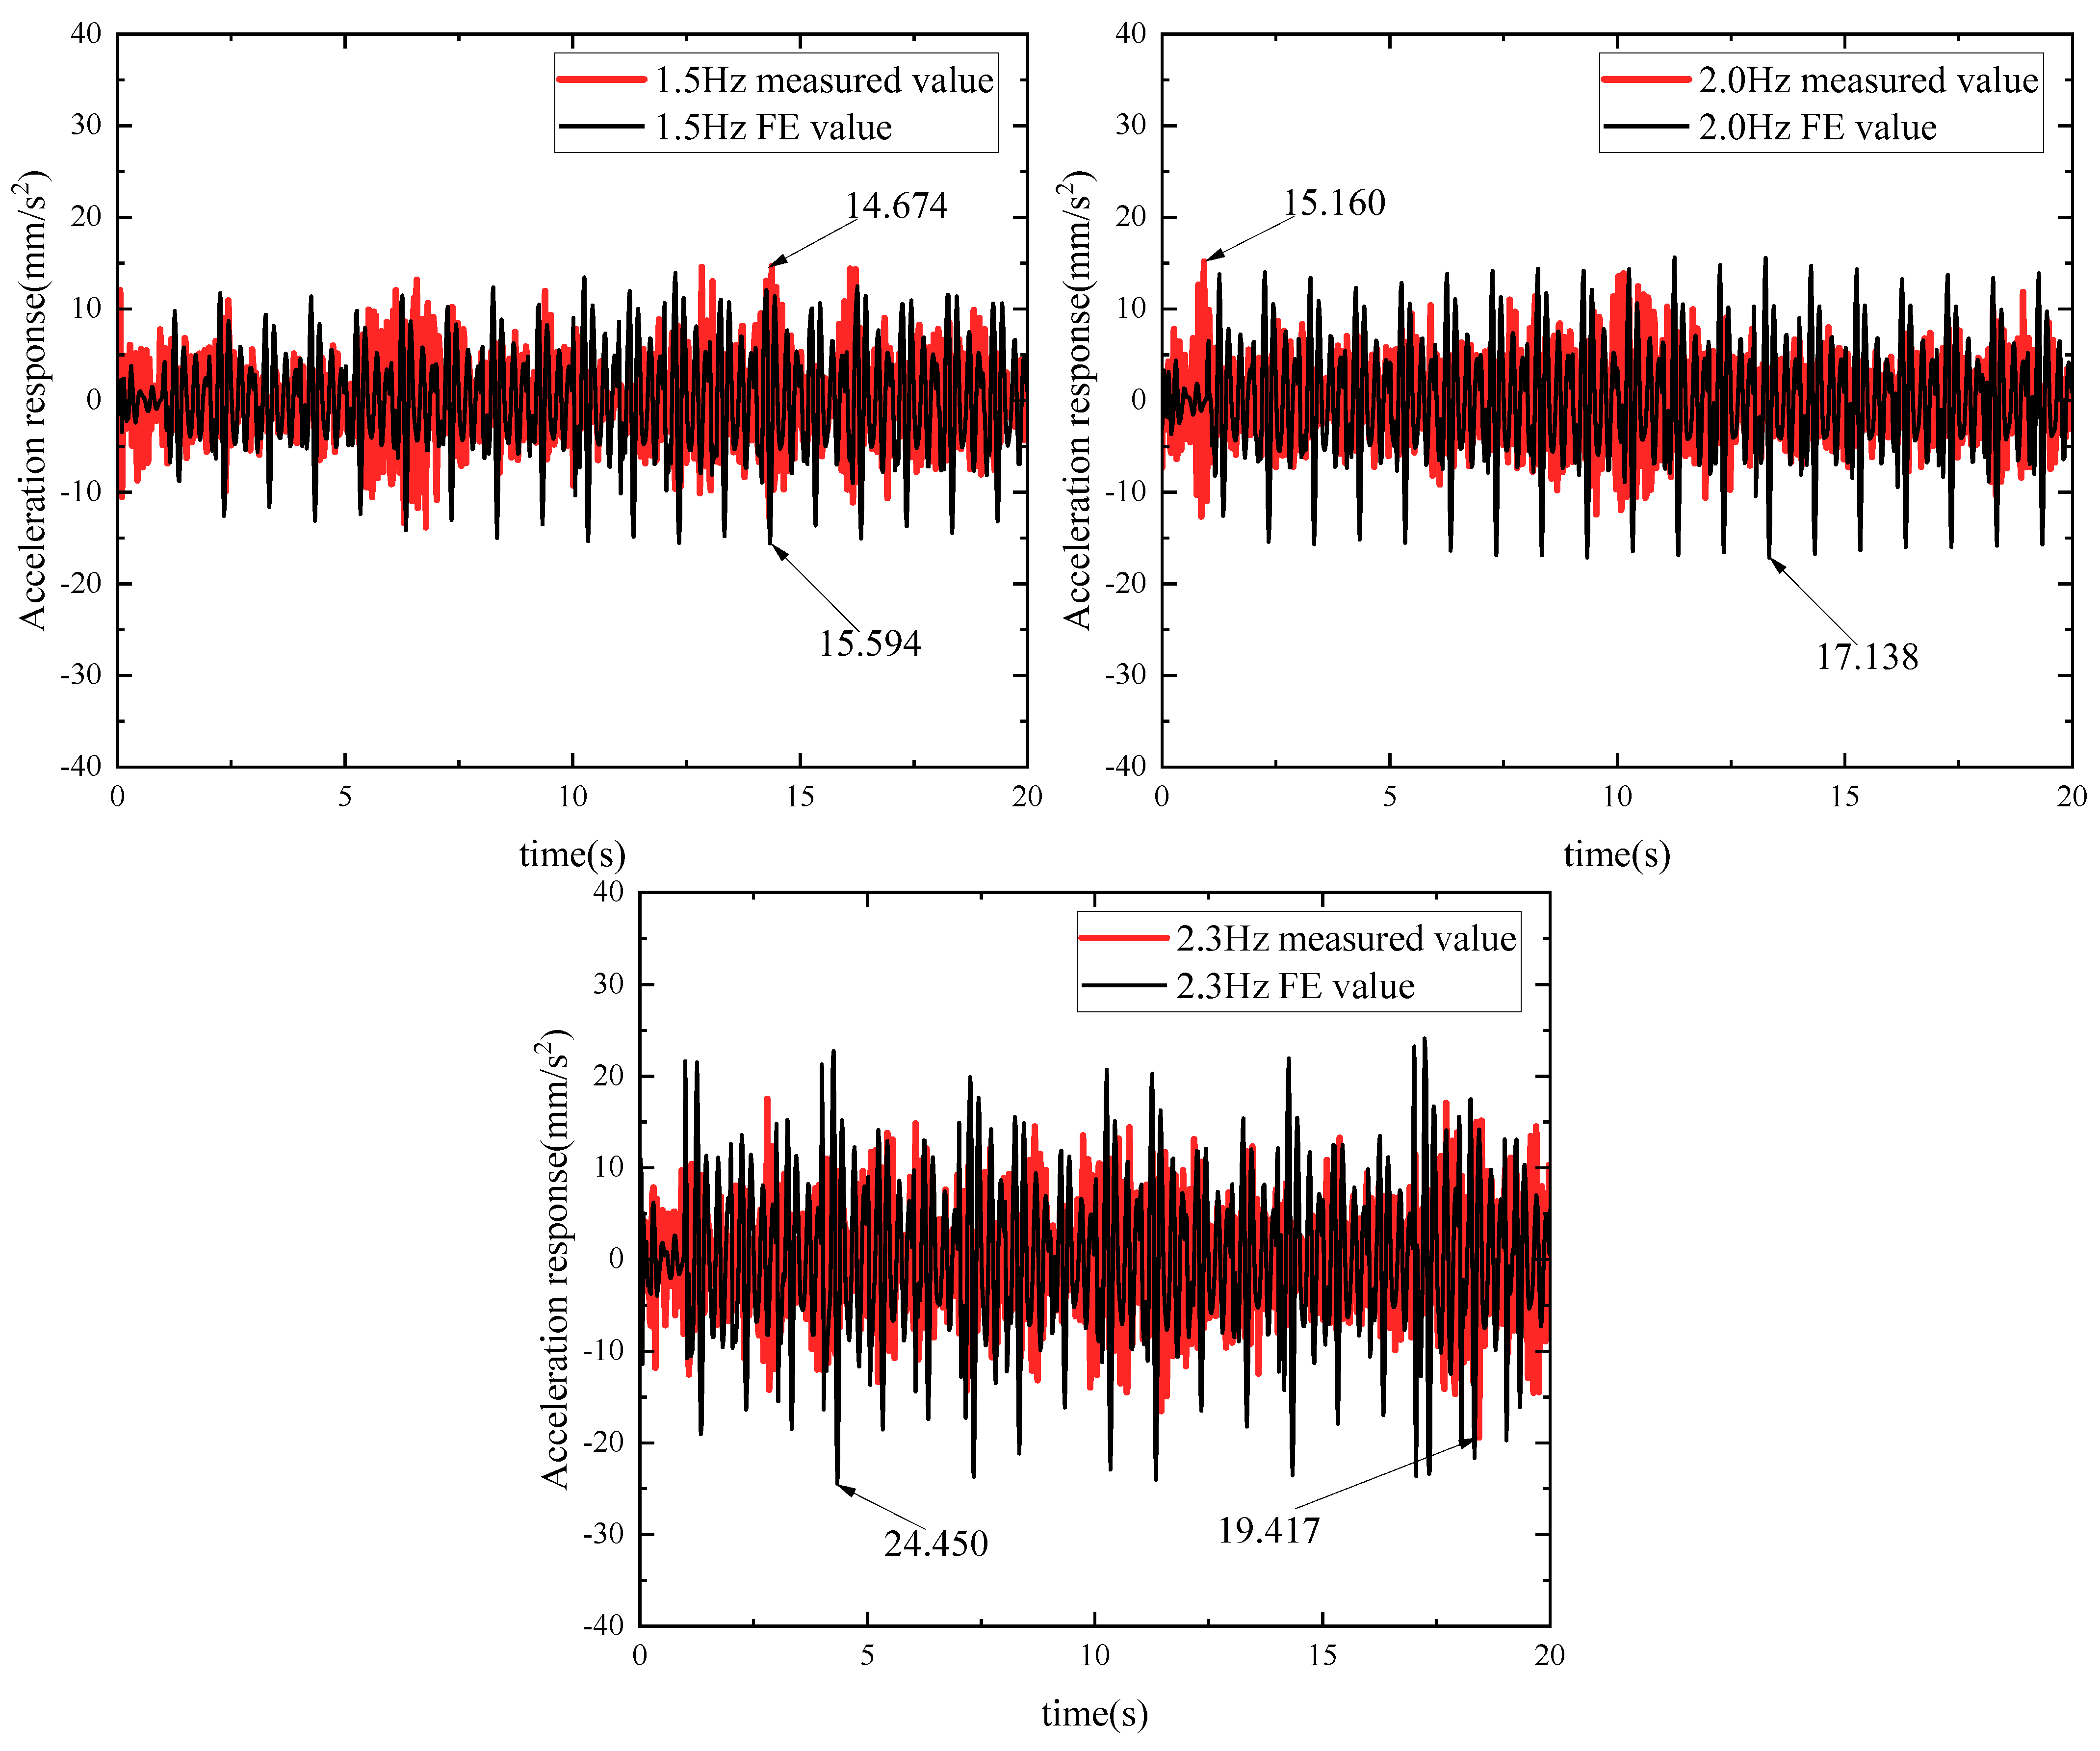
Figure 17.
Acceleration time-range response curves under different working conditions: (a) Crowd density: 0.1 Person/m2; (b) Crowd density: 0.2 Person/m2; (c) Crowd density: 0.3 Person/m2; (d) Crowd density: 0.4 Person/m2; (e) Crowd density: 0.5 Person/m2; (f) Crowd density: 0.6 Person/m2.
Figure 17.
Acceleration time-range response curves under different working conditions: (a) Crowd density: 0.1 Person/m2; (b) Crowd density: 0.2 Person/m2; (c) Crowd density: 0.3 Person/m2; (d) Crowd density: 0.4 Person/m2; (e) Crowd density: 0.5 Person/m2; (f) Crowd density: 0.6 Person/m2.
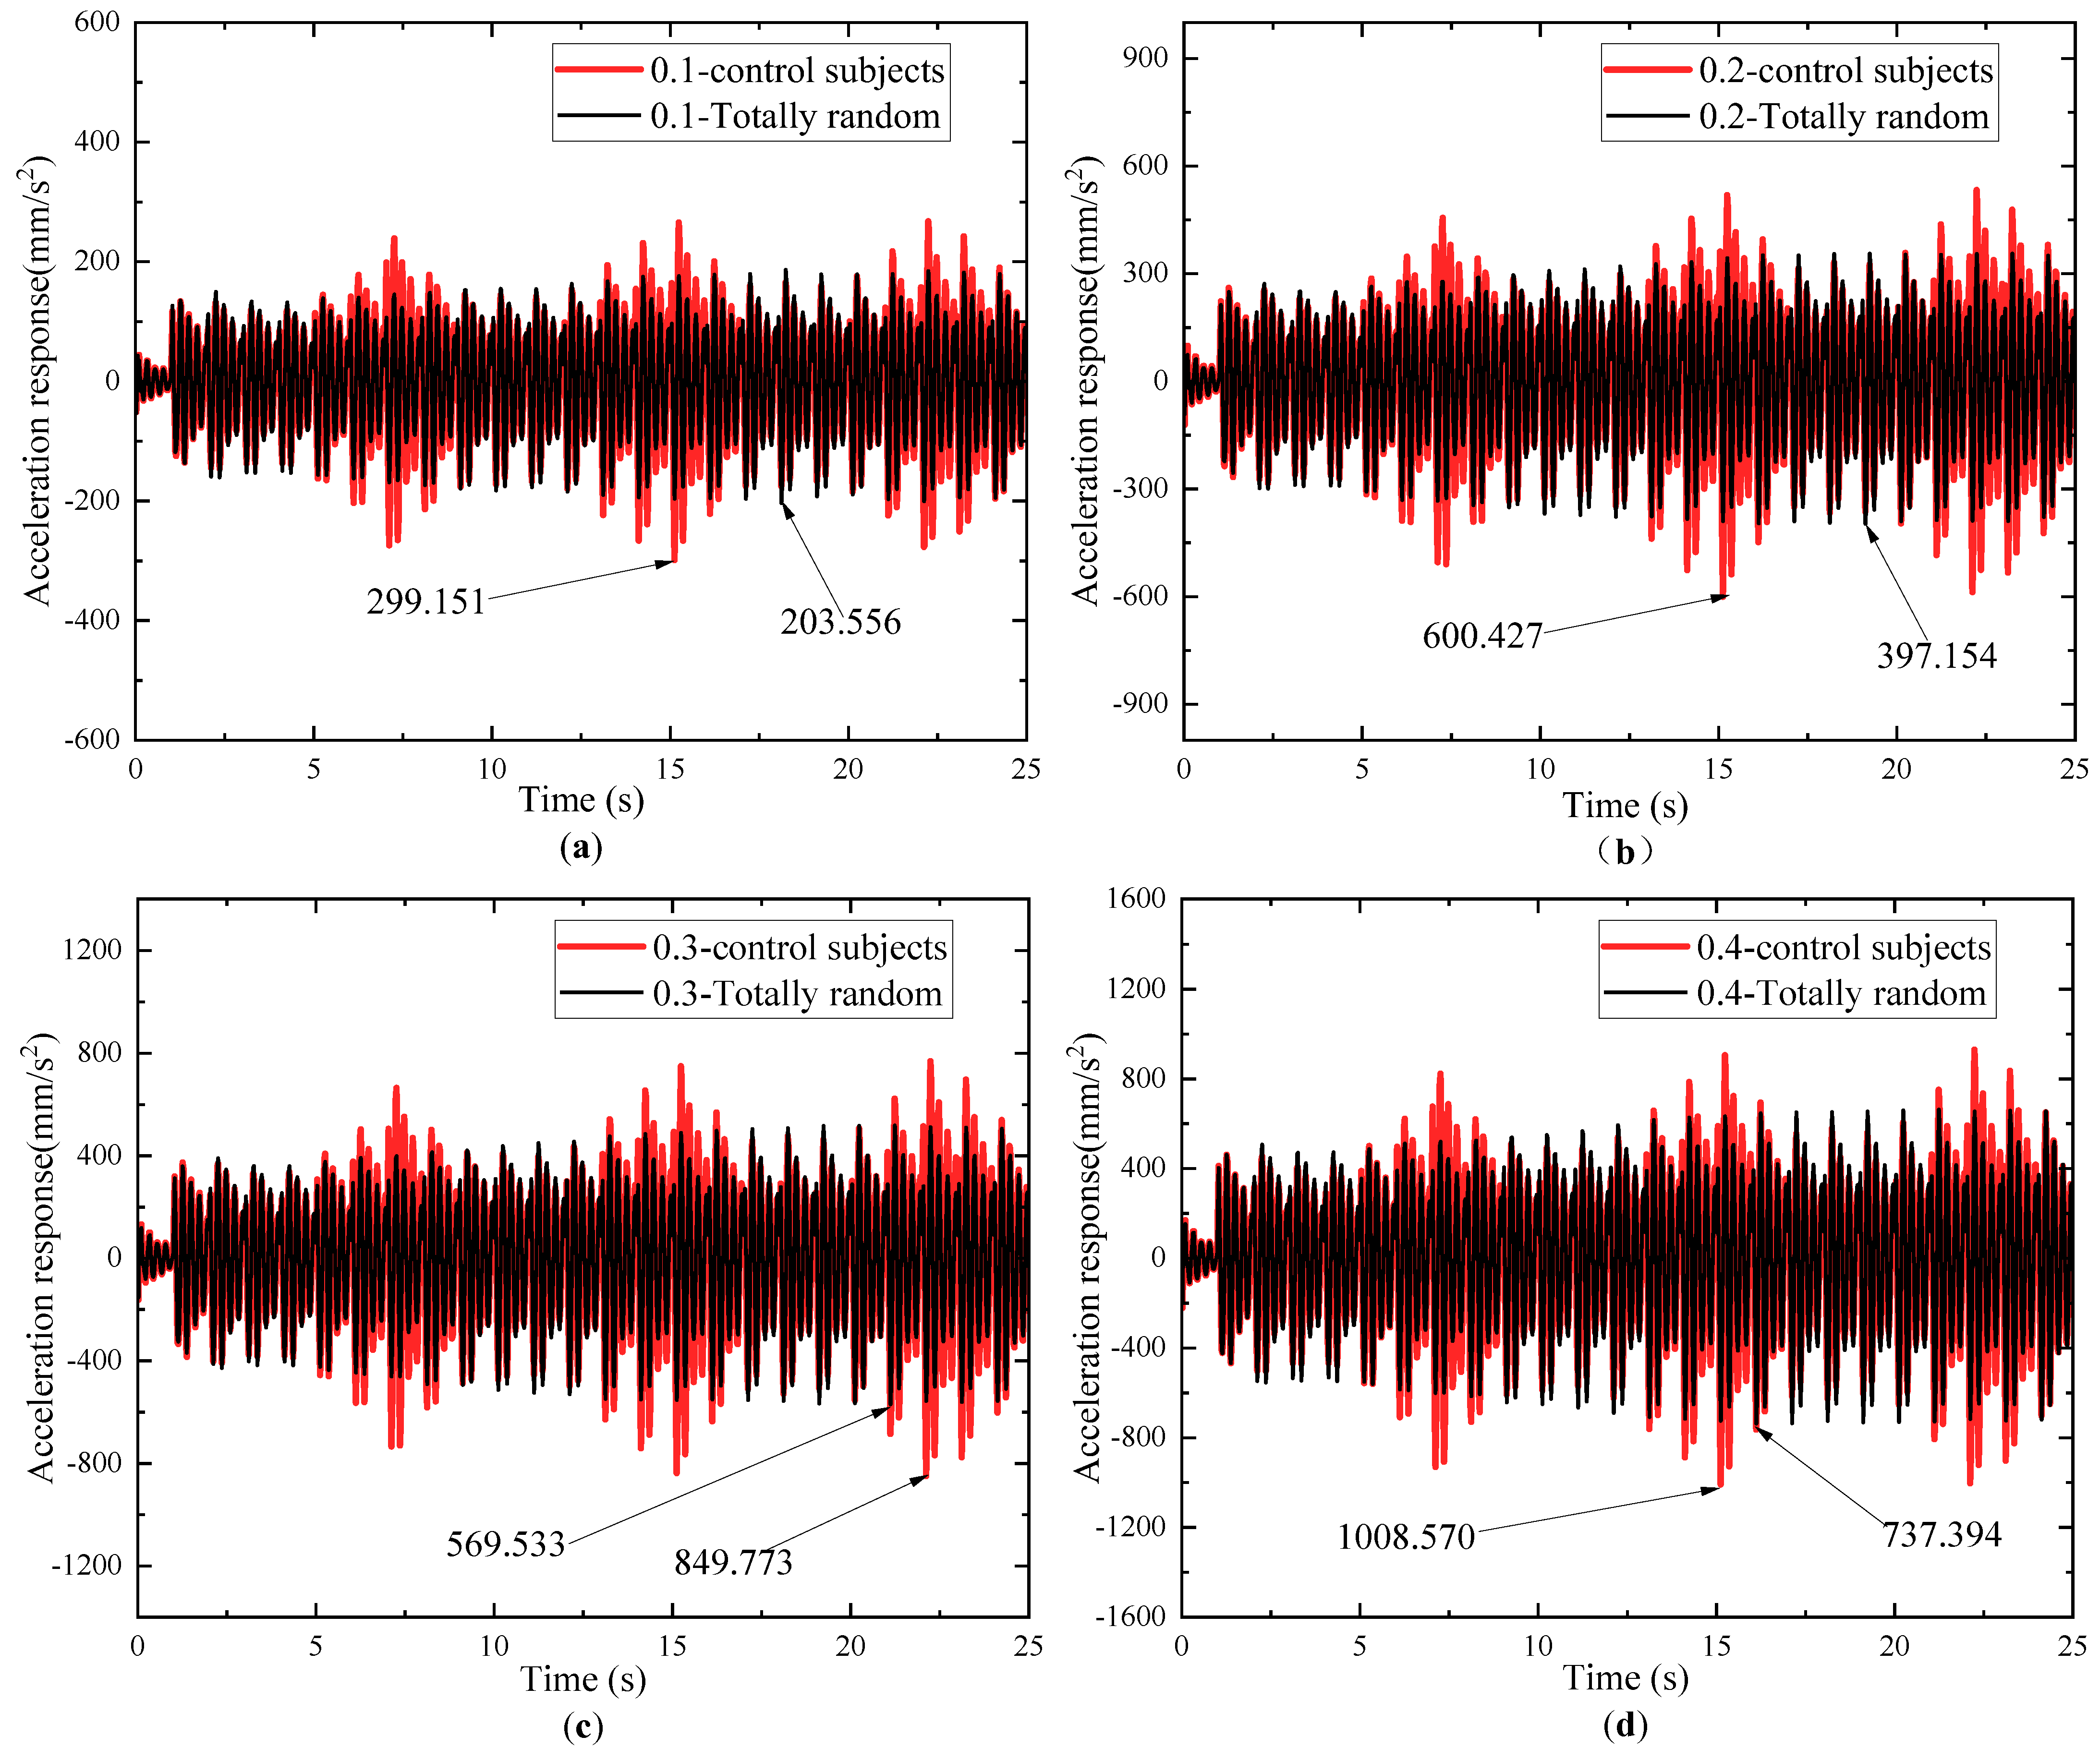

Figure 18.
The time-range cumulative displacements under different pedestrian parameters.
Figure 19.
Indicator of the importance of randomness in walking parameters: (a) Stochastic importance index for single walk parameters; (b) Stochastic importance index for double walk parameters.
Figure 19.
Indicator of the importance of randomness in walking parameters: (a) Stochastic importance index for single walk parameters; (b) Stochastic importance index for double walk parameters.
Figure 20.
The time-range cumulative displacement under different walking routes.

Figure 21.
Time-range cumulative displacement at the center point of the structure: (a) Time-scale cumulative displacements for different population densities corresponding to control subjects and totally random conditions; (b) Cumulative displacement difference between control subjects and totally random conditions.


Table 1.
Information on pedestrian walking parameters.
| Walking Parameters | Distribution Type | The Mean | C.O.V |
|---|---|---|---|
| stride frequency [7] | Gaussian distribution | 1.87 Hz | 0.10 |
| stride length [31] | Gaussian distribution | 0.715 m | 0.11 |
| weight [14] | Gaussian distribution | 70 kg | 0.21 |
Table 2.
Structural out-of-plane modal information.
| Order | Intrinsic Frequency (Hz) | Damping Ratio (%) | Integrated Frequency (Hz) | Integrated Damping Ratio (%) | Modal Damping Ratio (%) |
|---|---|---|---|---|---|
| 1st | 4.657 | 1.237 | 4.657 | 1.237 | 1.3035 |
| 2st | 5.643 | 1.039 | 5.760 | 1.070 | |
| 5.739 | 0.843 | ||||
| 5.898 | 1.328 | ||||
| 3st | 7.531 | 0.705 | 7.731 | 0.711 | |
| 7.677 | 0.621 | ||||
| 7.704 | 0.563 | ||||
| 7.868 | 1.152 | ||||
| 7.875 | 0.514 | ||||
| 4st | 8.291 | 1.331 | 8.529 | 1.537 | |
| 8.302 | 1.608 | ||||
| 8.310 | 1.526 | ||||
| 8.568 | 1.539 | ||||
| 8.585 | 1.509 | ||||
| 8.596 | 1.597 | ||||
| 8.685 | 1.680 | ||||
| 8.703 | 1.489 | ||||
| 8.718 | 1.554 | ||||
| 5st | 9.311 | 1.457 | 9.799 | 1.629 | |
| 9.849 | 1.535 | ||||
| 9.923 | 1.734 | ||||
| 9.933 | 1.667 | ||||
| 9.981 | 1.753 |
Table 3.
Material physical parameters.
| Material | Modulus of Elasticity (pa) | Poisson’s Ratio | Density (kg/m3) |
|---|---|---|---|
| Q355C steel | 2.1 × 10¹¹ | 0.3 | 7850 |
| C30 concrete | 3.0 × 10¹⁰ | 0.2 | 2550 |
Table 4.
Comparison table of the first 3 orders of out-of-plane vibration frequencies.
| Order | Calculated Frequency of FE | Measured Integrated Frequency | Inaccuracies (%) | Measuring Integrated Damping Ratio (%) |
|---|---|---|---|---|
| 1st | 4.590 Hz | 4.657 Hz | −1.439 | 1.237 |
| 2st | 5.730 Hz | 5.760 Hz | −0.521 | 1.070 |
| 3st | 7.622 Hz | 7.731 Hz | −1.410 | 0.711 |
Table 5.
The information of Tester.
| Tester | 1 | 2 | 3 | 4 | 5 | 6 | 7 | 8 | 9 | 10 | 11 | 12 | Mean |
|---|---|---|---|---|---|---|---|---|---|---|---|---|---|
| stride length (m) | 0.60 | 0.52 | 0.55 | 0.52 | 0.57 | 0.54 | 0.55 | 0.56 | 0.58 | 0.58 | 0.61 | 0.65 | 0.5692 |
| Weight (kg) | 75 | 72.5 | 102 | 70 | 70 | 55 | 70 | 75 | 75 | 100 | 75 | 96.5 | 78 |
Table 6.
Setting of test conditions.
| Test Conditions | Number of People | Number of Tests | Stride Frequency (Hz) | Walking Route |
|---|---|---|---|---|
| 1 | 12 | 3 | 1.5/2.0/2.3 | deterministic |
| 2 | 12 | 3 | 1.5/2.0/2.3 | random |
Table 7.
Comparison of peak acceleration of structure under different test conditions.
| Stride Frequency (Hz) | Test Conditions | Peak Acceleration (mm/s2) | Comparison Error (%) | |
|---|---|---|---|---|
| Measured Data | FE Calculation | |||
| 1.5 | 1 | 15.081 | 16.284 | −7.388 |
| 2 | 14.674 | 15.594 | −5.900 | |
| 2.0 | 1 | 17.332 | 18.961 | −8.591 |
| 2 | 15.160 | 17.138 | −11.542 | |
| 2.3 | 1 | 21.461 | 26.019 | −17.518 |
| 2 | 19.417 | 24.450 | −20.585 | |
| Max acceleration | 1 | 21.461 | 26.019 | \ |
| 2 | 19.417 | 24.450 | ||
Table 8.
The EN03 comfort levels.
| Comfort Levels | Evaluation of Comfort | Vertical Acceleration (mm/s2) | Horizontal Acceleration (mm/s2) |
|---|---|---|---|
| CL1 | Best | <500 | <100 |
| CL2 | Medium | 500~1000 | 100~300 |
| CL3 | Minimal | 1000~2500 | 300~800 |
| CL4 | Unacceptable | >2500 | >800 |
Table 9.
Vibration suitability assessment table for structures with different crowd densities.
| Crowd Density (Person/m2) | Condition | Mass Ratio * (%) | Walking Parameters | Peak Acceleration (mm/s2) | Evaluation of Comfort |
|---|---|---|---|---|---|
| 0.1 | Totally random | 0.62 | Gaussian | 203.556 | Best |
| Control subjects | The mean | 299.151 | Best | ||
| 0.2 | Totally random | 1.24 | Gaussian | 397.154 | Best |
| Control subjects | The mean | 600.427 | Medium | ||
| 0.3 | Totally random | 1.85 | Gaussian | 569.553 | Medium |
| Control subjects | The mean | 849.773 | Medium | ||
| 0.4 | Totally random | 2.47 | Gaussian | 737.394 | Medium |
| Control subjects | The mean | 1008.570 | Minimal | ||
| 0.5 | Totally random | 3.09 | Gaussian | 891.144 | Medium |
| Control subjects | The mean | 1201.033 | Minimal | ||
| 0.6 | Totally random | 3.71 | Gaussian | 1095.551 | Minimal |
| Control subjects | The mean | 1420.555 | Minimal |
* Mass ratio is the ratio of pedestrian to structural mass.
Table 10.
Random walk parameter working condition settings.
| Random Conditions | Walking Parameters | Option | Mean (mm) | Standard Deviation (mm) | C.O.V (%) |
|---|---|---|---|---|---|
| Control subjects | stride frequency | Mean | 497.55 | 14.51 | 2.92 |
| stride length | Mean | ||||
| weight | Mean | ||||
| stride frequency | stride frequency | Gaussian | 516.78 | 24.76 | 4.79 |
| stride length | Mean | ||||
| weight | Mean | ||||
| stride length | stride frequency | Mean | 488.94 | 18.83 | 3.85 |
| stride length | Gaussian | ||||
| weight | Mean | ||||
| weight | stride frequency | Mean | 504.76 | 21.32 | 4.22 |
| stride length | Mean | ||||
| weight | Gaussian | ||||
| stride length and weight | stride frequency | Mean | 500.42 | 12.22 | 2.44 |
| stride length | Gaussian | ||||
| weight | Gaussian | ||||
| stride frequency and weight | stride frequency | Gaussian | 507.61 | 14.78 | 2.91 |
| stride length | Mean | ||||
| weight | Gaussian | ||||
| stride frequency and stride length | stride frequency | Gaussian | 520.46 | 28.13 | 5.40 |
| stride length | Gaussian | ||||
| weight | Mean | ||||
| Totally random | stride frequency | Gaussian | 511.05 | 14.70 | 2.88 |
| stride length | Gaussian | ||||
| weight | Gaussian |
Disclaimer/Publisher’s Note: The statements, opinions and data contained in all publications are solely those of the individual author(s) and contributor(s) and not of MDPI and/or the editor(s). MDPI and/or the editor(s) disclaim responsibility for any injury to people or property resulting from any ideas, methods, instructions or products referred to in the content. |
© 2024 by the authors. Licensee MDPI, Basel, Switzerland. This article is an open access article distributed under the terms and conditions of the Creative Commons Attribution (CC BY) license (https://creativecommons.org/licenses/by/4.0/).
Share and Cite
MDPI and ACS Style
Yang, S.; Wang, G.; Xu, Q.; He, J.; Yang, M.; Su, C. Dynamic Response Study of Space Large-Span Structure under Stochastic Crowd-Loading Excitation. Buildings 2024, 14, 1203. https://doi.org/10.3390/buildings14051203
AMA Style
Yang S, Wang G, Xu Q, He J, Yang M, Su C. Dynamic Response Study of Space Large-Span Structure under Stochastic Crowd-Loading Excitation. Buildings. 2024; 14(5):1203. https://doi.org/10.3390/buildings14051203
Chicago/Turabian StyleYang, Shuwang, Gang Wang, Qiang Xu, Junfu He, Minghao Yang, and Chenhao Su. 2024. "Dynamic Response Study of Space Large-Span Structure under Stochastic Crowd-Loading Excitation" Buildings 14, no. 5: 1203. https://doi.org/10.3390/buildings14051203
Note that from the first issue of 2016, this journal uses article numbers instead of page numbers. See further details here.